

Quantum Simulation of Fractal Fracture in Amorphous Silica


Abstract
1. Introduction
1.1. Fractal Nature of Fracture
1.2. Computational Fracture at the Atomic Scale
1.3. Calculating in Larger Structures of Amorphous Silica
2. Methods
2.1. Model
2.2. Program Details
2.3. Coordinate Scans
2.4. Identifying the Point of Fracture
2.5. Calculating the Structure Parameter
2.6. Reconfiguration Fracture Energy
- After a coordinate scan, outlined in Section 2.3, the energy released is calculated from the difference between the transition and the minimum after fracture.
- The COSMO area [60] is then calculated for the initial and post-fracture geometries.
- , with units of kcal/mol, is converted into kJ/molecule.
- is estimated to be the per molecule released divided by the change in COSMO area per molecule.
3. Results
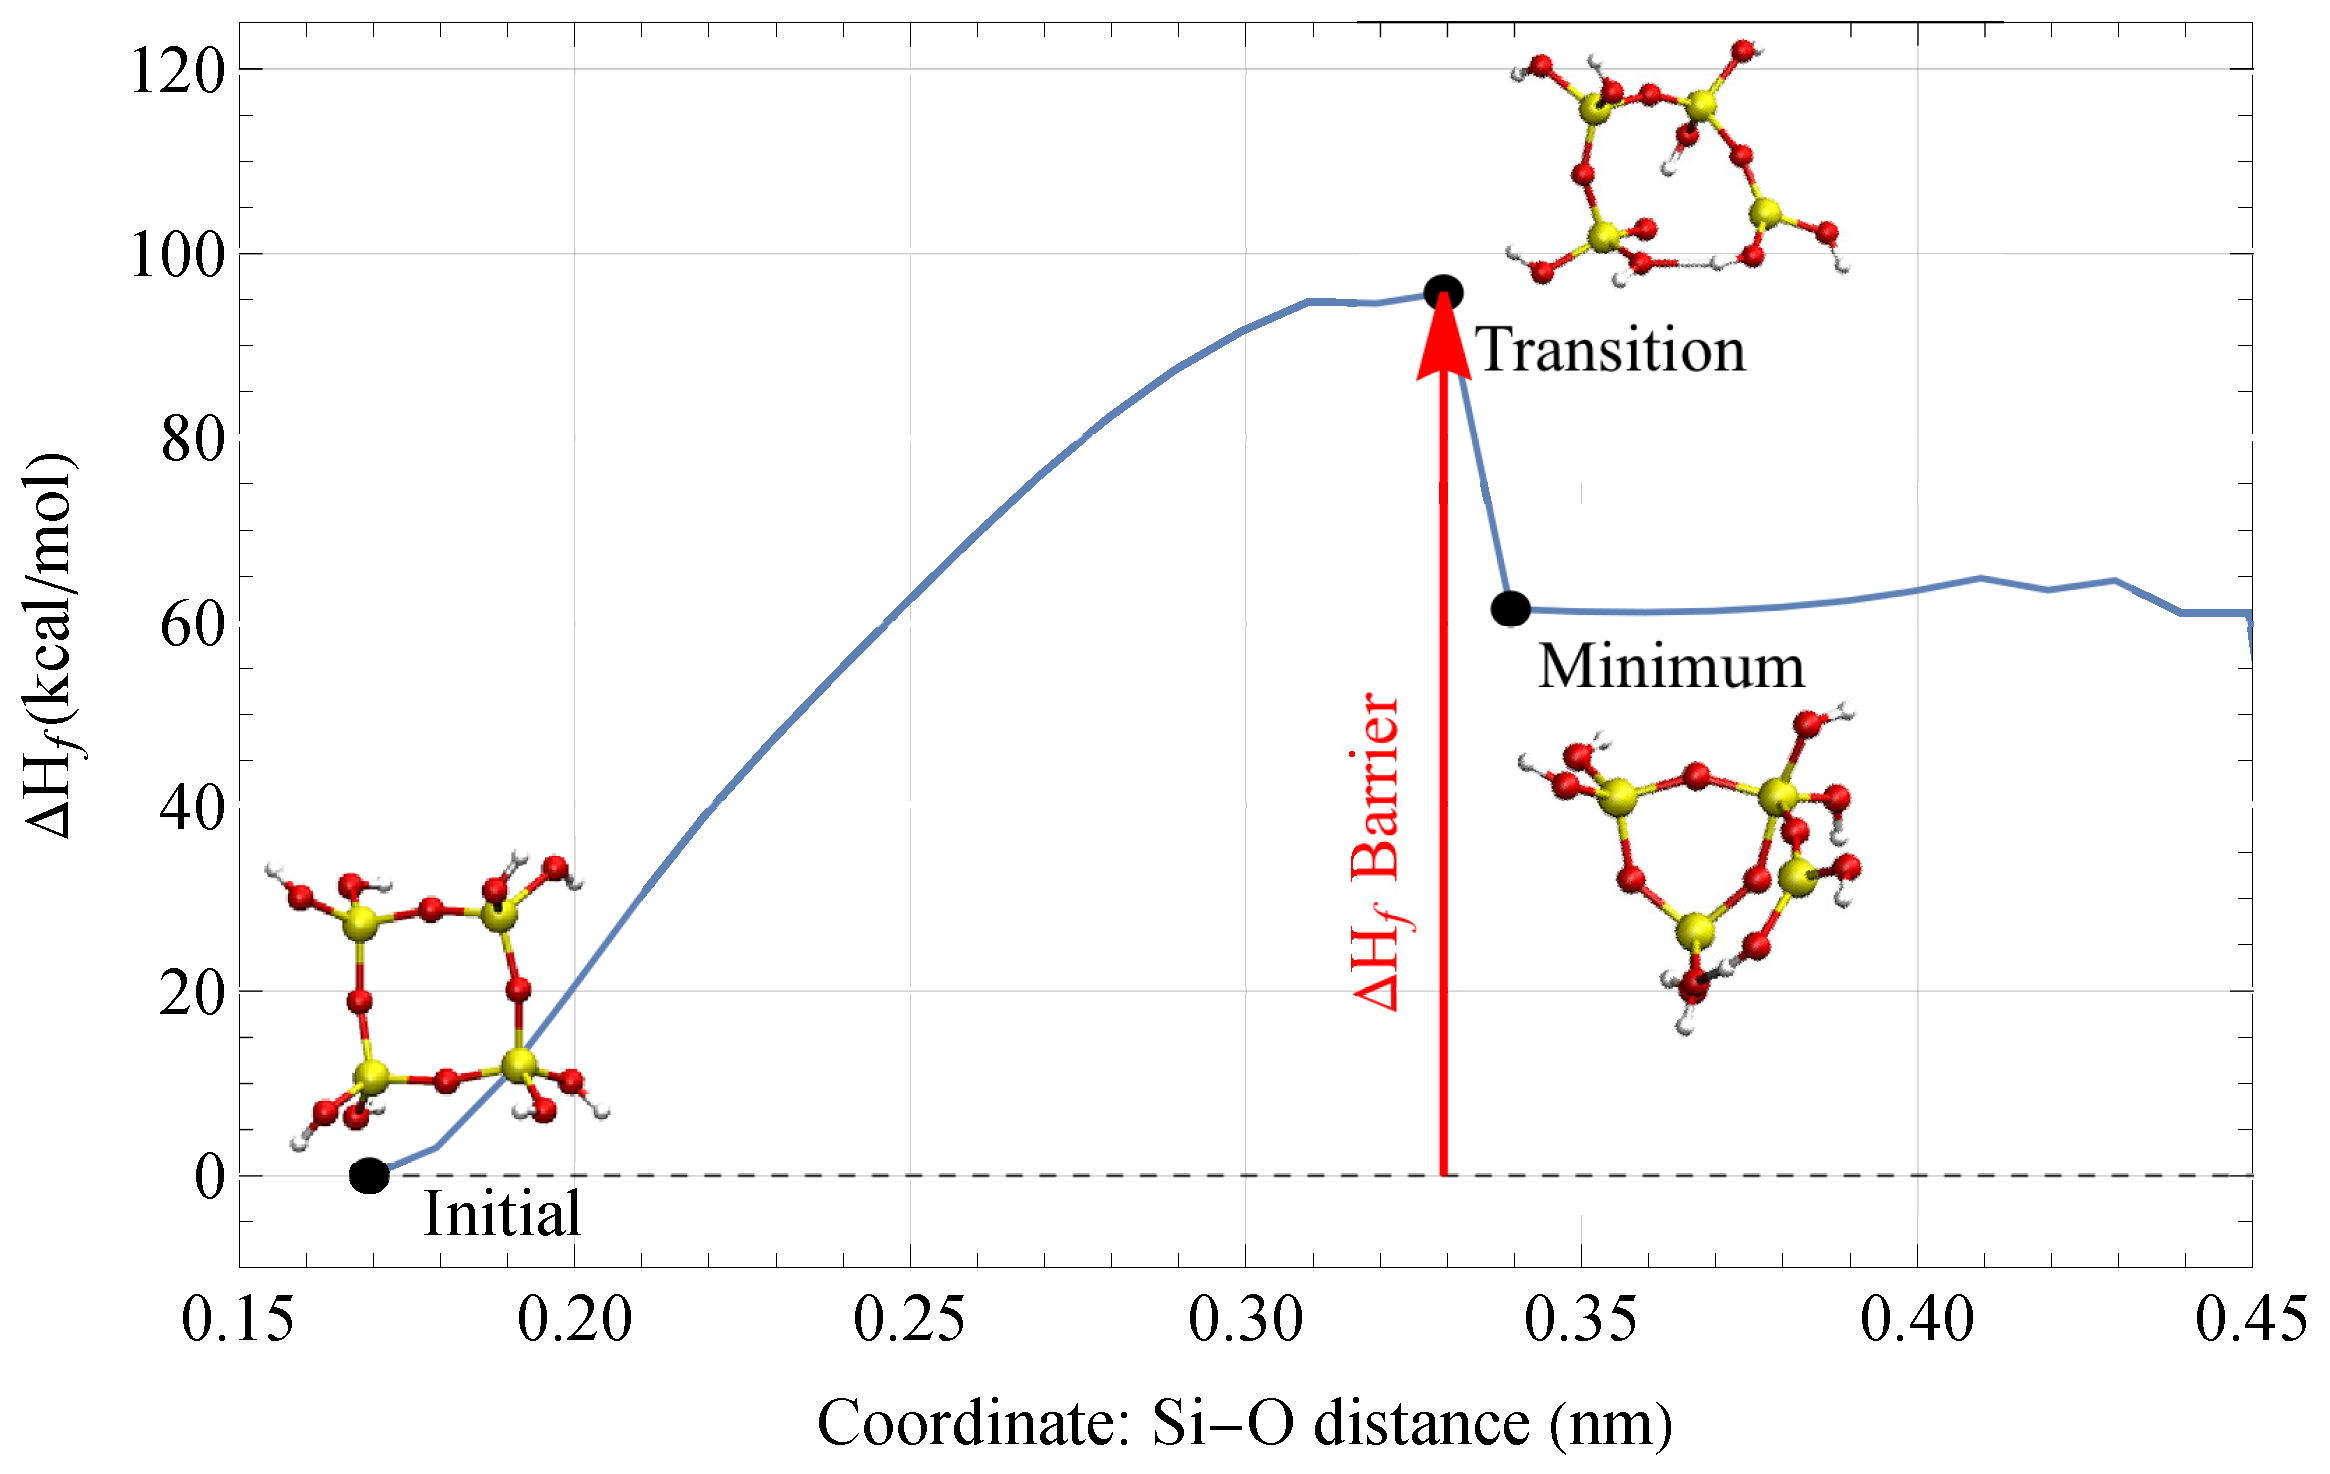
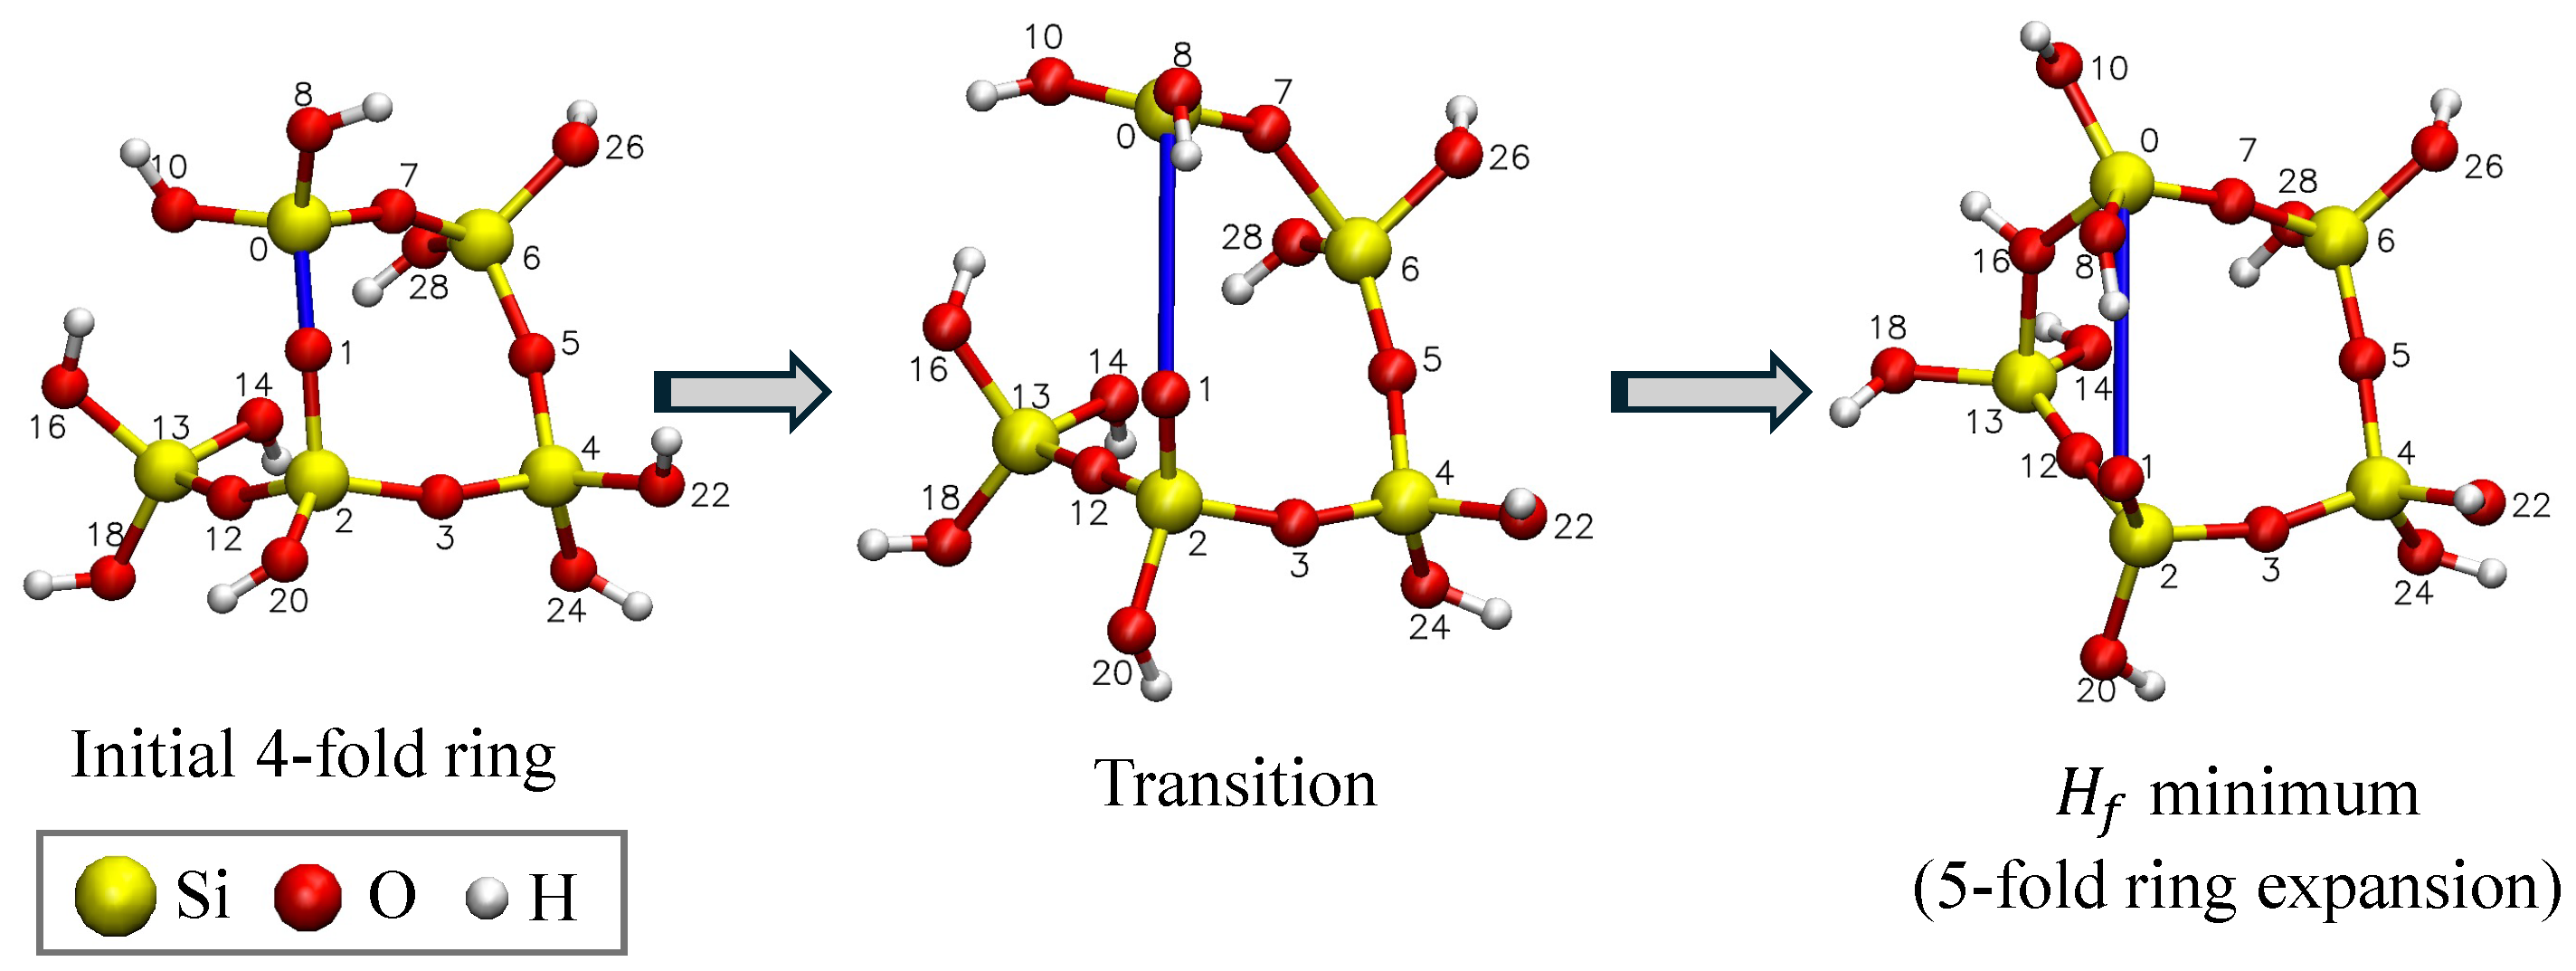
3.1. Results of Coordinate Scans
- A fracture event (FE) where suddenly drops at a certain bond length, accompanied by a reconfiguration of the geometric structure that is different from its initial geometry.
- A drop in where the geometry reconfigures back to its initial structure.
- A steady increase in during the entirety of the scan.
- A non-convergence of the self-consistent field (SCF) calculation, where the optimal geometry of the structure is not found.
3.2. Variation of with Clipping Radius
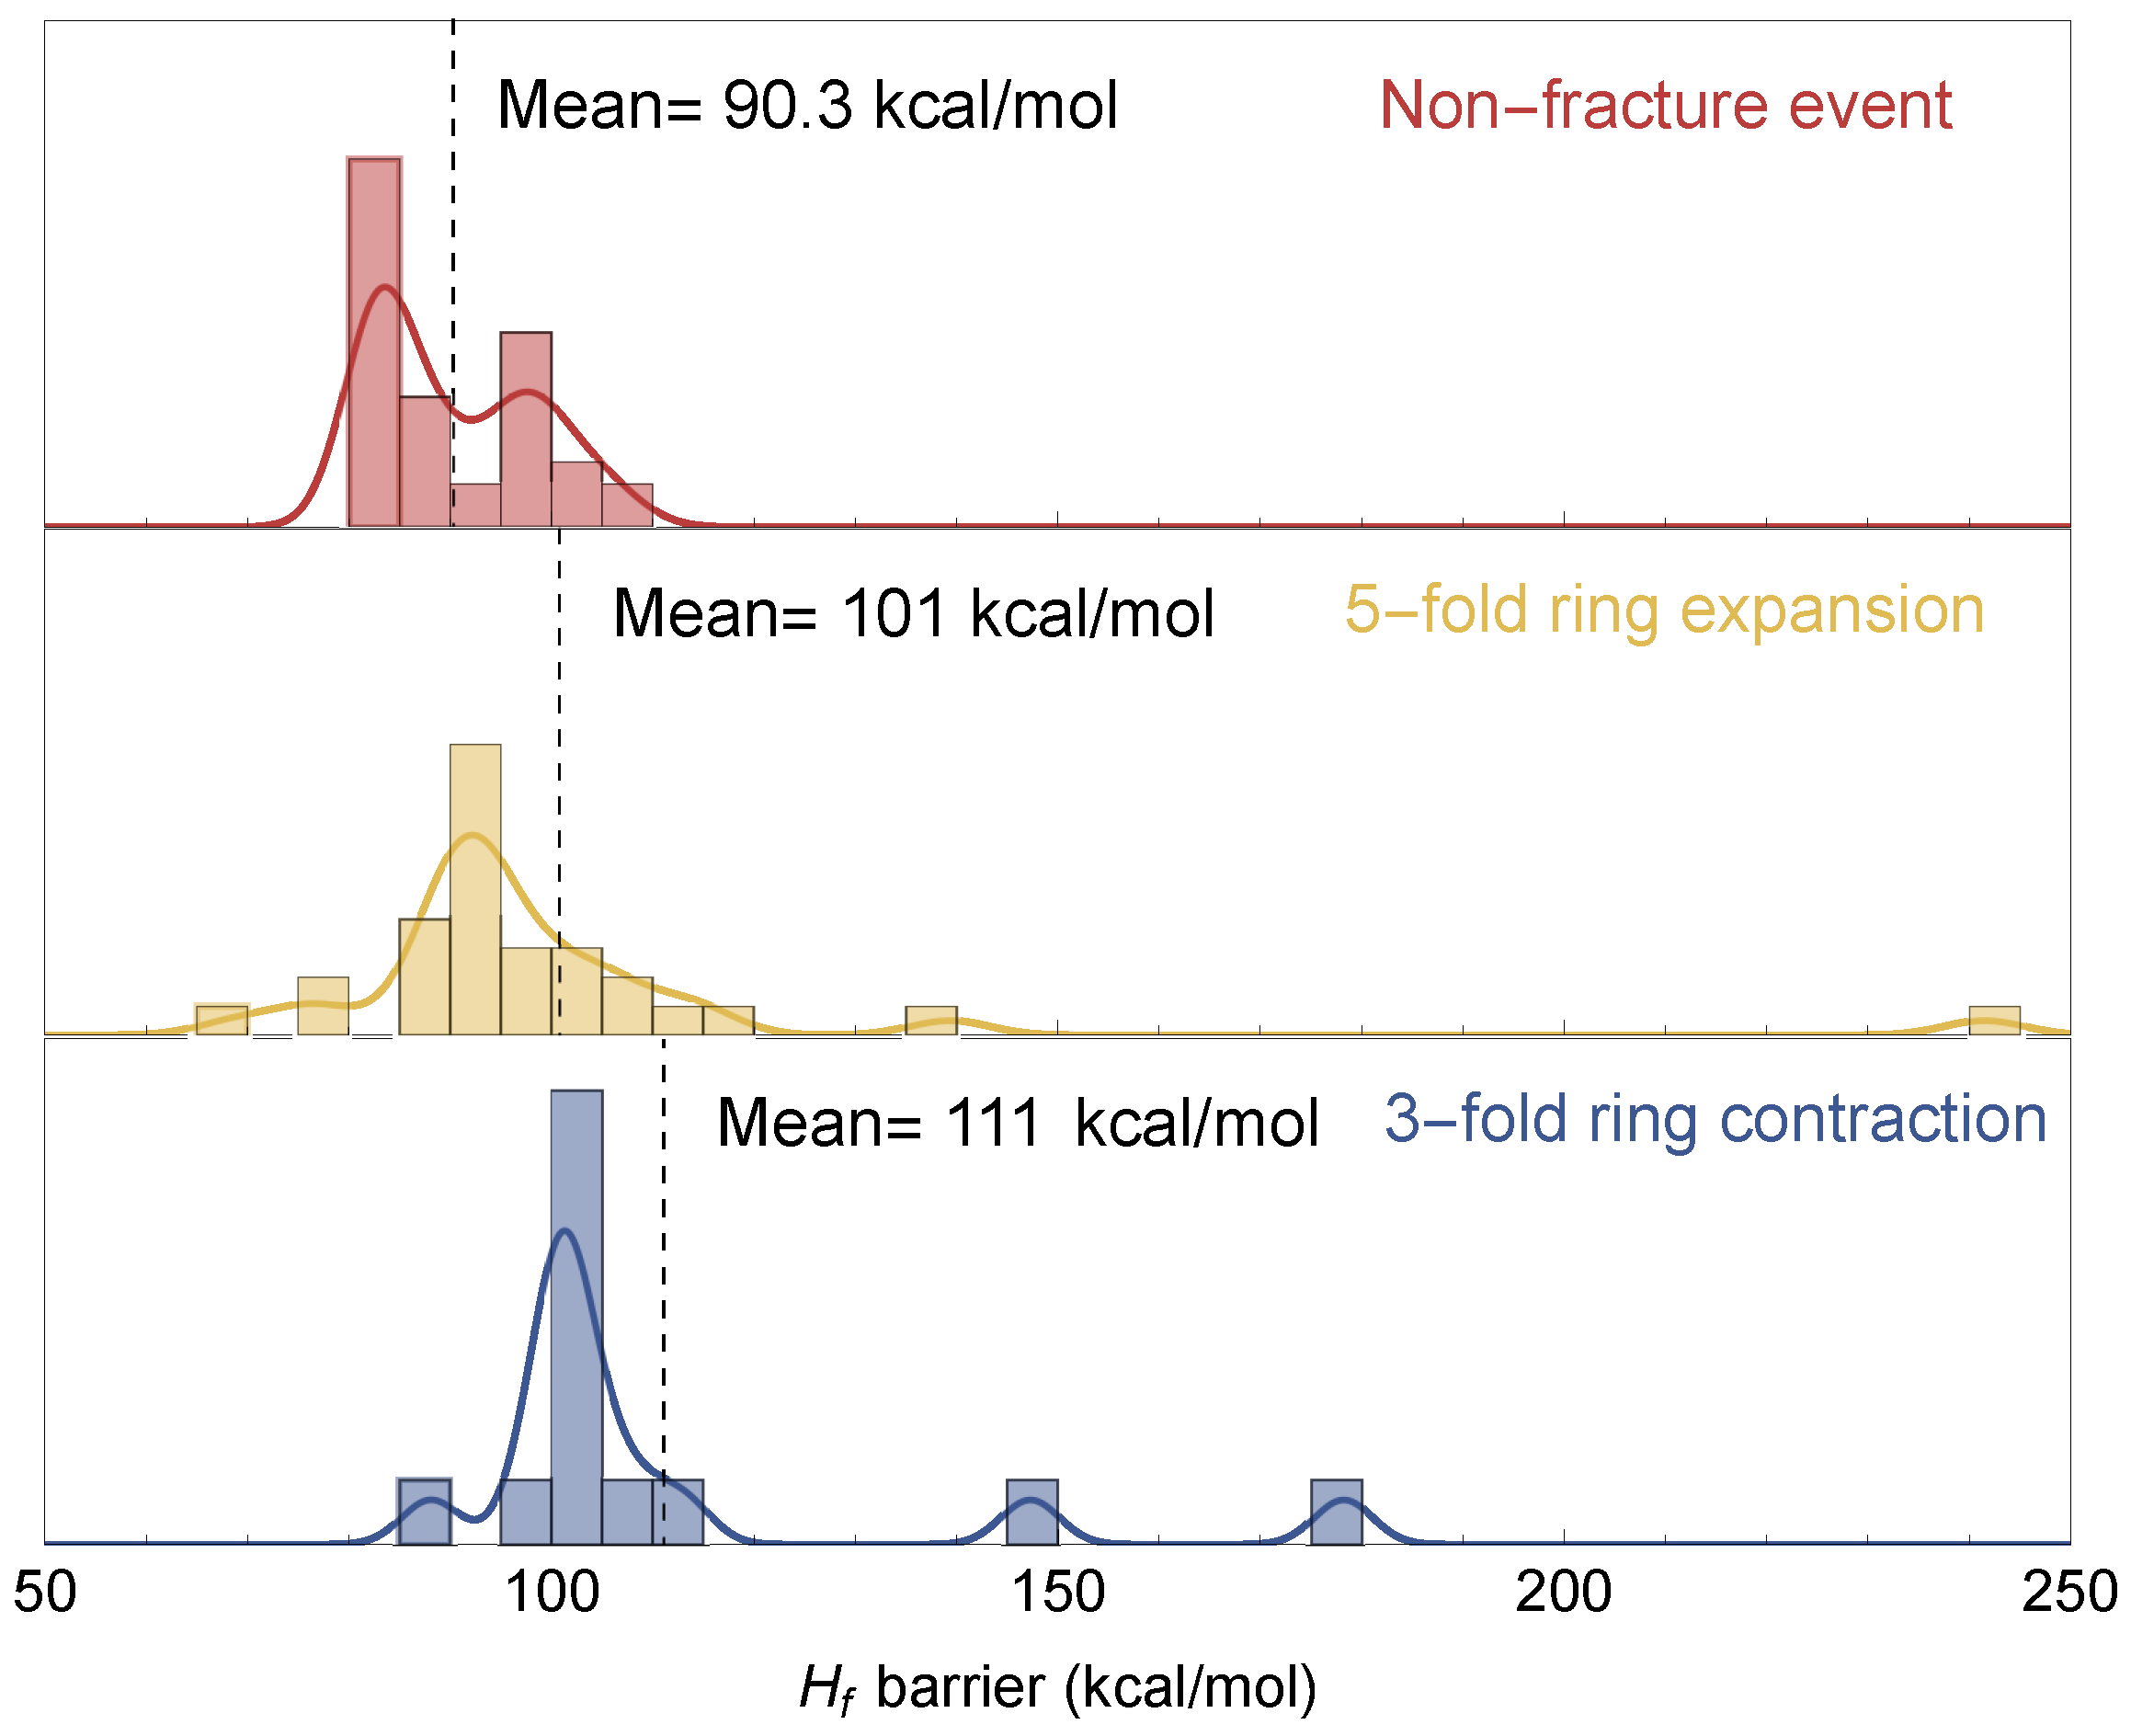
3.3. Fracture and Barriers
3.4. Reconfiguration Fracture Energy
4. Discussion
4.1. Fracture Events in a-Silica
4.2. Significance and Comparison of Calculations
4.3. Relation to the Macroscopic-Length Scale
4.4. Limitations
5. Conclusions
Author Contributions
Funding
Institutional Review Board Statement
Informed Consent Statement
Data Availability Statement
Acknowledgments
Conflicts of Interest
References
- West, J.; Mecholsky, J.; Hench, L. The application of fractal and quantum geometry to brittle fracture. J. Non-Cryst. Solids 1999, 260, 99–108. [Google Scholar] [CrossRef]
- Sun, Y.; Edwards, M.G.; Chen, B.; Li, C. A state-of-the-art review of crack branching. Eng. Fract. Mech. 2021, 257, 108036. [Google Scholar] [CrossRef]
- Bitzek, E.; Kermode, J.R.; Gumbsch, P. Atomistic Aspects of Fracture. Int. J. Fract. 2015, 191, 13–30. [Google Scholar] [CrossRef]
- Jiang, Y.; Killough, J.E.; Cui, Y. A numerical simulation approach for shale fracture network characterization using hybrid EDFM method. Lithosphere 2022, 2021, 4254028. [Google Scholar] [CrossRef]
- Yan, M.; Wu, D. A New Fracture Simulation Algorithm Based on Peridynamics for Brittle Objects. IEEE Access 2023, 11, 88609–88617. [Google Scholar] [CrossRef]
- Zhou, Z.; Su, Y.; Wang, W.; Yan, Y. Application of the fractal geometry theory on fracture network simulation. J. Pet. Explor. Prod. Technol. 2017, 7, 487–496. [Google Scholar] [CrossRef]
- Lan, M.; He, Y.; Wang, C.; Liu, X.; Ren, G.; Zhang, S. Fractal evolution characteristics of fracture meso-damage in uniaxial compression rock masses using bonded block model. Sci. Rep. 2024, 14, 17979. [Google Scholar] [CrossRef]
- Wang, W.; Su, Y.; Zhang, Q.; Xiang, G.; Cui, S. Performance-based fractal fracture model for complex fracture network simulation. Pet Sci. 2018, 15, 126–134. [Google Scholar] [CrossRef]
- Yangsheng, Z.; Zengchao, F.; Dong, Y.; Weiguo, L.; Zijun, F. Three-dimensional fractal distribution of the number of rock-mass fracture surfaces and its simulation technology. Comput. Geotech. 2015, 65, 136–146. [Google Scholar] [CrossRef]
- Mecholsky, J.; DeLellis, D.; Mecholsky, N. Relationship between fractography, fractal analysis and crack branching. J. Eur. Ceram. Soc. 2020, 40, 4722–4726. [Google Scholar] [CrossRef]
- Mandelbrot, B.B. The Fractal Geometry of Nature, 2nd ed.; Times Books: New York, NY, USA, 1982. [Google Scholar]
- Mandlebrot, B.; Passoja, D.; Paulley, A. Fractal character of fracture surface of metals. Nature 1984, 308, 721–722. [Google Scholar] [CrossRef]
- Mecholsky, J.J., Jr.; Passoja, D.E.; Feinberg-Ringel, K.S. Quantitative Analysis of Brittle Fracture Surfaces Using Fractal Geometry. J. Am. Ceram. Soc. 1989, 72, 60–65. [Google Scholar] [CrossRef]
- Russ, J.C. Fractal Surfaces; Springer Science & Business Media: Berlin/Heidelberg, Germany, 1994. [Google Scholar]
- Mackin, T.; Mecholsky, J. A Fractal Analysis of Brittle Fracture; Technical Report 87-007; Applied Research Laboratory, The Pennsylvania State University: State College, PA, USA, 1987. [Google Scholar]
- Williford, R. Multifractal fracture. Scr. Metall. 1988, 22, 1749–1754. [Google Scholar] [CrossRef]
- Mecholsky, J.J., Jr.; Freiman, S.W. Relationship between Fractal Geometry and Fractography. J. Am. Ceram. Soc. 1991, 74, 3136–3138. [Google Scholar] [CrossRef]
- Mosolov, A.B. Mechanics of Fractal Cracks in Brittle Solids. Europhys. Lett. 1993, 24, 673. [Google Scholar] [CrossRef]
- Milman, V.Y.; Stelmashenko, N.A.; Blumenfeld, R. Fracture surfaces: A critical review of fractal studies and a novel morphological analysis of scanning tunneling microscopy measurements. Prog. Mater. Sci. 1994, 38, 425–474. [Google Scholar] [CrossRef]
- Hill, T.; Mecholsky, J.; Anusavice, K. Fractal Analysis of Toughening Behavior in 3BaO5SiO2 Glass-Ceramics. J. Am. Ceram. Soc. 2000, 83, 545–552. [Google Scholar] [CrossRef]
- Santos, S.; Rodrigues, J. Correlation Between Fracture Toughness, Work of Fracture and Fractal Dimensions of Alumina-Mullite-Zirconia Composites. Mater. Res. 2003, 6, 219–226. [Google Scholar] [CrossRef]
- Mecholsky, J. Estimating theoretical strength of brittle materials using fractal geometry. Mater. Lett. 2006, 60, 2485–2488. [Google Scholar] [CrossRef]
- Chang, Q.; Chen, D.L.; Ru, H.Q.; Yue, X.Y.; Yu, L.; Zhang, C.P. Three-dimensional fractal analysis of fracture surfaces in titanium–iron particulate reinforced hydroxyapatite composites: Relationship between fracture toughness and fractal dimension. J. Mater. Sci. 2011, 46, 6118–6123. [Google Scholar] [CrossRef]
- Sahu, S.; Yadav, P.C.; Shekhar, S. Fractal Analysis as Applied to Fractography in Ferritic Stainless Steel. Metallogr. Microstruct. Anal. 2017, 6, 598–609. [Google Scholar] [CrossRef]
- Yarema, S.Y. On the contribution of G. R. Irwin to fracture mechanics. Mater. Sci. 1996, 31, 617–623. [Google Scholar] [CrossRef]
- Sanford, R. Principles of Fracture Mechanics; Prentice Hall: Hoboken, NJ, USA, 2003. [Google Scholar]
- Hilders, A.; Pilot, D. On the Development of a Relation between Fractal Dimension and Impact Toughness. Mater. Charact. 1997, 38, 121–127. [Google Scholar] [CrossRef]
- Key, W.B.; Jodha, K.S.; Kaur, N.; Salazar Marocho, S.M.; Mecholsky, J.J., Jr.; Griggs, J.A. Fracture toughness and fractal analysis of ceramic benchmark materials. J. Mater. Sci. 2022, 57, 10051–10058. [Google Scholar] [CrossRef]
- Lange, D.A.; Jennings, H.M.; Shah, S.P. Relationship between Fracture Surface Roughness and Fracture Behavior of Cement Paste and Mortar. J. Am. Ceram. Soc. 1993, 76, 589–597. [Google Scholar] [CrossRef]
- Lung, C.W.; Mu, Z.Q. Fractal Dimension Measured with Perimeter-area Relation and Toughness of Materials. Phys. Rev. B 1988, 38, 11781–11784. [Google Scholar] [CrossRef]
- Mecholsky, J.J., Jr.; Mackin, T.J. Fractal analysis of fracture in Ocala chert. J. Mater. Sci. Lett. 1988, 7, 1145–1147. [Google Scholar] [CrossRef]
- Carney, L.R.; Mecholsky, J.J. Relationship between Fracture Toughness and Fracture Surface Fractal Dimension in AISI 4340 Steel. Mater. Sci. Appl. 2013, 4, 258–267. [Google Scholar] [CrossRef]
- Mecholsky, J.J., Jr.; Mackin, T.J.; Passoja, D.E. Self-similar crack propagation in brittle materials. In Advances in Ceramics: Fractography of Glasses and Ceramics; Varner, J., Frechette., V.D., Eds.; American Ceramic Society: Columbus, OH, USA, 1988; Volume 22, pp. 127–134. [Google Scholar]
- Freiman, S.W.; Mecholsky, J.J. The Fracture of Brittle Materials: Testing and Analysis, 2nd ed.; John Wiley & Sons, Inc.: Hoboken, NJ, USA, 2019. [Google Scholar]
- Tsai, Y.; Mecholsky, J. Fractal fracture of single crystal silicon. J. Mater. Res. 1991, 6, 1248–1263. [Google Scholar] [CrossRef]
- West, J.; Hench, L. Silica fracture: Part 1 A ring contraction model. J. Mater. Sci. 1994, 29, 3601–3606. [Google Scholar] [CrossRef]
- Dewar, M.; Zoebisch, E.; Healy, E.; Stewart, J. AM1: A New General Purpose Quantum Mechanical Molecular Model. J. Am. Chem. Soc. 1985, 107, 3902–3909. [Google Scholar] [CrossRef]
- Bell, R.; Dean, P. The structure of vitreous silica: Validity of the random network theory. Philos. Mag. 1972, 25, 1381–1398. [Google Scholar] [CrossRef]
- Galeener, F.L. Planar Rings in Vitreous Silica. J. Non-Cryst. Solids 1982, 49, 53–62. [Google Scholar] [CrossRef]
- Galeener, F.; Barrio, R.; Martinez, E.; Elliott, R. Vibrational Decoupling of Rings in Amorphous Solids. Phys. Rev. Lett. 1984, 53, 2549. [Google Scholar] [CrossRef]
- Wright, A.C.; Thorpe, M.F. Eighty Years of Random Networks. Phys. Status Solidi 2013, 250, 931–936. [Google Scholar] [CrossRef]
- Humphrey, W.; Dalke, A.; Schulten, K. VMD—Visual Molecular Dynamics. J. Mol. Graph. 1996, 14, 33–38. [Google Scholar] [CrossRef]
- Collins, M.A. The interface between electronic structure theory and reaction dynamics by reaction path methods. In Advances in Chemical Physics; John Wiley & Sons: Hoboken, NJ, USA, 2009; pp. 389–453. [Google Scholar]
- Lewis, L.J. Fifty years of amorphous silicon models: The end of the story? J. Non-Cryst. Solids 2022, 580, 121383. [Google Scholar] [CrossRef]
- Mecholsky, N.A.; Morin, R.; Mecholsky, R.D.; Freiman, S.W.; Mecholsky, J.J. Dataset from the Bell and Dean paper on the structure of vitreous silica. Data Brief 2024, 55, 110734. [Google Scholar] [CrossRef]
- Ishimaru, M.; Munetoh, S.; Motooka, T. Generation of amorphous silicon structures by rapid quenching: A molecular-dynamics study. Phys. Rev. B 1997, 56, 15133–15138. [Google Scholar] [CrossRef]
- Zheng, Z.; Zheng, F.; Wu, Y.N.; Chen, S.; Wang, L.W. A Generalized Bond Switching Monte Carlo method for amorphous structure generation. Comput. Mater. Today 2025, 6, 100031. [Google Scholar] [CrossRef]
- Ding, Z.; Zhou, S.; Zhao, Y. Hardness and fracture toughness of brittle materials: A density functional theory study. Phys. Rev. B 2004, 70, 184117. [Google Scholar] [CrossRef]
- Sakanoi, R.; Shimazaki, T.; Xu, J.; Higuchi, Y.; Ozawa, N.; Sato, K.; Hashida, T.; Kubo, M. Communication: Different behavior of Young’s modulus and fracture strength of CeO2: Density functional theory calculations. J. Chem. Phys. 2014, 140, 121102. [Google Scholar] [CrossRef]
- Yuan, Z.; Zhang, C.; Li, L.; Xu, X.; Wang, X. Density functional theory calculation of fracture surfaces of siderite and hematite. Powder Technol. 2020, 376, 373–379. [Google Scholar] [CrossRef]
- Jung, G.S.; Irle, S.; Sumpter, B.G. Dynamic aspects of graphene deformation and fracture from approximate density functional theory. Carbon 2022, 190, 183–193. [Google Scholar] [CrossRef]
- Felix, L.C.; Li, Q.K.; Penev, E.S.; Yakobson, B.I. Ab Initio Molecular Dynamics Insights into Stress Corrosion Cracking and Dissolution of Metal Oxides. Materials 2025, 18, 538. [Google Scholar] [CrossRef]
- Zhang, H.; Sun, W.; Xie, X.; He, J.; Zhang, C. Insights into the Fracture Nature of Hematite from First Principles DFT Calculations. ACS Omega 2023, 8, 8248–8255. [Google Scholar] [CrossRef]
- Lazar, P.; Podloucky, R. Cleavage fracture of a crystal: Density functional theory calculations based on a model which includes structural relaxations. Phys. Rev. B 2008, 78, 104114. [Google Scholar] [CrossRef]
- Vashishta, P.; Kalia, R.K.; Nakano, A. Multimillion Atom Molecular-Dynamics Simulations of Nanostructured Materials and Processes on Parallel Computers. In Handbook of Materials Modeling: Methods; Yip, S., Ed.; Springer: Dordrecht, The Netherlands, 2005; pp. 875–928. [Google Scholar] [CrossRef]
- Griffith, A. The phenomenon of rupture and flow in solids. Philos. Trans. R. Soc. Lond. Ser. Contain. Pap. Math. Phys. Character 1921, 221, 163–198. [Google Scholar]
- Irwin, G. Fracturing and Fracture Mechanics, T&AM Report No 202; Department of Theoretical and Applied Mechanics, University of Illinois: Champaign, IL, USA, 1961. [Google Scholar]
- Weser, O.; Hein-Janke, B.; Mata, R.A. Automated handling of complex chemical structures in Z-matrix coordinates—The chemcoord library. J. Comput. Chem. 2023, 44, 710–726. [Google Scholar] [CrossRef]
- Mecholsky, J.J., Jr.; West, J.K.; Passoja, D.E. Fractal dimension as a characterization of free volume created during fracture in brittle materials. Philos. Mag. A 2002, 82, 3163–3176. [Google Scholar] [CrossRef]
- Klamt, A.; Schüürmann, G. COSMO: A new approach to dielectric screening in solvents with explicit expressions for the screening energy and its gradient. J. Chem. Soc. Perkin Trans. 2 1993, 5, 799–805. [Google Scholar] [CrossRef]
- Kruskal, W.H. A Nonparametric test for the Several Sample Problem. Ann. Math. Stat. 1952, 23, 525–540. [Google Scholar] [CrossRef]
- Vega, C.; Noya, E.G. Revisiting the Frenkel-Ladd method to compute the free energy of solids: The Einstein molecule approach. J. Chem. Phys. 2007, 127, 154113. [Google Scholar] [CrossRef]
- Eslami, H.; Müller-Plathe, F. Metadynamics simulations of three-dimensional nanocrystals self-assembled from triblock janus nanoparticles: Implications for light filtering. ACS Appl. Nano Mater. 2024, 7, 18045–18055. [Google Scholar] [CrossRef]
- Wiederhorn, S.M. Fracture Surface Energy of Glass. J. Am. Ceram. Soc. 1969, 52, 99–105. [Google Scholar] [CrossRef]
- Beauchamp, E.K. Mechanisms for hackle formation and crack branching. In Proceedings of the Ceramic Transactions: Fractography of Glasses and Ceramics III, Alfred, NY, USA, 7–12 July 1995; Varner, J., Frechette, V., Quinn, G., Eds.; American Ceramic Society: Westerville, OH, USA, 1996; Volume 64. [Google Scholar]
- Guilloteau, E.; Arribart, H.; Creuzet, F. Fractography of Glass at the Nanometer Scale. MRS Online Proc. Libr. 1995, 409, 365–370. [Google Scholar] [CrossRef]
- Smith, R.; Mecholsky, J. Application of atomic force microscopy in determining the fractal dimension of the mirror, mist, and hackle region of silica glass. Mater. Charact. 2011, 62, 457–462. [Google Scholar] [CrossRef]
- Garza-Méndez, F.; Hinojosa-Rivera, M.; Gómez, I.; Sánchez, E. Scaling properties of fracture surfaces on glass strengthened by ionic exchange. Appl. Surf. Sci. 2007, 254, 1471–1474. [Google Scholar] [CrossRef]
- van Duin, A.C.T.; Dasgupta, S.; Lorant, F.; Goddard, W.A. ReaxFF: A Reactive Force Field for Hydrocarbons. J. Phys. Chem. A 2001, 105, 9396–9409. [Google Scholar] [CrossRef]
- Wu, P.; Liu, R.; Li, W.; Zhang, W.; Wei, J.; Zhou, Q.; Wei, T.; Kardani, A.; Lin, Z.; Xiao, Y.; et al. Interface optimization by introducing Ti for strengthening graphene network/copper composites: New insight from MD simulations. Carbon 2025, 236, 120109. [Google Scholar] [CrossRef]


Disclaimer/Publisher’s Note: The statements, opinions and data contained in all publications are solely those of the individual author(s) and contributor(s) and not of MDPI and/or the editor(s). MDPI and/or the editor(s) disclaim responsibility for any injury to people or property resulting from any ideas, methods, instructions or products referred to in the content. |
© 2025 by the authors. Licensee MDPI, Basel, Switzerland. This article is an open access article distributed under the terms and conditions of the Creative Commons Attribution (CC BY) license (https://creativecommons.org/licenses/by/4.0/).
Share and Cite
Morin, R.M.; Mecholsky, N.A.; Mecholsky, J.J., Jr. Quantum Simulation of Fractal Fracture in Amorphous Silica. Materials 2025, 18, 3517. https://doi.org/10.3390/ma18153517
Morin RM, Mecholsky NA, Mecholsky JJ Jr. Quantum Simulation of Fractal Fracture in Amorphous Silica. Materials. 2025; 18(15):3517. https://doi.org/10.3390/ma18153517
Chicago/Turabian StyleMorin, Rachel M., Nicholas A. Mecholsky, and John J. Mecholsky, Jr. 2025. "Quantum Simulation of Fractal Fracture in Amorphous Silica" Materials 18, no. 15: 3517. https://doi.org/10.3390/ma18153517
APA StyleMorin, R. M., Mecholsky, N. A., & Mecholsky, J. J., Jr. (2025). Quantum Simulation of Fractal Fracture in Amorphous Silica. Materials, 18(15), 3517. https://doi.org/10.3390/ma18153517