
A Non-Contact Method of Measuring Capillary Rise Based on the Hygroscopic Expansion of the Material


Abstract
1. Introduction
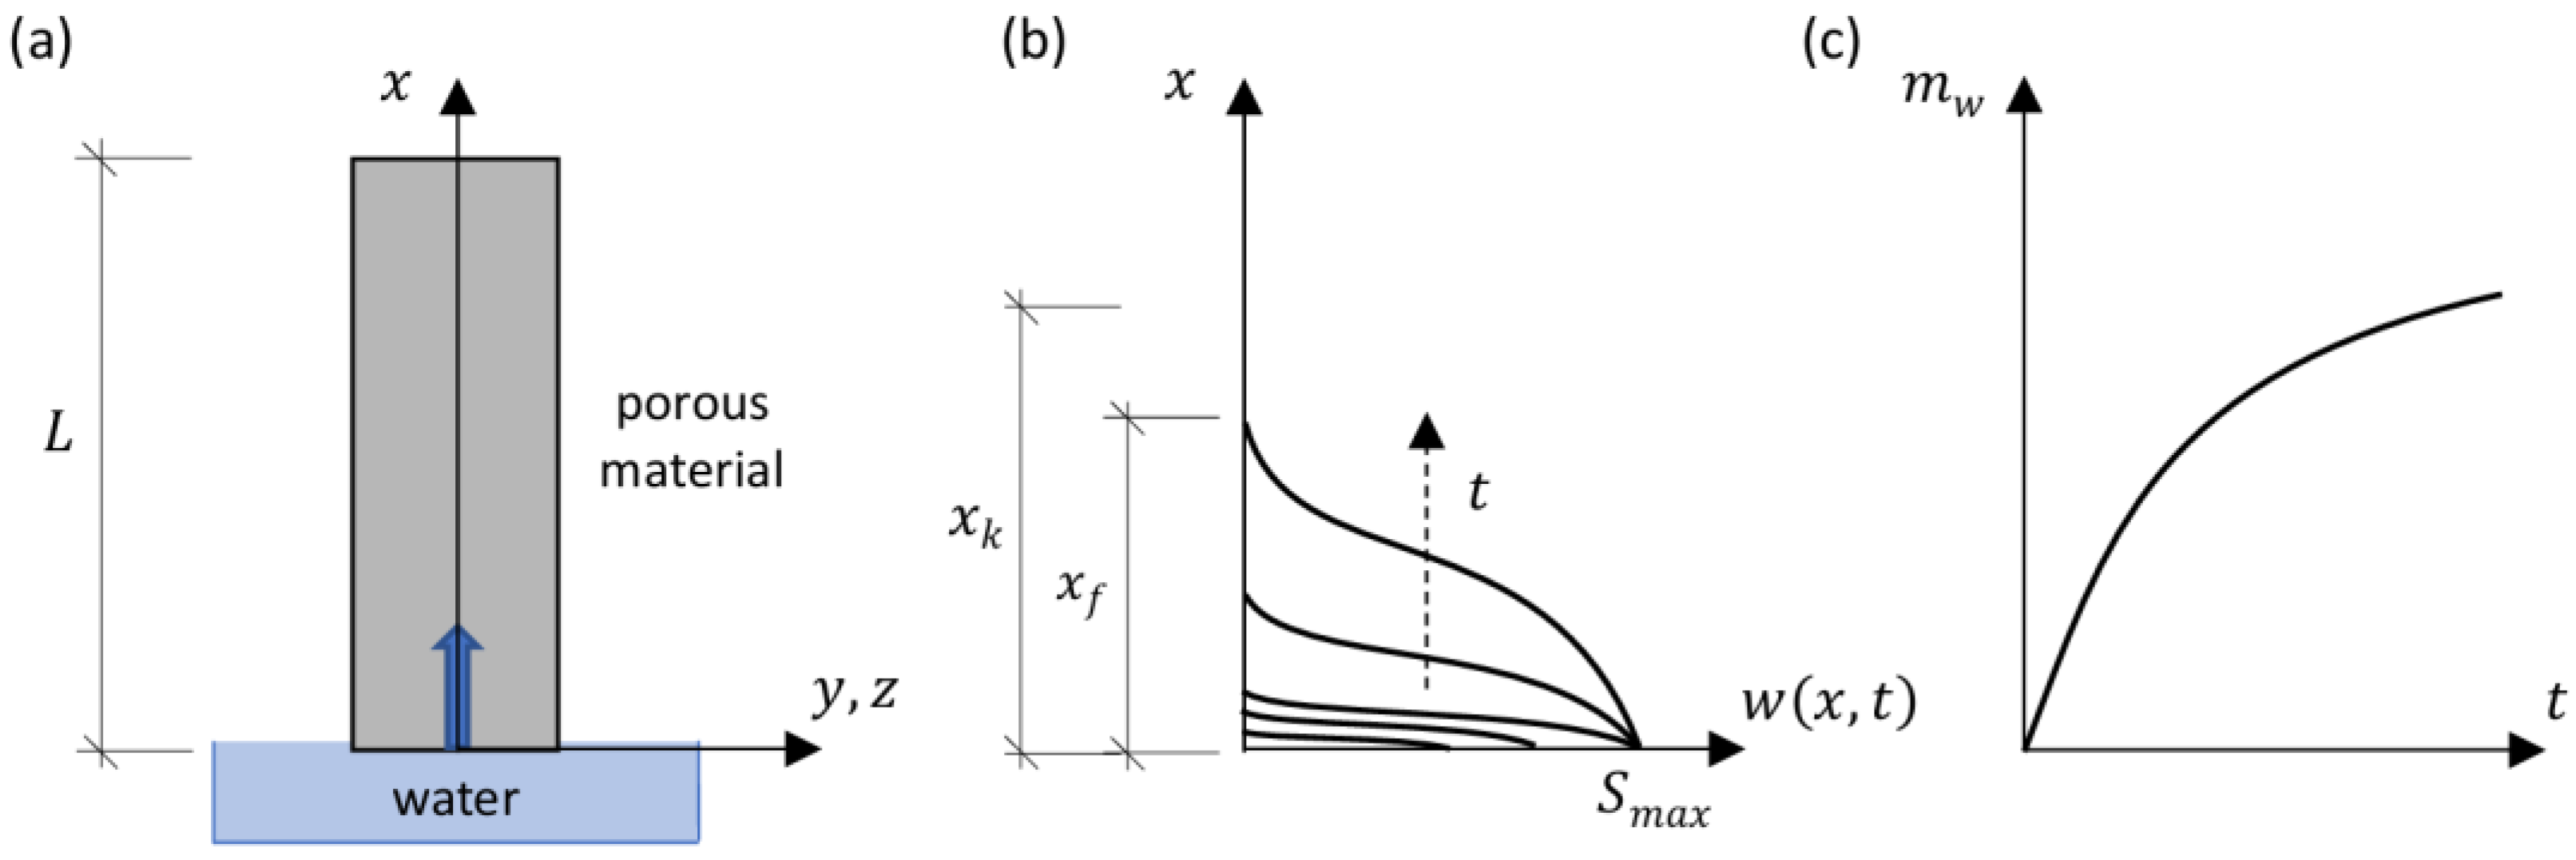
2. Problem Statement
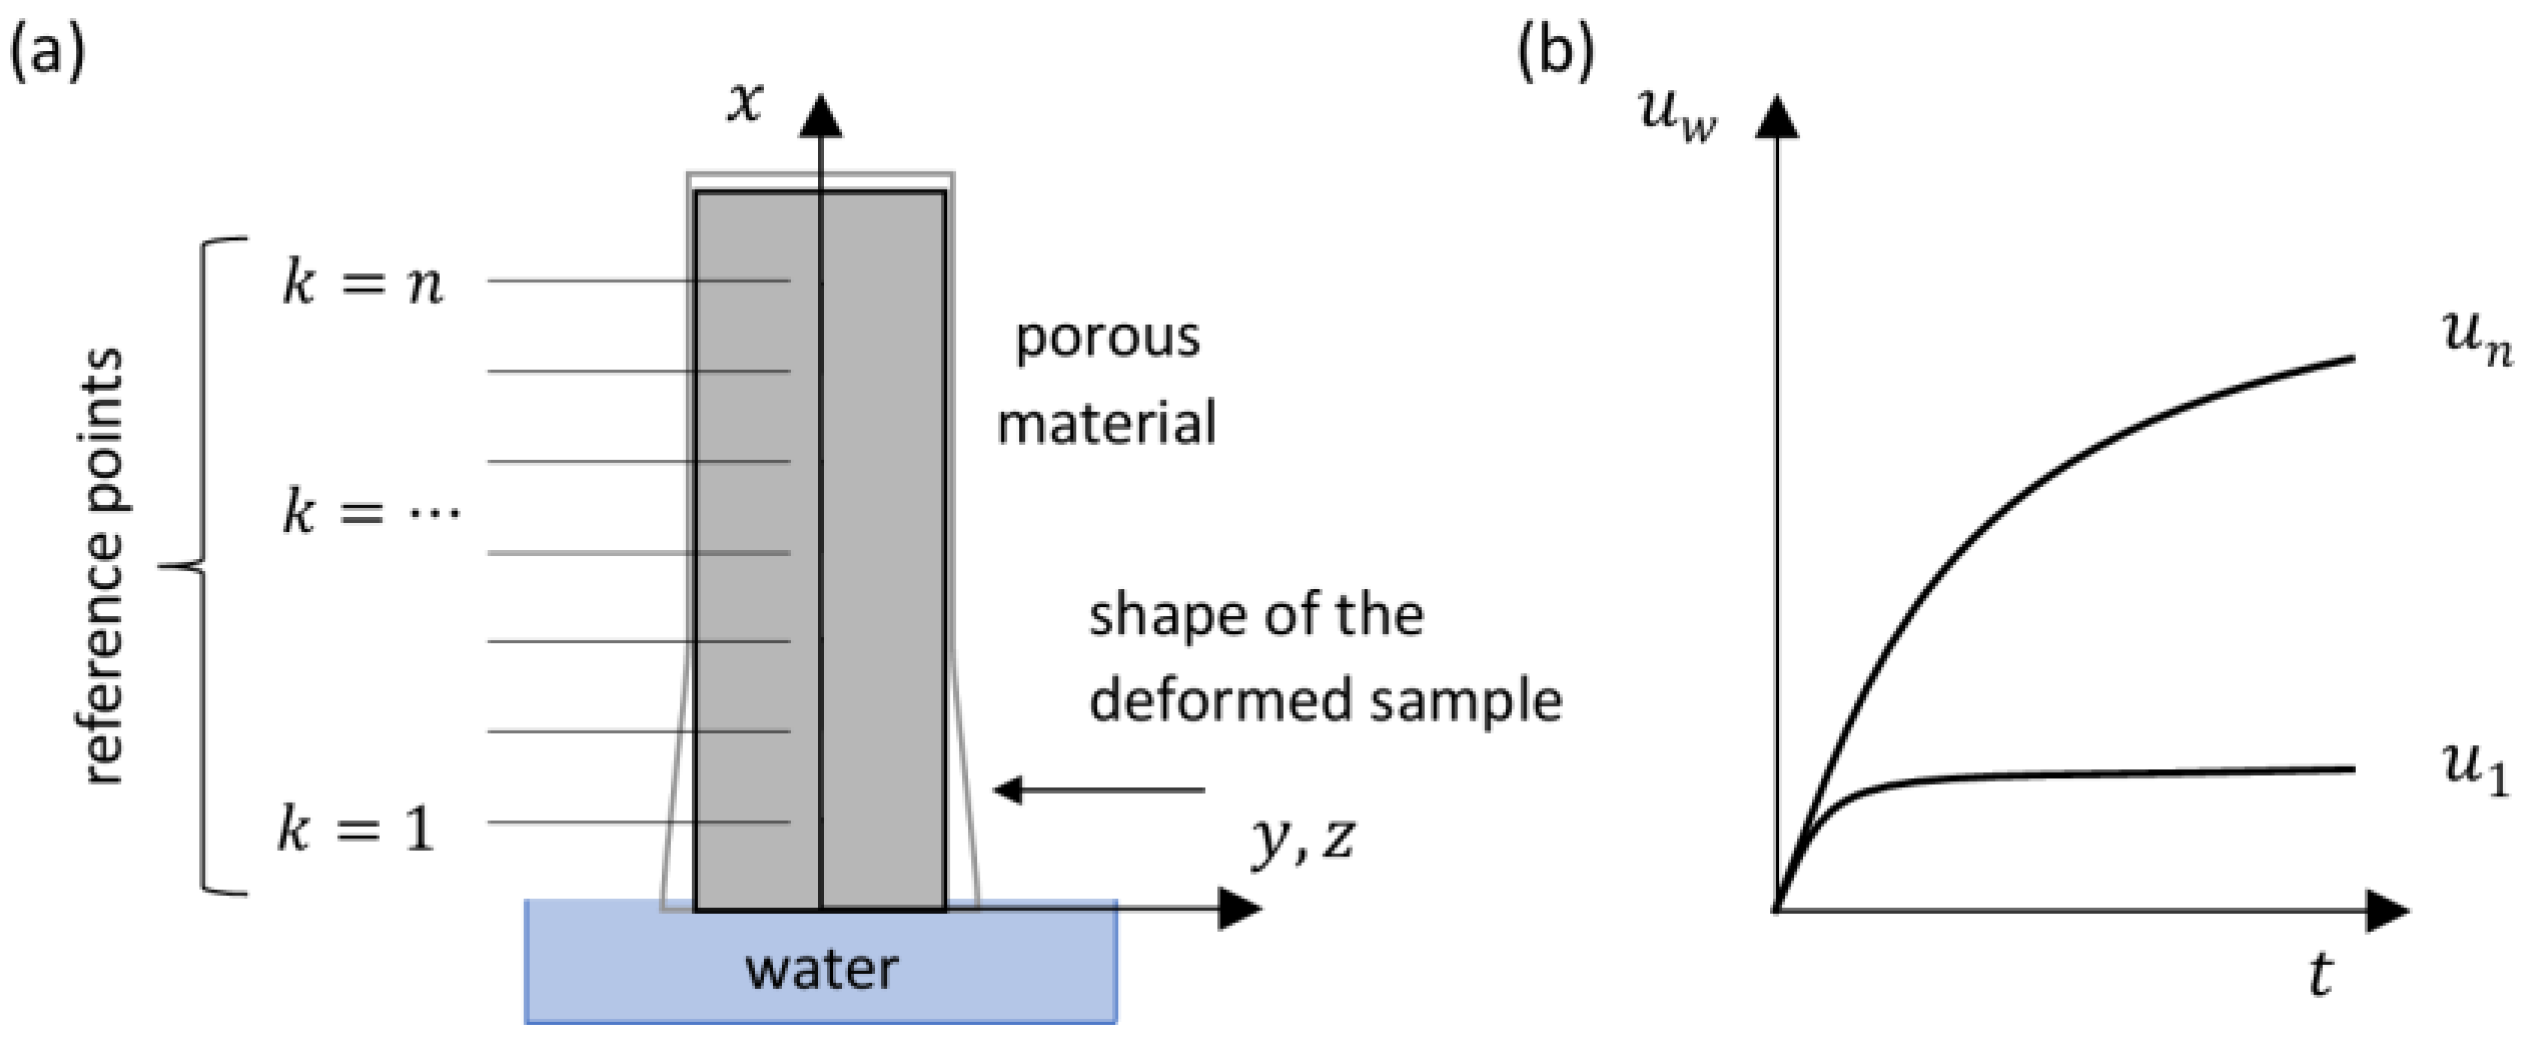
3. Mathematical Model for Determining the Mass of Adsorbed Water from Displacement Measurements
- −
- Equilibrium equations:
- −
- Physical equations:
- −
- Geometric equations (Bernoulli’s hypothesis of plane cross sections):where —the stress ; —the deformation ; —the moisture deformation ; —the coefficient of moisture expansion []; and —the current and initial water saturation, respectively []; and —the current and initial gravimetric moisture content, respectively [kg/m3]; —the maximum (saturated) gravimetric moisture content [kg/m3].
4. The Experiment
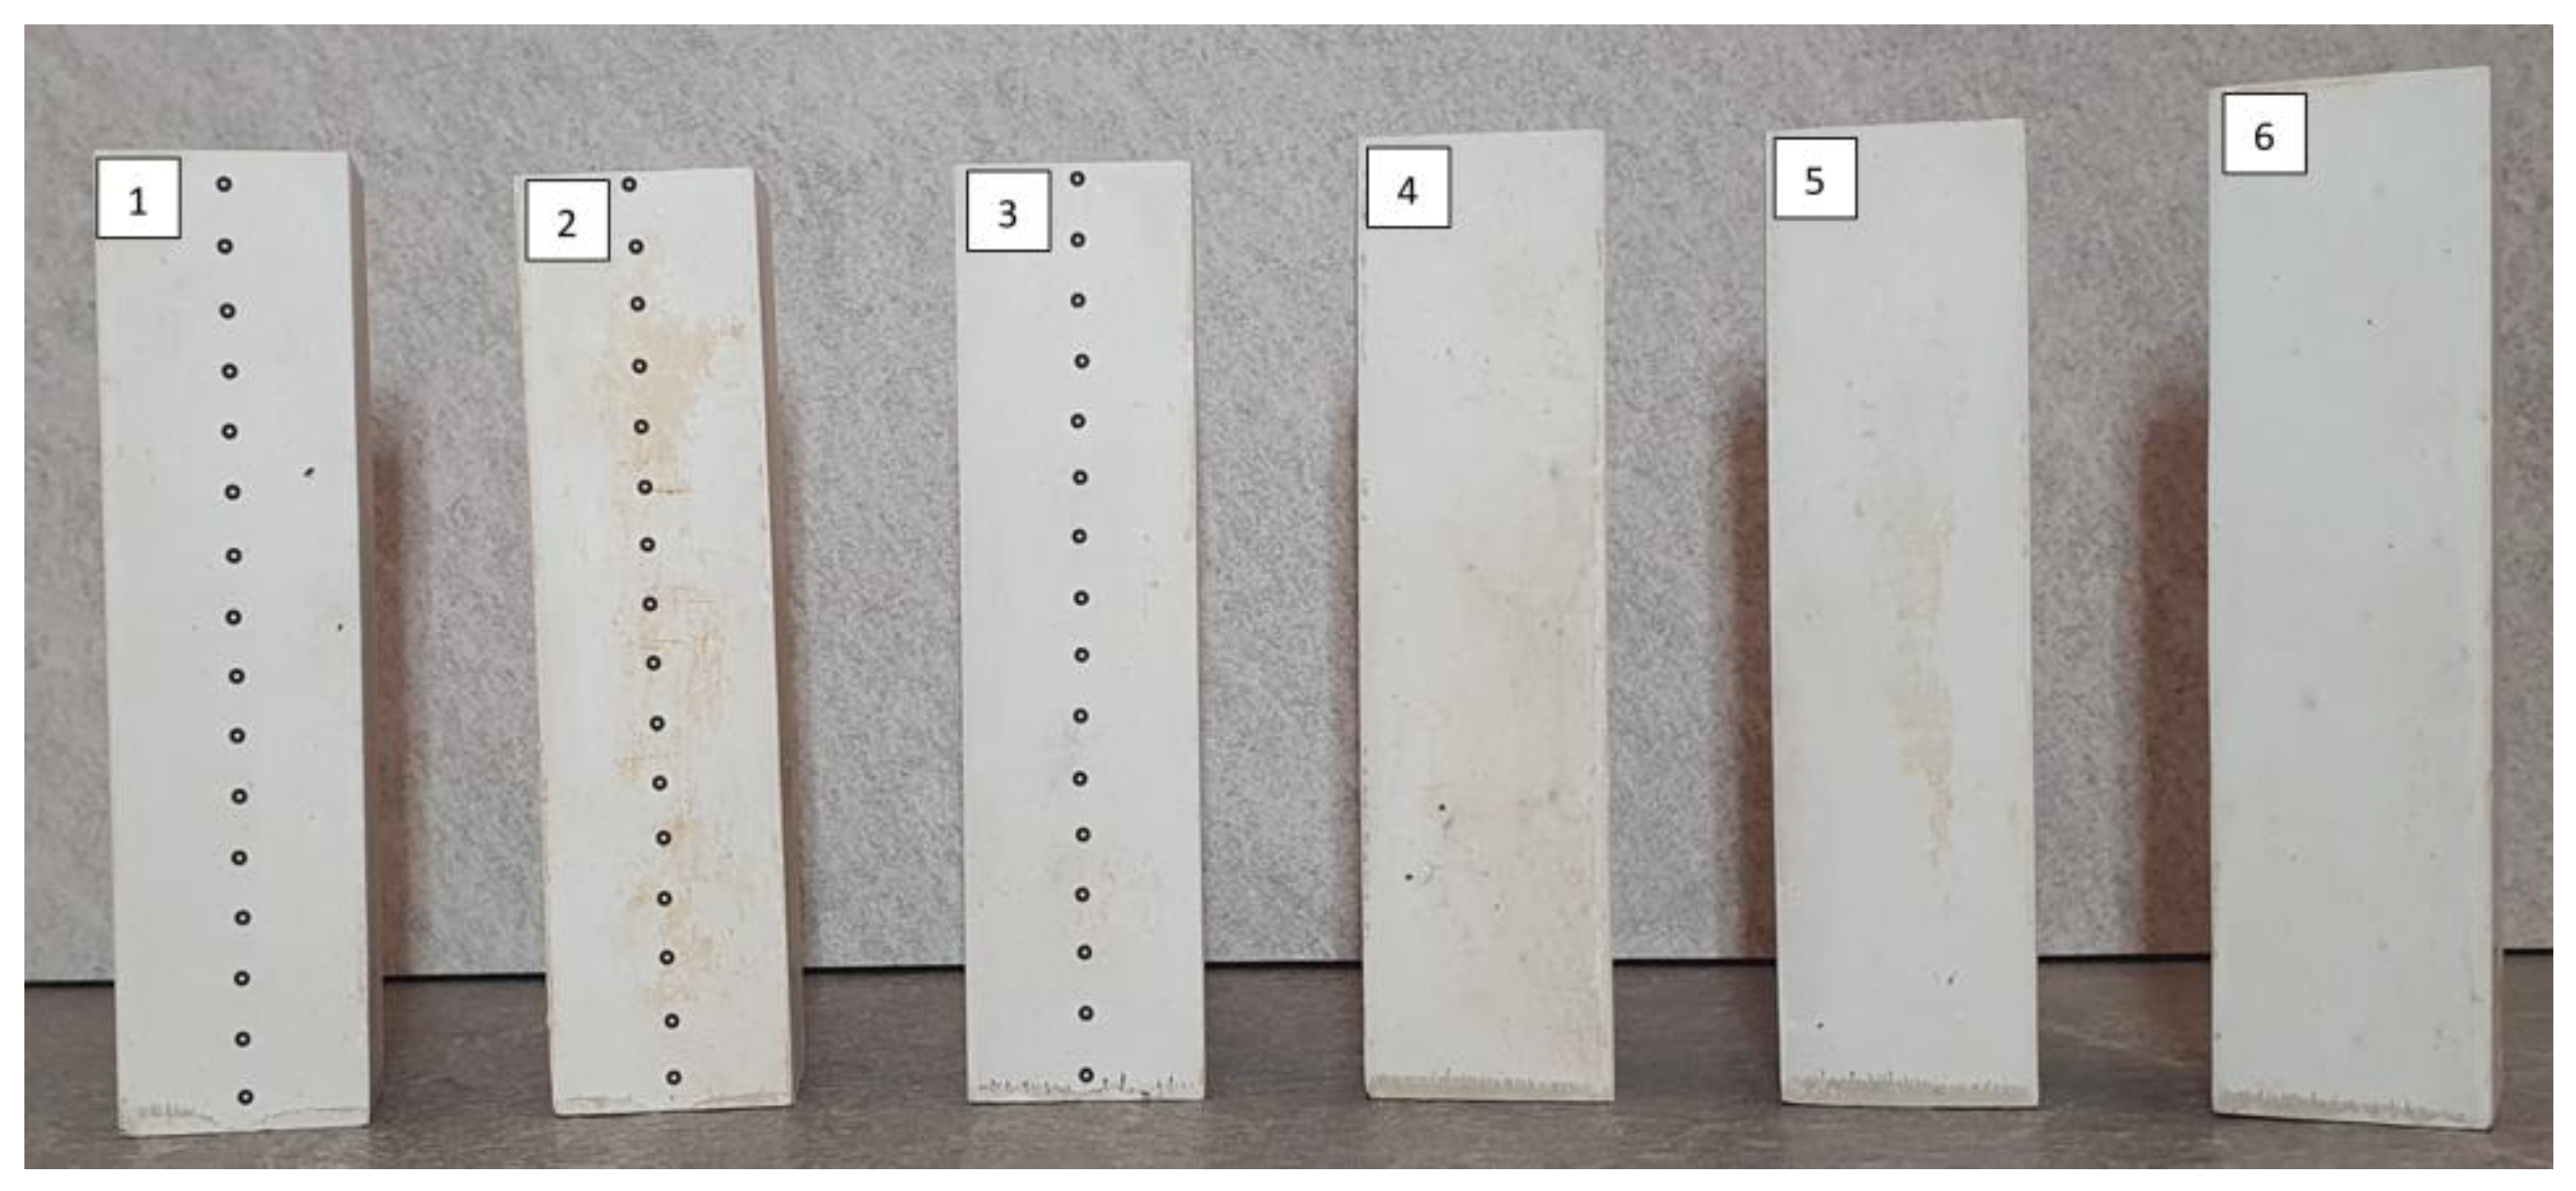
- Sample Preparation
4.1. Main Research
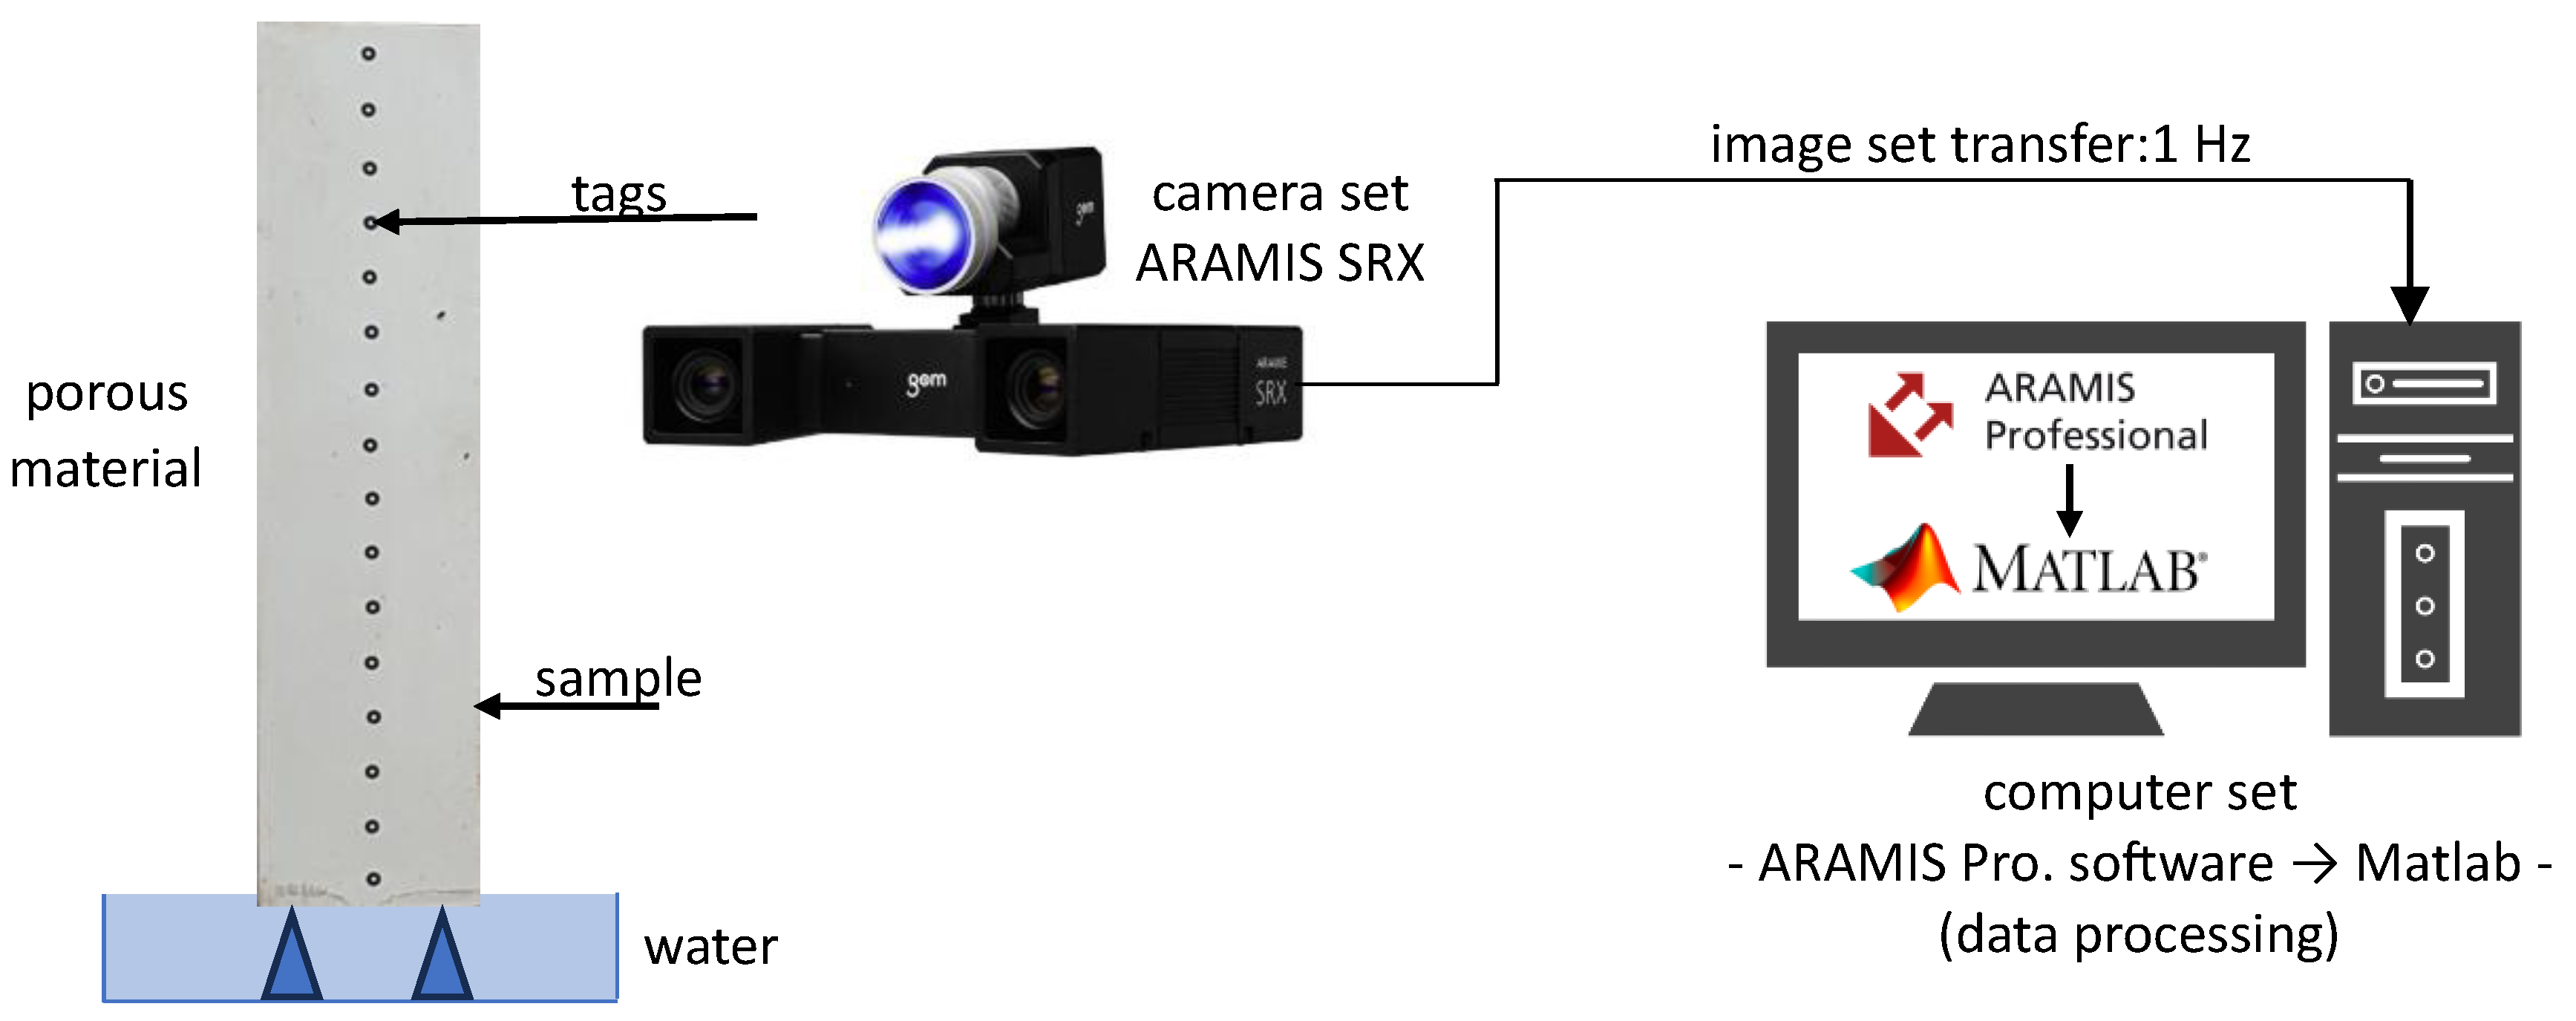
- Measurement Bench
- Course of the Study
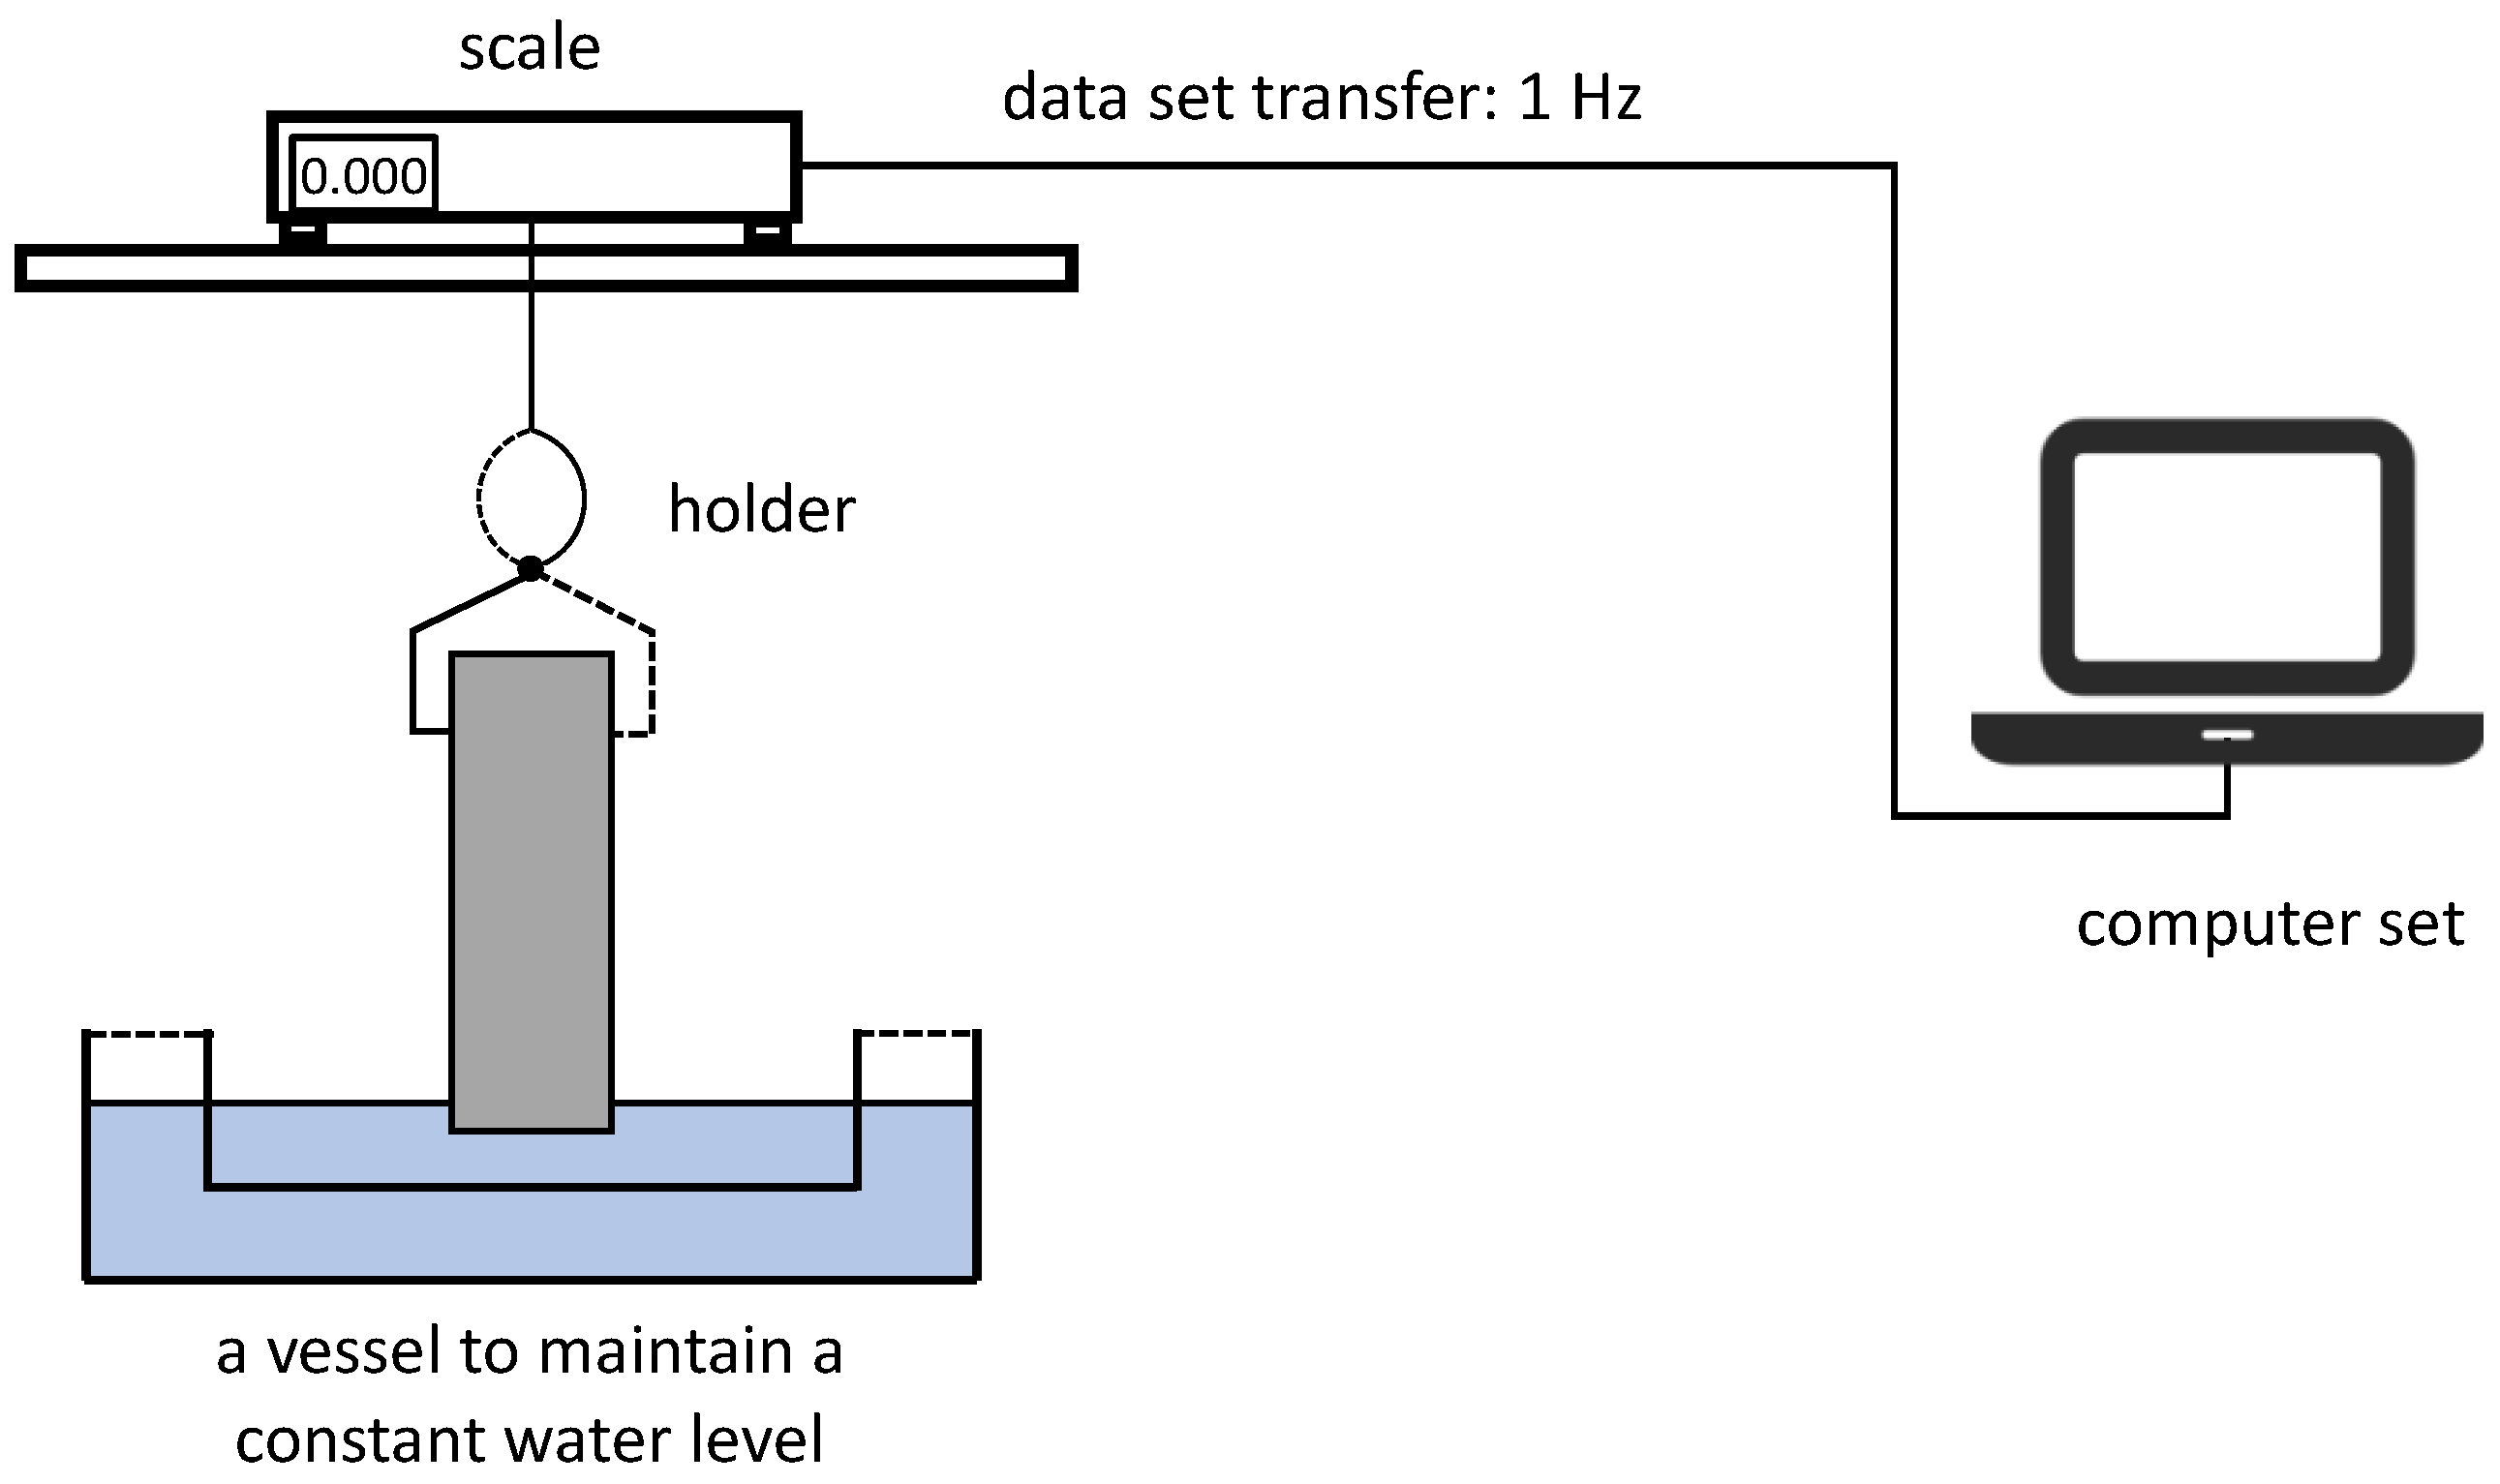
4.2. Gravimetric Measurements
- Measurement Bench
- Course of the Study
5. Uncertainty Analysis
5.1. Measurement Uncertainty
5.2. Systematic Error
5.3. Total Uncertainty
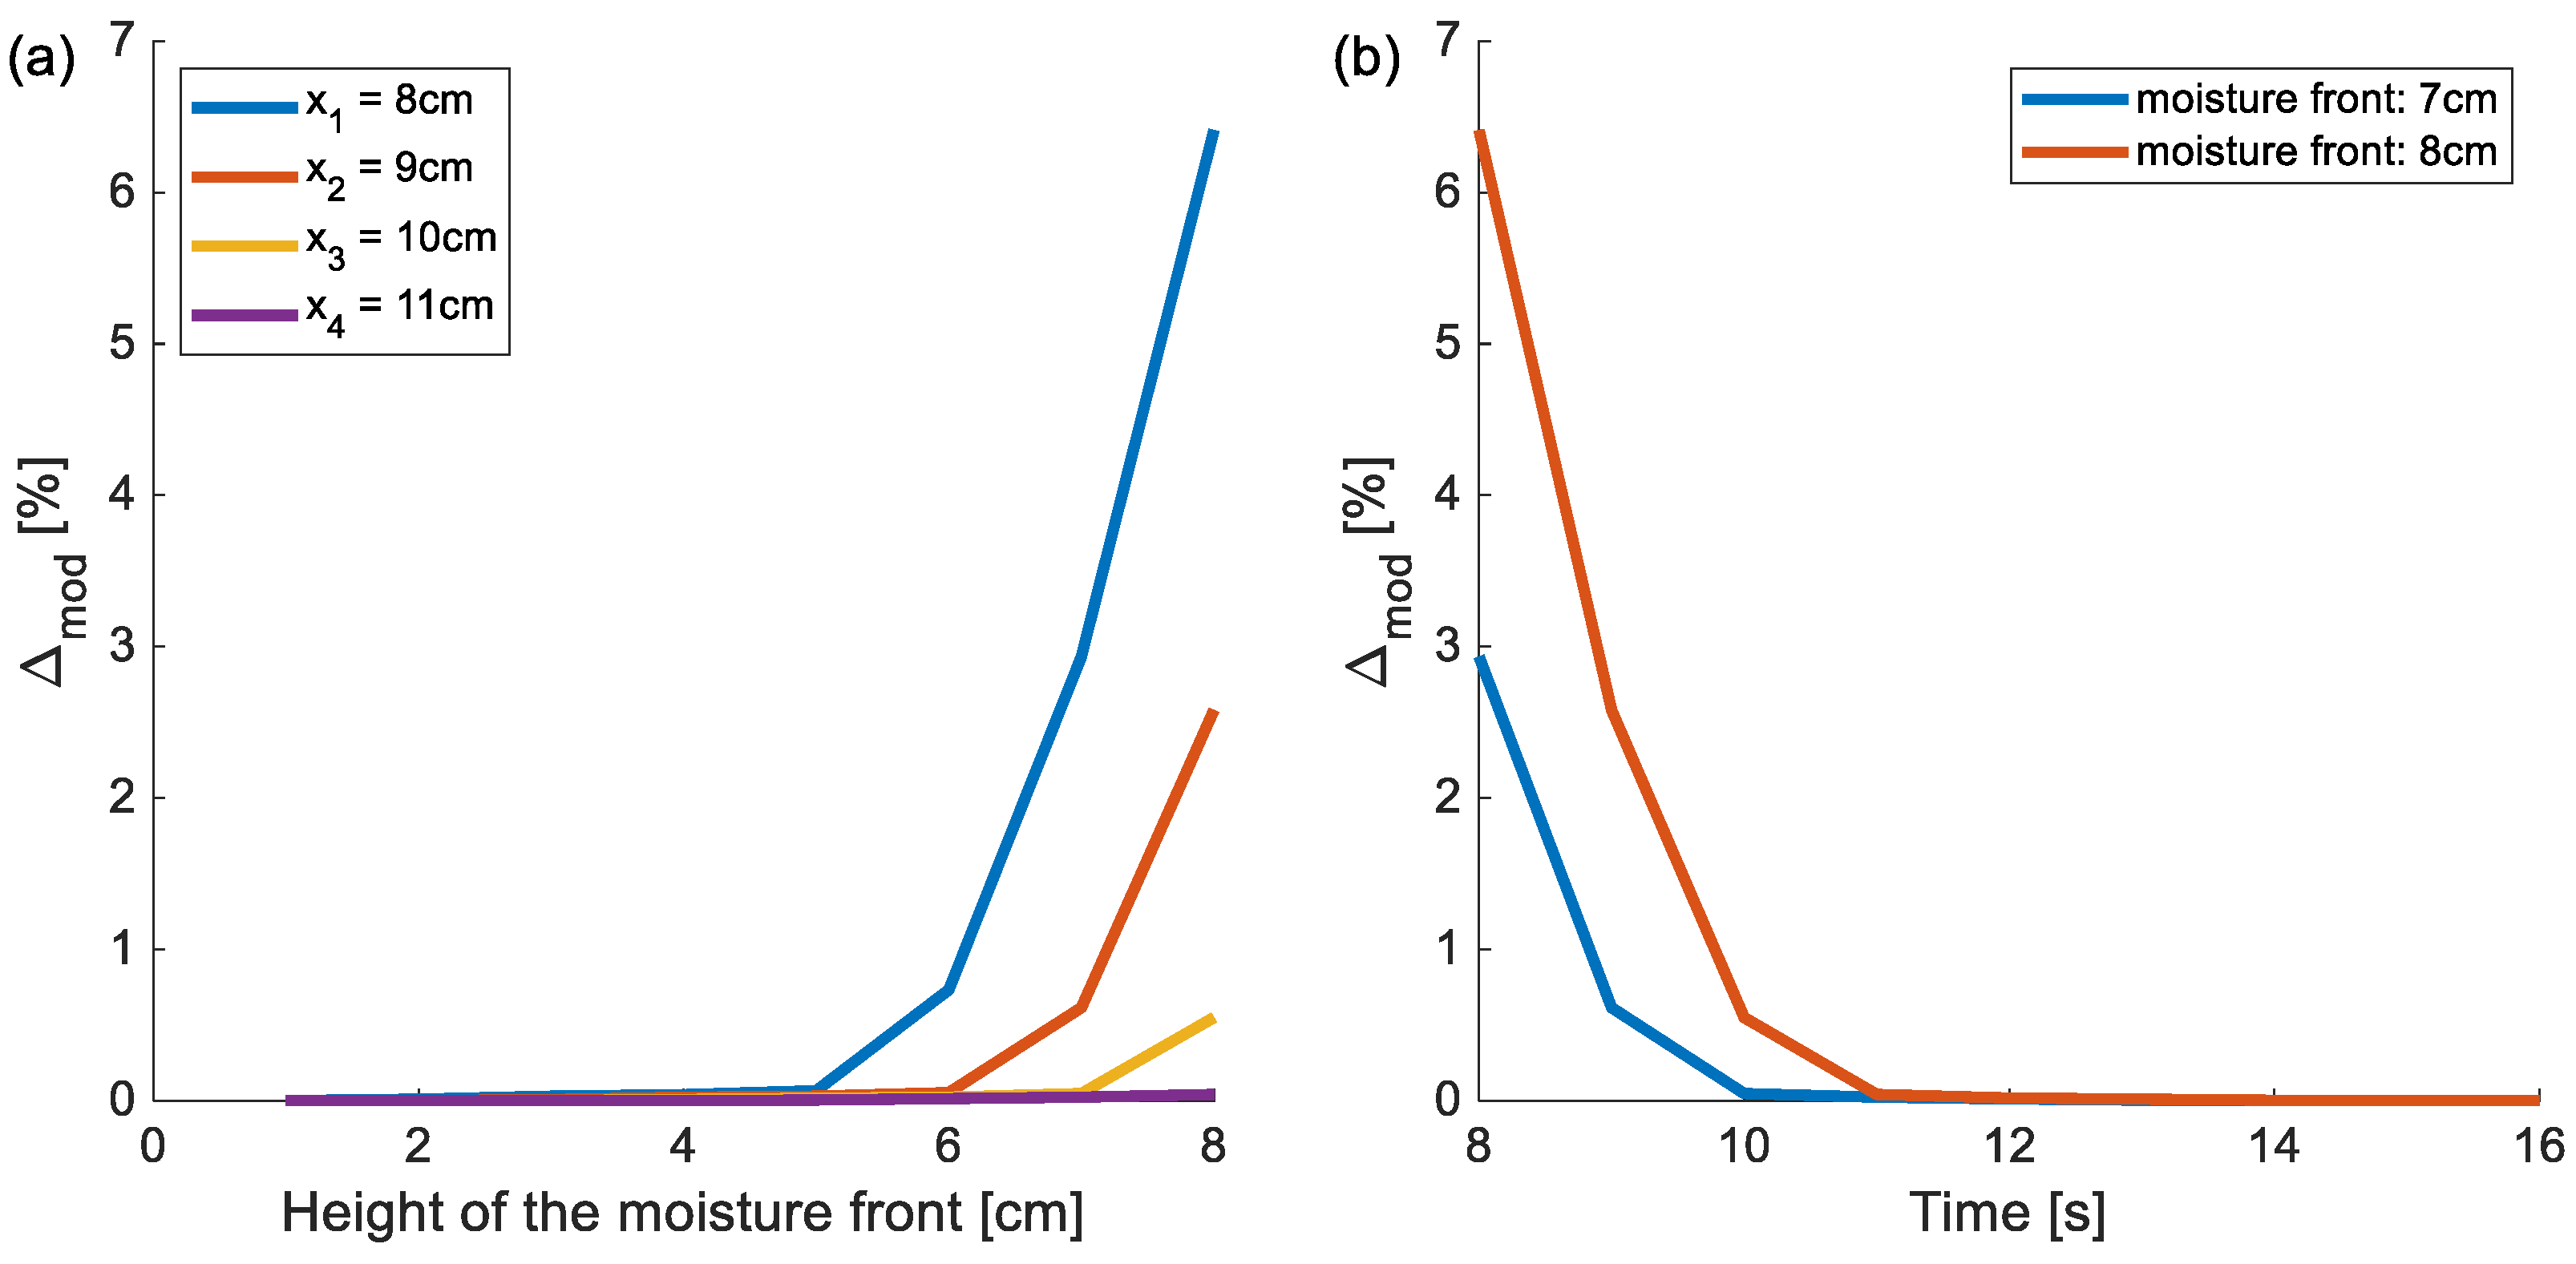
6. Applicability Range of the Model
7. Results
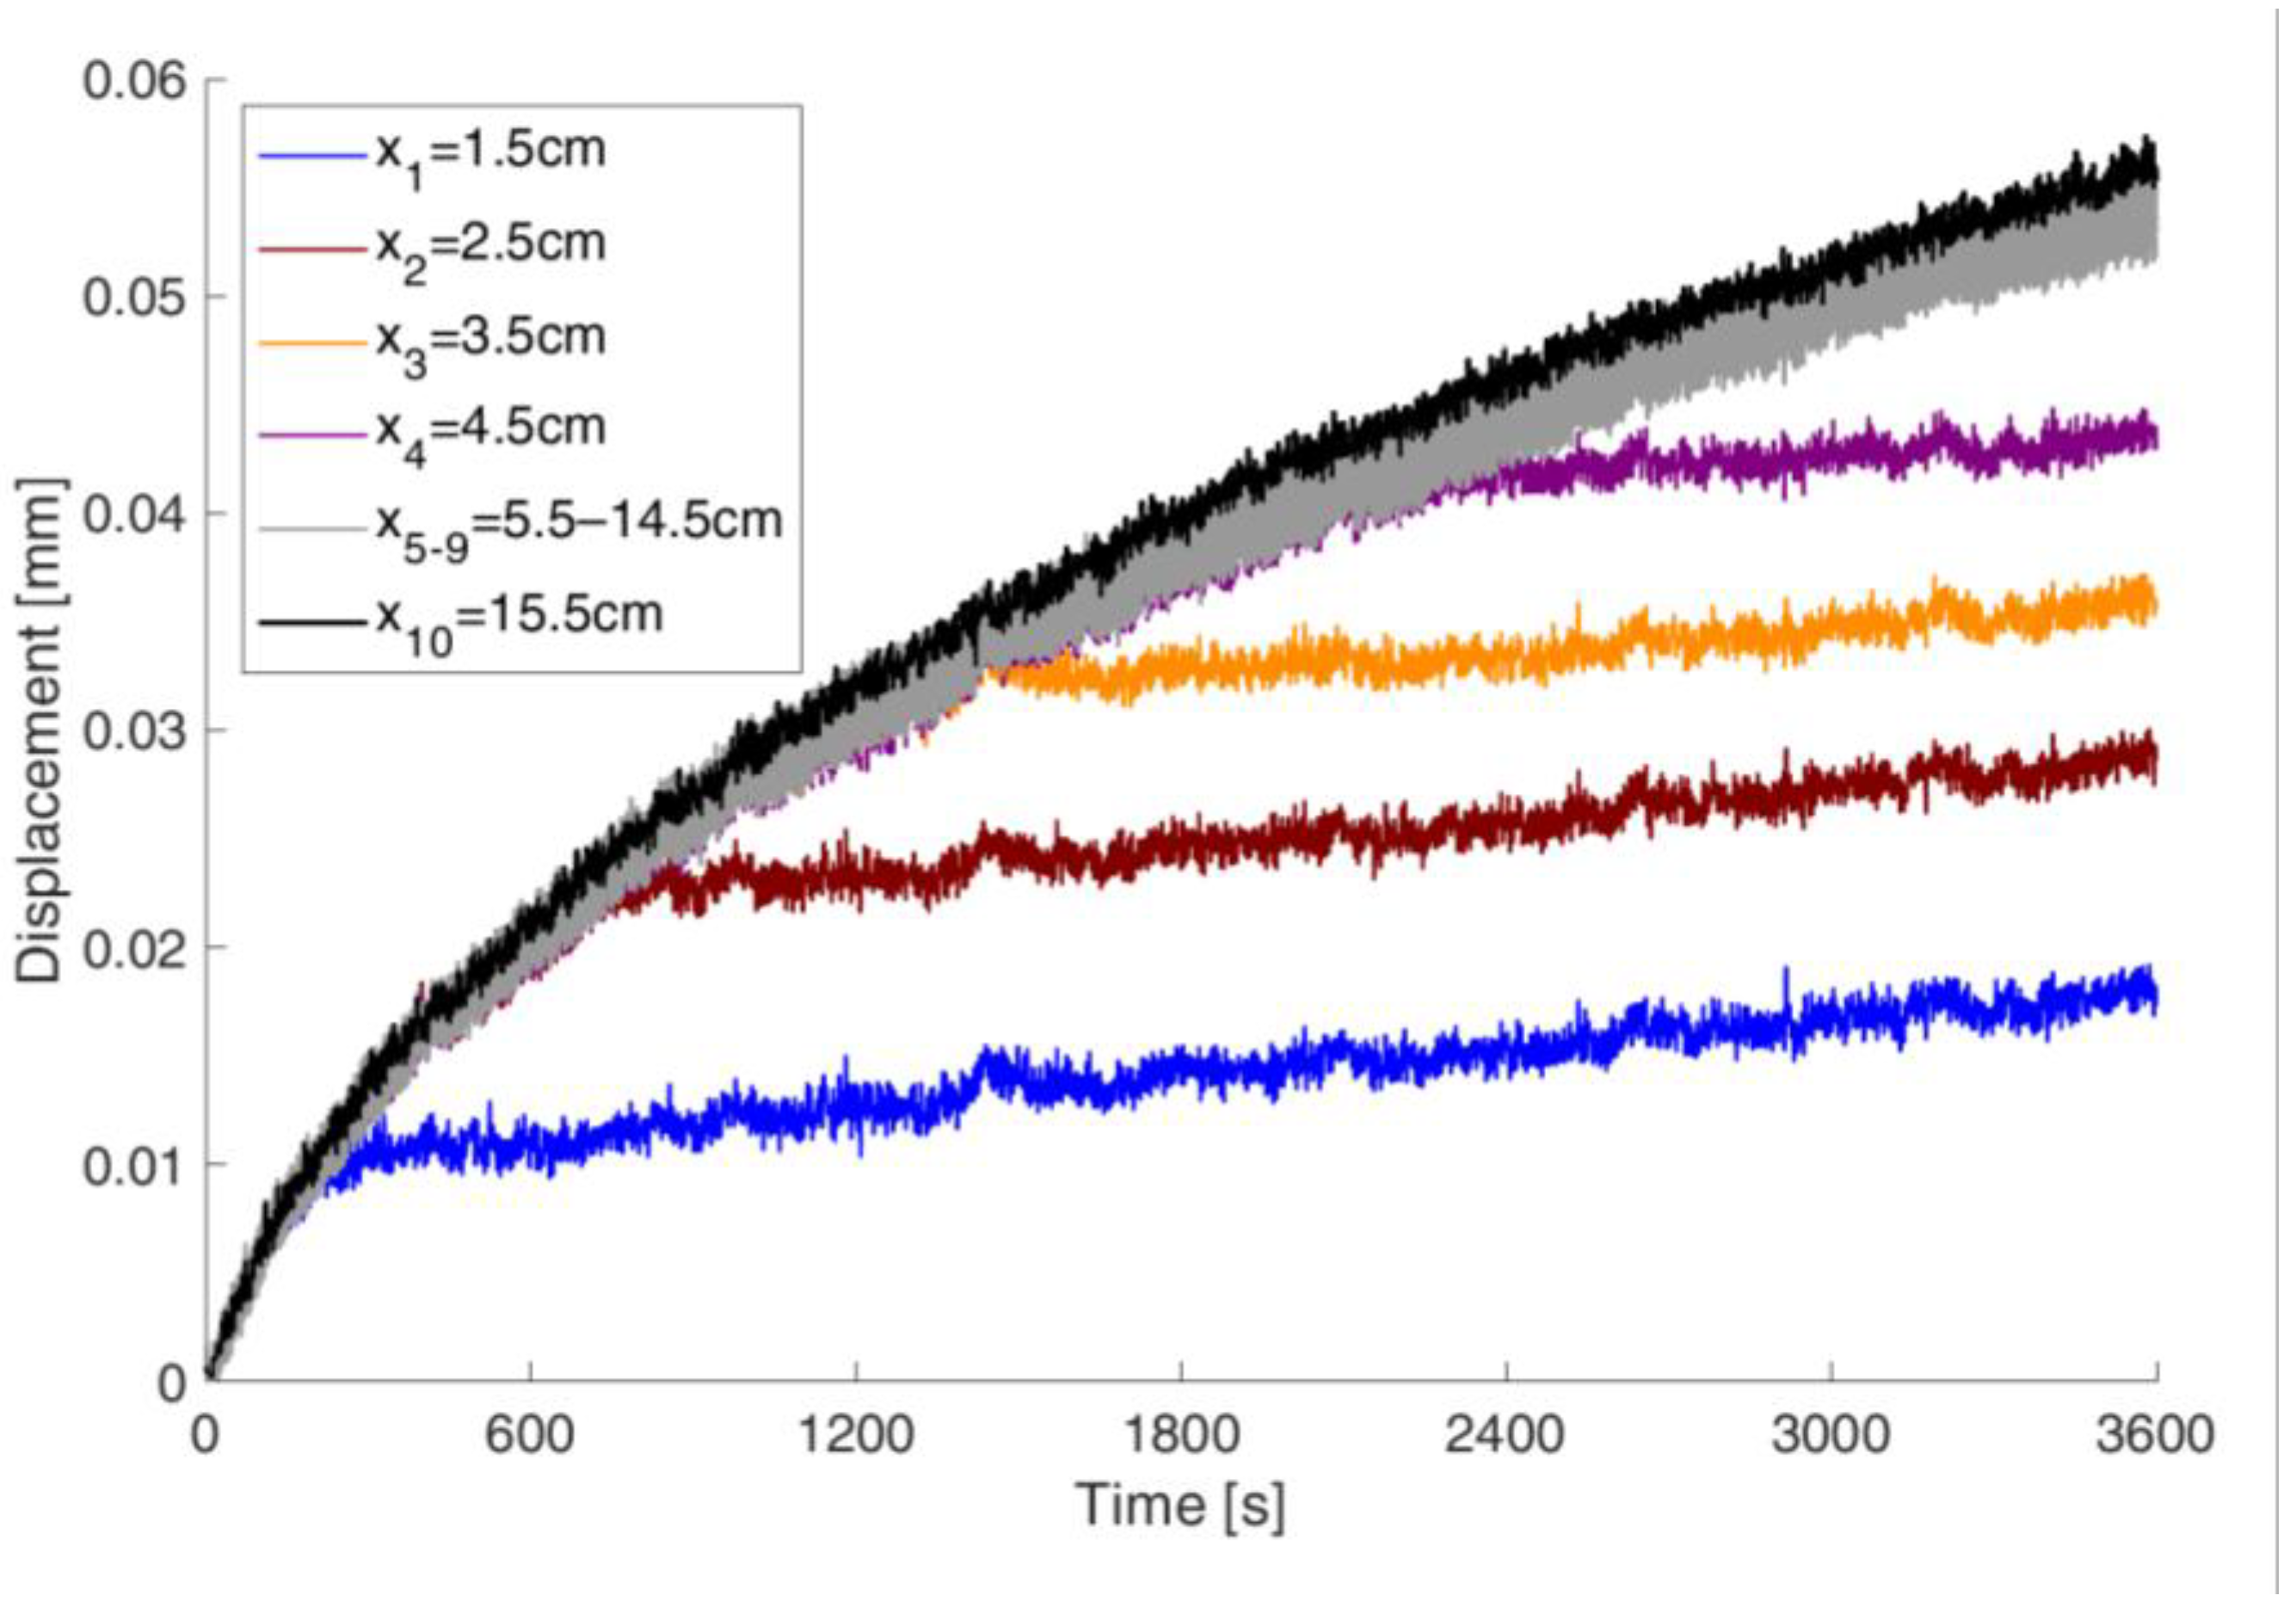
7.1. Displacement Method
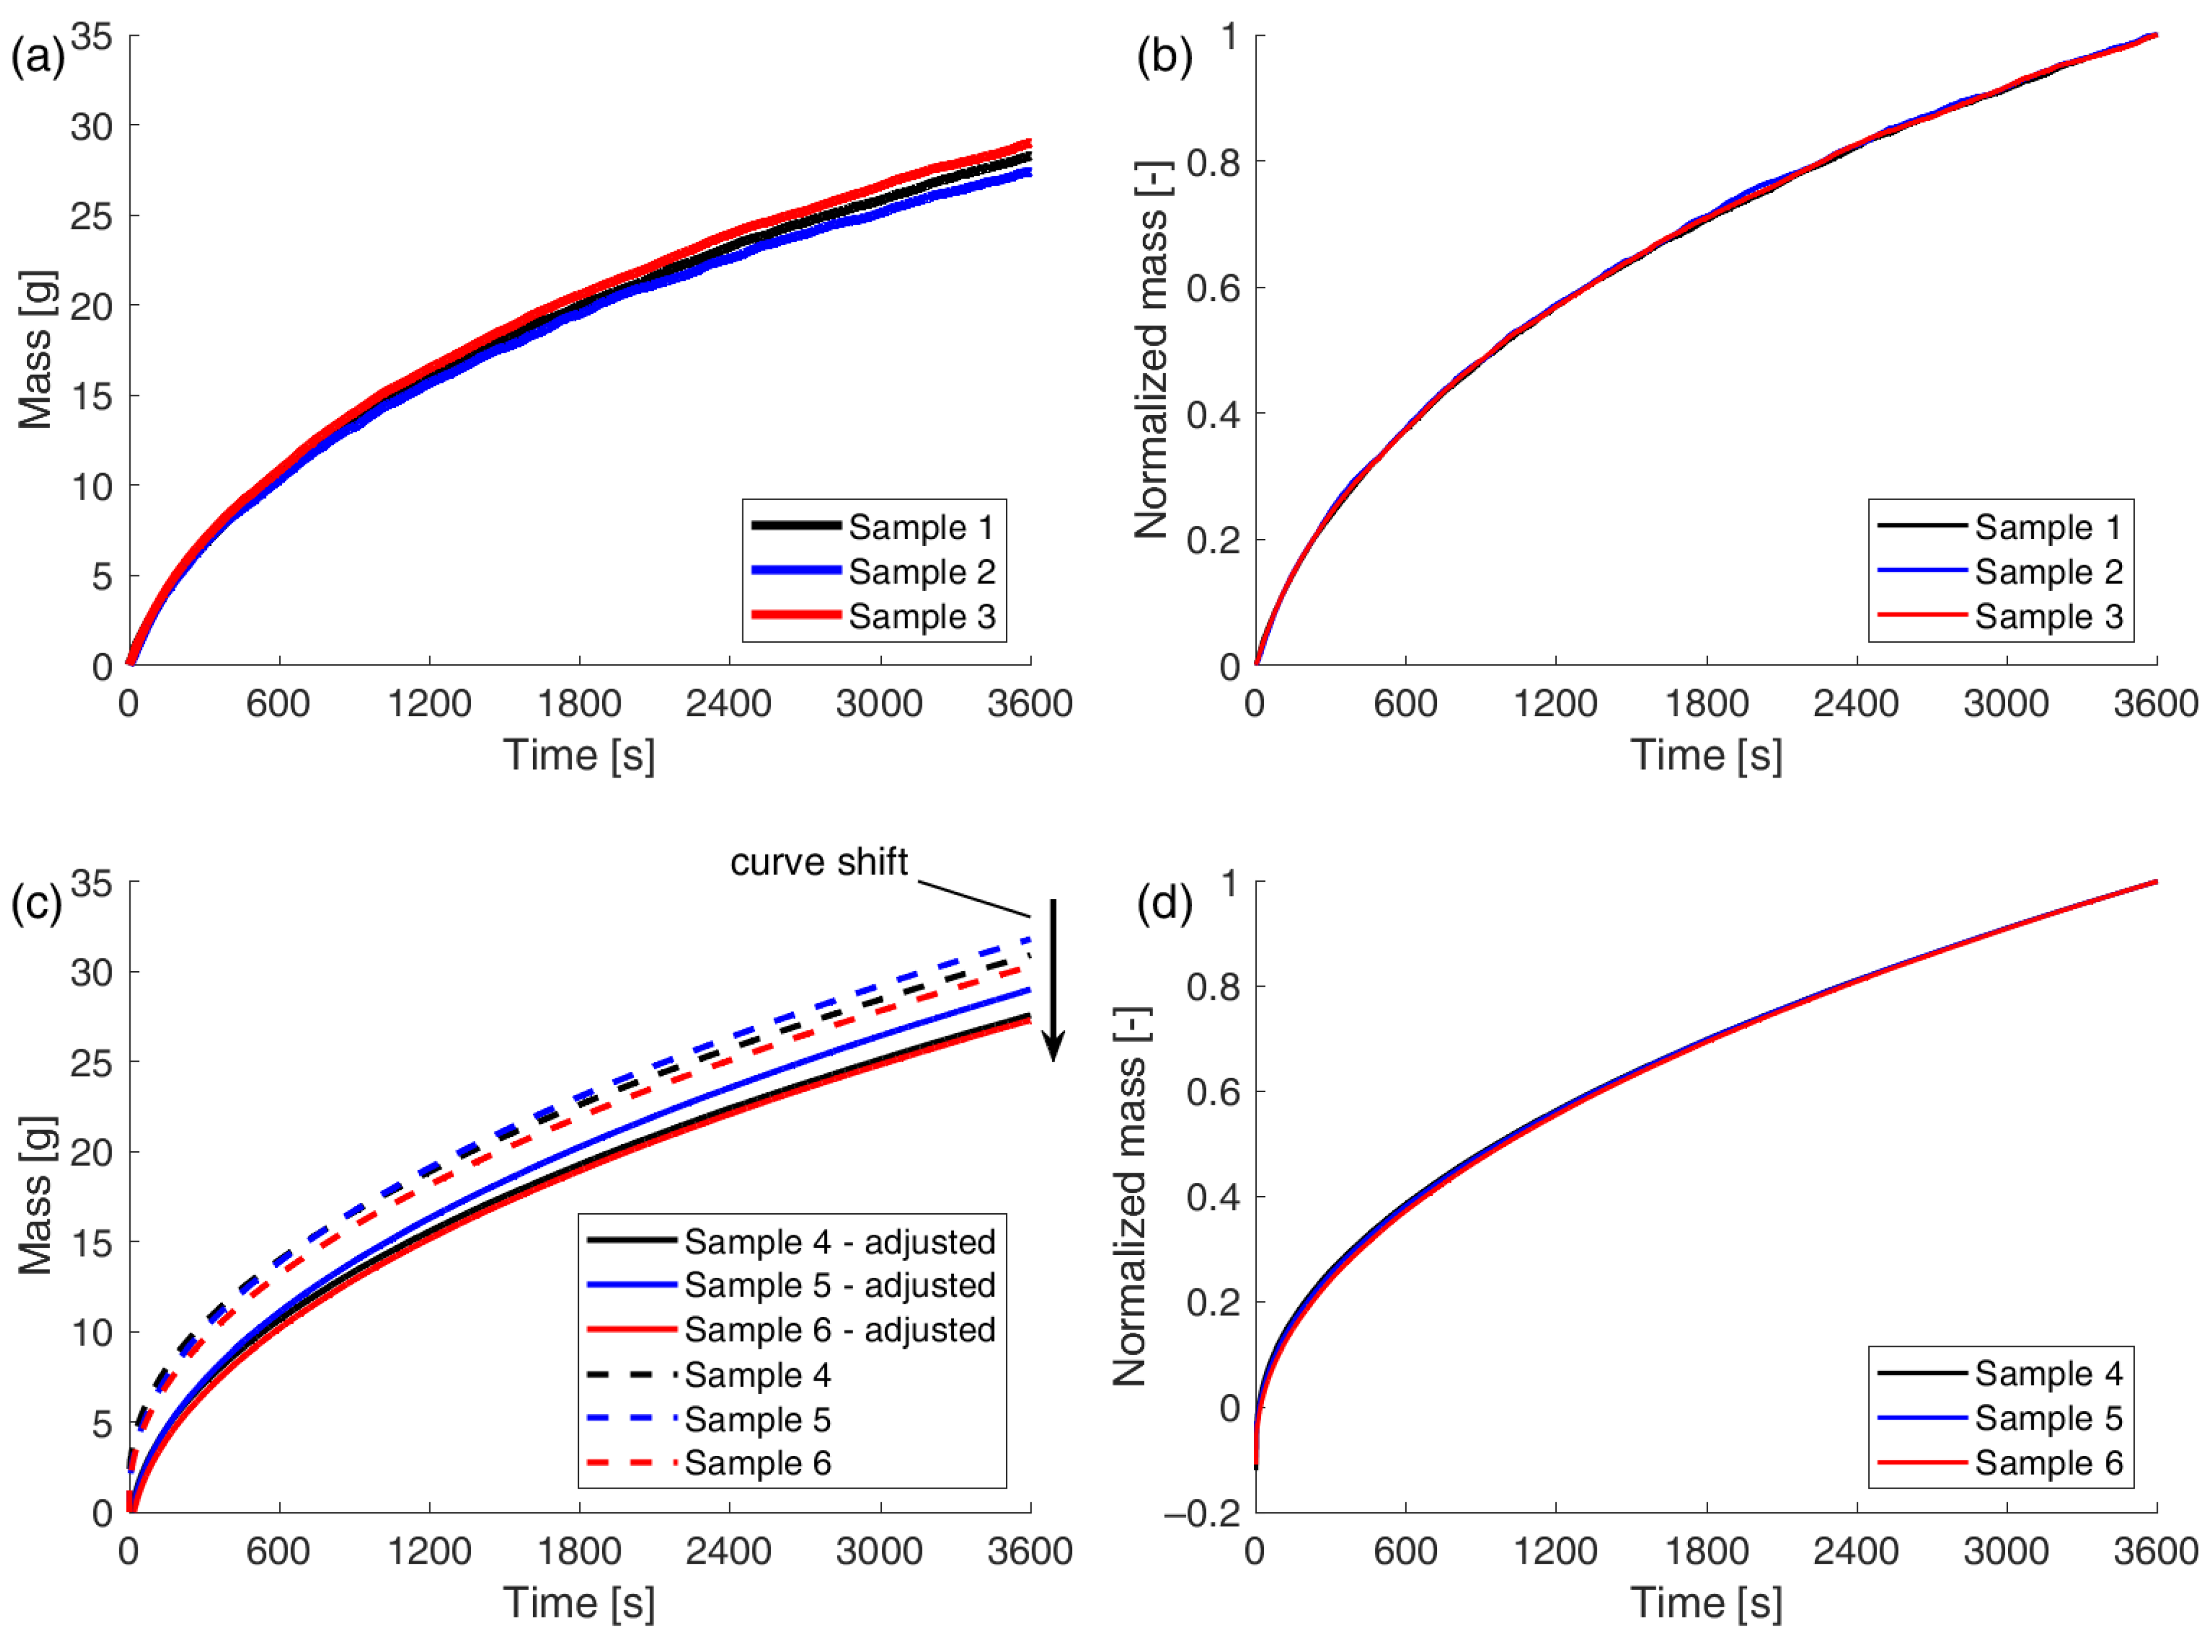
7.2. Gravimetric Method
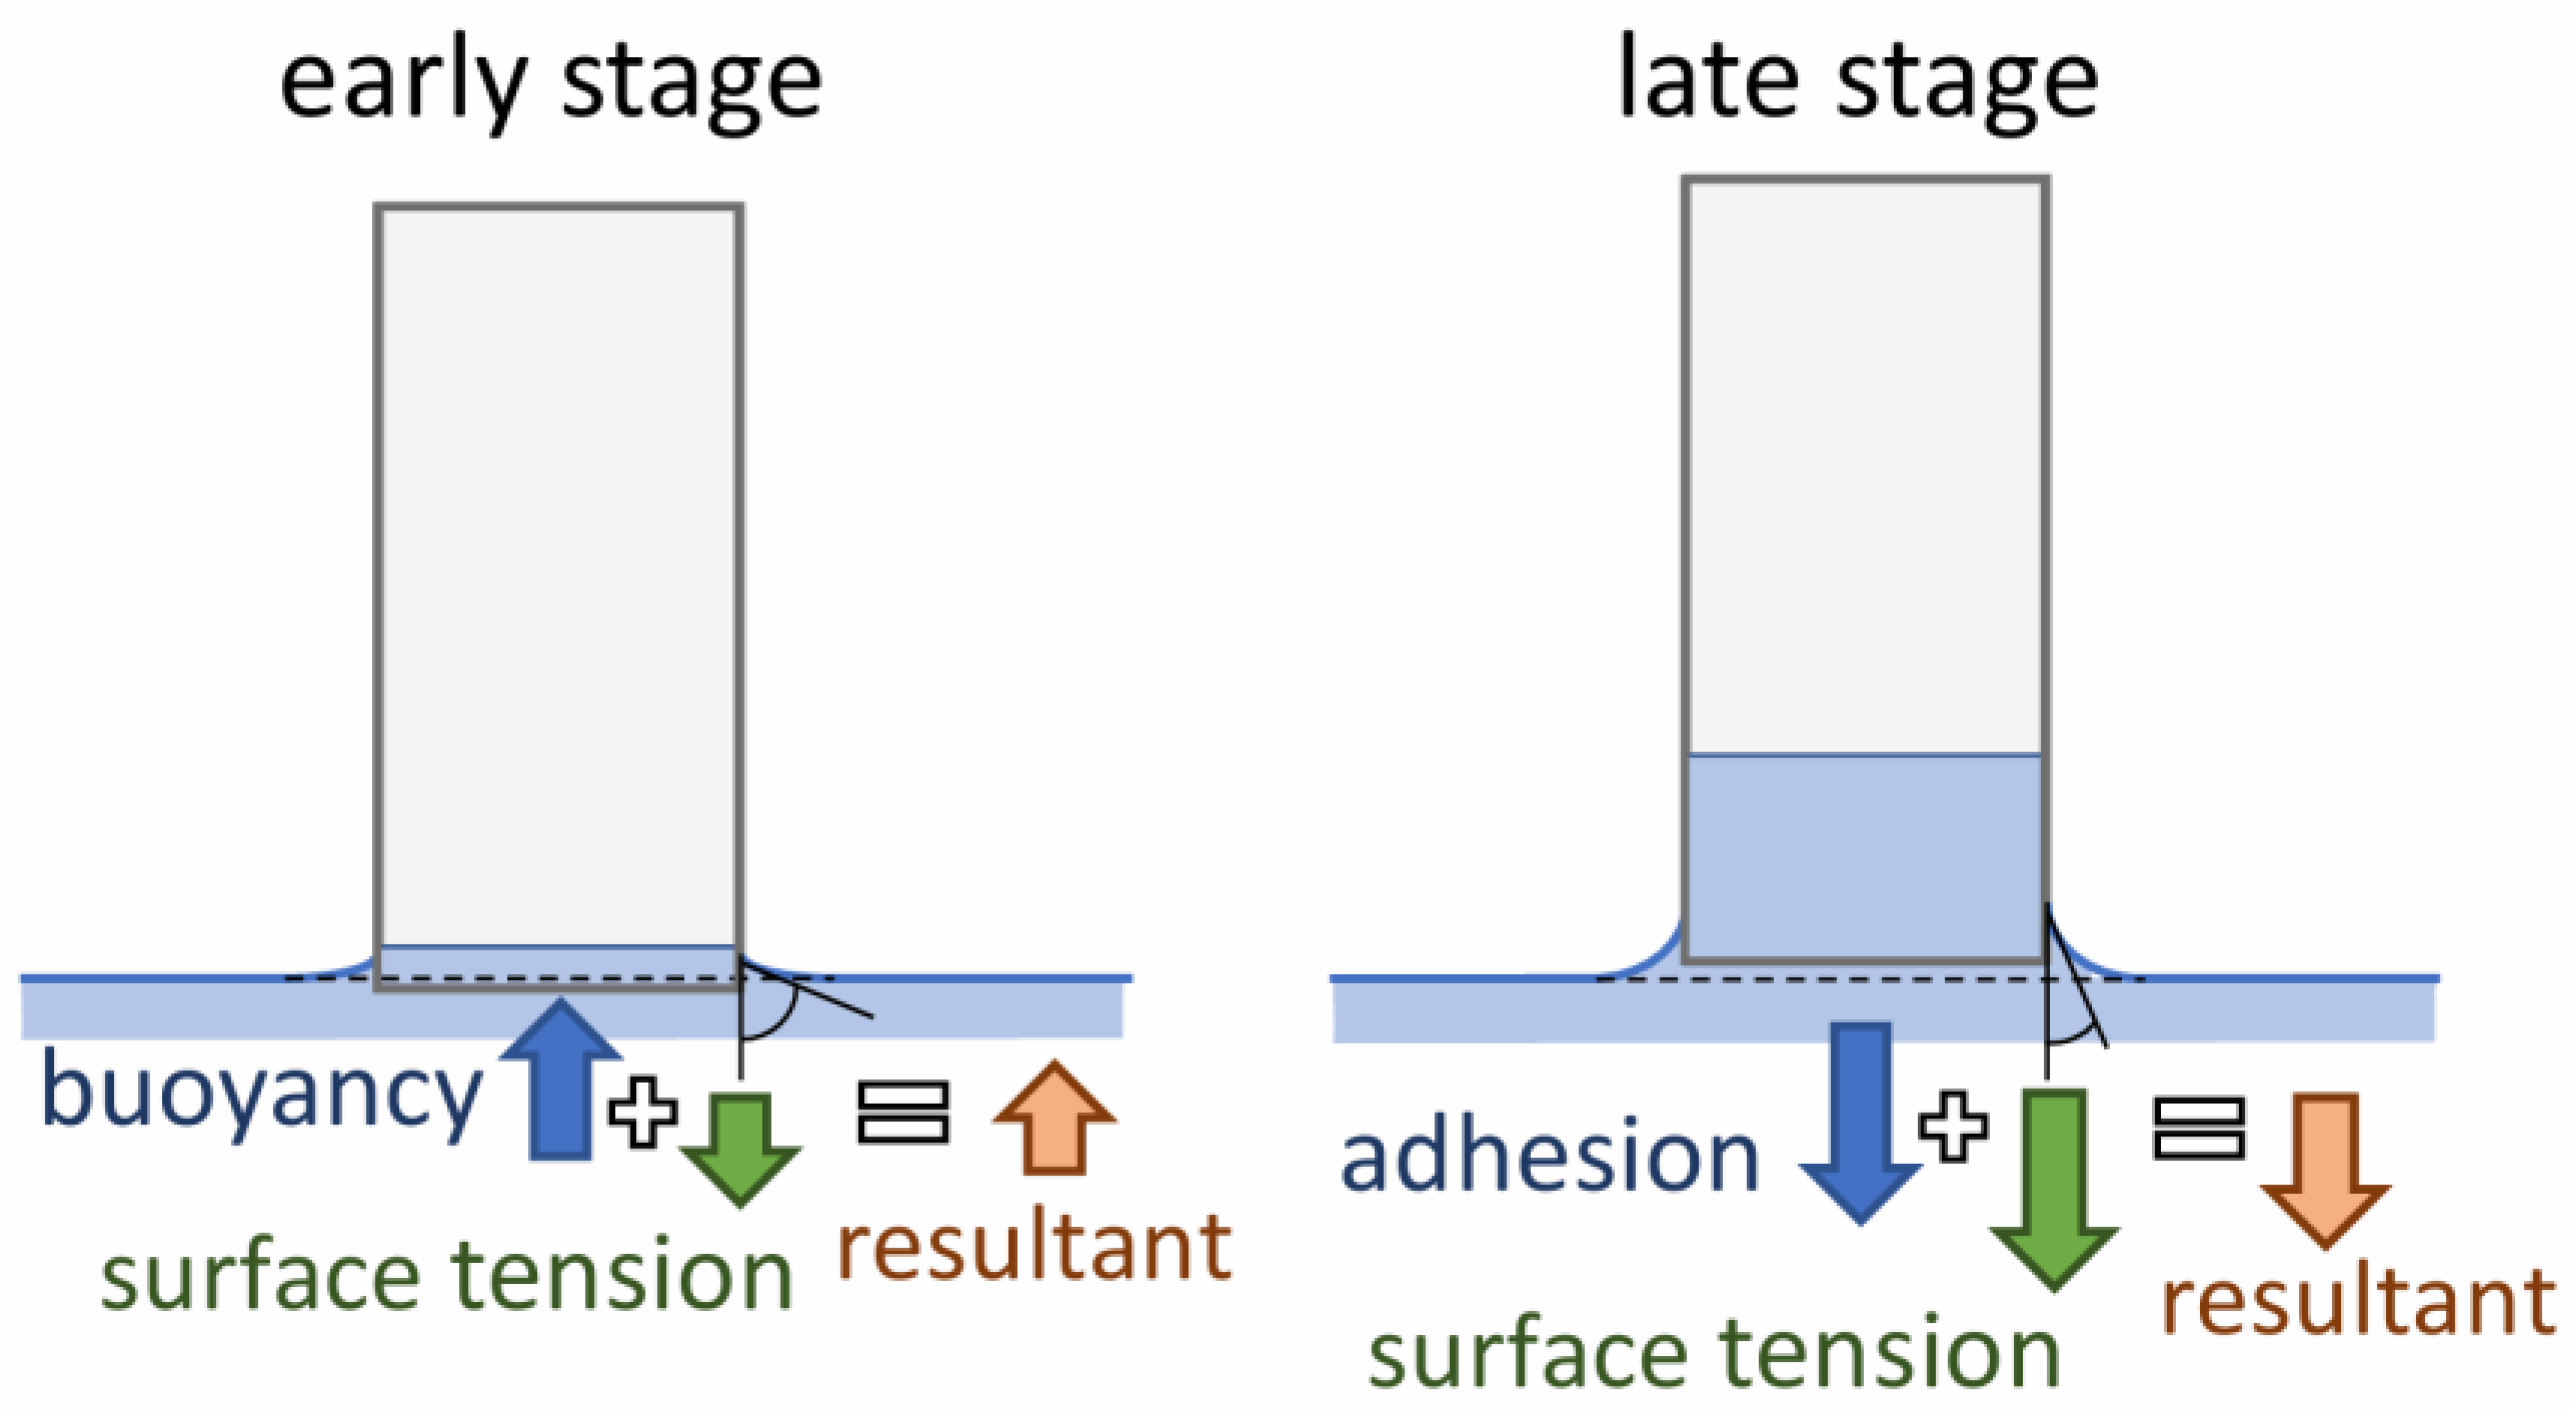
- −
- The surface tension force (acting downward);
- −
- The buoyancy force (acting upward) in the early stage, when the bottom of the sample is slightly below the water surface;
- −
- The force due to the weight of a thin layer of liquid adhering to the bottom surface of the sample as a result of adhesion (acting downward) in the later stage, when the bottom of the sample is slightly above the water surface.
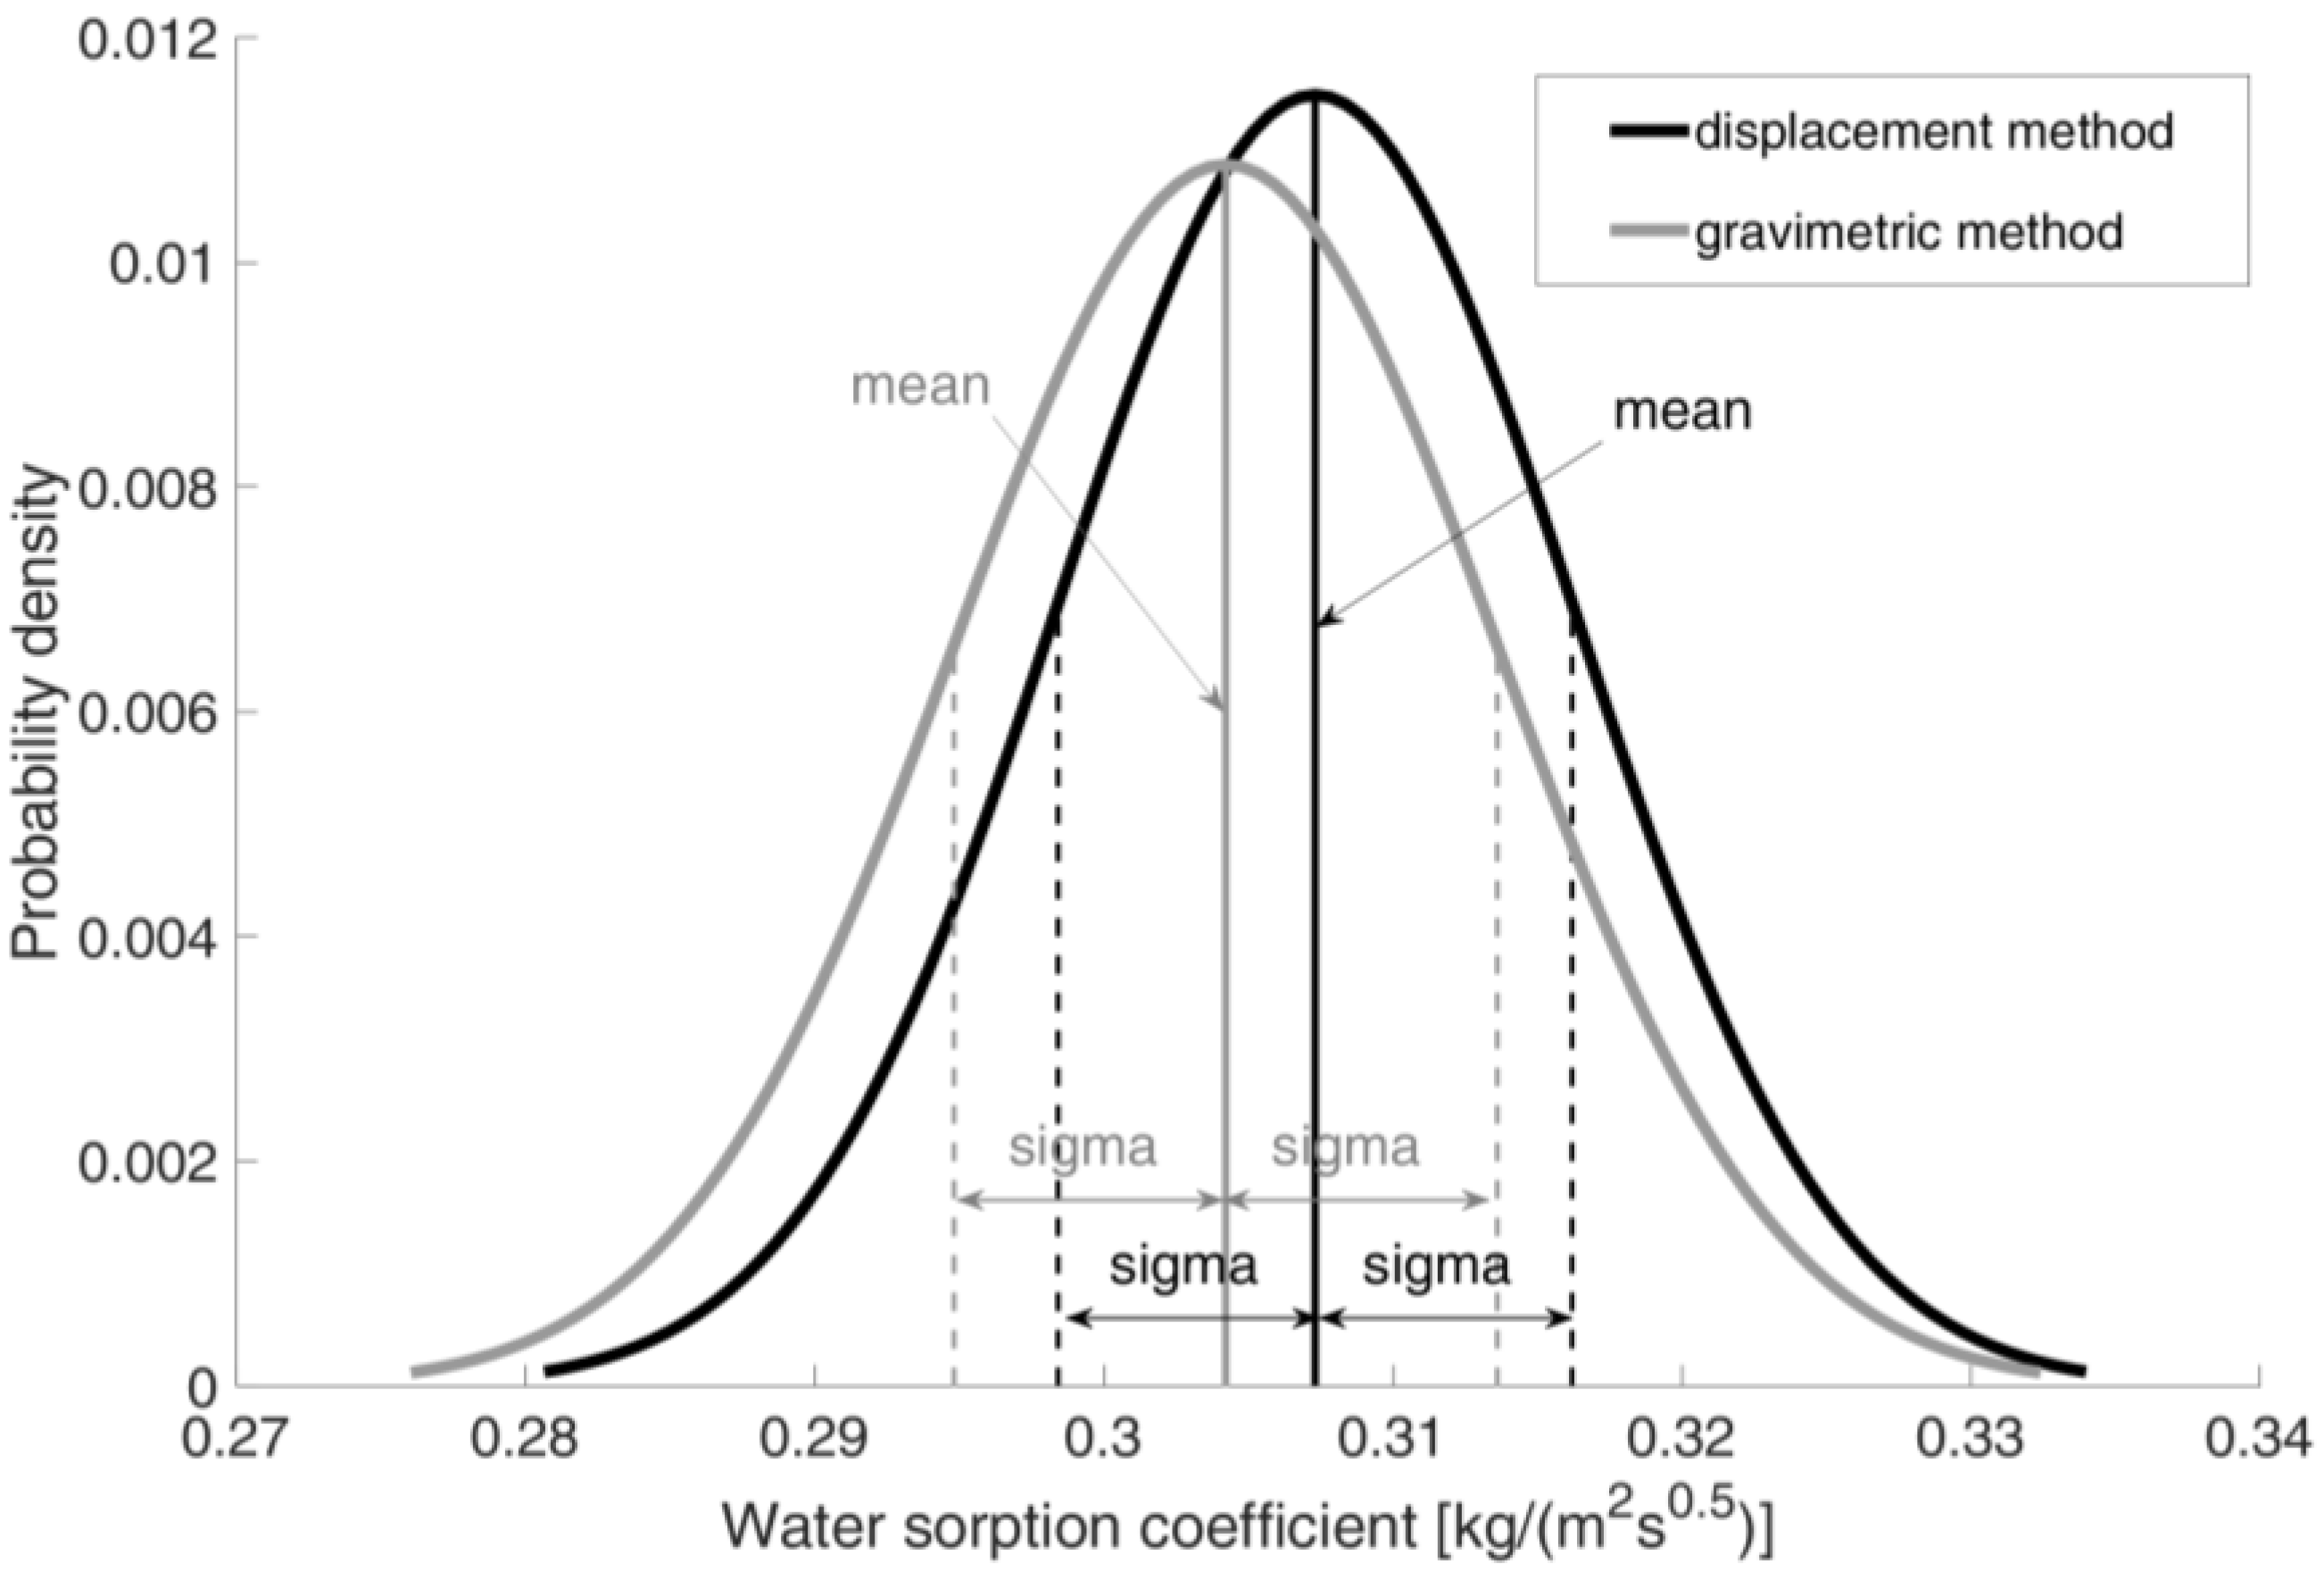
7.3. Analyzed Methods Comparison
7.4. Evaluation of the Suitability of the Proposed Method
8. Conclusions
- The proposed method, based on tracking the displacements of points on the surface of the sample, enables the analysis of the capillary rise process in building materials.
- The efficacy of the proposed methodology was validated through a comparative analysis with the most prevalent gravimetric approach. The results of the statistical analysis demonstrated that both methods yielded nearly identical outcomes, with a difference of approximately 1% between the average water adsorption coefficients determined by both methods.
- As has been shown, the gravimetric method is not an appropriate means of analyzing the initial stages of the capillary rise process. In contrast, the proposed method permits such an analysis.
- The presented measurement method allows for the tracking of displacements across the entire height of the sample. Once the mathematical model has been further developed, it will be possible to measure not only the total absorbed water mass but also the moisture distribution within the sample during capillary rise. This will enable the verification of capillary rise models proposed in the literature.
- One advantage of the proposed method is that it is non-contact, which eliminates any influence on the course of the studied process. Furthermore, it is possible to study even large samples, which is challenging for many other methods.
- To the authors’ knowledge, this is the first method based on moisture-induced expansion that enables quantifying the amount of water absorbed during capillary rise in porous materials.
Author Contributions
Funding
Institutional Review Board Statement
Informed Consent Statement
Data Availability Statement
Conflicts of Interest
References
- de Sa, C.; Benboudjema, F.; Thiery, M.; Sicard, J. Analysis of microcracking induced by differential drying shrinkage. Cem. Concr. Res. 2008, 30, 947–956. [Google Scholar] [CrossRef]
- Samouh, H.; Rozière, E.; Wisniewski, V.; Loukili, A. Consequences of longer sealed curing on drying shrinkage, cracking and carbonation of concrete. Cem. Concr. Res. 2017, 95, 117–131. [Google Scholar] [CrossRef]
- Brzyski, P.; Suchorab, Z. Capillary Uptake Monitoring in Lime-Hemp-Perlite Composite Using the Time Domain Reflectometry Sensing Technique for Moisture Detection in Building Composites. Materials 2020, 13, 1677. [Google Scholar] [CrossRef] [PubMed]
- Wang, X.; Li, L.; Mu, W.; Yang, T.; Du, Y.; Lu, J. Damage characteristics and mechanisms of shear strength at the interface between fiber-reinforced concrete and rock under freeze-thaw cycles. J. Build. Eng. 2024, 98, 111191. [Google Scholar] [CrossRef]
- Janetti, M.B.; Janssen, H. Effect of dynamic contact angle variation on spontaneous imbibition in porous materials. Transp. Porous Media 2020, 142, 493–508. [Google Scholar] [CrossRef] [PubMed]
- Zhuang, S.; Wang, Q.; Zhang, M. Water absorption behaviour of concrete: Novel experimental findings and model characterization. J. Build. Eng. 2022, 98, 111191. [Google Scholar] [CrossRef]
- Villagrán-Zaccardi, Y.A.; Alderete, N.M.; Benítez, A.; Carrasco, M.F.; Corallo, P.; López, R.; Rios, C. Relationship between sorptivity coefficients of concrete as calculated from the evolution of water uptake versus t0.5 or t0.25. Constr. Build. Mater. 2022, 342, 128084. [Google Scholar] [CrossRef]
- Zaccardi, Y.A.V.; Alderete, N.M.; De Belie, N. Improved model for capillary absorption in cementitious materials: Progress over the fourth root of time. Cem. Concr. Res. 2017, 100, 153–165. [Google Scholar] [CrossRef]
- PN-EN 772-11:2011; Methods of Test for Masonry Units—Part 11: Determination of Water Absorption of Aggregate Concrete, Manufactured Stone and Natural Stone Masonry Units due to Capillary Action and the Initial Rate of Water Absorption of Clay Masonry Units. Polish Committee for Standardization: Warsaw, Poland, 2011. (In Polish)
- Plagge, R.; Scheffler, G.; Grunewald, J. Automatic measurement of the water uptake coefficient and the capillary water content of porous building materials. Bauphysik 2005, 160, 639–643. [Google Scholar] [CrossRef]
- Marynowicz, A.; Kucharczyk, A. Determination of the water absorption and water diffusion coefficients by means of infrared thermography measurements. Measurement 2021, 185, 110054. [Google Scholar] [CrossRef]
- Ketelaars, A.J.; Pel, L.; Coumans, W.J.; Kerkhof, P.J.A.M. Drying kinetics: A comparison of diffusion coefficients from moisture concentration profiles and drying curves. Chem. Eng. Sci. 1995, 50, 1187–1191. [Google Scholar] [CrossRef]
- Kohonen, R. A Method to Analyze the Transient Hygrothermal Behaviour of Building Materials and Components: Dissertation; VTT Technical Research Centre of Finland: Espoo, Finland, 1984; ISBN 951-38-2020-3. [Google Scholar]
- Pel, L.; Ketelaars, A.J.; Adan, O.C.G.; van Well, A.A. Determination of moisture diffusivity in porous media using scanning neutron radiography. Int. J. Heat Mass Transf. 1993, 36, 1261–1267. [Google Scholar] [CrossRef]
- Krus, M. Moisture Transport and Storage Coefficients of Porous Mineral Building Materials—Theoretical Principles and New Test Methods; Fraunhofer IRB Verlag: Stuttgart, Germany, 1996; Volume 66, p. 106. [Google Scholar]
- Pel, L. Moisture transport in porous building materials. Tech. Univ. Eindh. 1994, 1991, 593–596. [Google Scholar] [CrossRef]
- Pel, L.; Brocken, H. Determination of moisture diffusivity in porous media using moisture concentration profiles. Int. J. Heat Mass Transf. 1996, 39, 1273–1280. [Google Scholar] [CrossRef]
- Yang, L.; Gao, D.; Zhang, Y.; Tang, J.; Li, Y. Relationship between sorptivity and capillary coefficient for water absorption of cement-based materials: Theory analysis and experiment. R. Soc. Open Sci. 2019, 6, 190112. [Google Scholar] [CrossRef] [PubMed]
- Nizovtsev, M.I.; Sterlyagov, A.N.; Terekhov, V.I. Dynamics of thermal and moistening fronts in porous material under capillary moistening. Therm. Sci. 2013, 17, 1071–1078. [Google Scholar] [CrossRef]
- Long, Z.; Zhang, Z.; Zhang, H. Nondestructive measurement of the capillary water absorption coefficient and water transport behaviors of porous building materials by using single-sided NMR. Constr. Build. Mater. 2024, 414, 134819. [Google Scholar] [CrossRef]
- Al-Naddaf, M. A new automatic method for continuous measurement of the capillary water absorption of building materials. Constr. Build. Mater. 2018, 160, 639–643. [Google Scholar] [CrossRef]
- Yedra, E.; Ferrández, D.; Morón, C.; Saiz, P. New test methods to determine water absorption by capillarity. Experimental study in masonry mortars. Constr. Build. Mater. 2022, 319, 125988. [Google Scholar] [CrossRef]
- Alderete, N.M.; Mignon, A.; Schollbach, K.; Villagrán-Zaccardi, Y. Deformations in Cement Pastes during Capillary Imbibition and Their Relation to Water and Isopropanol as Imbibing Liquids. Materials 2022, 15, 36. [Google Scholar] [CrossRef] [PubMed]
- Alderete, N.M.; Villagrán-Zaccardi, Y.; Shields, Y.; Van den Heede, P.; Zappitelli, M.P.; Patel, R.; Jovanović, B.; Trtik, P.; De Belie, N. Neutron radiography with simultaneous deformation measurements demand rethinking the modelling of imbibition in cement paste. Cem. Concr. Res. 2024, 179, 107481. [Google Scholar] [CrossRef]

| Sample No. | Final Mass of Water Recorded During the Test [g] | Mass of Water from Control Measurements [g] | Mass Difference [g] |
|---|---|---|---|
| 4 | 30.89 | 27.57 | 3.32 |
| 5 | 31.79 | 28.99 | 2.80 |
| 6 | 30.27 | 27.28 | 2.99 |
| Sample No. | Mass of Absorbed Water [g] | Mean Value [g] | Relative Standard Deviation [%] | |
|---|---|---|---|---|
| Displacement method | 1 | 28.26 | 28.07 | 2.8 |
| 2 | 27.37 | |||
| 3 | 28.98 | |||
| Gravimetrical method | 4 | 27.57 | ||
| 5 | 28.99 | |||
| 6 | 27.28 | |||
| Sample No. | Calculated Coefficient [kg/(m2 s0.5)] | Mean Value [kg/(m2 s0.5)] | Relative Standard Deviation [%] | Mean Value [kg/(m2 s0.5)] | Relative Standard Deviation [%] |
|---|---|---|---|---|---|
| 1 | 0.308 | 0.307 | 2.9 | 0.306 | 2.7 |
| 2 | 0.298 | ||||
| 3 | 0.316 | ||||
| 4 | 0.297 | 0.304 | 3.1 | ||
| 5 | 0.315 | ||||
| 6 | 0.301 |
Disclaimer/Publisher’s Note: The statements, opinions and data contained in all publications are solely those of the individual author(s) and contributor(s) and not of MDPI and/or the editor(s). MDPI and/or the editor(s) disclaim responsibility for any injury to people or property resulting from any ideas, methods, instructions or products referred to in the content. |
© 2025 by the authors. Licensee MDPI, Basel, Switzerland. This article is an open access article distributed under the terms and conditions of the Creative Commons Attribution (CC BY) license (https://creativecommons.org/licenses/by/4.0/).
Share and Cite
Kucharczyk, A.; Pawlik, K.; Czabak, M. A Non-Contact Method of Measuring Capillary Rise Based on the Hygroscopic Expansion of the Material. Materials 2025, 18, 3501. https://doi.org/10.3390/ma18153501
Kucharczyk A, Pawlik K, Czabak M. A Non-Contact Method of Measuring Capillary Rise Based on the Hygroscopic Expansion of the Material. Materials. 2025; 18(15):3501. https://doi.org/10.3390/ma18153501
Chicago/Turabian StyleKucharczyk, Andrzej, Kamil Pawlik, and Mariusz Czabak. 2025. "A Non-Contact Method of Measuring Capillary Rise Based on the Hygroscopic Expansion of the Material" Materials 18, no. 15: 3501. https://doi.org/10.3390/ma18153501
APA StyleKucharczyk, A., Pawlik, K., & Czabak, M. (2025). A Non-Contact Method of Measuring Capillary Rise Based on the Hygroscopic Expansion of the Material. Materials, 18(15), 3501. https://doi.org/10.3390/ma18153501