3.1. Microstructure Charact
Figure 1 illustrates the microstructural characteristics and elemental distributions of AISI 347H stainless steel subjected to two distinct heat treatment processes. In the AR condition (
Figure 1a1,a2), a large number of coarse, irregular Nb-rich precipitates are observed, predominantly located at grain boundaries and within the grains. In contrast, the solution-annealed sample (
Figure 1b1,b2) exhibits a significantly reduced number of precipitates, with most Nb-rich phases either dissolved or refined into smaller particles. The corresponding EDS elemental maps clearly demonstrate that the bright contrast regions in the SEM images are enriched in Nb, with relatively low Fe and Cr concentrations, indicative of the presence of Nb-type precipitates. The relatively uniform distribution of Fe, Cr, and Ni in the matrix suggests that the heat treatment primarily affects the secondary phase evolution rather than the bulk composition.
Figure 2 shows the EBSD characterization results of AISI 347H stainless steels. The inverse pole figure (IPF) maps (a1–b1) reveal that all samples exhibit fully austenitic microstructures with equiaxed grains, while grain refinement is most evident in the solution-annealed condition (b1). The kernel average misorientation (KAM) maps (a2–b2) indicate varying levels of local plastic strain and dislocation density. 347H-SA exhibits localized regions of high KAM intensity, reflecting stress concentration induced by carbide/nitride precipitation.
The phase maps (a3–b3) further confirm that the matrix phase is face-centered cubic (FCC, red), with minor NbC (BCC, blue) phases distributed along grain boundaries and within the matrix. Quantitative phase analysis reveals the ratio of two AISI 347H stainless steels is similar.
Figure 3a presents the X-ray diffraction (XRD) patterns of AISI 347H stainless steel under two different heat treatment conditions. All samples exhibit typical diffraction peaks corresponding to the austenitic FCC structure, with no detectable transformation to martensitic or BCC phases at the resolution of the instrument.
Figure 3b presents the surface residual stress results obtained via the sin
2 ψ method based on the (311) diffraction plane, which is widely used for stress analysis in FCC alloys due to its low susceptibility to crystallographic texture and intergranular effects. 347H-SA exhibits the highest residual tensile stress, which may result from thermal mismatch stress and dislocation recovery-induced imbalance during high-temperature annealing. In contrast, the 347H-AR sample demonstrates the lowest residual stress level, reflecting its relatively unperturbed microstructure and lack of significant thermal or phase transformation history. These findings underscore the pronounced influence of thermal treatment on the residual stress state, which could play a crucial role in the subsequent oxidation behavior and mechanical performance.
3.2. Electrochemical Properties
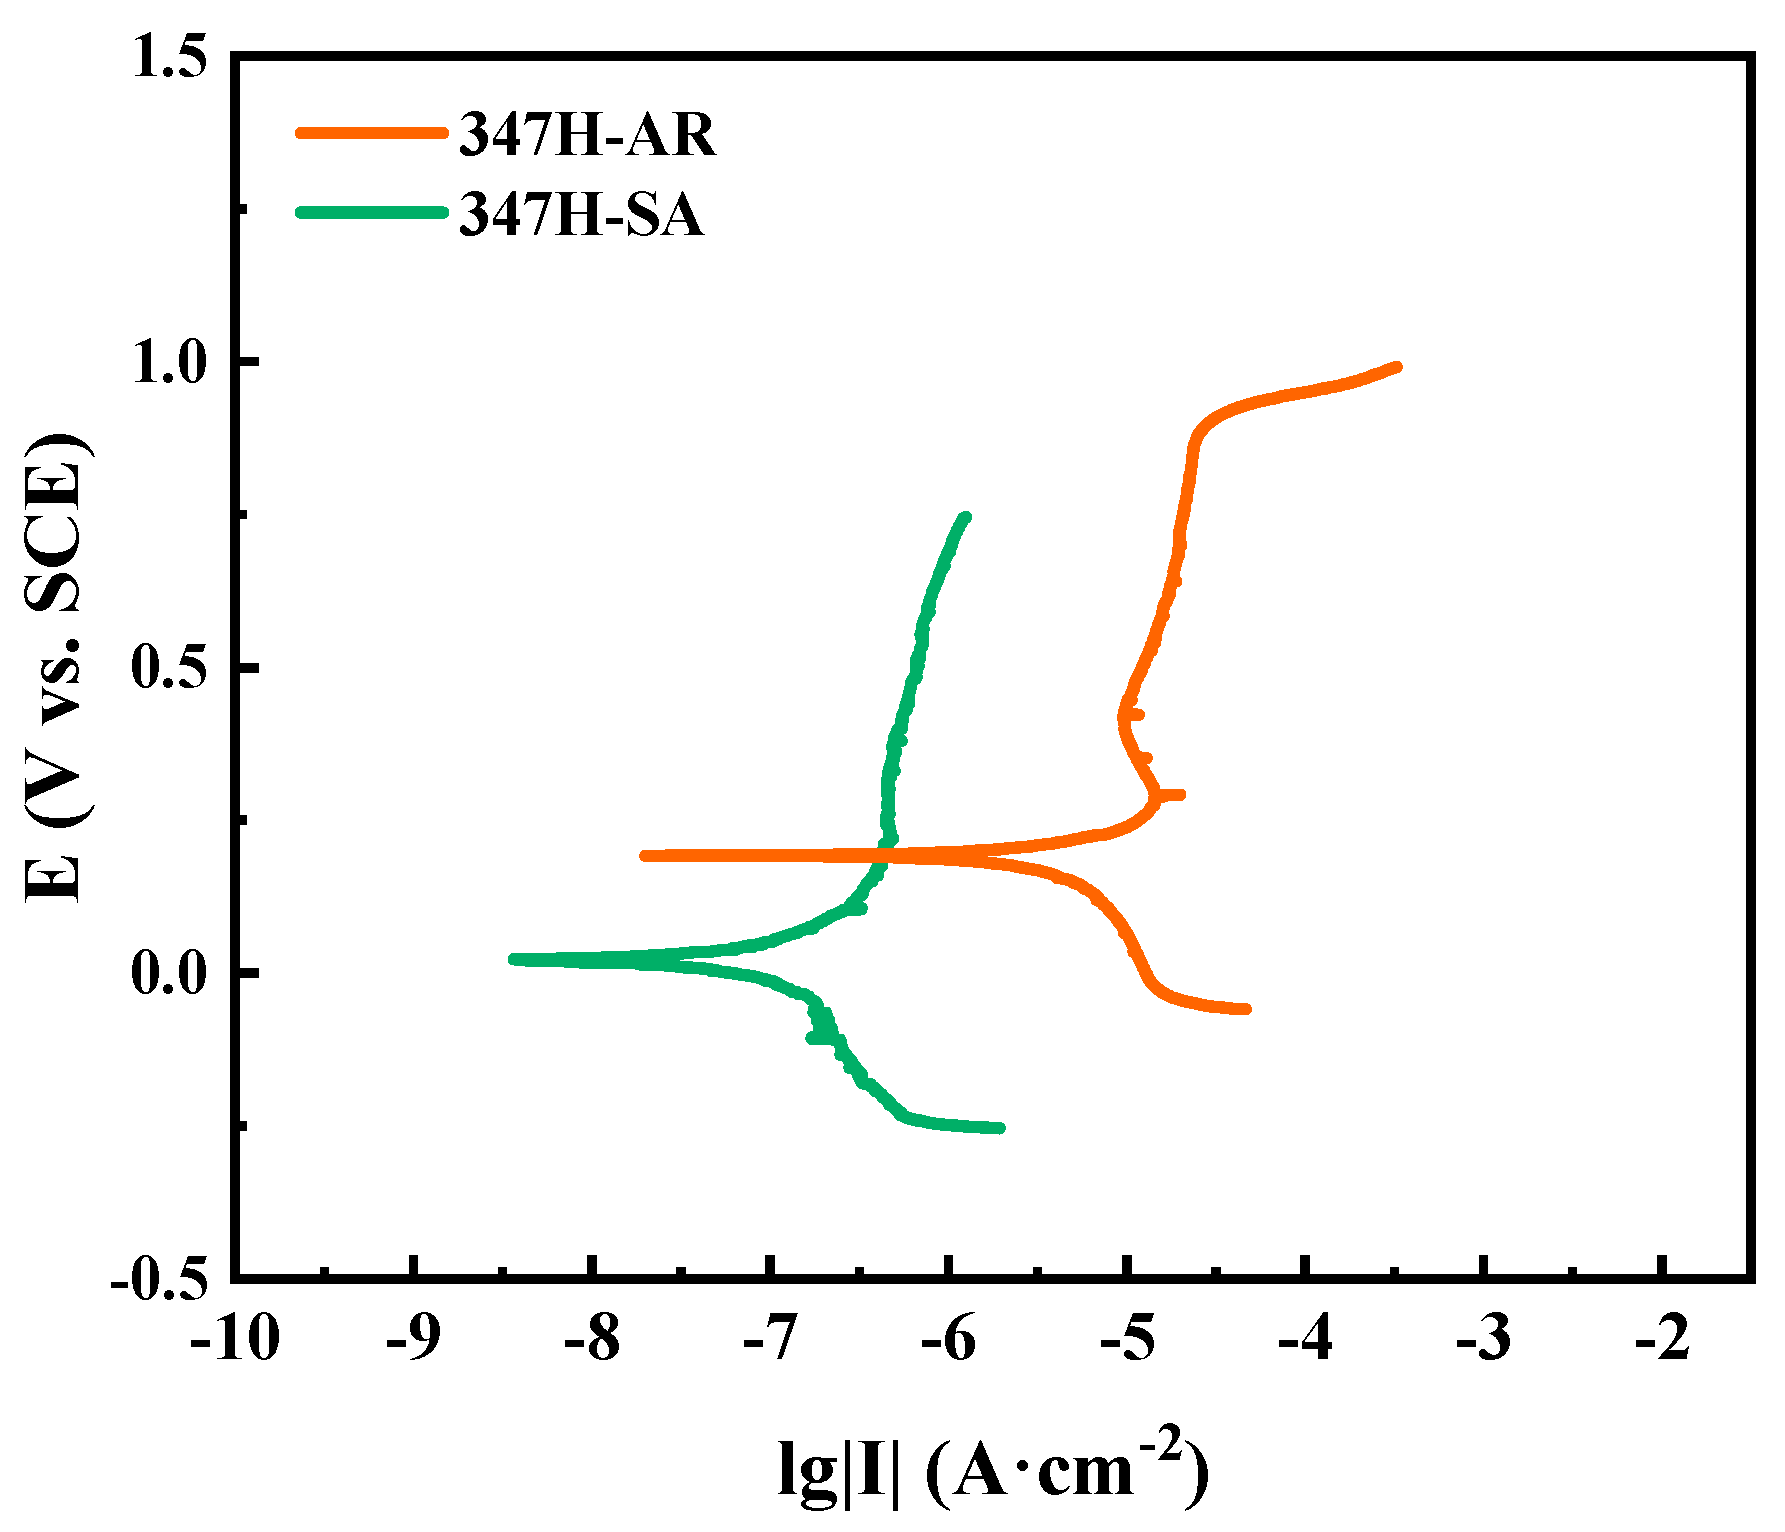
Figure 4 presents the potentiodynamic polarization curves of AISI 347H stainless steel subjected to different heat treatment conditions. All samples exhibit characteristic passive behavior with distinct passivation regions, but their corrosion resistance varies significantly depending on thermal history. The 347H-SA sample shows the lowest corrosion current density (I
corr), indicating its superior ability to form and maintain a stable passive film. This improvement is likely attributed to the optimized distribution of Nb-rich precipitates, which act as Cr-donating sites and enhance passivation. In contrast, the 347H-AR sample exhibits a significantly higher I
corr, reflecting inferior passivation and greater susceptibility to uniform corrosion. It suggests that while annealing improves microstructural uniformity, the reduction in Nb-containing phases may reduce passivation stability. These findings confirm that stabilization heat treatment plays a beneficial role in improving the corrosion resistance of AISI 347H stainless steel by modifying its precipitate morphology and passive film properties.
The EIS results, shown in
Figure 5, further validate the corrosion behavior observed in the polarization measurements. The electrochemical data were fitted using the equivalent circuit model presented in
Figure 5a. The Nyquist plots (
Figure 5a) exhibit typical depressed capacitive semicircles for all samples, indicating a passive film–electrolyte interface governed by charge transfer processes. The 347H-SA sample exhibits the largest semicircle diameter, corresponding to the highest charge transfer resistance, suggesting a dense and stable passive film. The fitted equivalent circuit model, consisting of two time constants, was used to represent the bilayer structure of the passive film as an outer porous layer and an inner compact layer.
Overall, the EIS analysis confirms that solution treatment significantly enhances the electrochemical stability of the passive film on AISI 347H stainless steel, consistent with its superior polarization performance.
3.3. High-Temperature Oxidation Behavior
The samples were subsequently subjected to oxidation at 550 °C to evaluate the influence of heat treatment on the oxidation resistance of AISI 347H stainless steels.
Figure 6 presents the ToF-SIMS negative ion depth profiles of the AISI 347H stainless steel samples with and without heat treatment after different oxidation durations. This technique enabled the identification of specific oxide species as well as their lateral and depth distributions, which complement the morphological and elemental information obtained from SEM and EDS. The signal intensity is plotted on a logarithmic scale as a function of sputtering time. The metallic region is defined by the onset of the intensity plateau of the Fe
2− ion profile, indicating the interface between the oxide film and the metallic substrate [
17].
As shown in
Figure 6, FeO
2−, CrO
2−, NiO
2−, and NbO
2− signals are detected in the oxide region, indicating the presence of iron, chromium, nickel, and niobium oxides, respectively. As shown in
Figure 6a1, after 1 h of oxidation of the 347H-AR sample, the FeO
2− depth profile exhibits a peak at the outermost region and gradually decreases across the entire oxide layer, suggesting that iron oxide is primarily concentrated near the surface, with a smaller fraction distributed within the inner oxide. In contrast, the CrO
2− signal peaks deeper within the oxide layer and spans a broader region than FeO
2−, indicating that chromium oxide predominantly forms in the inner oxide layer. The significantly higher intensity of the CrO
2− signal compared to FeO
2− further suggests that the oxide film is richer in chromium oxide. The NiO
2− signal also peaks at the surface but exhibits relatively low intensity, implying limited formation of nickel oxide, consistent with previous findings that nickel, due to its lower oxygen affinity, is less prone to oxidation than iron and chromium [
18]. Meanwhile, the NbO
2− signal peaks near the oxide/metal interface, indicating that niobium oxide is mainly concentrated at the inner boundary of the oxide film. Taken together, these profiles suggest that the oxide film formed on 347H-AR after 1 h of oxidation exhibits a bilayer structure, with the outer layer enriched in Fe and Ni oxides and the inner layer dominated by Cr and Nb oxides, where Cr oxide is the principal component.
As for the 347H-SA sample after 2 h of oxidation, the results shown in
Figure 6b1 indicate that the oxide film also exhibits a bilayer structure similar to that observed in the 347H-AR sample, with the outer layer enriched in Fe and Ni oxides and the inner layer dominated by Cr and Nb oxides. However, a notable difference is that the NbO
2− depth profile displays two distinct peaks, one located in the outermost region and the other near the oxide/metal interface, suggesting that Nb oxides are distributed both at the surface and at the substrate interface. This dual distribution of Nb oxides contributes to the superior oxidation resistance of the 347H-SA sample compared to 347H-AR.
Niobium oxides enhance oxidation resistance through multiple mechanisms [
19,
20]. Due to their intrinsically low ionic conductivity, particularly in the form of Nb
2O
5, they serve as effective barriers to oxygen ion diffusion, thereby reducing the inward transport of oxygen and the outward migration of metal cations, which slows down the oxidation process. Furthermore, niobium acts synergistically with chromium to stabilize the Cr
2O
3 oxide scale, suppress chromium volatilization and redistribution under high-temperature conditions, and improve the adhesion and resistance to spallation of the protective oxide layer.
With increasing oxidation time, the oxide film structures of both 347H-SA and 347H-AR samples remain unchanged, indicating that prolonged oxidation does not significantly alter the bilayer configuration of the oxide scales on either steel. Regarding the CrO2− signal, its intensity remains consistently high throughout the oxidation process, while the FeO2− signal gradually decreases. This observation aligns with the fact that chromium has a higher affinity for oxygen than iron, making it more susceptible to oxidation under high-temperature conditions. As for the NbO2− and NiO2− signals, their intensities remain relatively stable, suggesting that the distribution and oxidation states of niobium and nickel do not significantly vary with extended oxidation time.
In
Figure 6, the dashed lines mark the boundary between the oxide layer and the underlying metal, allowing for the estimation of oxide thickness based on sputtering time. For the 347H-AR sample, the oxide thickness corresponds to sputtering times of 140 s, 152 s, 302 s, 360 s, and 500 s after oxidation for 2 h, 6 h, 12 h, 24 h, and 48 h, respectively. In contrast, the 347H-SA sample exhibited sputtering times of 110 s, 150 s, 260 s, 302 s, and 325 s for the same oxidation durations. Assuming a sputtering rate of 0.02 nm·s
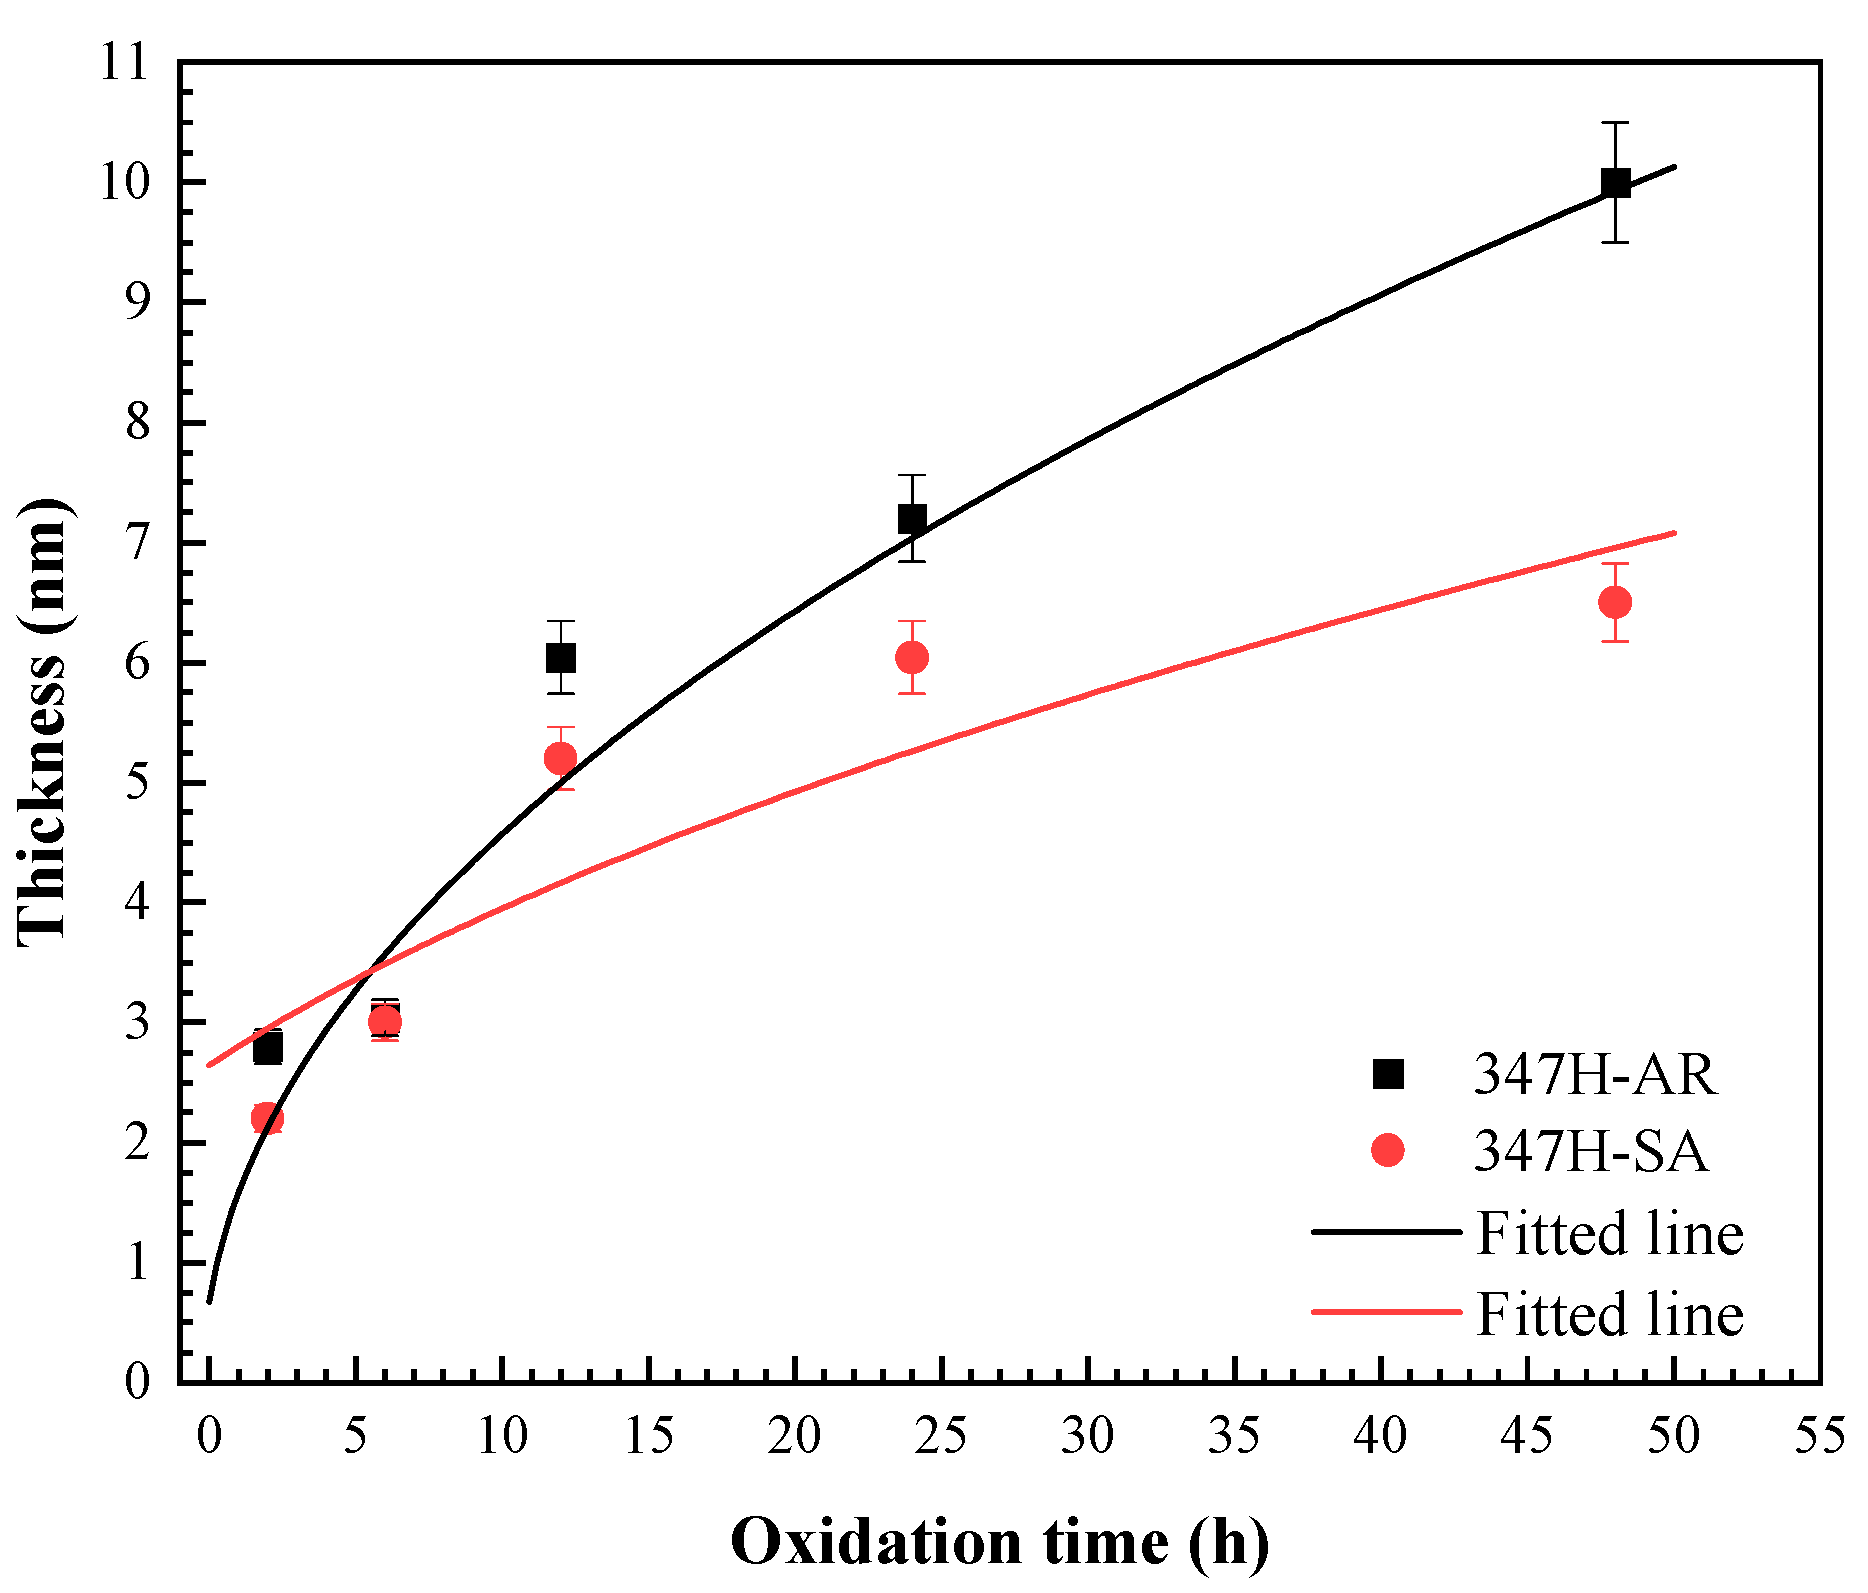
−1, these values correspond to oxide thicknesses of 2.8 nm, 3.0 nm, 6.0 nm, 7.2 nm, and 10.0 nm for 347H-AR, and 2.2 nm, 3.0 nm, 5.2 nm, 6.0 nm, and 6.5 nm for 347H-SA, respectively. The complete evolution of oxide thickness is summarized in
Figure 7.
As shown in
Figure 7, the thickness evolution of AISI 347H stainless steel samples exhibit an approximately parabolic growth behavior throughout the entire exposure duration at 550 °C during. This trend suggests that the oxidation process is controlled by diffusion mechanisms. According to Wagner’s oxidation theory [
21], for oxidation processes governed by parabolic kinetics, the relationship between the thickness (nm) and exposure time (t) can be described by the following equation:
where d represents the oxide film thickness, t is the exposure time, and
kp is the parabolic rate constant of the oxidation reaction, which is temperature-dependent. According to Equation (1), the parabolic relationship between oxide thickness and exposure time can be fitted using the experimental data obtained at different temperatures, as shown by the dashed curves in
Figure 7. Based on the fitting results, the parabolic rate constants at 550 °C were determined to be 2.042 nm
2/h for the 347H-AR and 0.862 nm
2/h for the 347H-SA.
These results indicate that the oxide film on 347H-SA grows more slowly than that on 347H-AR under identical oxidation conditions. The reduced oxidation rate of 347H-SA can be attributed to its modified microstructure after heat treatment, which promotes the formation of a more uniform and protective oxide layer with reduced defect density. This enhanced oxidation resistance suggests that appropriate heat treatment can effectively improve the long-term high-temperature performance of AISI 347H SS by stabilizing the passive film and suppressing the outward diffusion of metallic species.
Figure 8 presents the SEM images and corresponding EDS elemental mapping of 347H-AR and 347H-SA samples after oxidation at 550 °C for 48 h. The surface morphology of the 347H-AR sample (
Figure 8a1,a2) reveals dense, randomly oriented needle-like or flake-like oxide structures, while the 347H-SA sample (
Figure 8b1,b2) exhibits more aligned and uniform oxide features, suggesting a more compact and ordered oxide scale. The higher degree of structural regularity in the 347H-SA sample indicates improved surface protection under prolonged oxidation. EDS mapping confirms the presence of Fe, Cr, Ni, and O in the oxide films of both samples. In both cases, strong Cr and O signals suggest that the oxide scales are primarily composed of Cr-rich oxides, most likely Cr
2O
3. Fe is also distributed across the surface, indicating partial formation of iron oxides, while Ni appears with relatively weaker intensity. Notably, the 347H-SA sample shows a more homogeneous and dense distribution of Cr and O, supporting its superior oxidation resistance compared to the 347H-AR sample.
Similar corrosion behaviors were observed by Chen et al. [
2] in their study of TP347H stainless steel exposed to supercritical water. At 550 °C, they also reported parabolic oxidation kinetics and the formation of bilayer oxide scales consisting of outer Fe-based oxides and inner (Fe,Cr)-rich spinels. In our work, although the oxidation environment differs (dry air vs. supercritical water), the solution-treated AISI 347H steel similarly developed a compact, Cr
2O
3-rich inner layer that limited oxygen diffusion and stabilized the oxide structure.


