
Bond Behavior and Critical Anchorage Length Prediction of Novel Negative Poisson’s Ratio Bars Embedded in Ultra-High-Performance Concrete


Abstract
1. Introduction
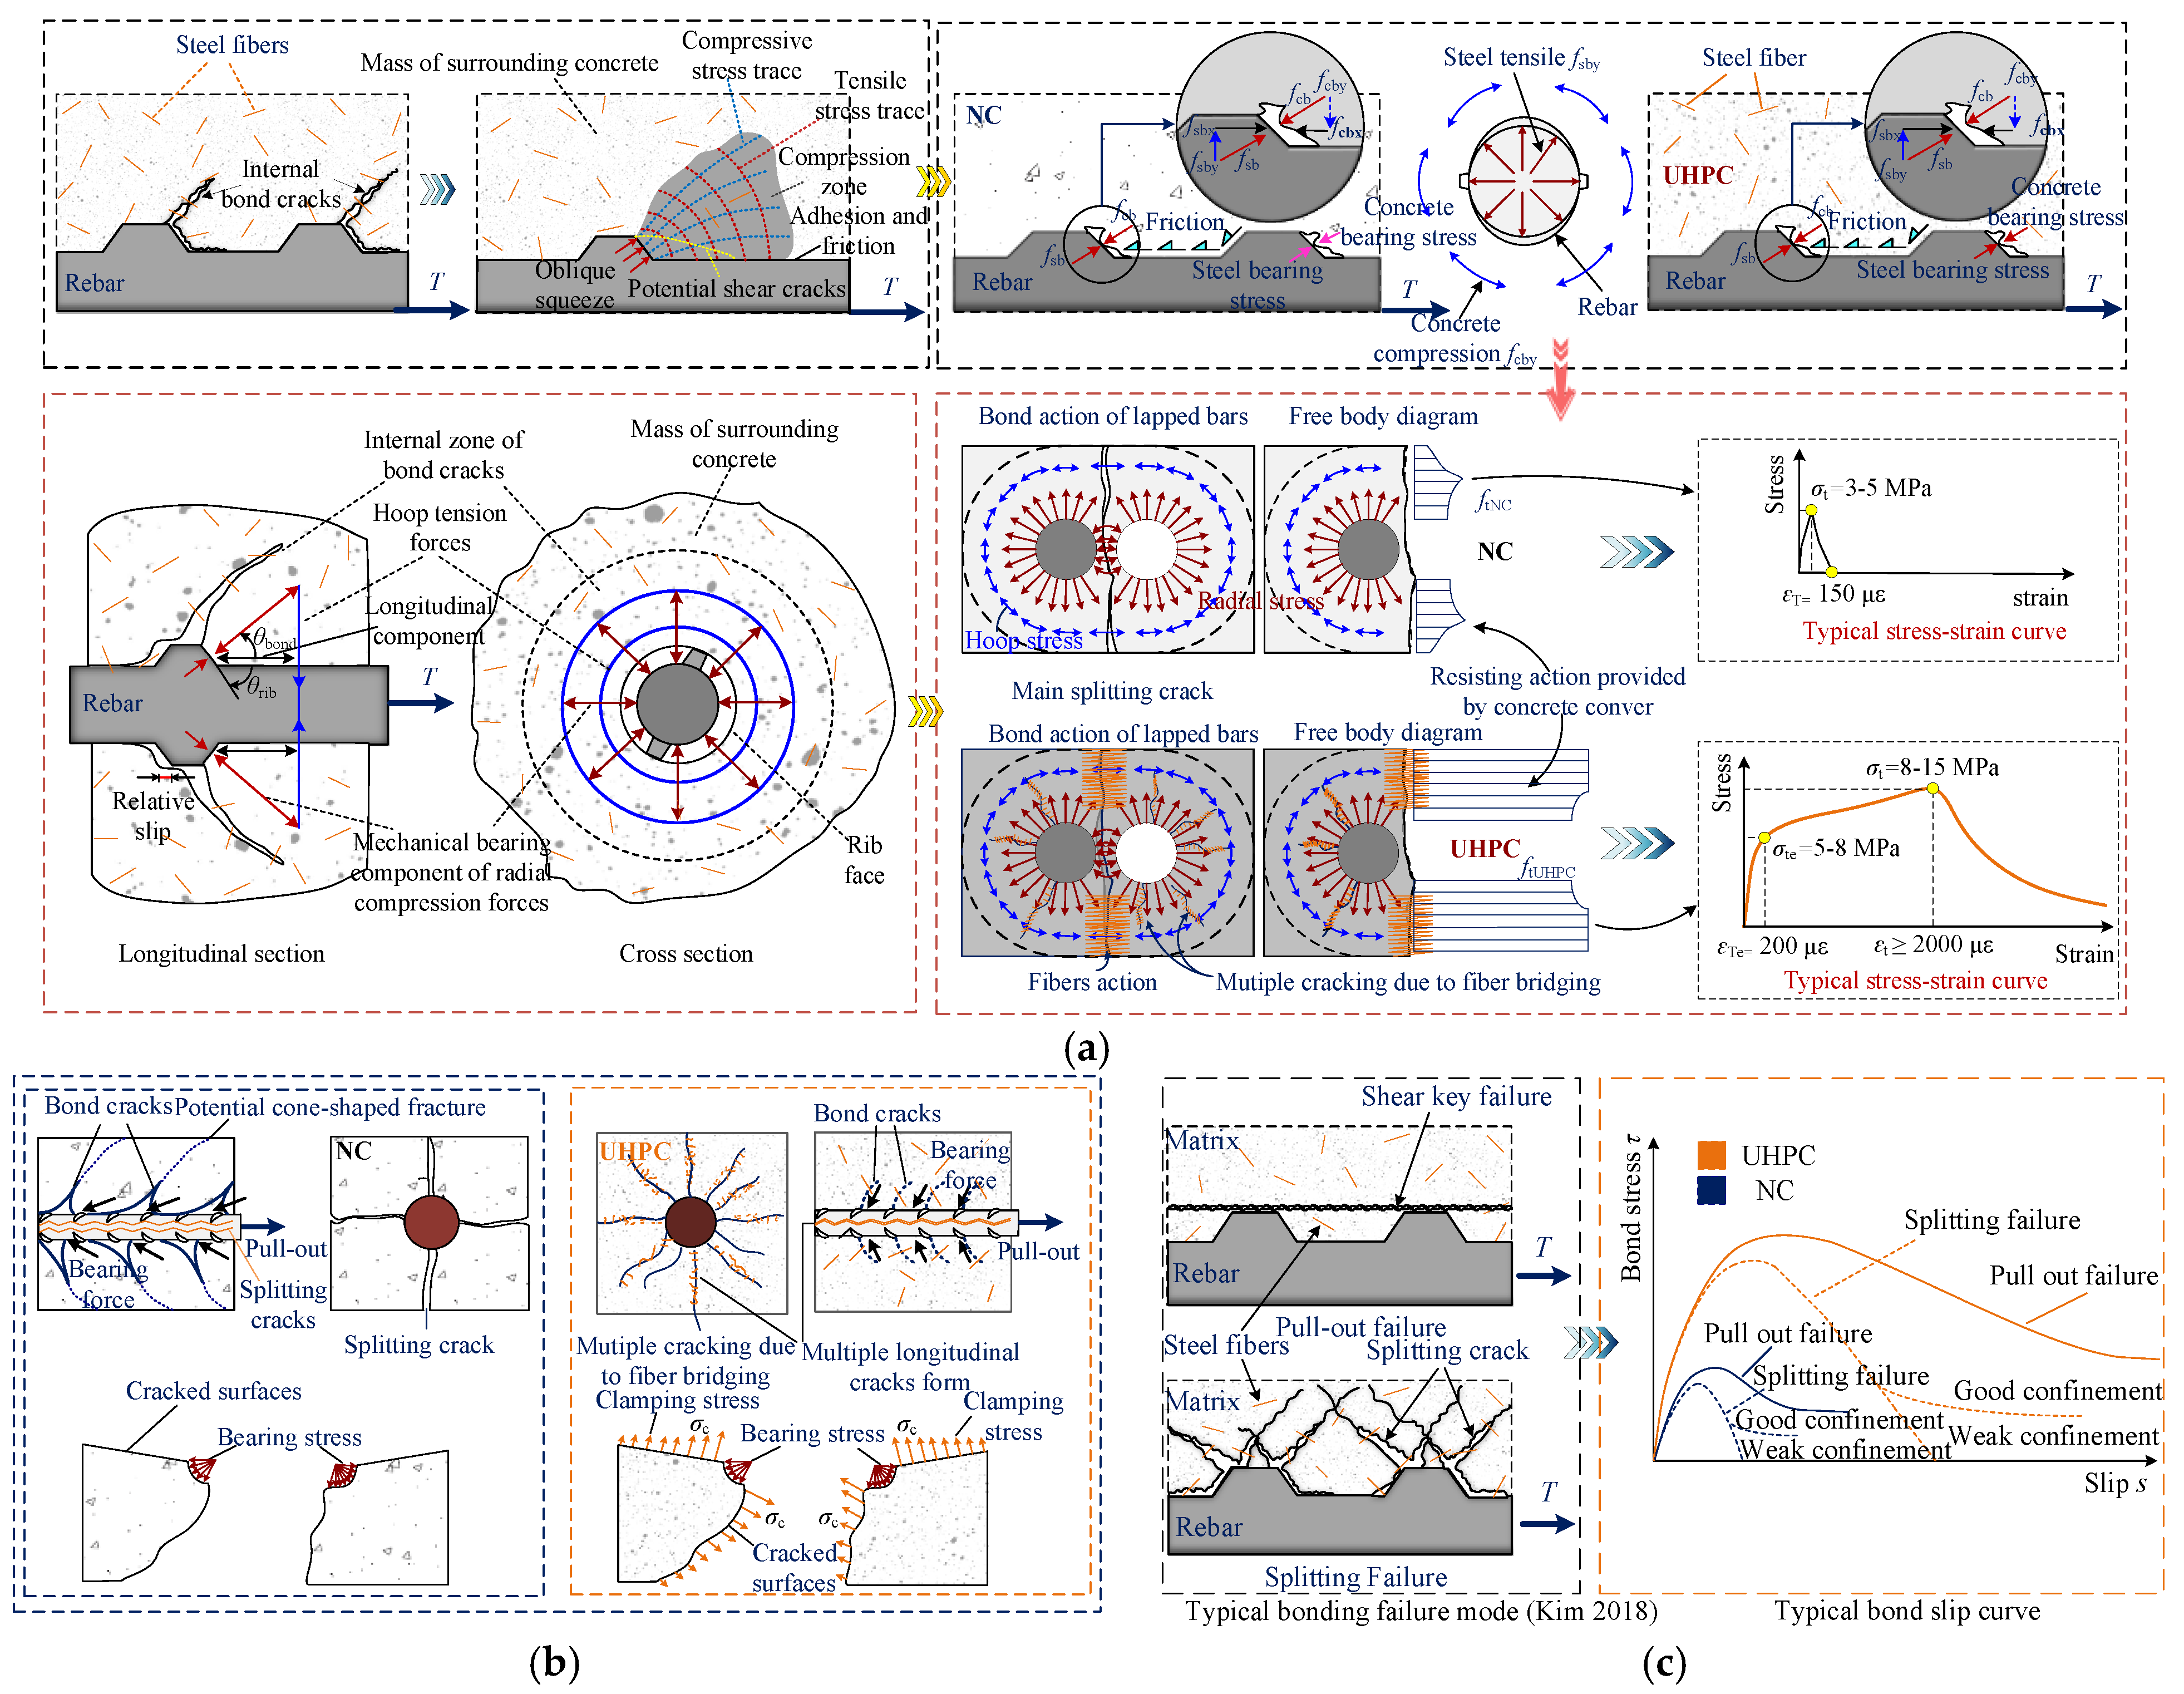
2. Bonding Mechanism
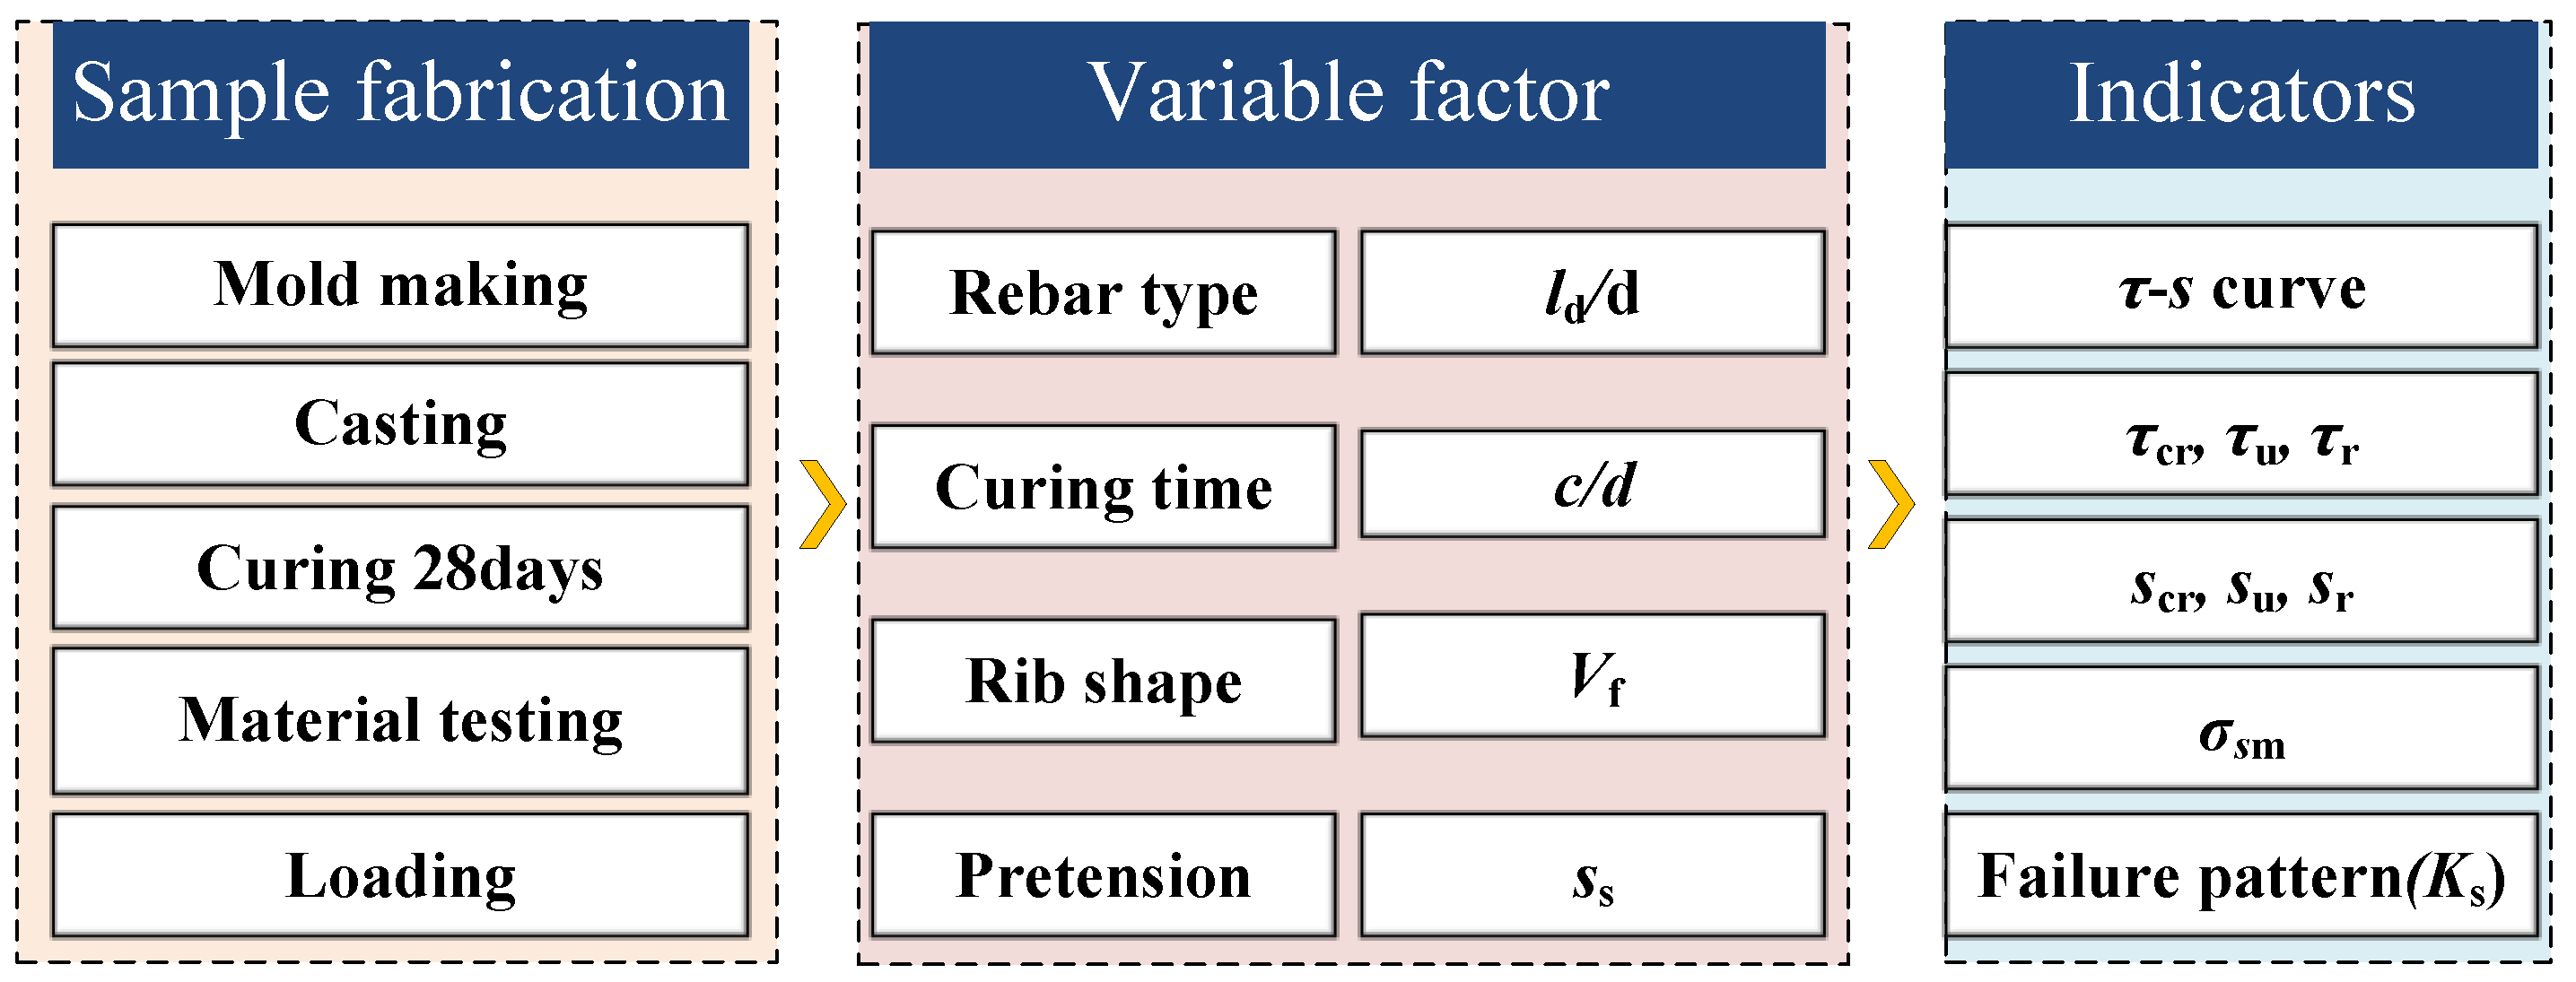
3. Experimental Program
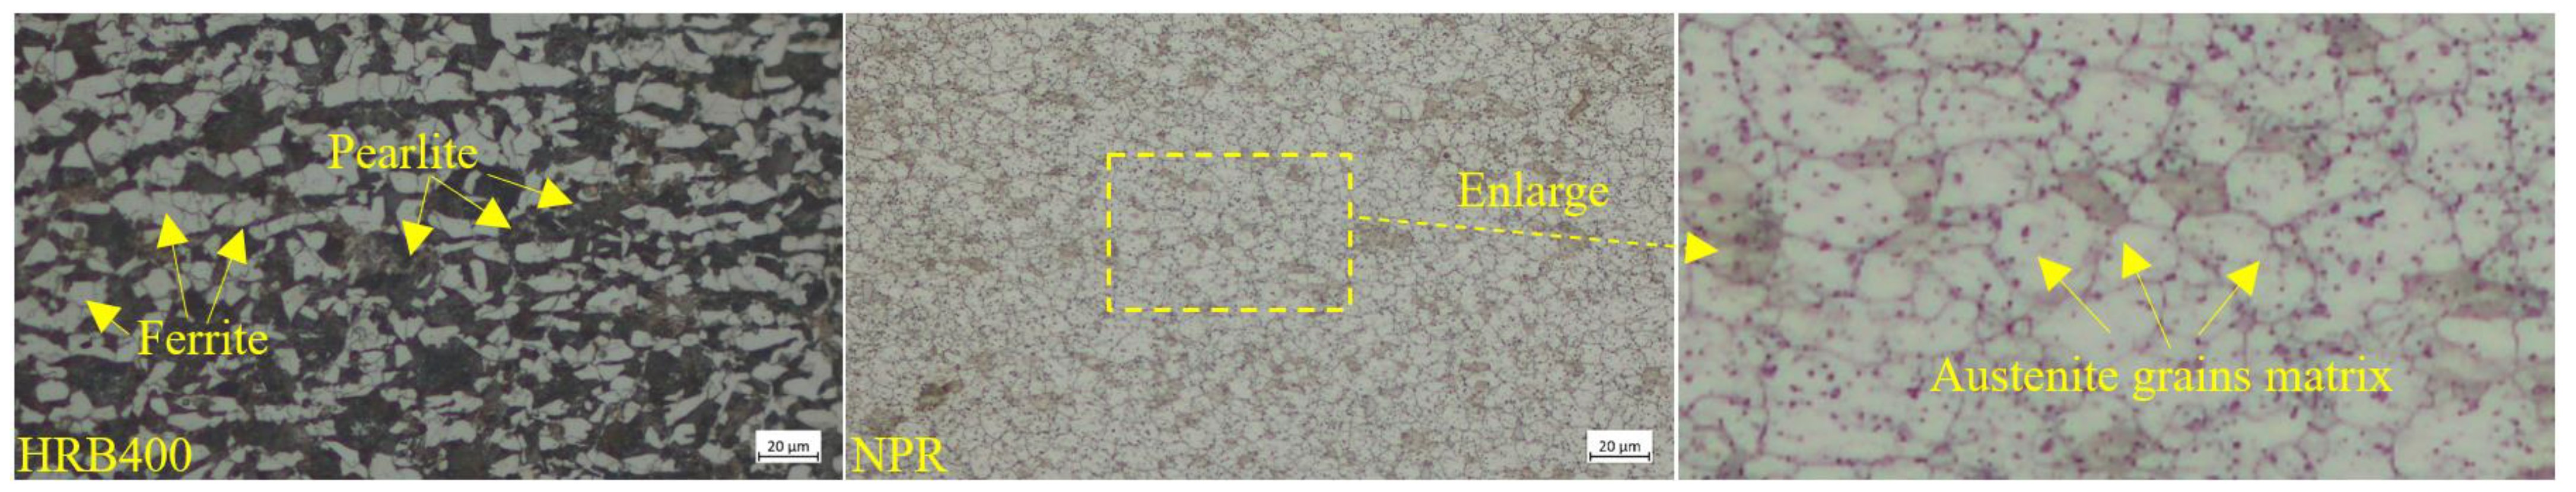
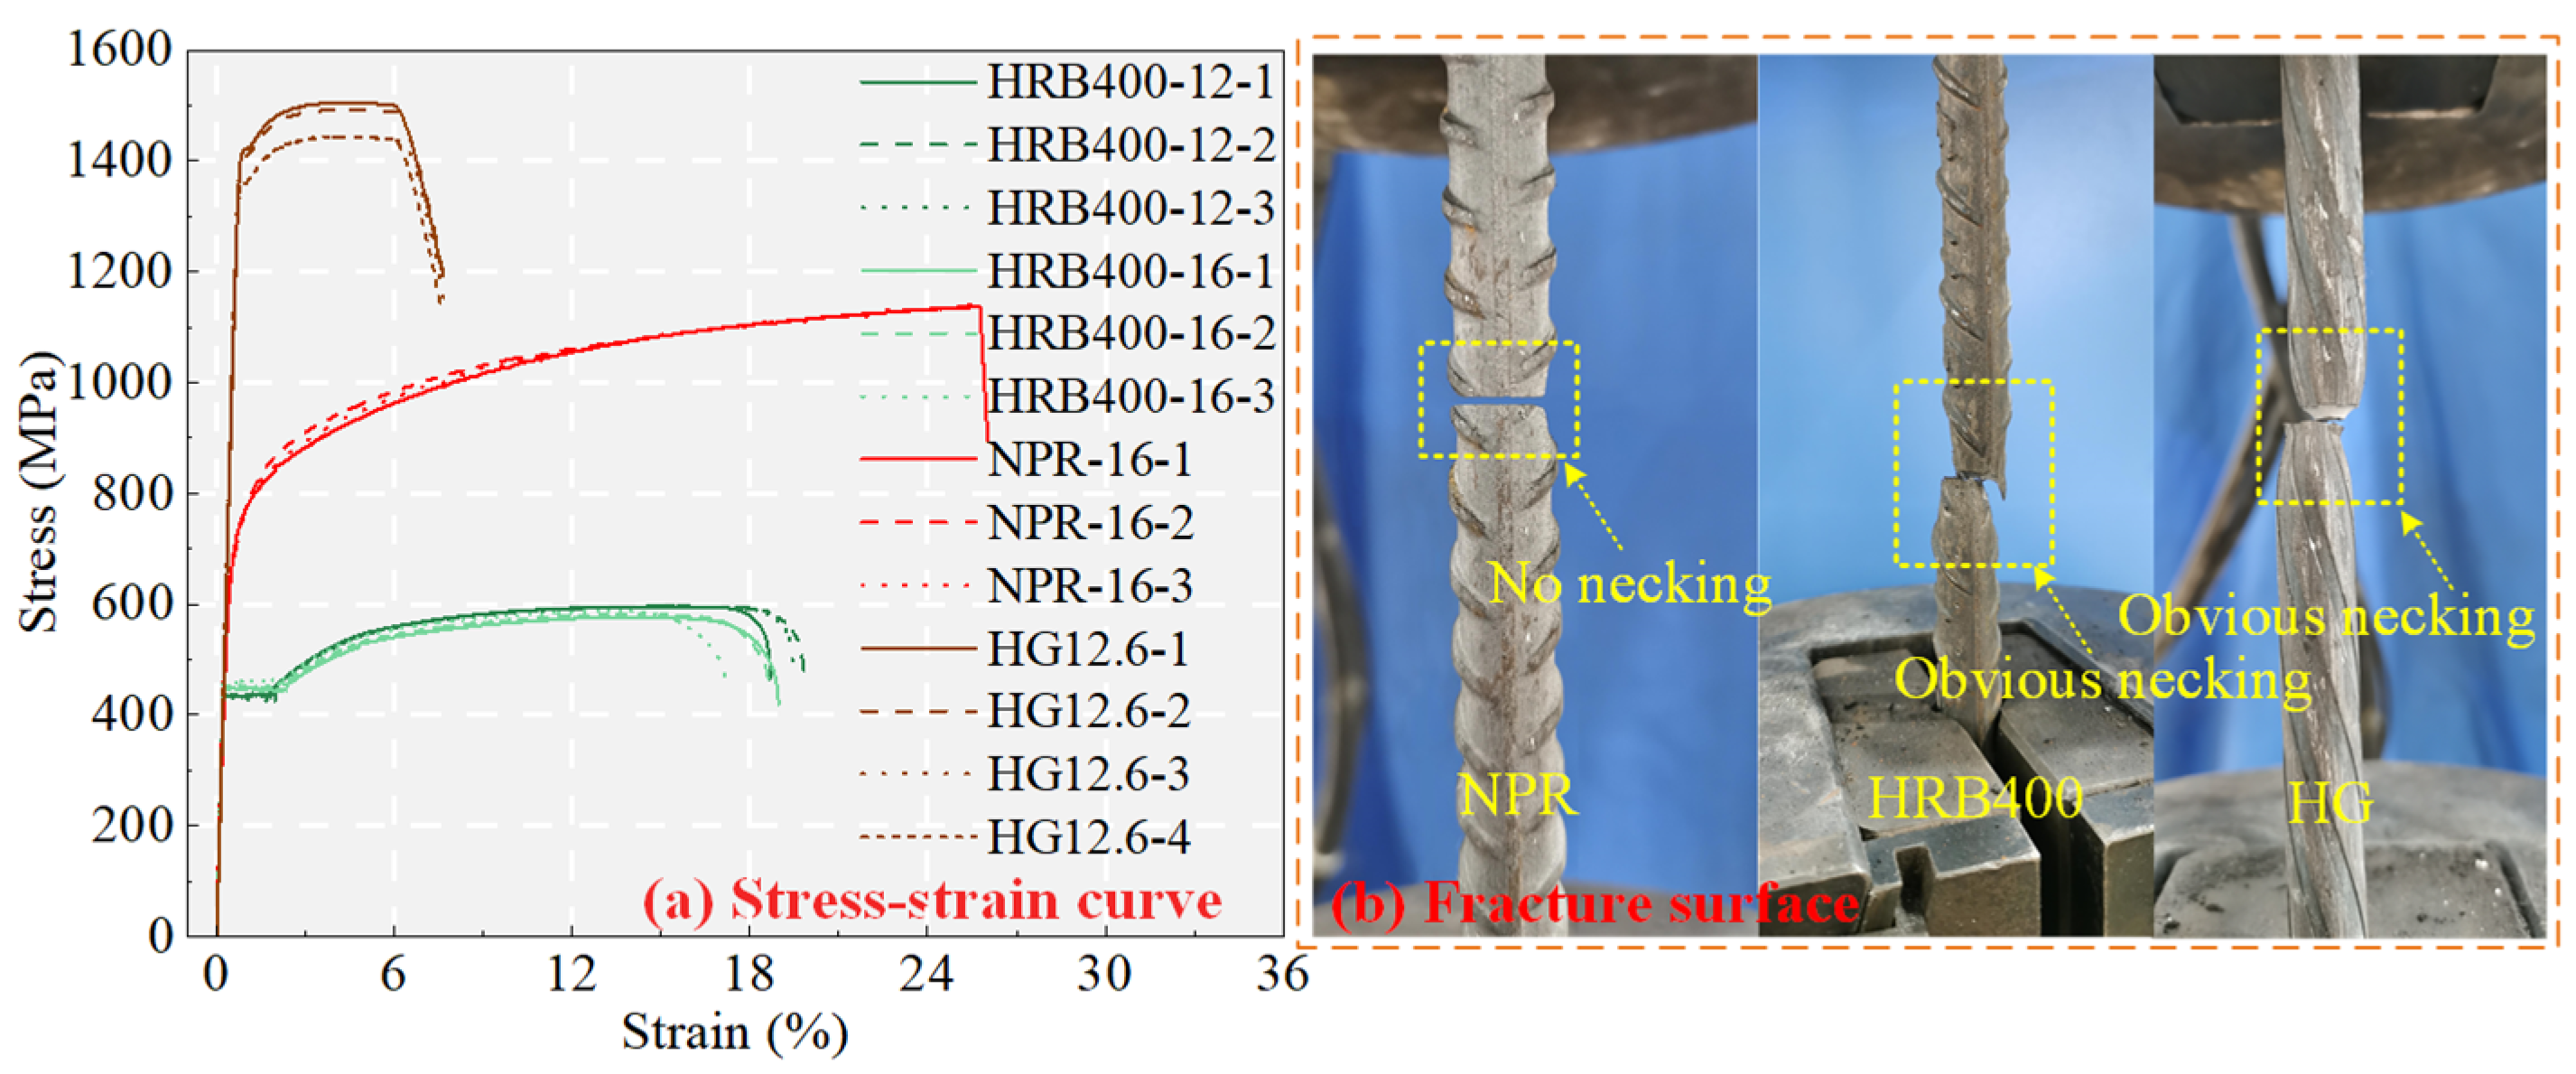
3.1. Rebar Material
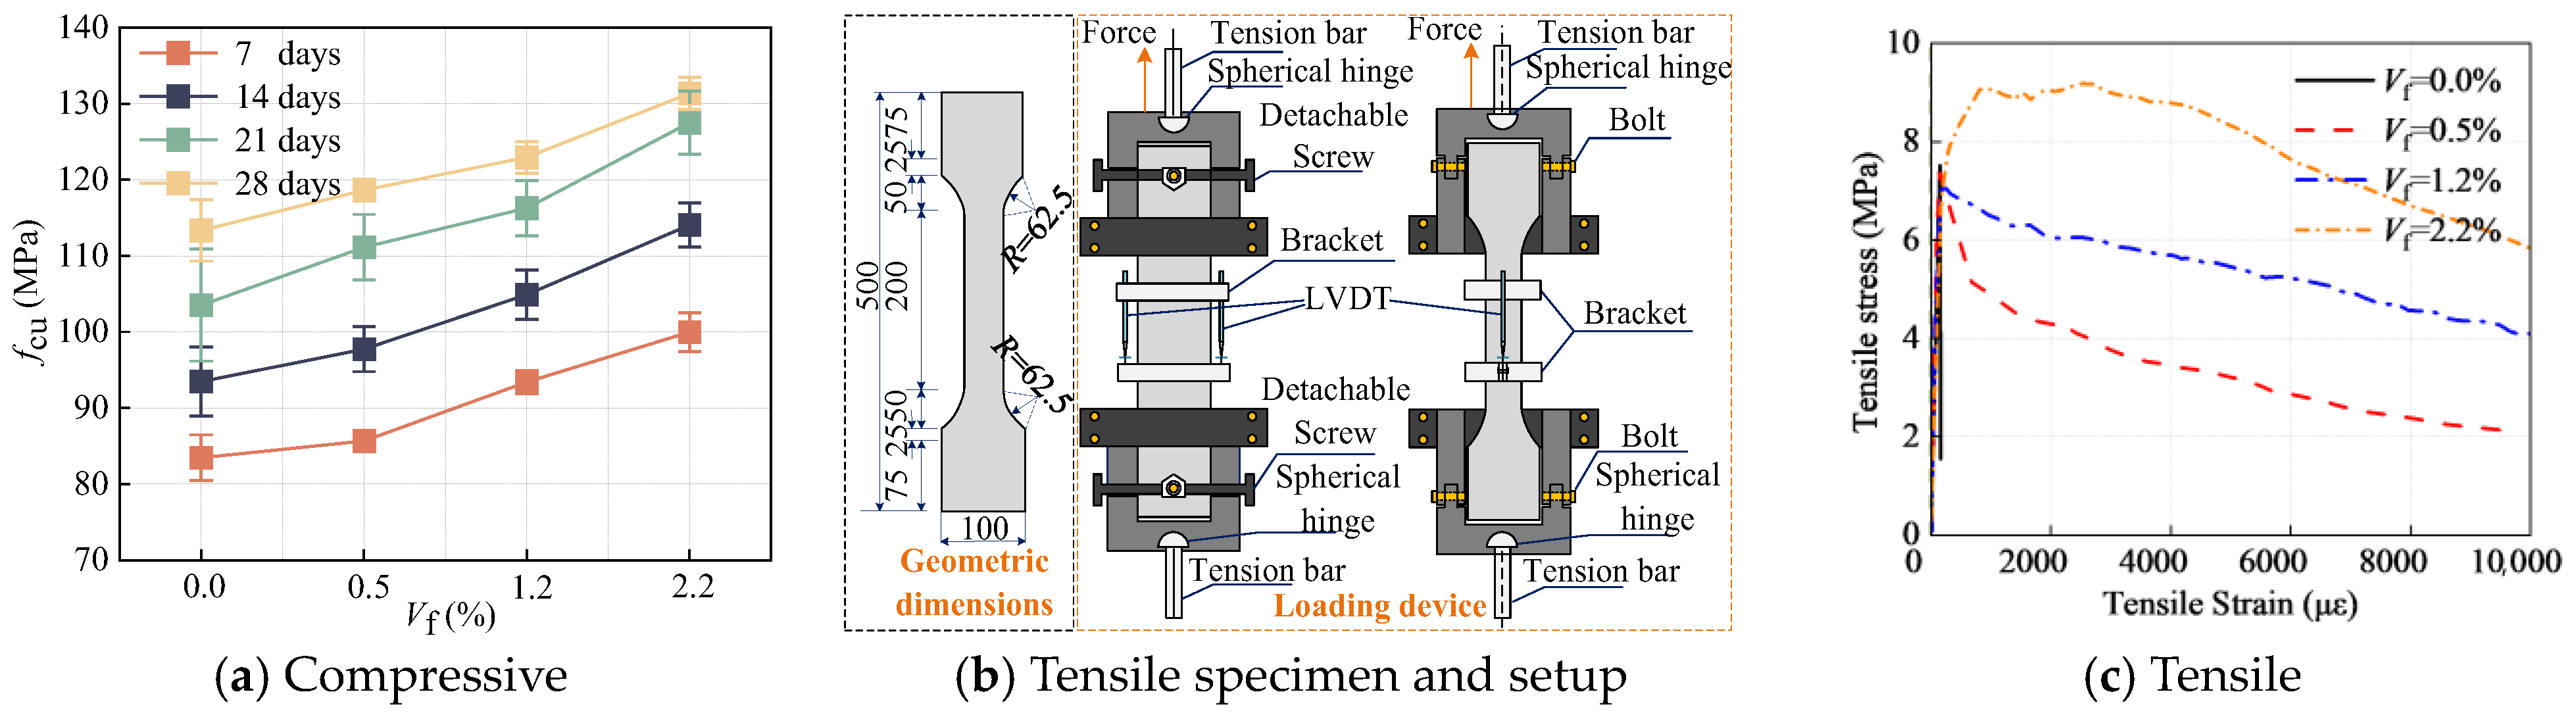
3.2. UHPC Material
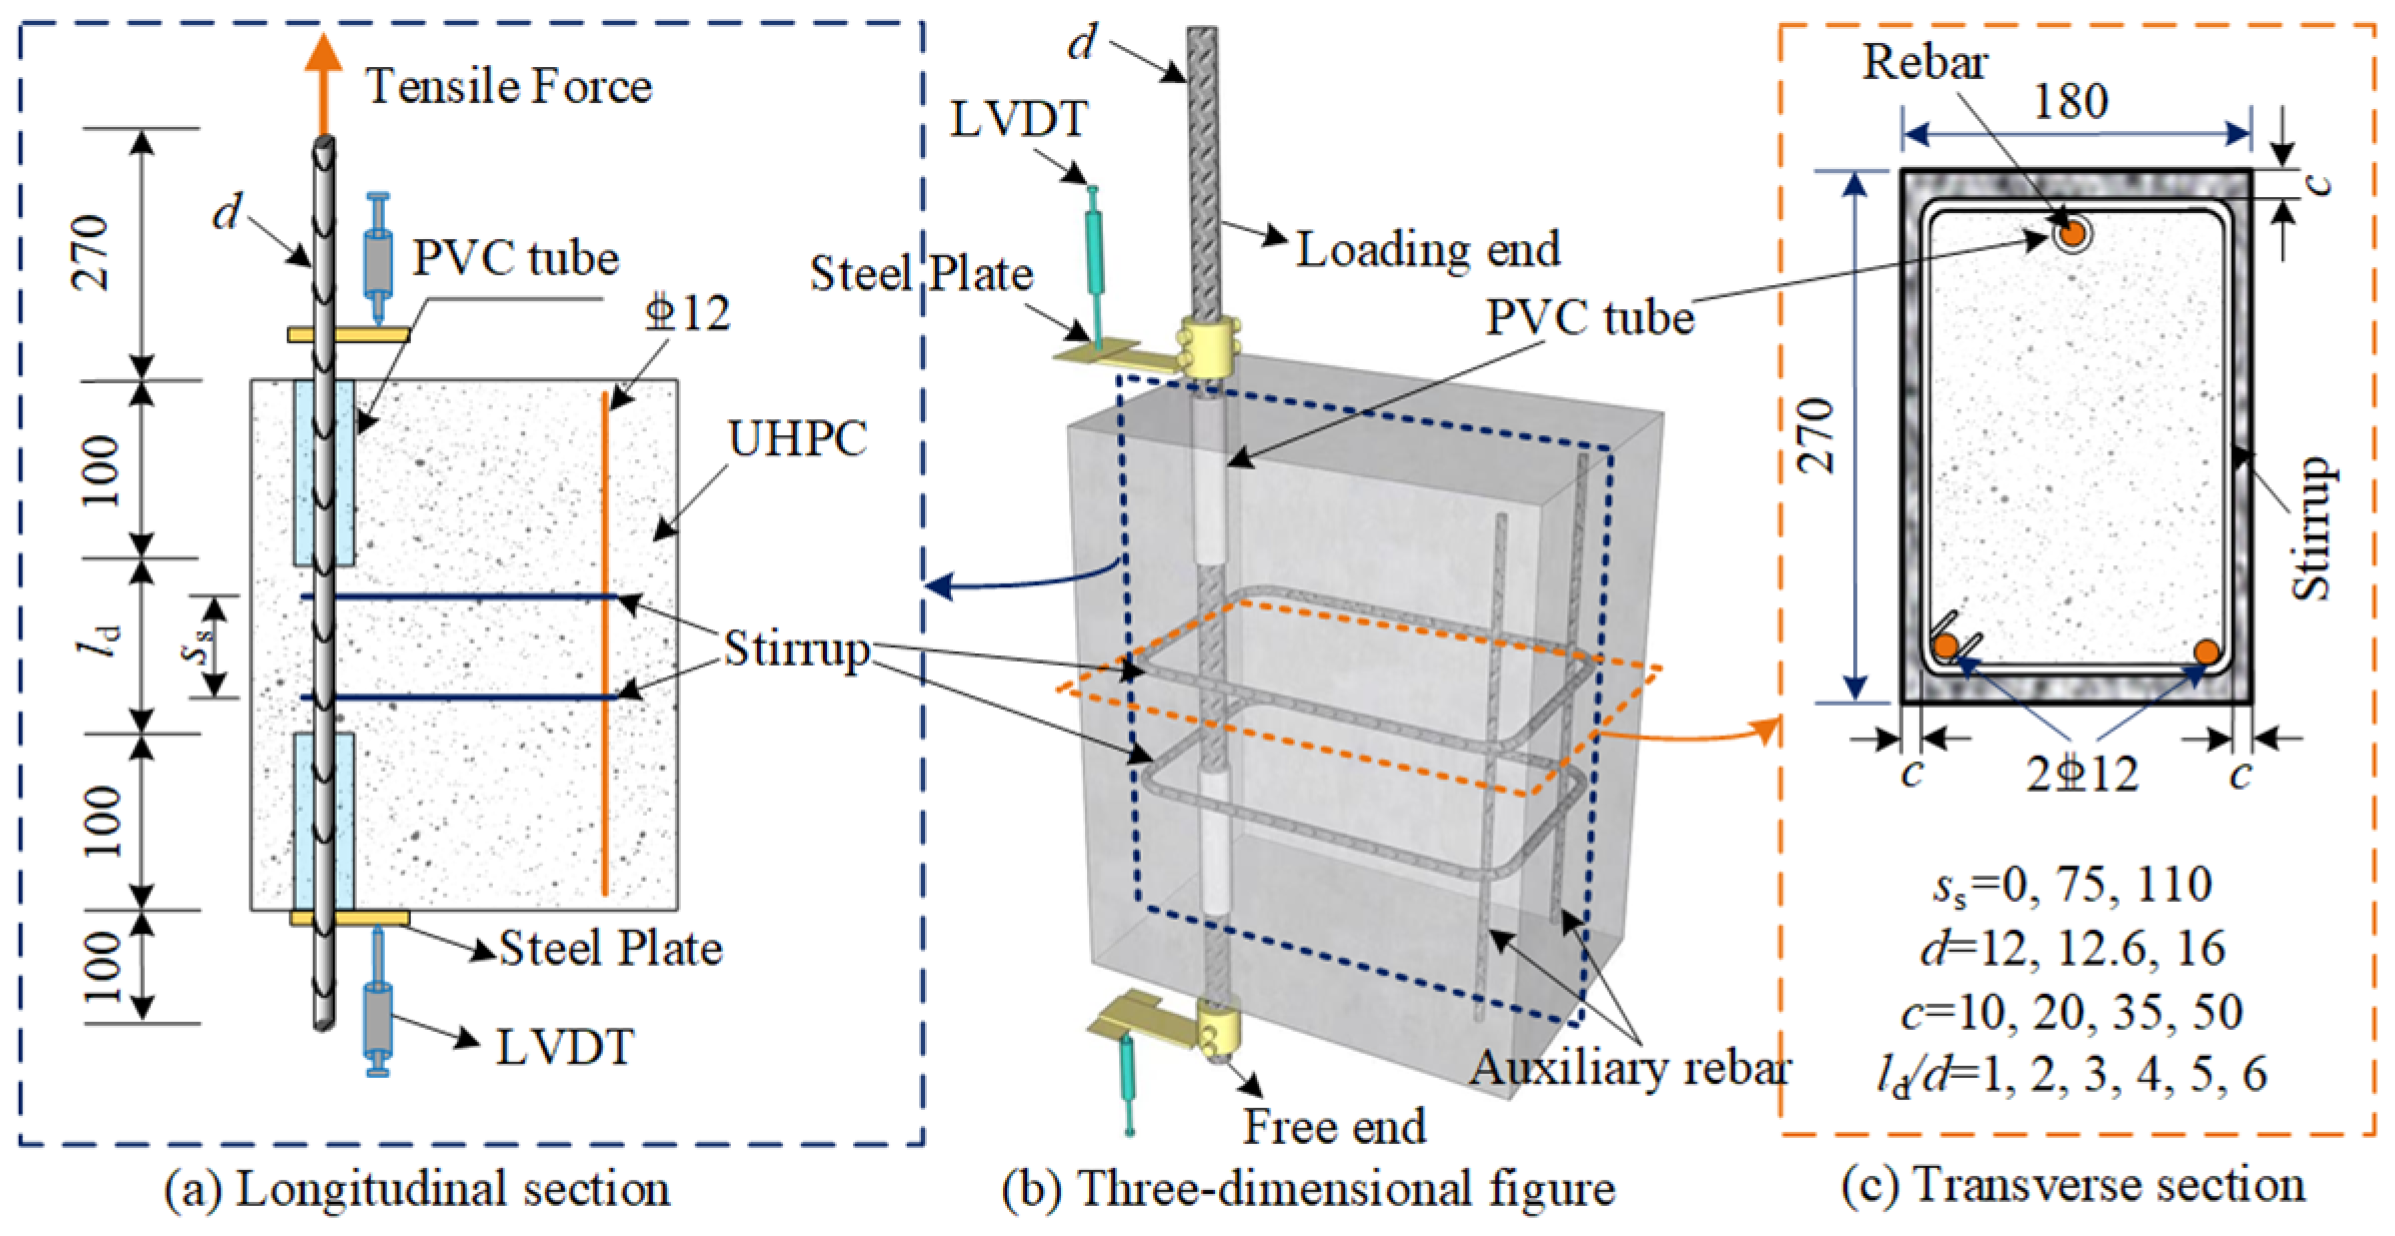
3.3. Eccentric Pull-Out Design
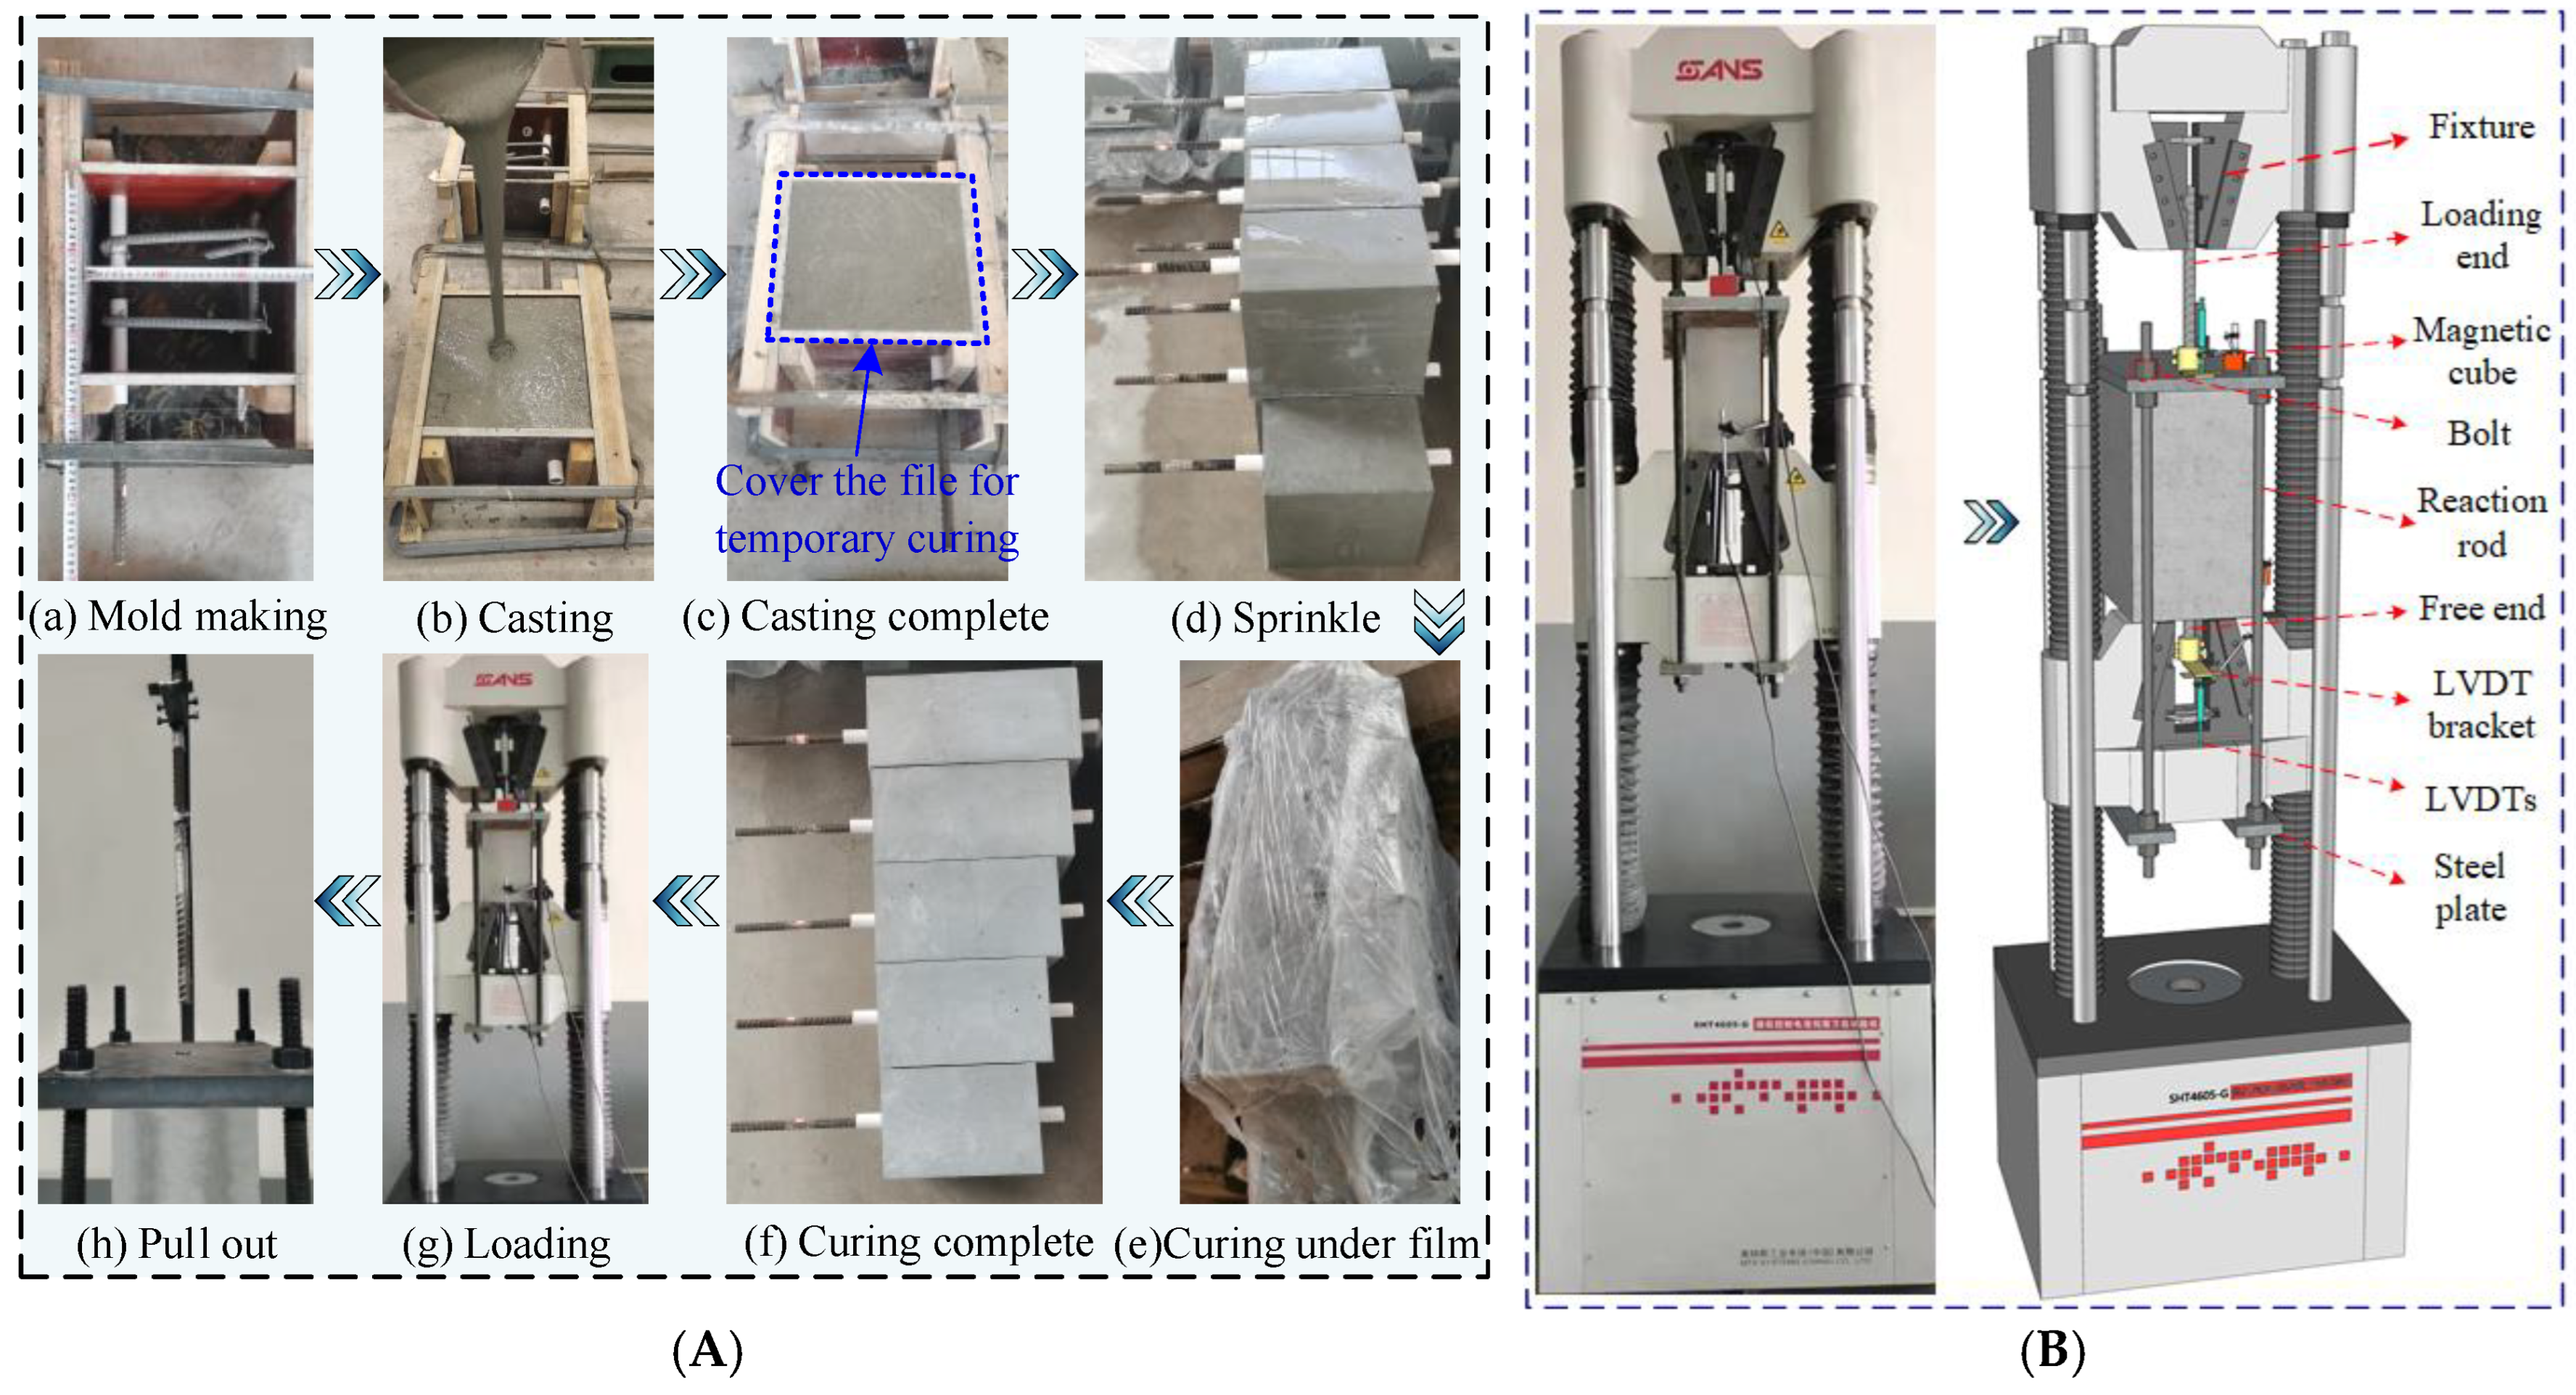
3.4. Test Process and Test Setup
3.5. Test Matrix
4. Test Results
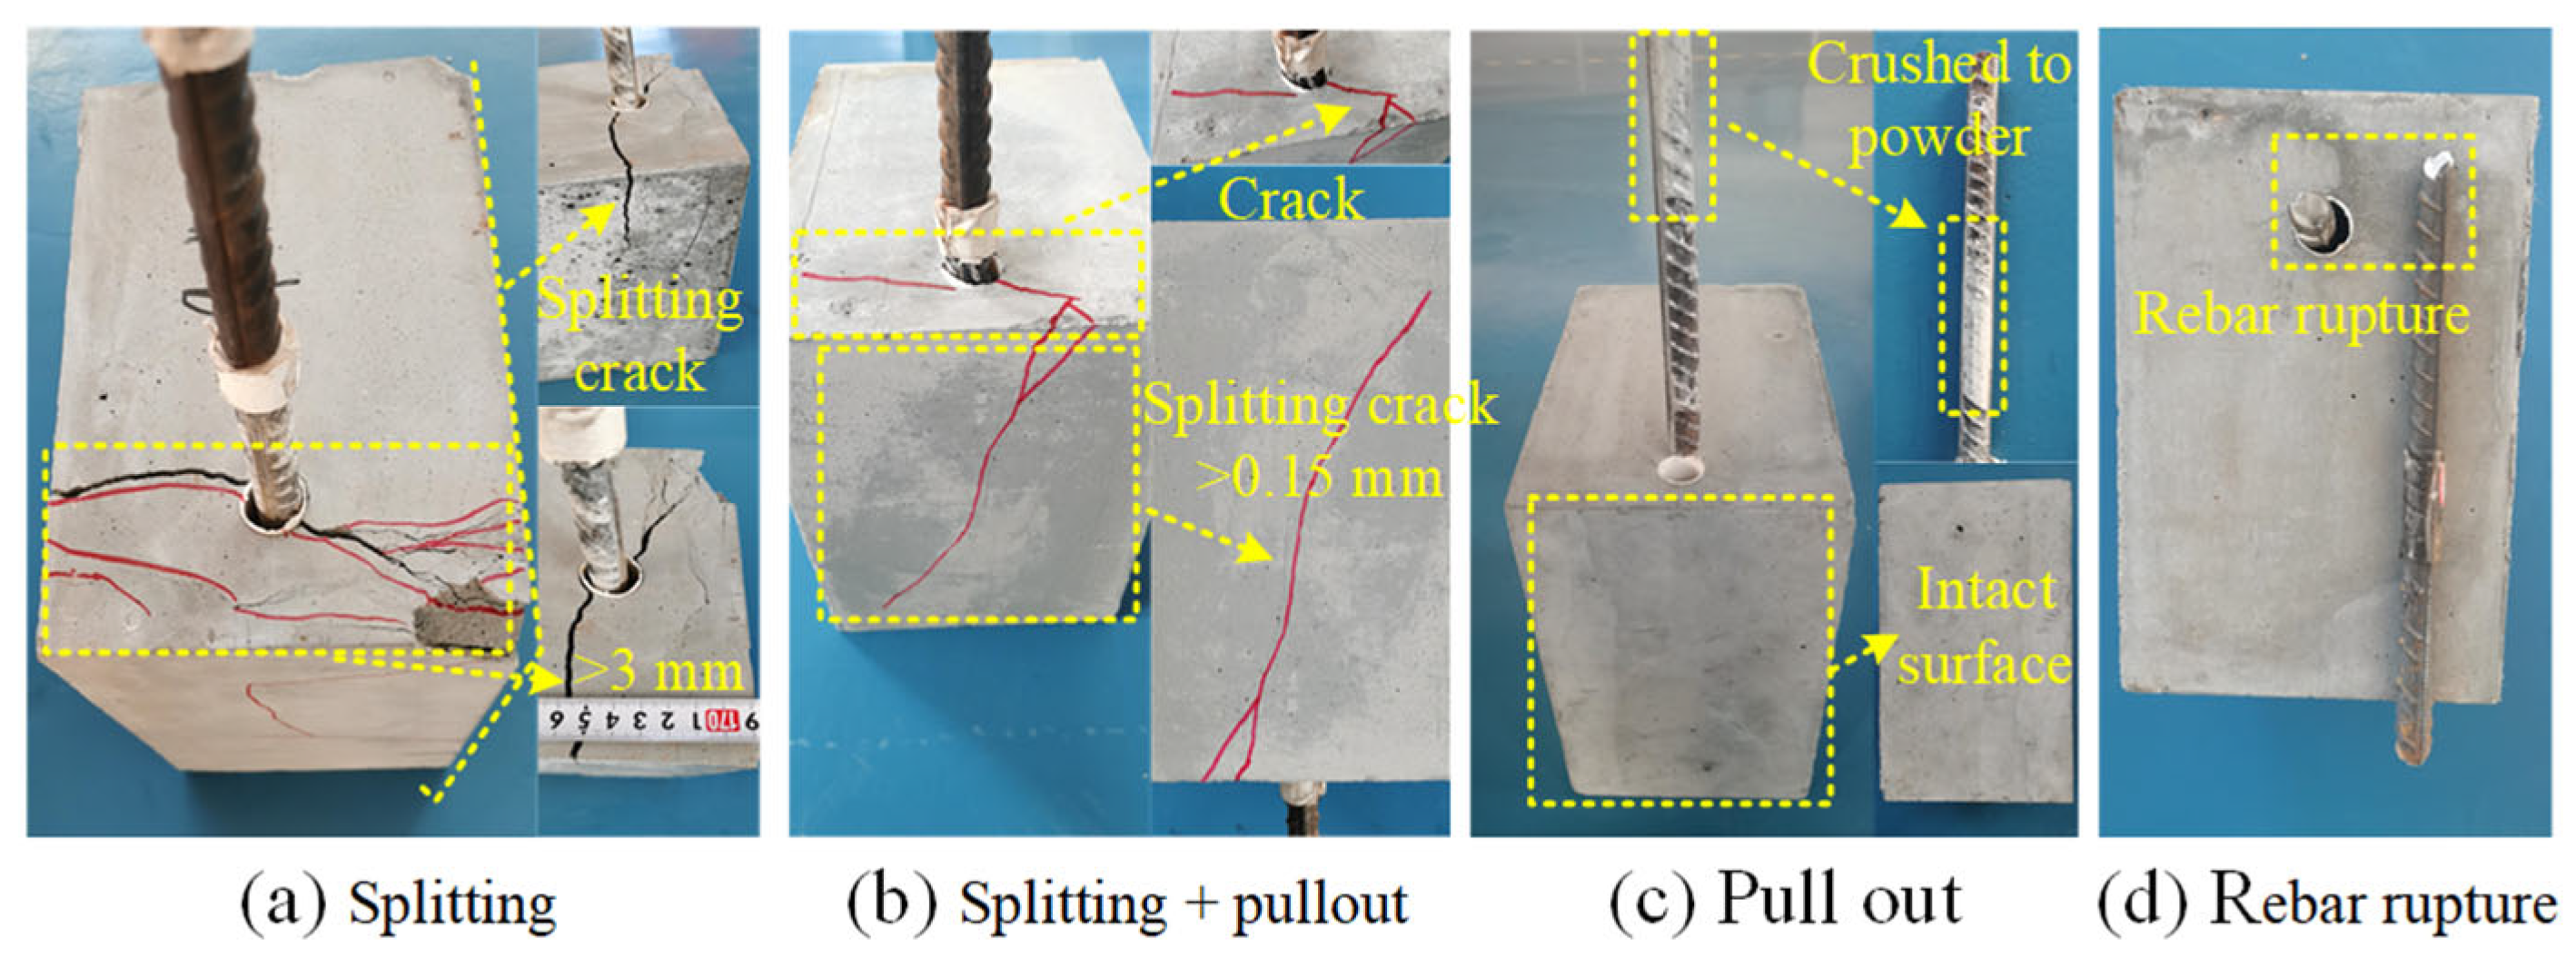
4.1. Crack Pattern and Failure Mode
4.2. Quantitative Discrimination of the Bond Failure Modes of NPR-UHPC
4.3. Measured τ-s Curves
5. Discussion
5.1. Effect of the Rebar Type
5.2. Effect of Pretension Strain
5.3. Effect of the Rib Height of the NPR Bars
5.4. Effect of the Rib Spacing of the NPR Bars
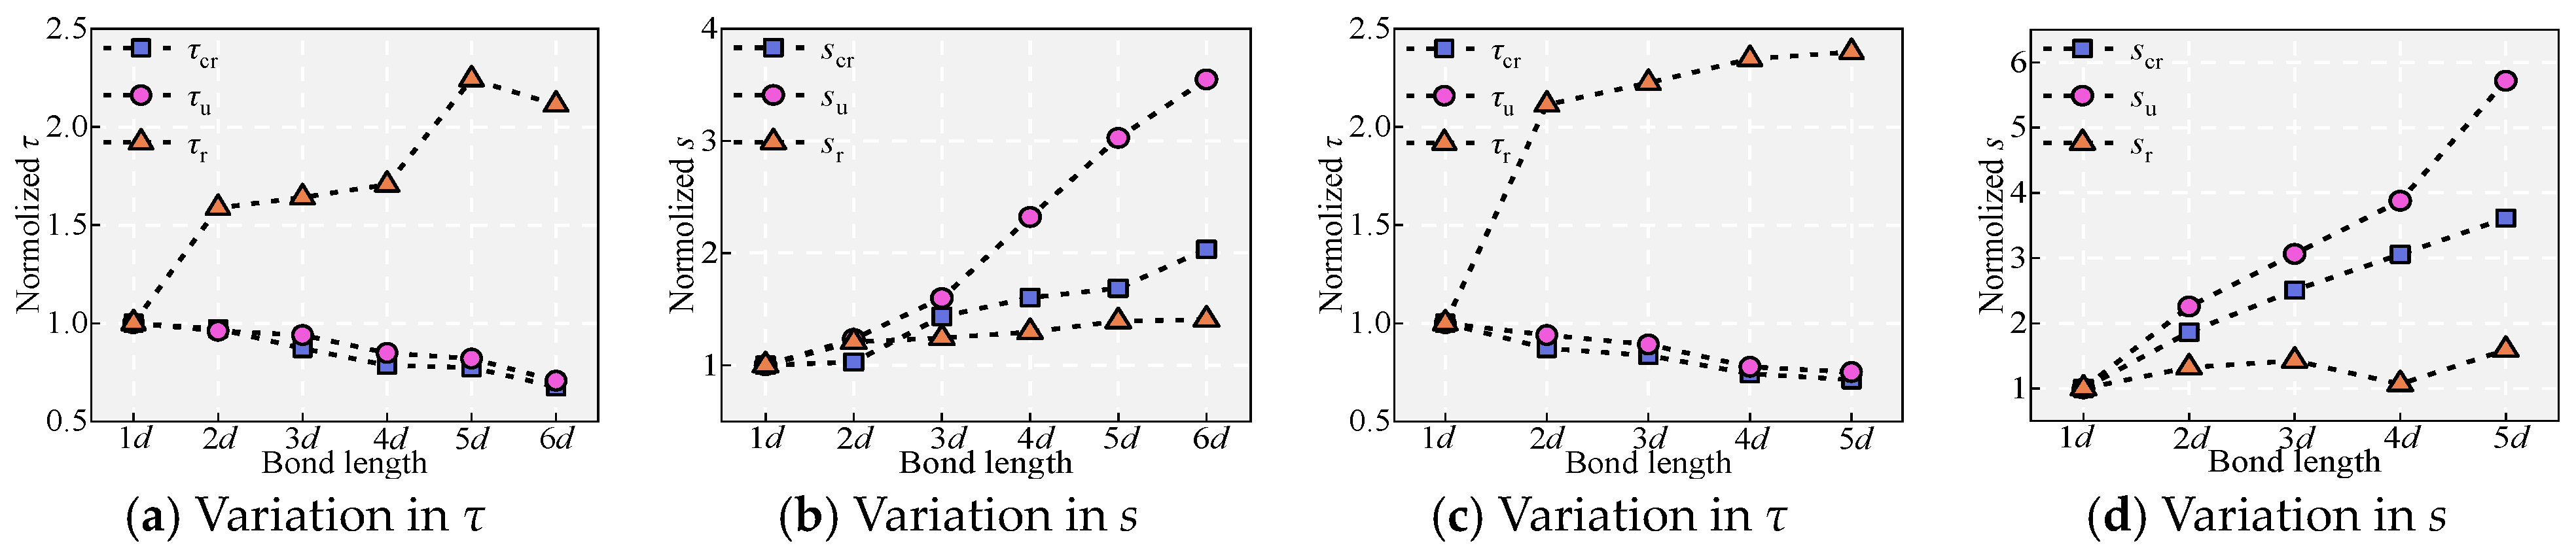
5.5. Effect of the Embedment Length ld
5.6. Effect of Stirrup Spacing ss
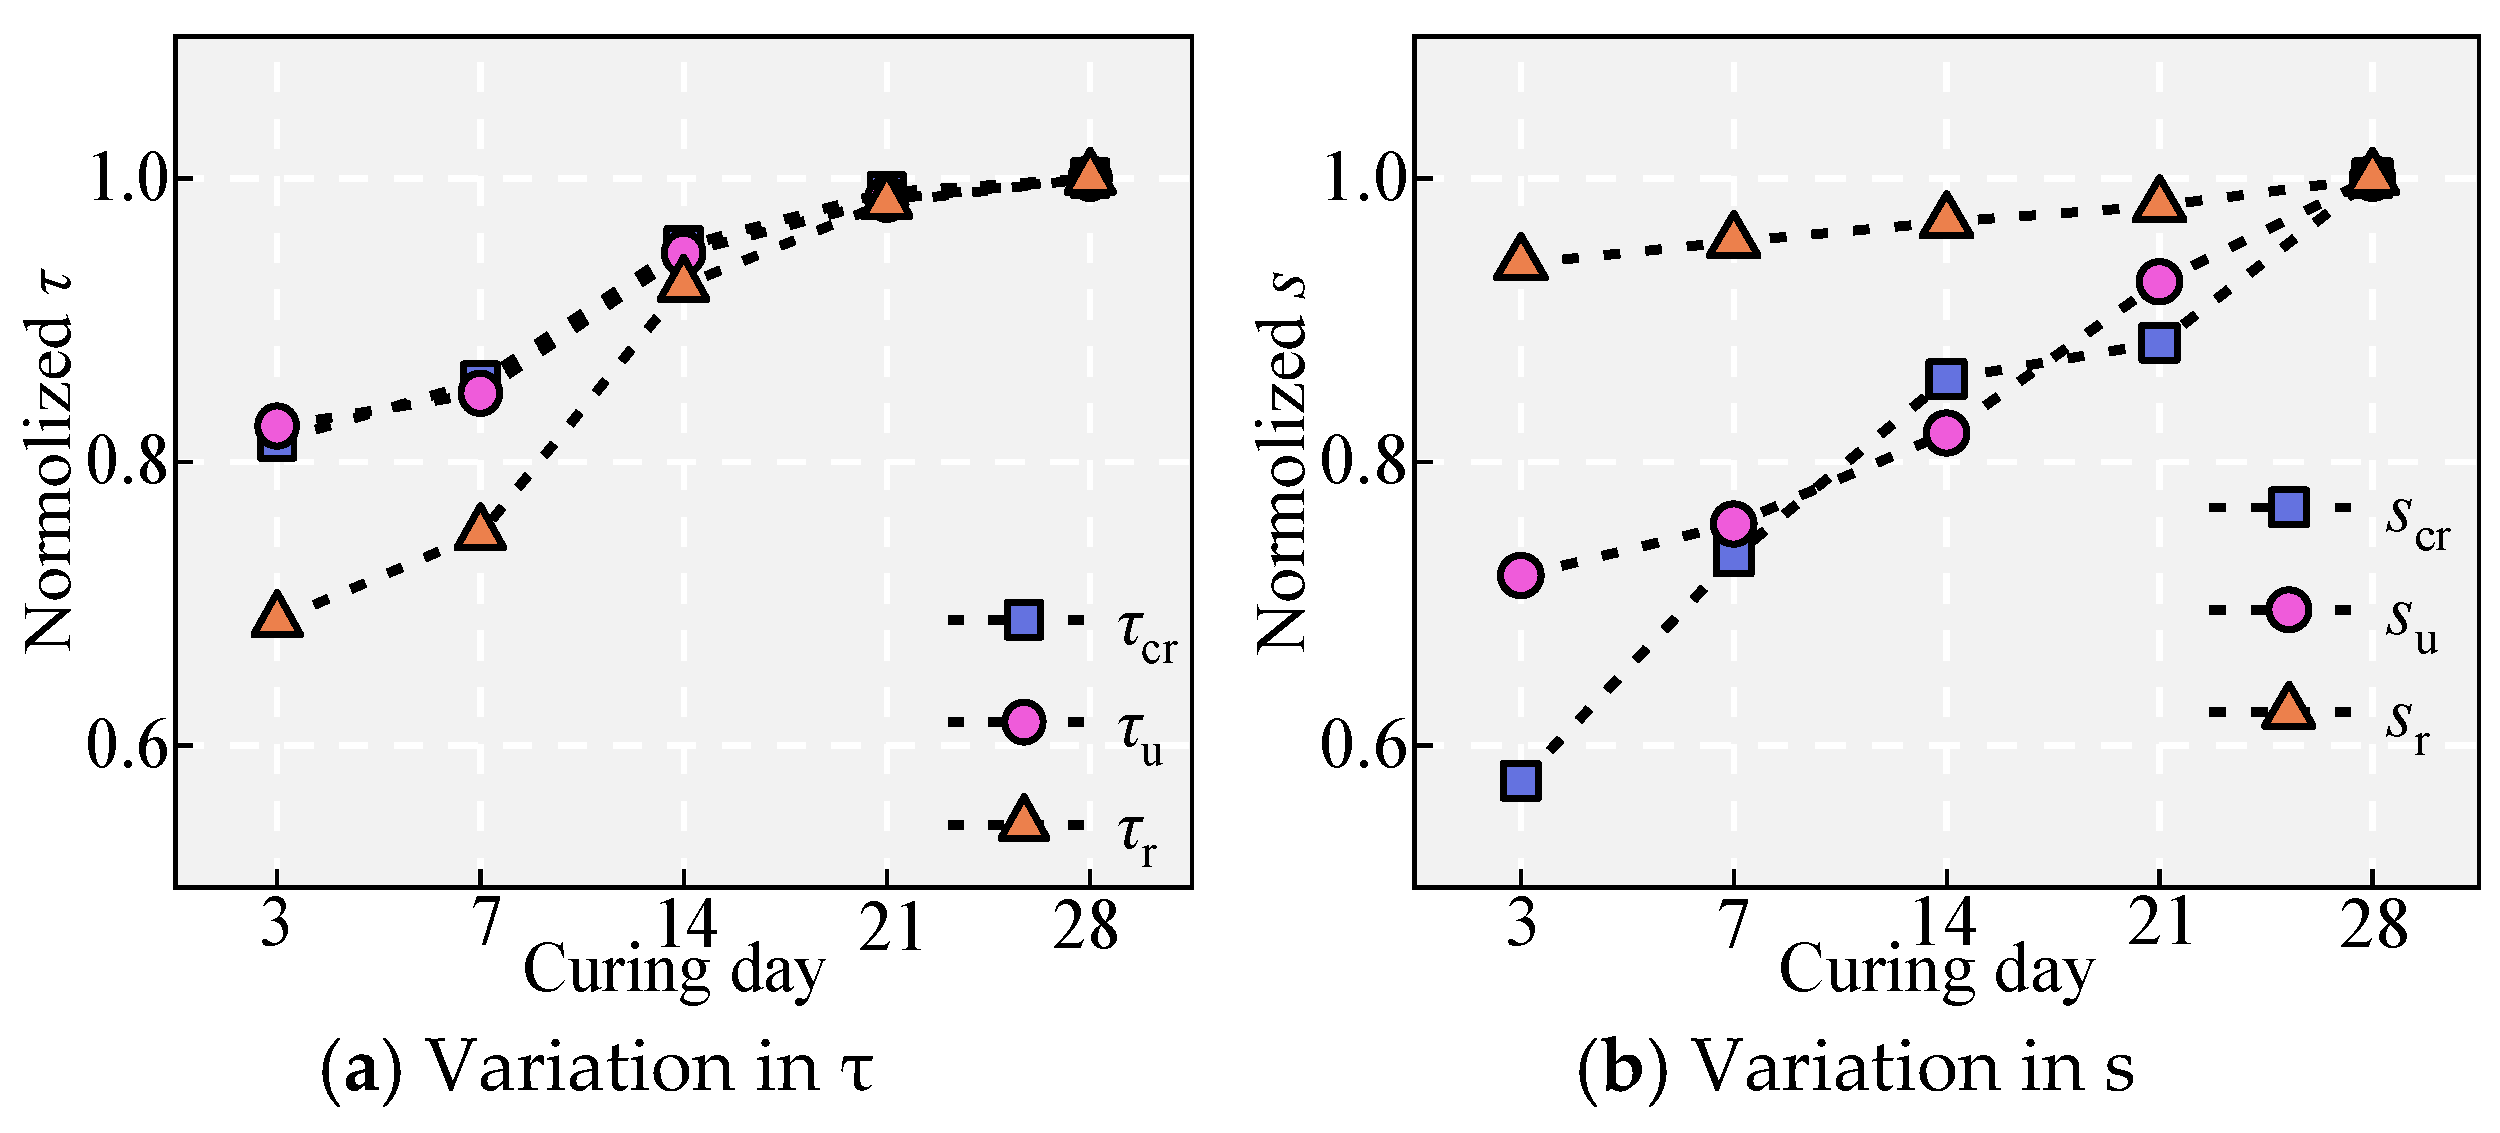
5.7. Effect of Curing Time
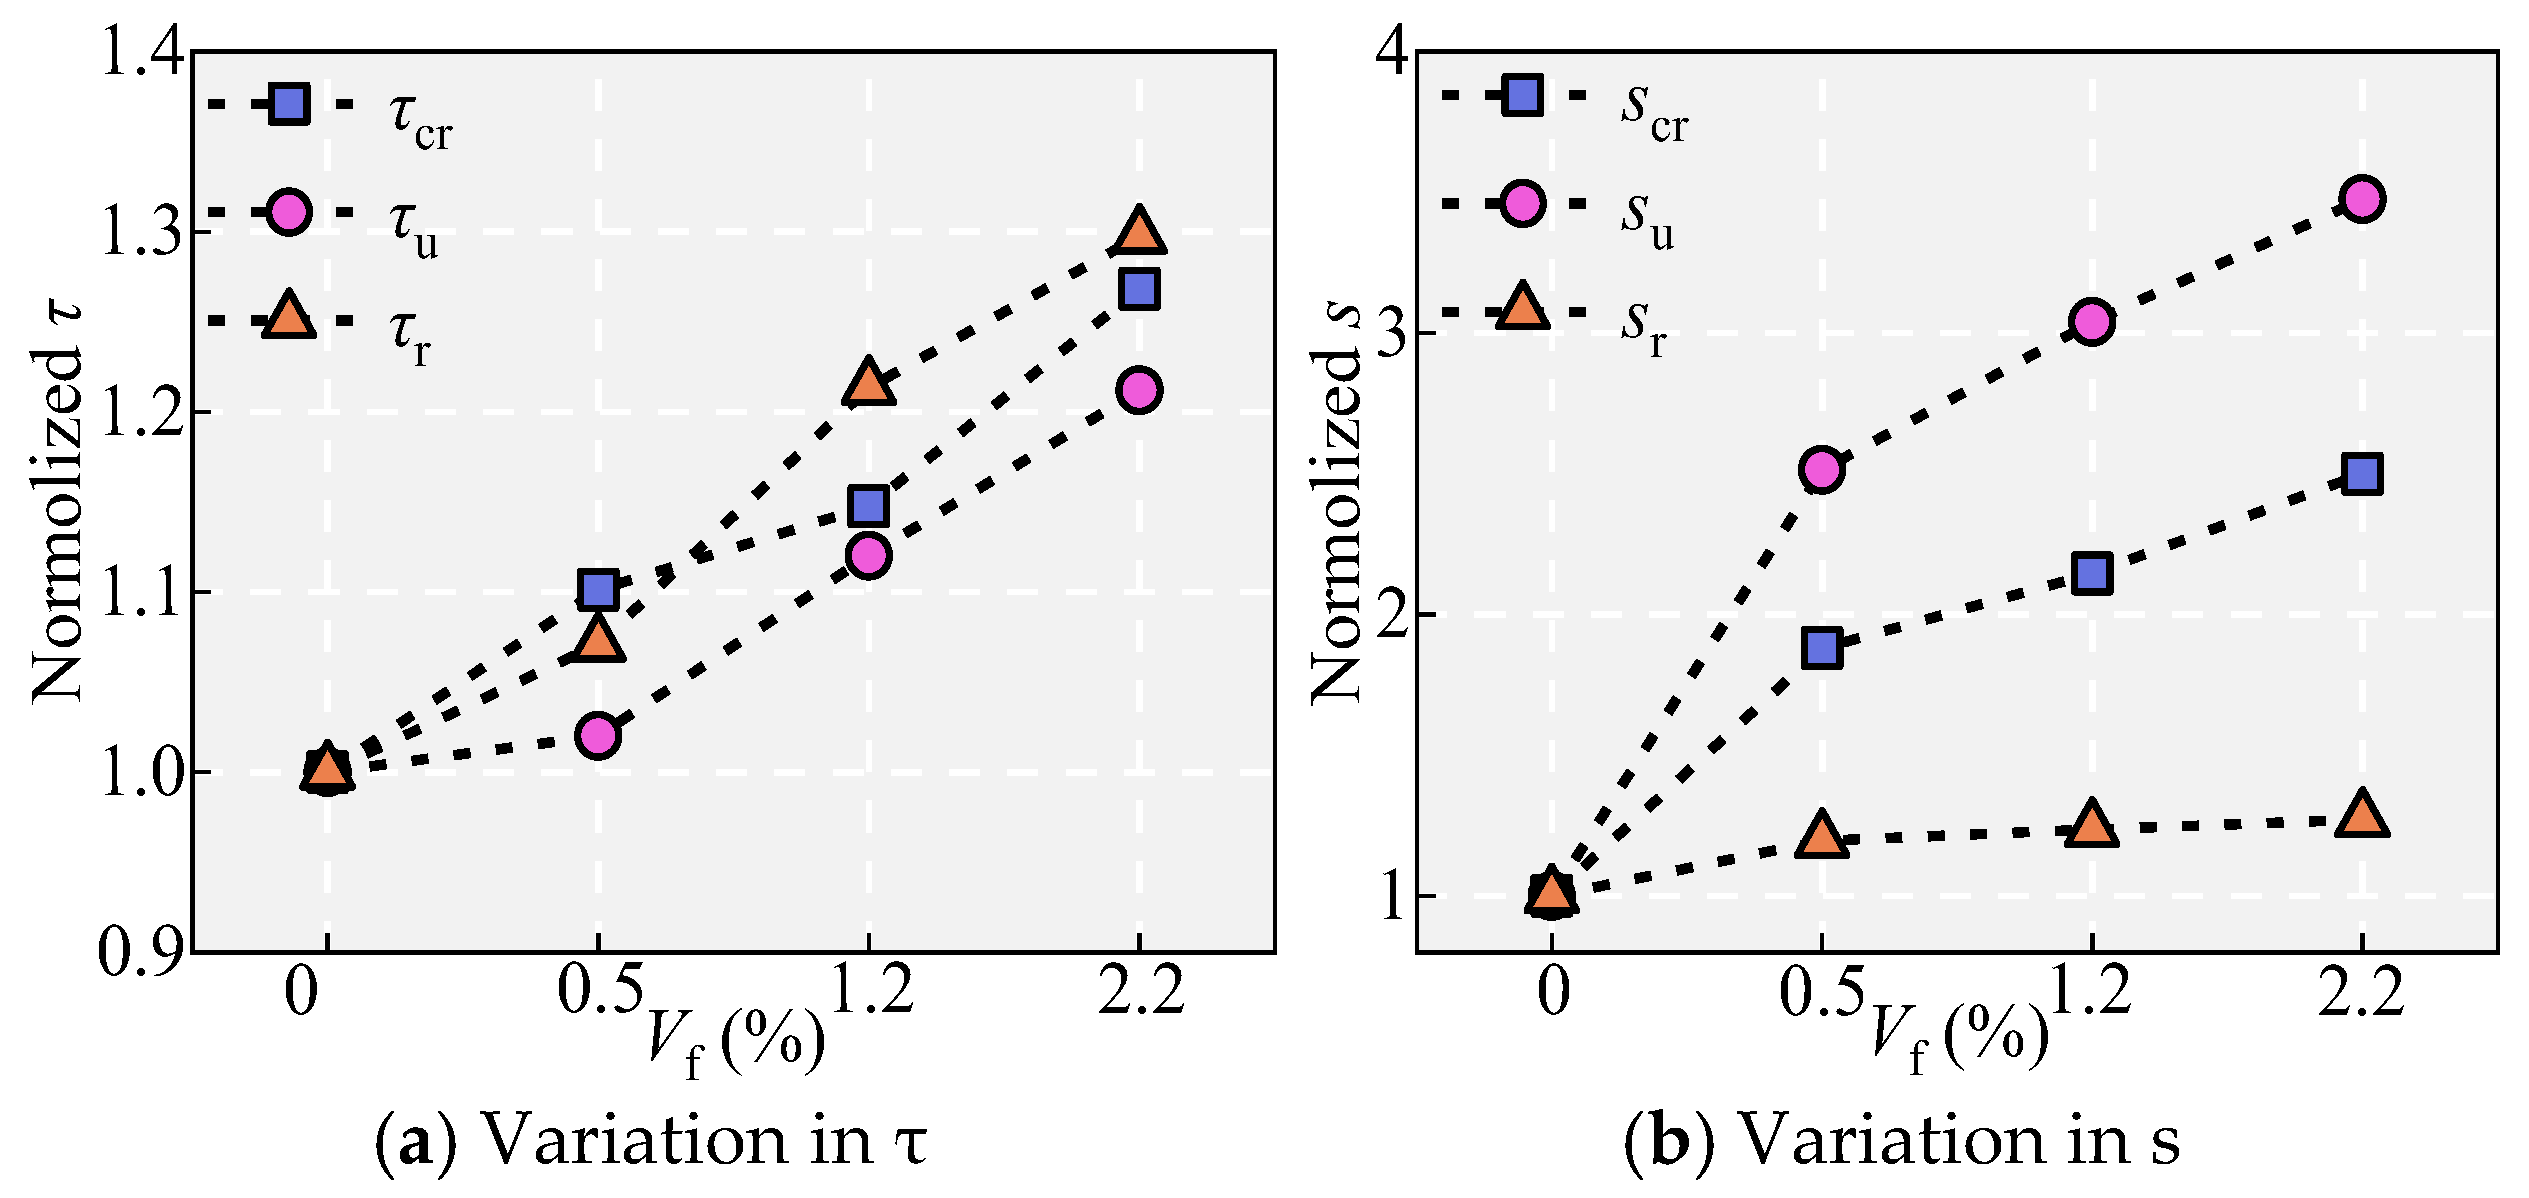
5.8. Effects of the Steel Fiber Volume Vf
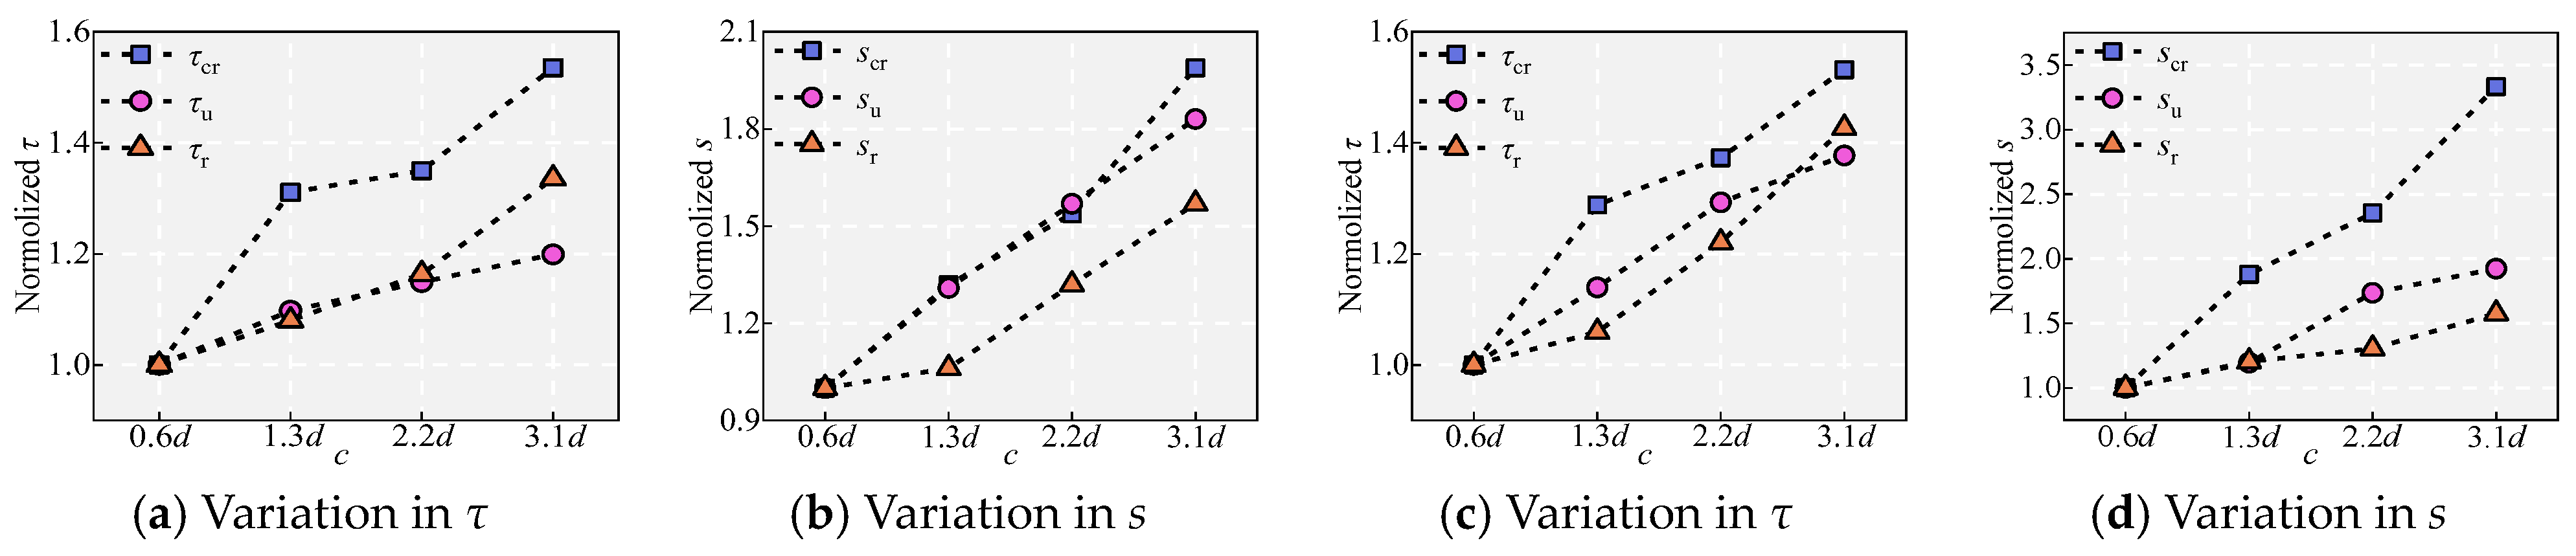
5.9. Effect of the UHPC Cover Depth c
6. Critical Embedded Length lcd and Ultimate Embedded Length lud Models
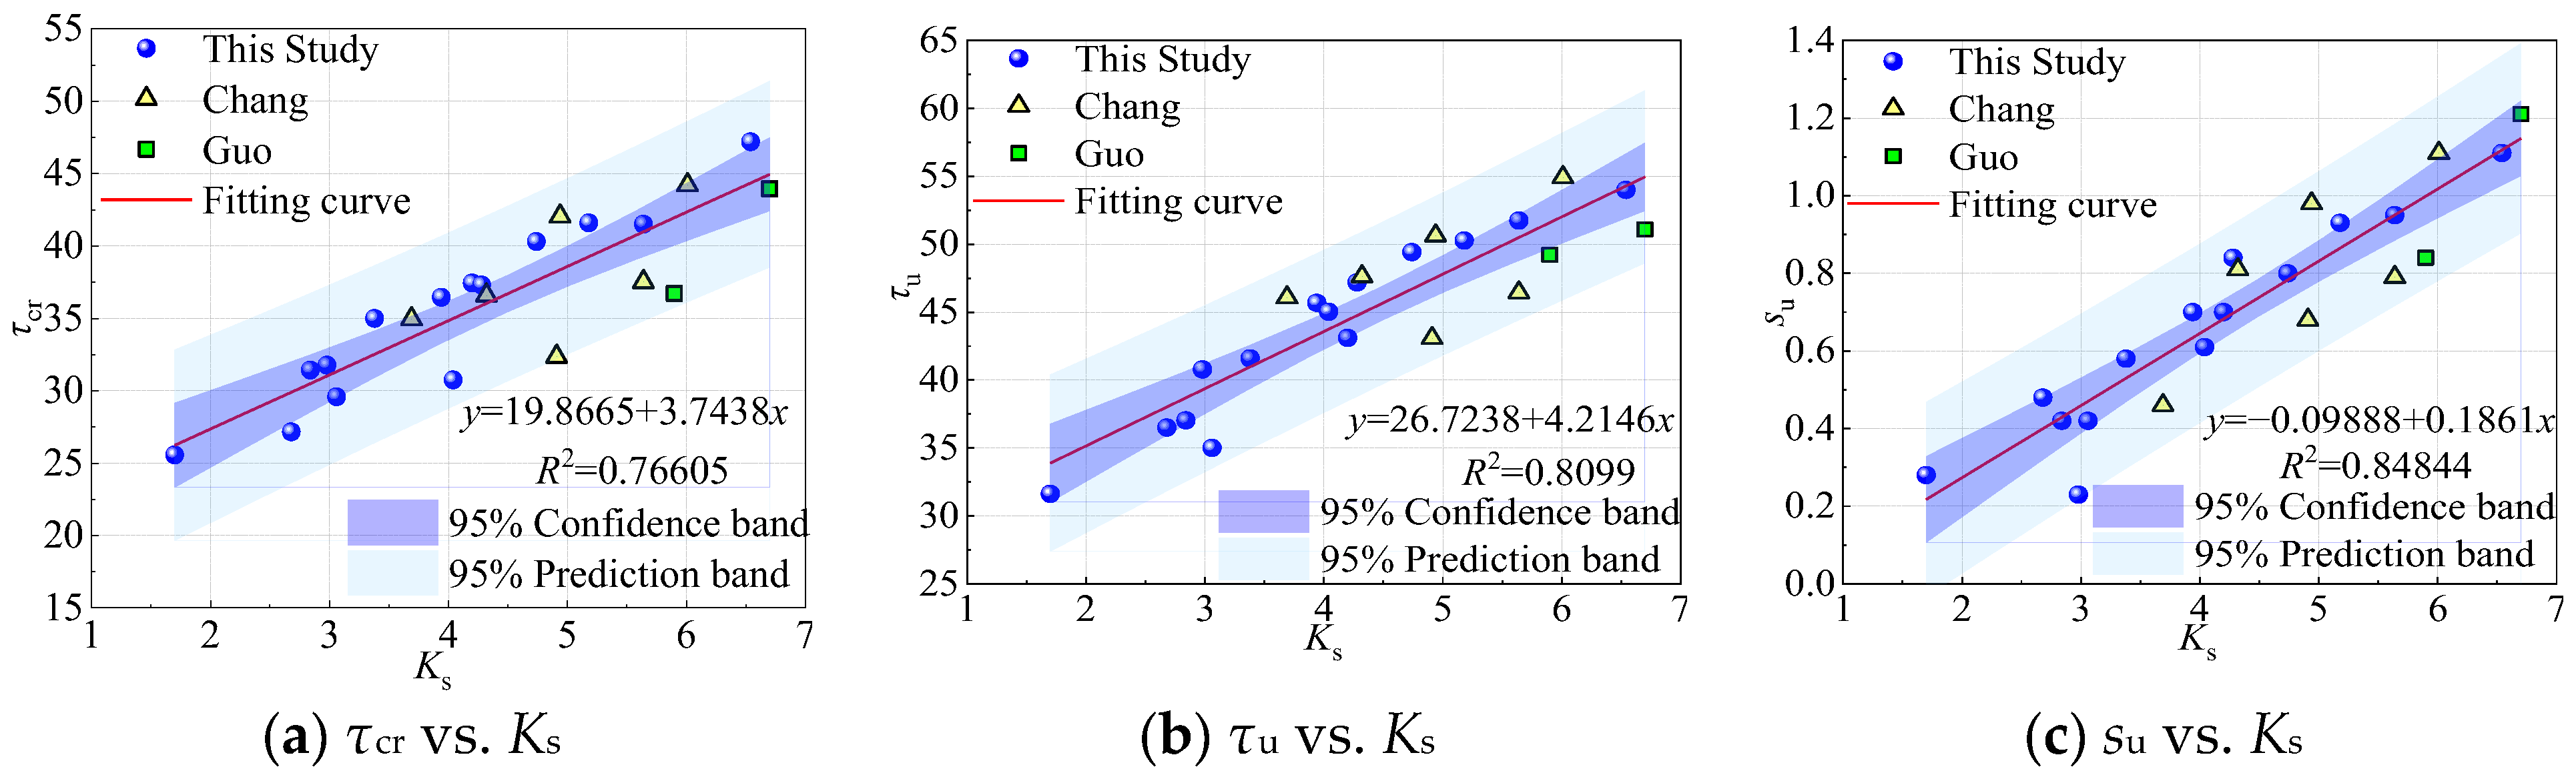
6.1. Multiparameter Regression Model for σsm
6.2. ANN Model for σsm
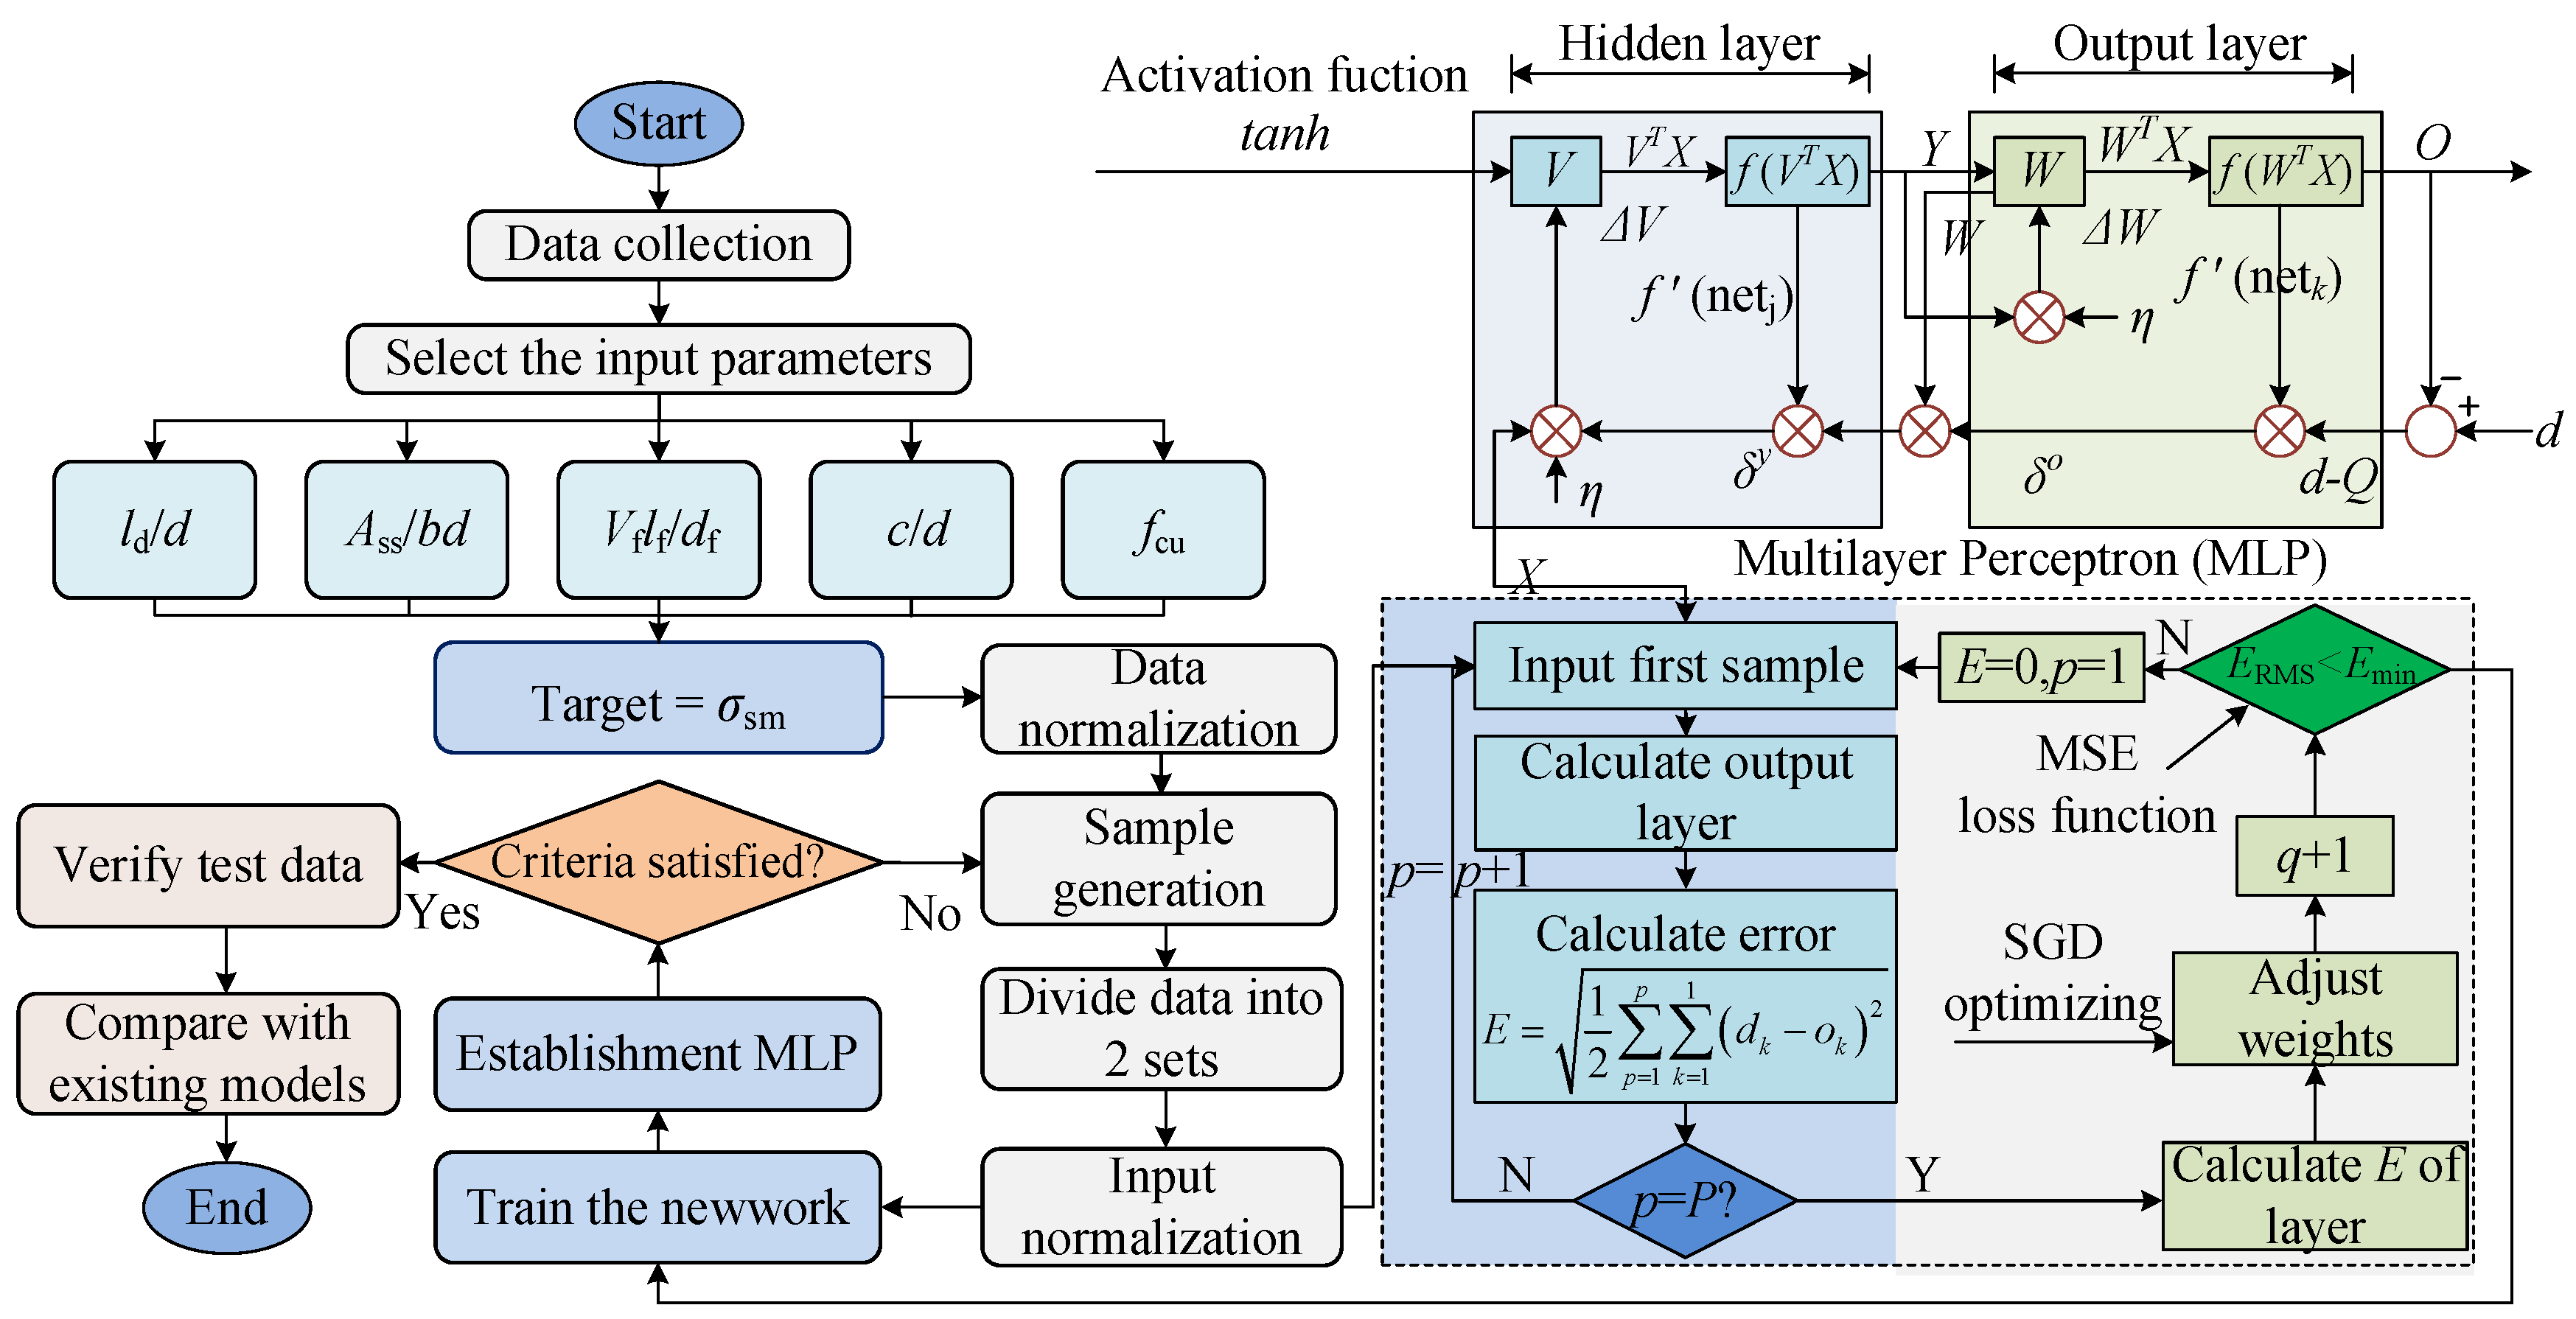
6.2.1. Establishment
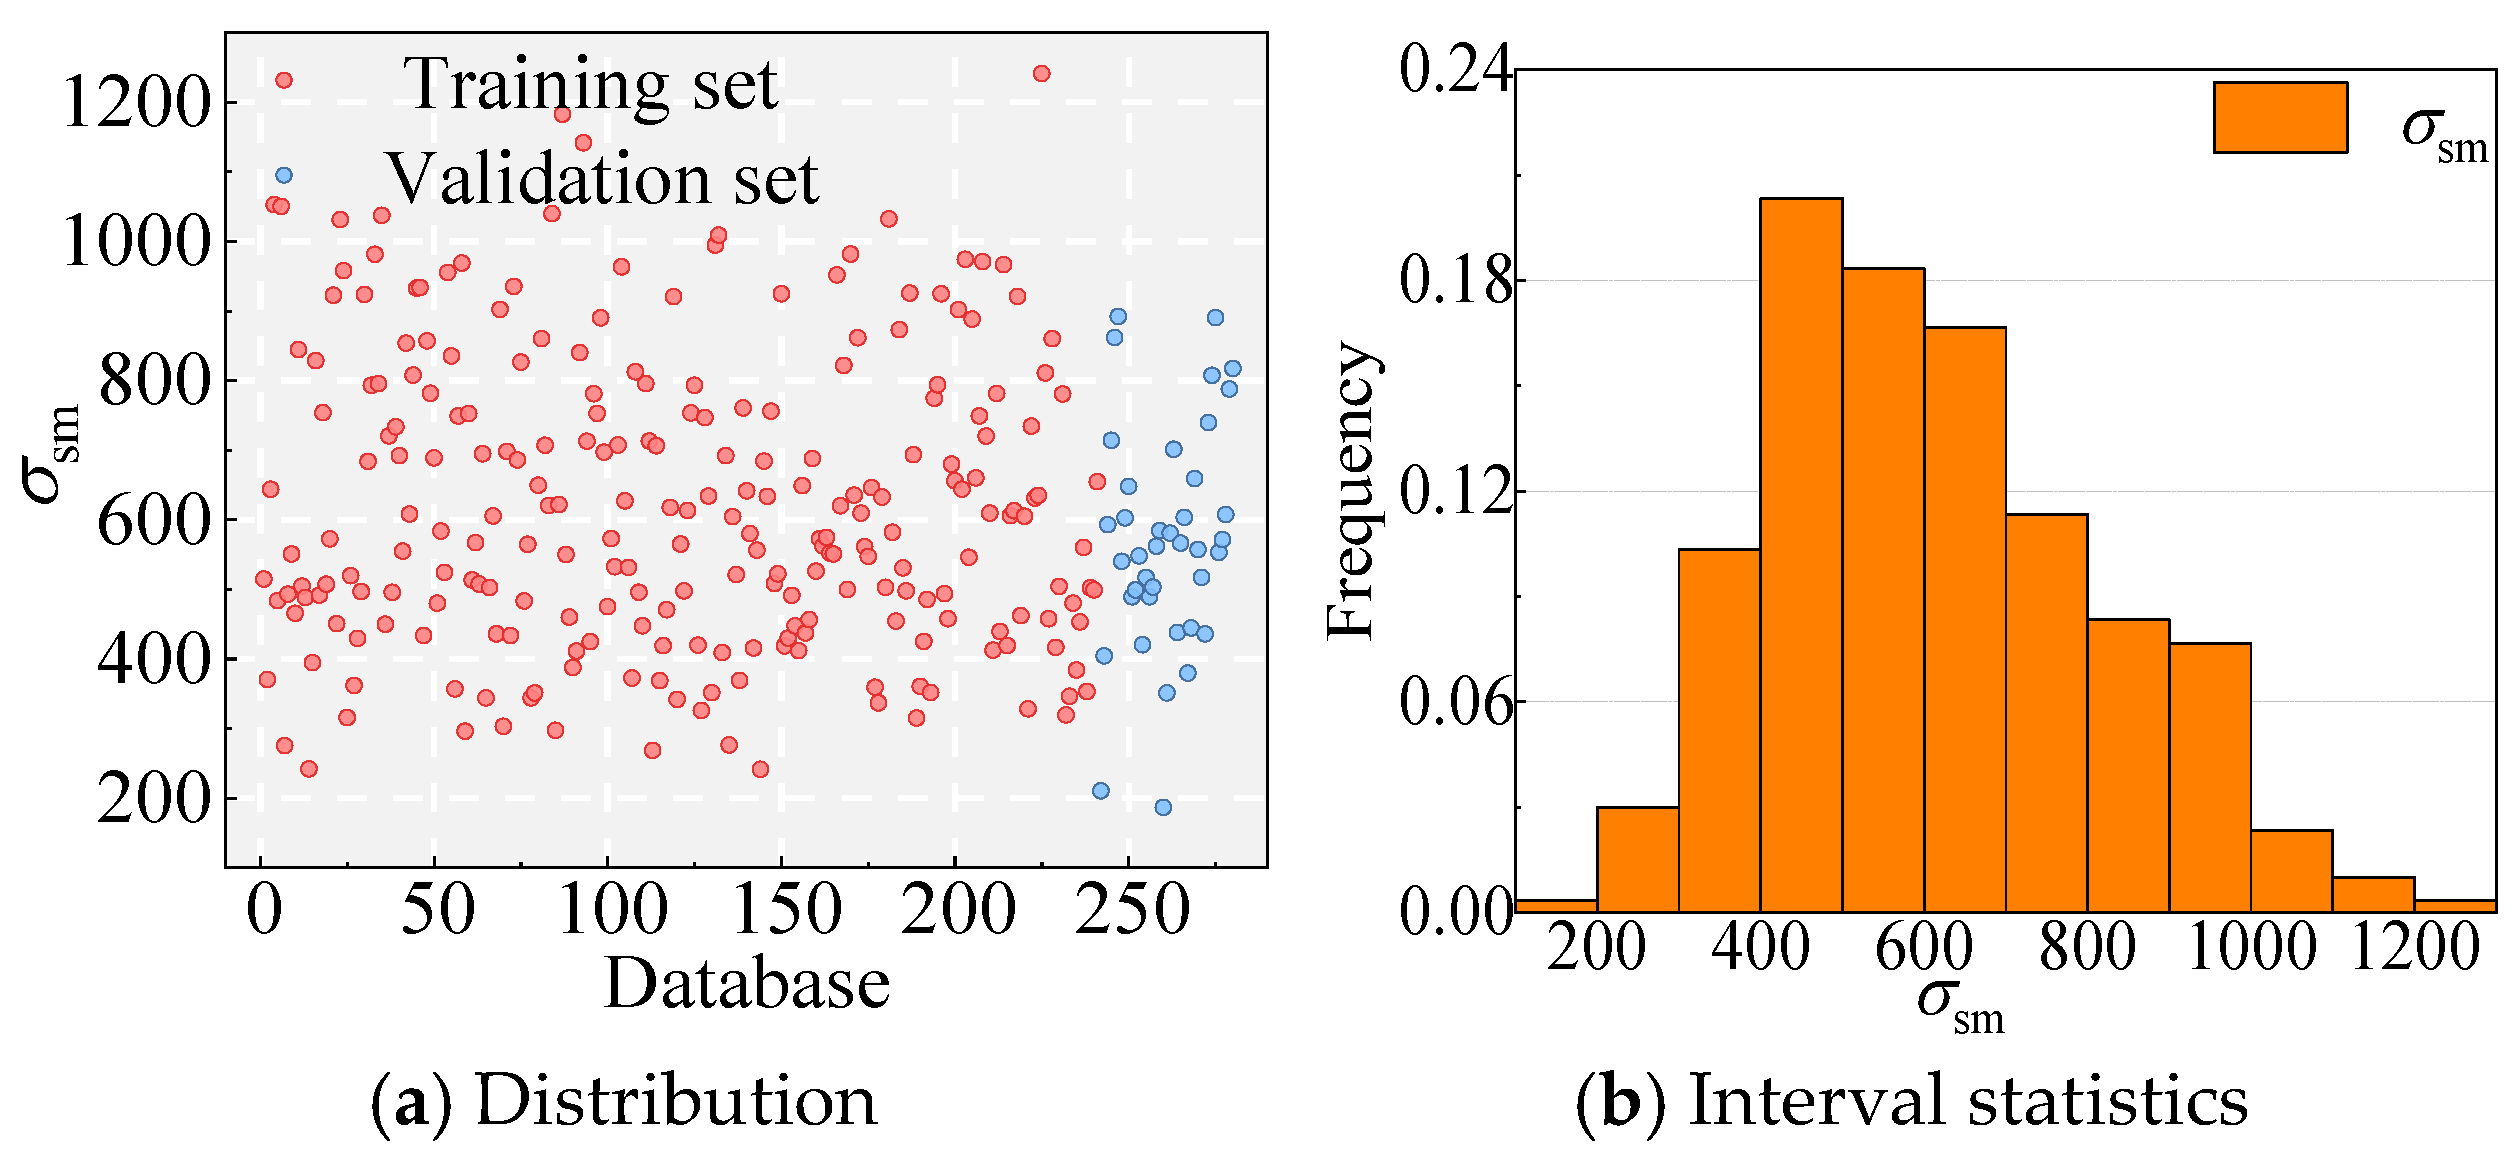
Database
Input and Output
Evaluation Indicators
Modeling
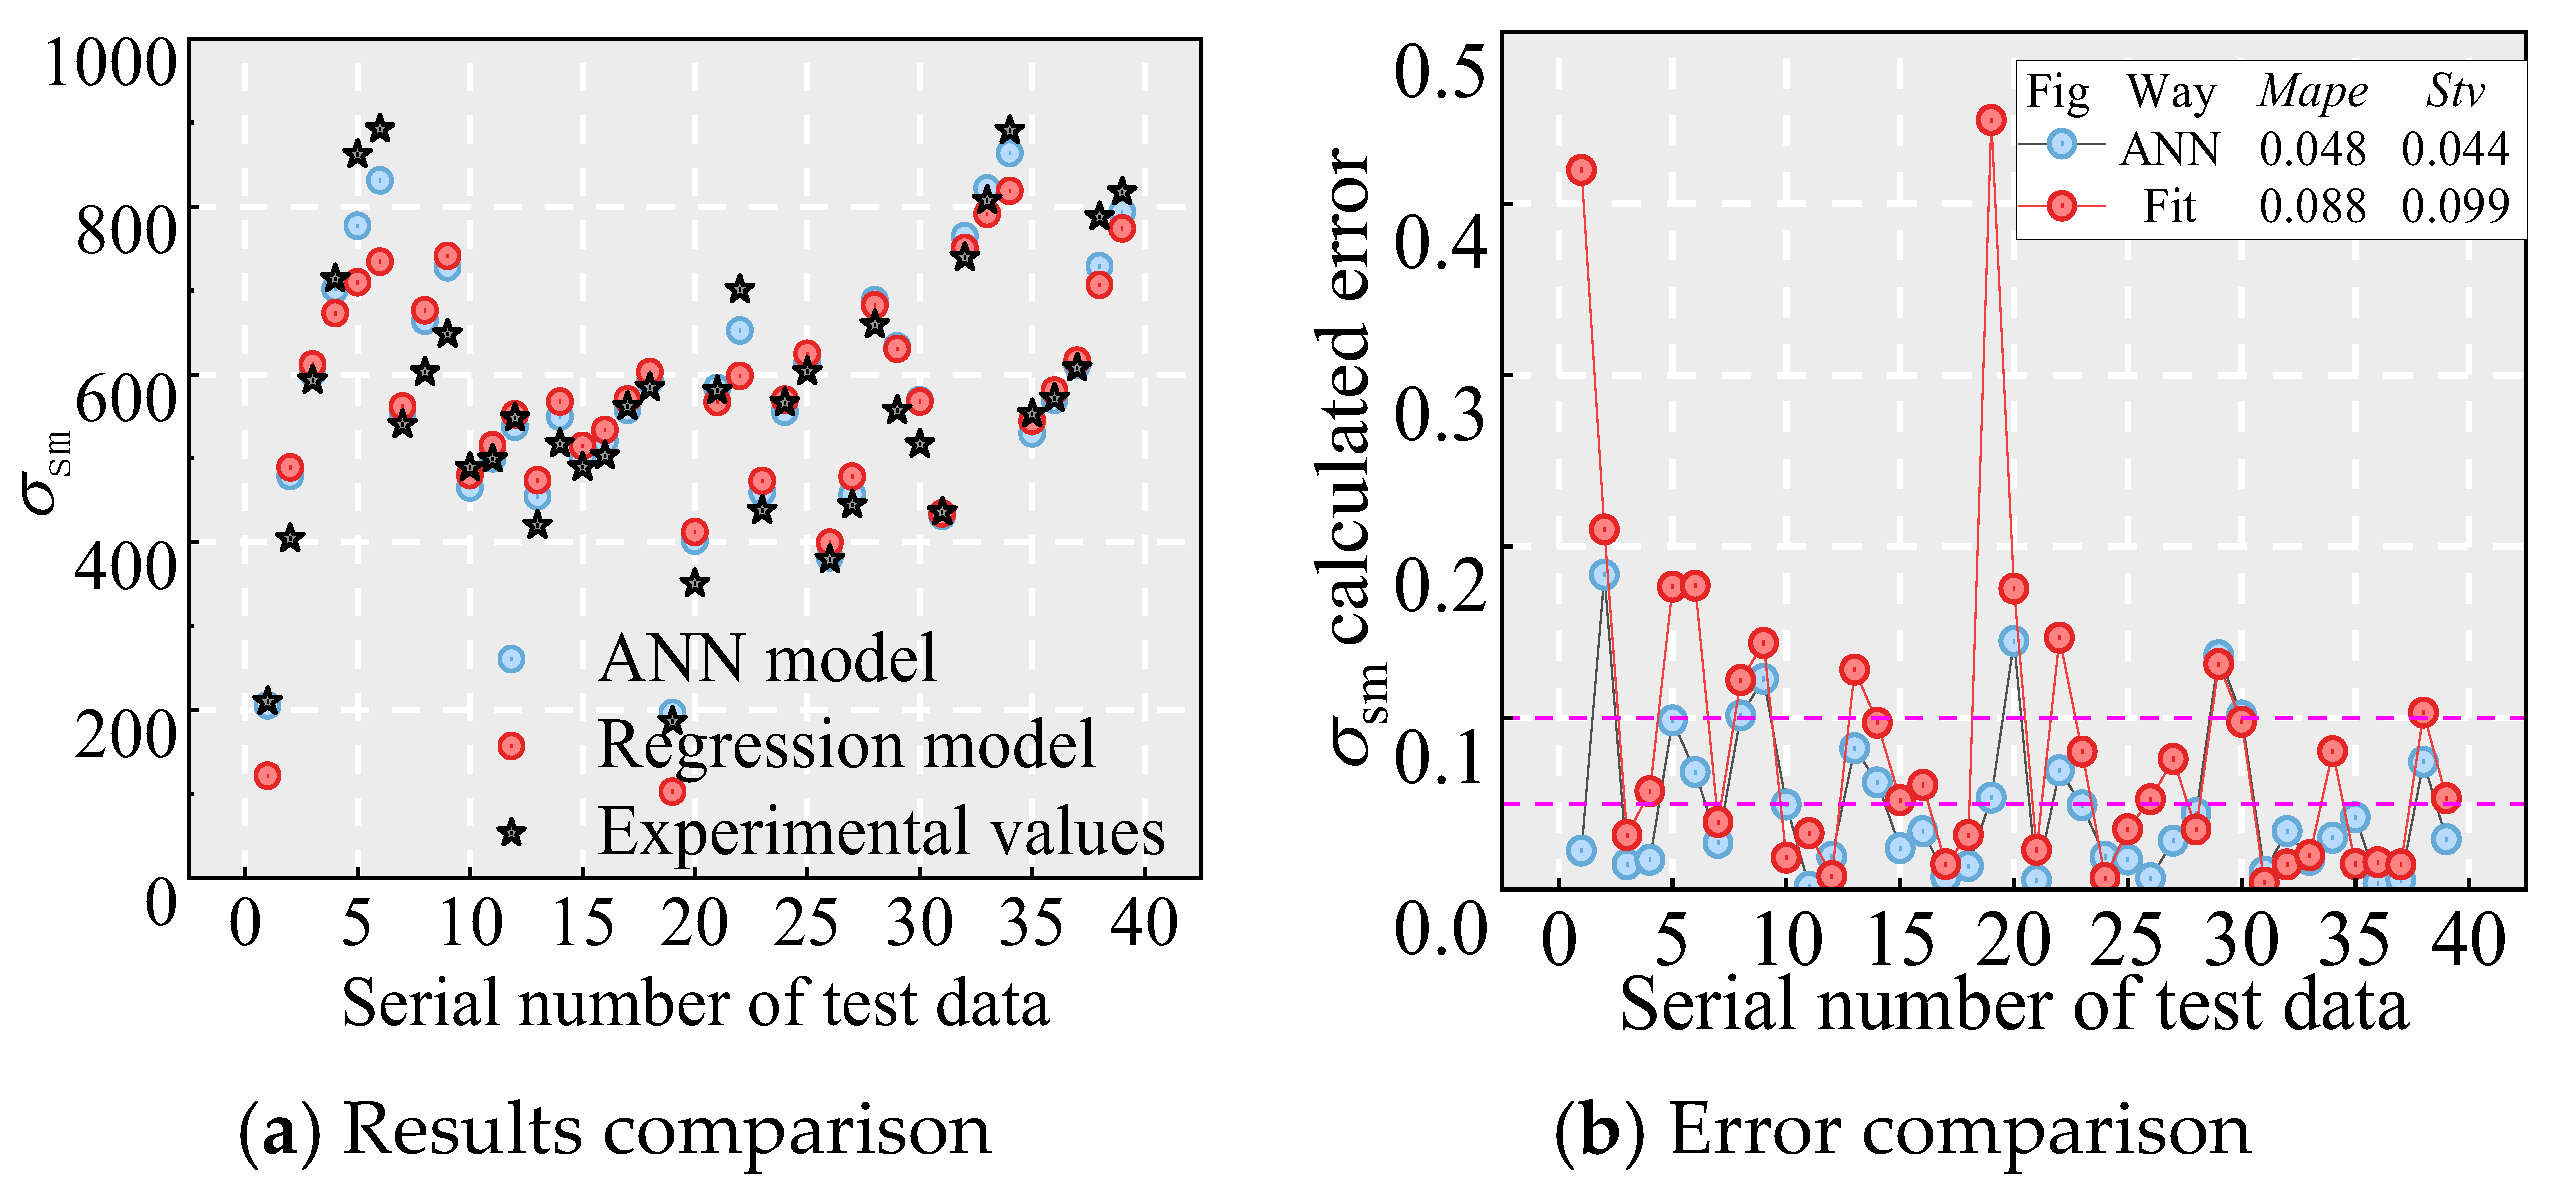
6.2.2. Verification
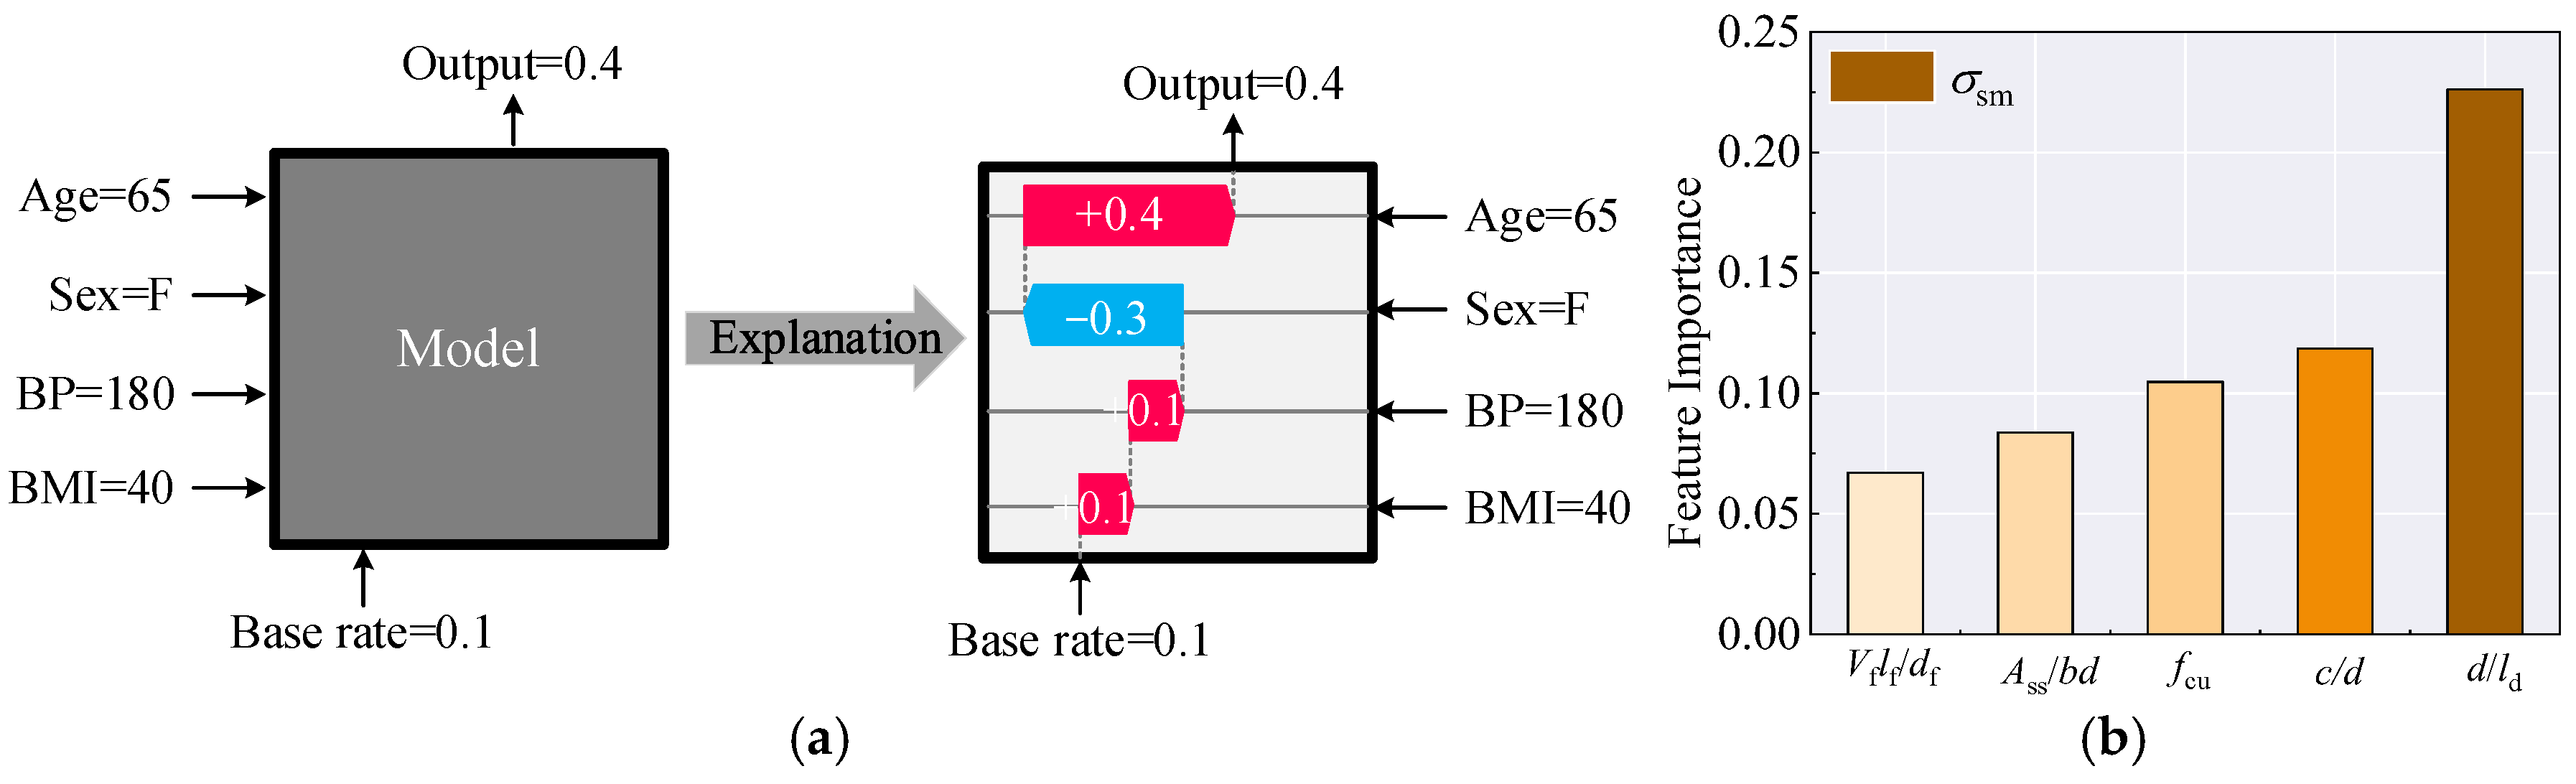
6.2.3. Relative Importance
7. Conclusions
- (1)
- Without stirrup confinement, c/d > 1 (Vf ≥ 2%) can be considered the minimum cover thickness to prevent splitting failure. With stirrup confinement (ρss ≥ 1.14), c/d ≥ 0.63 (Vf ≥ 0.5%) can be considered the minimum cover thickness to prevent splitting failure.
- (2)
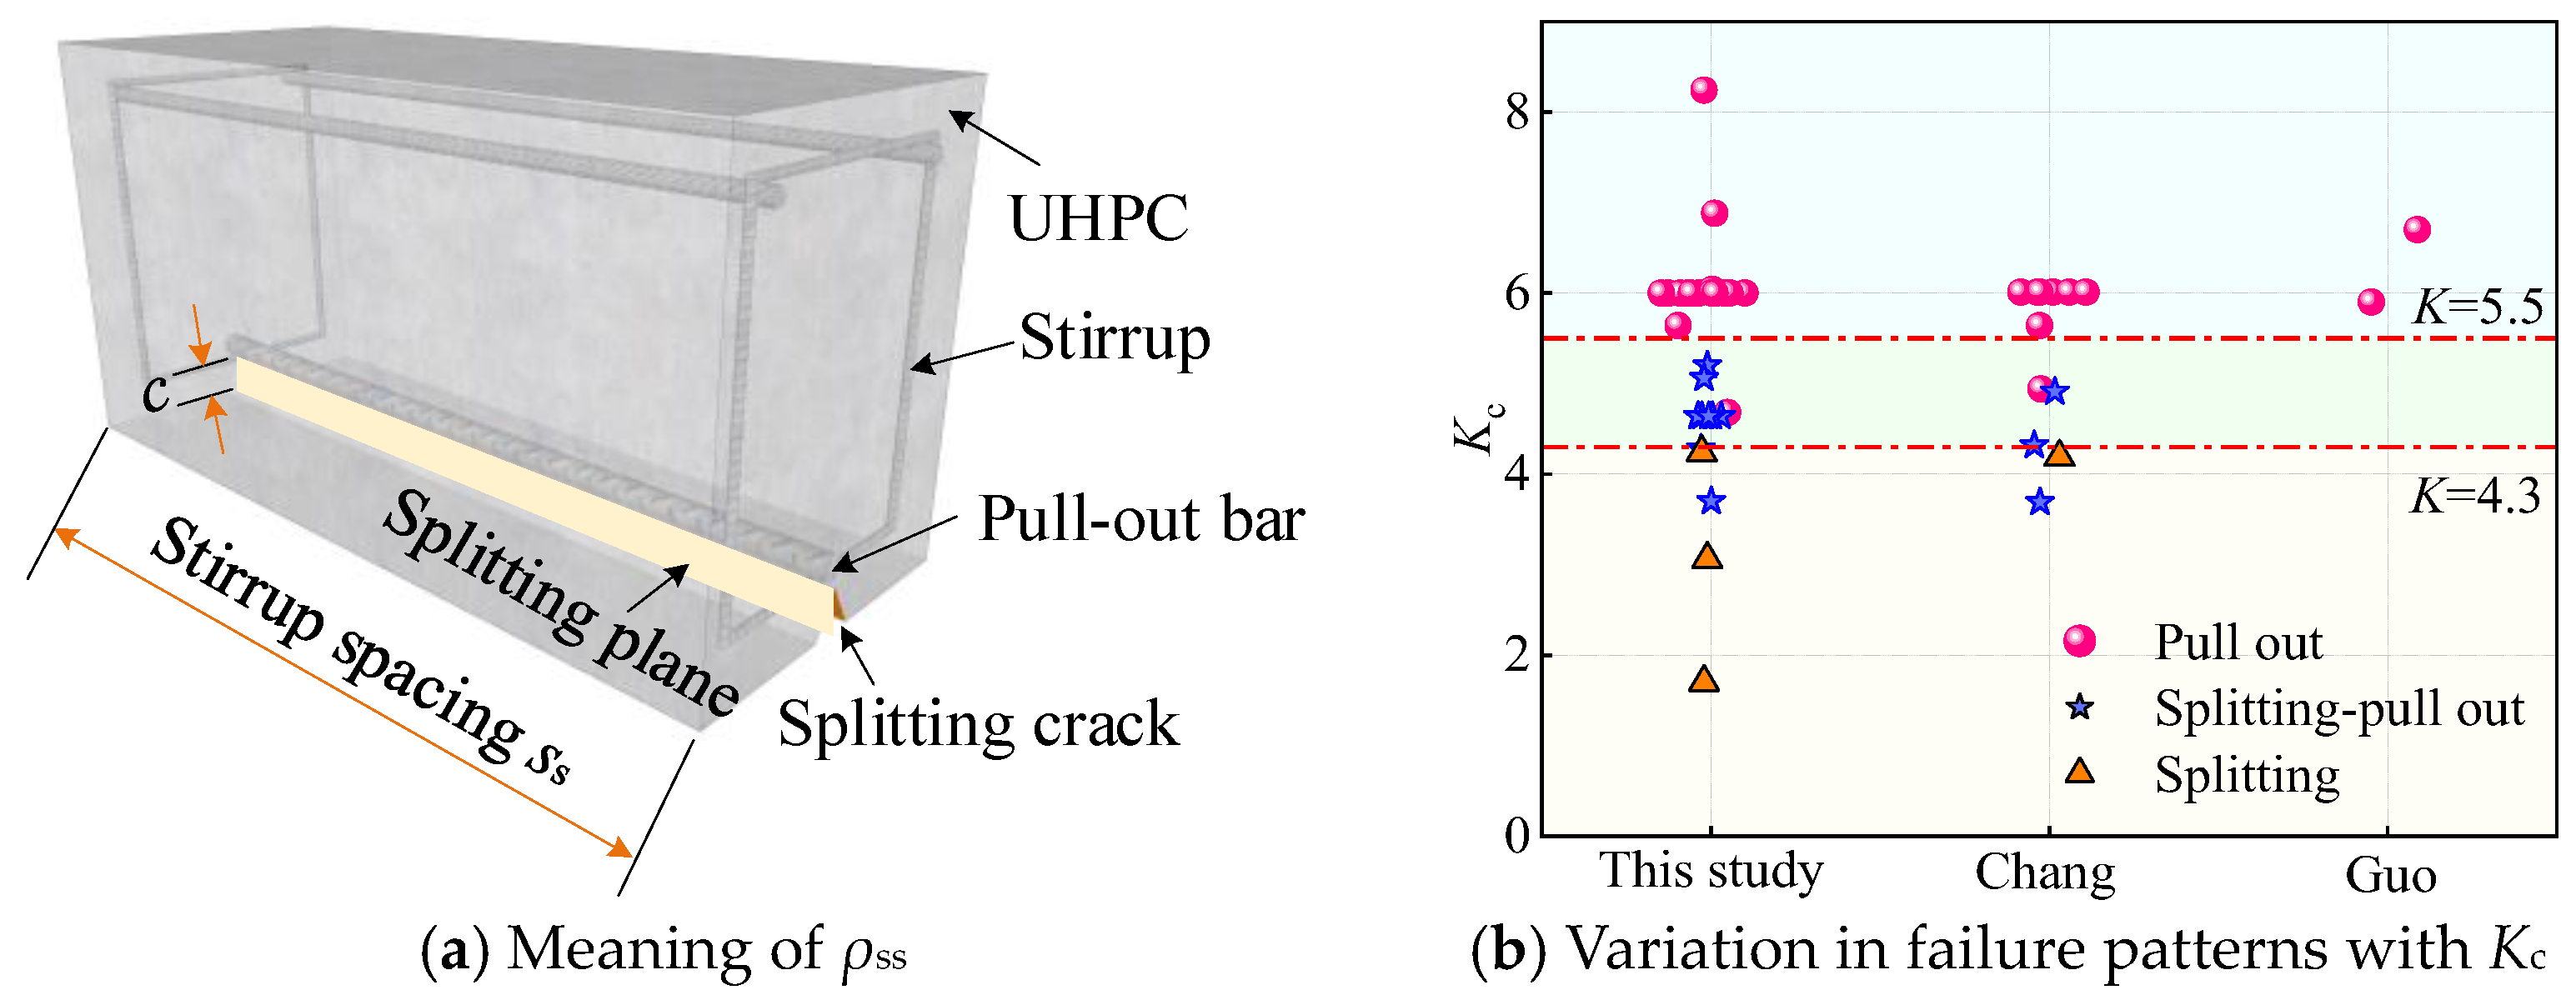
- For UHPC application, the modified constraint parameter Kc is proposed as the discrimination index to characterize the failure type in this study. Kc is a combined constraint parameter determined by the stirrups, cover depth, and steel fibers. When Kc ≤ 4.3, the NPR-UHPC specimens undergo splitting failure. When 4.3 < Kc ≤ 5.64, the NPR-UHPC specimens undergo splitting–pull-out failure. When Kc ≥ 5.6, the NPR-UHPC specimens undergo pull-out failure.
- (3)
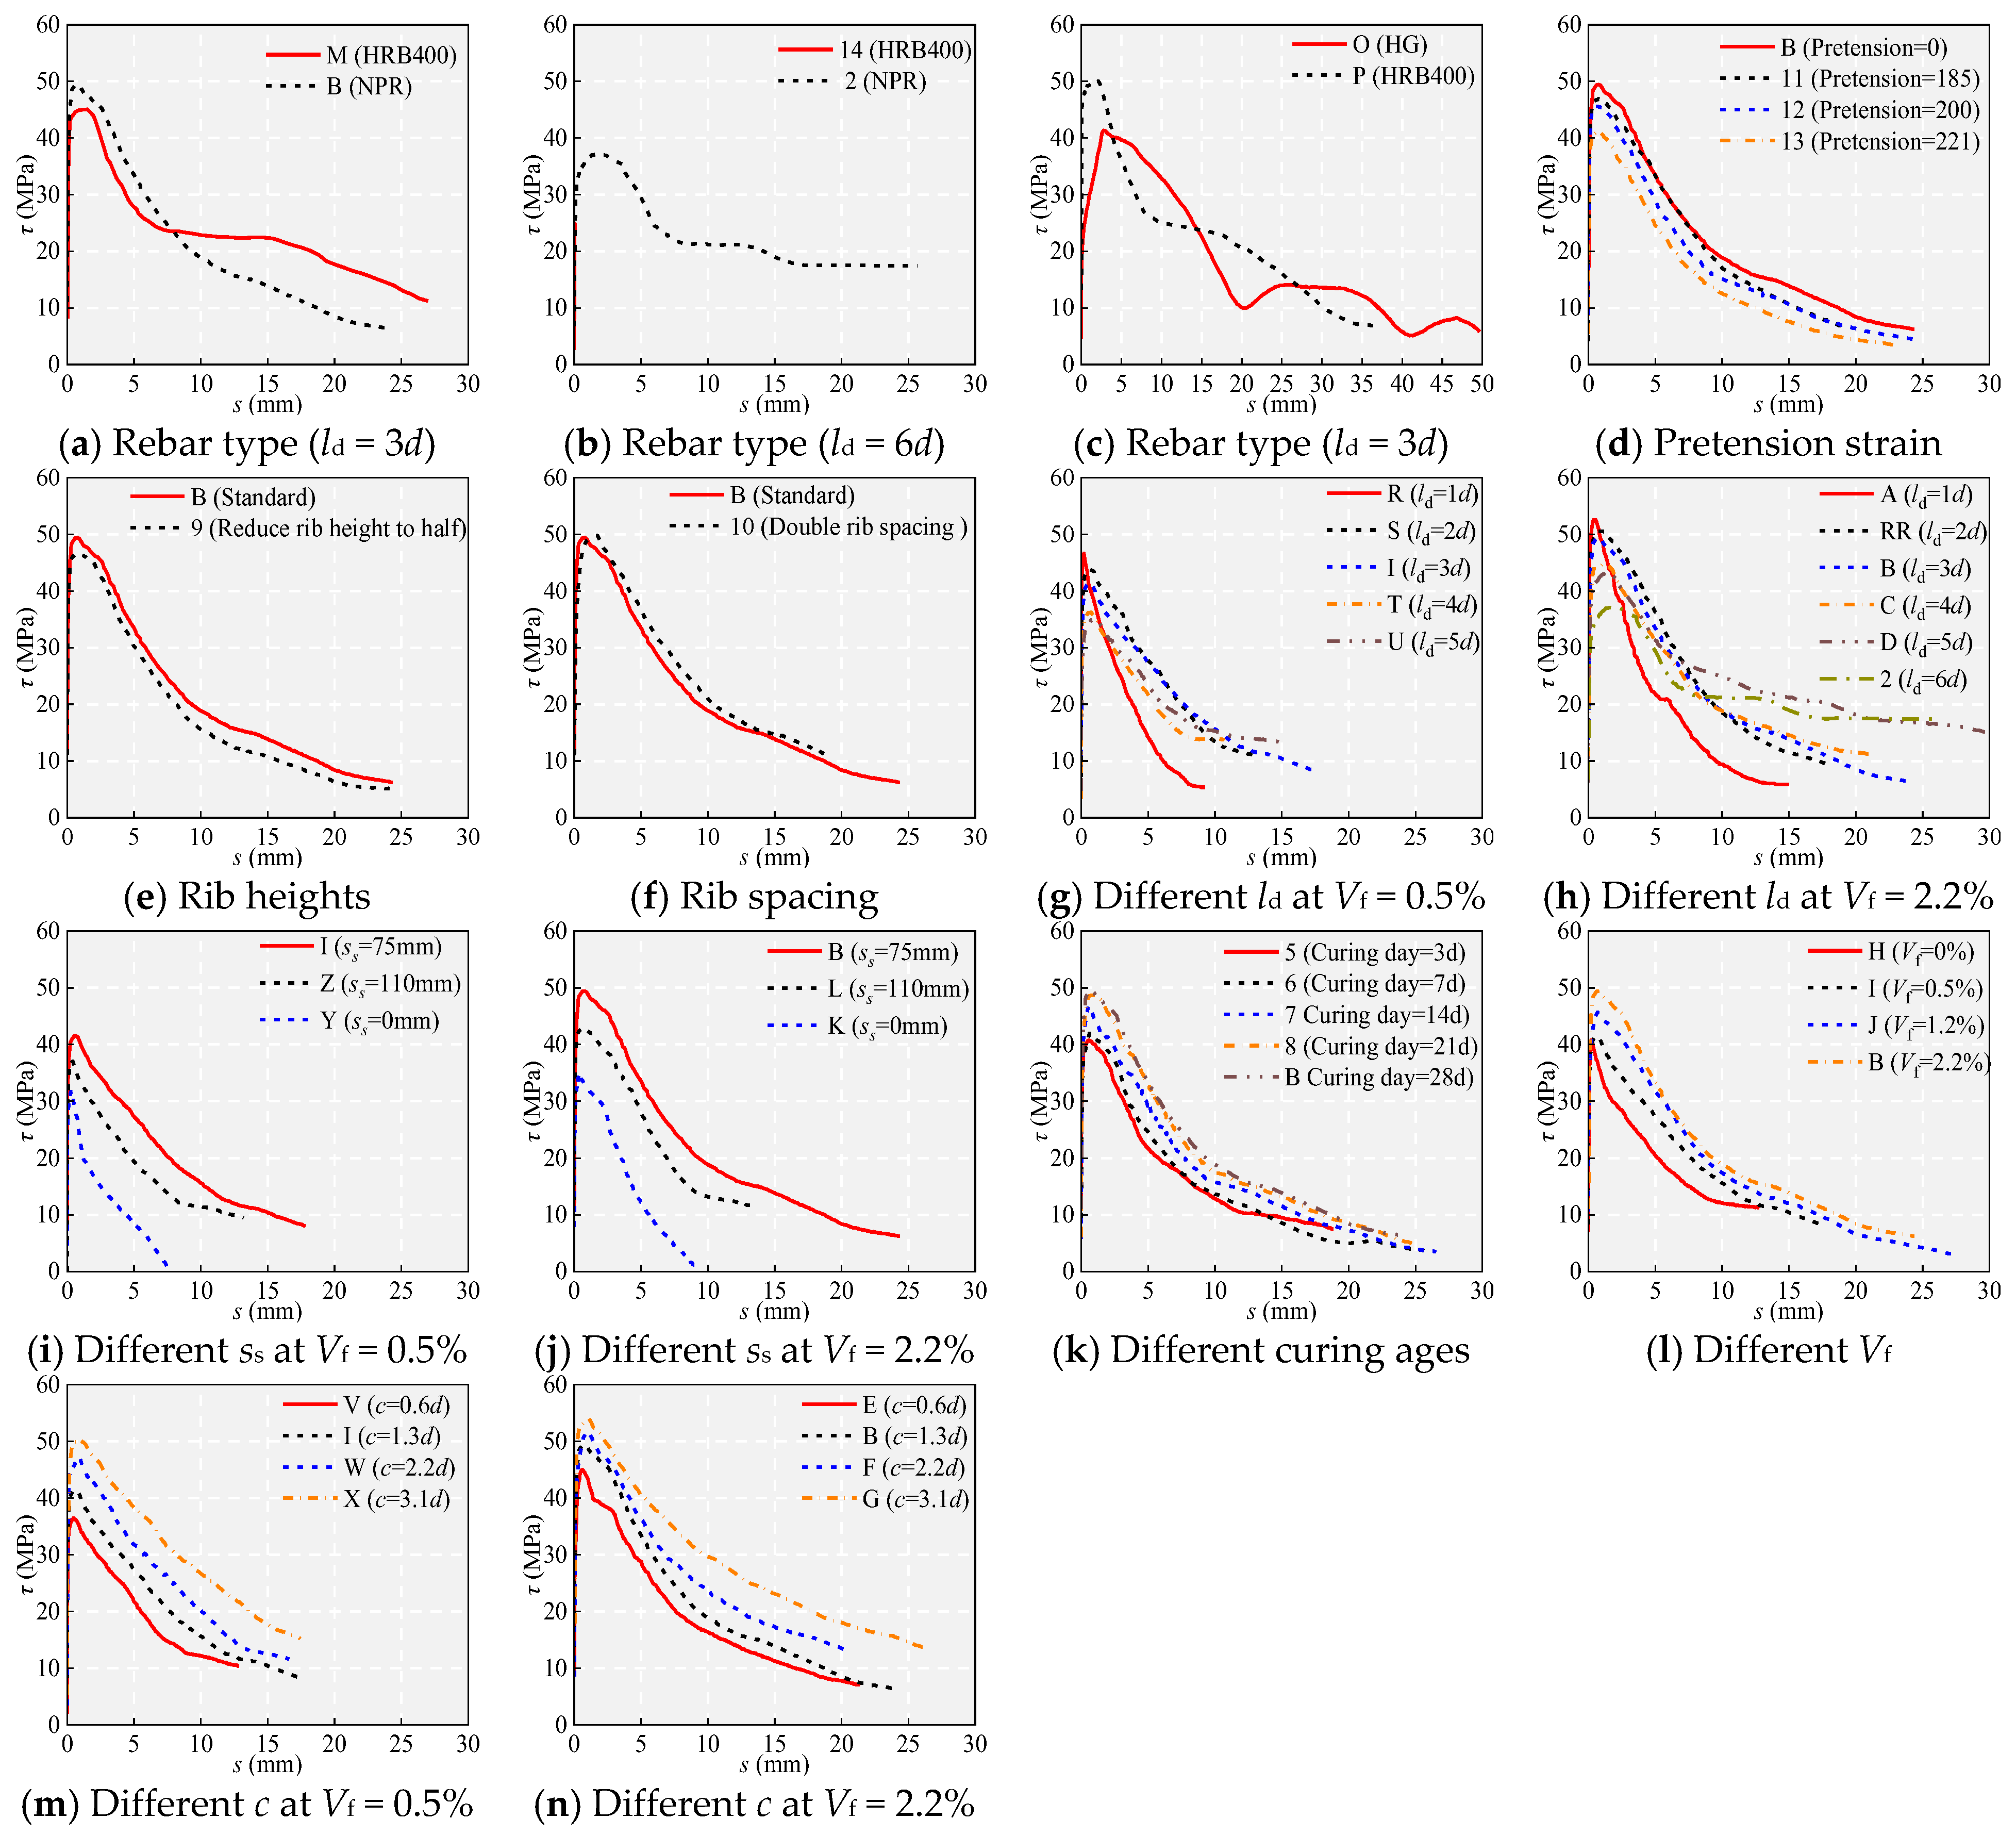
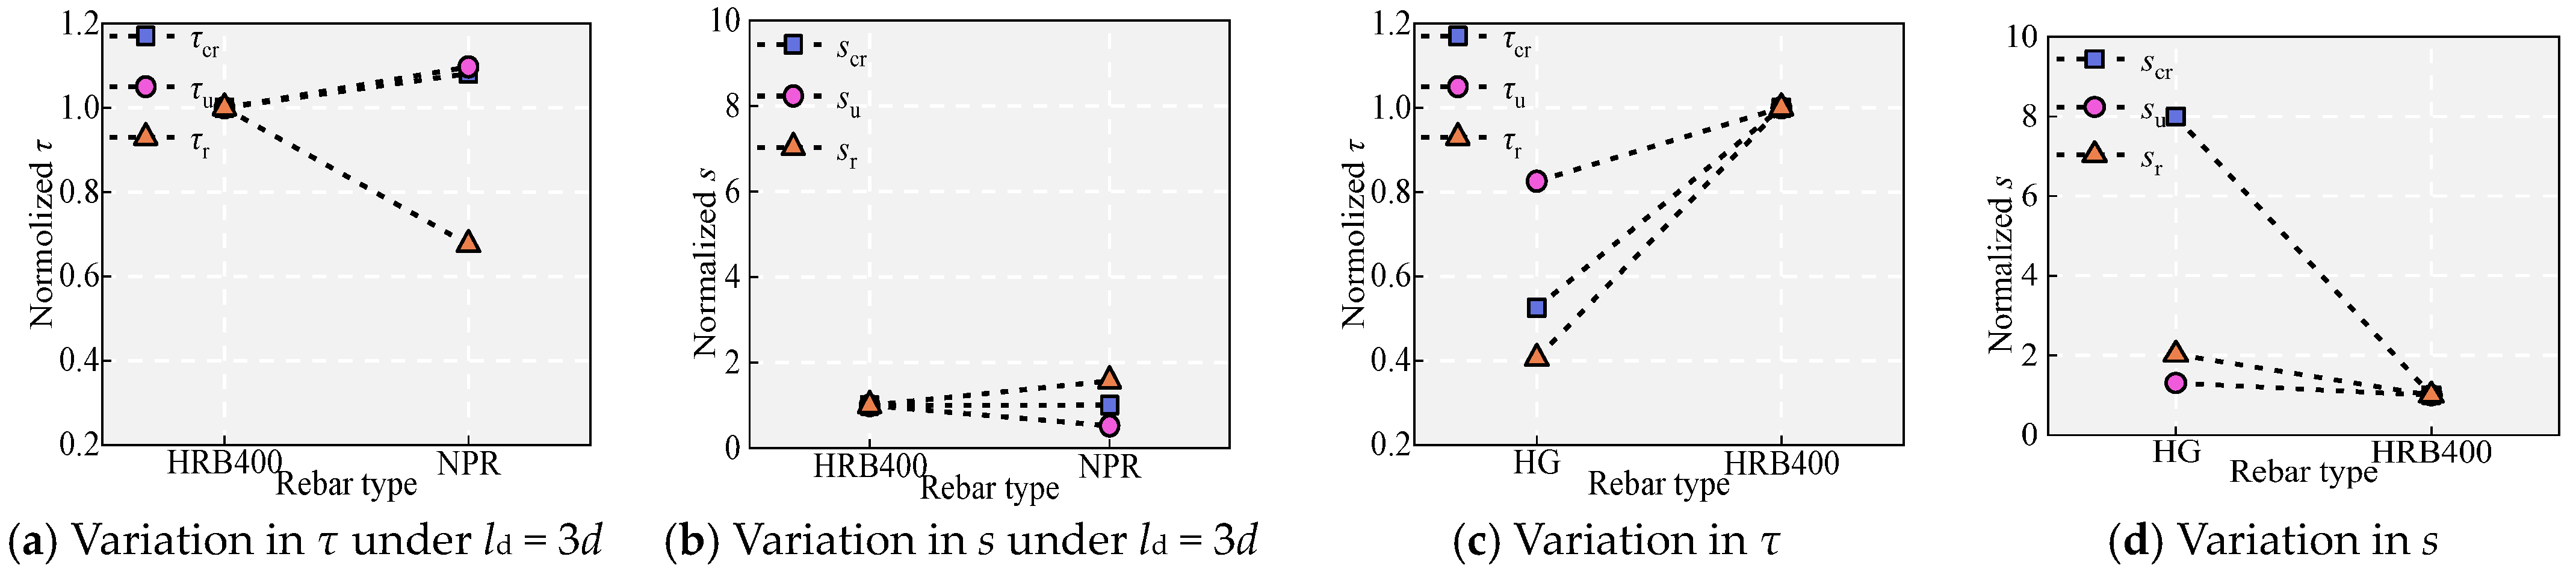
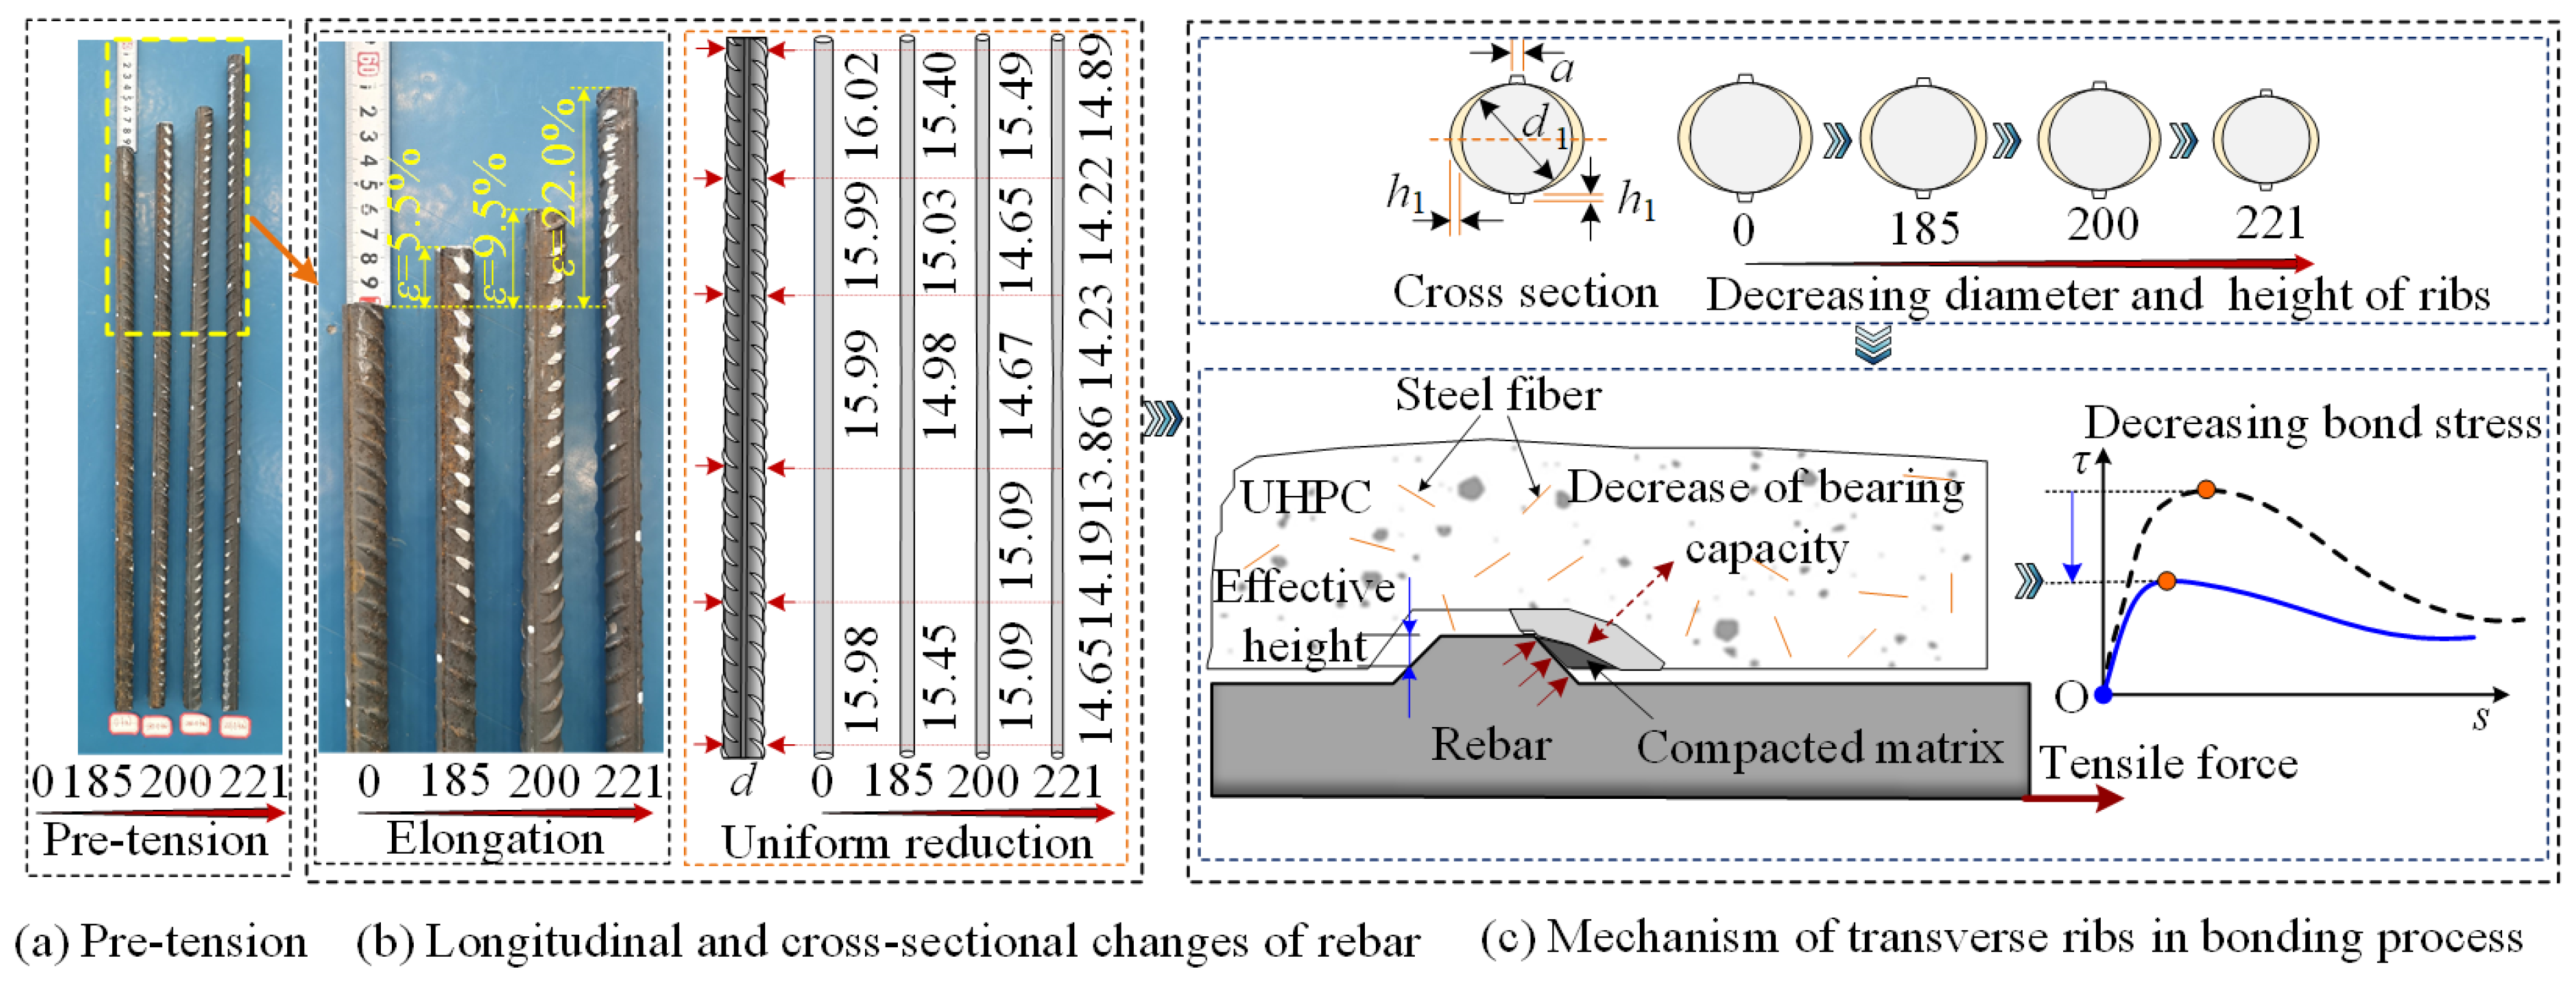
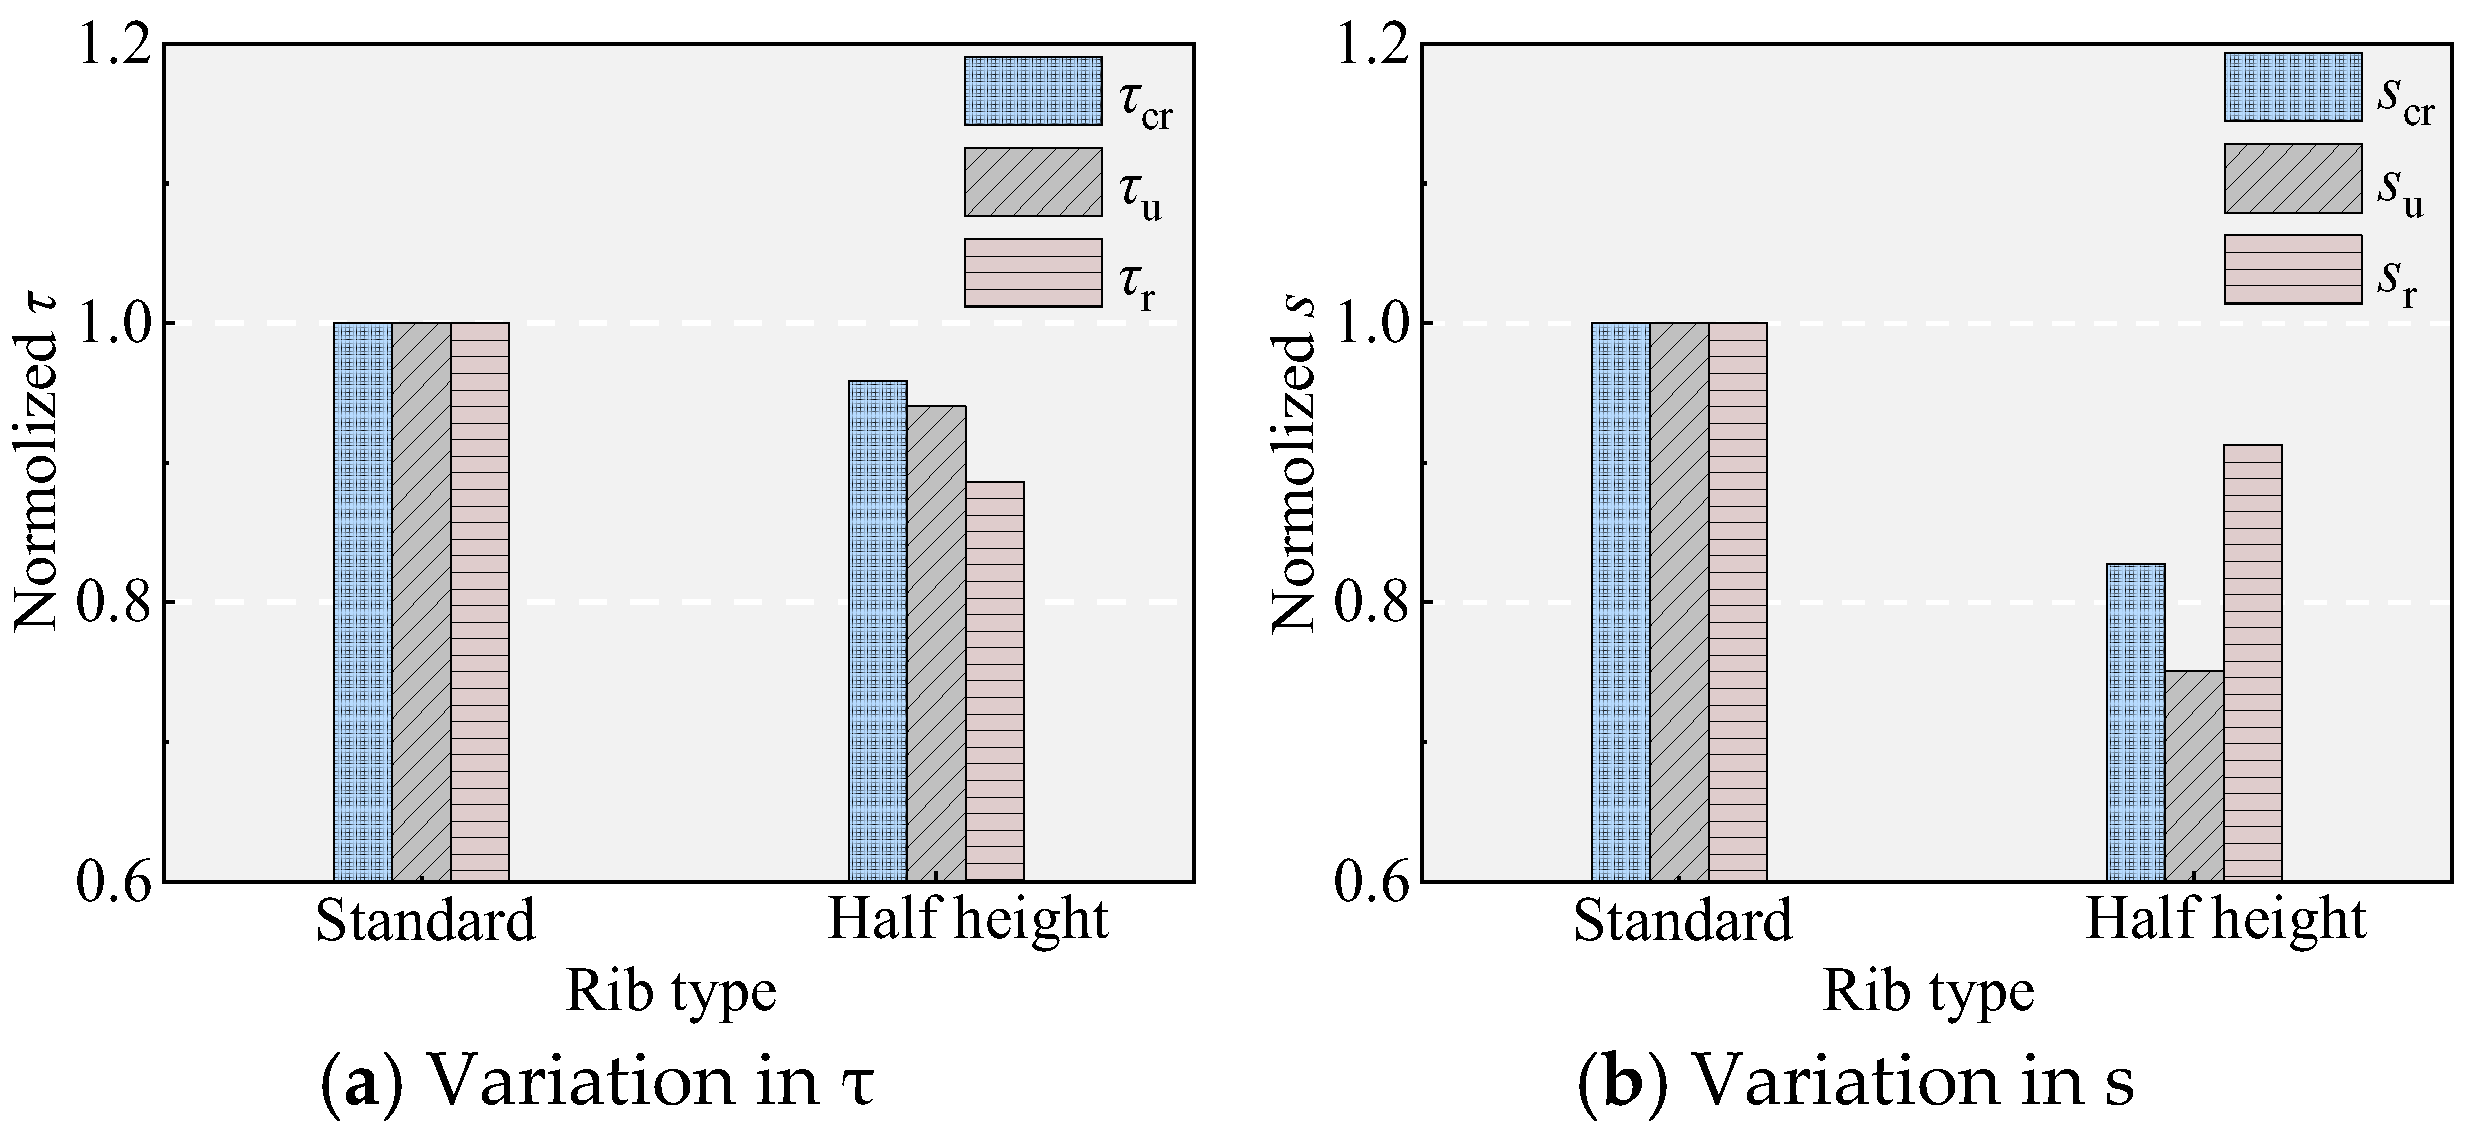
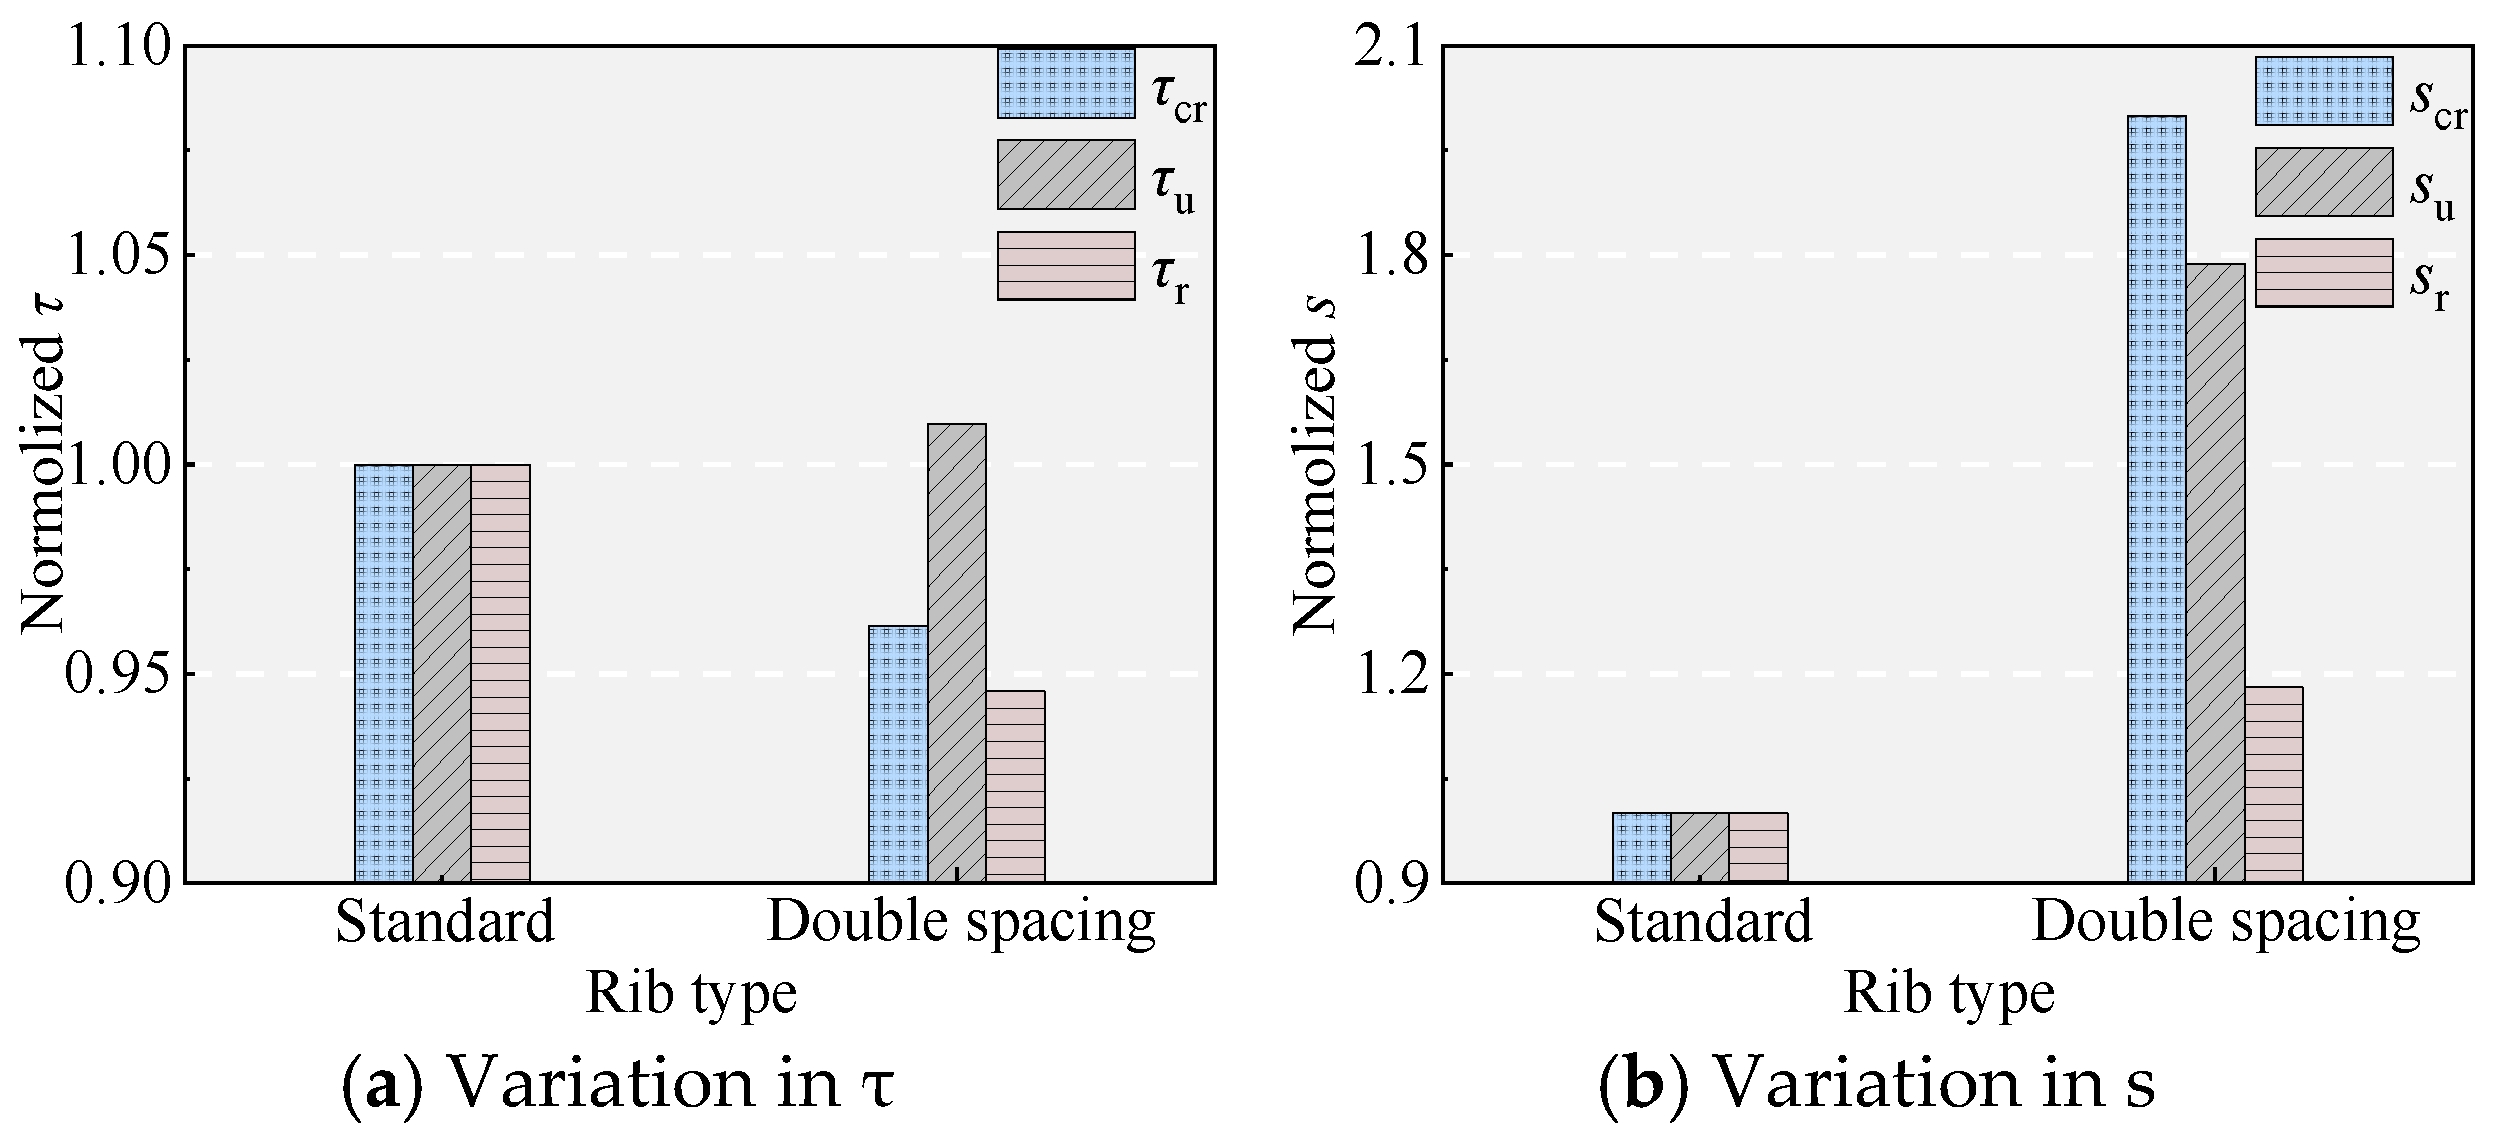
- In terms of interfacial bonding performance of NPR with UHPC, the NPR bars outperform the HRB400 bars, and the HRB400 bars outperform the HG bars. The unique characteristic of uniform elongation under high tensile strain causes the NPR bars to undergo yield “softening”, which reduces their bonding performance with UHPC, and this reduction is directly proportional to the tensile strain. For the NPR bars, prestrain levels of 5.5%, 9.5%, and 22.0% decrease τu by 5.07%, 7.79%, and 17.01% and su by 7.00%, 15.88%, and 30.54%, respectively. Increasing the rib spacing and reducing the rib height are detrimental to bond performance.
- (4)
- It is discovered that as ld increases, τu decreases, while su and τr increase, and better bond ductility is exhibited after the peak point. Decreasing ss and increasing the curing age, Vf, and c are beneficial for the bond behavior between NPR bars and UHPC, enhancing τu and su, and showing better bond ductility after the peak point.
- (5)
- A regression model considering the effects of ld/d, Ass/bss, Vflf/df, c/d, and fcu is developed to predict the lcd and lud. Moreover, an ANN model is developed to accurately predict the lcd and lud between NPR bars and UHPC. Further, compared to the regression model, the ANN model exhibits a higher R2 value, lower MAPE and RMSE, and a broader parameter applicability range.
Author Contributions
Funding
Institutional Review Board Statement
Informed Consent Statement
Data Availability Statement
Conflicts of Interest
References
- Shao, Y.; Tich, K.L.; Boaro, S.B.; Billington, S.L. Impact of fiber distribution and cyclic loading on the bond behavior of steel-reinforced UHPC. Cem. Concr. Compos. 2022, 126, 104338. [Google Scholar] [CrossRef]
- Yoo, D.Y.; Shin, H.O. Bond performance of steel rebar embedded in 80–180 MPa ultra-high strength concrete. Cem. Concr. Compos. 2018, 93, 206–217. [Google Scholar] [CrossRef]
- Lagier, F.; Massicotte, B.; Charron, J.P. Experimental investigation of bond stress distribution and bond strength in unconfined UHPFRC lap splices under direct tension. Cem. Concr. Compos. 2016, 74, 26–38. [Google Scholar] [CrossRef]
- Ronanki, V.S.; Aaleti, S.; Valentim, D.B. Experimental investigation of bond behavior of mild steel reinforcement in UHPC. Eng. Struct. 2018, 176, 707–718. [Google Scholar] [CrossRef]
- Liu, J.H. Study on Uniaxial Properties of Ultra High Performance Concrete and Bonding Properties with High Strength Rebar. Master’s Thesis, Chongqing University, Chongqing, China, 2020. [Google Scholar]
- Jia, F.F. Experimental Study on Bond Properties Between Steel Bar and Reactive Powder Concrete. Ph.D. Thesis, Beijing Jiaotong University, Beijing, China, 2013. [Google Scholar]
- An, M.Z.; Zhang, M. Experimental research of bond capability between deformed bars and reactive powder concrete. China Railw. Sci. 2007, 28, 50–54. [Google Scholar]
- Sun, M.; Gao, R.; Chen, Y.; Gao, M. Experimental study of bond performance between high-strength rebar and reactive powder concrete. Bridge Constr. 2016, 46, 18–23. [Google Scholar]
- Sturm, A.B.; Visintin, P. Local bond slip behavior of steel reinforcing bars embedded in ultra high performance fibre reinforced concrete. Struct. Concr. 2019, 20, 108–122. [Google Scholar] [CrossRef]
- Khaksefidi, S.; Ghalehno, M.; De Brito, J. Bond behaviour of high-strength steel rebars in normal (NSC) and ultra-high performance concrete (UHPC). J. Build. Eng. 2021, 33, 101592. [Google Scholar] [CrossRef]
- Shao, Y.; Billington, S.L. Impact of UHPC tensile behavior on steel reinforced UHPC flexural behavior. J. Struct. Eng. 2022, 148, 04021244. [Google Scholar] [CrossRef]
- Hasgul, U.; Turker, K.; Birol, T.; Yavas, A. Flexural behavior of ultra-high-performance fiber reinforced concrete beams with low and high reinforcement ratios. Struct. Concr. 2018, 19, 1–14. [Google Scholar] [CrossRef]
- Gu, J.B.; Wang, J.Y.; Lu, W. An experimental assessment of ultra high performance concrete beam reinforced with negative Poisson’s ratio (NPR) steel rebar. Constr. Build. Mater. 2022, 327, 127042. [Google Scholar] [CrossRef]
- Wang, J.Y.; Gu, J.B.; Liu, C.; Huang, Y.H.; Xiao, R.C.; Ma, B. Flexural behavior of ultra high performance concrete beams reinforced with high strength steel. Struct. Eng. Mech. 2022, 81, 539–550. [Google Scholar]
- Guo, Y.Q. Applied Basic Research on Reinforced Ultra High Performance Concrete (UHPC) Members Based on Tensile Regulation. Ph.D. Thesis, Tongji University, Shanghai, China, 2023. [Google Scholar]
- Yoo, D.Y.; Banthia, N.; Yoon, Y.S. Experimental and numerical study on flexural behavior of ultra-high-performance fiber-reinforced concrete beams with low reinforcement ratios. Can. J. Civ. Eng. 2017, 44, 18–28. [Google Scholar] [CrossRef]
- Gu, T.; Jia, L.-J.; Chen, B.; Xia, M.; Guo, H.; He, M.-C. Unified full-range plasticity till fracture of meta steel and structural steels. Eng. Fract. Mech. 2021, 253, 107869. [Google Scholar] [CrossRef]
- Shao, S.-W.; Shang, H.-S.; Feng, H.-B.; Wang, W.-Z. Study on the mechanical properties of NPR steel bars and the bonding properties with marine concrete. Constr. Build. Mater. 2022, 316, 125721. [Google Scholar] [CrossRef]
- De Cooman, B.C.; Estrin, Y.; Kim, S.K. Twinning-induced plasticity (TWIP) steels. Acta Mater. 2018, 142, 283–362. [Google Scholar] [CrossRef]
- Chang, S.Y. Research on Bond Behavior Between High Performance Steel Bars and UHPC. Master’s Thesis, Tongji University, Shanghai, China, 2023. [Google Scholar]
- Cai, Z.H.; Ding, H.; Xue, X. Microstructural evolution and mechanical properties of hot-rolled 11% manganese TRIP steel. Mater. Sci. Eng. A 2013, 560, 388–395. [Google Scholar] [CrossRef]
- Hu, A.; Liang, X.; Shi, Q. Bond characteristics between high strength bars and ultra-high performance concrete. J. Xi’an Univ. Archit. Technol. (Nat. Sci. Ed.) 2021, 53, 534–544. [Google Scholar]
- Chen, Y.T. Experimental and Analytical Study of Bond Behavior of High Strength Reinforcing Steel in Ultra High Performance Concrete. Master’s Thesis, Southeast University, Nanjing, China, 2020. [Google Scholar]
- Gao, X.L. Experimental Study and Refined Numerical Simulation on Steel-UHPC Composite Structure. Ph.D. Thesis, Tongji University, Shanghai, China, 2021. [Google Scholar]
- Zhang, Z.; Li, S.S.; Zhu, P.; Shao, X.; Bu, G. Test on interface bonding behaviour between steel rebar and ultra-high performance concrete. J. Hunan Univ. (Nat. Sci.) 2022, 49, 105–115. [Google Scholar]
- Liang, R.; Huang, Y. Experimental study on bond performance between high strength steel rebar and ultra-high performance concrete. J. Build. Struct. 2022, 43, 294–302. [Google Scholar]
- Chao, S.H.; Naaman, A.E.; Parra-Montesinos, G.J. Bond behavior of reinforcing bars in tensile strain-hardening fiber-reinforced cement composites. ACI Struct. J. 2009, 106, 897–906. [Google Scholar]
- Morris, G.J. Experimental Evaluation of Local Bond Behavior of Deformed Reinforcing Bars in Concrete Structures. Master’s Thesis, University of Canterbury, Christchurch, New Zealand, 2015. [Google Scholar]
- Kim, M.J.; Kim, H.G.; Lee, J.M.; Lee, Y.J.; Kim, K.H. A prediction model for bond deterioration in RC members. I: Bond stress-slip behavior for splitting failure. J. Struct. Eng. 2018, 144, 04018002. [Google Scholar] [CrossRef]
- Li, X.; Zhang, J.; Liu, J.; Cao, W. Bond behavior of spiral ribbed ultra-high strength steel rebar embedded in plain and steel fiber reinforced high-strength concrete. KSCE J. Civ. Eng. 2019, 23, 4417–4430. [Google Scholar] [CrossRef]
- Lu, B.-L.; Wang, J.-Y.; Rong, X.-L.; Chen, L.-B.; Chen, Z.-W. Bond performance of novel NPR rebar-reinforced UHPC under cyclic loading. Constr. Build. Mater. 2025, 474, 140987. [Google Scholar] [CrossRef]
- GB/T 228.1-2010; Metallic Materials–Tensile Testing—Part 1: Method of Test at Room Temperature. National Standard of The People’s Republic of China: Beijing, China, 2010.
- ASTM A706; Standard Specification for Deformed and Plain Low-Alloy Steel Bars for Concrete Reinforcement. ASTM International: West Conshohocken, PA, USA, 2023.
- Long, X.C.; Wang, J.Y.; Rong, X.L.; Lu, B.L.; Chen, L.B.; Chen, Z.W. Cyclic performance of novel NPR steel-reinforced UHPC beams. J. Build. Eng. 2025, 103, 112181. [Google Scholar] [CrossRef]
- Yoo, D.-Y.; Shin, H.-O.; Yang, J.-M.; Yoon, Y.-S. Material and bond properties of ultra high performance fiber reinforced concrete with micro steel fibers. Compos. Part B Eng. 2014, 58, 122–133. [Google Scholar] [CrossRef]
- Deng, Z.C.; Yuan, C.X. Experimental study on bond capability between high strength rebar and reactive powder concrete. China Civ. Eng. J. 2014, 47, 69–78. [Google Scholar]
- Deng, M.K.; Pan, J.J.; Sun, H.Z. Bond behavior of deformed bar embedded in Engineered Cementitious Composites under cyclic loading. Constr. Build. Mater. 2019, 197, 164–174. [Google Scholar] [CrossRef]
- Zhao, Y.; Lin, H.; Wu, K.; Jin, W. Bond behaviour of normal/recycled concrete and corroded steel bars. Constr. Build. Mater. 2013, 48, 348–359. [Google Scholar] [CrossRef]
- Huang, L.; Chi, Y.; Xu, L.; Chen, P.; Zhang, A. Local bond performance of rebar embedded in steel-polypropylene hybrid fiber reinforced concrete under monotonic and cyclic loading. Constr. Build. Mater. 2016, 103, 77–92. [Google Scholar] [CrossRef]
- Rao, G.A.; Pandurangan, K.; Sultana, F.; Eligehausen, R. Studies on the pull-out strength of ribbed bars in high-strength concrete. In Proceeding of the 6th International Association of Fracture Mechanics for Concrete and Concrete Structures Catania, Taylor & Francis, Catania, Italy, 7–22 June 2007; pp. 295–301. [Google Scholar]
- Alkaysi, M.; El-Tawil, S. Factors affecting bond development between Ultra High Performance Concrete (UHPC) and steel bar reinforcement. Constr. Build. Mater. 2017, 144, 412–422. [Google Scholar] [CrossRef]
- Yuan, J.; Graybeal, B.A. Bond Behavior of Reinforcing Steel in Ultra-High Performance Concrete; Federal Highway Administration, Office of Infrastructure: Washington, DC, USA, 2014.
- Lin, H.W. Experimental Study on the Bond Behaviour of Corroded Reinforced Concrete Under Monotonic or Repeated Loading. Ph.D. Thesis, Zhejiang University, Hangzhou, China, 2017. [Google Scholar]
- Rong, X.L. Research on the Synergistic Working Mechanism of NPR Reinforcement and UHPC and the Flexural Performance of Their Reinforced Beams. Ph.D. Thesis, Tongji University, Shanghai, China, 2024. [Google Scholar]
- Shafighfard, T.; Kazemi, F.; Asgarkhani, N.; Yoo, D.-Y. Machine-learning methods for estimating compressive strength of high-performance alkali-activated concrete. Eng. Appl. Artif. Intell. 2024, 136, 109053. [Google Scholar] [CrossRef]
- Pishro, A.A.; Zhang, S.; Huang, D.; Xiong, F.; Li, W.; Yang, Q. Application of artificial neural networks and multiple linear regression on local bond stress equation of UHPC and reinforcing steel bars. Sci. Rep. 2021, 11, 15061. [Google Scholar]
- Kong, Q.; He, C.; Liao, L.; Xu, J.; Yuan, C. Hyperparameter optimization for interfacial bond strength prediction between fiber-reinforced polymer and concrete. Structures 2023, 51, 573–601. [Google Scholar] [CrossRef]
- Zhang, Y.-X.; Zhang, Q.; Xu, L.-Y.; Hou, W.; Miao, Y.-S.; Liu, Y.; Huang, B.-T. Transfer learning for intelligent design of lightweight Strain-Hardening Ultra-High-Performance Concrete (SH-UHPC). Autom. Constr. 2025, 175, 106241. [Google Scholar] [CrossRef]
- Hemmatian, A.; Jalali, M.; Naderpour, H.; Nehdi, M.L. Machine learning prediction of fiber pull-out and bond-slip in fiber-reinforced cementitious composites. J. Build. Eng. 2023, 63, 105474. [Google Scholar] [CrossRef]
- Singh, R.; Arora, H.C.; Bahrami, A.; Kumar, A.; Kapoor, N.R.; Kumar, K.; Rai, H.S. Enhancing Sustainability of Corroded RC Structures: Estimating Steel-to-Concrete Bond Strength with ANN and SVM Algorithms. Materials 2022, 15, 8295. [Google Scholar] [CrossRef]
- Cavaleri, L.; Barkhordari, M.S.; Repapis, C.C.; Armaghani, D.J.; Ulrikh, D.V.; Asteris, P.G. Convolution-based ensemble learning algorithms to estimate the bond strength of the corroded reinforced concrete. Constr. Build. Mater. 2022, 359, 129504. [Google Scholar] [CrossRef]
- Gharah, T.A.T.; Nazari, Z.M. Artificial Intelligence, Machine Learning, and Deep Learning in Structural Engineering: A Scien-tometrics Review of Trends and Best Practices. Arch. Comput. Methods Eng. 2022, 30, 115–159. [Google Scholar]
- Su, M.; Zhong, Q.; Peng, H.; Li, S. Selected machine learning approaches for predicting the interfacial bond strength between FRPs and concrete. Constr. Build. Mater. 2020, 270, 121456. [Google Scholar] [CrossRef]
- Javad, M.M.; Mehdi, M.S. A New Multi-objective Artificial Bee Colony Algorithm for Optimal Adaptive Robust Controller Design. IETE J. Res. 2019, 68, 1–14. [Google Scholar]
- Liu, Y.; Wu, W.-Z.; Zhang, Y.-X.; Hou, W.; Zhang, H.; Peng, L.-G. Engineered/Strain-Hardening Cementitious Composites (ECC/SHCC) for Resilient Cold-Region Infrastructure: A Critical Review of Freeze-Thaw Durability. Case Stud. Constr. Mater. 2025, 22, e04362. [Google Scholar] [CrossRef]
- Xiong, Q.; Xiong, H.; Kong, Q.; Ni, X.; Li, Y.; Yuan, C. Machine learning-driven seismic failure mode identification of reinforced concrete shear walls based on PCA feature extraction. Structures 2022, 44, 1429–1442. [Google Scholar] [CrossRef]
- Li, Z.; Qi, J.; Hu, Y.; Wang, J. Estimation of bond strength between UHPC and reinforcing bars using machine learning approaches. Eng. Struct. 2022, 262, 114311. [Google Scholar] [CrossRef]
- Wang, K.; Li, J.; Li, L.; Deng, E.; Zhang, Y.; Li, Z. Machine learning to estimate the bond strength of the corroded steel bar-concrete. Struct. Concr. 2023, 25, 696–715. [Google Scholar] [CrossRef]
- Yoon, J.; Kim, H.; Ju, S.; Li, Z.; Pyo, S. Framework for rapid characterization of fresh properties of cementitious materials using point cloud and machine learning. Constr. Build. Mater. 2023, 400, 132647. [Google Scholar] [CrossRef]
- Xu, Z.; Xu, C.Z.; Rong, X.L. Bond performance and constitutive model of novel NPR rebar–UHPC system under monotonic loading. Case Stud. Constr. Mater, 2025; under review. [Google Scholar]
- Lundberg, S.M.; Lee, S.I. A unified approach to interpreting model predictions. In Proceedings of the 31st Conference on Neural Information Processing Systems (NIPS 2017), Long Beach, CA, USA, 4–9 December 2017; pp. 4768–4777. [Google Scholar]


| Material | Fe | C | Si | Mn | P | S | Ni | Cr | Cu |
|---|---|---|---|---|---|---|---|---|---|
| NPR | 73.59 | 0.49 | 0.49 | 20.2 | 0.03 | <0.01 | 0.01 | 3.65 | 0.02 |
| HRB400 | 97.78 | 0.28 | 0.47 | 1.54 | 0.019 | 0.017 | 0.005 | 0.029 | 0.007 |
| Type | d (mm) | Es (MPa) | fy (MPa) | εy | fu (MPa) | fu/fy | εmax | εu | Elongation Till Fracture |
|---|---|---|---|---|---|---|---|---|---|
| NPR | 16 | 189 | 689 | 5731 | 1139 | 1.65 | 257,173 | 260,254 | 28.10 |
| HRB400 | 16 | 198 | 448 | 2363 | 583 | 1.30 | 136,315 | 182,590 | 18.70 |
| HRB400 | 12 | 191 | 433 | 2348 | 602 | 1.38 | 135,927 | 193,196 | 19.80 |
| HG | 12.6 | 196 | 1386 | 9047 | 1471 | 1.06 | 38,734 | 76,379 | 7.74 |
| Cement | Silica Fume | Quartz Powder | Beads | Quartz Sand | Water | Superplasticizer |
|---|---|---|---|---|---|---|
| 797.0 | 71.0 | 200.9 | 31.7 | 1002.6 | 198.1 | 8.2 |
| Diameter (mm) | Length (mm) | Aspect ratio | Young’s modulus (GPa) | Tensile strength (MPa) | Density (kg/m3) | |
| 0.2 | 16 | 80 | 200 | 2500 | 7850 | |
| No. | Rebar Type | d | ld | ld/d | c | c/d | Vf | ss | Curing Time | Transverse Rib Shape | Pretension |
|---|---|---|---|---|---|---|---|---|---|---|---|
| A | NPR | 16 | 16 | 1 | 20 | 1.3 | 2.2 | 75 | 28 | Standard | 0 |
| RR | NPR | 16 | 32 | 2 | 20 | 1.3 | 2.2 | 75 | 28 | Standard | 0 |
| B | NPR | 16 | 48 | 3 | 20 | 1.3 | 2.2 | 75 | 28 | Standard | 0 |
| C | NPR | 16 | 64 | 4 | 20 | 1.3 | 2.2 | 75 | 28 | Standard | 0 |
| D | NPR | 16 | 80 | 5 | 20 | 1.3 | 2.2 | 75 | 28 | Standard | 0 |
| 2 | NPR | 16 | 96 | 6 | 20 | 1.3 | 2.2 | 75 | 28 | Standard | 0 |
| E | NPR | 16 | 48 | 3 | 10 | 0.6 | 2.2 | 75 | 28 | Standard | 0 |
| F | NPR | 16 | 48 | 3 | 35 | 2.2 | 2.2 | 75 | 28 | Standard | 0 |
| G | NPR | 16 | 48 | 3 | 50 | 3.1 | 2.2 | 75 | 28 | Standard | 0 |
| H | NPR | 16 | 48 | 3 | 20 | 1.3 | 0 | 75 | 28 | Standard | 0 |
| I | NPR | 16 | 48 | 3 | 20 | 1.3 | 0.5 | 75 | 28 | Standard | 0 |
| J | NPR | 16 | 48 | 3 | 20 | 1.3 | 1.2 | 75 | 28 | Standard | 0 |
| K | NPR | 16 | 48 | 3 | 20 | 1.3 | 2.2 | 0 | 28 | Standard | 0 |
| L | NPR | 16 | 48 | 3 | 20 | 1.3 | 2.2 | 110 | 28 | Standard | 0 |
| M | HRB400 | 16 | 48 | 3 | 20 | 1.3 | 2.2 | 75 | 28 | Standard | 0 |
| 14 | HRB400 | 16 | 96 | 6 | 20 | 1.3 | 2.2 | 75 | 28 | Standard | 0 |
| O | HG | 12.6 | 37.8 | 3 | 20 | 1.6 | 2.2 | 75 | 28 | Standard | 0 |
| P | HRB400 | 12 | 36 | 3 | 20 | 1.7 | 2.2 | 75 | 28 | Standard | 0 |
| 5 | NPR | 16 | 48 | 3 | 20 | 1.3 | 2.2 | 75 | 3 | Standard | 0 |
| 6 | NPR | 16 | 48 | 3 | 20 | 1.3 | 2.2 | 75 | 7 | Standard | 0 |
| 7 | NPR | 16 | 48 | 3 | 20 | 1.3 | 2.2 | 75 | 14 | Standard | 0 |
| 8 | NPR | 16 | 48 | 3 | 20 | 1.3 | 2.2 | 75 | 21 | Standard | 0 |
| 9 | NPR | 16 | 48 | 3 | 20 | 1.3 | 2.2 | 75 | 28 | Reduce rib height to half | 0 |
| 10 | NPR | 16 | 48 | 3 | 20 | 1.3 | 2.2 | 75 | 28 | Increase rib spacing to double | 0 |
| 11 | NPR | 16 | 48 | 3 | 20 | 1.3 | 2.2 | 75 | 28 | Standard | 185 |
| 12 | NPR | 16 | 48 | 3 | 20 | 1.3 | 2.2 | 75 | 28 | Standard | 200 |
| 13 | NPR | 16 | 48 | 3 | 20 | 1.3 | 2.2 | 75 | 28 | Standard | 221 |
| R | NPR | 16 | 16 | 1 | 20 | 1.3 | 0.5 | 75 | 28 | Standard | 0 |
| S | NPR | 16 | 32 | 2 | 20 | 1.3 | 0.5 | 75 | 28 | Standard | 0 |
| T | NPR | 16 | 64 | 4 | 20 | 1.3 | 0.5 | 75 | 28 | Standard | 0 |
| U | NPR | 16 | 80 | 5 | 20 | 1.3 | 0.5 | 75 | 28 | Standard | 0 |
| V | NPR | 16 | 48 | 3 | 10 | 0.6 | 0.5 | 75 | 28 | Standard | 0 |
| W | NPR | 16 | 48 | 3 | 35 | 2.2 | 0.5 | 75 | 28 | Standard | 0 |
| X | NPR | 16 | 48 | 3 | 50 | 3.1 | 0.5 | 75 | 28 | Standard | 0 |
| Y | NPR | 16 | 48 | 3 | 20 | 1.3 | 0.5 | 0 | 28 | Standard | 0 |
| Z | NPR | 16 | 48 | 3 | 20 | 1.3 | 0.5 | 110 | 28 | Standard | 0 |
| No. | τcr | scr | Pu | τu | su | τr | sr | σsm | Failure Type |
|---|---|---|---|---|---|---|---|---|---|
| A | 46.26 | 0.08 | 42.29 | 52.59 | 0.50 | 9.68 | 9.79 | 210.34 | Pull-out |
| RR | 44.93 | 0.09 | 81.32 | 50.56 | 0.62 | 15.37 | 11.82 | 404.44 | Pull-out |
| B | 40.30 | 0.12 | 119.23 | 49.42 | 0.80 | 15.89 | 12.17 | 593.00 | Pull-out |
| C | 36.32 | 0.13 | 143.55 | 44.62 | 1.16 | 16.52 | 12.69 | 713.94 | Pull-out |
| D | 35.80 | 0.14 | 173.30 | 43.10 | 1.51 | 21.72 | 13.64 | 861.92 | Pull-out |
| 2 | 31.28 | 0.17 | 179.39 | 37.18 | 1.77 | 20.47 | 13.77 | 892.22 | Pull-out |
| E | 30.75 | 0.09 | 108.64 | 45.03 | 0.61 | 14.71 | 11.46 | 540.31 | Pull-out |
| F | 41.50 | 0.14 | 124.84 | 51.74 | 0.95 | 17.12 | 15.13 | 620.90 | Pull-out |
| G | 47.20 | 0.18 | 130.27 | 53.99 | 1.11 | 19.65 | 17.99 | 647.86 | Pull-out |
| H | 31.77 | 0.05 | 98.39 | 40.78 | 0.23 | 12.25 | 9.57 | 489.34 | Splitting + Pull-out |
| I | 34.99 | 0.09 | 100.37 | 41.60 | 0.58 | 13.12 | 11.45 | 499.18 | Splitting + Pull-out |
| J | 36.46 | 0.10 | 110.22 | 45.68 | 0.70 | 14.86 | 11.83 | 548.17 | Splitting + Pull-out |
| K | 29.58 | 0.08 | 84.47 | 35.01 | 0.42 | 0.00 | 9.36 | 420.13 | Splitting |
| L | 37.44 | 0.10 | 103.99 | 43.10 | 0.70 | 13.10 | 10.15 | 517.20 | Splitting + Pull-out |
| M | 37.28 | 0.12 | 108.71 | 45.06 | 1.52 | 23.52 | 7.74 | 540.67 | Pull-out |
| 14 | 120.12 | 597.44 | Rebar failure | ||||||
| O | 23.02 | 0.24 | 61.83 | 41.33 | 2.76 | 10.18 | 19.86 | 495.87 | Pull-out |
| P | 43.82 | 0.03 | 67.94 | 50.06 | 2.11 | 25.09 | 9.81 | 600.69 | Pull-out |
| 5 | 32.85 | 0.07 | 98.40 | 40.78 | 0.57 | 10.94 | 11.44 | 489.40 | Pull-out |
| 6 | 34.53 | 0.09 | 101.16 | 41.93 | 0.60 | 11.91 | 11.63 | 503.14 | Pull-out |
| 7 | 38.38 | 0.10 | 112.95 | 46.81 | 0.65 | 14.69 | 11.80 | 561.78 | Pull-out |
| 8 | 39.91 | 0.11 | 117.47 | 48.69 | 0.74 | 15.62 | 11.93 | 584.25 | Pull-out |
| 9 | 38.64 | 0.10 | 112.15 | 46.48 | 0.60 | 14.09 | 11.11 | 557.79 | Pull-out |
| 10 | 38.75 | 0.24 | 120.38 | 49.9 | 1.43 | 15.03 | 14.37 | 598.72 | Pull-out |
| 11 | 38.00 | 0.09 | 113.19 | 46.91 | 0.74 | 14.85 | 11.52 | 562.96 | Pull-out |
| 12 | 35.63 | 0.08 | 109.95 | 45.57 | 0.67 | 14.26 | 11.04 | 546.85 | Pull-out |
| 13 | 31.57 | 0.06 | 98.96 | 41.01 | 0.56 | 12.19 | 10.38 | 492.17 | Pull-out |
| R | 41.89 | 0.04 | 37.53 | 46.66 | 0.19 | 5.90 | 8.04 | 186.65 | Splitting + Pull-out |
| S | 36.52 | 0.07 | 70.54 | 43.86 | 0.42 | 12.47 | 10.62 | 350.86 | Splitting + Pull-out |
| T | 31.11 | 0.11 | 116.72 | 36.28 | 0.73 | 13.84 | 8.57 | 580.54 | Splitting + Pull-out |
| U | 29.82 | 0.13 | 140.96 | 35.05 | 1.08 | 14.05 | 12.78 | 701.06 | Splitting + Pull-out |
| V | 27.16 | 0.05 | 88.07 | 36.50 | 0.48 | 12.38 | 9.51 | 438.02 | Splitting + Pull-out |
| W | 37.30 | 0.11 | 113.85 | 47.19 | 0.84 | 15.12 | 12.41 | 566.26 | Pull-out |
| X | 41.60 | 0.16 | 121.29 | 50.27 | 0.93 | 17.67 | 14.99 | 603.24 | Pull-out |
| Y | 25.56 | 0.03 | 76.29 | 31.62 | 0.28 | 0.00 | 7.74 | 379.46 | Splitting |
| Z | 31.43 | 0.06 | 89.35 | 37.03 | 0.42 | 11.93 | 8.72 | 444.40 | Splitting + Pull-out |
| From | No. | ld/d | c/d | Vf (%) | lf/df | b (mm) | ss (mm) | Curing Day | fcu (MPa) | ft (MPa) | σsm (MPa) |
|---|---|---|---|---|---|---|---|---|---|---|---|
| [20] | NPR-H-3d | 3 | 4.2 | 2.5 | 72.7 | 150 | null | 28 | 153 | 11.5 | 659.04 |
| NPR-L-3d | 3 | 4.2 | 2 | 72.7 | 150 | null | 28 | 139 | 8.3 | 545.28 | |
| NPR-S-3d | 3 | 4.2 | 1 | 72.7 | 150 | null | 28 | 128 | 7.2 | 516.96 | |
| NPR-N-3d | 3 | 4.2 | 0 | 72.7 | 150 | null | 28 | 86 | 4.7 | 355.68 | |
| NPR-H-4d | 4 | 4.2 | 2.5 | 72.7 | 150 | null | 28 | 153 | 11.5 | 739.52 | |
| NPR-H-5d | 5 | 4.2 | 2.5 | 72.7 | 150 | null | 28 | 153 | 11.5 | 807.4 | |
| NPR-H-6d | 6 | 4.2 | 2.5 | 72.7 | 150 | null | 28 | 153 | 11.5 | 890.4 | |
| NPR-H-3d-30 | 3 | 1.9 | 2.5 | 72.7 | 150 | null | 28 | 153 | 11.5 | 552.96 | |
| NPR-H-3d-40 | 3 | 2.5 | 2.5 | 72.7 | 150 | null | 28 | 153 | 11.5 | 571.56 | |
| NPR-H-3d-50 | 3 | 3.1 | 2.5 | 72.7 | 150 | null | 28 | 153 | 11.5 | 607.56 | |
| [15] | F1-HP16-4D82 | 4 | 5.1 | 1 | 80 | 180 | null | 28 | 139 | 7.7 | 787.68 |
| F2-HP16-4D82 | 4 | 5.1 | 2 | 80 | 180 | null | 28 | 145 | 9.6 | 817.28 |
Disclaimer/Publisher’s Note: The statements, opinions and data contained in all publications are solely those of the individual author(s) and contributor(s) and not of MDPI and/or the editor(s). MDPI and/or the editor(s) disclaim responsibility for any injury to people or property resulting from any ideas, methods, instructions or products referred to in the content. |
© 2025 by the authors. Licensee MDPI, Basel, Switzerland. This article is an open access article distributed under the terms and conditions of the Creative Commons Attribution (CC BY) license (https://creativecommons.org/licenses/by/4.0/).
Share and Cite
Xu, Z.; Xu, C.-Z.; Rong, X.-L.; Wang, J.-Y.; Ma, X.-Y. Bond Behavior and Critical Anchorage Length Prediction of Novel Negative Poisson’s Ratio Bars Embedded in Ultra-High-Performance Concrete. Materials 2025, 18, 3182. https://doi.org/10.3390/ma18133182
Xu Z, Xu C-Z, Rong X-L, Wang J-Y, Ma X-Y. Bond Behavior and Critical Anchorage Length Prediction of Novel Negative Poisson’s Ratio Bars Embedded in Ultra-High-Performance Concrete. Materials. 2025; 18(13):3182. https://doi.org/10.3390/ma18133182
Chicago/Turabian StyleXu, Zhao, Chang-Ze Xu, Xian-Liang Rong, Jun-Yan Wang, and Xue-Yuan Ma. 2025. "Bond Behavior and Critical Anchorage Length Prediction of Novel Negative Poisson’s Ratio Bars Embedded in Ultra-High-Performance Concrete" Materials 18, no. 13: 3182. https://doi.org/10.3390/ma18133182
APA StyleXu, Z., Xu, C.-Z., Rong, X.-L., Wang, J.-Y., & Ma, X.-Y. (2025). Bond Behavior and Critical Anchorage Length Prediction of Novel Negative Poisson’s Ratio Bars Embedded in Ultra-High-Performance Concrete. Materials, 18(13), 3182. https://doi.org/10.3390/ma18133182