
Purification and Preparation of Graphene-like Nanoplates from Natural Graphite of Canindé, CE, Northeast-Brazil

 ,
,  , ,
, ,  , ,
, ,
Abstract
1. Introduction
2. Experimental Section
2.1. Experimental Methods
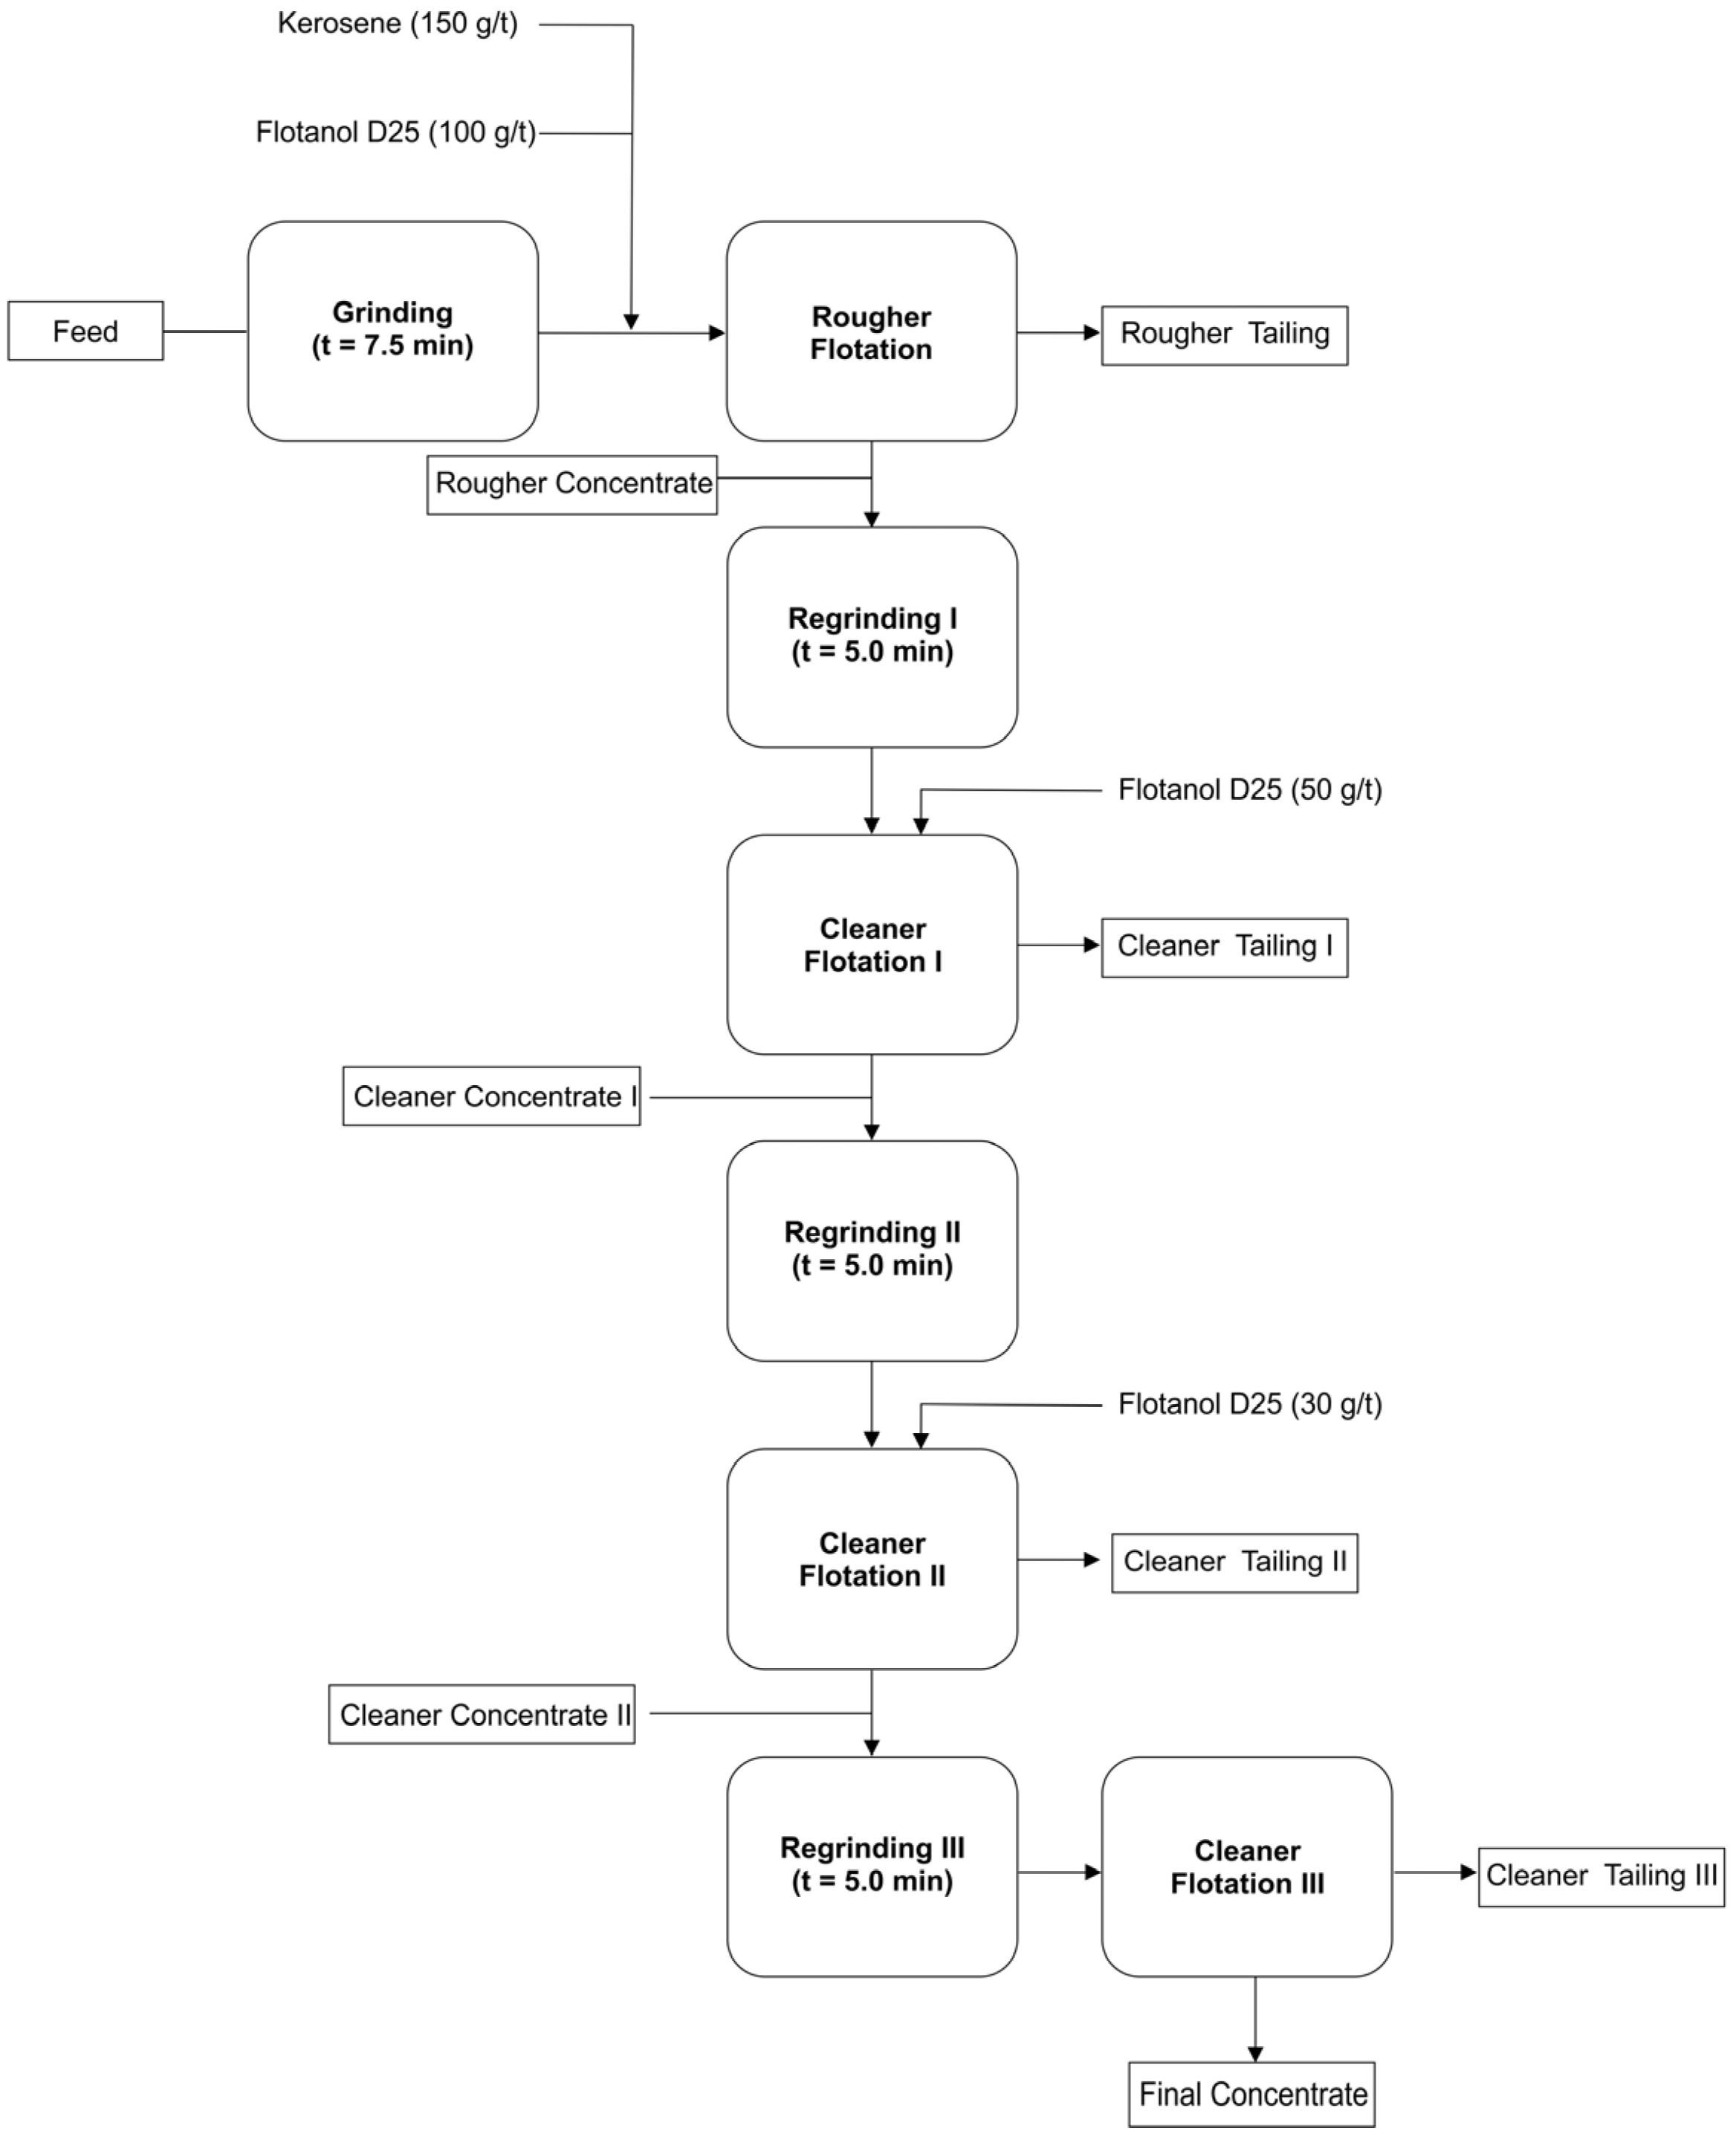
2.1.1. Flotation Experiment
2.1.2. Chemical Purification in Alkaline Environment (C-NaOH Treatment)
2.1.3. Leaching in an Acidic Environment (C-NaOH + H2SO4 Treatment)
2.2. Characterizations
3. Results and Discussion
3.1. Flotation
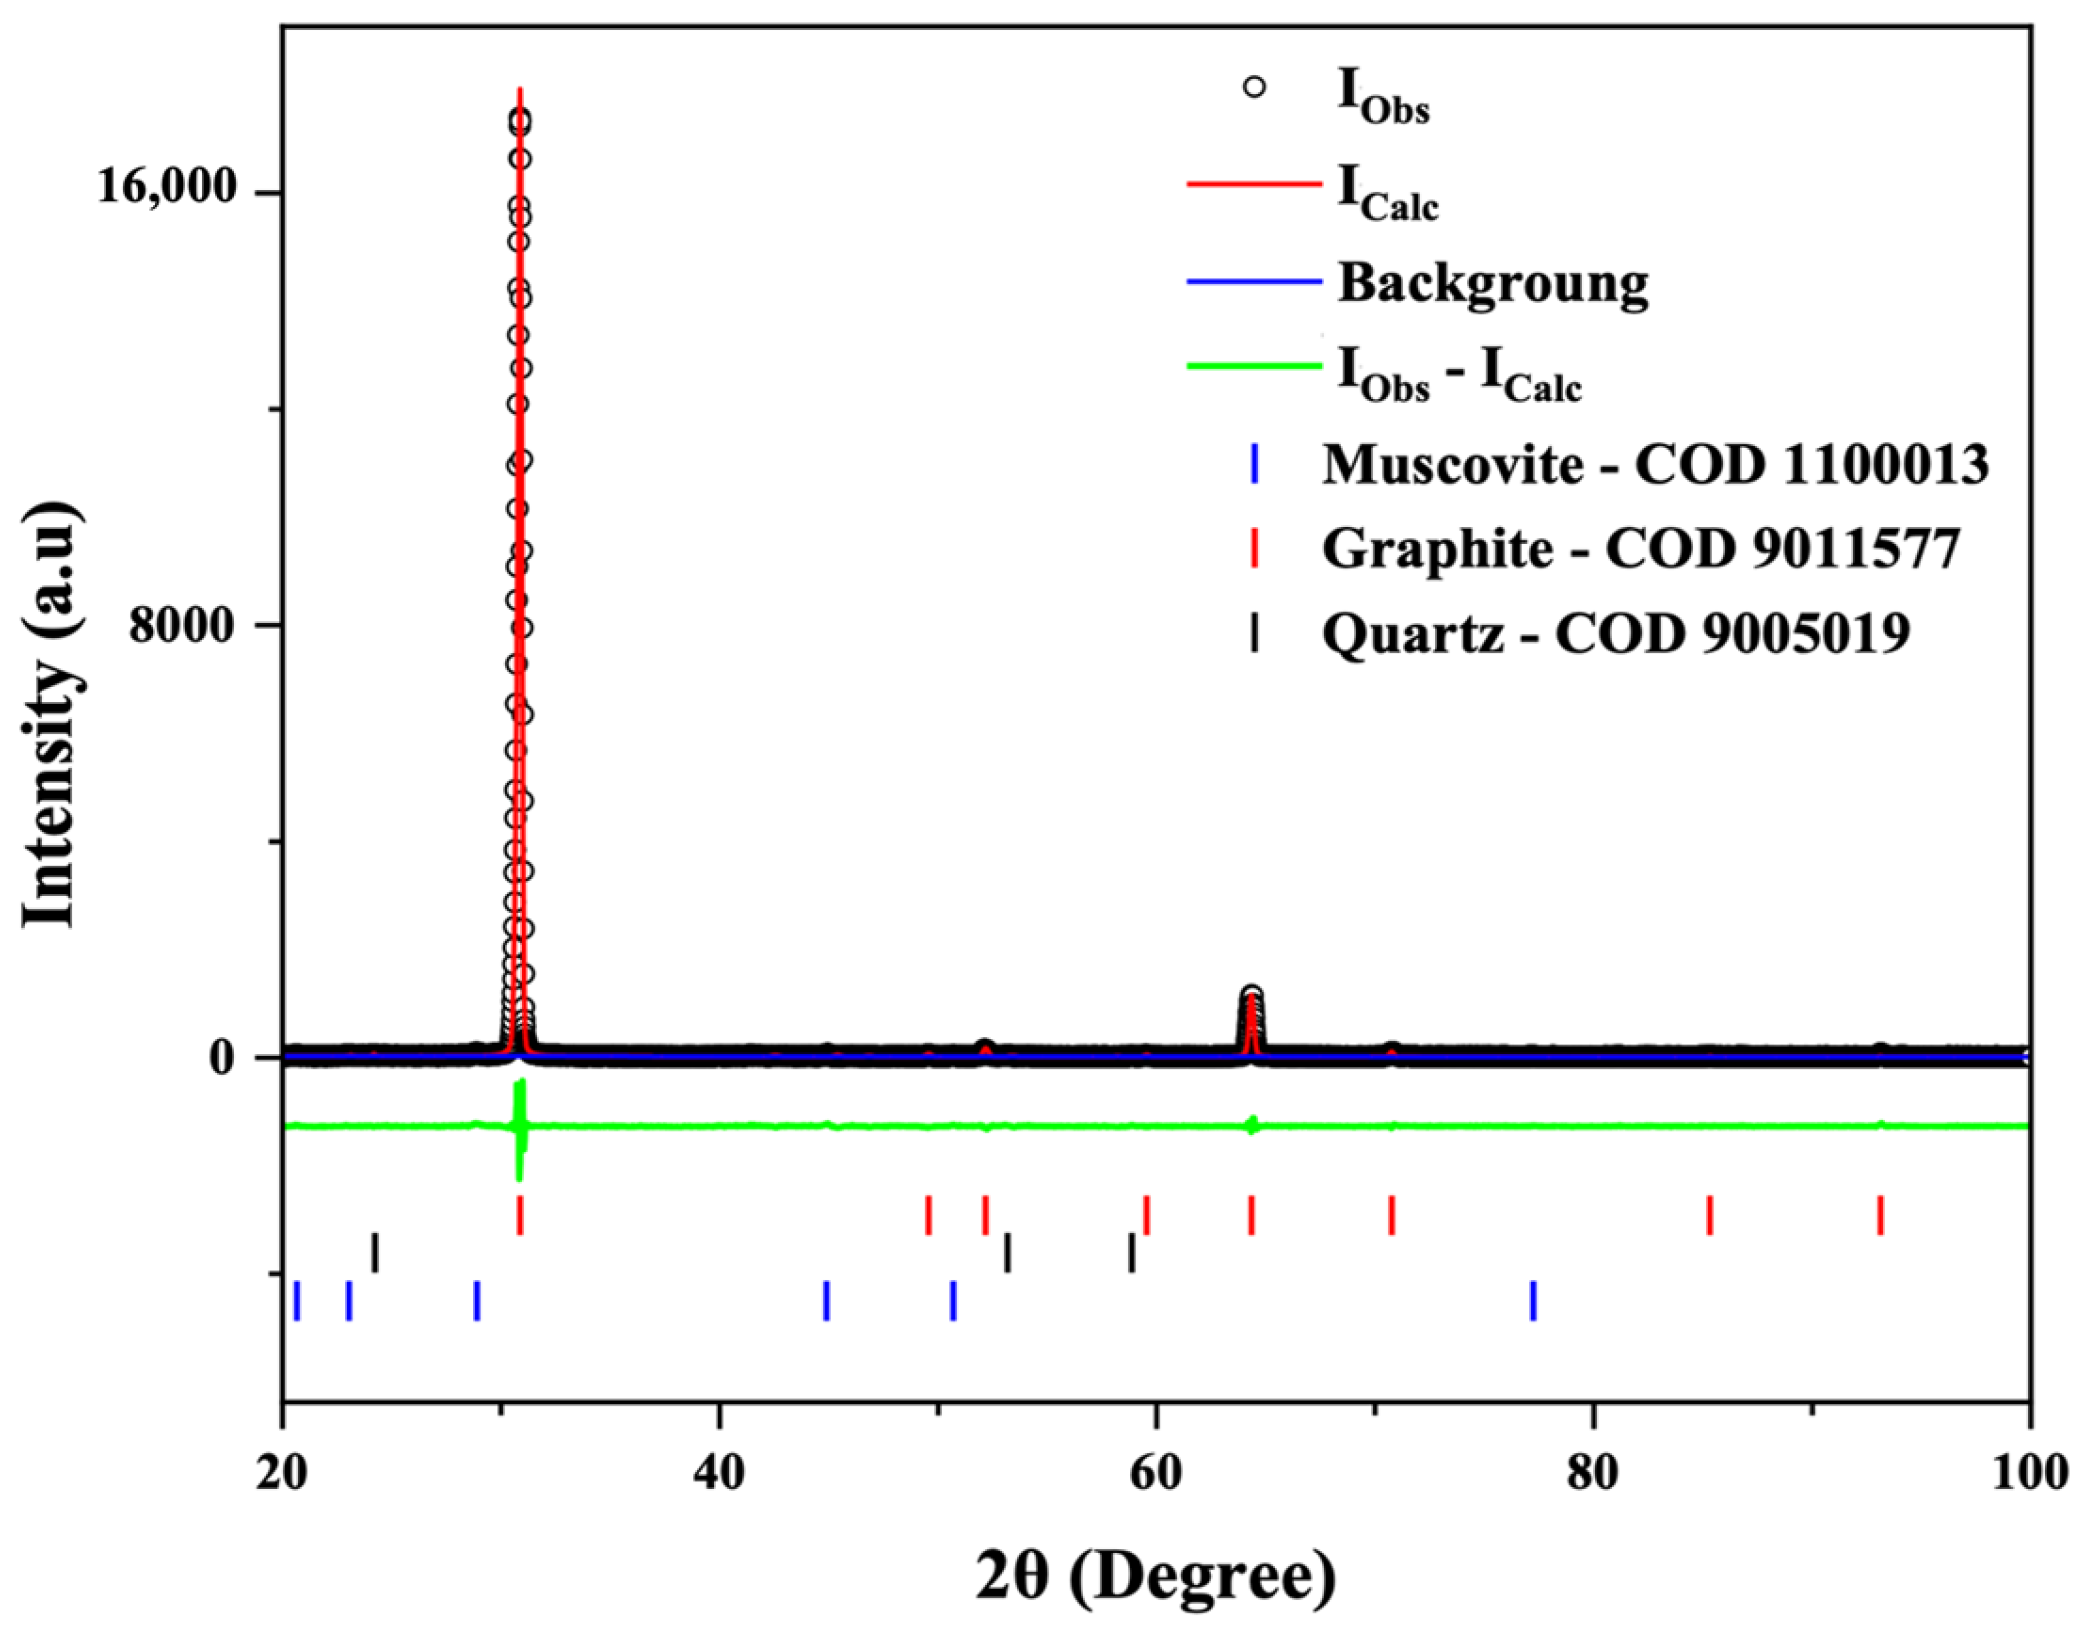
3.2. XRD Analysis
3.3. XRF Analysis
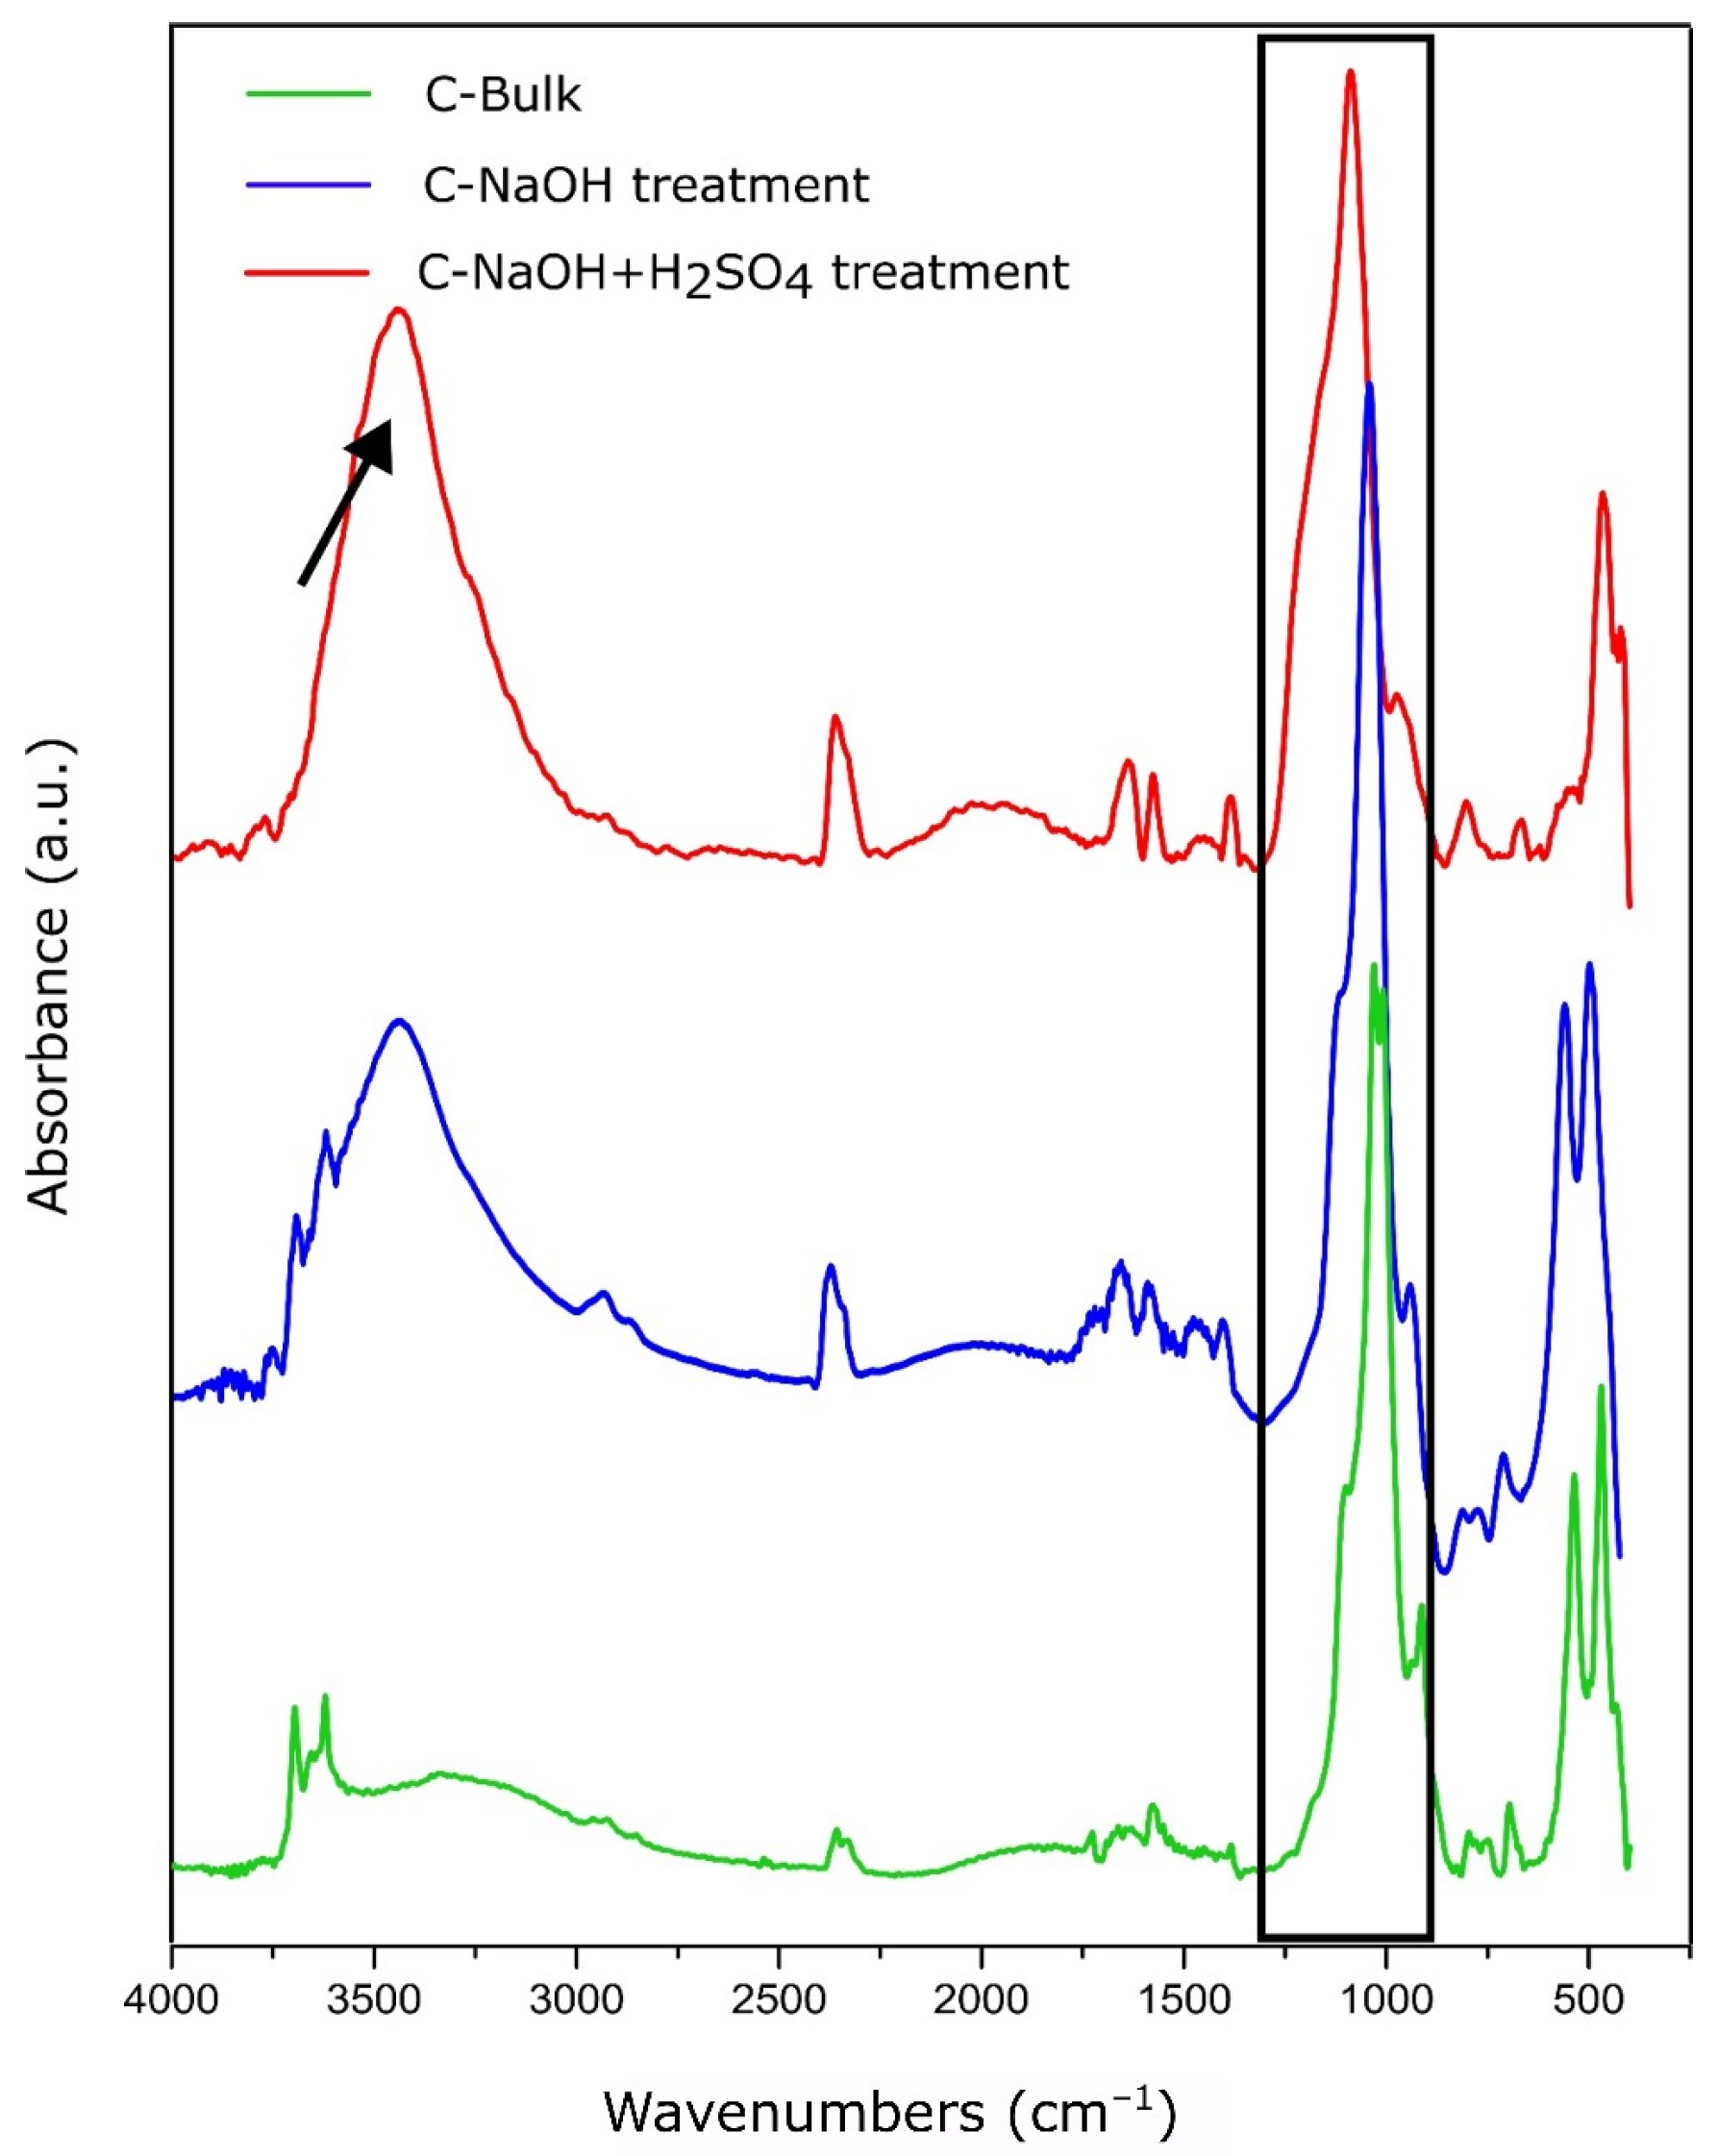
3.4. FTIR Analysis
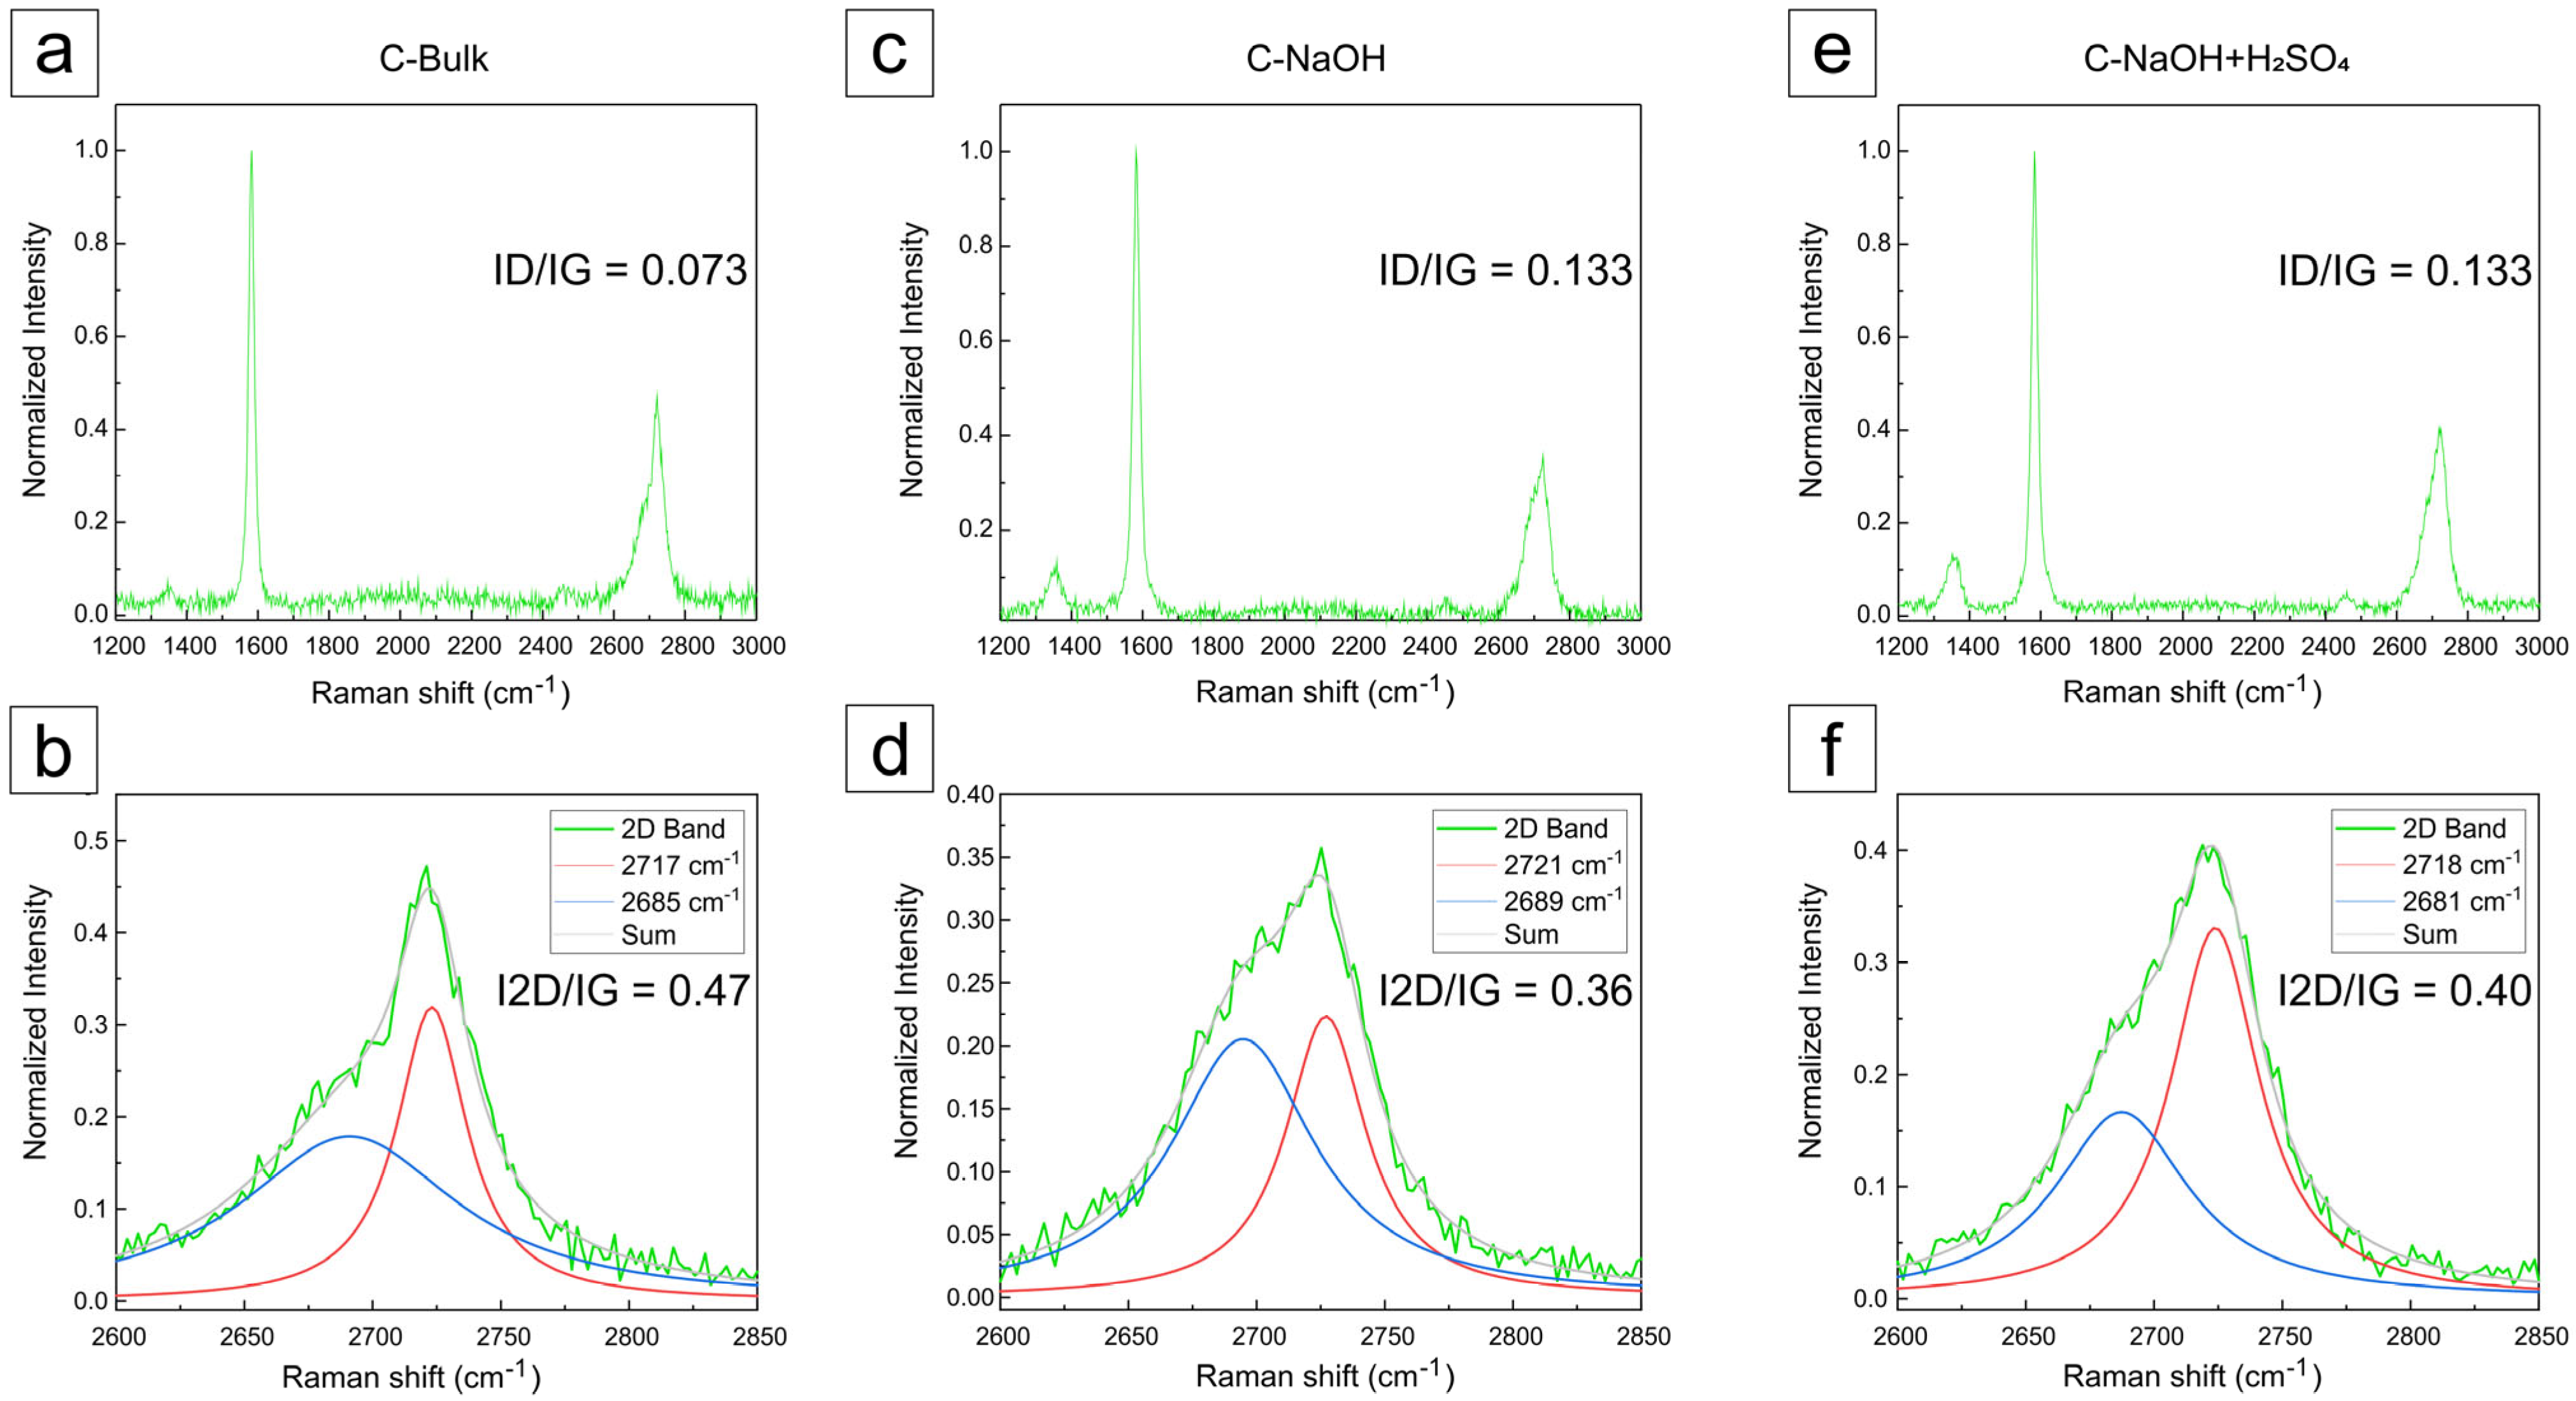
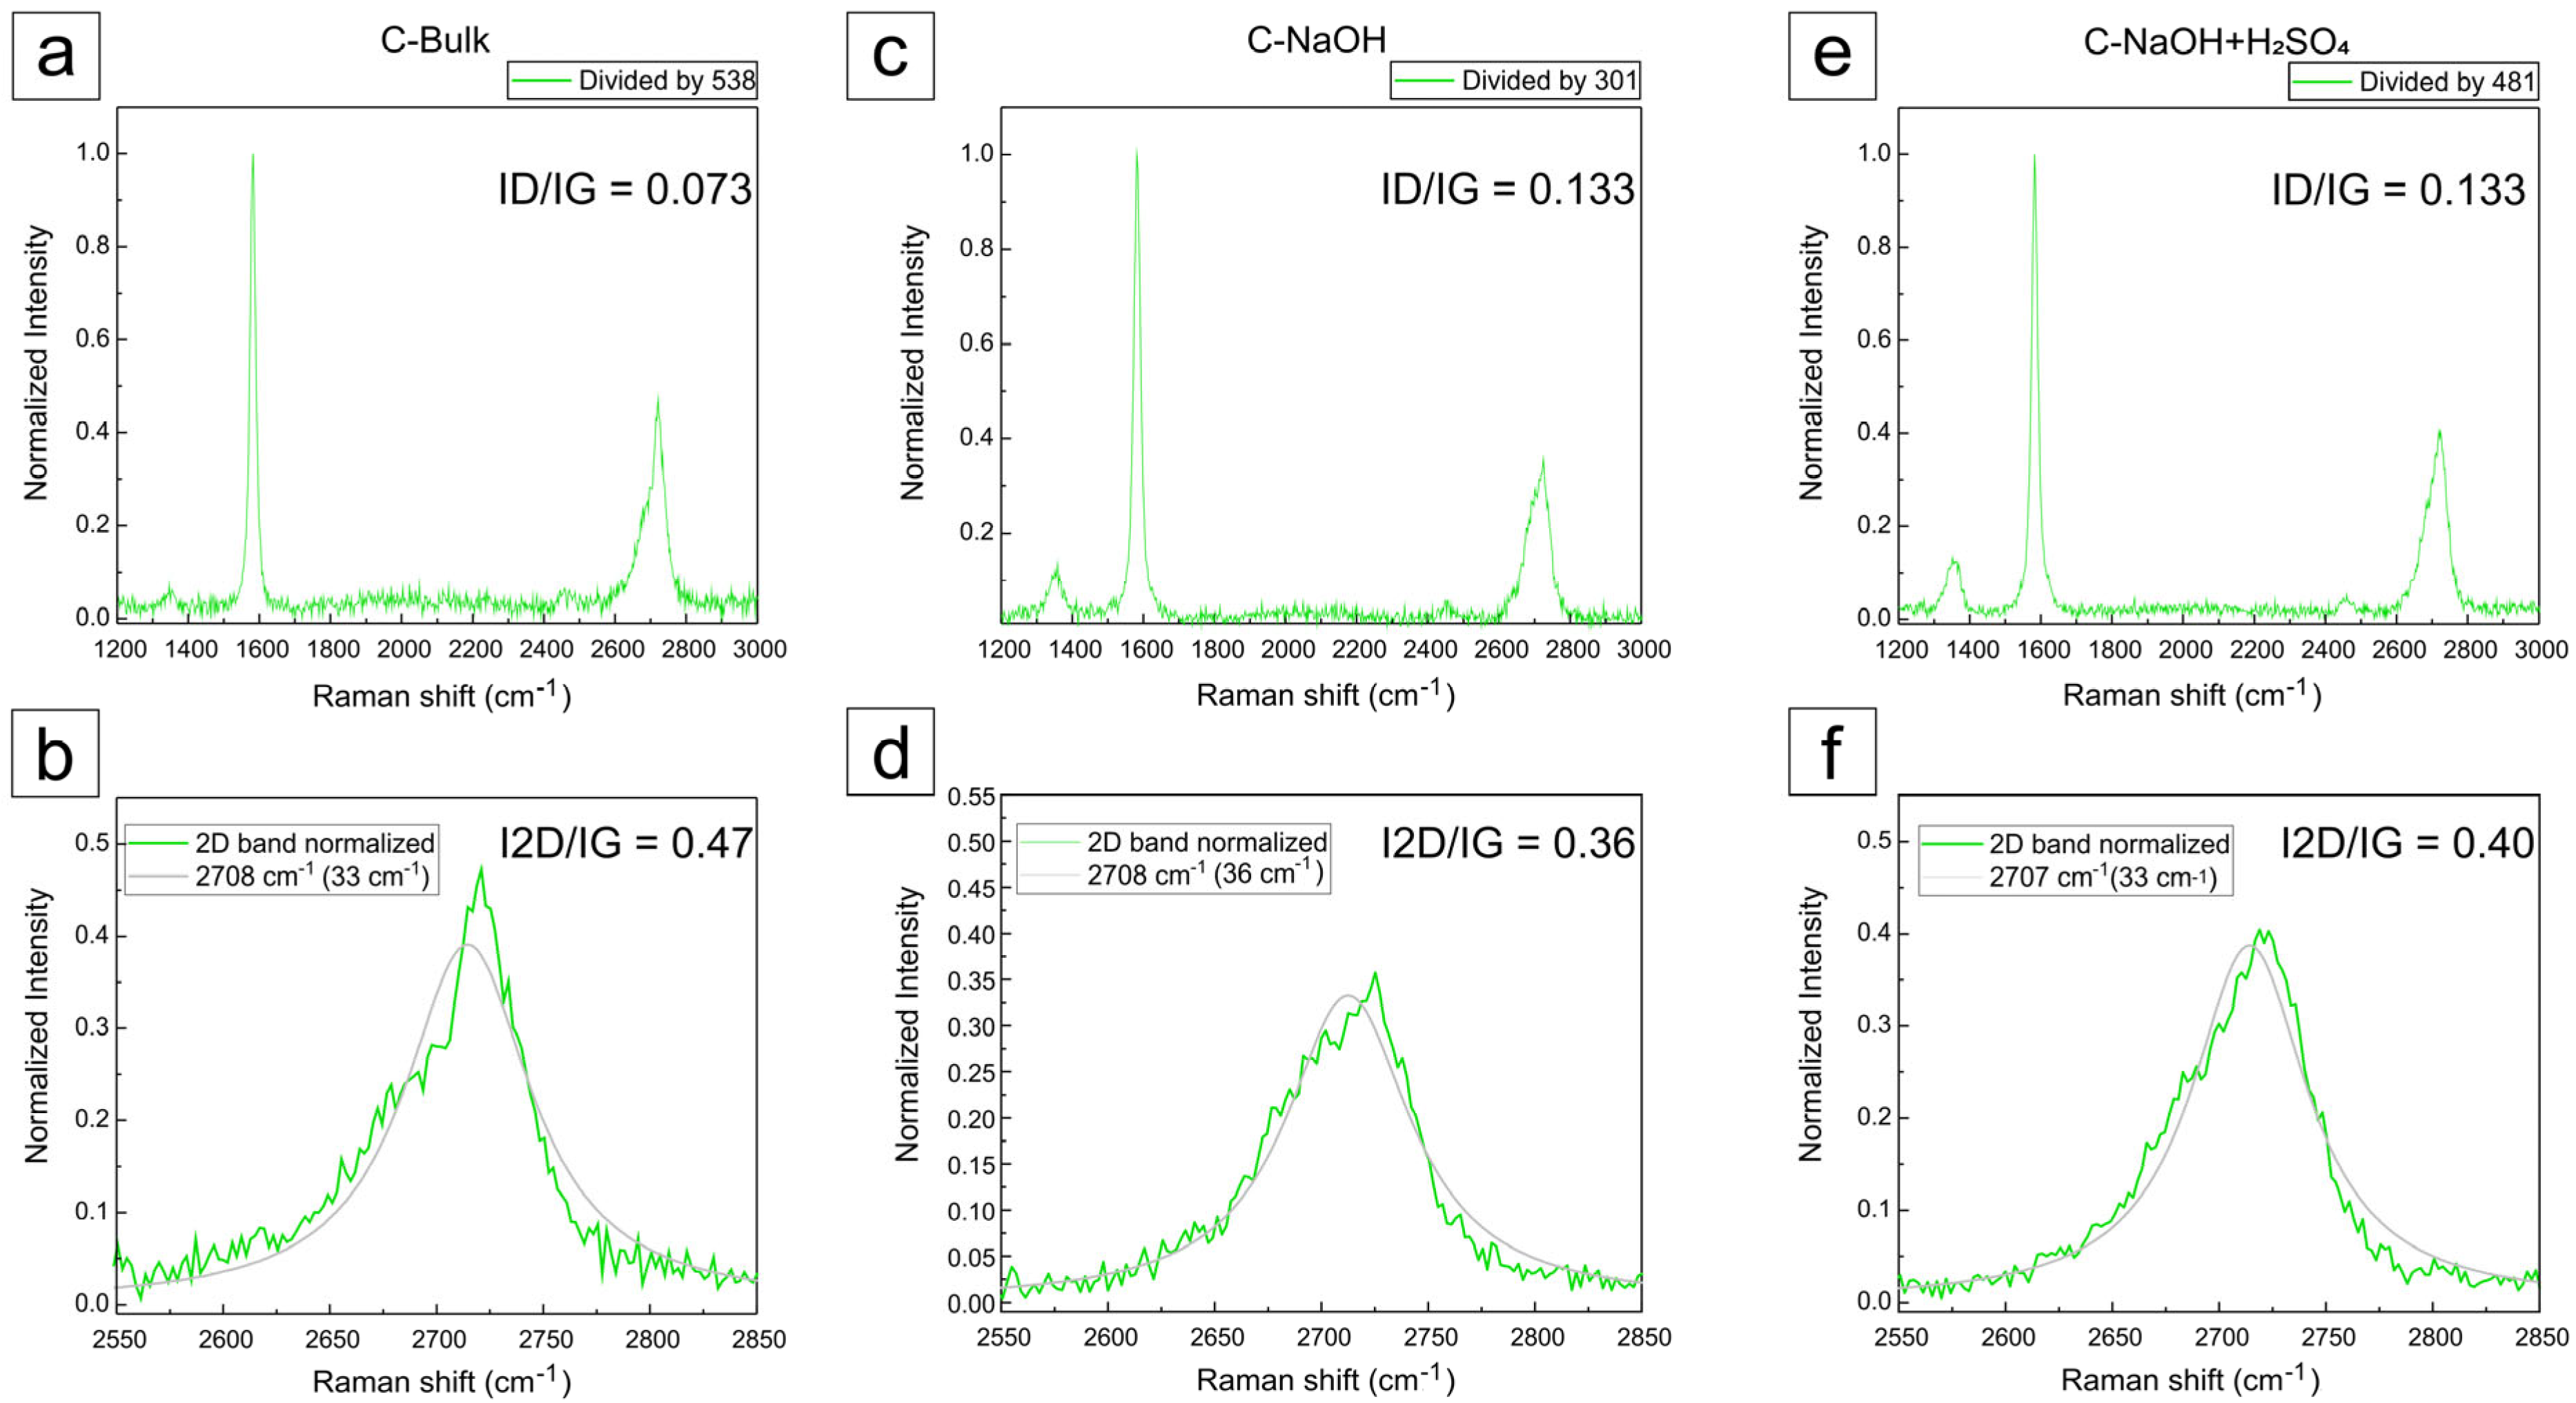
3.5. Raman Analysis
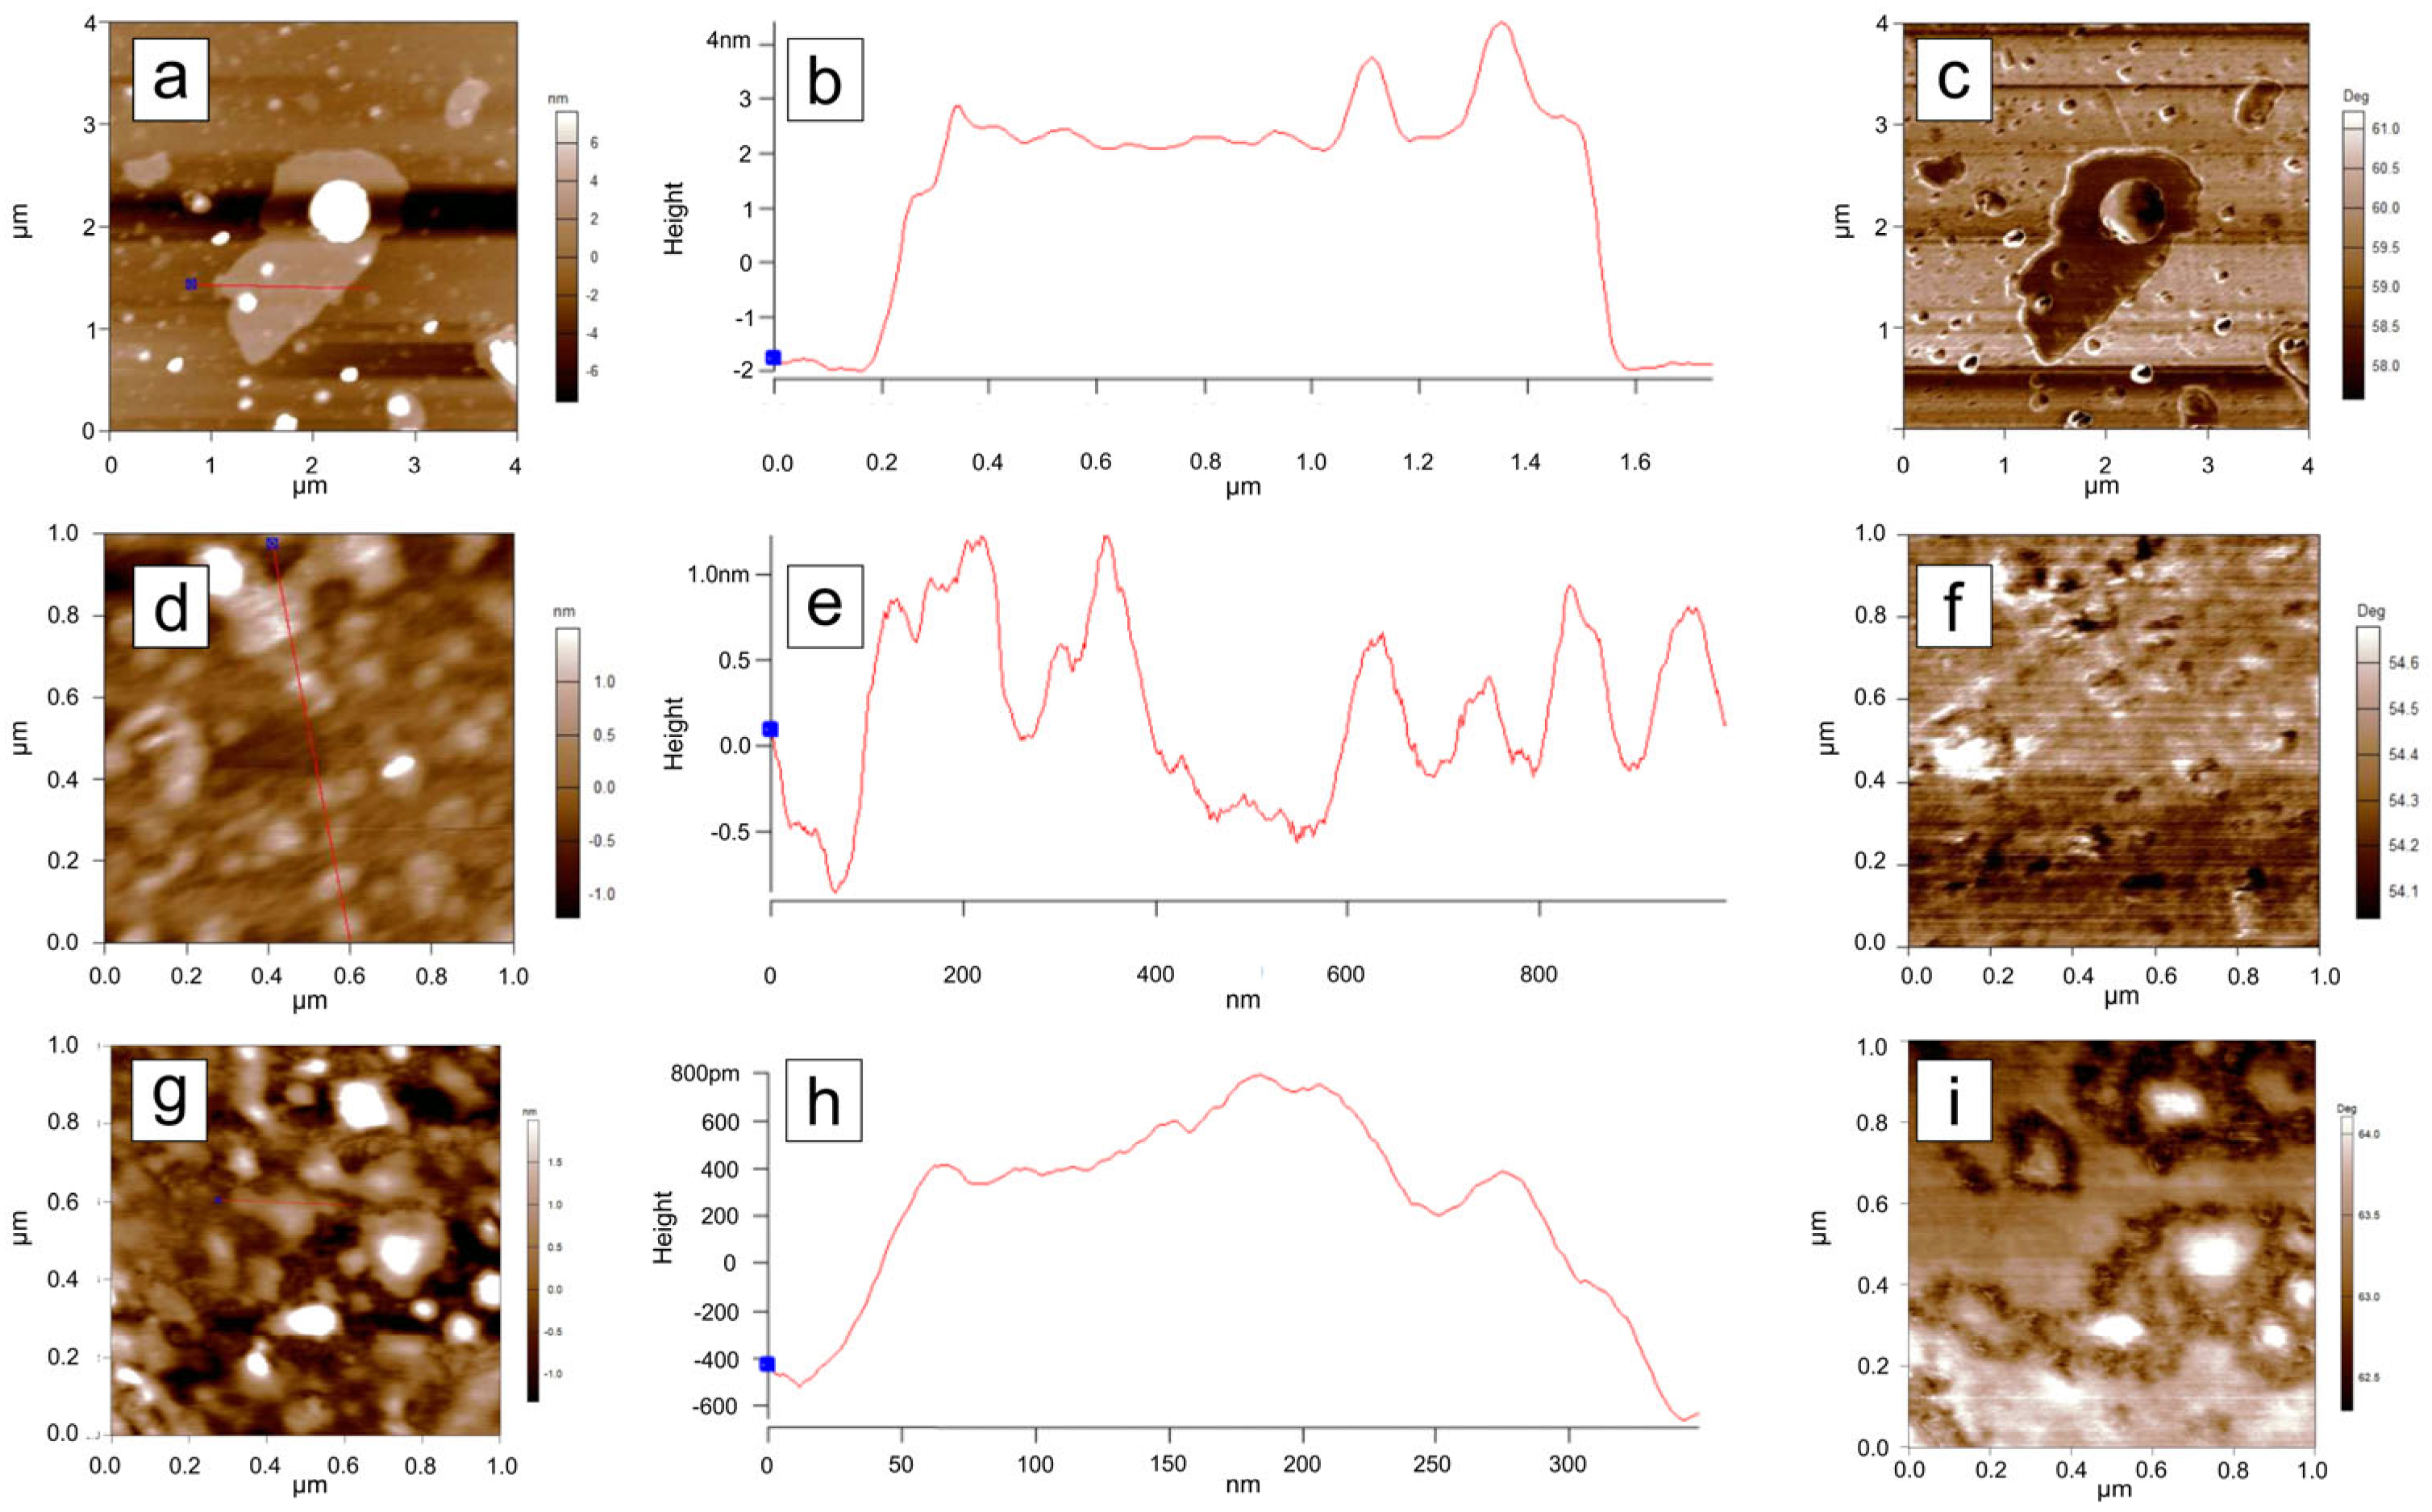
3.6. Atomic Force Microscopy (AFM) Analysis
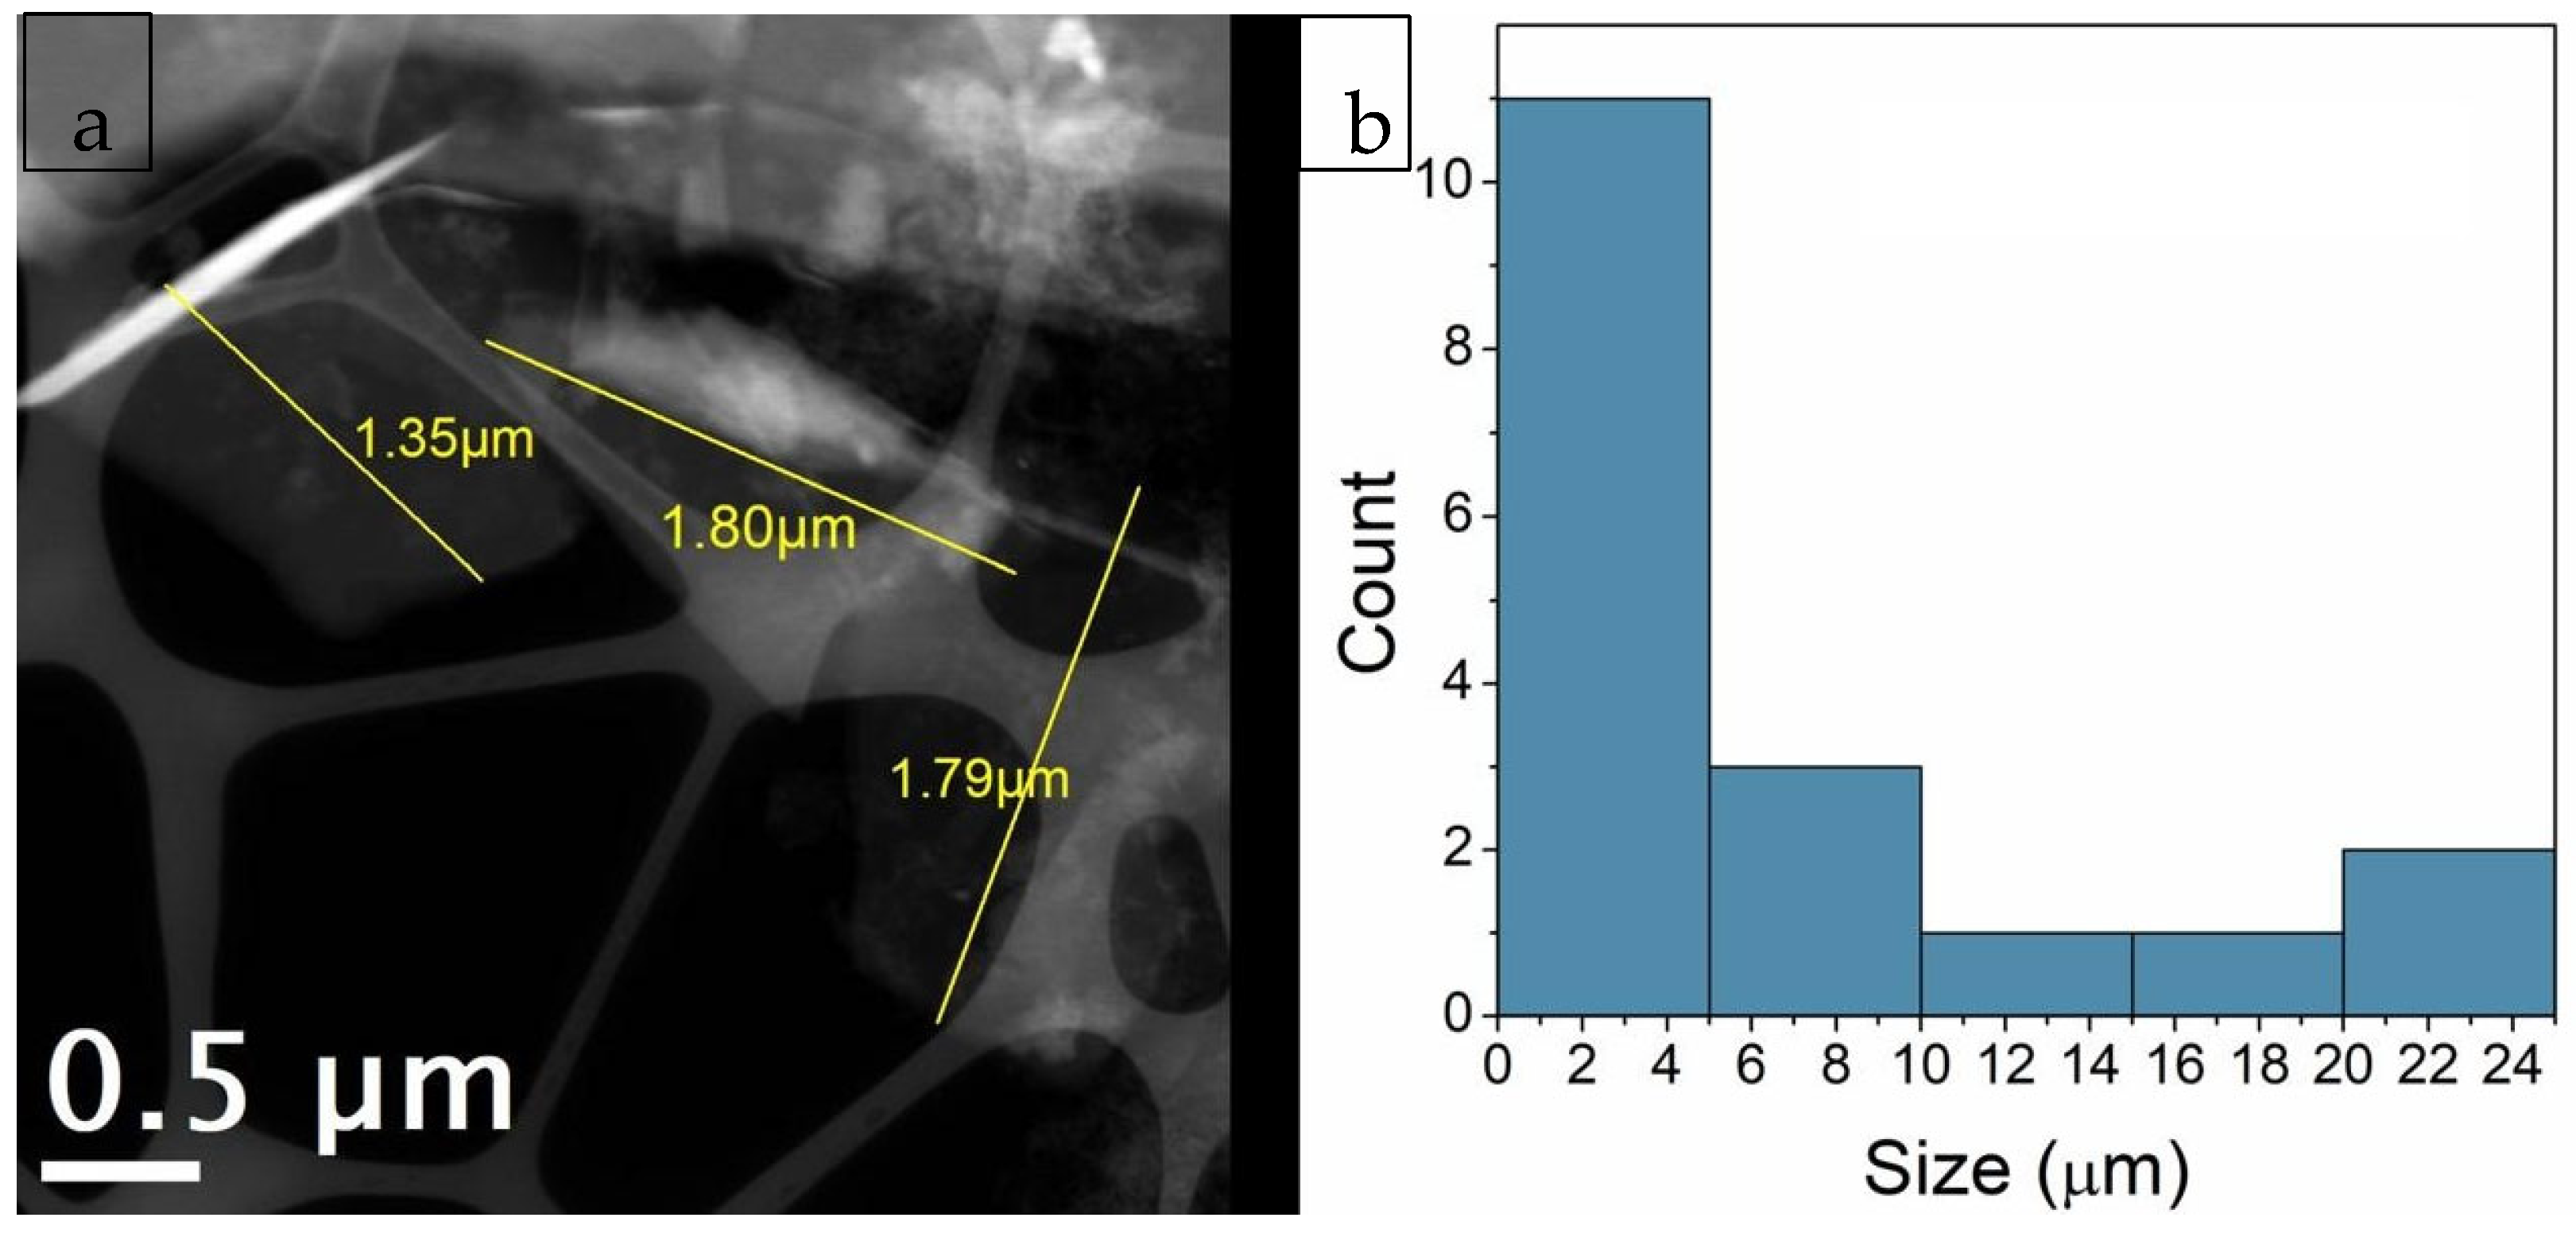
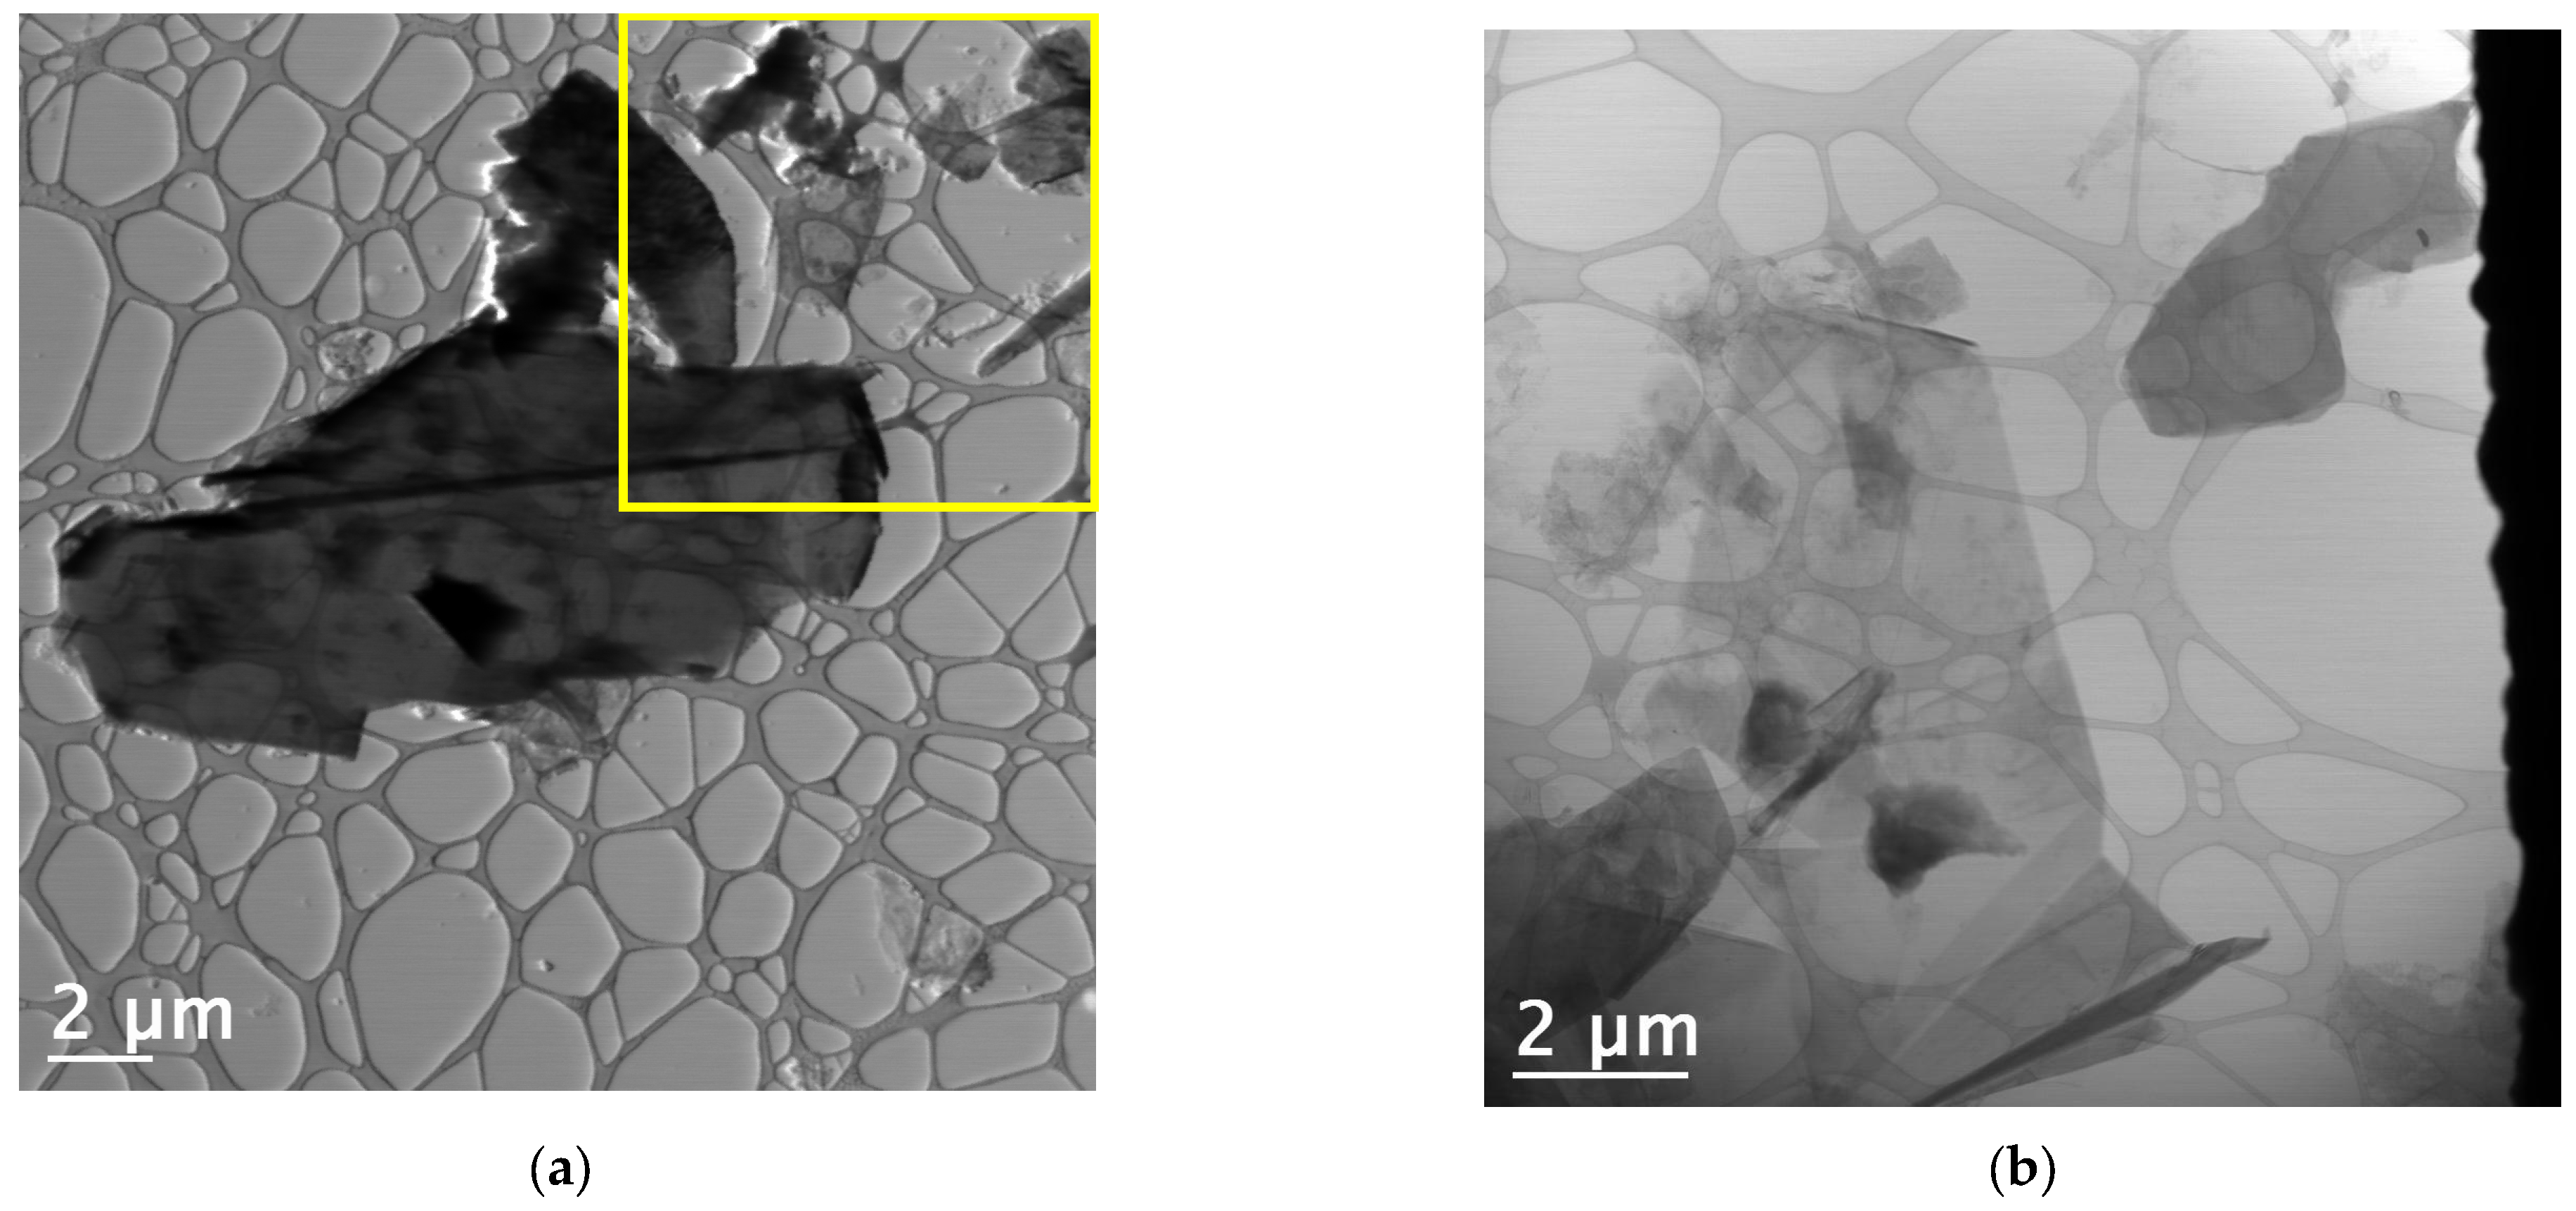
3.7. Transmission Electron Microscopy (TEM) Analysis
4. Conclusions
Author Contributions
Funding
Institutional Review Board Statement
Informed Consent Statement
Data Availability Statement
Acknowledgments
Conflicts of Interest
References
- Van Schmus, W.R.; Oliveira, E.P.; Silva Filho, A.F.; Toteu, S.F. Proterozoic links between the Borborema Province, NE Brazil, and the Central African Fold Belt. Geol. Soc. Lond. Spec. Publ. 2011, 294, 69–99. [Google Scholar] [CrossRef]
- Hodkiewicz, J. Characterizing carbon materials with Raman spectroscopy. Thermo Sci. Appl. Note 2010, 51946. [Google Scholar]
- Belém, J. Caracterização Mineralógica, Física e Termobarométrica de Minérios de Grafita da Província Grafítica Bahia-Minas. Master’s Thesis, Universidade Federal de Minas Gerais, Belo Horizonte, Brazil, 2006. [Google Scholar]
- Peng, W.; Li, H.; Hu, Y.; Liu, Y.; Song, S. Does silicate mineral impurities in natural graphite affect the characteristics of synthesized graphene? Mater. Res. Bull. 2016, 74, 333–339. [Google Scholar] [CrossRef]
- Nobre, A.G.; Martínez, J.A.E.; Terence, M.C.; Florêncio, O. The action of shear zones in the natural availability of graphite nanoplatelets: The example of the metadolomites of the Itaiacoca Group and the mica schist of the Dom Silverio Group. Braz. J. Anim. Environ. Res. 2020, 3, 3108–3118. [Google Scholar] [CrossRef]
- Nobre, A.G.; de Andrade, F.R.D.; Salazar-Naranjo, A.F.; Rigue, J.N.; da Silva, R.B.; Vlach, S.R.F.; Ando, R.A. Electrical resistance evolution of graphite and talc geological heterostructures under progressive metamorphism. C 2023, 9, 75. [Google Scholar] [CrossRef]
- Chehreh Chelgani, S.; Rudolph, M.; Kratzsch, R.; Sandmann, D.; Gutzmer, J. A review of graphite beneficiation techniques. Miner. Process. Extr. Metall. Rev. 2016, 37, 58–68. [Google Scholar] [CrossRef]
- Vasumathi, N.; Sarjekar, A.; Chandrayan, H.; Chennakesavulu, K.; Reddy, G.R.; Vijaya Kumar, T.V.; El-Gendy, N.S.; Gopalkrishna, S.J. A mini review on flotation techniques and reagents used in graphite beneficiation. Int. J. Chem. Eng. 2023, 2023, 1007689. [Google Scholar] [CrossRef]
- Ithnin, N.F.B.M.; Liu, W.W. Exfoliation of Graphite into Graphene Oxide and Reduction by Plant Extract to Synthesize Graphene. Int. J. Nanoelectron. Mater. 2024, 17, 284. [Google Scholar]
- Nobre, A.G.; da Silva, L.P.N.; de Andrade, F.R.D. Graphene geology and the fourth industrial revolution. In Proceedings of the 7th Brazilian Technology Symposium (BTSym’21); Smart Innovation, Systems and Technologies; Iano, Y., Saotome, O., Kemper Vásquez, G.L., Cotrim Pezzuto, C., Arthur, R., Gomes de Oliveira, G., Eds.; Springer: Cham, Switzerland, 2023; Volume 207. [Google Scholar]
- Nobre, A.G.; Martínez, J.A.E.; Florêncio, O. Mineral nanotechnology in circular economy. In Proceedings of the 6th Brazilian Technology Symposium (BTSym’20); Smart Innovation, Systems and Technologies; Iano, Y., Saotome, O., Kemper, G., Mendes de Seixas, A.C., Gomes de Oliveira, G., Eds.; Springer: Cham, Switzerland, 2021; Volume 233. [Google Scholar]
- Potts, J.R.; Dreyer, D.R.; Bielawski, C.W.; Ruoff, R.S. Graphene-based polymer nanocomposites. Polymer 2011, 52, 5–25. [Google Scholar] [CrossRef]
- Zhang, X.; Xu, Y.; Wang, M.; Liu, E.; Zhao, N.; Shi, C.; Lin, D.; Zhu, F.; He, C. A powder-metallurgy-based strategy toward three-dimensional graphene-like network for reinforcing copper matrix composites. Nat. Commun. 2020, 11, 2775. [Google Scholar] [CrossRef]
- Tan, L.; Wang, C.; Zeng, M.; Fu, L. Graphene: An outstanding multifunctional coating for conventional materials. Small 2017, 13, 1603337. [Google Scholar] [CrossRef] [PubMed]
- Kulyk, B.; Freitas, M.A.; Santos, N.F.; Mohseni, F.; Carvalho, A.F.; Yasakau, K.; Fernandes, A.J.; Bernardes, A.; Figueiredo, B.; Silva, R.; et al. A critical review on the production and application of graphene and graphene-based materials in anti-corrosion coatings. Crit. Rev. Solid State Mater. Sci. 2021, 47, 309–355. [Google Scholar] [CrossRef]
- Belov, D.V.; Belyaev, S.N.; Radishchev, D.B.; Okhapkin, A.I. Synthesis of coatings based on graphene-like materials and study of their physicochemical properties. Inorg. Mater. Appl. Res. 2024, 15, 506–522. [Google Scholar] [CrossRef]
- Wakamatsu, T.; Numata, Y. Flotation of graphite. Miner. Eng. 1991, 4, 975–982. [Google Scholar] [CrossRef]
- Wang, H.; Feng, Q.; Liu, K.; Zuo, K.; Tang, X. A novel technique for microcrystalline graphite beneficiation based on alkali-acid leaching process. Sep. Sci. Technol. 2017, 53, 982–989. [Google Scholar] [CrossRef]
- Xiyue, Z.; Hongjuan, S.; Tongjiang, P.; Li, Z.; Bo, L. Purification mechanism of microcrystalline graphite and dissolution of non-carbon impurity during alkali autoclave-acid leaching. Phys. Chem. Miner. 2024, 51, 25. [Google Scholar] [CrossRef]
- Sala, O. Fundamentos da Espectroscopia Raman e no Infravermelho, 2nd ed.; UNESP: São Paulo, Brazil, 2008. [Google Scholar]
- Ferrari, A.C. Raman spectroscopy of graphene and graphite: Disorder, electron–phonon coupling, doping and nonadiabatic effects. Solid State Commun. 2007, 143, 47–57. [Google Scholar] [CrossRef]
- Cuesta-López, S.; Fernández, M.L.; Menendez-Aguado, J.M.; Ricci, C. Raman Spectroscopy as a tool for identification and valorisation assessment of critical raw materials: Graphite case. In Proceedings of the Mineral Exploration Symposium, Virtual Event, 17–18 September 2020. [Google Scholar]
- Shokry, S.A.; Elmorsi, A.K.; Elsrogy, H. Preparation and Characterization of Chemically Converted Graphene from Natural Graphite. Egypt. J. Pet. 2024, 33, 16. [Google Scholar] [CrossRef]
- Xie, X.; Zhang, J.; Chen, Y.; Wang, C. A method for the preparation of graphene from spent graphite of retired lithium-ion batteries. J. Power Sources 2024, 594, 234023. [Google Scholar] [CrossRef]
- Hontoria-Lucas, C.; López-Peinado, A.J.; López-González, J.D.; Rojas-Cervantes, M.L.; Martín-Aranda, R.M. Study of oxygen-containing groups in a series of graphite oxides: Physical and chemical characterization. Carbon 1995, 33, 1585–1592. [Google Scholar] [CrossRef]
- Dreyer, D.R.; Park, S.; Bielawski, C.W.; Ruoff, R.S. The chemistry of graphene oxide. Chem. Soc. Rev. 2010, 39, 228–240. [Google Scholar] [CrossRef] [PubMed]
- Zólyomi, V.; Koltai, J.; Kürti, J. Resonance Raman spectroscopy of graphite and graphene. Phys. Status Solidi B 2011, 248, 2435–2444. [Google Scholar] [CrossRef]
- Lu, S.; Yao, M.; Yang, X.; Li, Q.; Xiao, J.; Yao, Z.; Jiang, L.; Liu, R.; Liu, B.; Chen, S.; et al. High-pressure transformation of graphene nanoplates: A Raman study. Chem. Phys. Lett. 2013, 585, 101–106. [Google Scholar] [CrossRef]
- Ahmad, I.; McCarthy, J.E.; Baranov, A.; Gun’ko, Y.K. Development of Graphene Nano-Platelet Based Counter Electrodes for Solar Cells. Materials 2015, 8, 5953–5973. [Google Scholar] [CrossRef]
- Cançado, L.G.; Monken, V.P.; Campos, J.L.E.; Santos, J.C.C.; Backes, C.; Chacham, H.; Neves, B.R.A.; Jorio, A. Science and Metrology of defects in graphene using Raman Spectroscopy. Carbon 2024, 220, 118801. [Google Scholar] [CrossRef]
- Ferrari, A.C.; Meyer, J.C.; Scardaci, V.; Casiraghi, C.; Lazzeri, M.; Mauri, F.; Piscanec, S.; Jiang, D.; Novoselov, K.S.; Roth, S.; et al. Raman spectrum of graphene and graphene layers. Phys. Rev. Lett. 2006, 97, 187401. [Google Scholar] [CrossRef]
- Panyathip, R.; Sucharitakul, S.; Phaduangdhitidhada, S.; Ngamjarurojana, A.; Kumnorkaew, P.; Choopun, S. Surface Enhanced Raman Scattering in Graphene Quantum Dots Grown via Electrochemical Process. Molecules 2021, 26, 5484. [Google Scholar] [CrossRef]
- Pimenta, M.A.; Dresselhaus, G.; Dresselhaus, M.S.; Cançado, L.G.; Jorio, A.; Saito, R. Studying disorder in graphite-based systems by Raman spectroscopy. Phys. Chem. Chem. Phys. 2007, 9, 1276–1290. [Google Scholar] [CrossRef]
- Sparavigna, A.C. Graphene, Graphene Oxide and Carbon Nanotubes in Raman Spectroscopy. Int. J. Sci. 2024, 13, 1–26. [Google Scholar] [CrossRef]
- Wu, W.; Ranasinghe, J.C.; Chatterjee, A.; Huang, S. Recent advances on Raman spectroscopy of graphene: Towards biosensing applications. Mater. Chem. Phys. 2024, 318, 129281. [Google Scholar] [CrossRef]
- Bokobza, L.; Bruneel, J.L.; Couzi, M. Raman spectra of carbon-based materials (from graphite to carbon black) and of some silicone composites. C 2015, 1, 77–94. [Google Scholar] [CrossRef]
- Ramirez, C.; Osendi, M.I. Characterization of graphene nanoplatelets-Si3N4 composites by Raman spectroscopy. J. Eur. Ceram. Soc. 2013, 33, 471–477. [Google Scholar] [CrossRef]
- Ojrzyńska, M.; Jamroz, J.; Maciałowicz, M.; Wilczyński, K.; Daniszewska, A.; Antonowicz, J.; Zdrojek, M. Quality and thickness control of graphene nanoplatelets during large-scale production using liquid phase exfoliation. Mater. Today Commun. 2025, 42, 111543. [Google Scholar] [CrossRef]
- Muzyka, R.; Drewniak, S.; Pustelny, T.; Chrubasik, M.; Gryglewicz, G. Characterization of graphite oxide and reduced graphene oxide obtained from different graphite precursors and oxidized by different methods using Raman spectroscopy. Materials 2018, 11, 1050. [Google Scholar] [CrossRef]
- Patel, J.; Kiani, A. Comparative study of tribological behaviours of different base greases enhanced by graphene nano platelets. Ind. Lubr. Tribol. 2019, 71, 1054–1061. [Google Scholar]
- Lavini, F.; Cellini, F.; Rejhon, M.; Kunc, J.; Berger, C.; Heer, W.; Riedo, E. Atomic force microscopy phase imaging of epitaxial graphene films. J. Phys. Mater. 2020, 3, 045001. [Google Scholar] [CrossRef]


| C-Bulk | Chemical Formula | Space Group | Weight Fraction (%) | Lattice Parameters (Å, °) | Cell Volume (Å3) | Rwp (%) | GOF (χ2) | Crystallite Size (nm) |
|---|---|---|---|---|---|---|---|---|
| Muscovite | KAl2(AlSi3O10)(OH)2 | C 1 2/c 1 | 0.1 | a = 13.20 b = 4.84 c = 14.66 β = 68.89° | 875.86 | 16.9 | 1.53 | 19.01 |
| Graphite | C | P 63/m m c | 71.4 | a = 2.463; c = 6.719 | 35.330 | 83.04 | ||
| Quartz | SiO2 | P 31 2 1 | 28.5 | a = 4.928; c = 5.519 | 116.125 | 42.30 | ||
| C-NaOH + H2SO4 Treatment | Chemical Formula | Space Group | Weight Fraction (%) | Lattice Parameters (Å, °) | Cell Volume (Å3) | Rwp (%) | GOF (χ2) | Crystallite Size (nm) |
| Graphite | C | P 63/m m c | 100.00 | a = 2.53777 c = 6.77568 | 37.791 | 15.02 | 1.532 | 130 |
| Analyses | SiO2 | Al2O3 | CaO | MgO | K2O | TiO2 | MnO | Fe2O3 | SO3 | Cl | P2O5 | Co2O3 | Rh2O3 |
|---|---|---|---|---|---|---|---|---|---|---|---|---|---|
| Method | XRF | XRF | XRF | XRF | XRF | XRF | XRF | XRF | XRF | XRF | XRF | XRF | XRF |
| Unit | % | % | % | % | % | % | % | % | % | % | % | % | % |
| Detection Limit | 0.01 | 0.01 | 0.01 | 0.01 | 0.01 | 0.01 | 0.01 | 0.01 | 0.01 | 0.01 | 0.01 | 0.01 | 0.01 |
| Stage 1 | 42.43 | 18.88 | 2.19 | 1.06 | 7.55 | 2.69 | 2.69 | 23.81 | 0.34 | 0.62 | 0.00 | 0.00 | 0.00 |
| Stage 2 | 31.02 | 15.65 | 2.44 | 0.00 | 6.32 | 2.90 | 0.54 | 36.16 | 0.37 | 0.75 | 3.67 | 0.18 | 0.00 |
| Stage 3 | 29.75 | 12.88 | 2.61 | 1.06 | 5.13 | 3.52 | 0.34 | 39.78 | 0.00 | 0.00 | 3.73 | 0.00 | 1.22 |
| Stage 4 | 75.65 | 3.63 | 4.70 | 0.00 | 3.71 | 0.00 | 0.00 | 0.86 | 0.00 | 0.00 | 11.45 | 0.00 | 0.00 |
Disclaimer/Publisher’s Note: The statements, opinions and data contained in all publications are solely those of the individual author(s) and contributor(s) and not of MDPI and/or the editor(s). MDPI and/or the editor(s) disclaim responsibility for any injury to people or property resulting from any ideas, methods, instructions or products referred to in the content. |
© 2025 by the authors. Licensee MDPI, Basel, Switzerland. This article is an open access article distributed under the terms and conditions of the Creative Commons Attribution (CC BY) license (https://creativecommons.org/licenses/by/4.0/).
Share and Cite
Santos, L.; Ayala, A.; Silva, R.; Moura, T.; Farias, J.; Nobre, A.; Araújo, B.; Vasconcelos, F.; Rocha, J. Purification and Preparation of Graphene-like Nanoplates from Natural Graphite of Canindé, CE, Northeast-Brazil. Materials 2025, 18, 3162. https://doi.org/10.3390/ma18133162
Santos L, Ayala A, Silva R, Moura T, Farias J, Nobre A, Araújo B, Vasconcelos F, Rocha J. Purification and Preparation of Graphene-like Nanoplates from Natural Graphite of Canindé, CE, Northeast-Brazil. Materials. 2025; 18(13):3162. https://doi.org/10.3390/ma18133162
Chicago/Turabian StyleSantos, Lucilene, Alejandro Ayala, Raul Silva, Thiago Moura, João Farias, Augusto Nobre, Bruno Araújo, Francisco Vasconcelos, and Janaína Rocha. 2025. "Purification and Preparation of Graphene-like Nanoplates from Natural Graphite of Canindé, CE, Northeast-Brazil" Materials 18, no. 13: 3162. https://doi.org/10.3390/ma18133162
APA StyleSantos, L., Ayala, A., Silva, R., Moura, T., Farias, J., Nobre, A., Araújo, B., Vasconcelos, F., & Rocha, J. (2025). Purification and Preparation of Graphene-like Nanoplates from Natural Graphite of Canindé, CE, Northeast-Brazil. Materials, 18(13), 3162. https://doi.org/10.3390/ma18133162