Author Contributions
Conceptualization, K.Y. and J.R.; methodology, S.Z. (Shenghan Zhuang) and J.R.; formal analysis, J.R.; investigation, K.Y., S.Z. (Shenghan Zhuang), Y.W., S.Z. (Shuo Zhou), and J.L.; resources, K.Y. and S.Z. (Shenghan Zhuang); data curation, K.Y., S.Z. (Shenghan Zhuang), and J.R.; writing—original draft preparation, K.Y., S.Z. (Shenghan Zhuang) and J.R.; writing—review and editing, J.R.; visualization, Y.W., J.L., and J.R.; supervision, J.R.; project administration, K.Y., S.Z. (Shenghan Zhuang), and J.R.; funding acquisition, K.Y. and J.R. All authors have read and agreed to the published version of the manuscript.
Figure 1.
Aggregates with different particle sizes. (a) 5–10 mm, (b) 10–20 mm, and (c) 20–30 mm.
Figure 1.
Aggregates with different particle sizes. (a) 5–10 mm, (b) 10–20 mm, and (c) 20–30 mm.
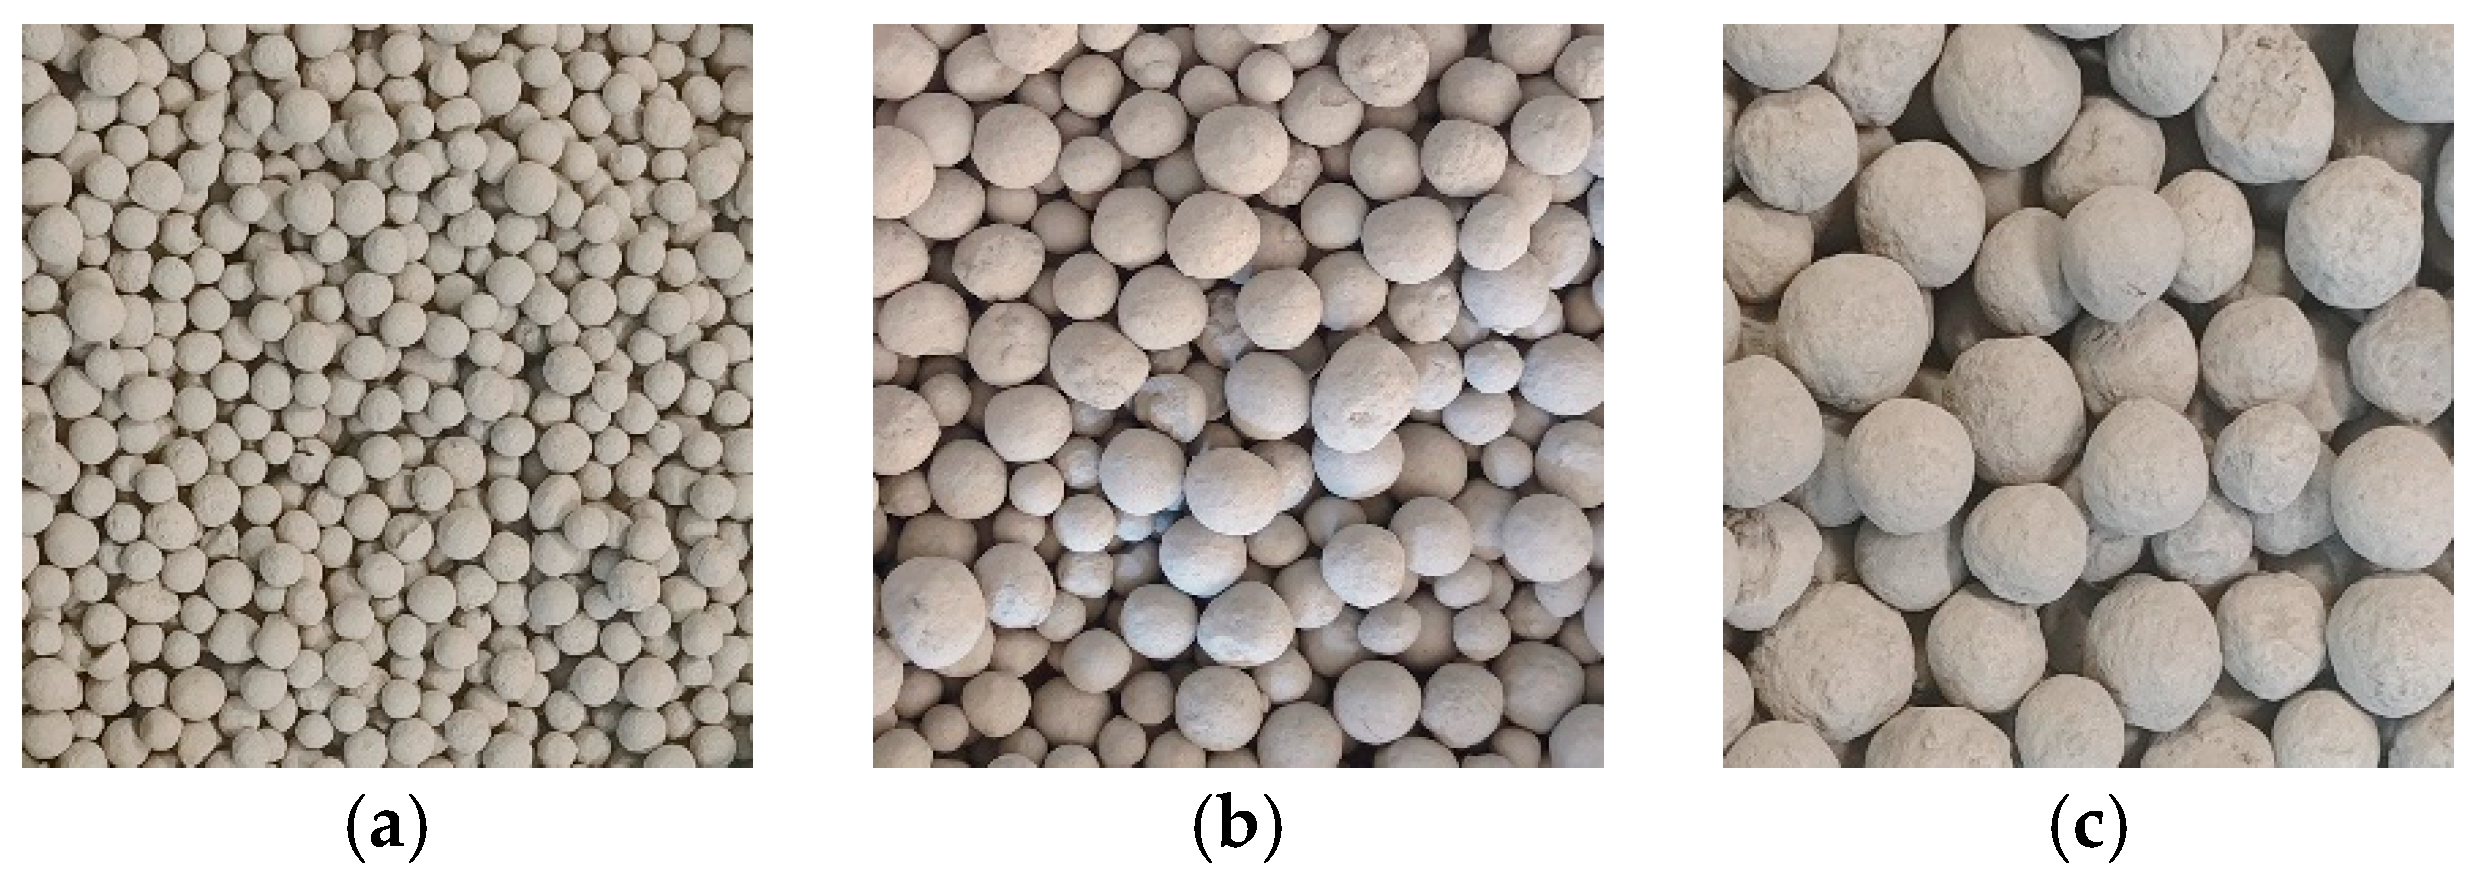
Figure 2.
Ceramsites with different sizes. (a) 5–10 mm, (b) 10–20 mm, and (c) 20–30 mm.
Figure 2.
Ceramsites with different sizes. (a) 5–10 mm, (b) 10–20 mm, and (c) 20–30 mm.
Figure 3.
Standard curing process of specimens.
Figure 3.
Standard curing process of specimens.
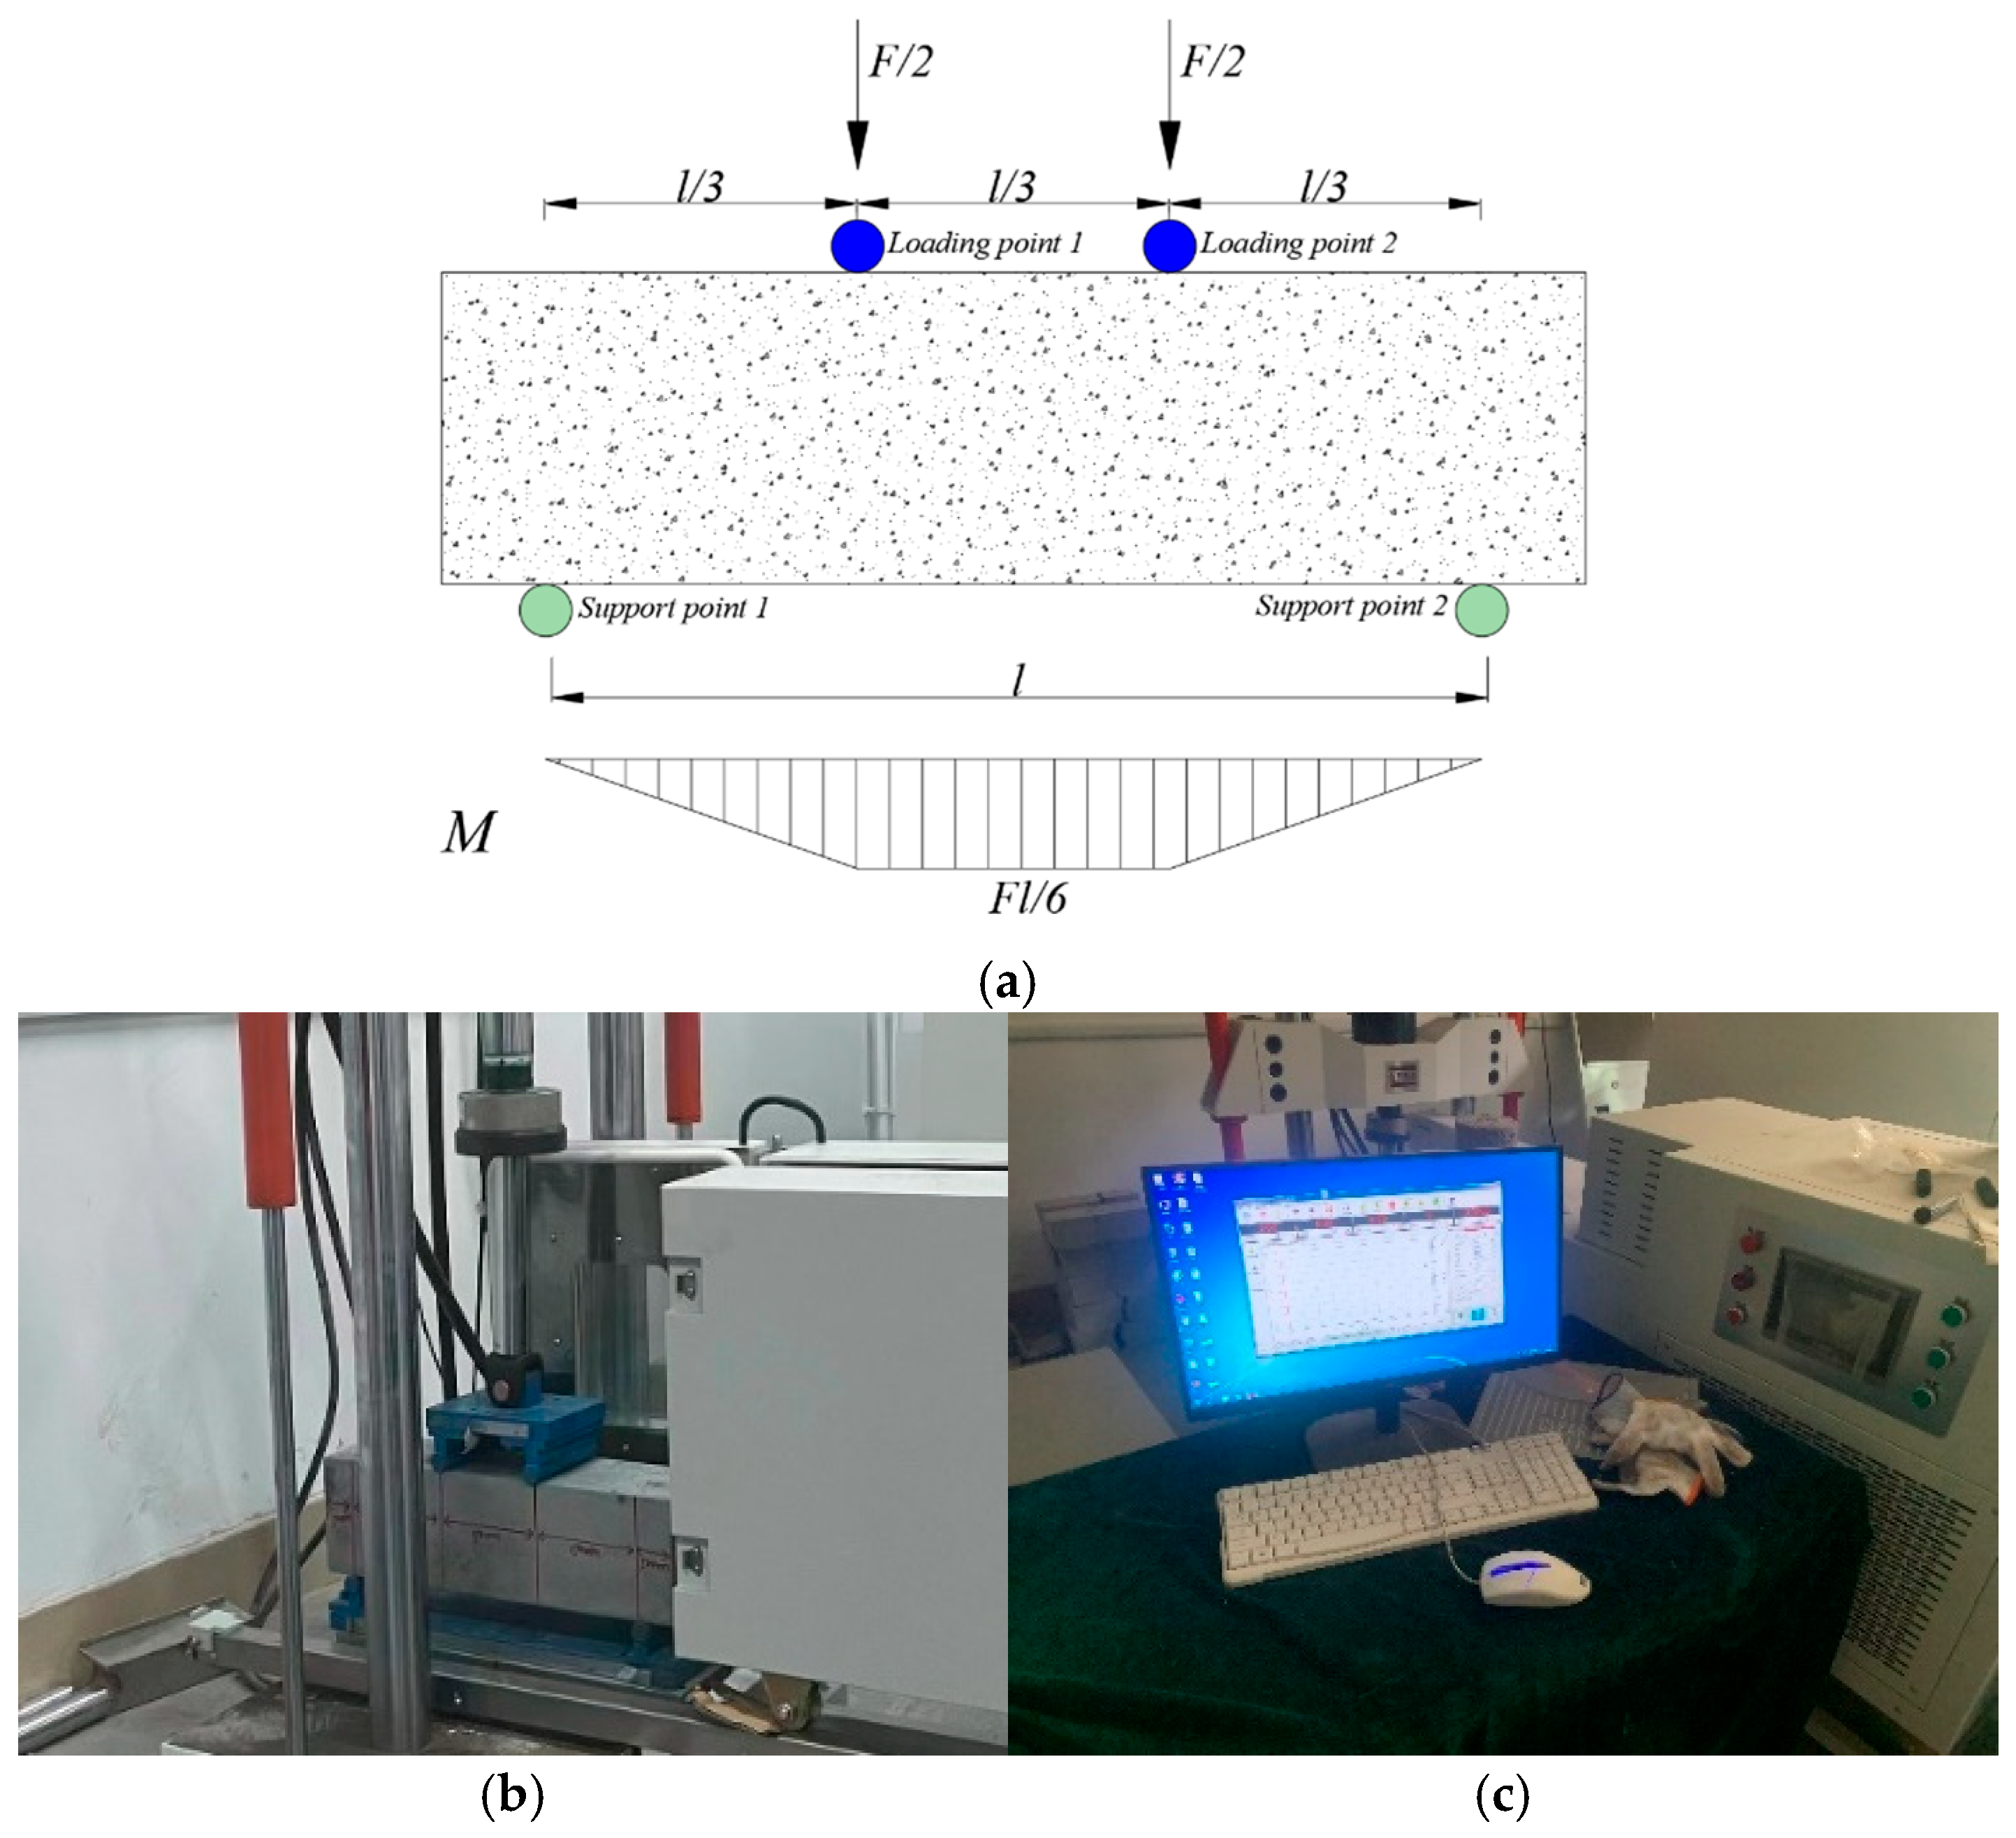
Figure 4.
Schematic diagram of fatigue test. (a) Four-point fatigue test force and bending moment situation, (b) testing machine, (c) and test machine control interface.
Figure 4.
Schematic diagram of fatigue test. (a) Four-point fatigue test force and bending moment situation, (b) testing machine, (c) and test machine control interface.
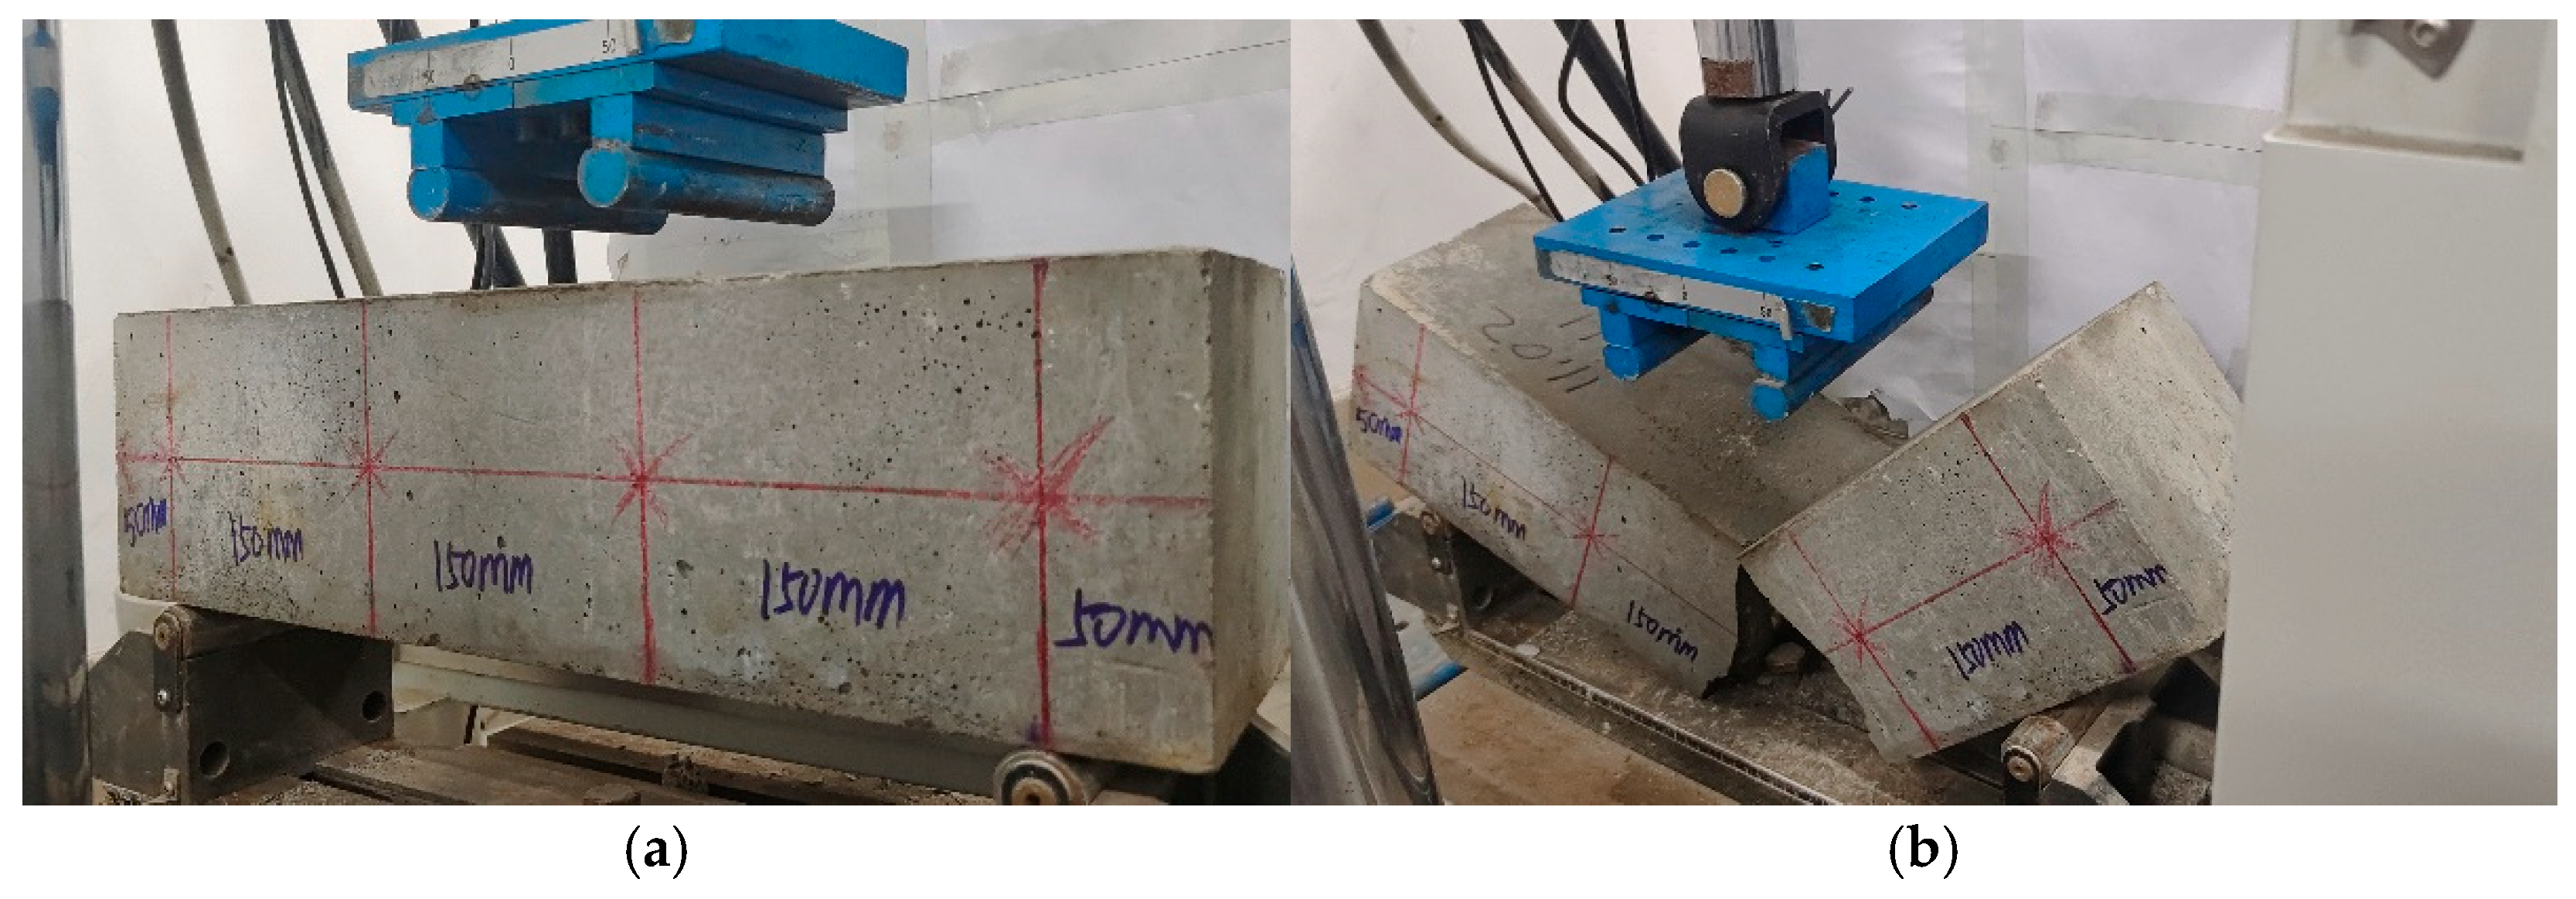
Figure 5.
Specimen placement and fracture. (a) Test piece placement, (b) test piece fracture.
Figure 5.
Specimen placement and fracture. (a) Test piece placement, (b) test piece fracture.
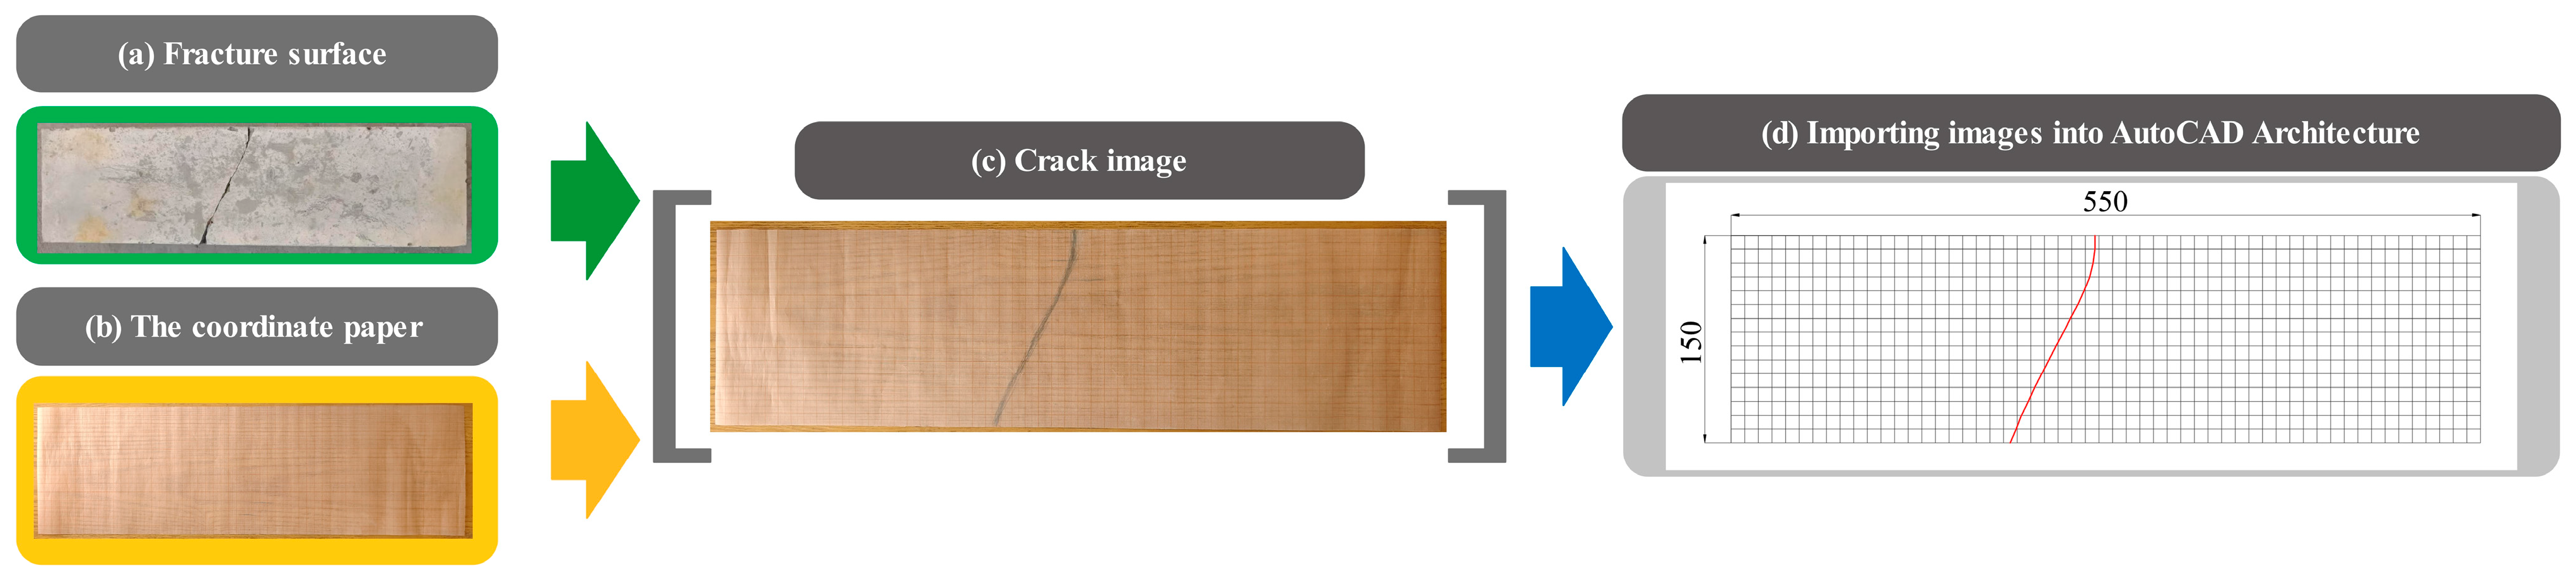
Figure 6.
Process for recording crack locations and angles.
Figure 6.
Process for recording crack locations and angles.
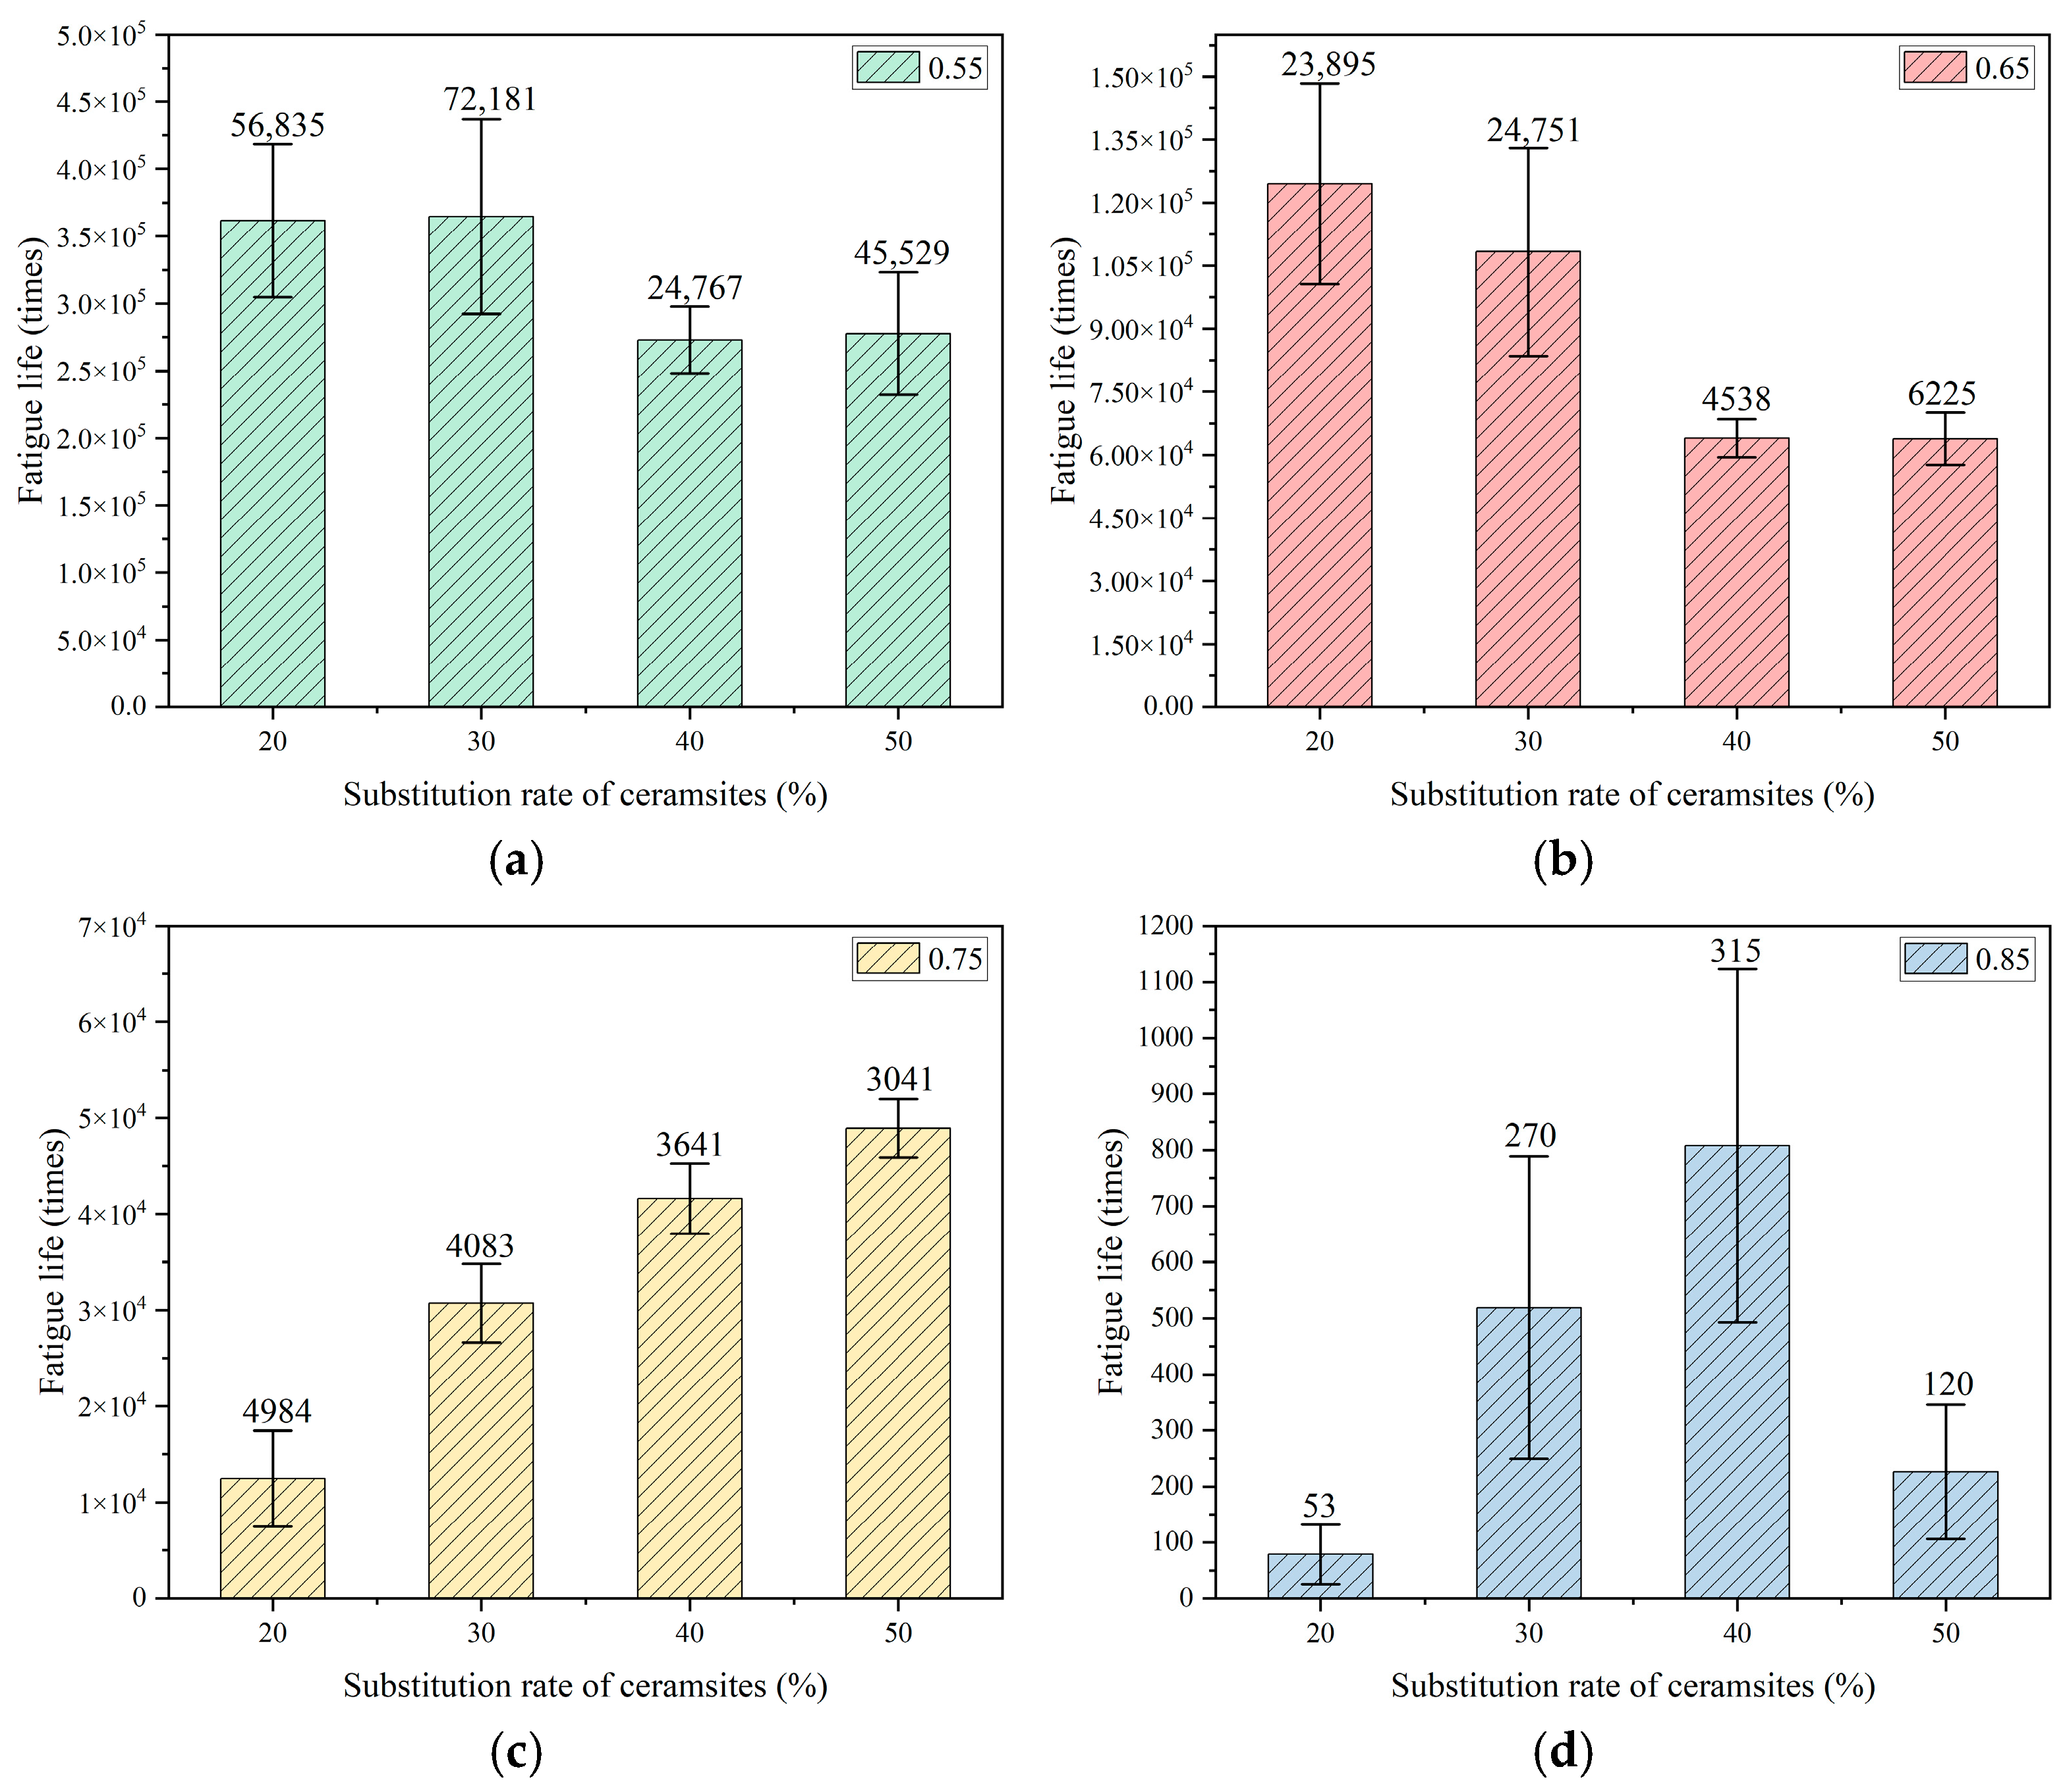
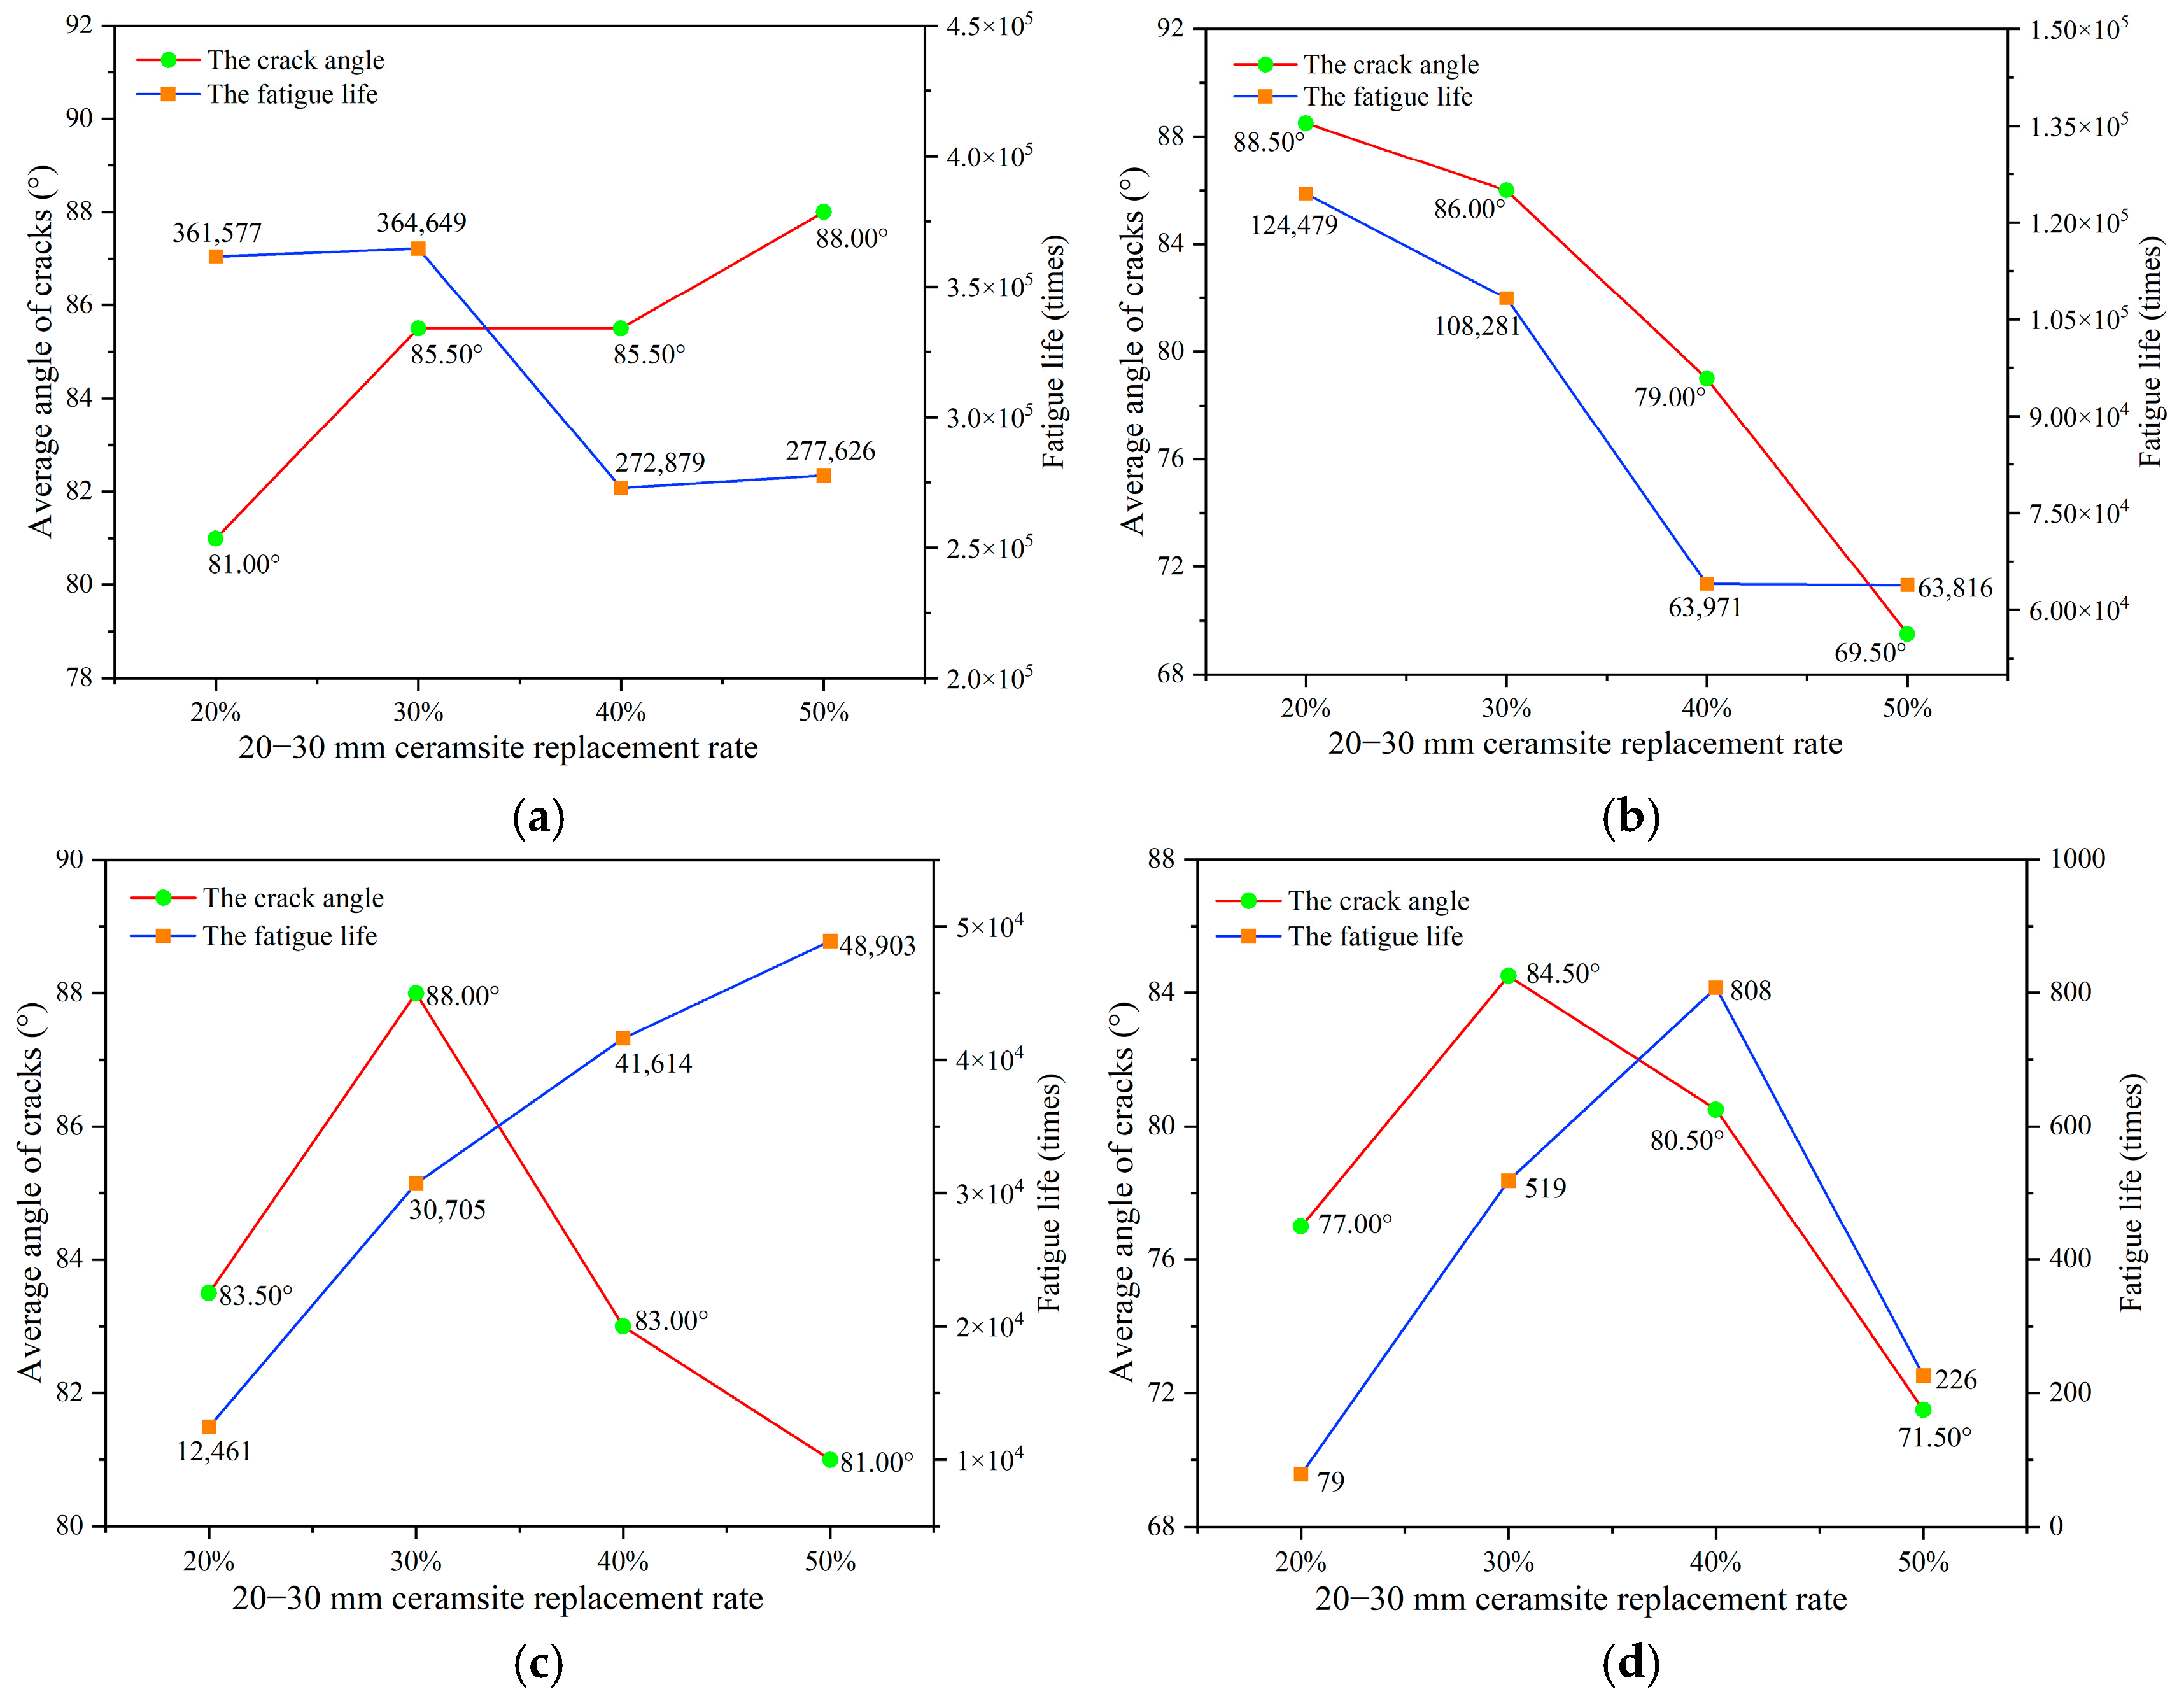
Figure 7.
The effect of a 20–30 mm ceramsite replacement rate on fatigue life. (a) The stress level was 0.55, (b) the stress level was 0.65, (c) the stress level was 0.75, (d) the stress level was 0.85.
Figure 7.
The effect of a 20–30 mm ceramsite replacement rate on fatigue life. (a) The stress level was 0.55, (b) the stress level was 0.65, (c) the stress level was 0.75, (d) the stress level was 0.85.
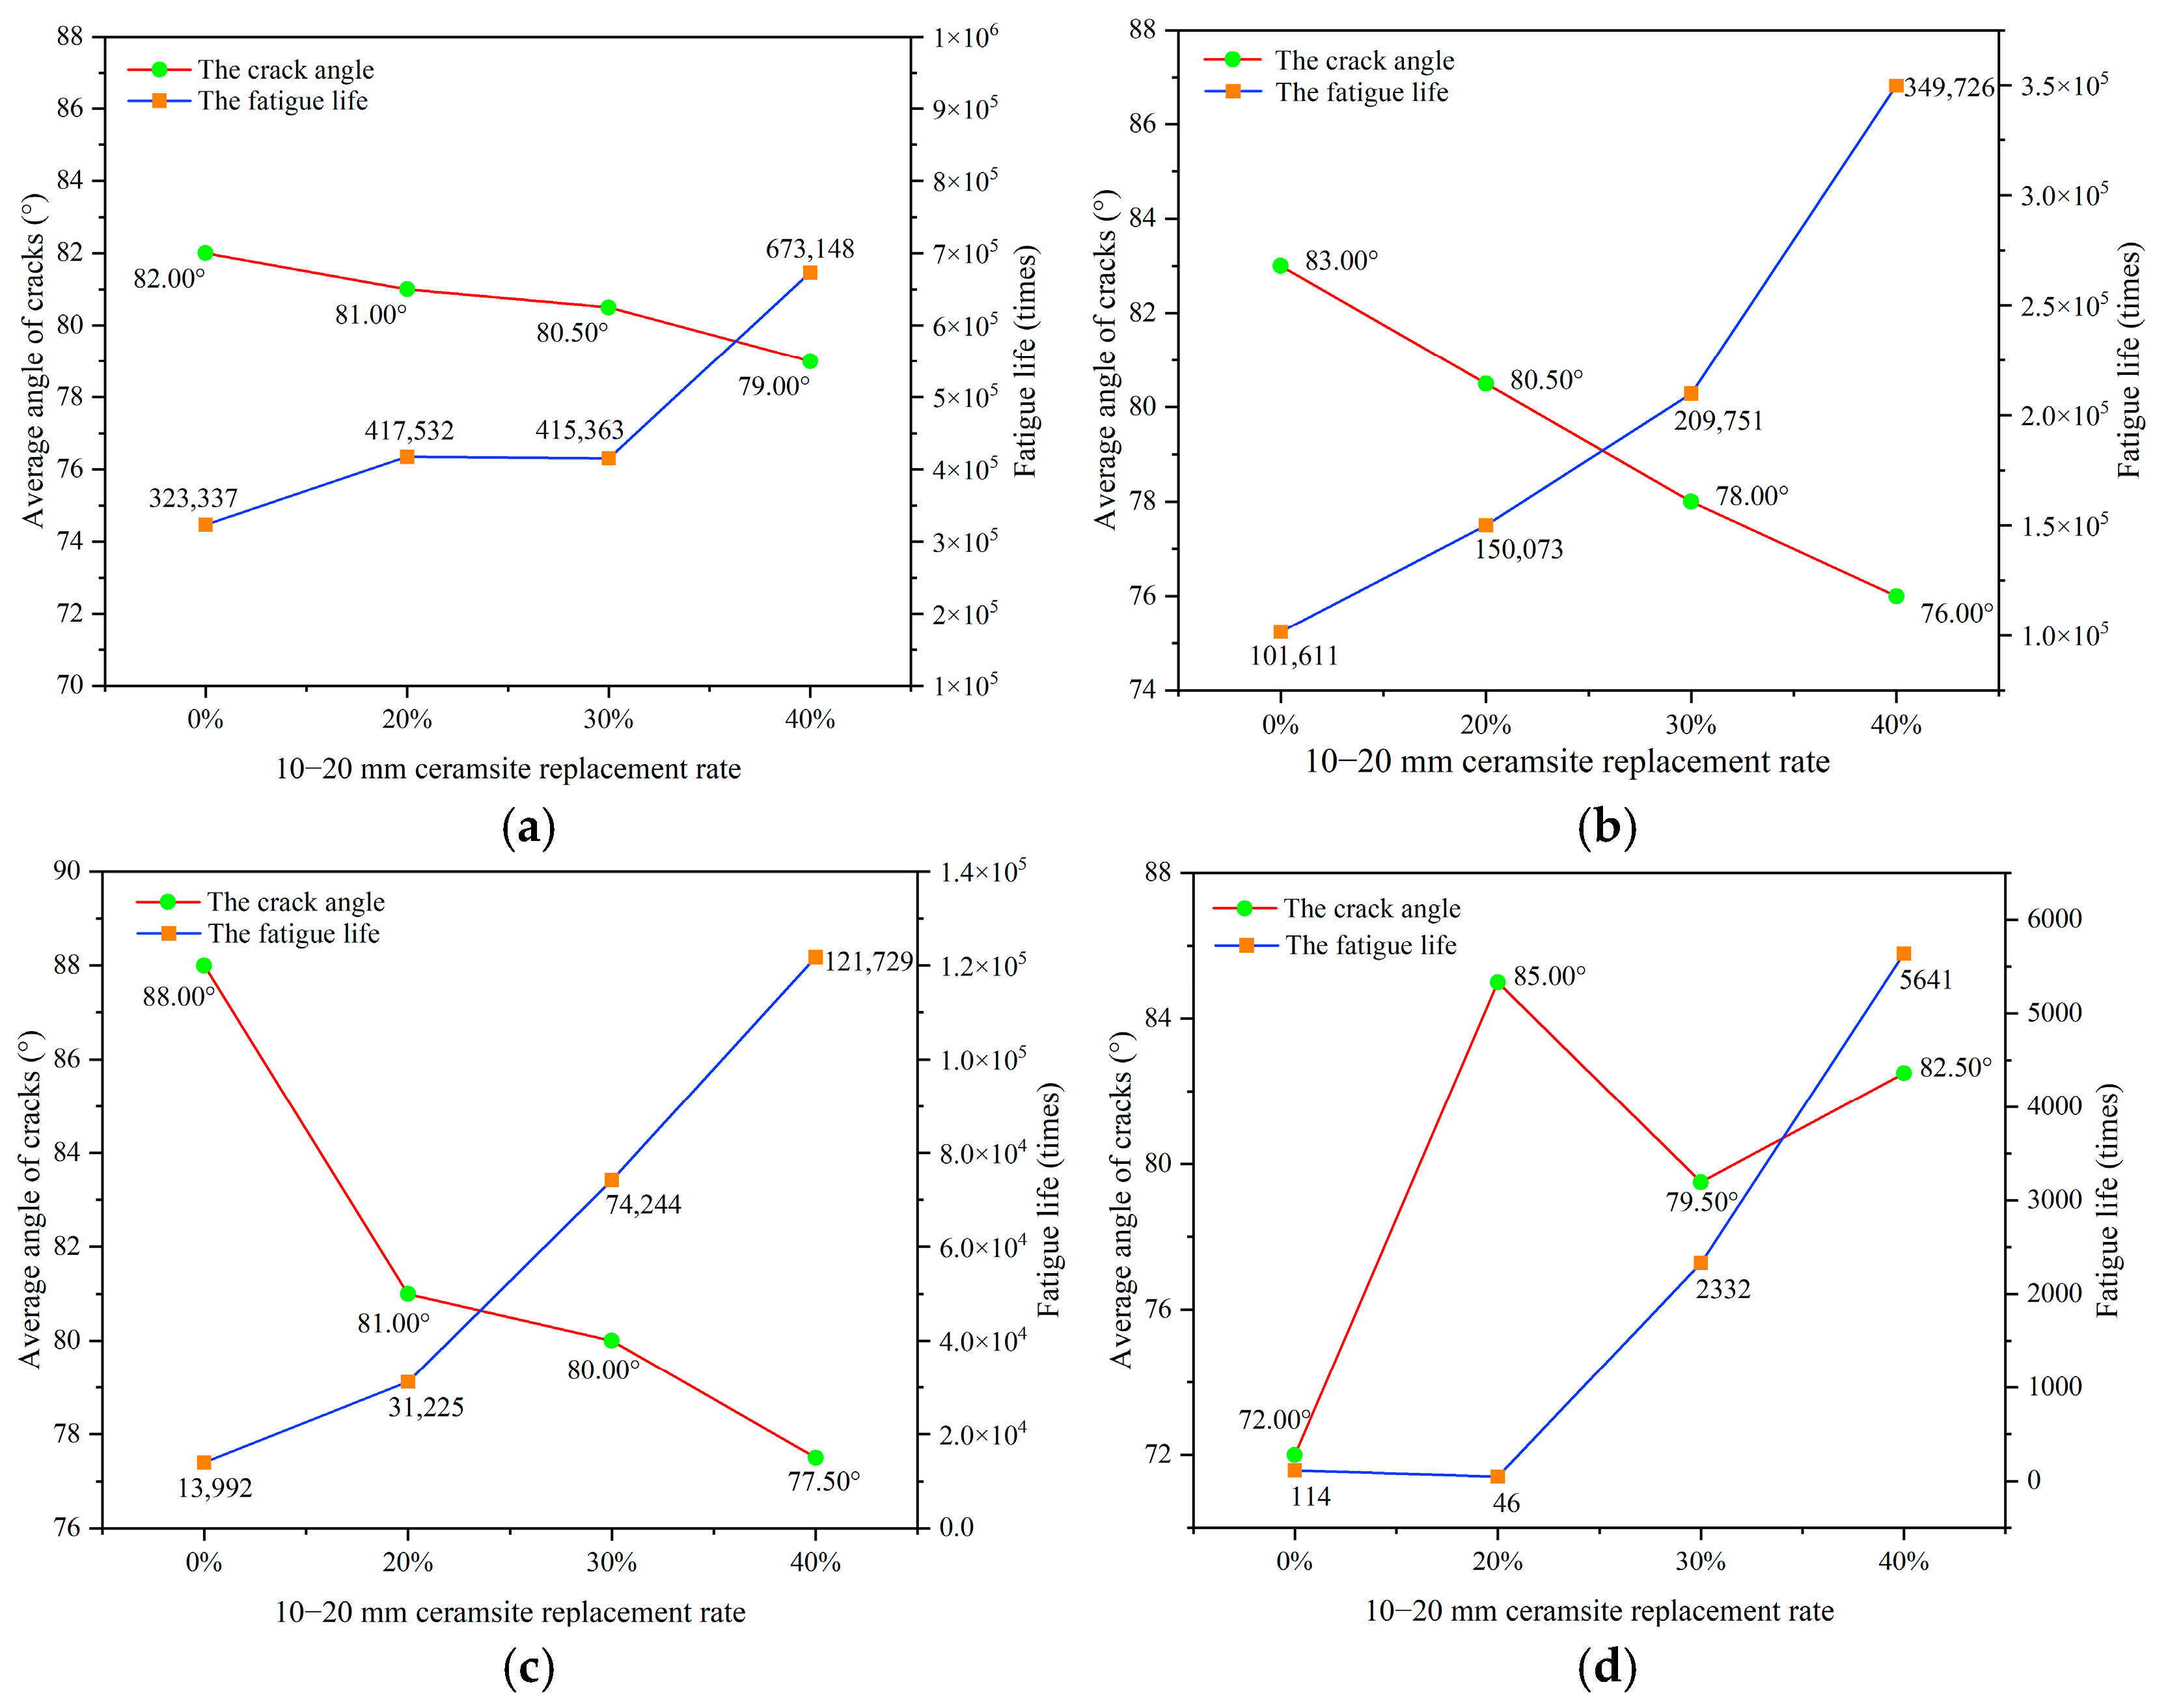
Figure 8.
The effect of a 10–20 mm ceramsite replacement rate on fatigue life. (a) The stress level was 0.55, (b) the stress level was 0.65, (c) the stress level was 0.75, (d) the stress level was 0.85.
Figure 8.
The effect of a 10–20 mm ceramsite replacement rate on fatigue life. (a) The stress level was 0.55, (b) the stress level was 0.65, (c) the stress level was 0.75, (d) the stress level was 0.85.
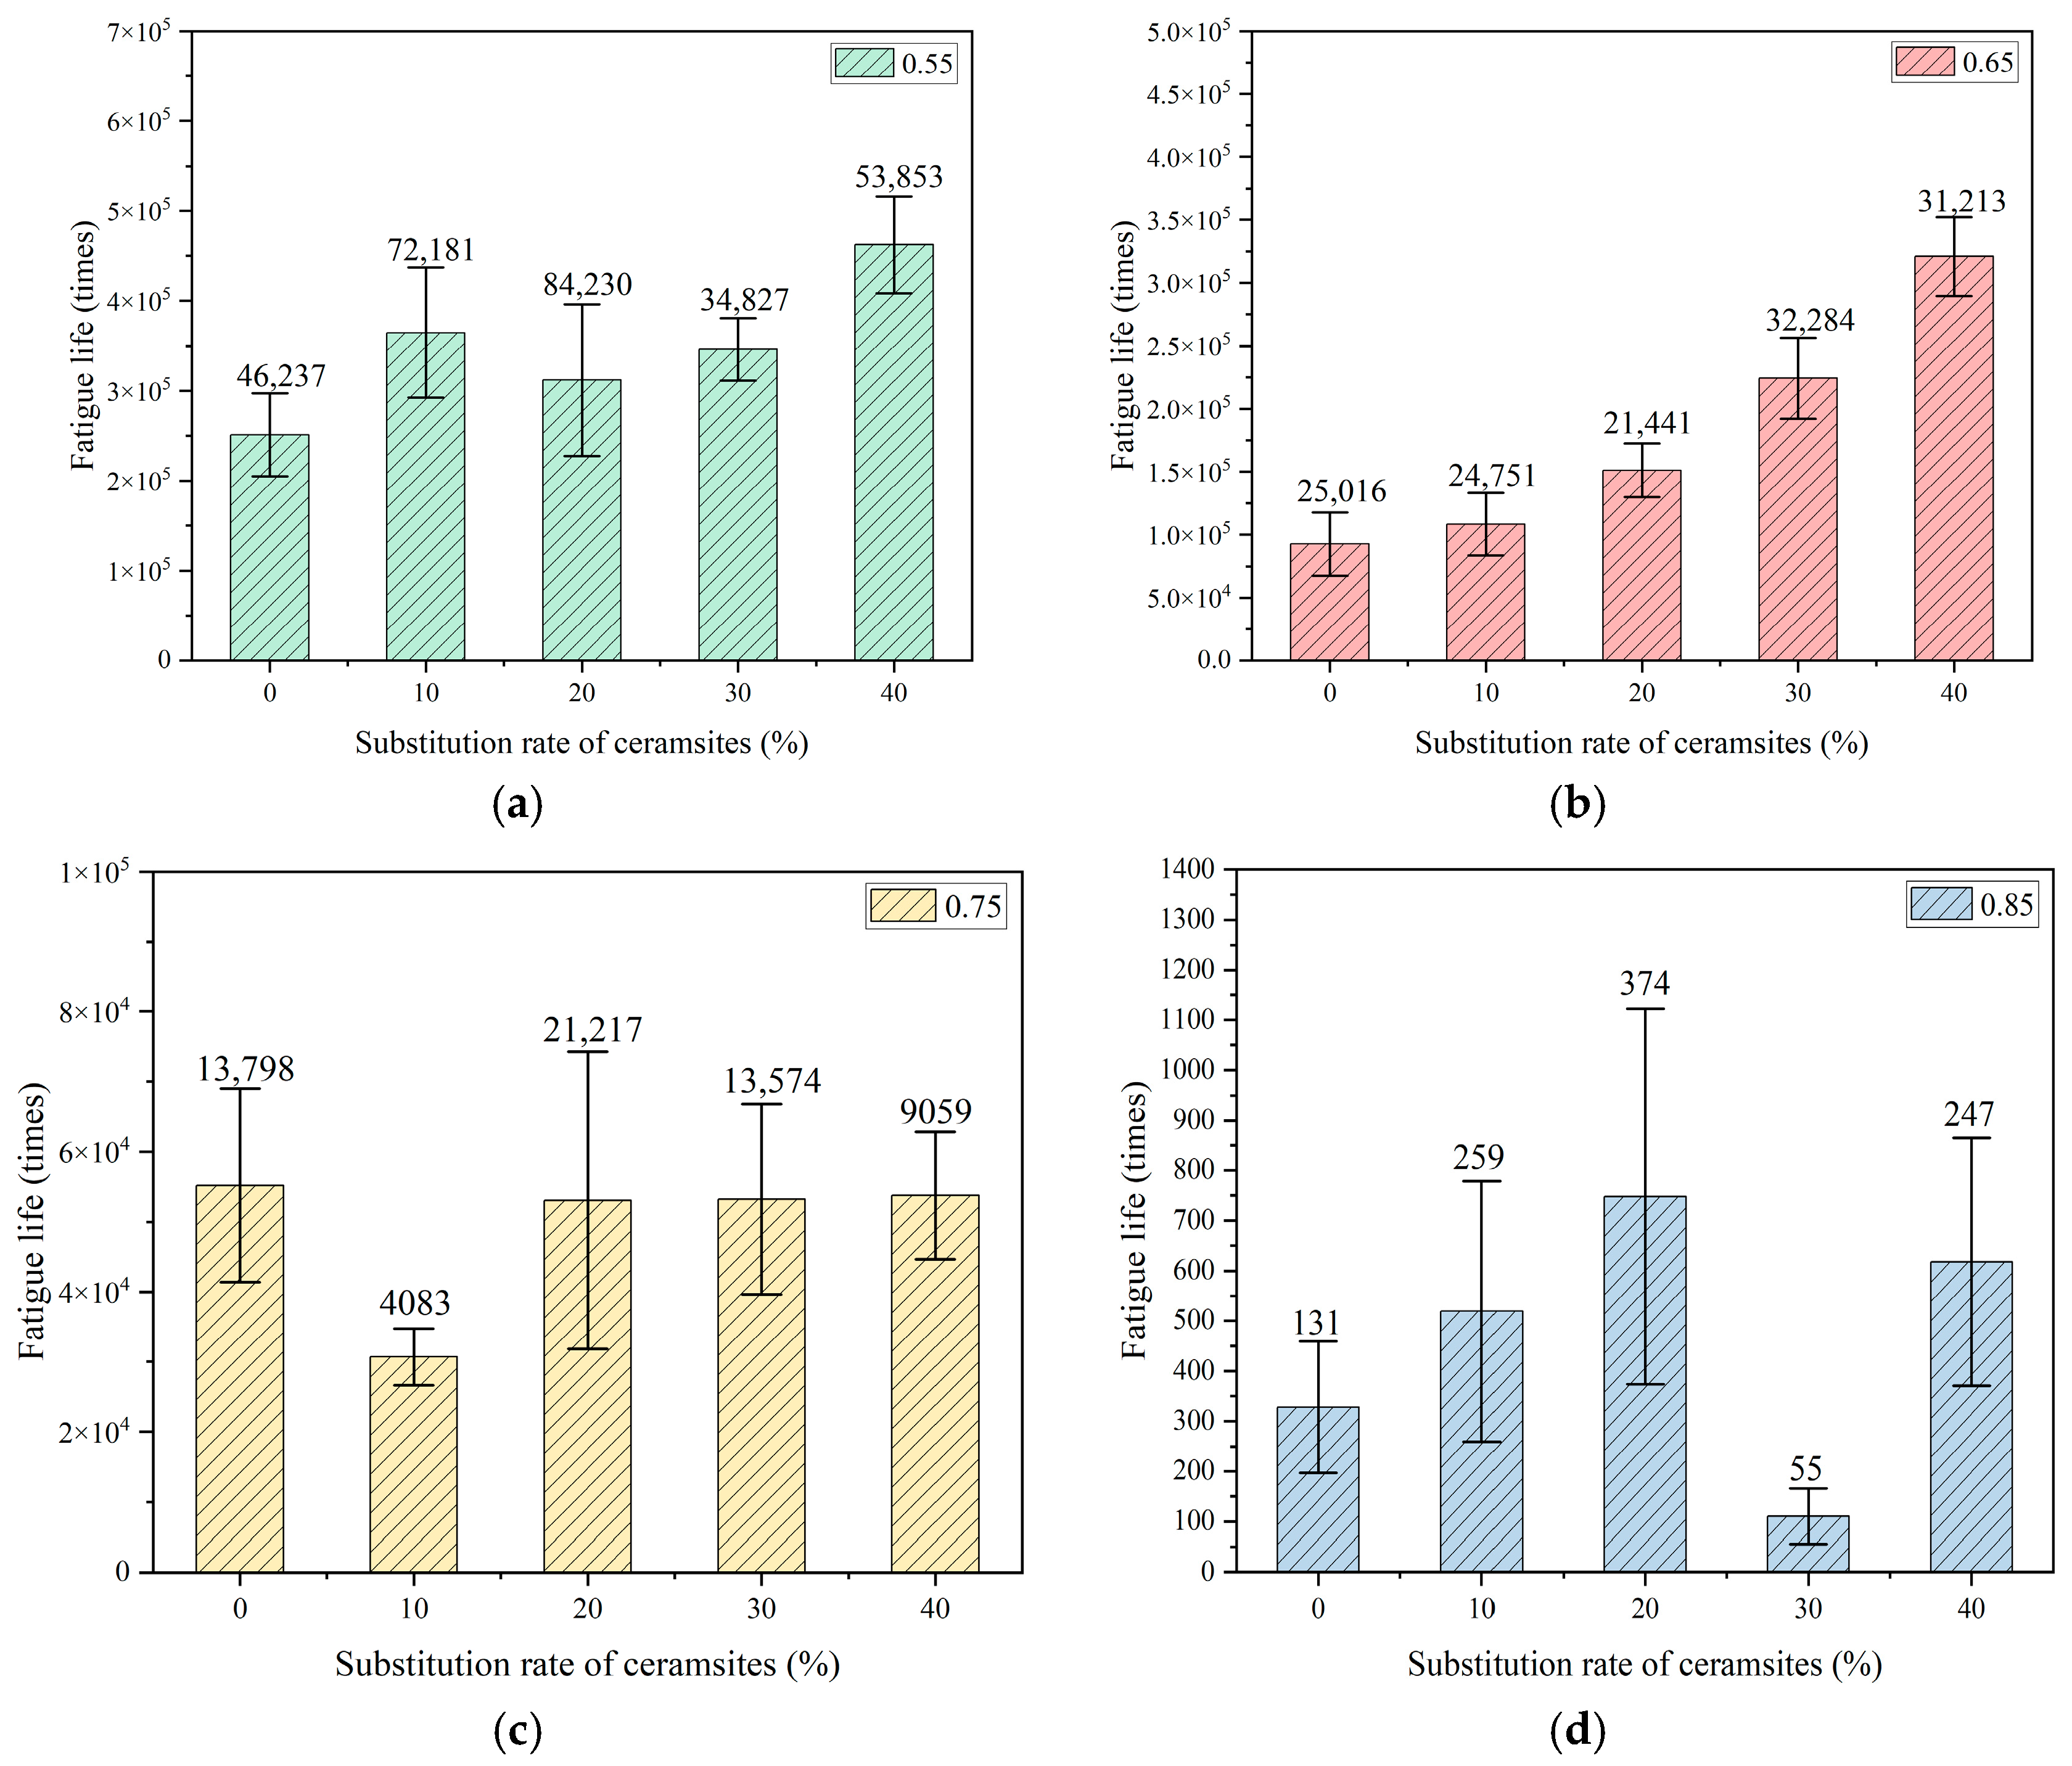
Figure 9.
The effect of a 5–10 mm ceramsite replacement rate on fatigue life. (a) The stress level was 0.55, (b) the stress level was 0.65, (c) the stress level was 0.75, (d) the stress level was 0.85.
Figure 9.
The effect of a 5–10 mm ceramsite replacement rate on fatigue life. (a) The stress level was 0.55, (b) the stress level was 0.65, (c) the stress level was 0.75, (d) the stress level was 0.85.
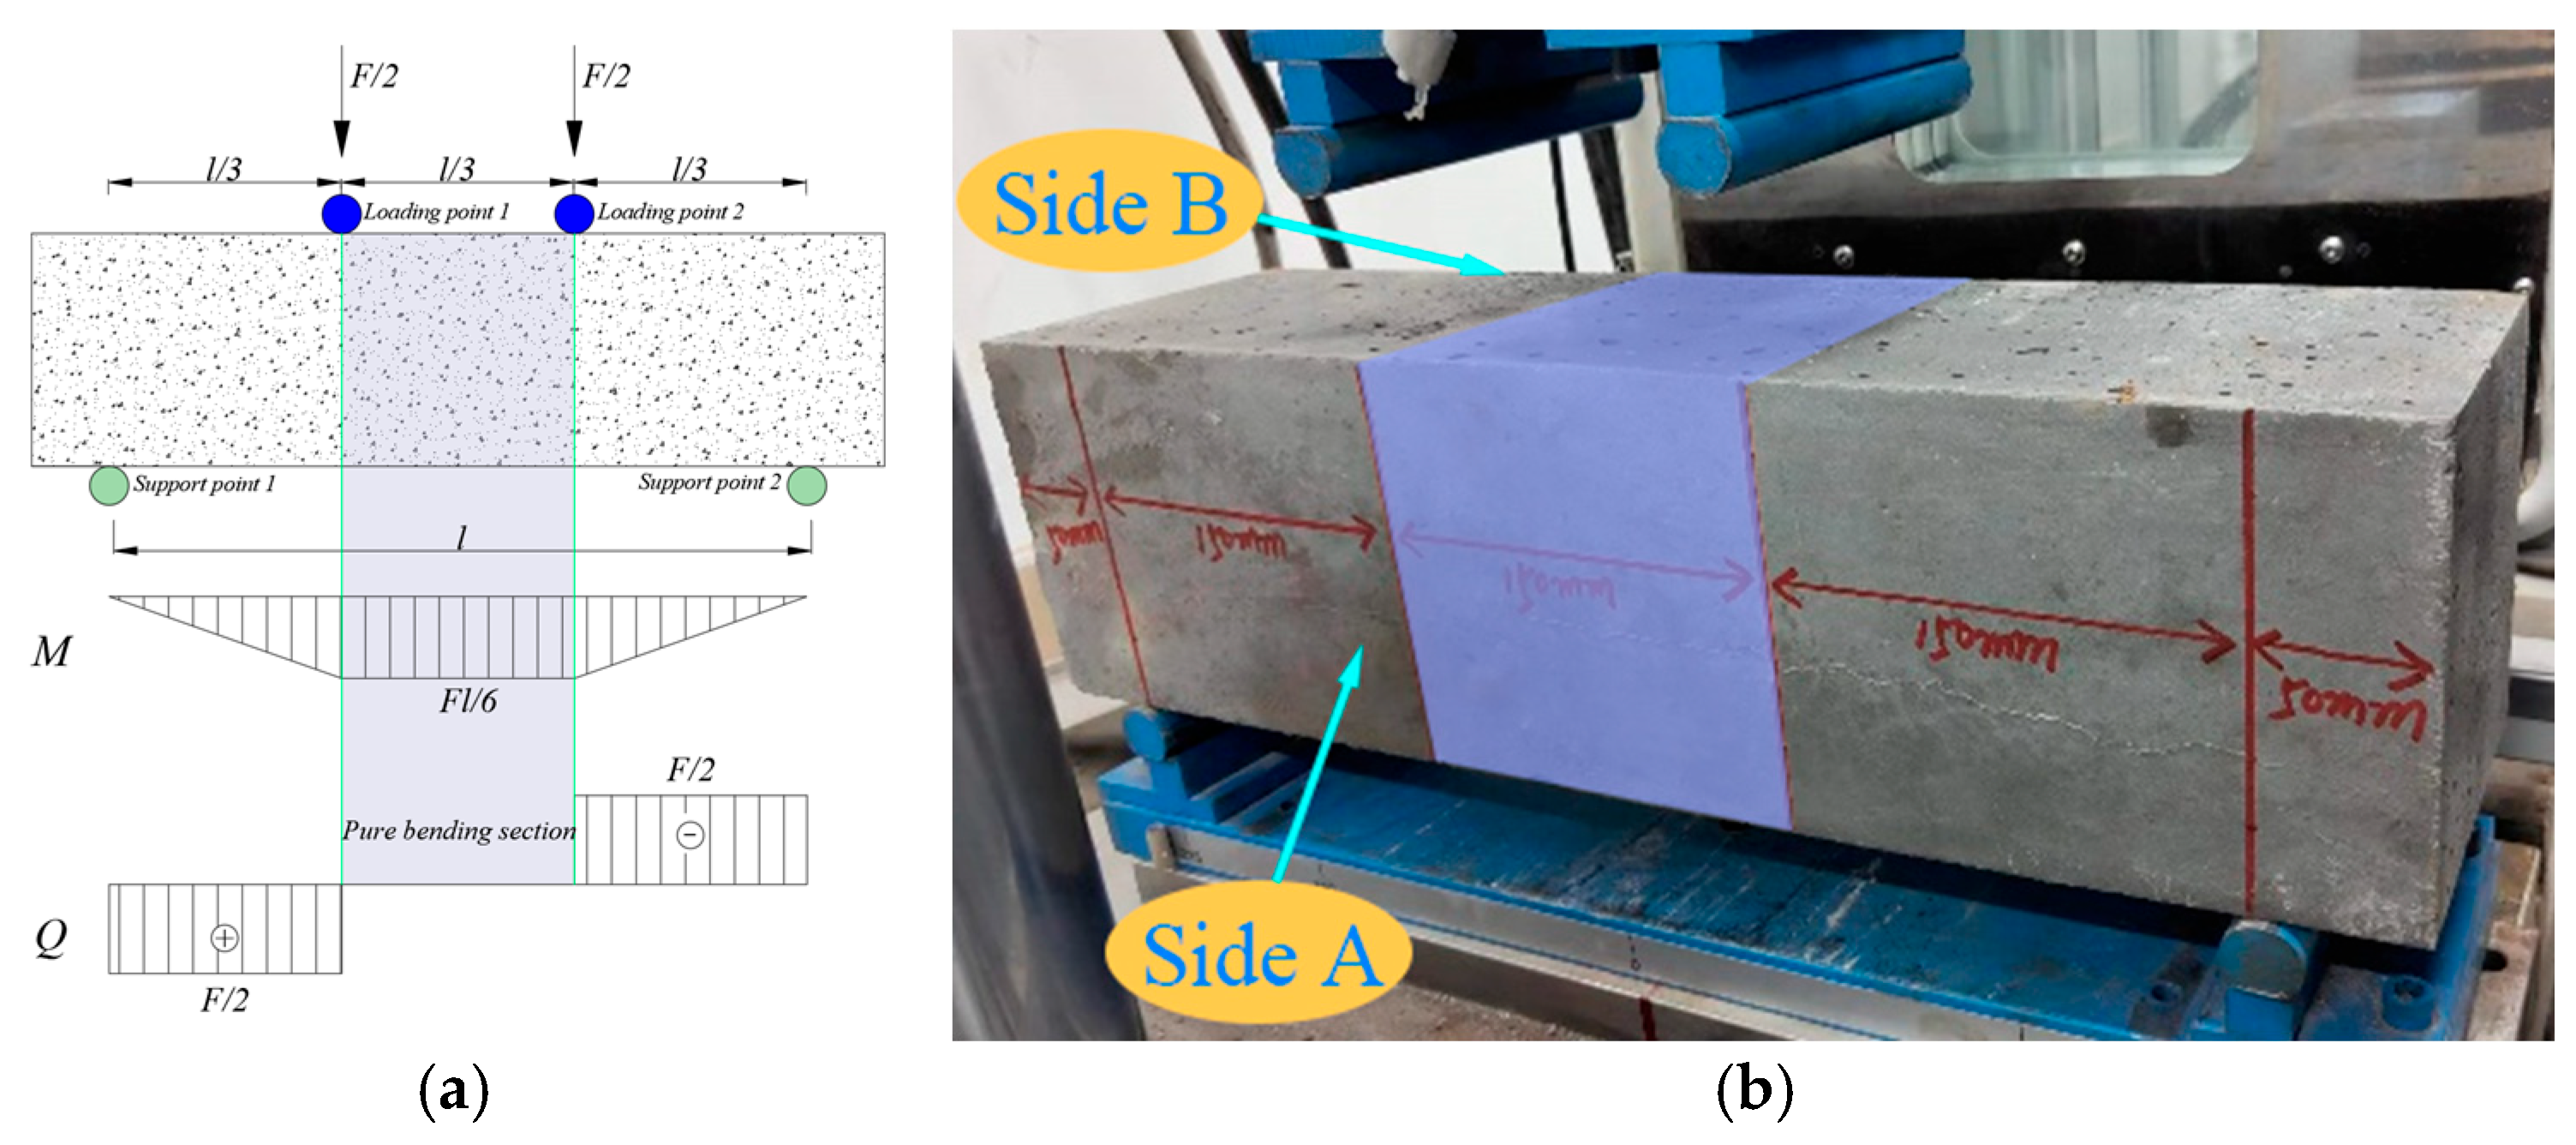
Figure 10.
Bending section of the four-point fatigue test. (a) Internal force diagram, (b) test piece loading diagram.
Figure 10.
Bending section of the four-point fatigue test. (a) Internal force diagram, (b) test piece loading diagram.
Figure 11.
Crack diagram of specimen side A and B.
Figure 11.
Crack diagram of specimen side A and B.
Figure 12.
Regional division diagram. (a) Regional division, (b) crack diagram.
Figure 12.
Regional division diagram. (a) Regional division, (b) crack diagram.
Figure 13.
Statistics of crack locations with different ceramsite replacement rates. (a) Statistics of crack location with CRR3, (b) statistics of crack location with CRR2, (c) statistics of crack location with CRR1.
Figure 13.
Statistics of crack locations with different ceramsite replacement rates. (a) Statistics of crack location with CRR3, (b) statistics of crack location with CRR2, (c) statistics of crack location with CRR1.
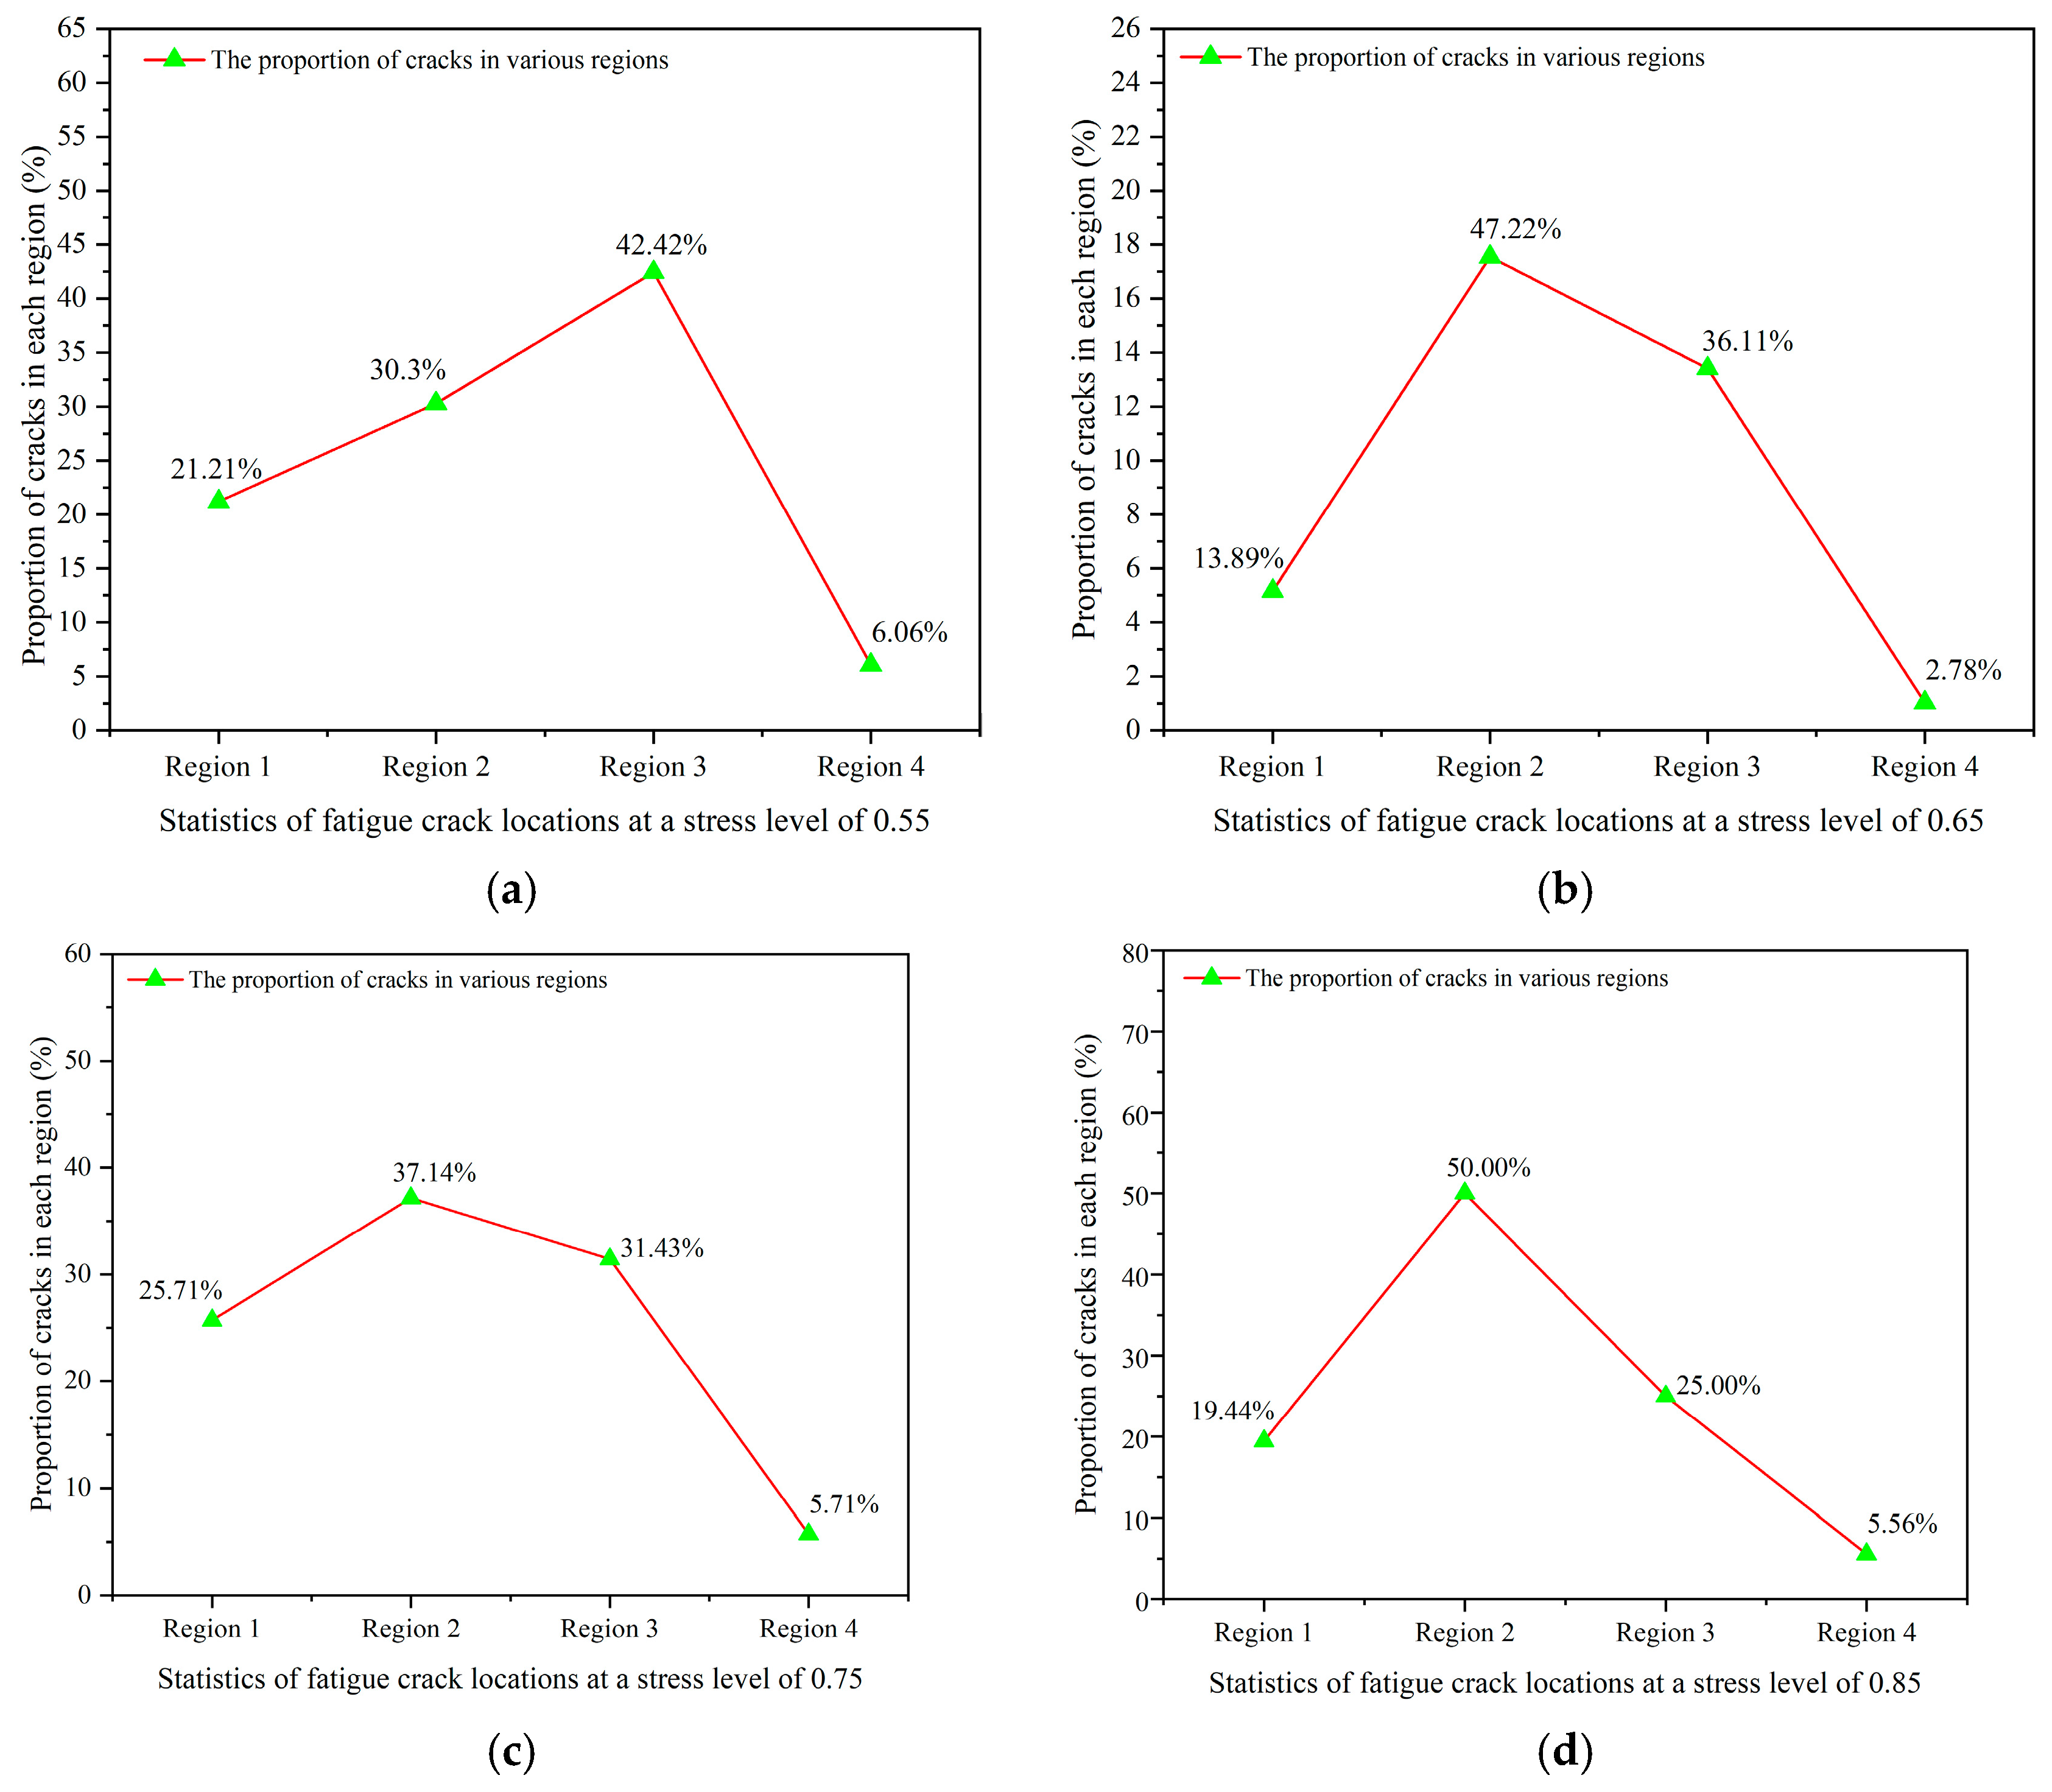
Figure 14.
Statistics of crack locations under different stress levels. (a) The stress level was 0.55, (b) the stress level was 0.65, (c) the stress level was 0.75, (d) the stress level was 0.85.
Figure 14.
Statistics of crack locations under different stress levels. (a) The stress level was 0.55, (b) the stress level was 0.65, (c) the stress level was 0.75, (d) the stress level was 0.85.
Figure 15.
The relationship between fatigue life and the average crack angle in relation to CRR1. (a) The stress level was 0.55, (b) the stress level was 0.65, (c) the stress level was 0.75, (d) the stress level was 0.85.
Figure 15.
The relationship between fatigue life and the average crack angle in relation to CRR1. (a) The stress level was 0.55, (b) the stress level was 0.65, (c) the stress level was 0.75, (d) the stress level was 0.85.
Figure 16.
The relationship between fatigue life and the average crack angle in relation to CRR2. (a) The stress level was 0.55, (b) the stress level was 0.65, (c) the stress level was 0.75, (d) the stress level was 0.85.
Figure 16.
The relationship between fatigue life and the average crack angle in relation to CRR2. (a) The stress level was 0.55, (b) the stress level was 0.65, (c) the stress level was 0.75, (d) the stress level was 0.85.
Figure 17.
The relationship between fatigue life and the average crack angle in relation to CRR3. (a) The stress level was 0.55, (b) the stress level was 0.65, (c) the stress level was 0.75, (d) the stress level was 0.85.
Figure 17.
The relationship between fatigue life and the average crack angle in relation to CRR3. (a) The stress level was 0.55, (b) the stress level was 0.65, (c) the stress level was 0.75, (d) the stress level was 0.85.
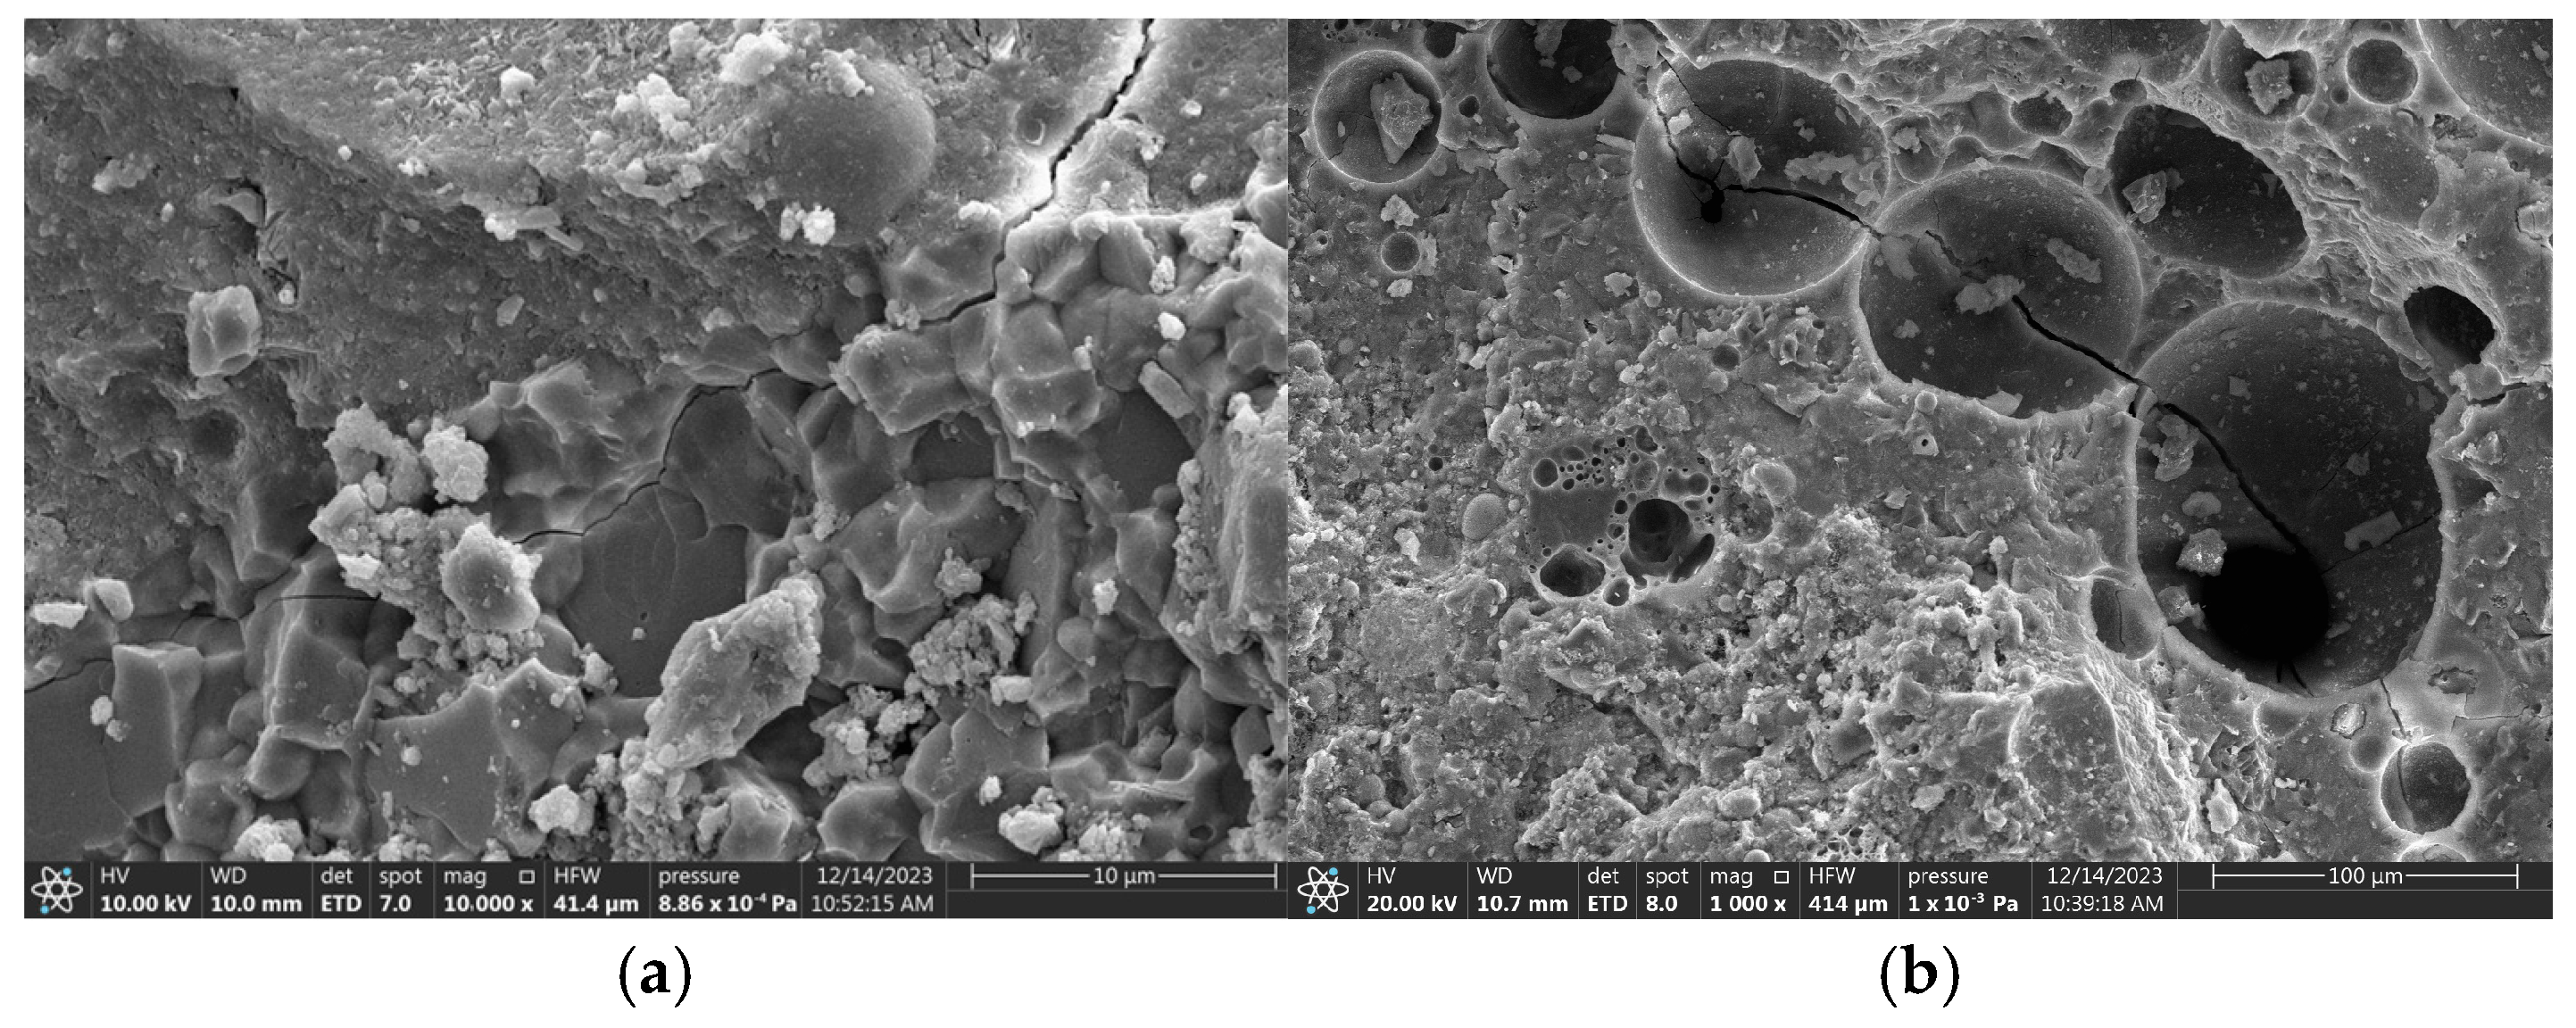
Figure 18.
SEM images (natural aggregate and 5–10 mm ceramsite). (a) At low to moderate stress levels (0.55, 0.65, 0.75), (b) at a higher stress level (0.85).
Figure 18.
SEM images (natural aggregate and 5–10 mm ceramsite). (a) At low to moderate stress levels (0.55, 0.65, 0.75), (b) at a higher stress level (0.85).
Figure 19.
SEM images (natural aggregate and 10–20 mm ceramsite). (a) At low to moderate stress levels (0.55, 0.65, 0.75), (b) at a higher stress level (0.85).
Figure 19.
SEM images (natural aggregate and 10–20 mm ceramsite). (a) At low to moderate stress levels (0.55, 0.65, 0.75), (b) at a higher stress level (0.85).
Figure 20.
SEM images (natural aggregate and 20–30 mm ceramsite). (a) At low to moderate stress levels (0.55, 0.65, 0.75), (b) at a higher stress level (0.85).
Figure 20.
SEM images (natural aggregate and 20–30 mm ceramsite). (a) At low to moderate stress levels (0.55, 0.65, 0.75), (b) at a higher stress level (0.85).
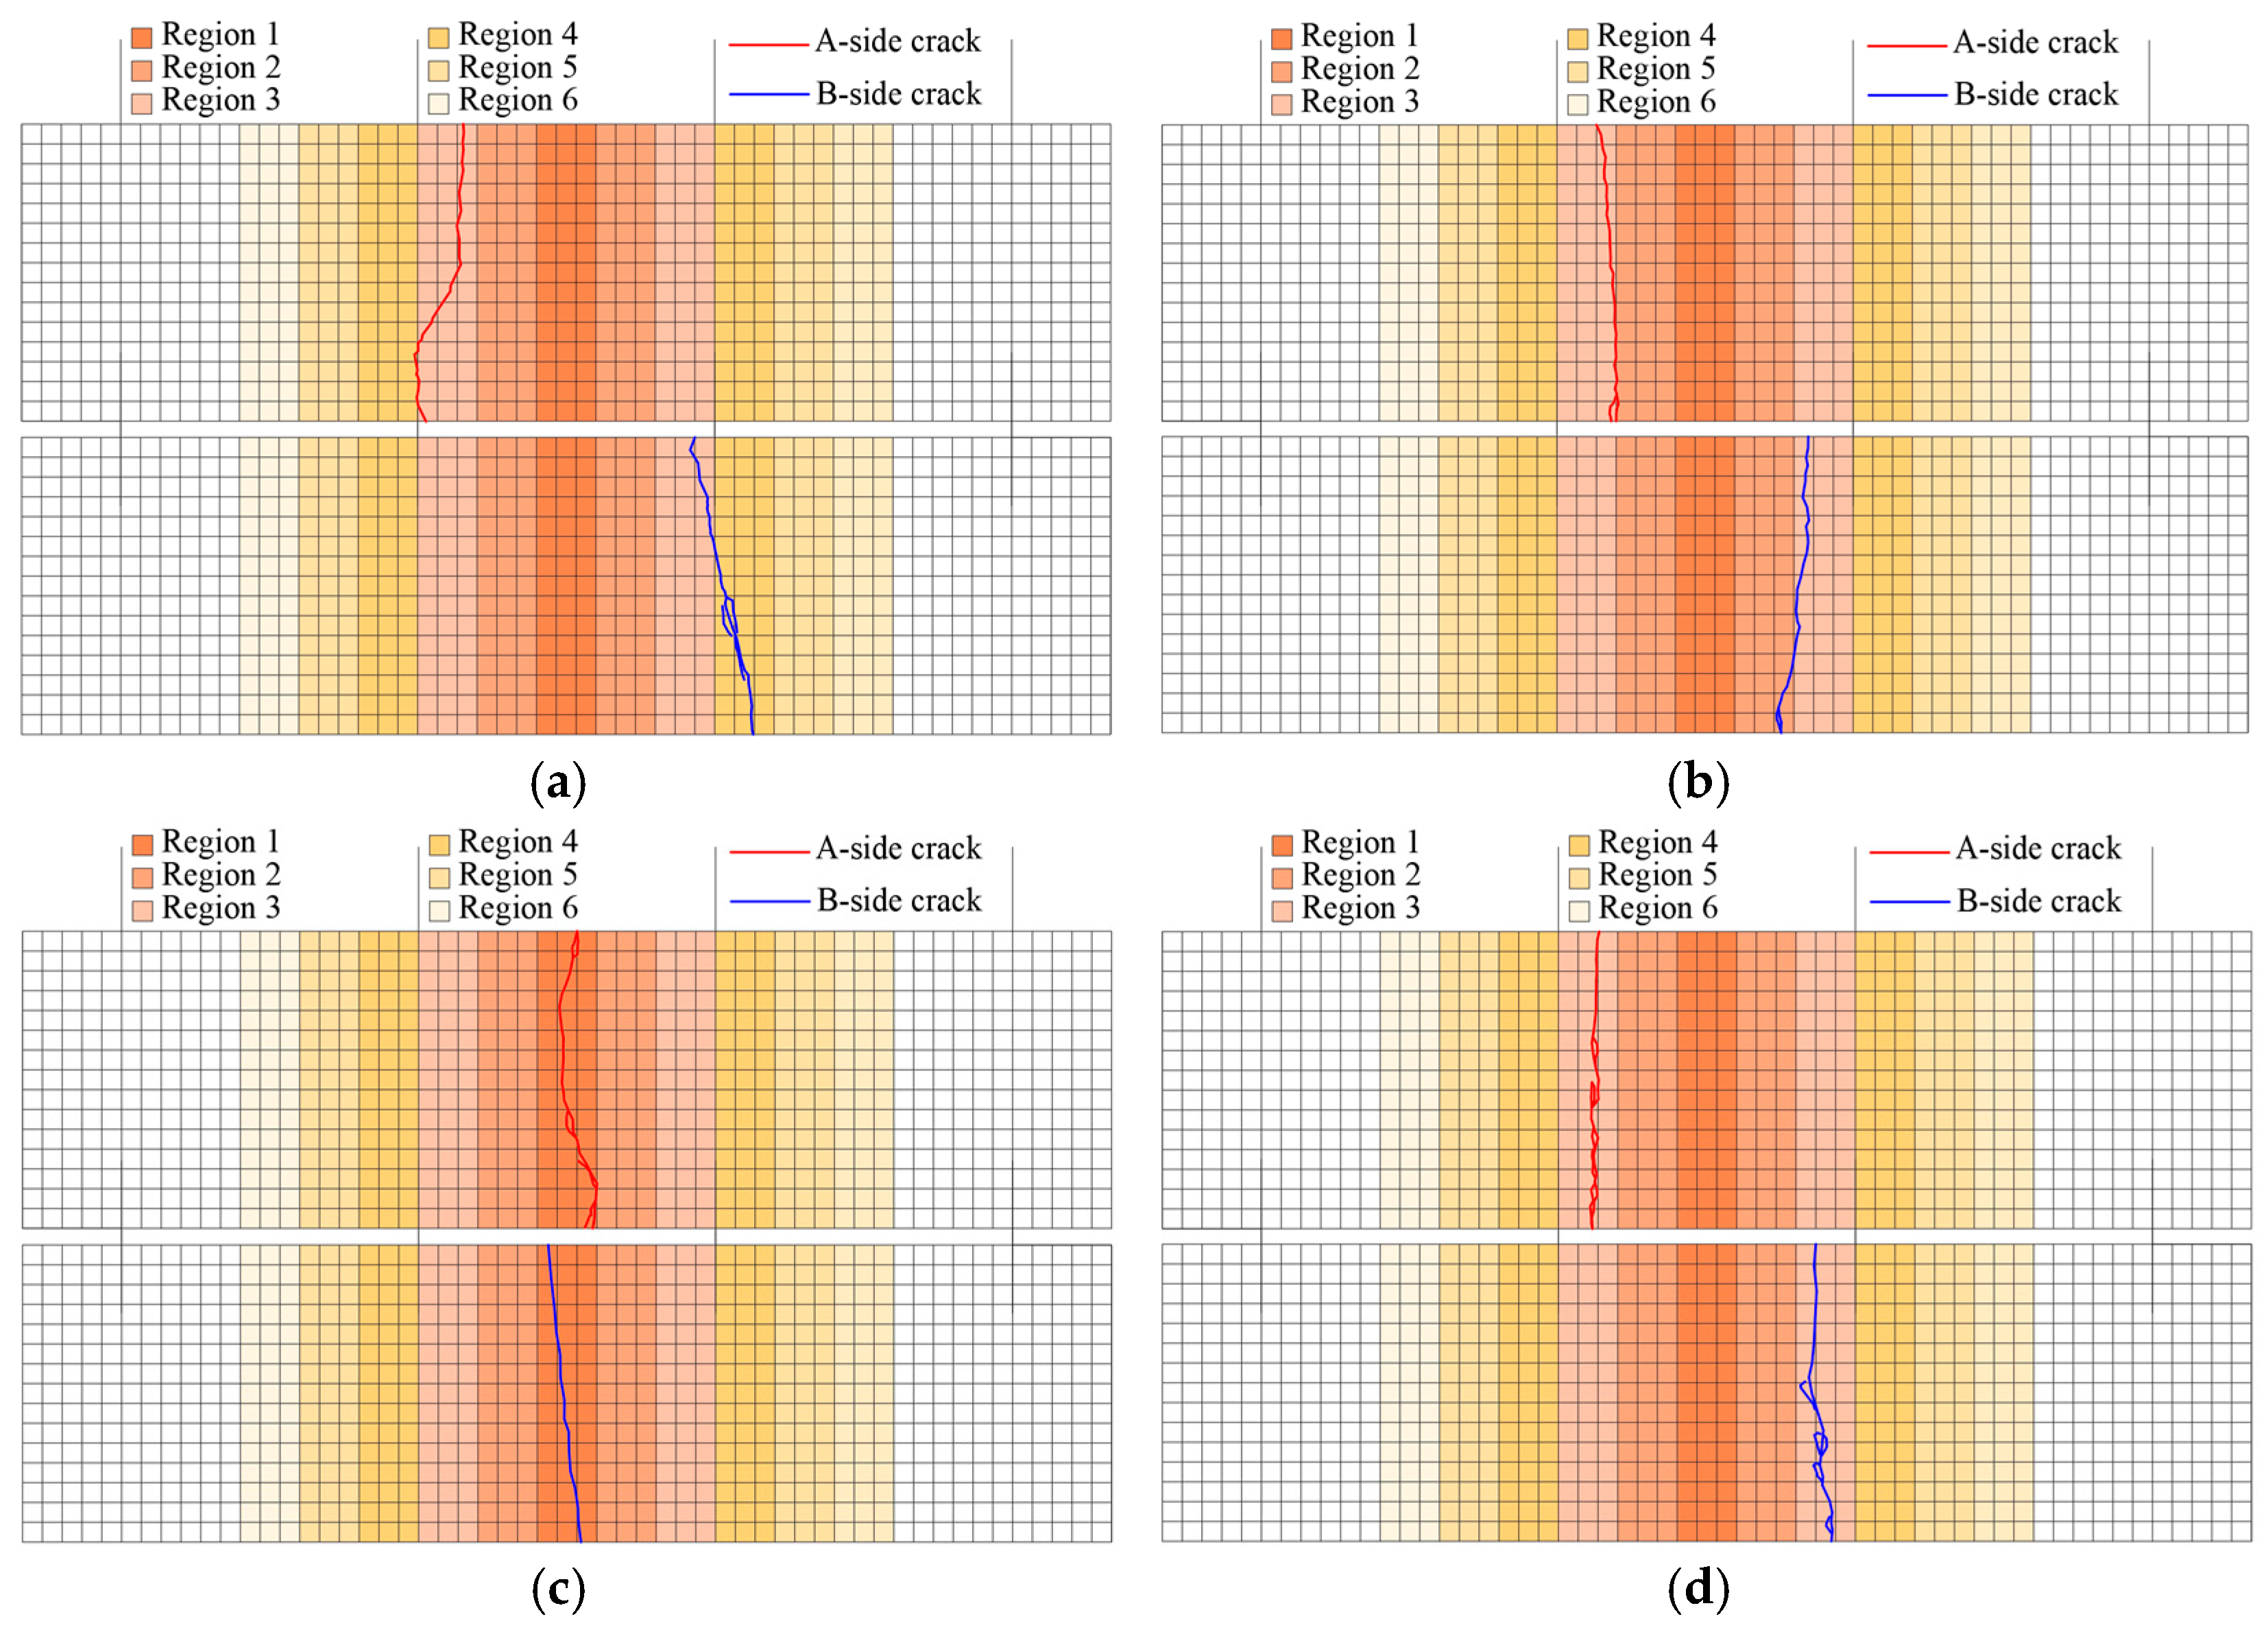
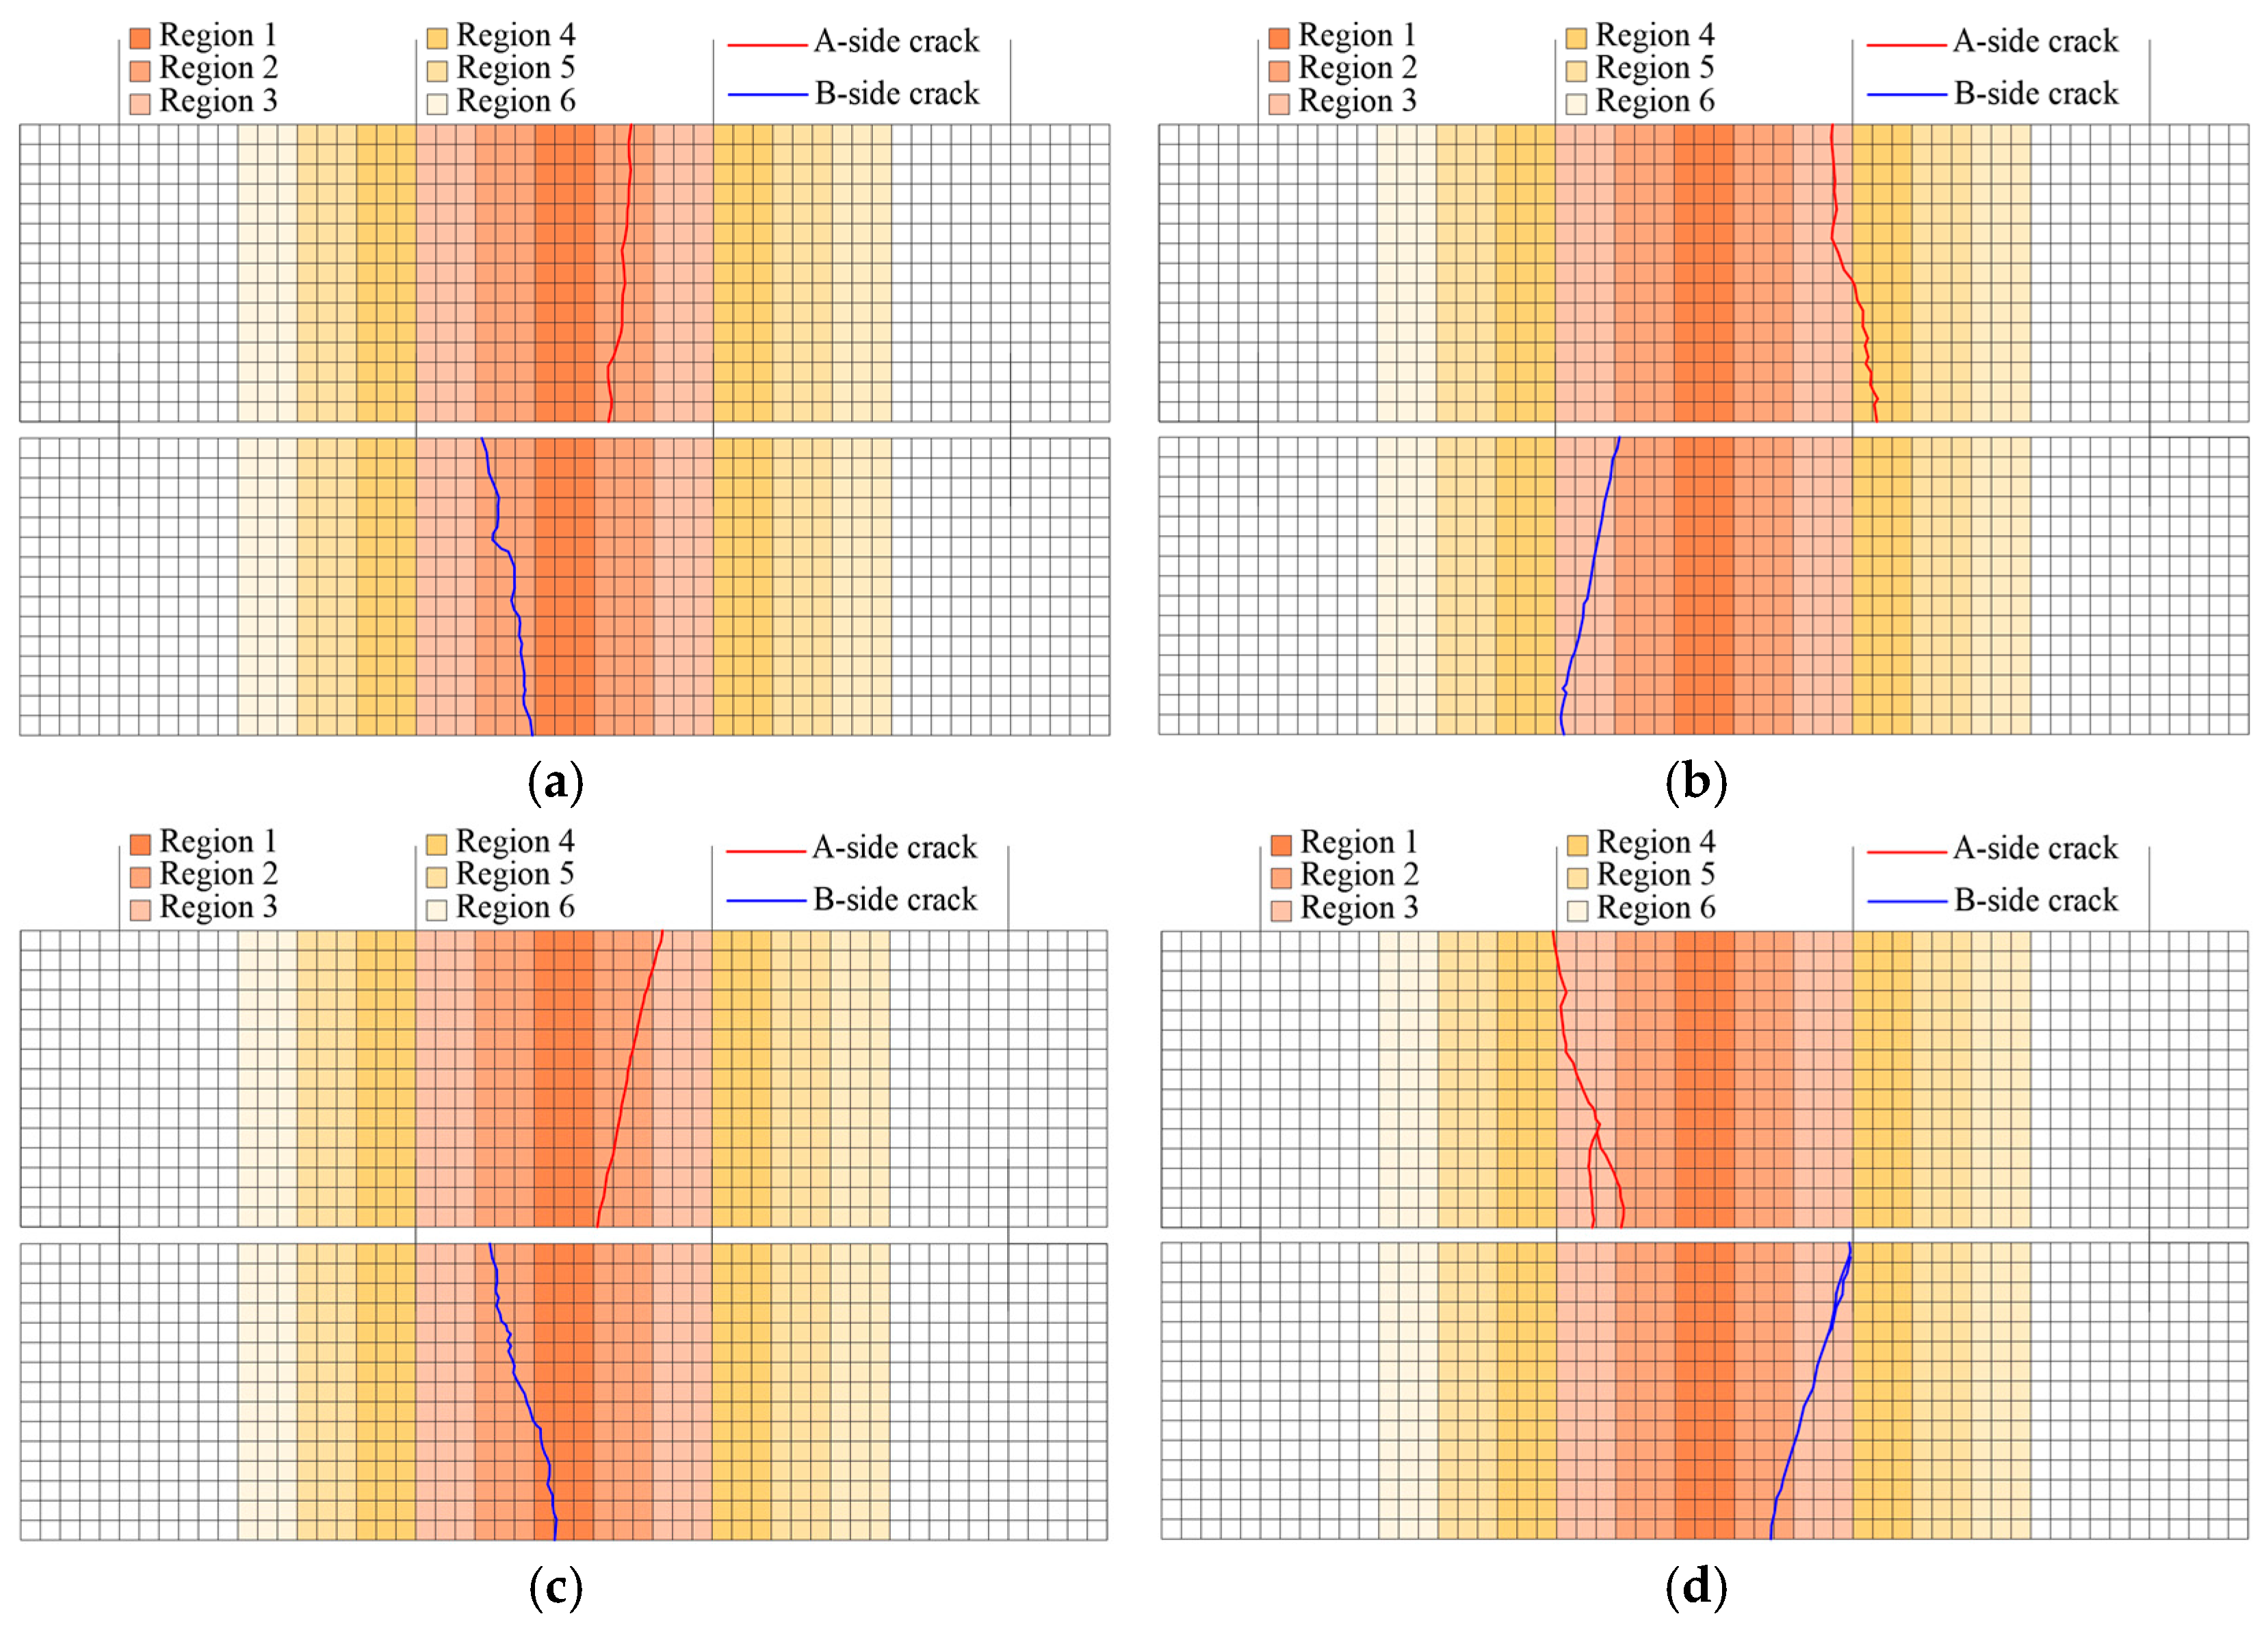
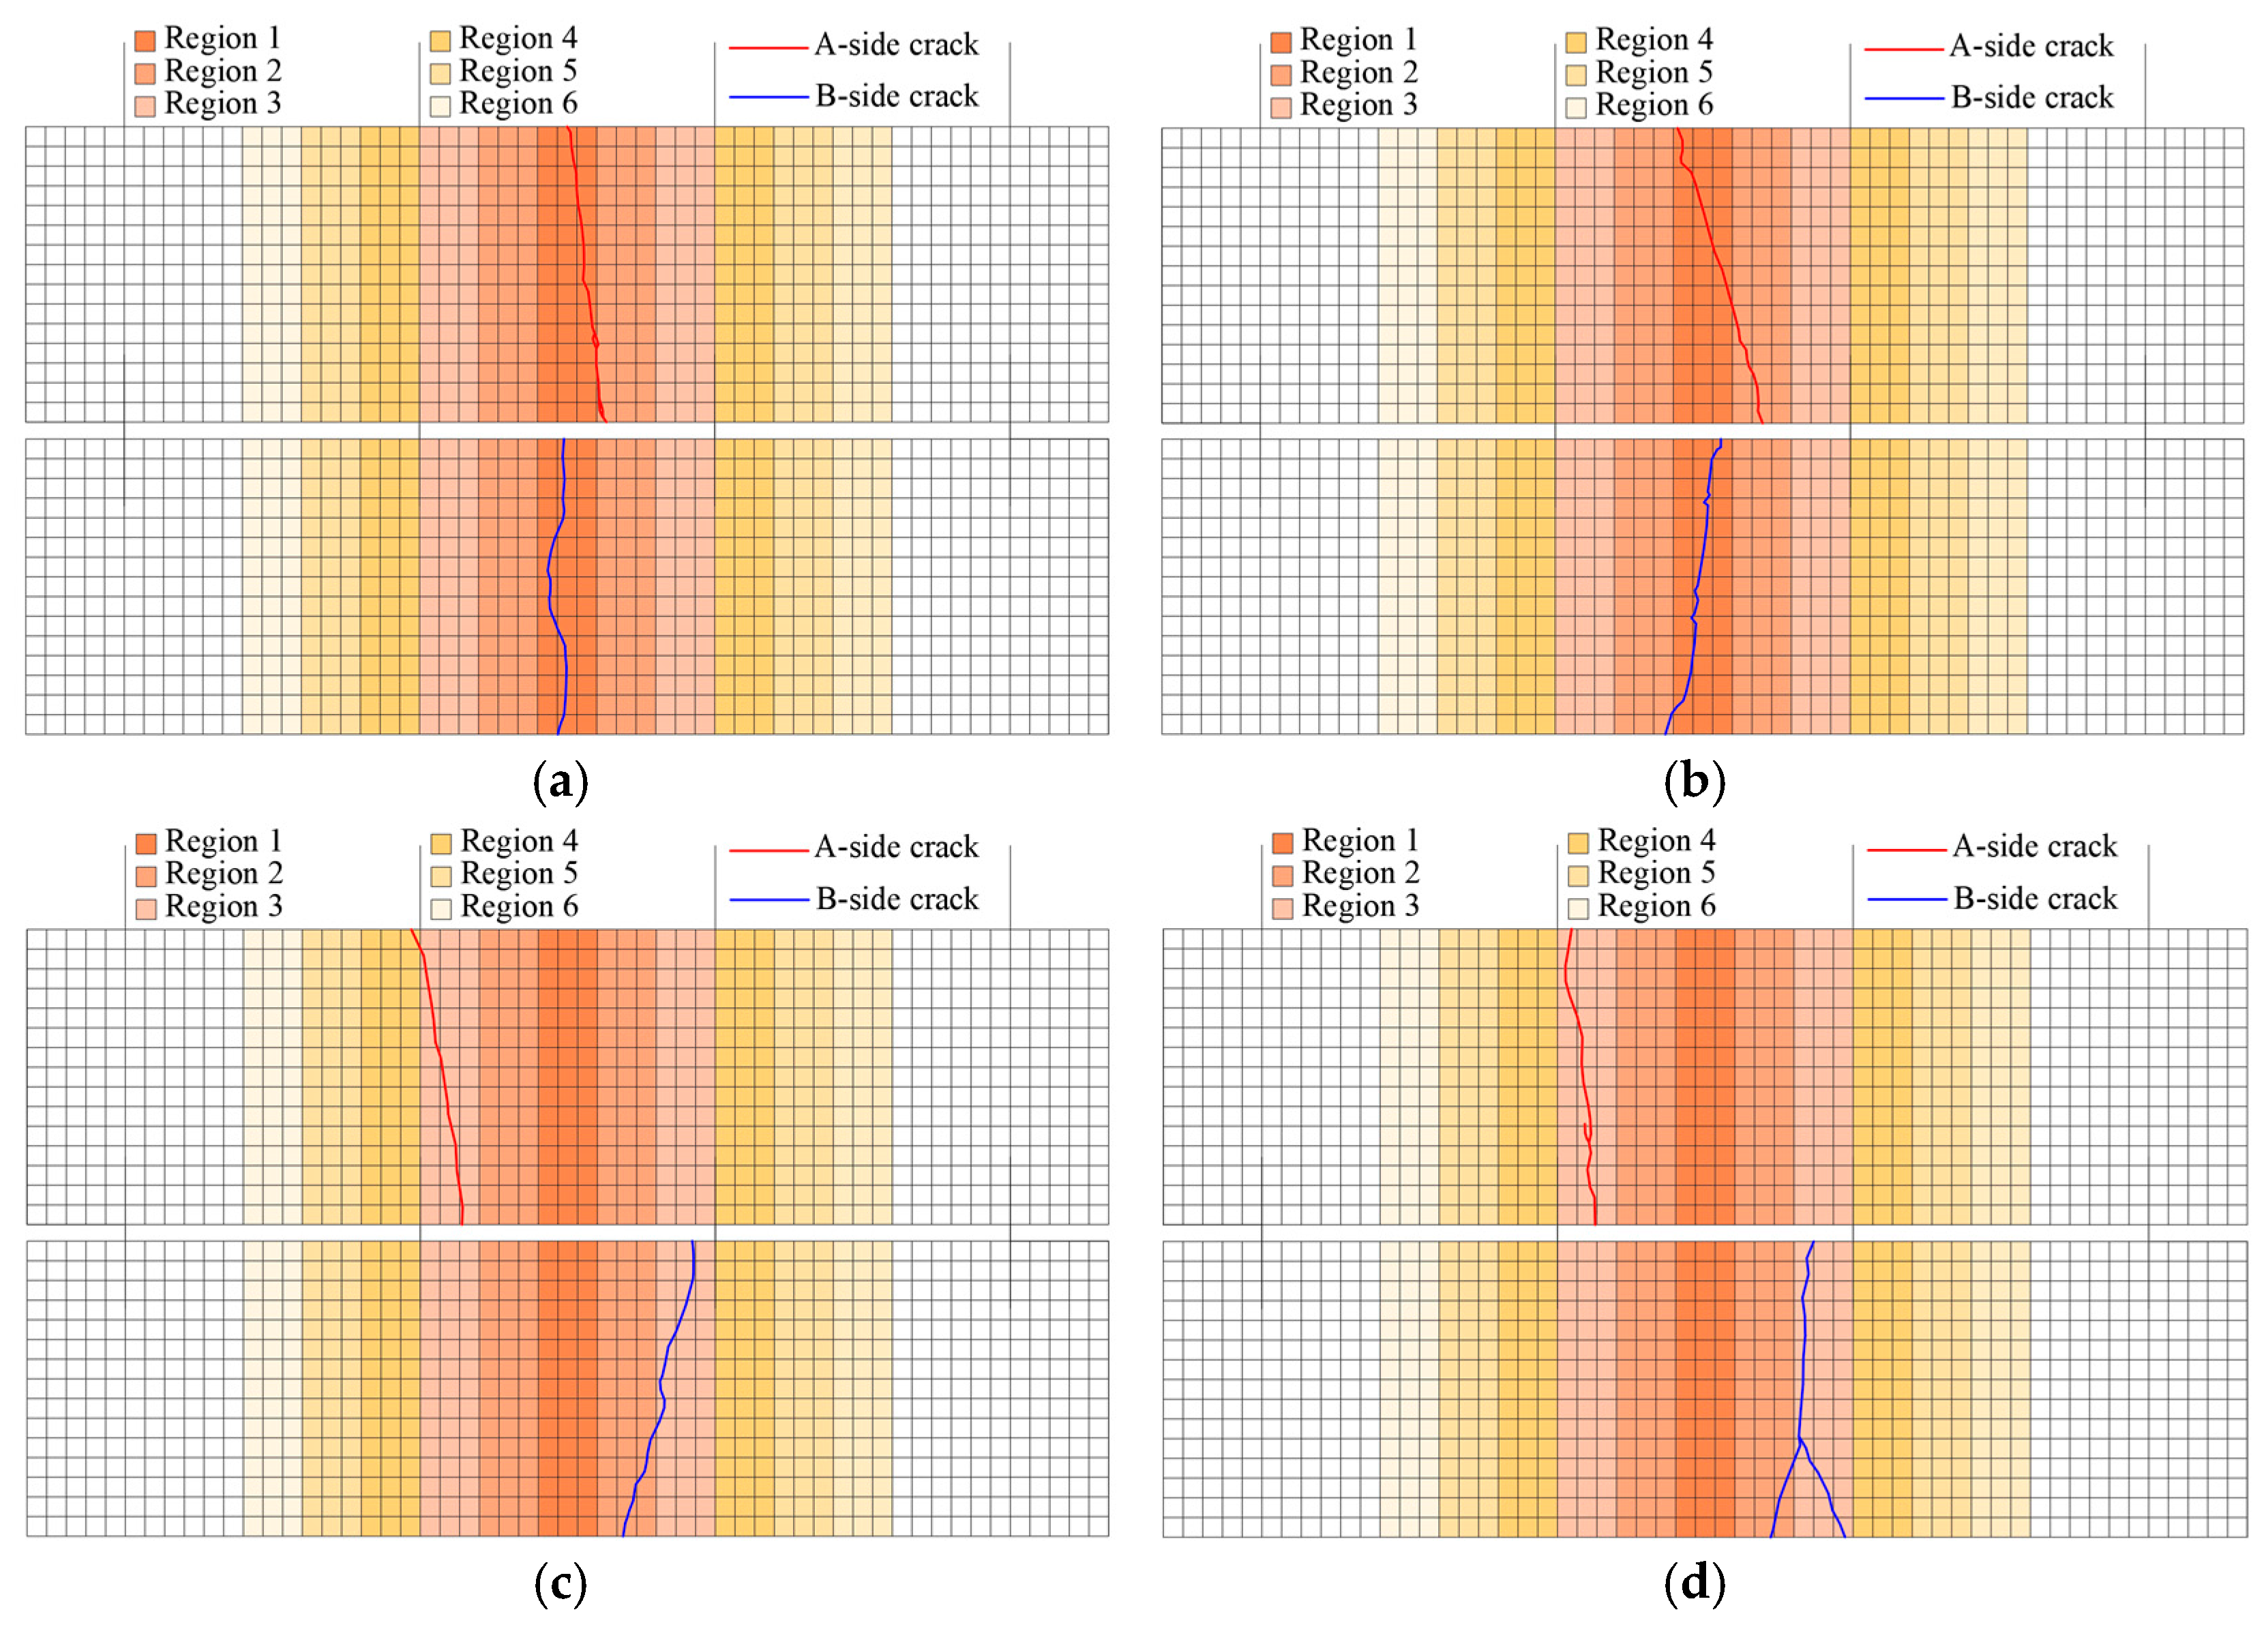
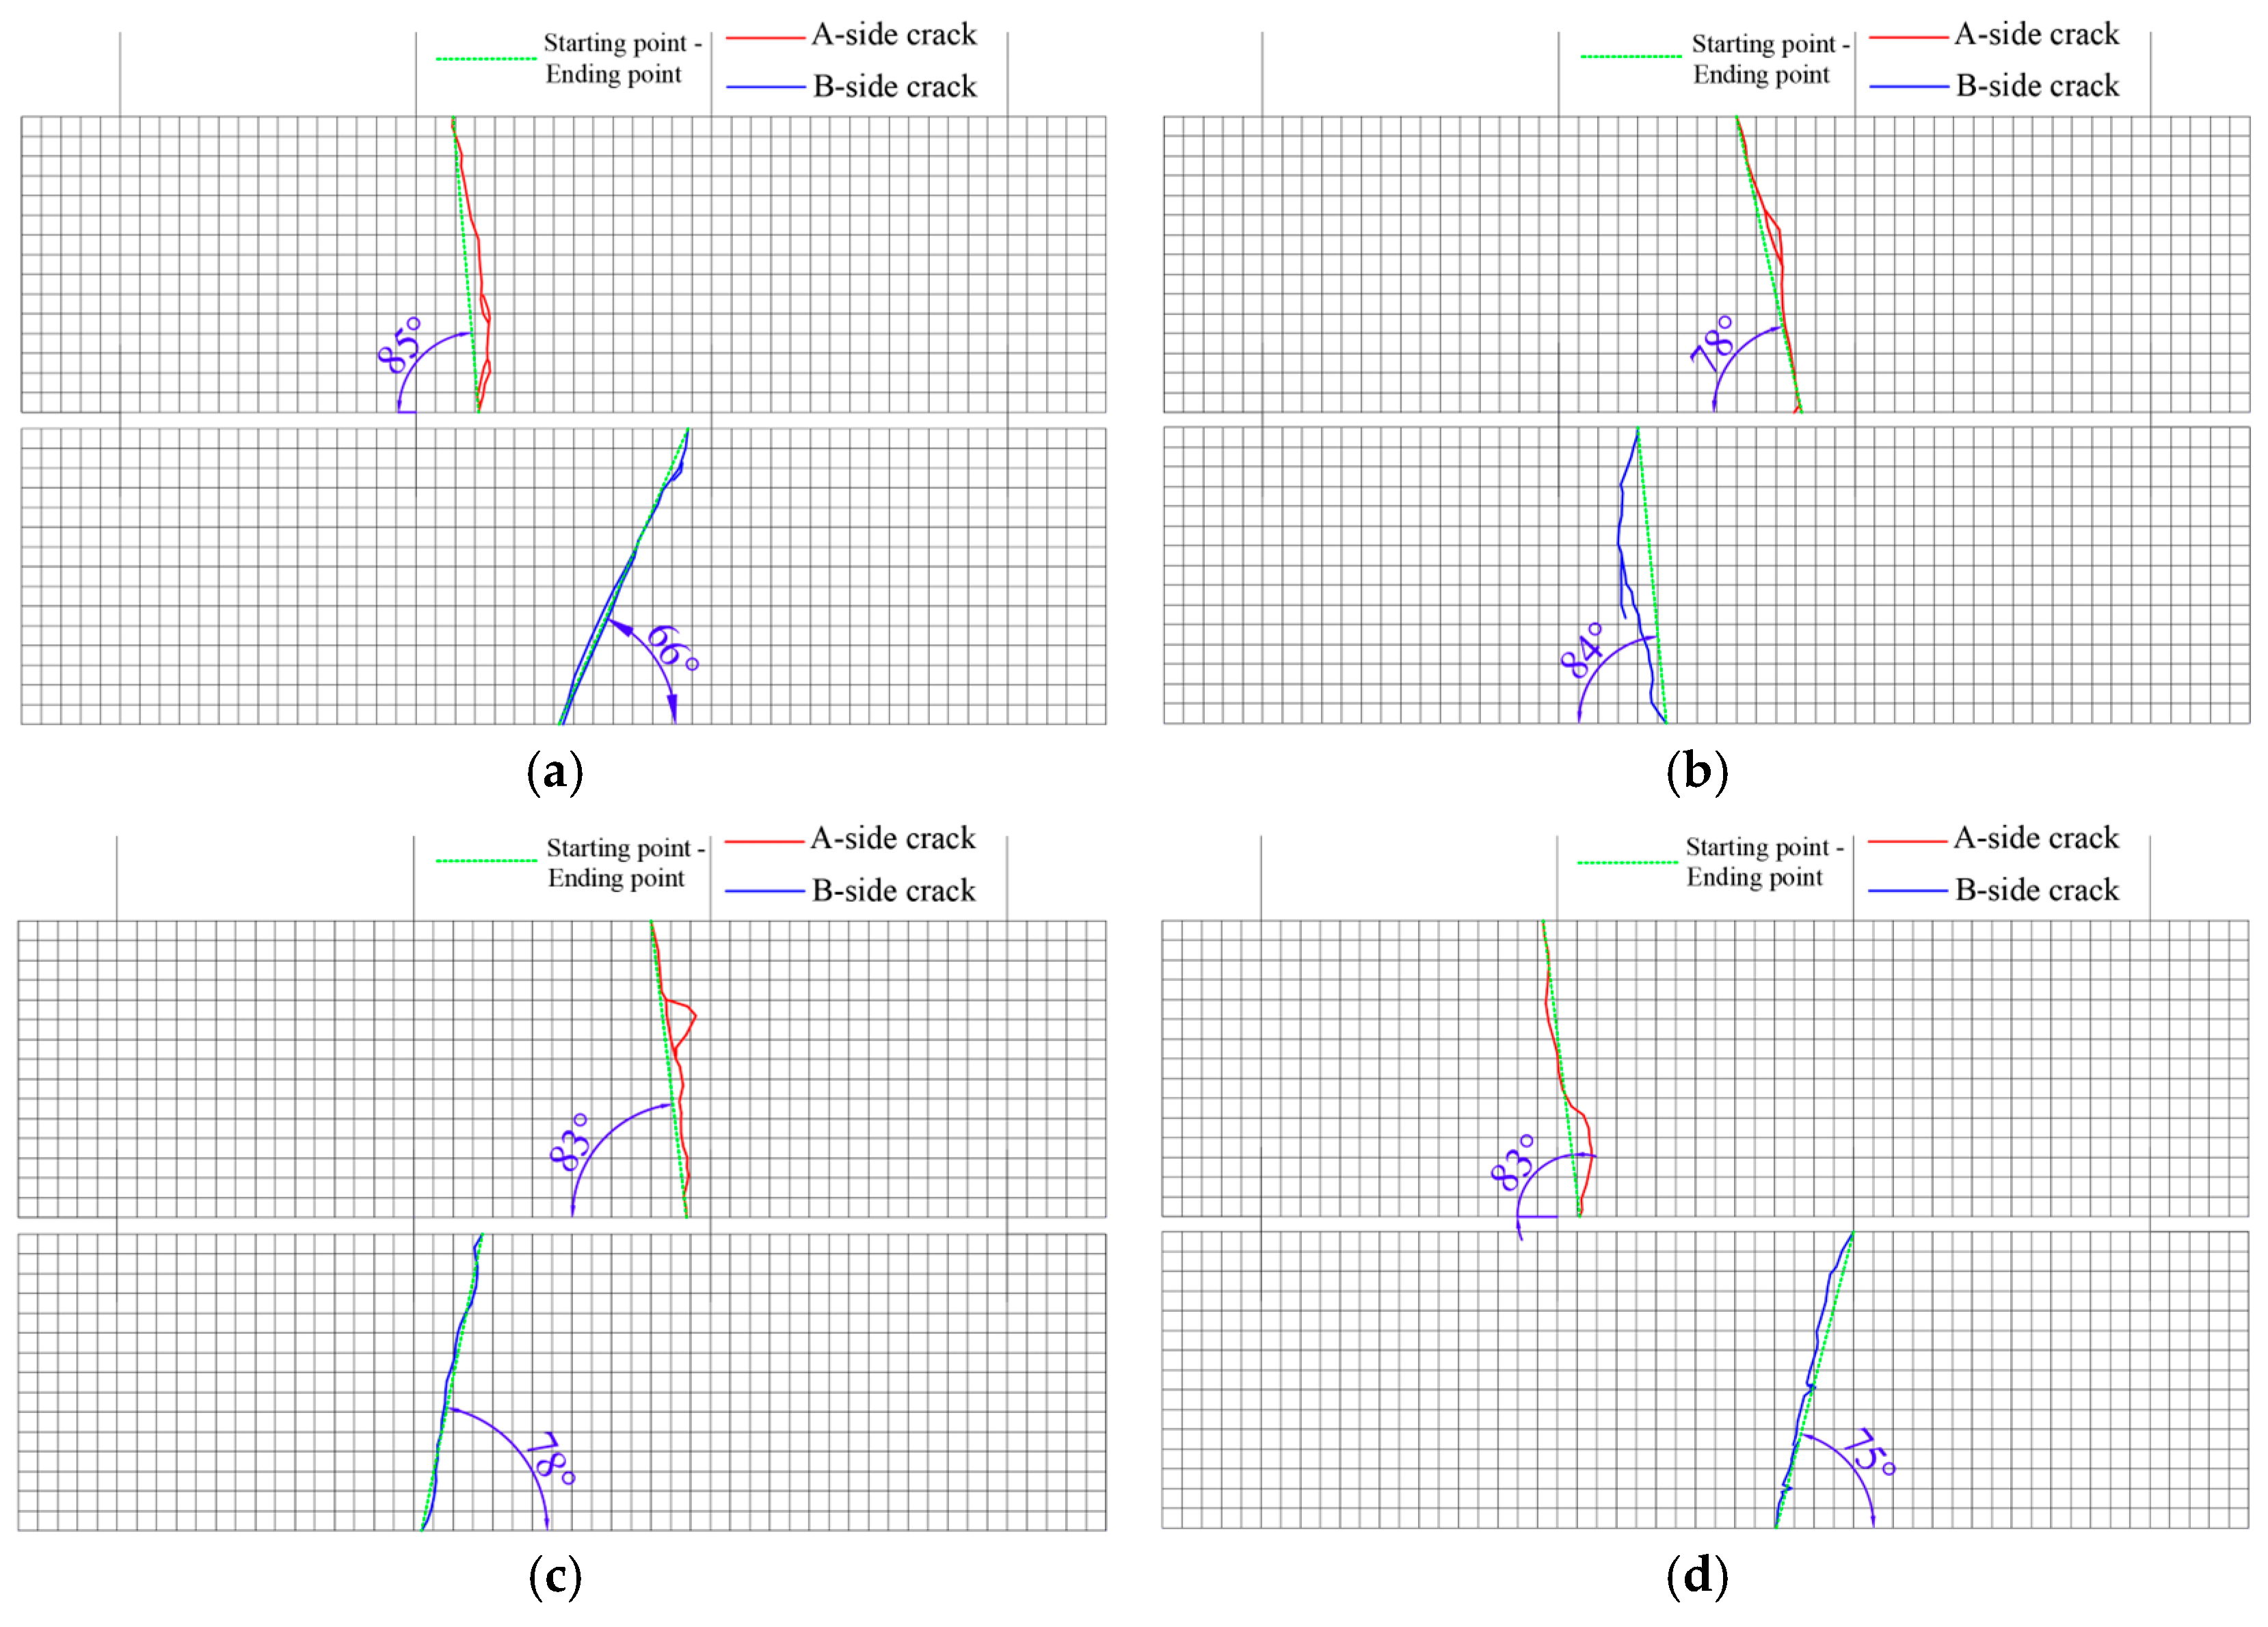
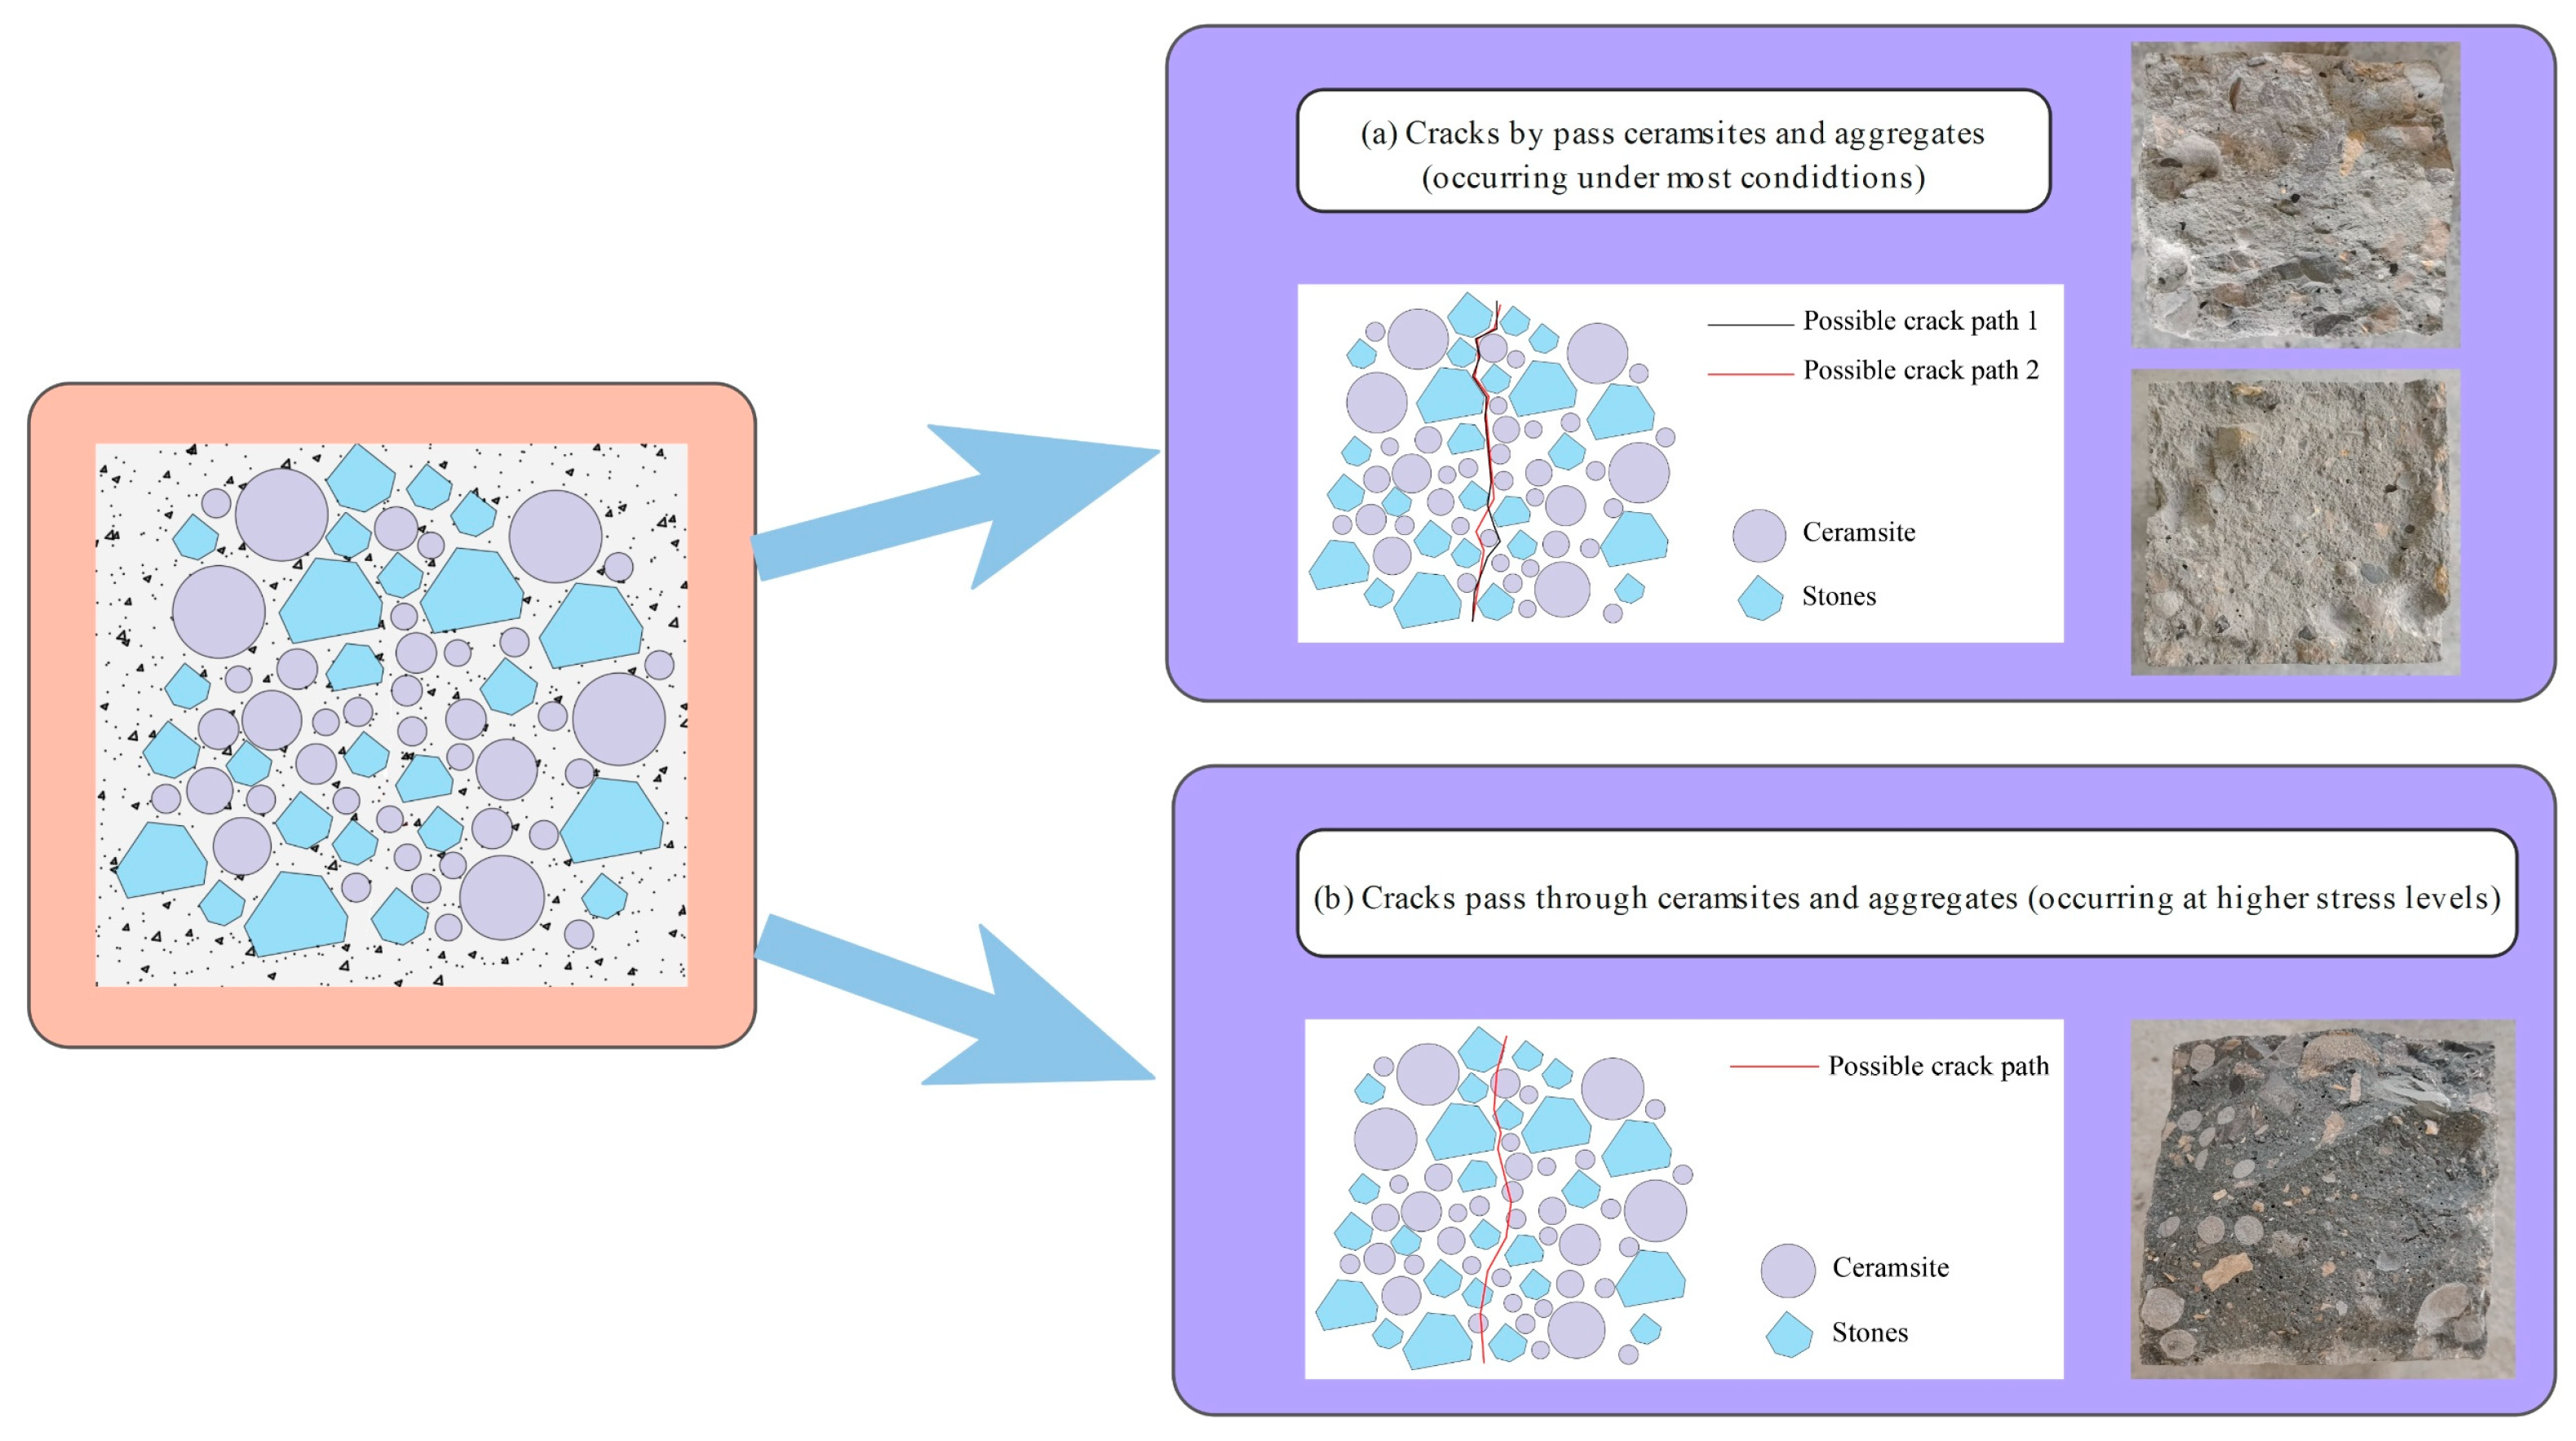
Figure 21.
The CRR3 crack simulation path.
Figure 21.
The CRR3 crack simulation path.
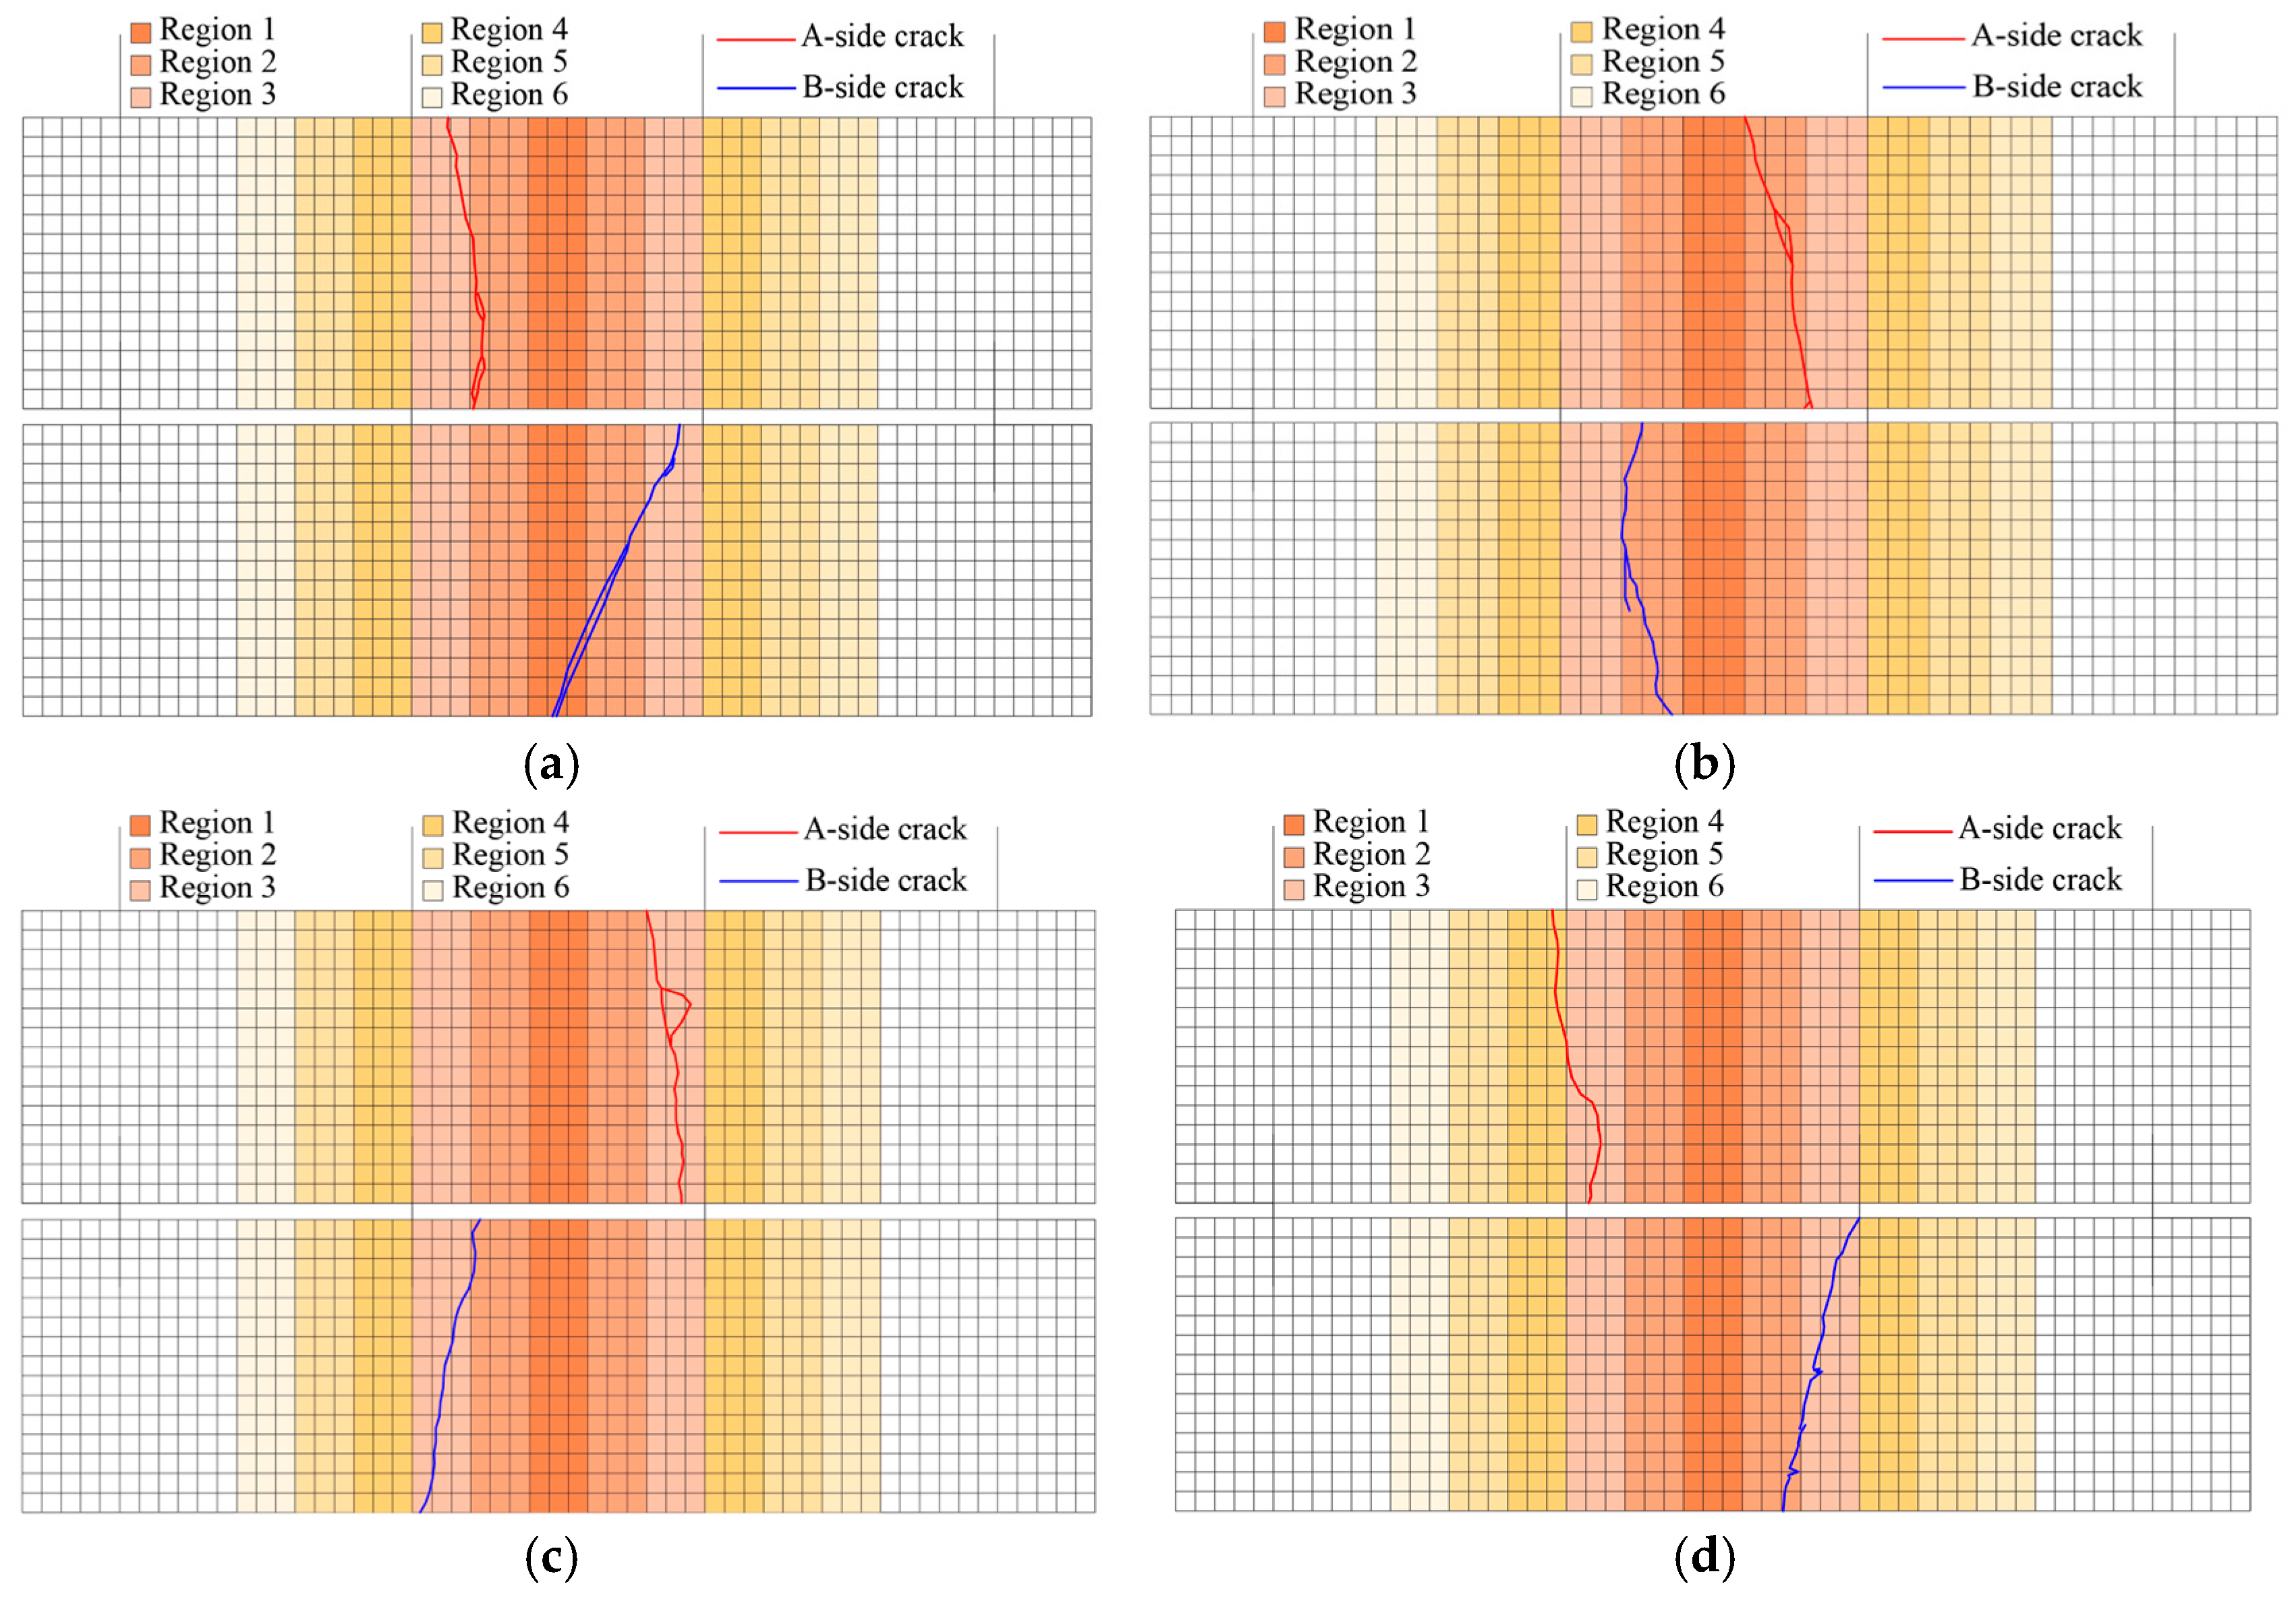
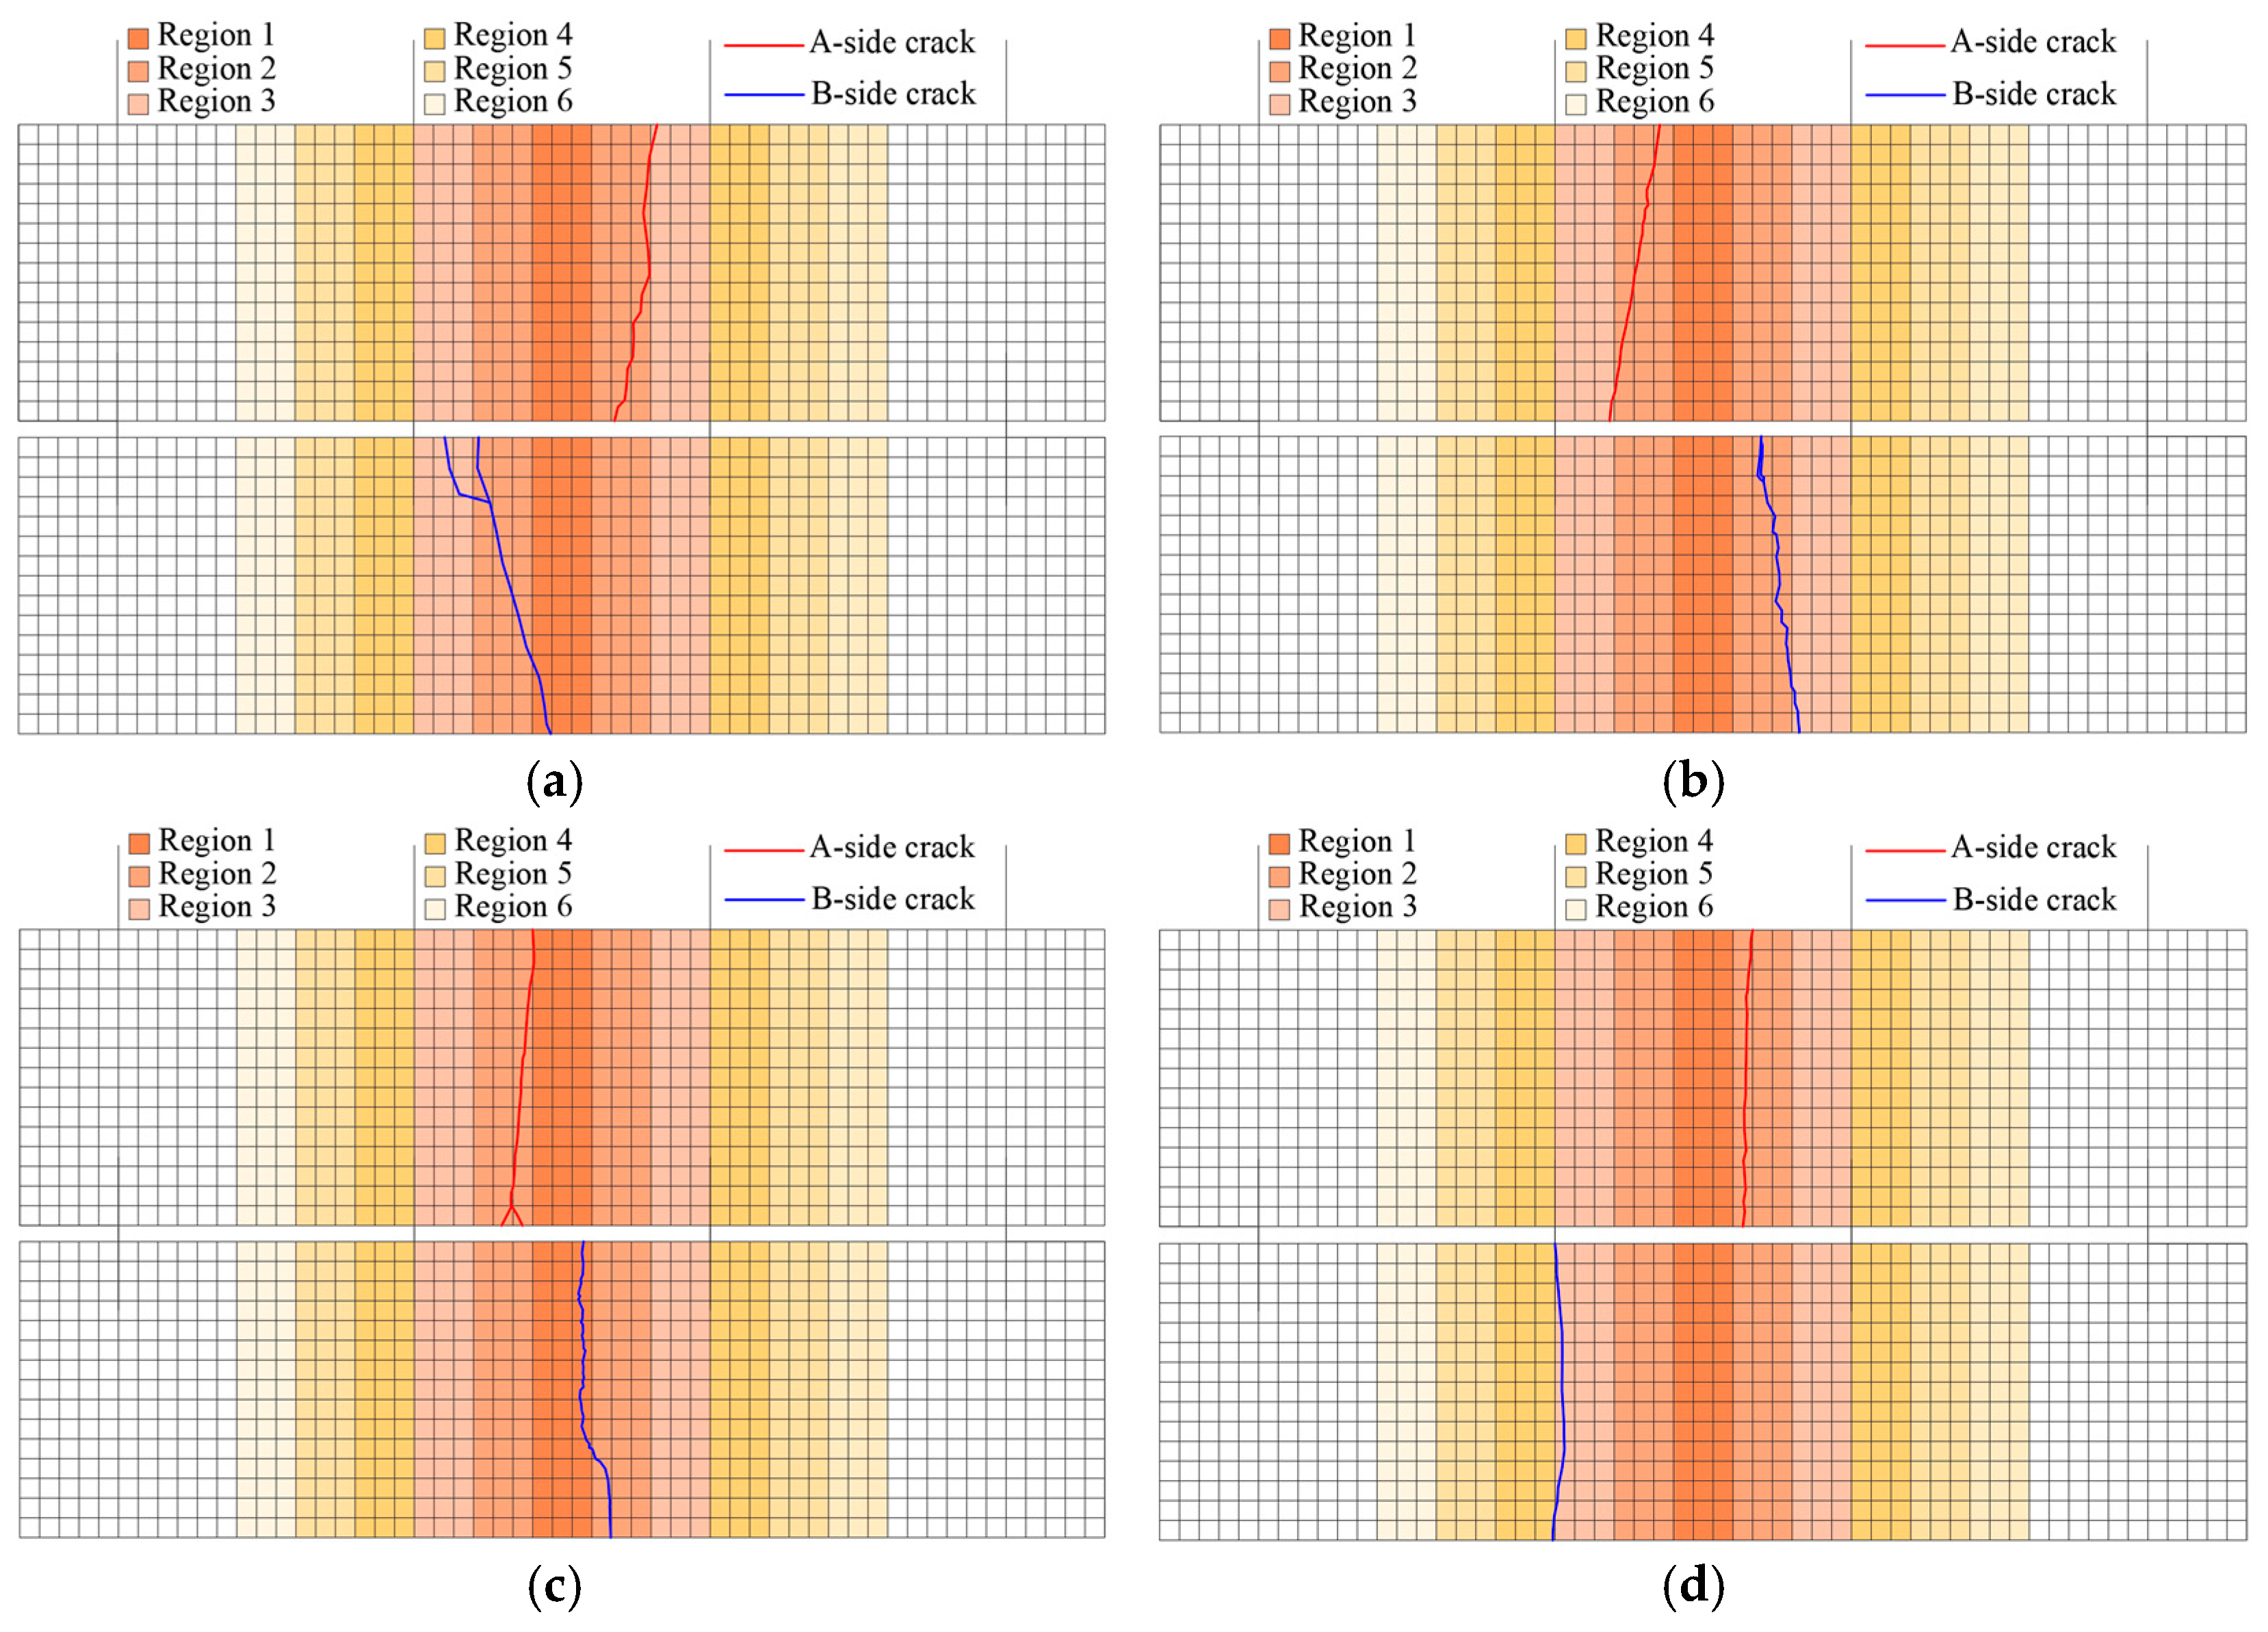
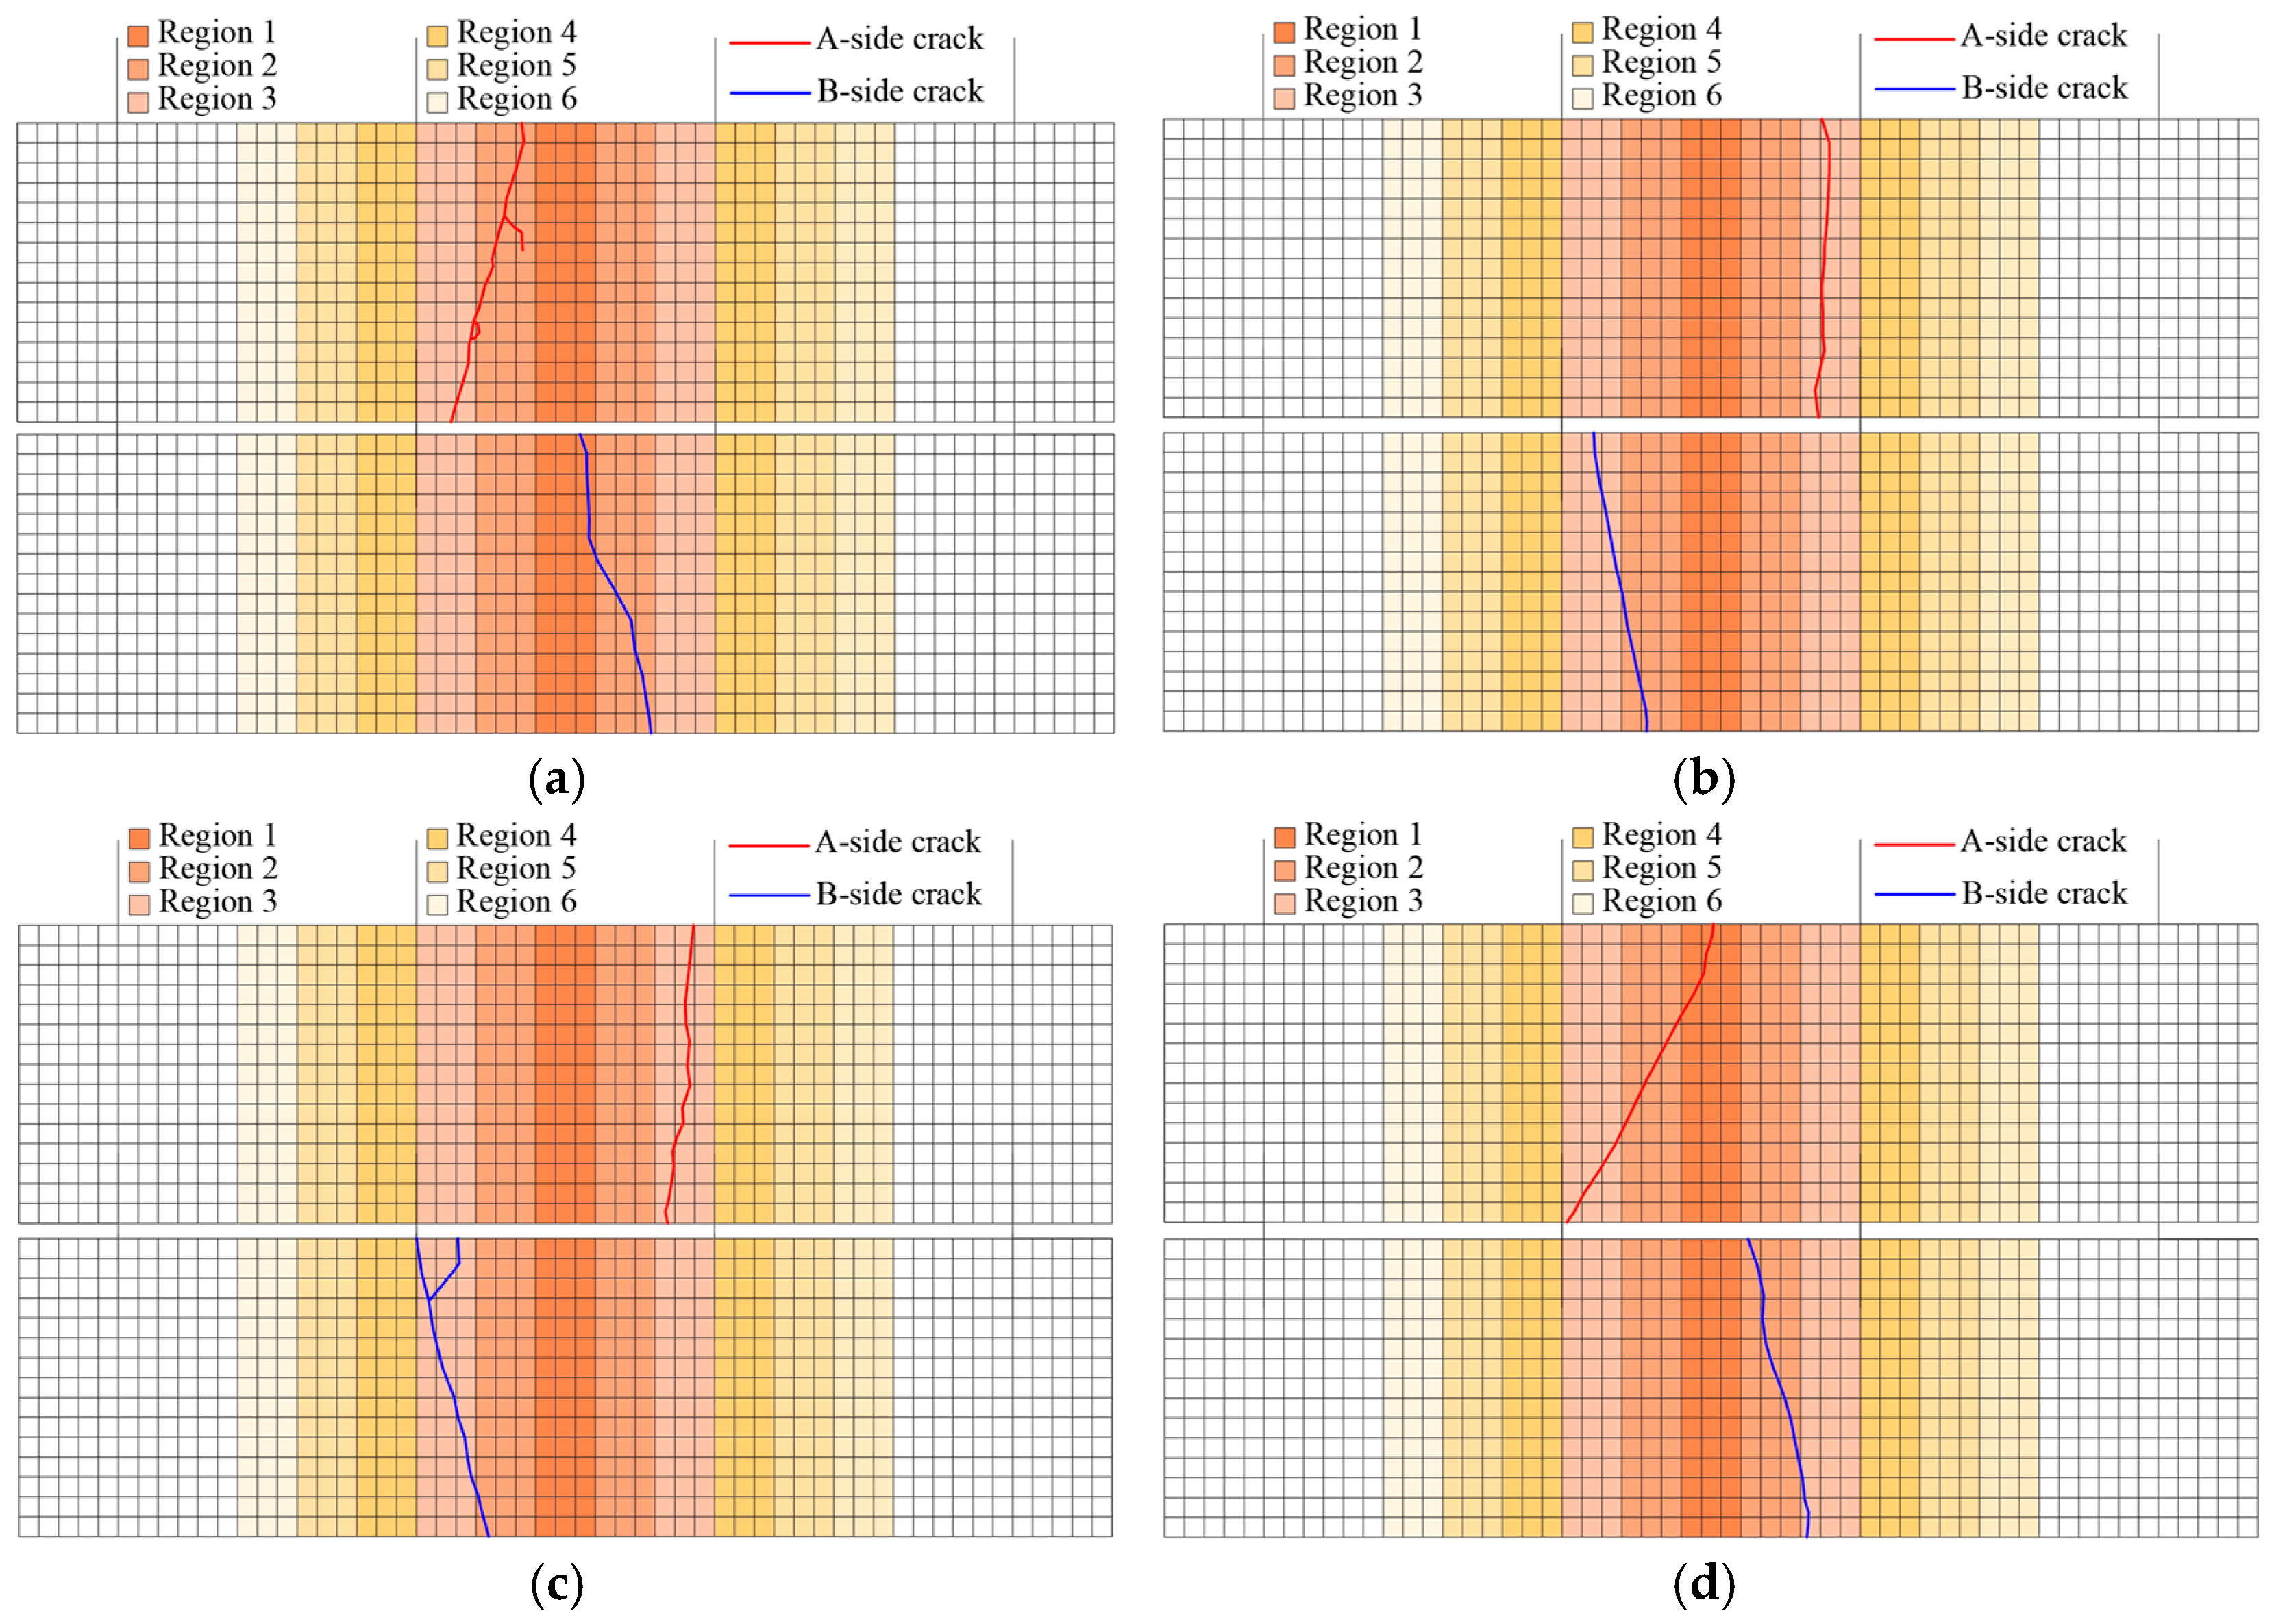
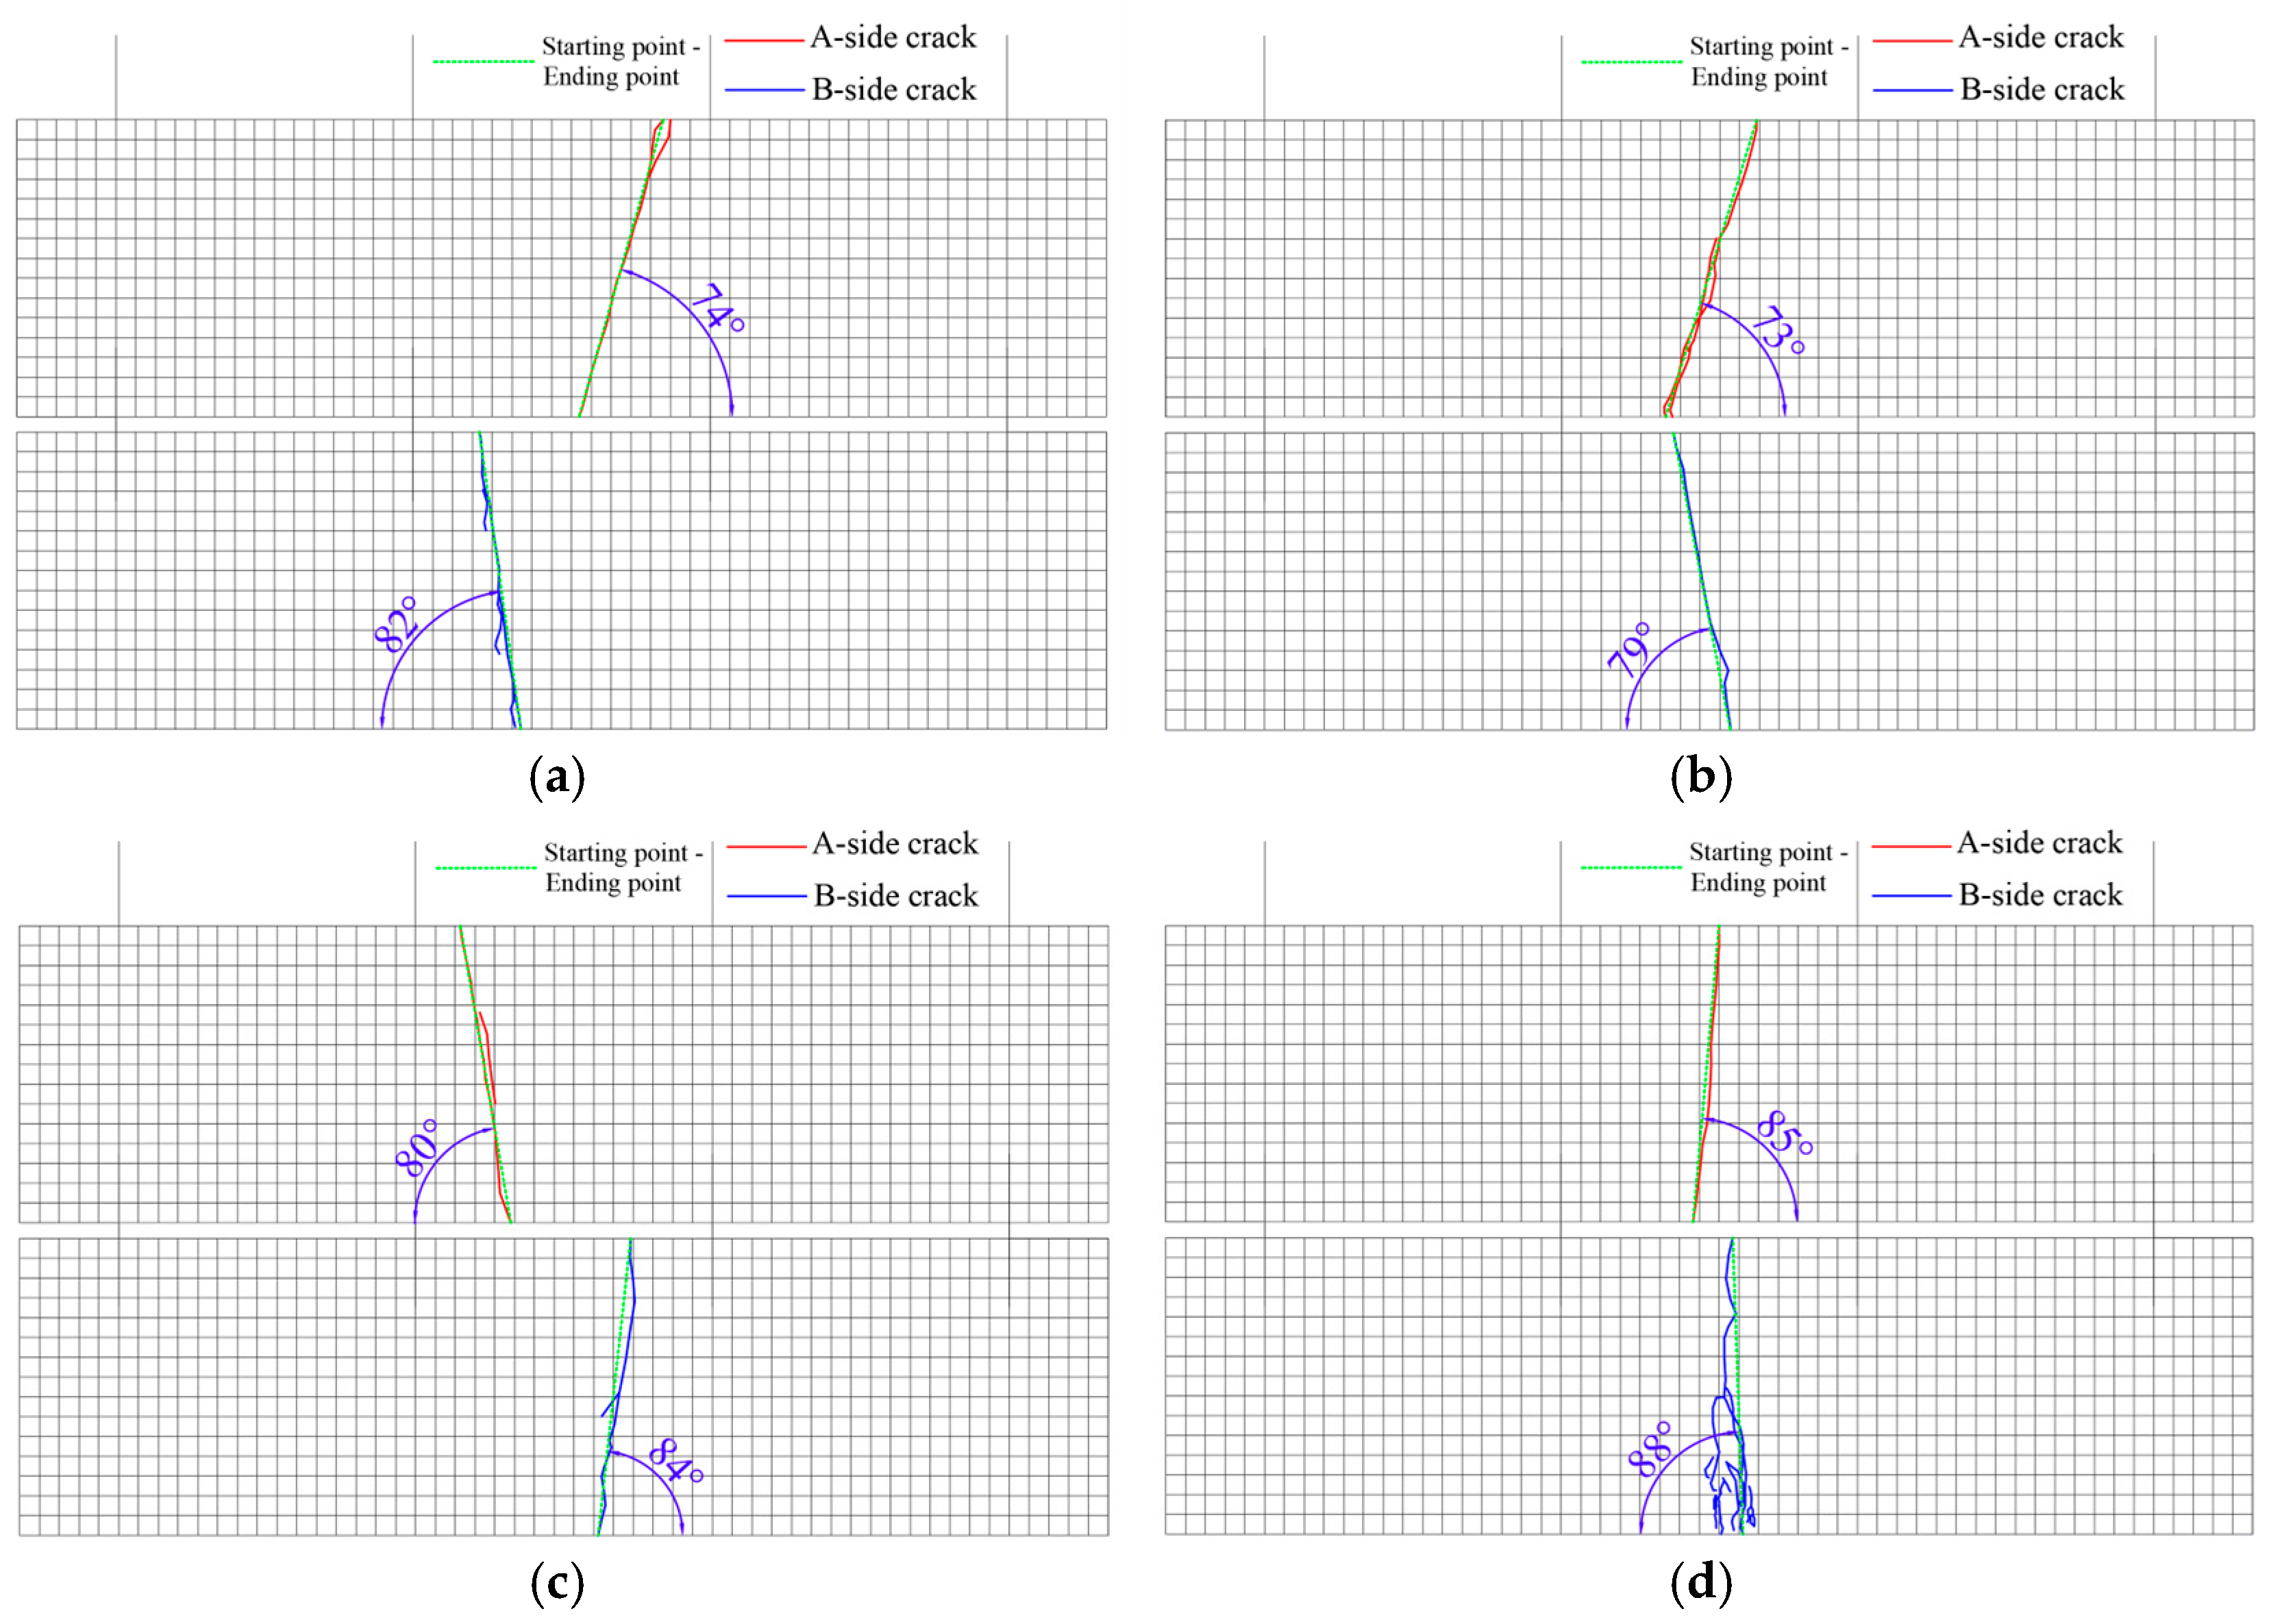
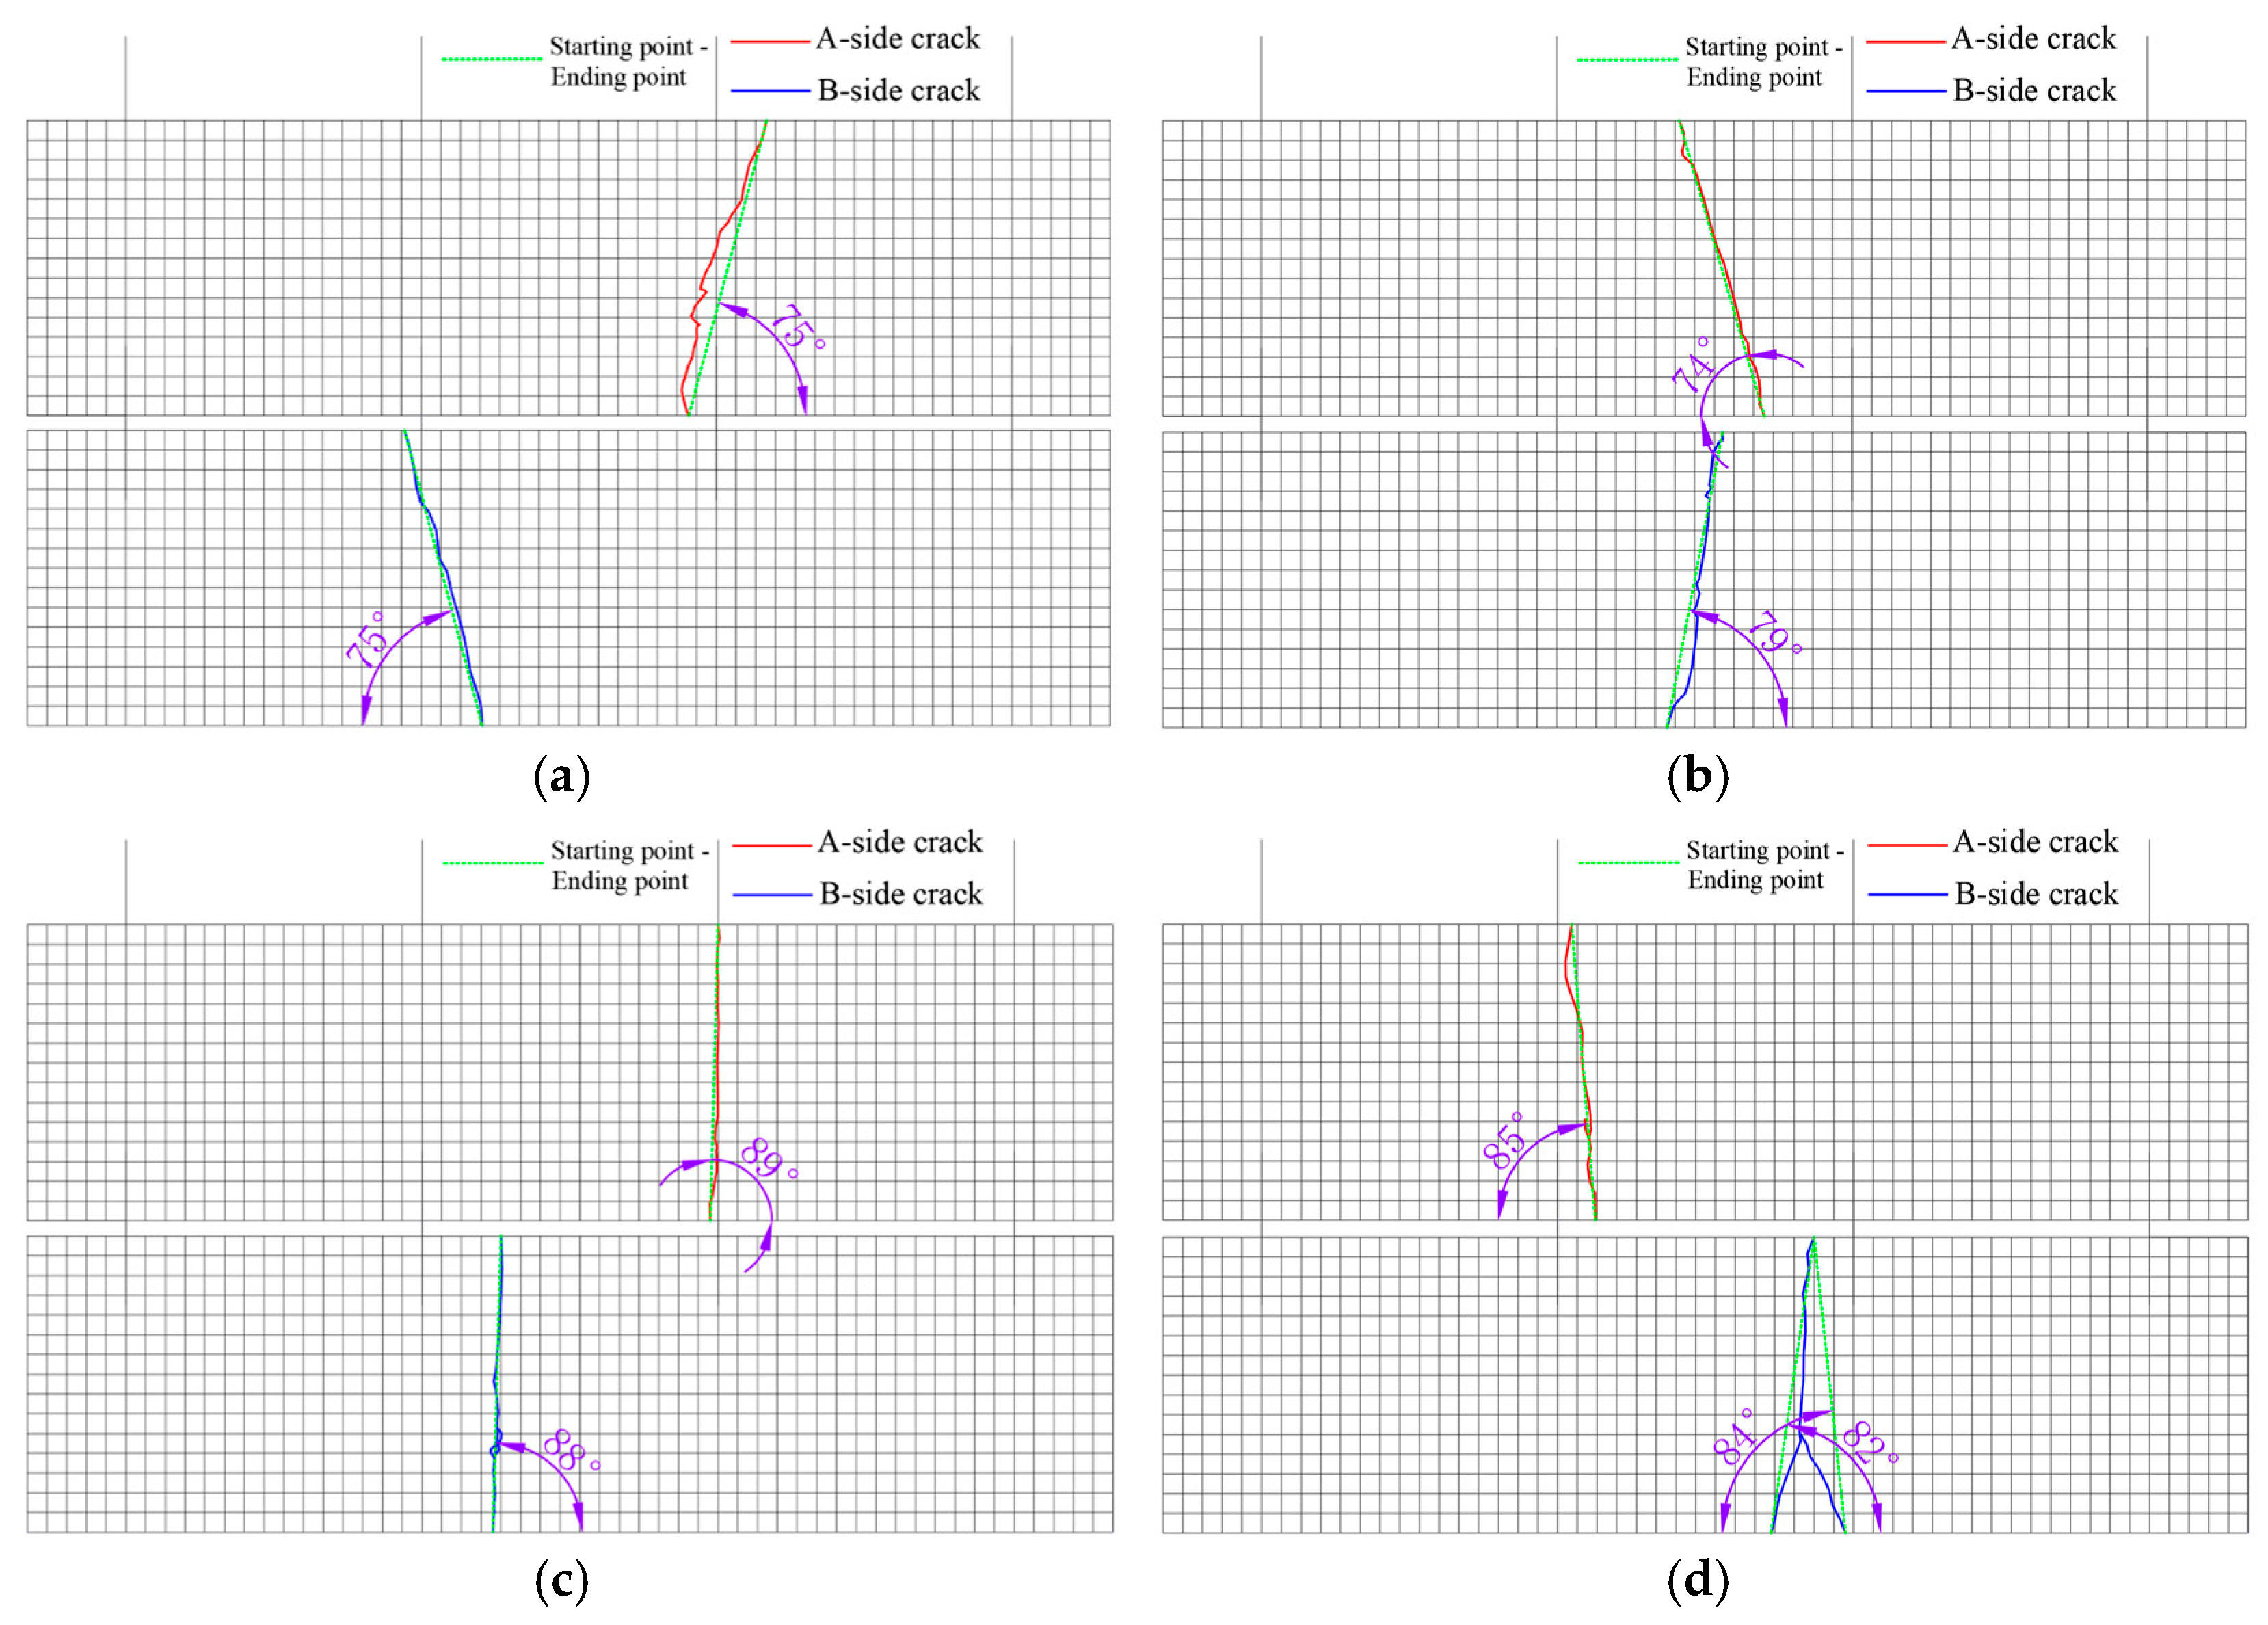
Figure 22.
The CRR2 crack simulation path.
Figure 22.
The CRR2 crack simulation path.
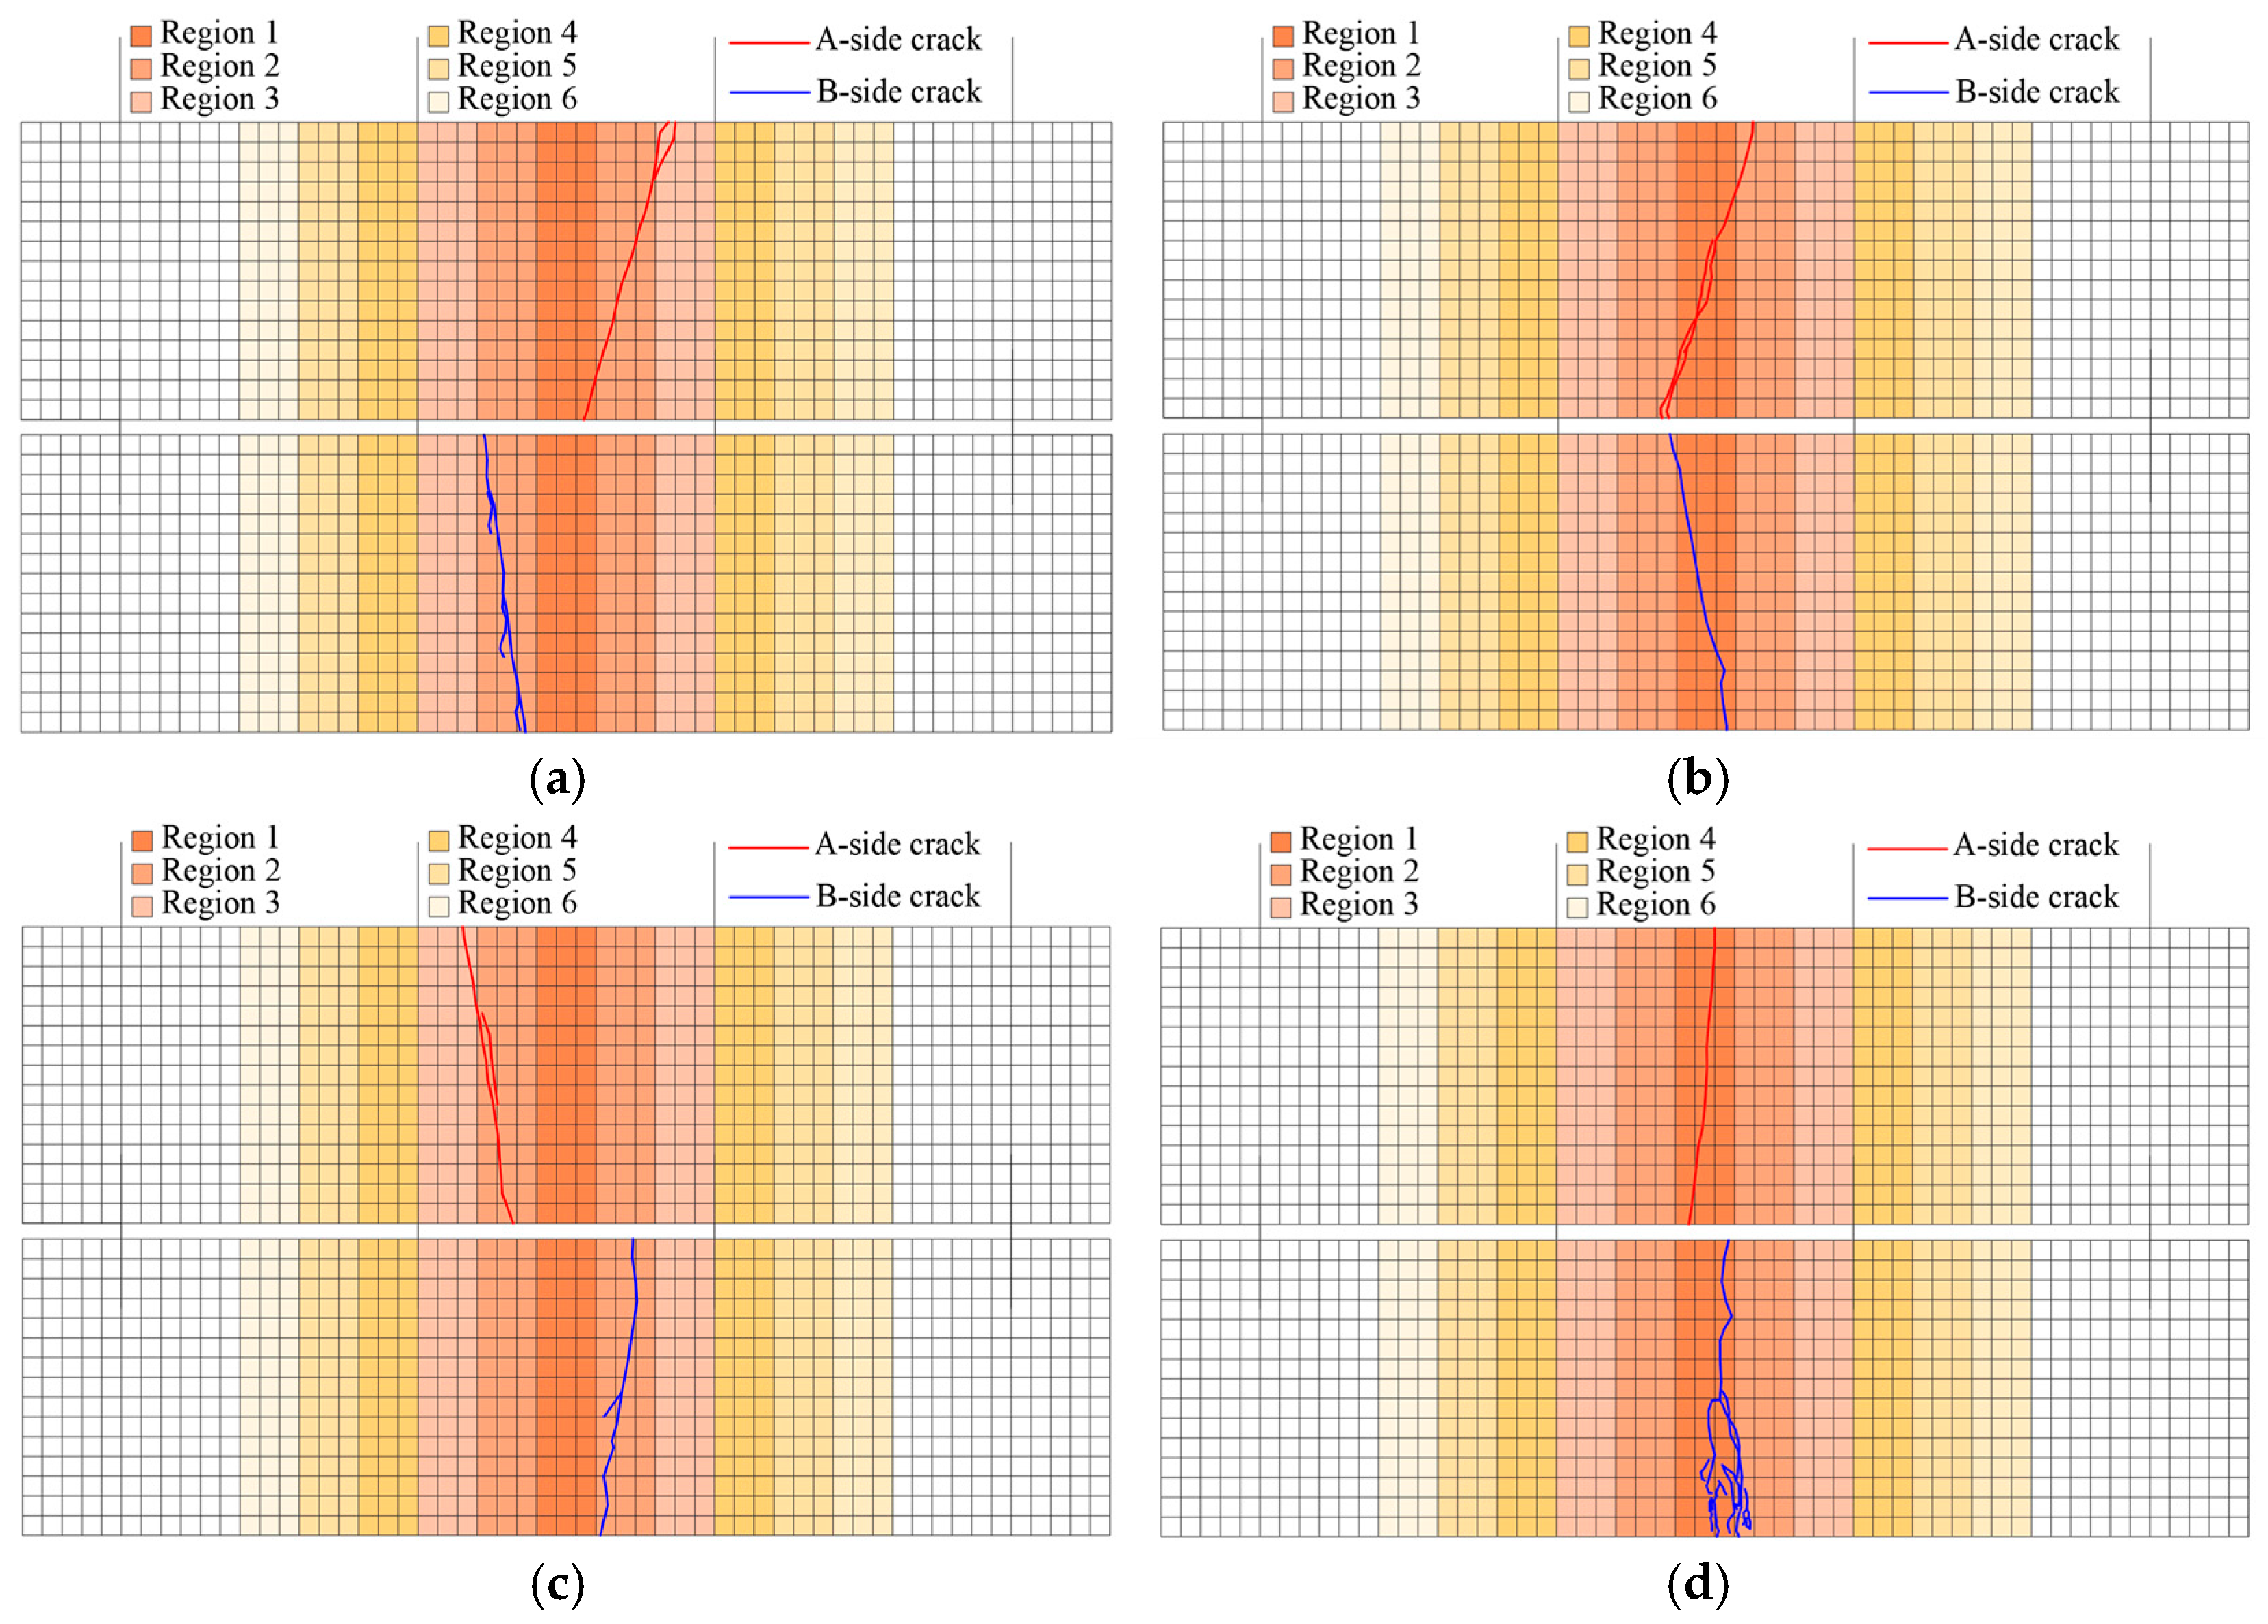
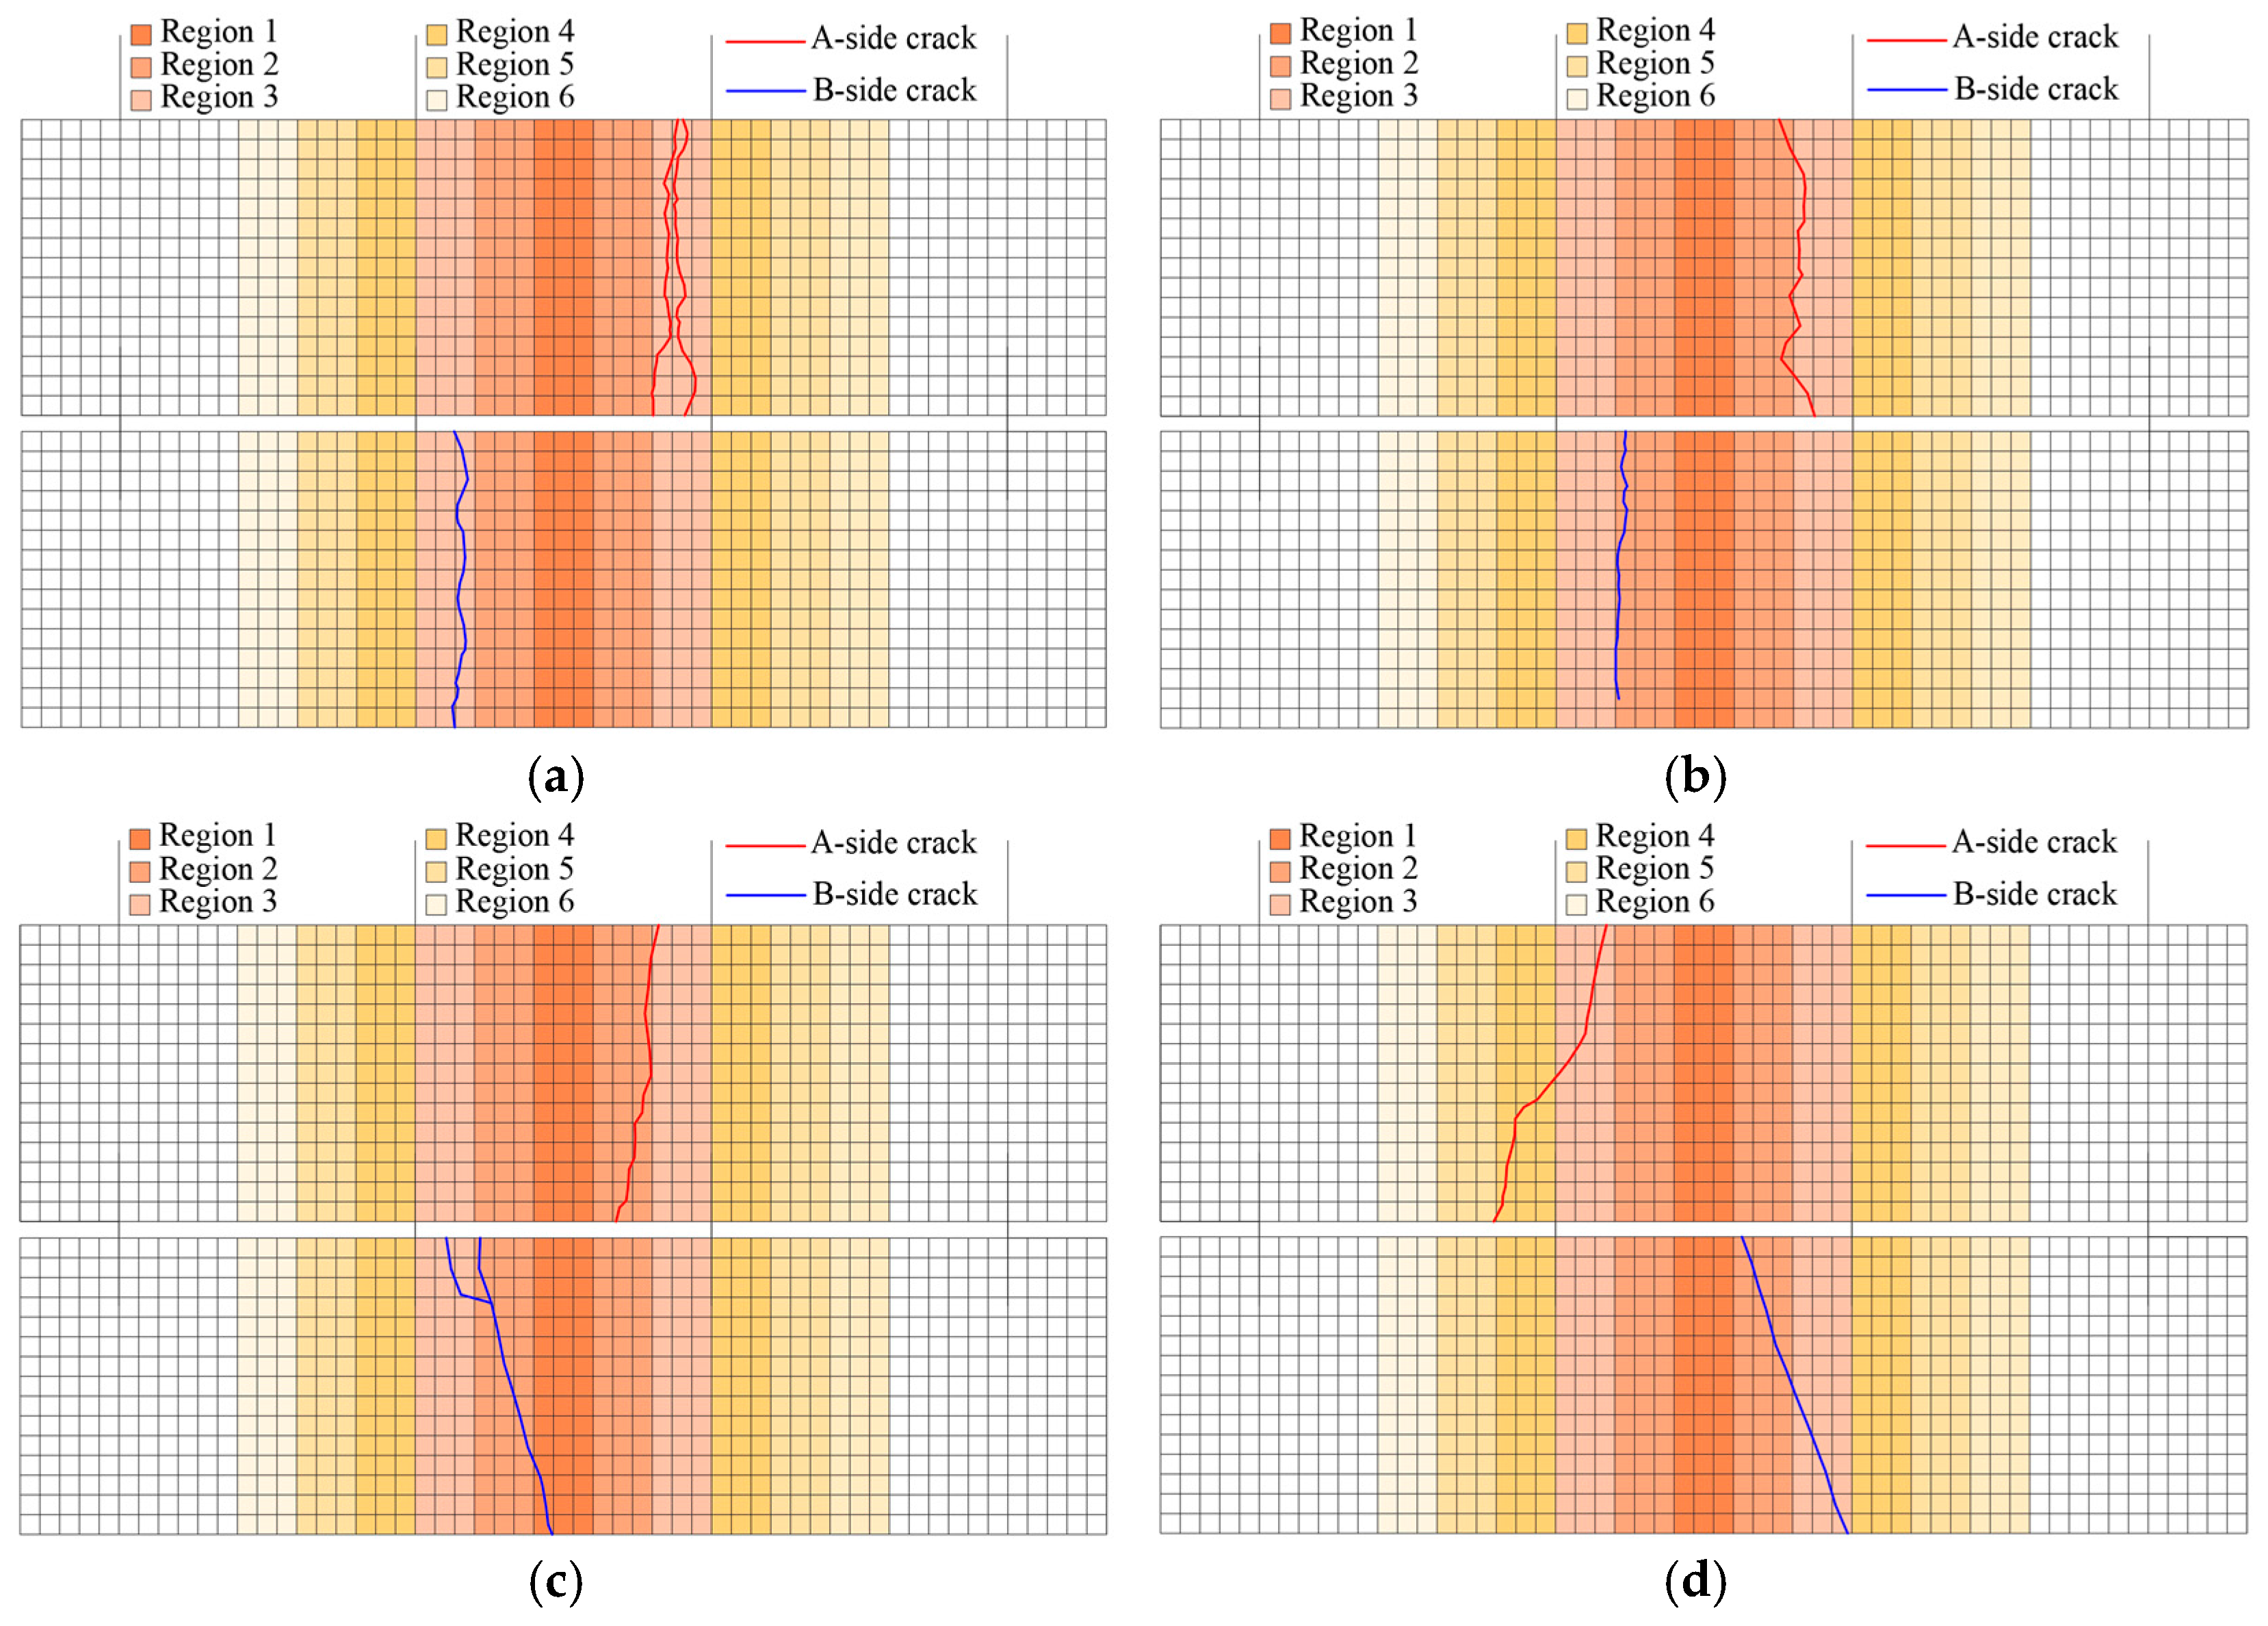
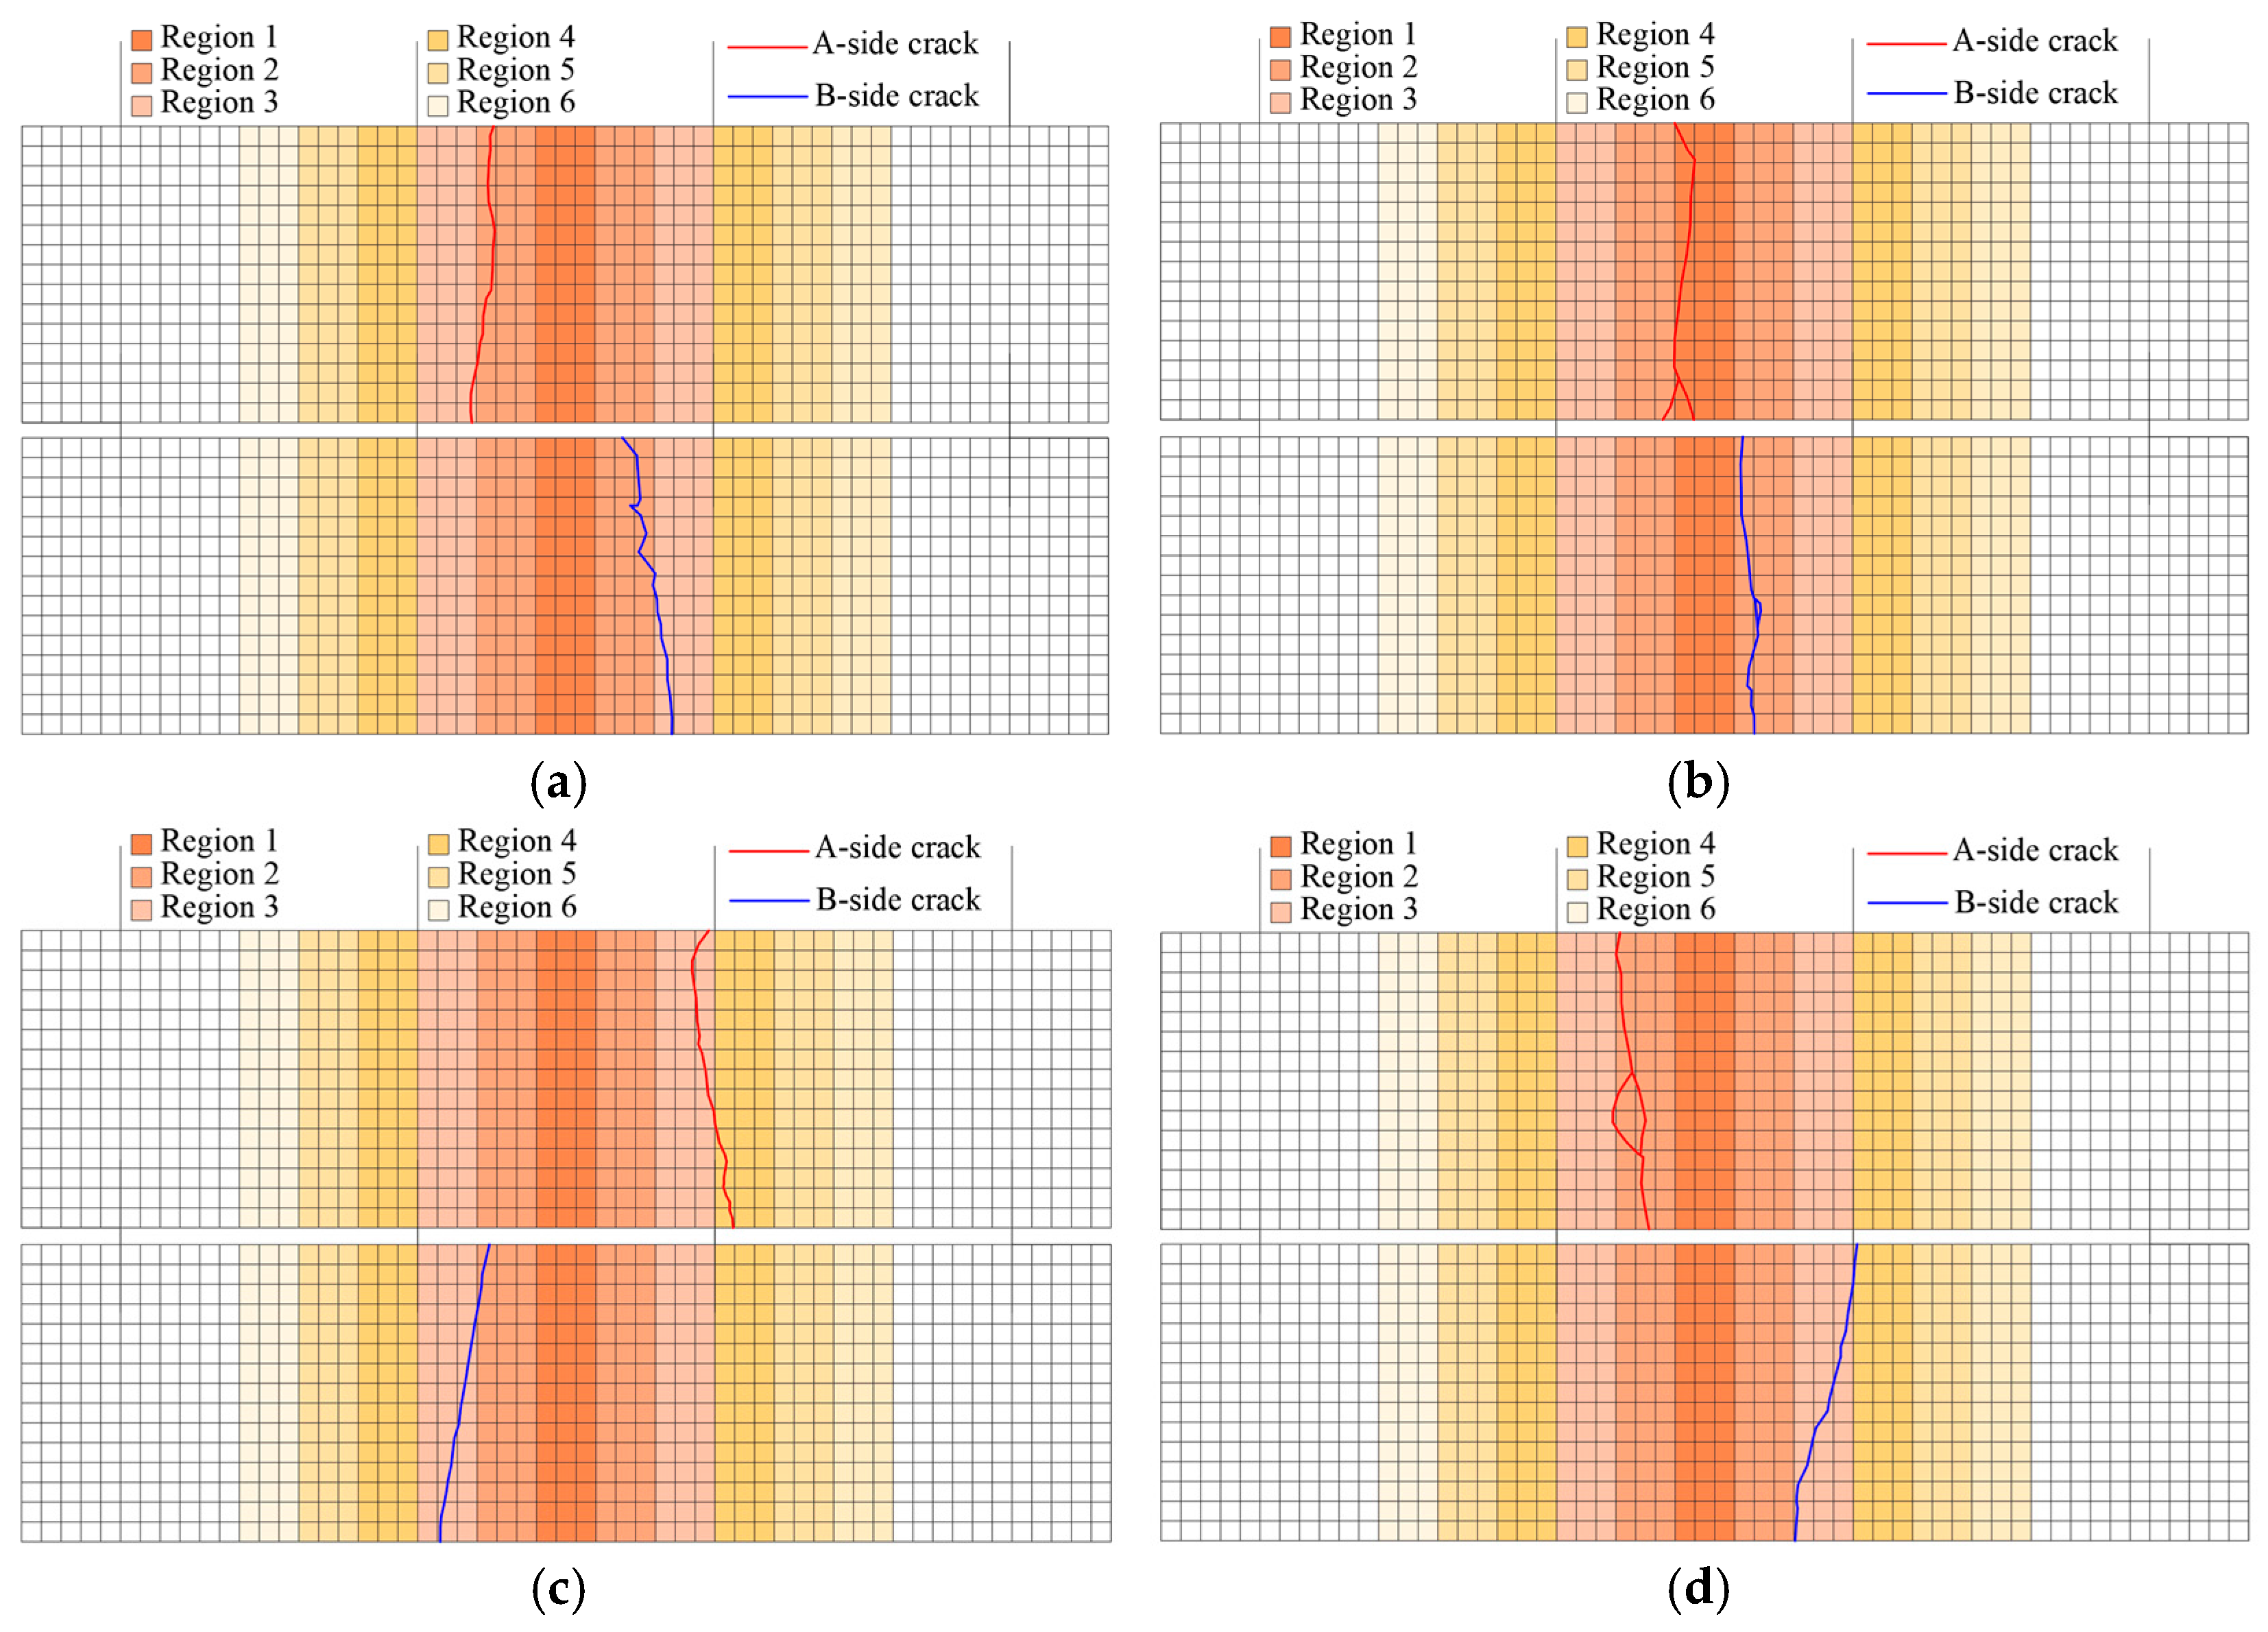
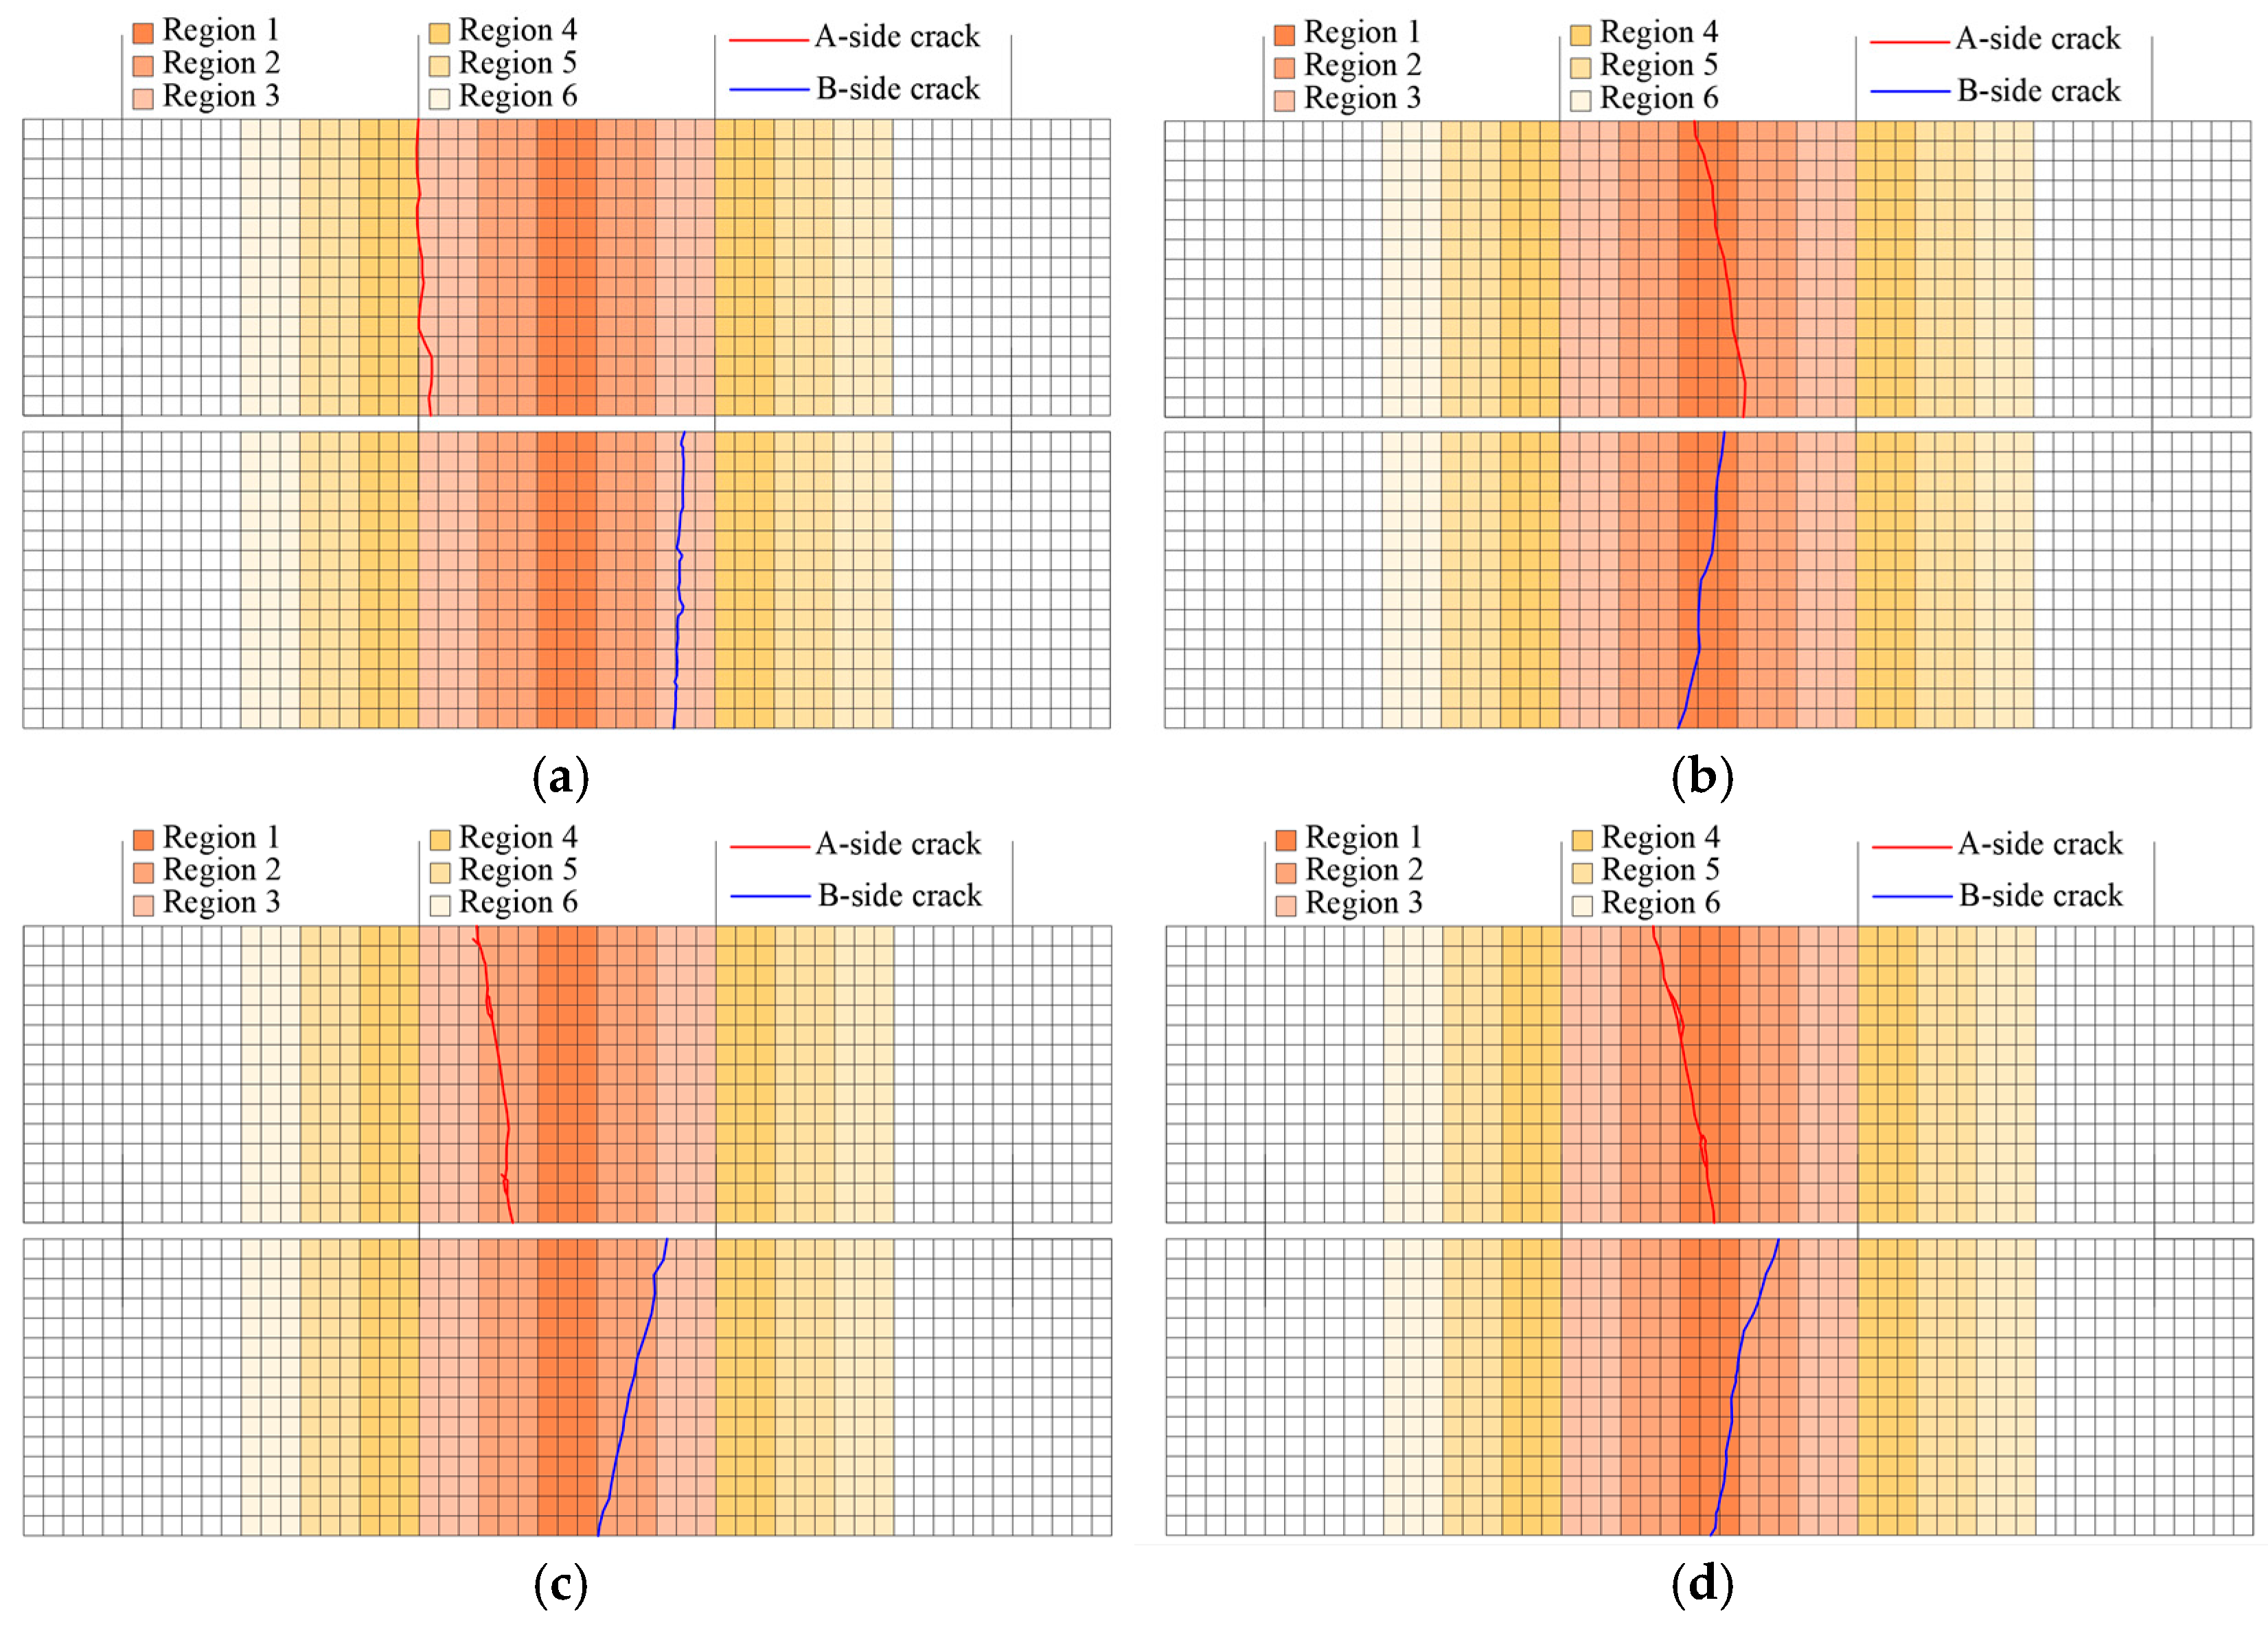
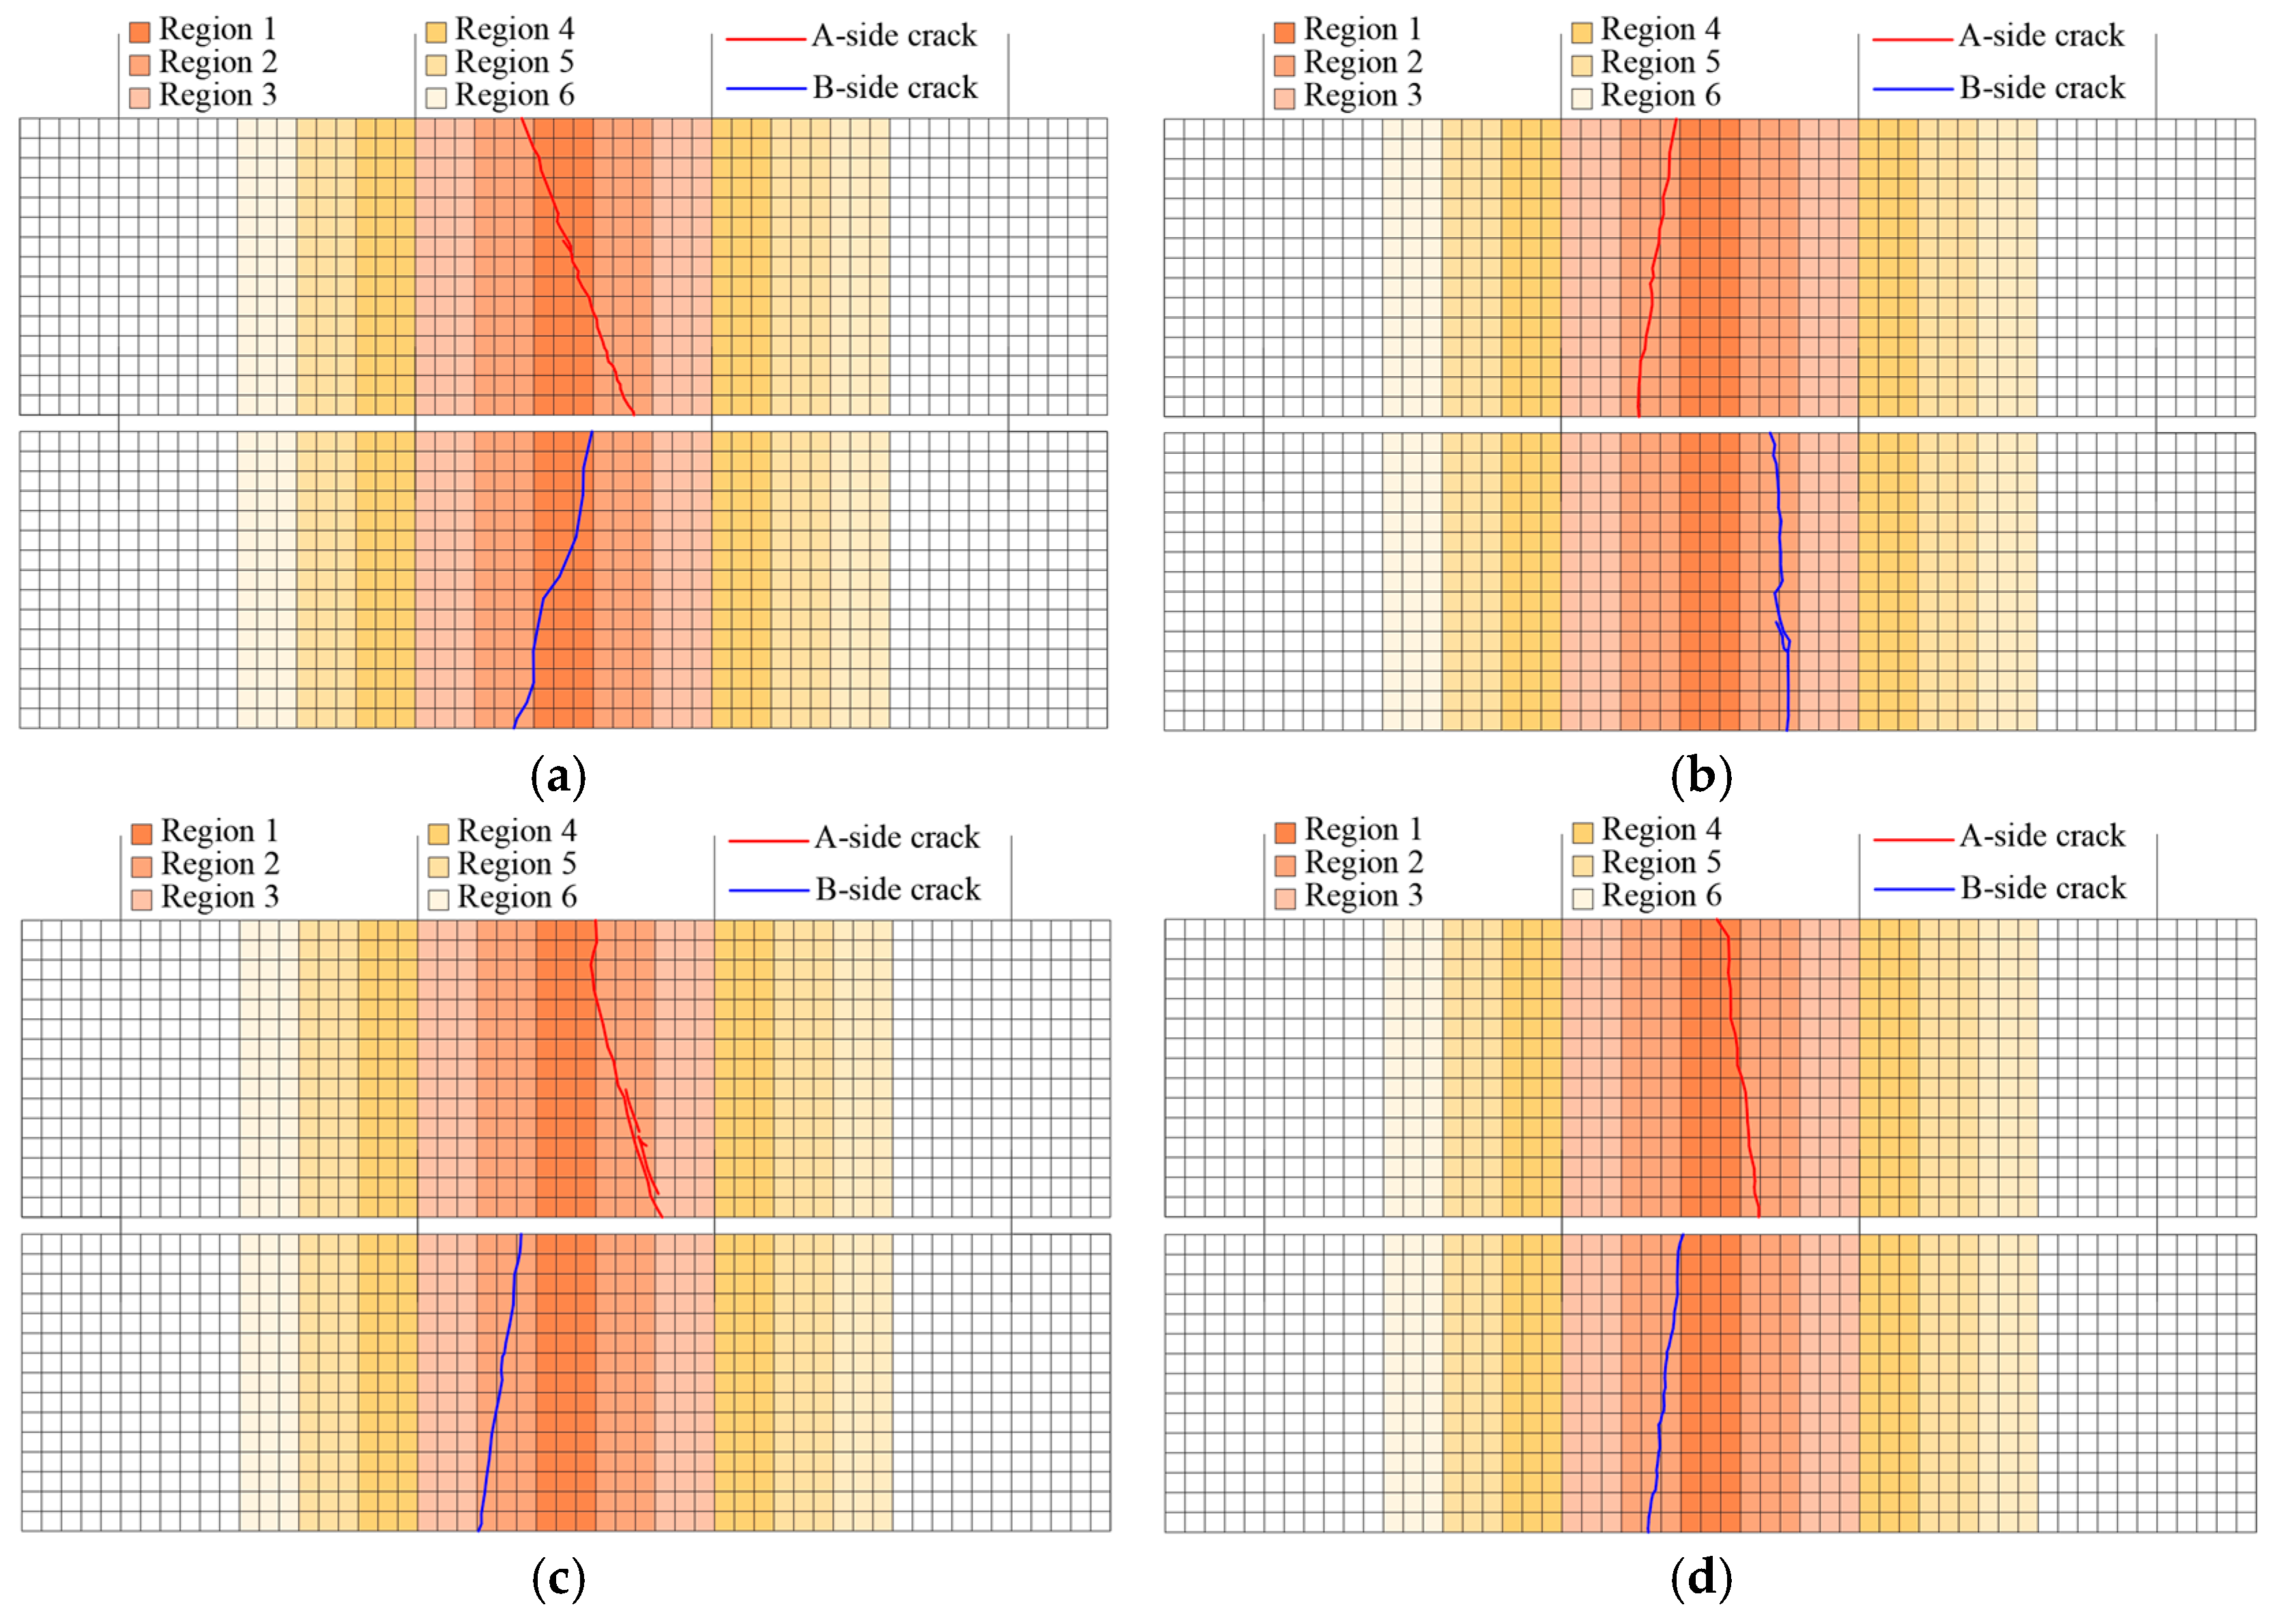
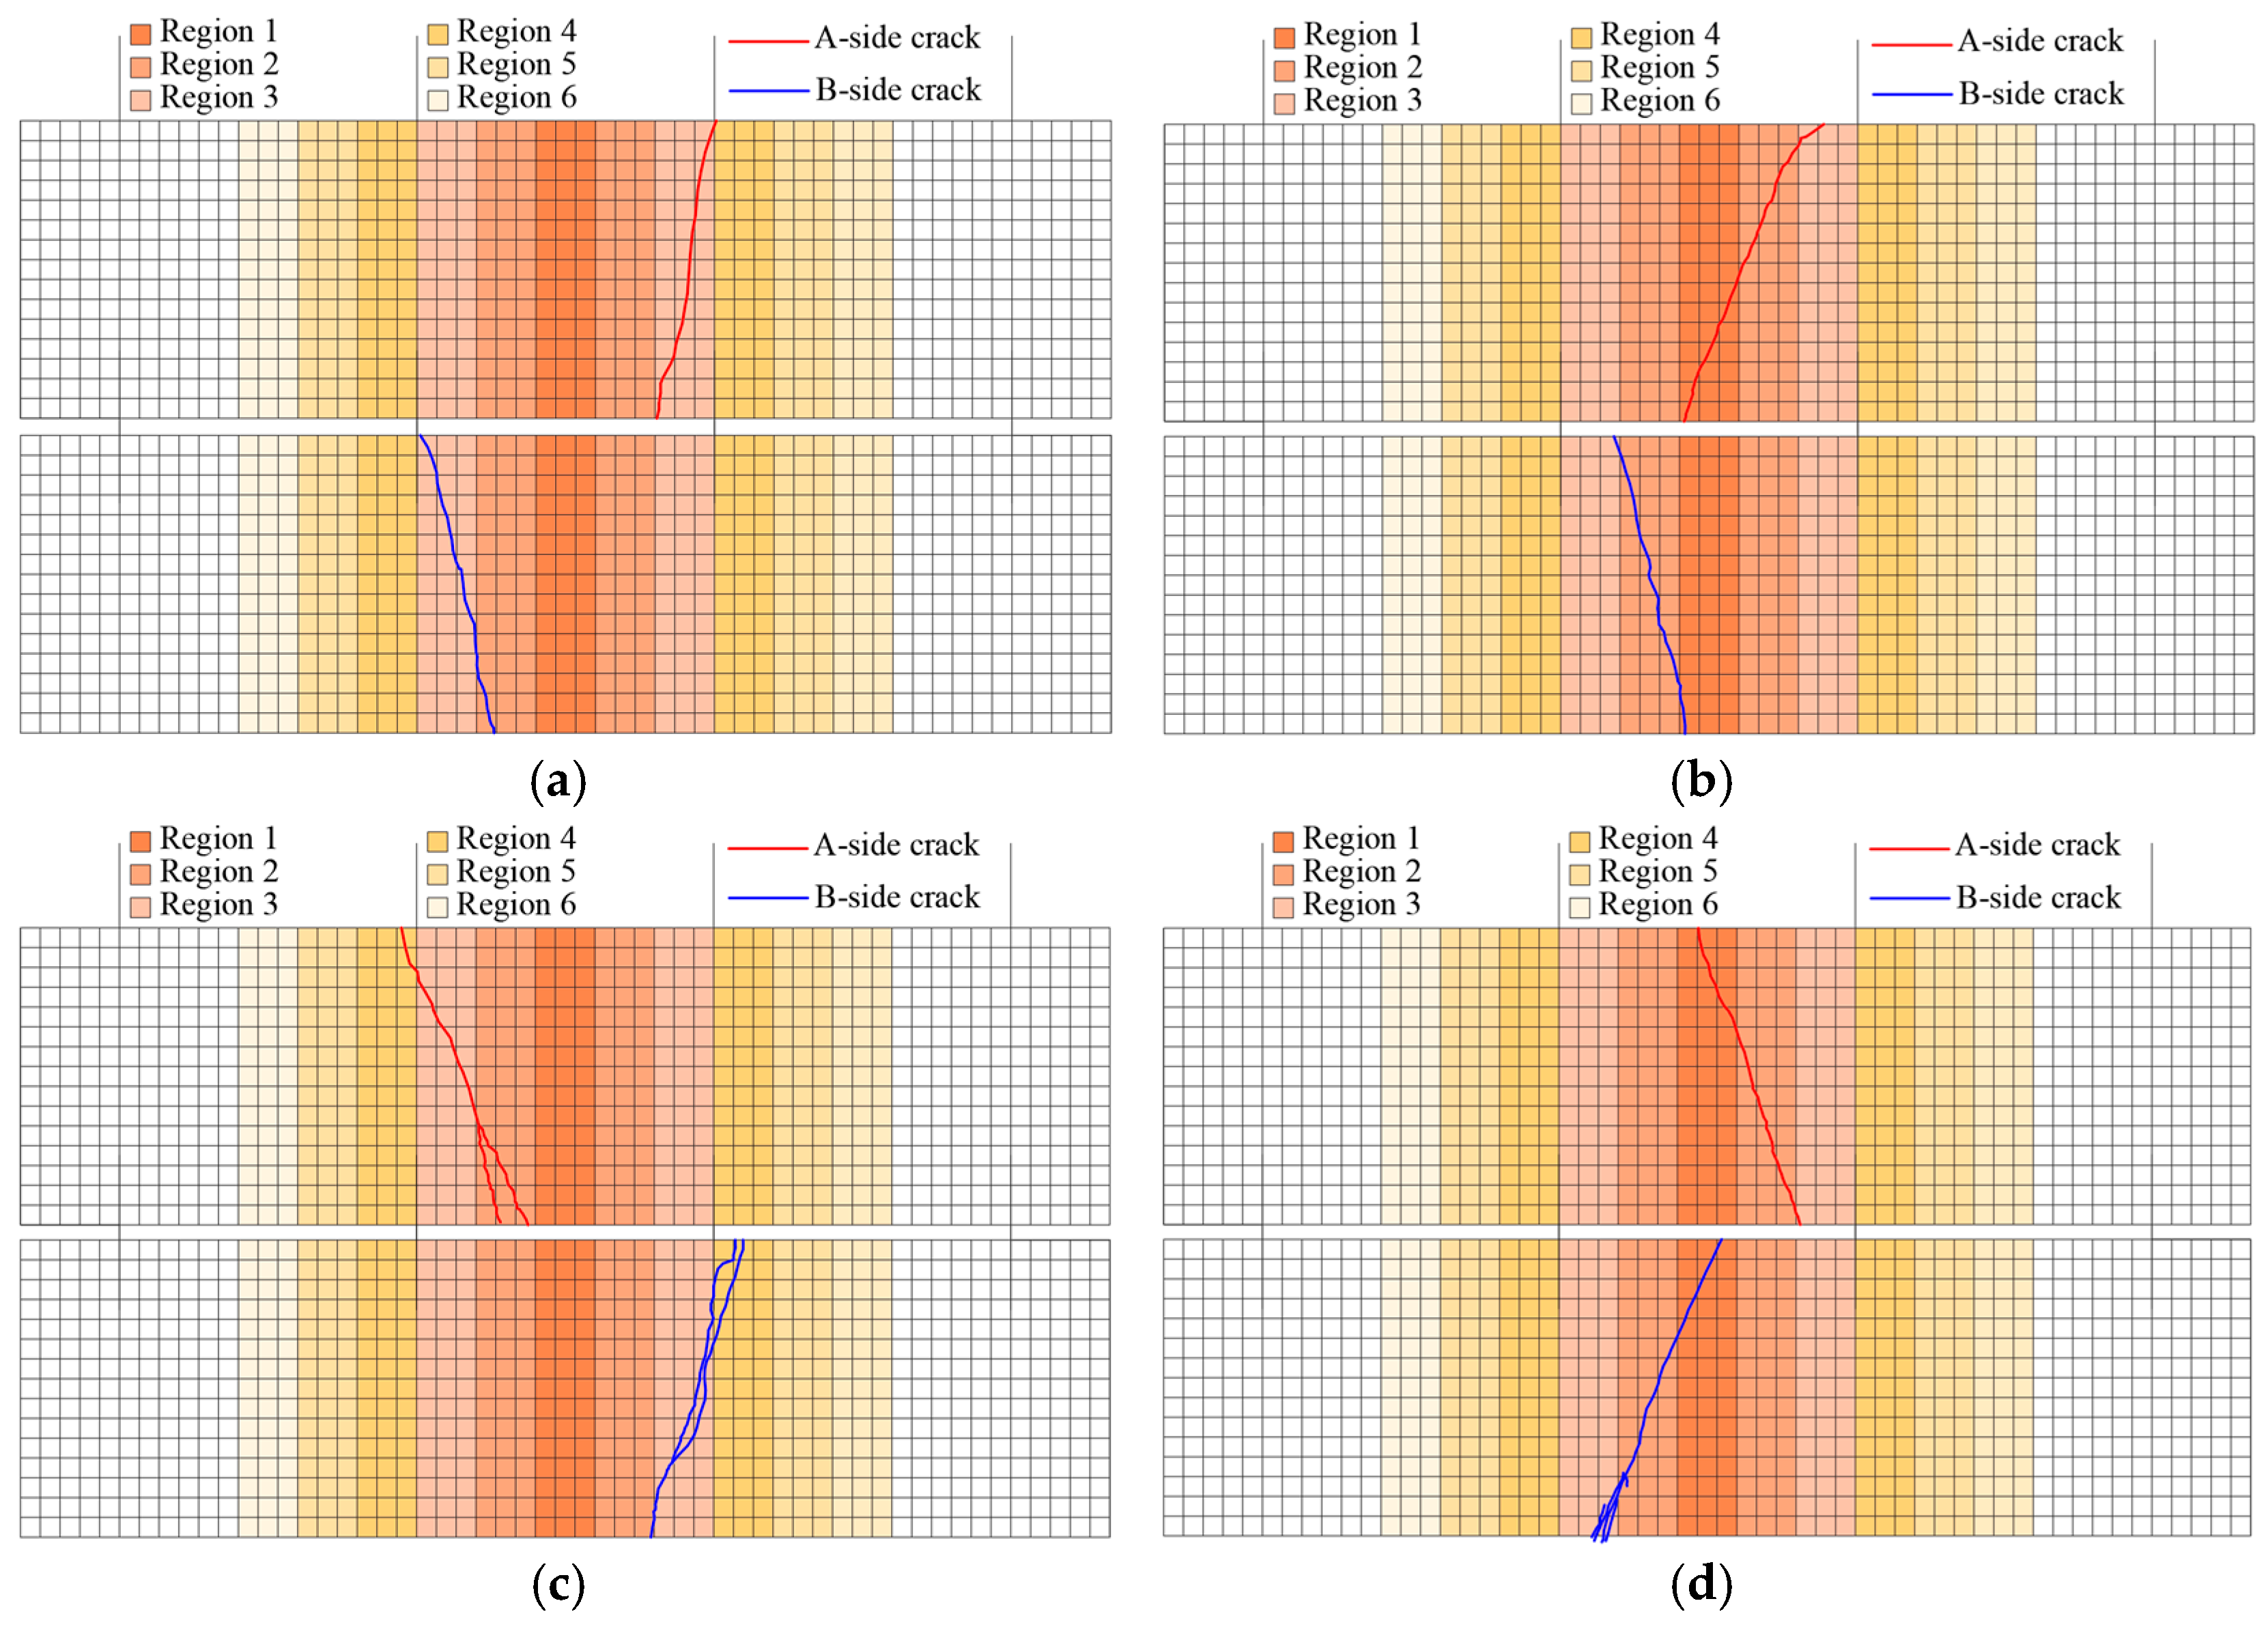
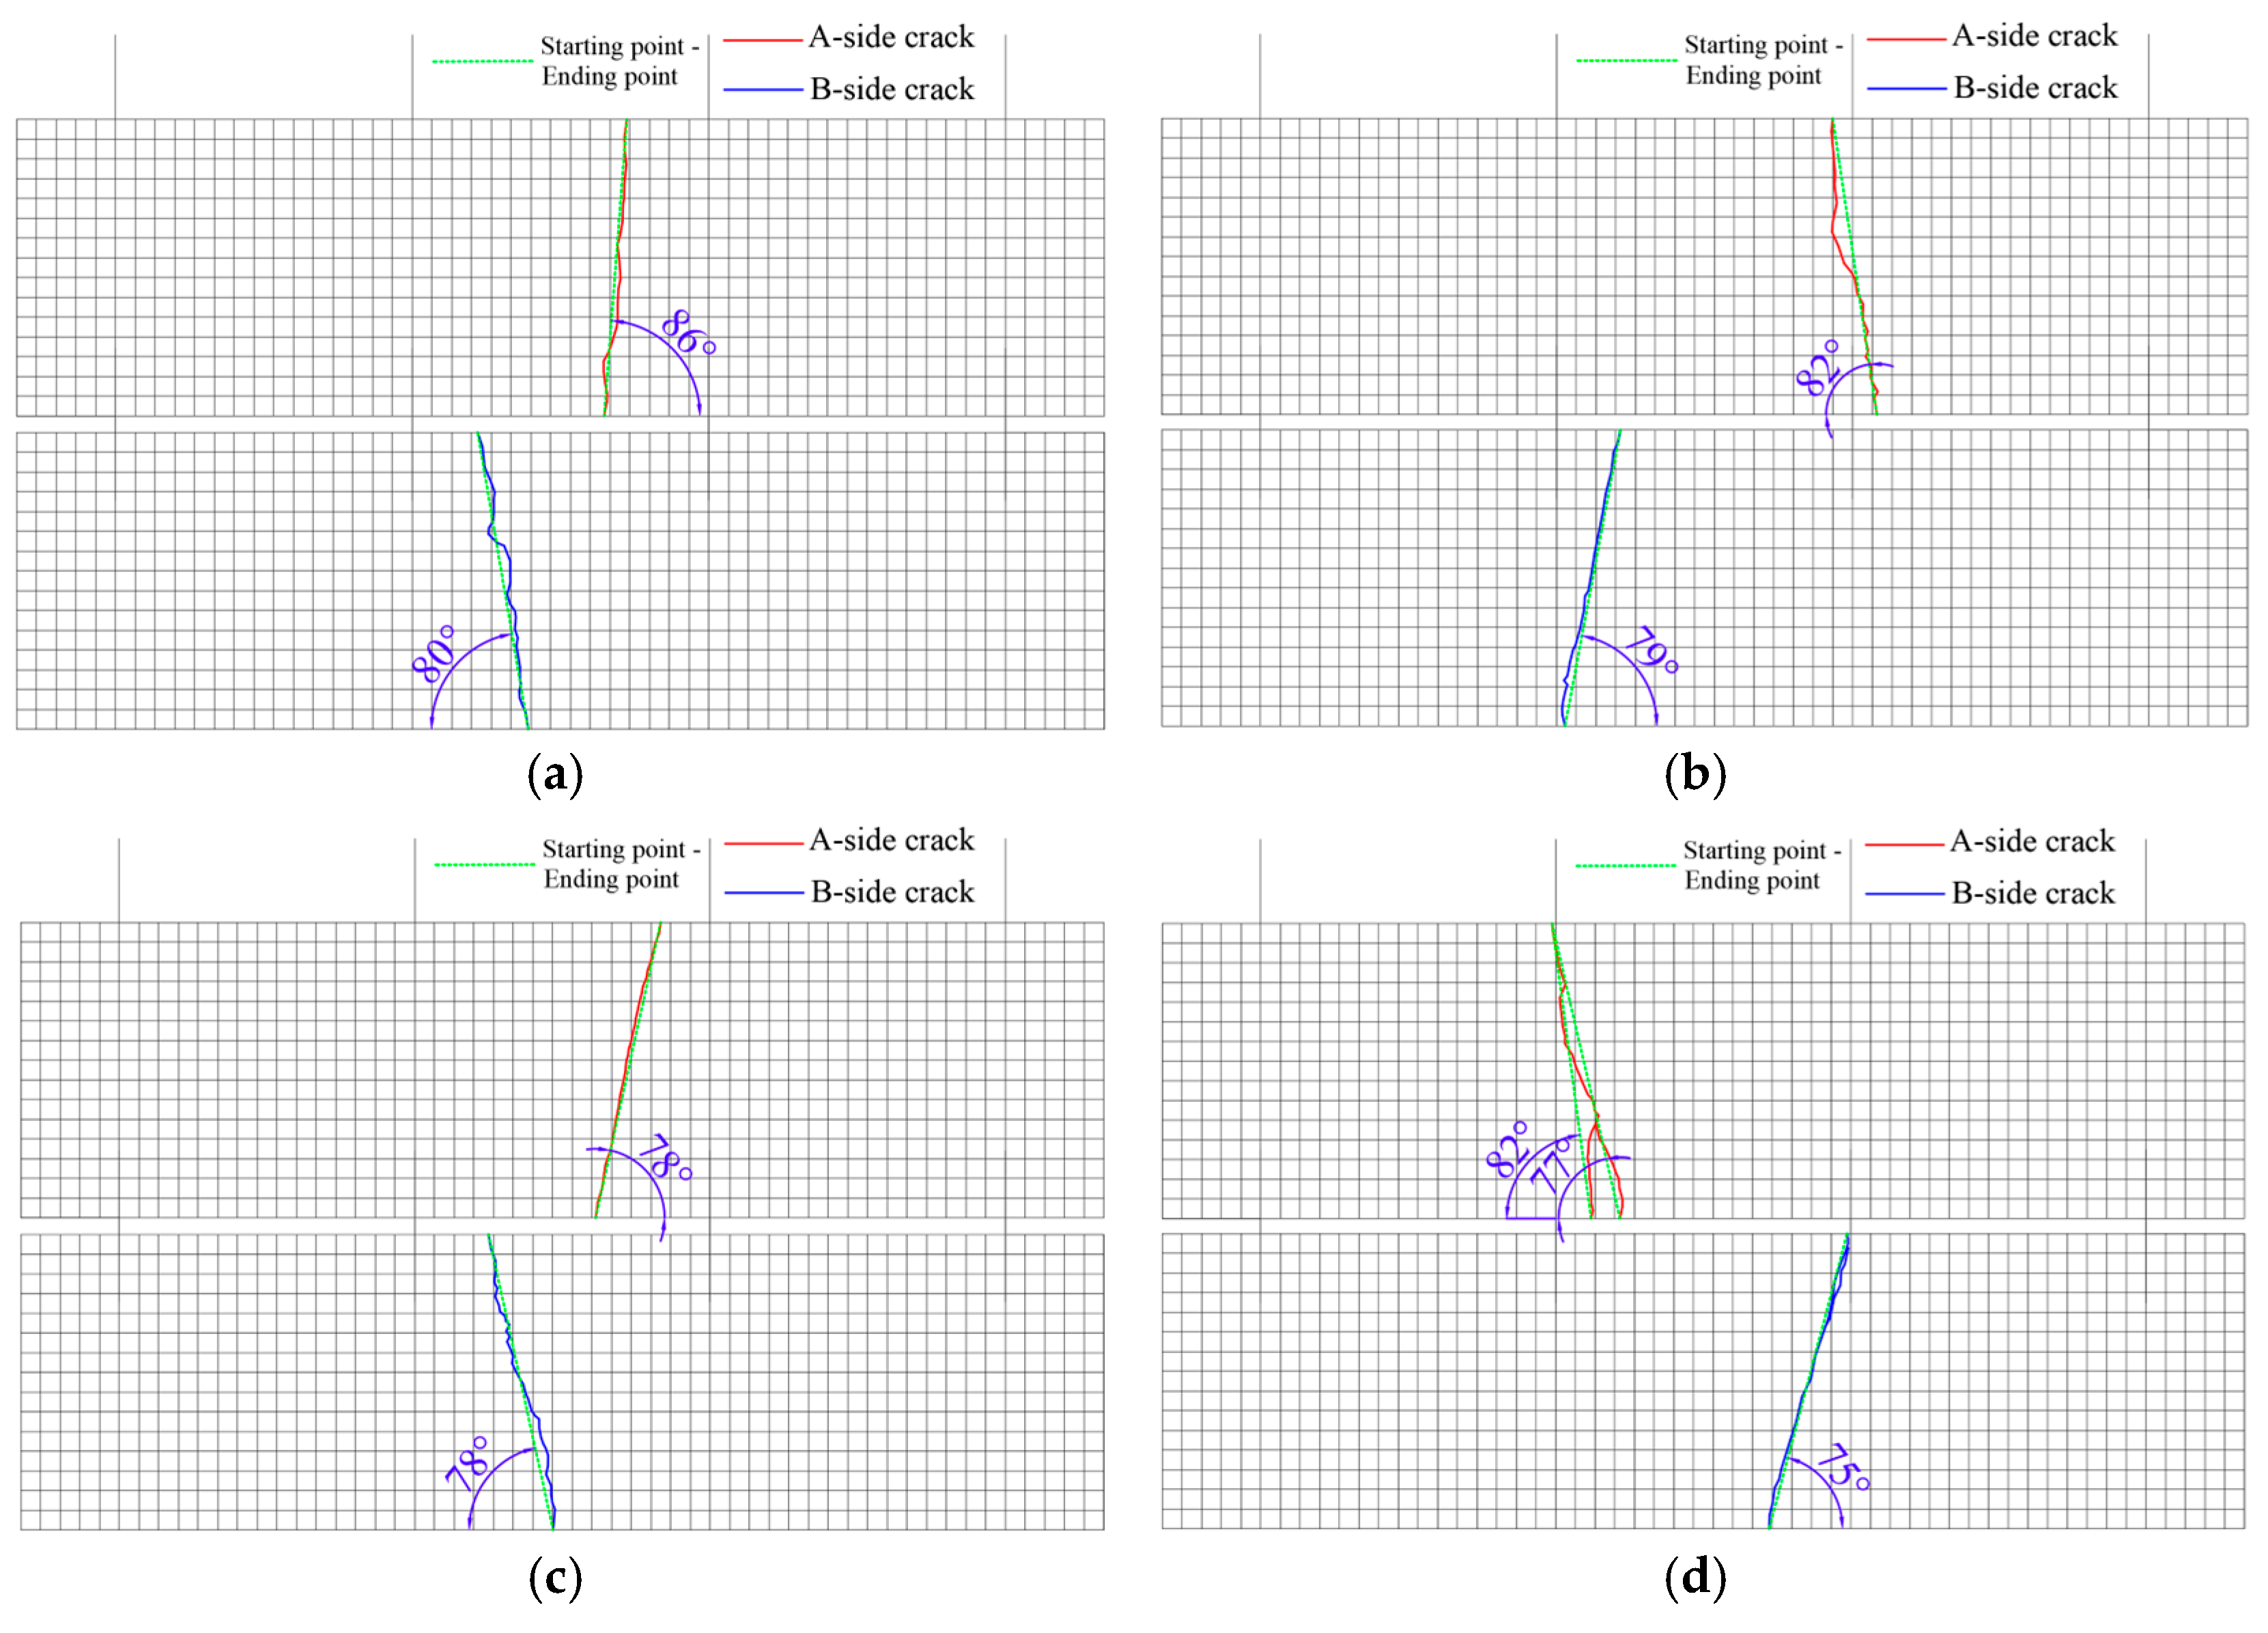
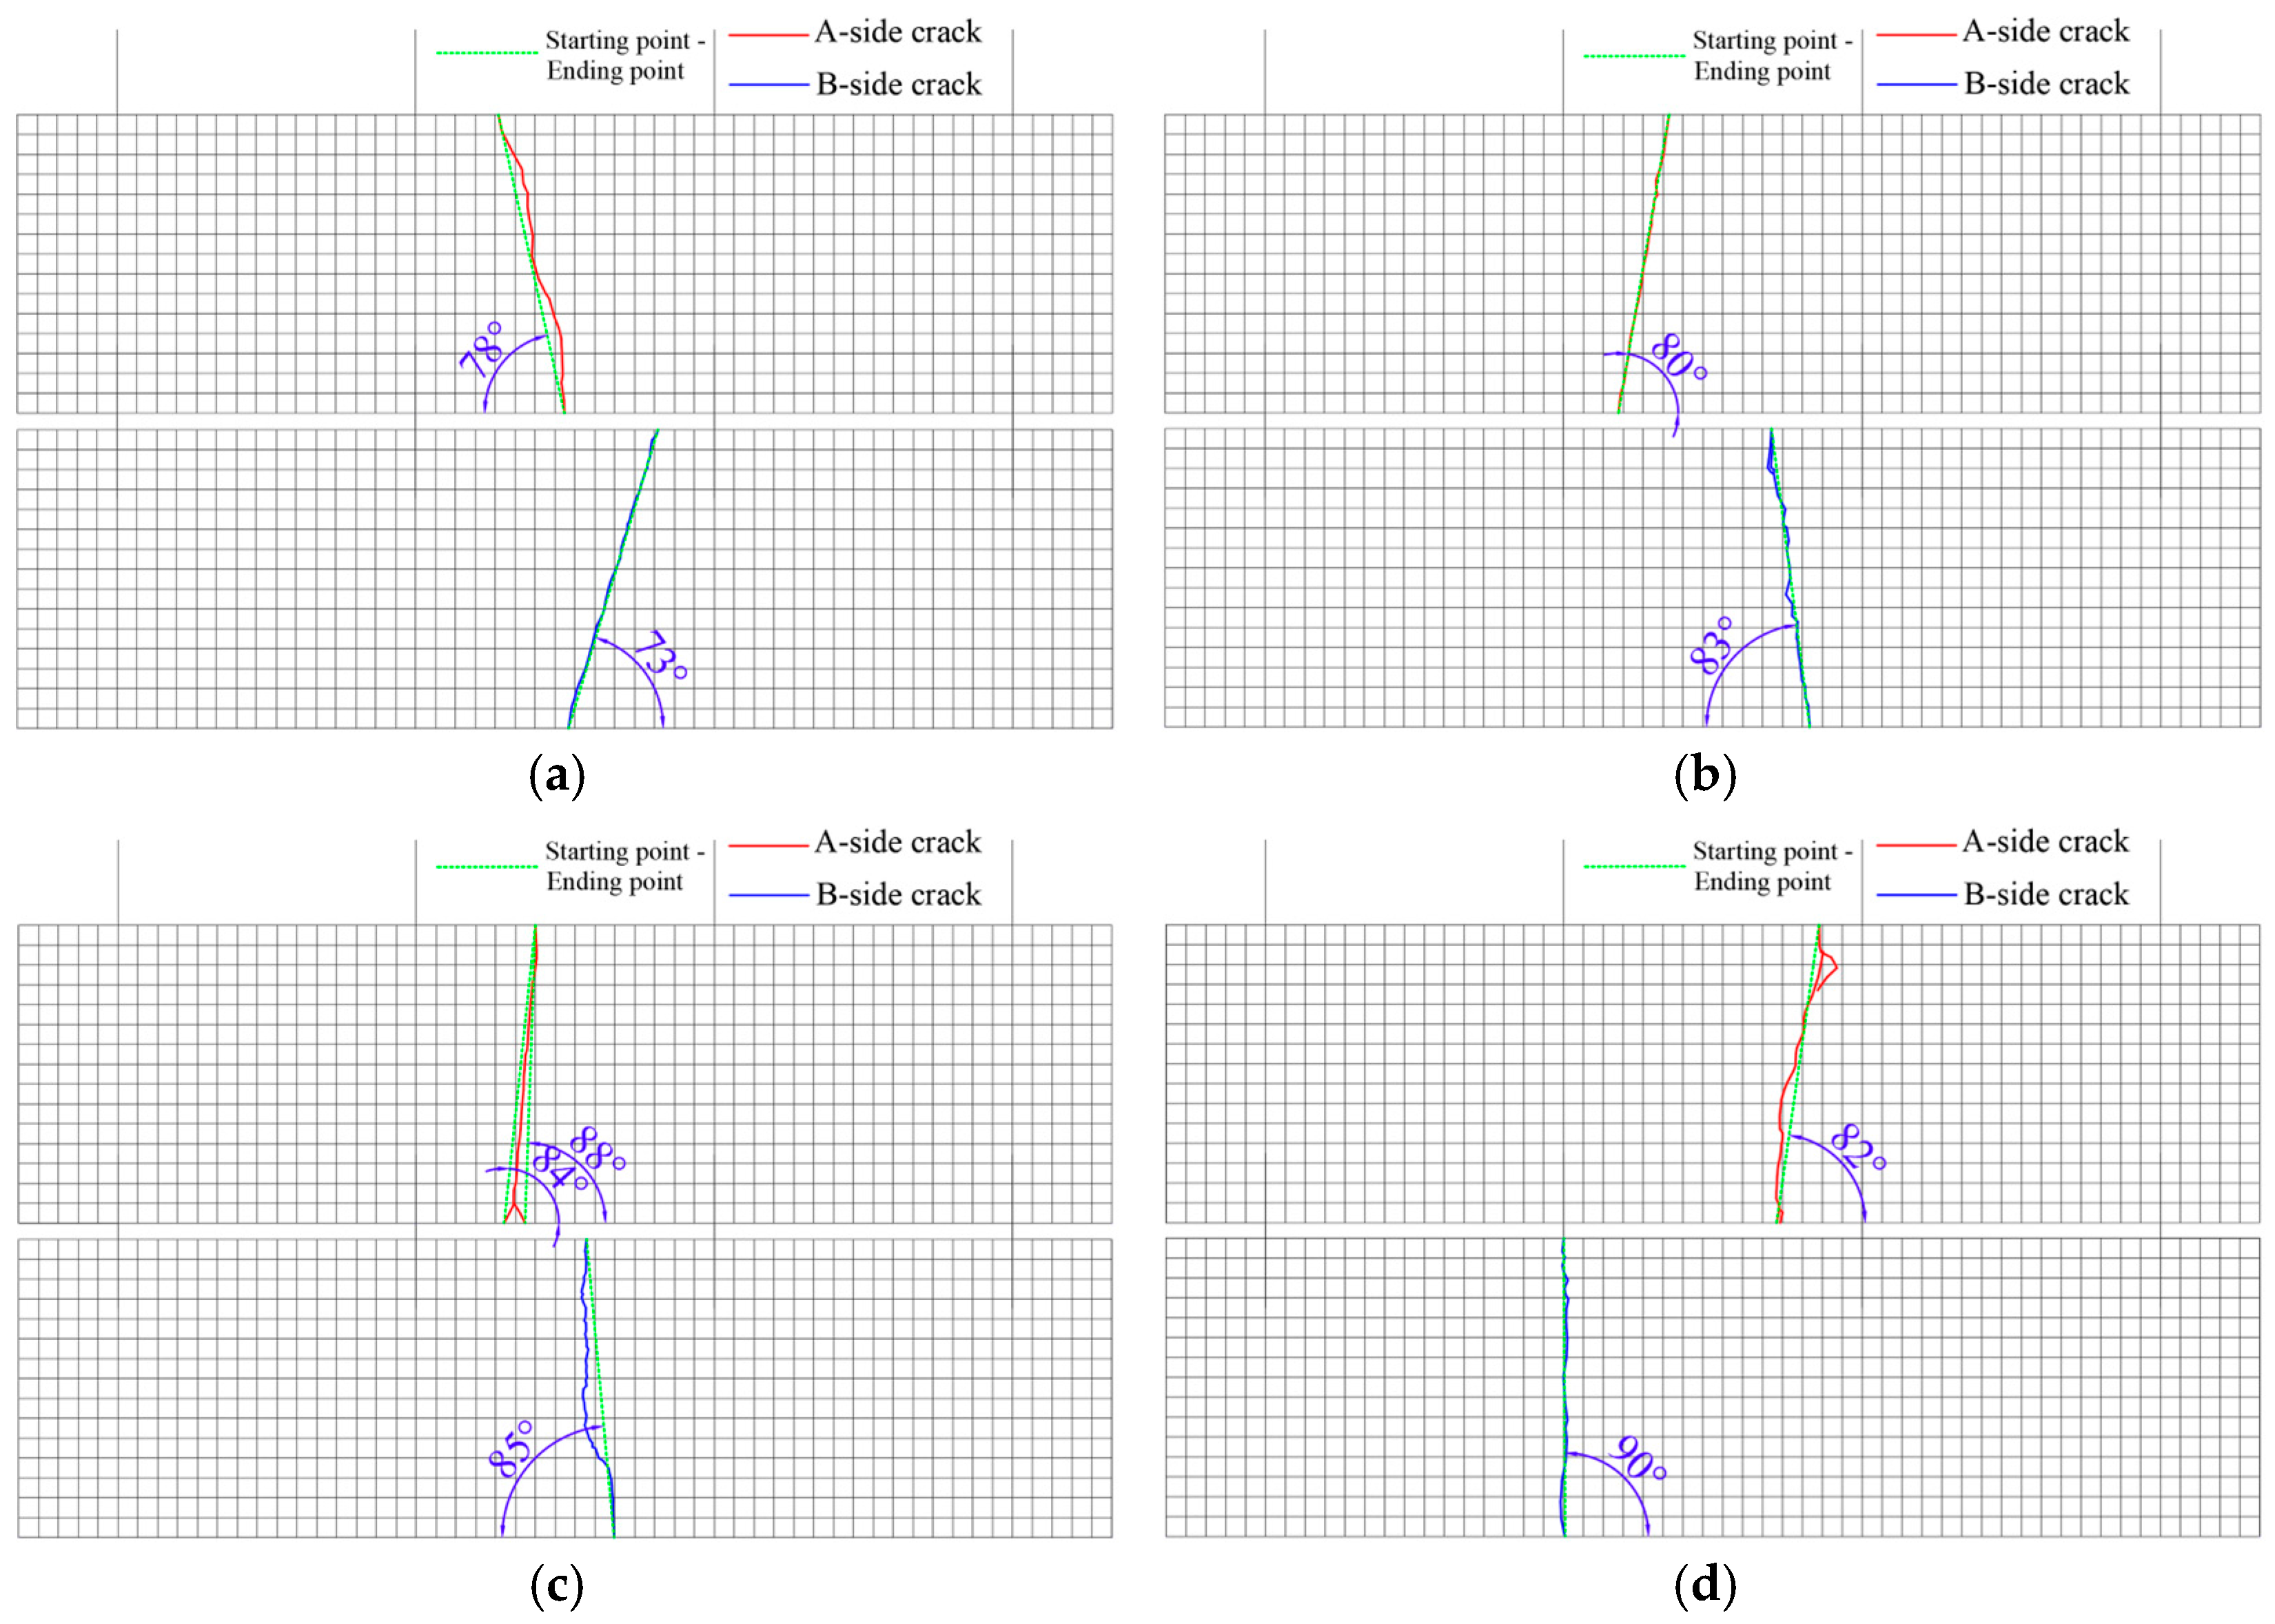
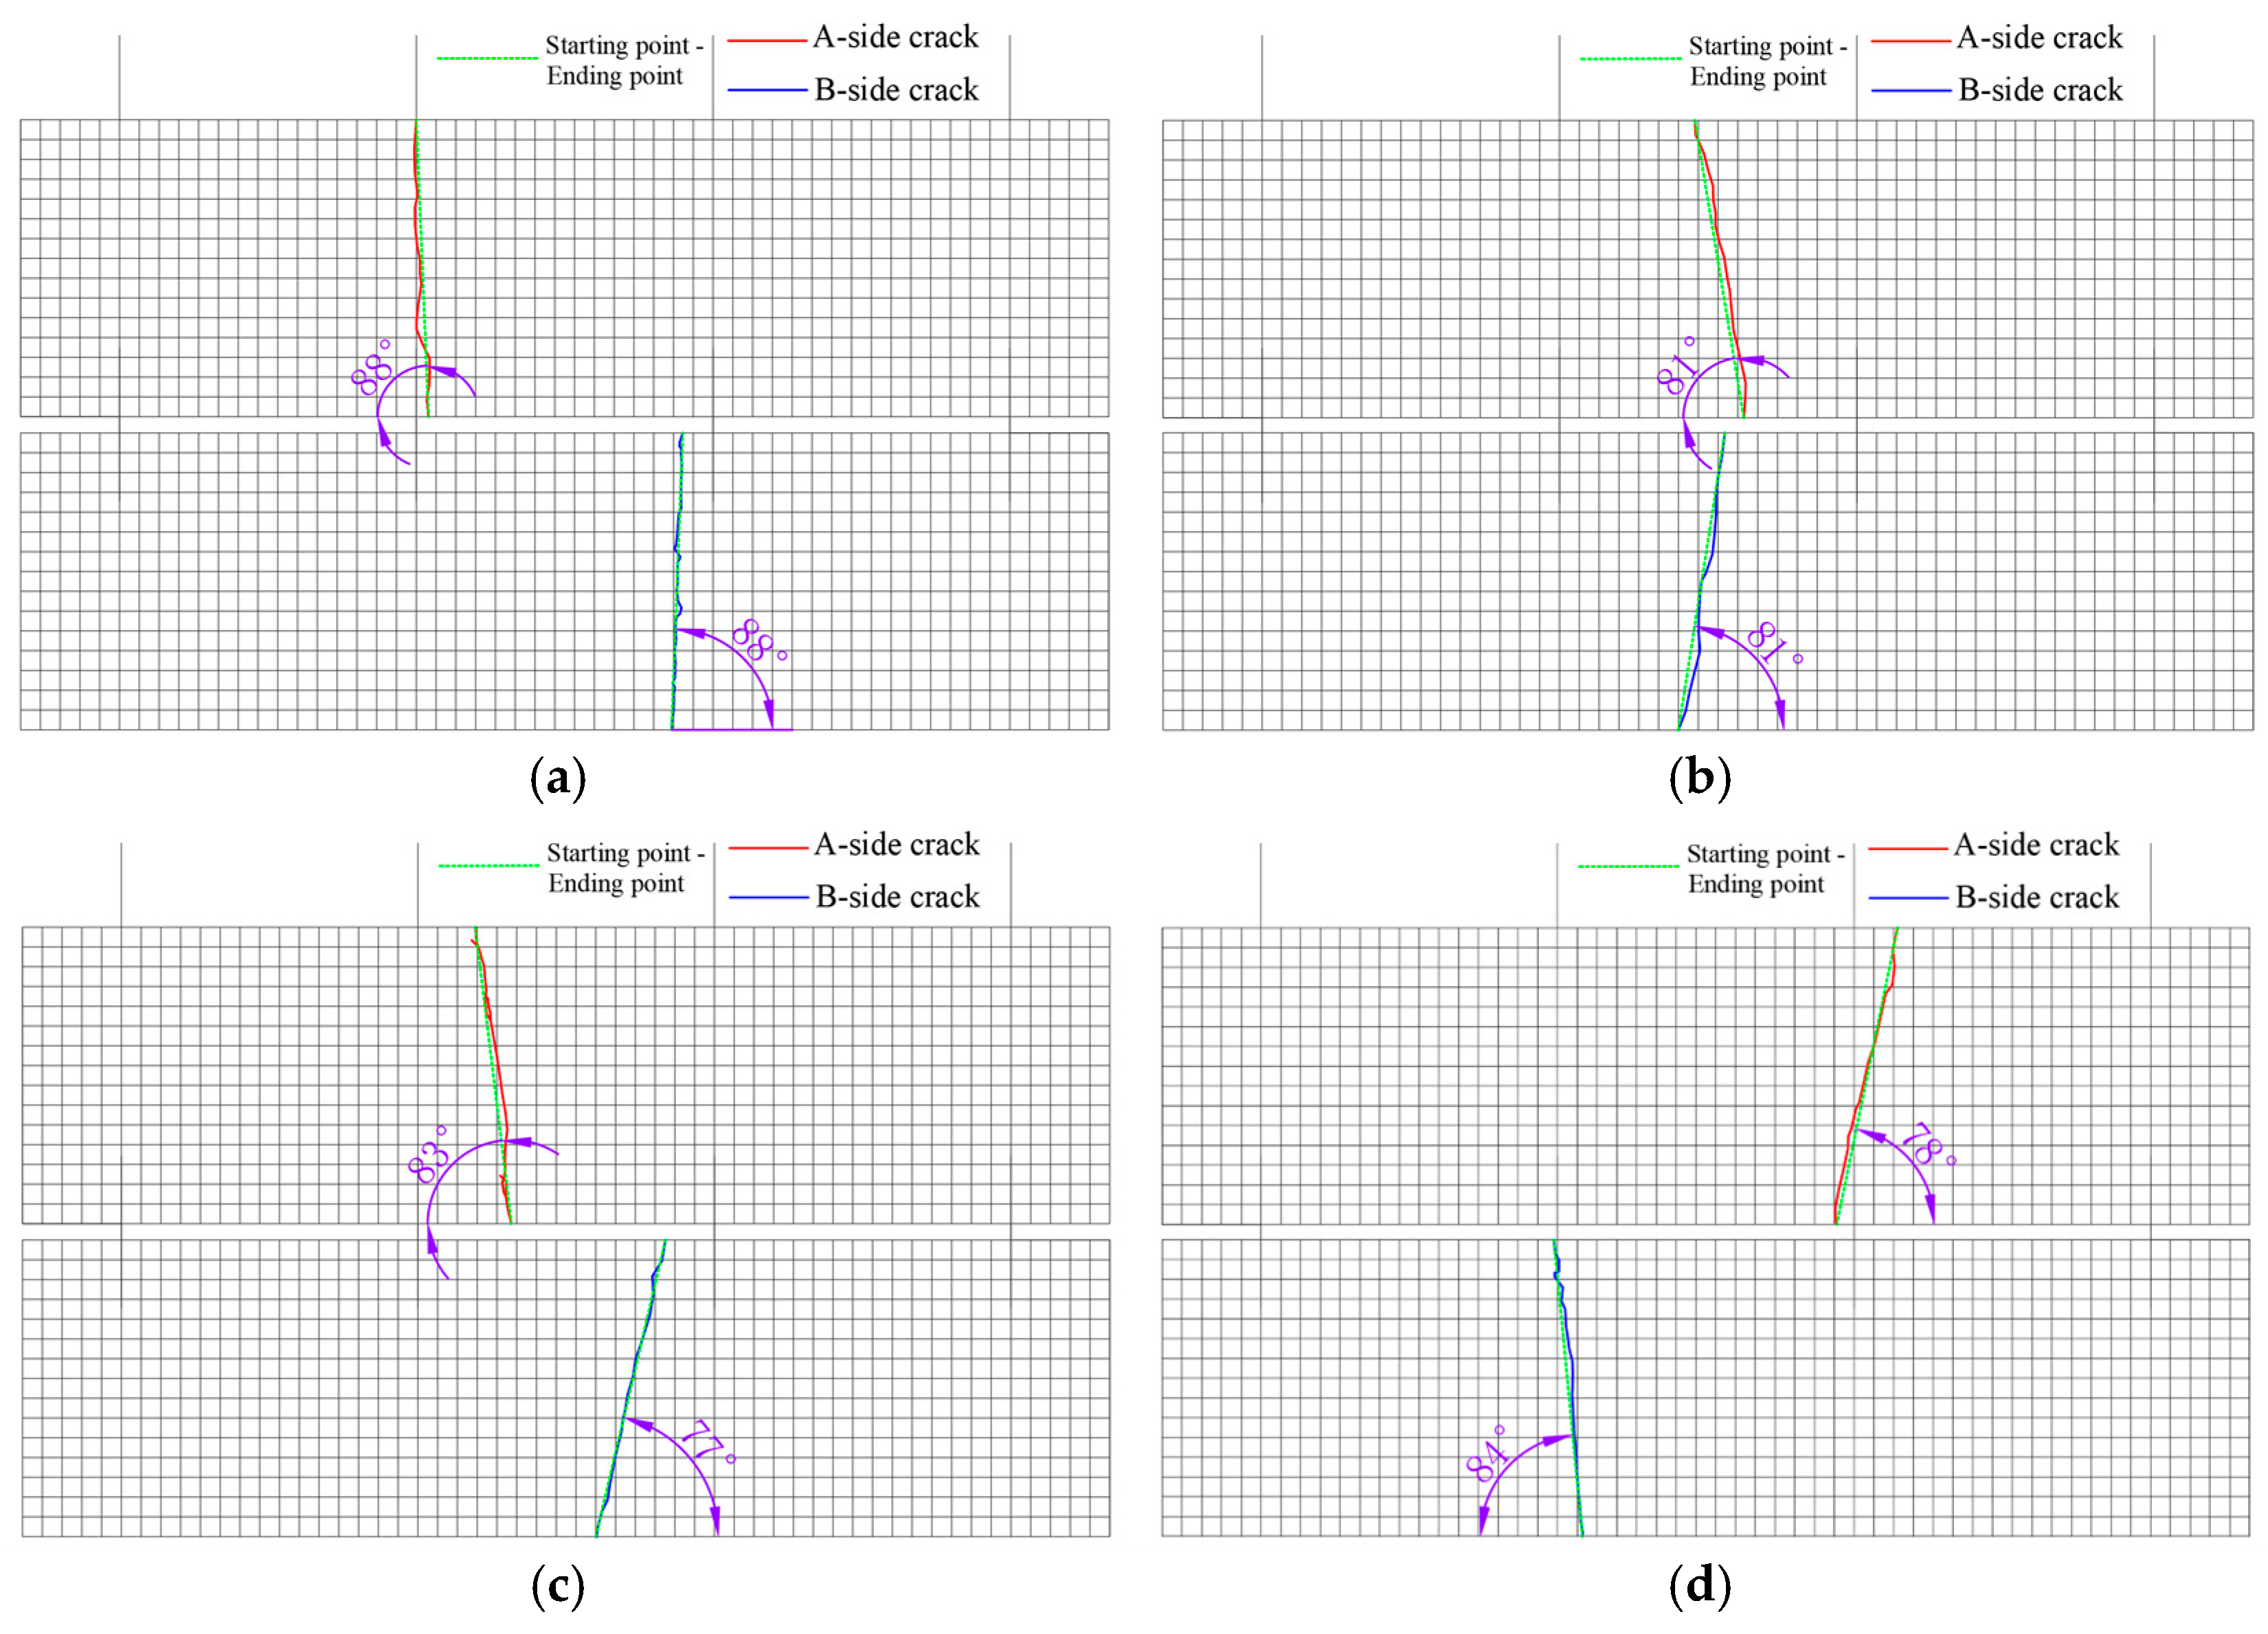
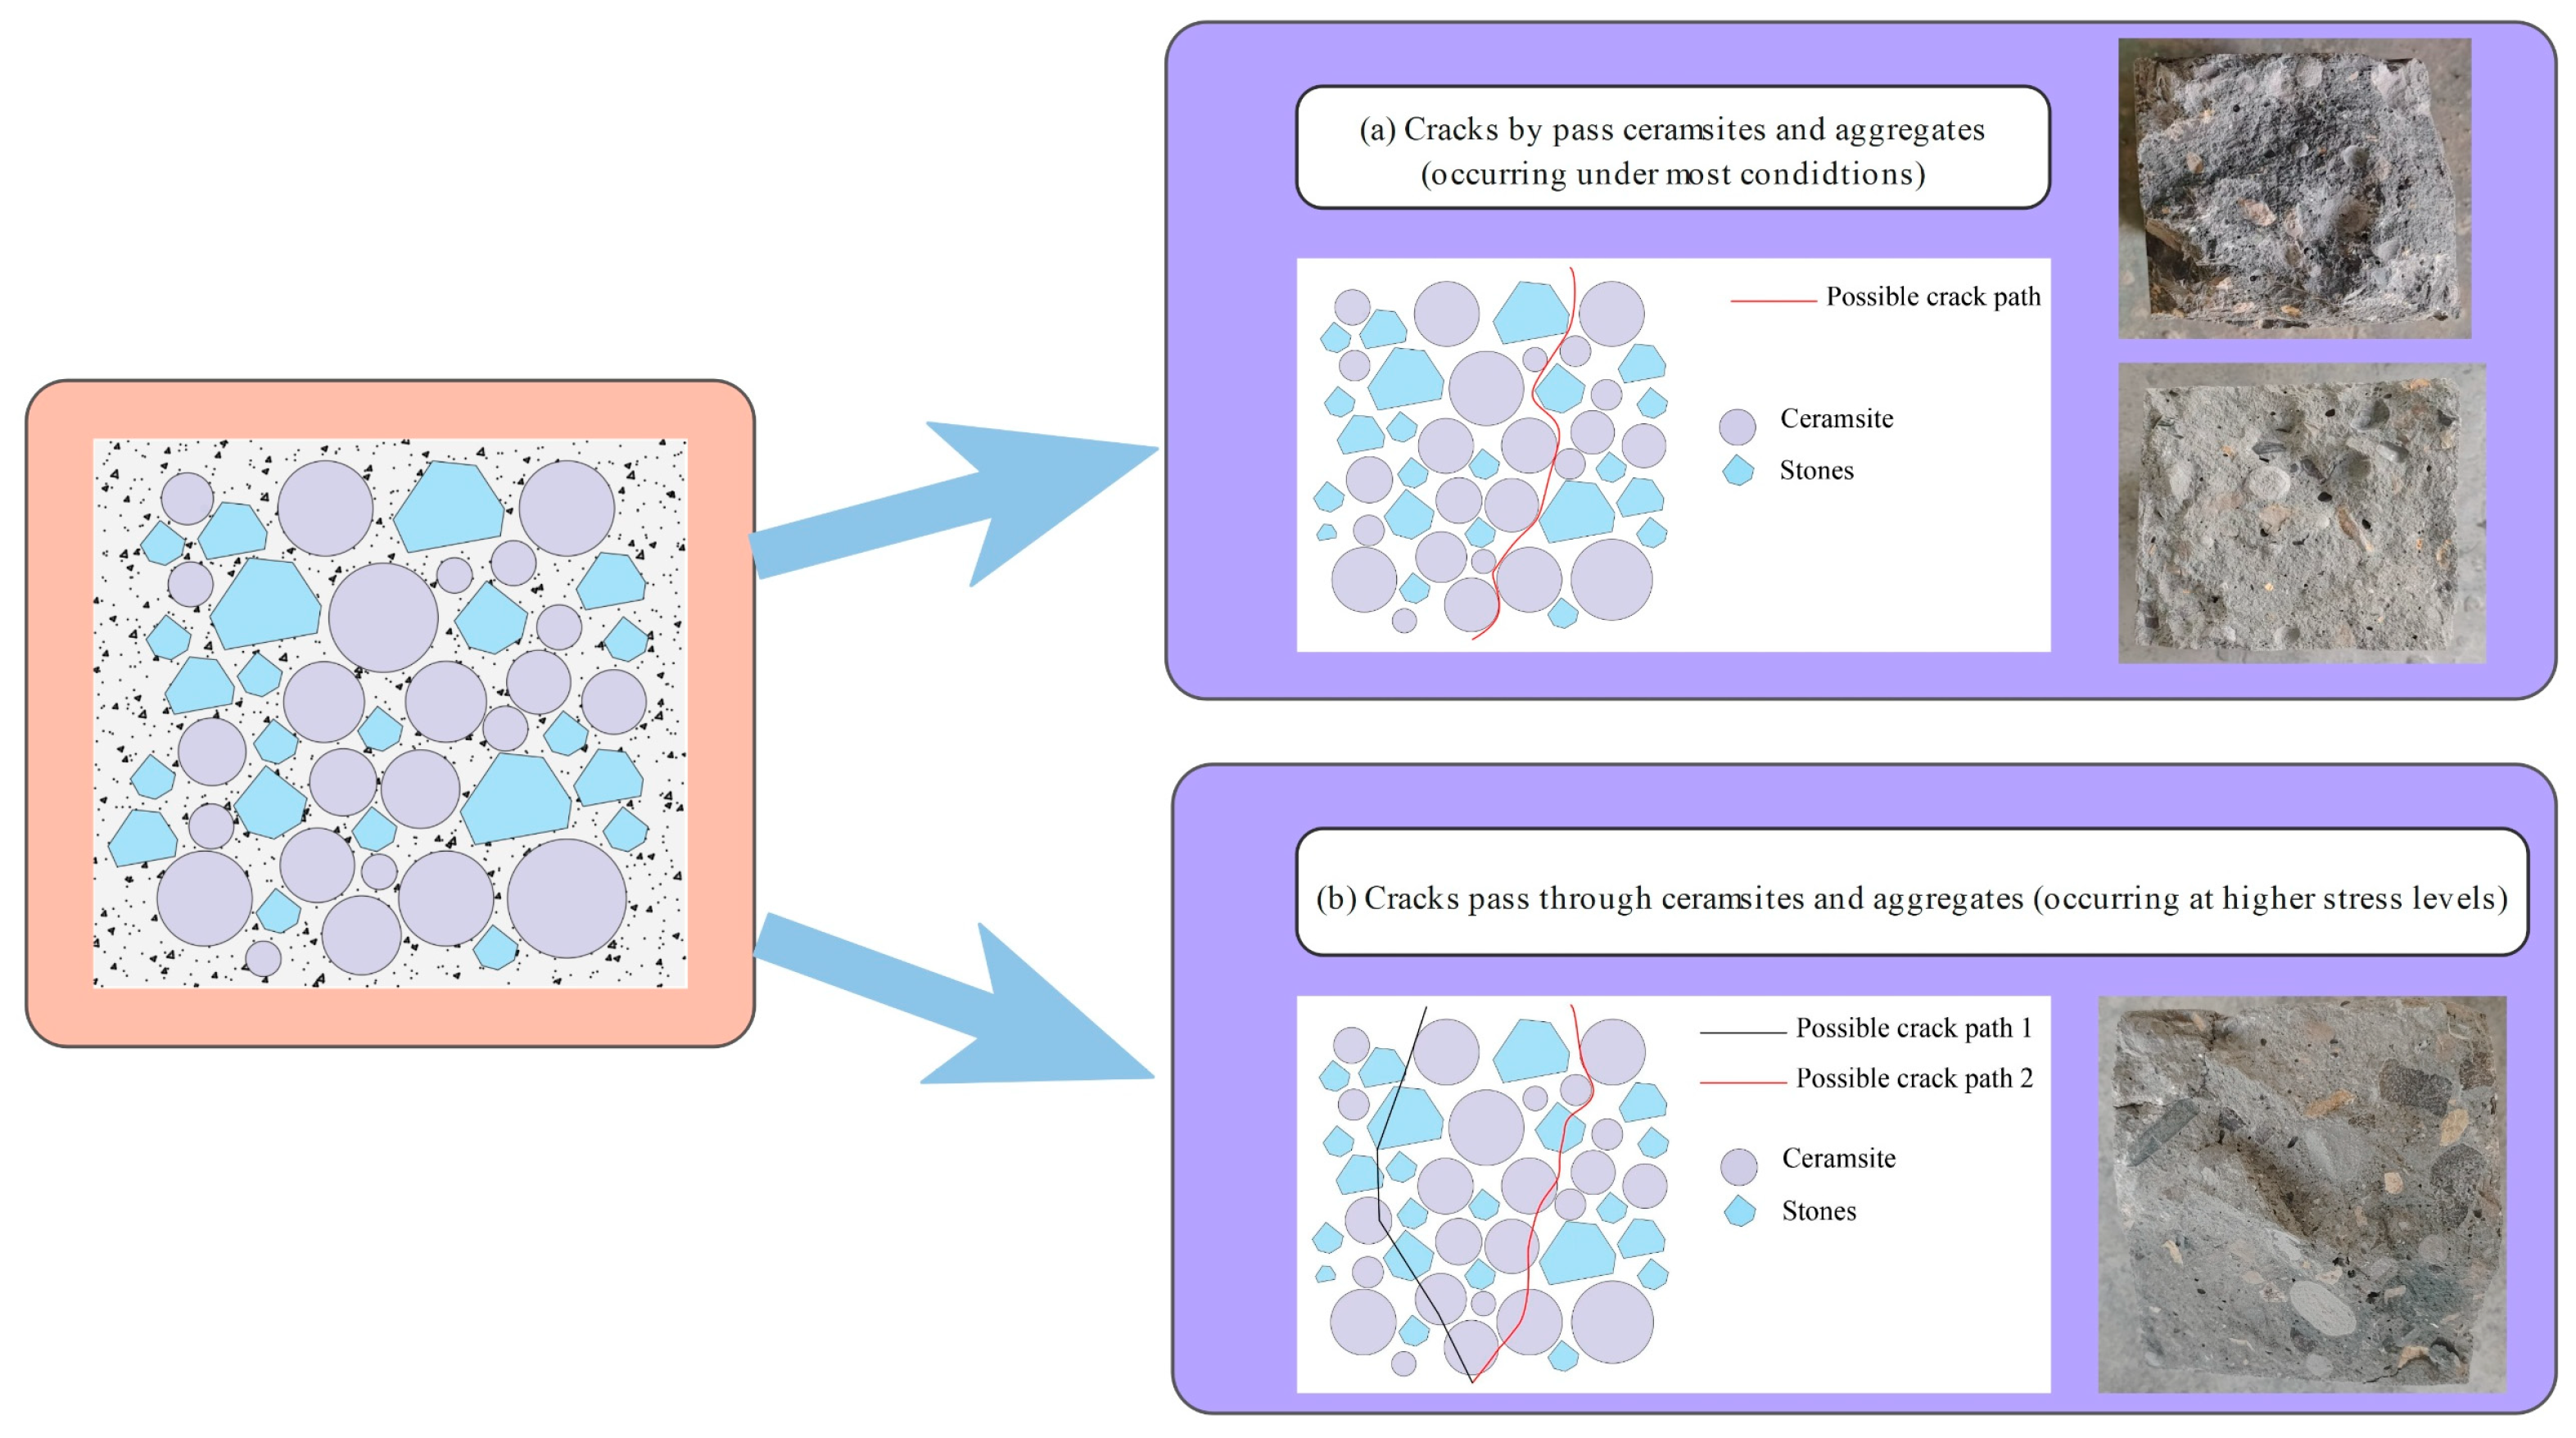
Figure 23.
The CRR1 crack simulation path.
Figure 23.
The CRR1 crack simulation path.
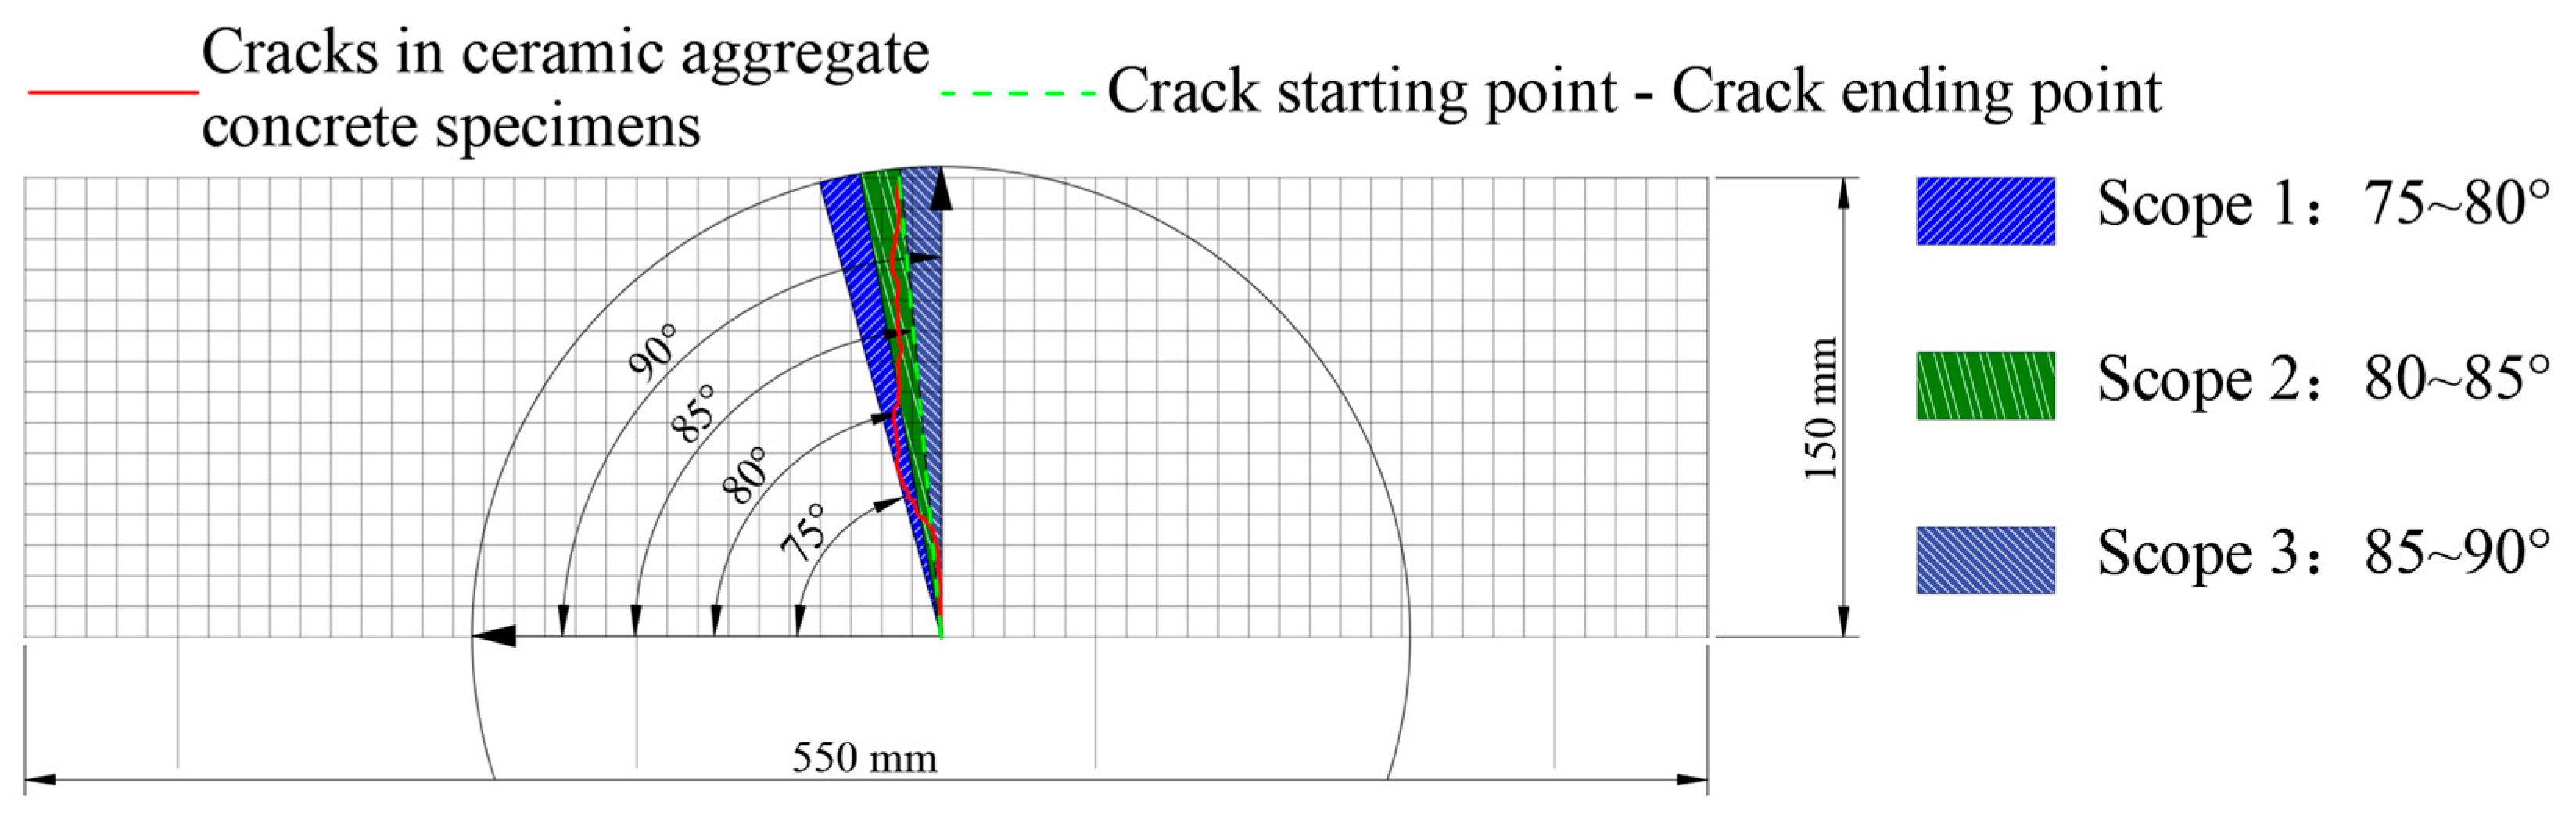
Figure 24.
Schematic diagram of angle range division of fatigue cracks.
Figure 24.
Schematic diagram of angle range division of fatigue cracks.
Figure 25.
Statistics of fatigue crack angles under different stress levels. (a) The stress level was 0.55, (b) the stress level was 0.65, (c) the stress level was 0.75.
Figure 25.
Statistics of fatigue crack angles under different stress levels. (a) The stress level was 0.55, (b) the stress level was 0.65, (c) the stress level was 0.75.
Table 1.
Physical properties of cement.
Table 1.
Physical properties of cement.
Fineness
(%) | Standard Viscosity (%) | Stability | Setting Time
(min) | Flexural Strength
(MPa) | Compressive Strength
(MPa) |
|---|
| Cake Testing Method | Initial | Final | 3-Day | 3-Day |
|---|
| 5.9 | 28.3 | Qualified | 215 | 275 | 5.7 | 26.8 |
Table 2.
Technical properties of aggregates.
Table 2.
Technical properties of aggregates.
| Crushing Value (%) | Wear Loss (%) | Robustness (%) | Needle Like Particle Content (%) | Water Absorption Rate (%) |
|---|
| 14.4 | 16.2 | 6.2 | 6.1 | 0.81 |
Table 3.
Technical properties of ceramsites.
Table 3.
Technical properties of ceramsites.
| Apparent Density (kg/m3) | Cylinder Compression Strength (MPa) | Water Absorption Rate (%) | Mud Content (%) | Cl− (%) |
|---|
| 1950 | 16.4 | 9.8 | 1.0 | 0.01 |
Table 4.
Technical properties of silica fume.
Table 4.
Technical properties of silica fume.
| Density (kg/m3) | Activity Index (%) | Specific Surface Area (m2/g) | Water Demand Ratio (%) | Alkali Content (%) | SiO2 Content
(%) | SO3 Content
(%) | Cl− (%) |
|---|
| 2200 | 108 | 20,000 | 123 | 0.23 | 92 | 0.33 | 0.005 |
Table 5.
Physical properties of fly ash.
Table 5.
Physical properties of fly ash.
| Density (g/m3) | Bulk Density (g/m3) | Specific Surface Area (m2/g) | Water absorption Capacity (%) | Water Demand | Water Content |
|---|
| 2.1 | 0.79 | 3500 | 106 | ≤100% | ≤0.9% |
Table 6.
Technical properties of river sand.
Table 6.
Technical properties of river sand.
| Particle Size (mm) | Fineness Modulus | Bulk Density (kg/m3) | Apparent Density (kg/m3) |
|---|
| <5 | 2.7 | 1392 | 2588 |
Table 7.
Technical properties of water-reducing agent.
Table 7.
Technical properties of water-reducing agent.
| Technical Indicators | Detection Result |
|---|
| Water-reducing rate (%) | 35 |
| Bleeding rate (%) | 29 |
| Gas content (%) | 4.0 |
| Difference in condensation time (min) | Initial setting | +20 |
| Final setting | −30 |
| Compressive strength ratio (%) | 1 d | 220 |
| 3 d | 183 |
| 7 d | 180 |
| 28 d | 165 |
Table 8.
Different aggregate contents.
Table 8.
Different aggregate contents.
| No. | CRR1 | CRR2 | CRR3 |
|---|
| N-1 | 20% | 10% | 10% |
| N-2 | 30% | 10% | 10% |
| N-3 | 40% | 10% | 10% |
| N-4 | 50% | 10% | 10% |
| N-5 | 30% | 0% | 10% |
| N-6 | 30% | 20% | 10% |
| N-7 | 30% | 30% | 10% |
| N-8 | 30% | 40% | 10% |
| N-9 | 30% | 10% | 0% |
| N-10 | 30% | 10% | 20% |
| N-11 | 30% | 10% | 30% |
| N-12 | 30% | 10% | 40% |
Table 9.
Parameters of the fatigue tests.
Table 9.
Parameters of the fatigue tests.
| Loading Frequency (Hz) | Stress Level (MPa) | Stress Ratio | Stress Loading Speed (mm/s) |
|---|
| 10 | 0.55, 0.65, 0.75, 0.85 | 0.1 | 0.005 |
Table 10.
Analysis of variance (ANOVA) of the fatigue life of CRR1.
Table 10.
Analysis of variance (ANOVA) of the fatigue life of CRR1.
| Stress Level (MPa) | SS | df | MS | F | p-Value |
|---|
| 0.55 | SSB | 3.9 × 10¹⁰ | 3 | 1.3 × 10¹⁰ | 4.63 | 0.016 |
| SSW | 4.5 × 10¹⁰ | 16 | 2.8 × 10⁹ |
| 0.65 | SSB | 1.4 × 10¹⁰ | 3 | 4.8 × 10⁹ | 15.48 | <0.001 |
| SSW | 5.0 × 10⁹ | 16 | 3.1 × 10⁸ |
| 0.75 | SSB | 3.8 × 10⁹ | 3 | 1.3 × 10⁹ | 62.46 | <0.001 |
| SSW | 3.2 × 10⁸ | 16 | 2.0 × 10⁷ |
| 0.85 | SSB | 1.6 × 10⁶ | 3 | 5.2 × 10⁵ | 5.35 | 0.010 |
| SSW | 1.6 × 10⁶ | 16 | 9.8 × 10⁴ |
Table 11.
Analysis of variance (ANOVA) of the fatigue life of CRR2.
Table 11.
Analysis of variance (ANOVA) of the fatigue life of CRR2.
| Stress Level (MPa) | SS | df | MS | F | p-Value |
|---|
| 0.55 | SSB | 3.8 × 10¹¹ | 4 | 9.4 × 10¹⁰ | 14.11 | <0.001 |
| SSW | 1.3 × 10¹¹ | 20 | 6.7 × 10⁹ |
| 0.65 | SSB | 2.1 × 10¹¹ | 4 | 5.2 × 10¹⁰ | 52.07 | <0.001 |
| SSW | 2.0 × 10¹⁰ | 20 | 1.0 × 10⁹ |
| 0.75 | SSB | 3.8 × 10¹⁰ | 4 | 9.6 × 10⁹ | 43.62 | <0.001 |
| SSW | 4.4 × 10⁹ | 20 | 2.2 × 10⁸ |
| 0.85 | SSB | 1.1 × 10⁸ | 4 | 2.8 × 10⁷ | 14.25 | <0.001 |
| SSW | 4.0 × 10⁷ | 20 | 2.0 × 10⁶ |
Table 12.
Analysis of variance (ANOVA) of the fatigue life of CRR3.
Table 12.
Analysis of variance (ANOVA) of the fatigue life of CRR3.
| Stress Level (MPa) | SS | df | MS | F | p-Value |
|---|
| 0.55 | SSB | 1.2 × 10¹¹ | 4 | 3.0 × 10¹⁰ | 12.69 | <0.001 |
| SSW | 4.7 × 10¹⁰ | 20 | 2.4 × 10⁹ |
| 0.65 | SSB | 1.8 × 10¹¹ | 4 | 4.4 × 10¹⁰ | 59.55 | <0.001 |
| SSW | 1.5 × 10¹⁰ | 20 | 7.4 × 10⁸ |
| 0.75 | SSB | 2.1 × 10⁹ | 4 | 5.4 × 10⁸ | 2.91 | 0.047 |
| SSW | 3.7 × 10⁹ | 20 | 1.8 × 10⁸ |
| 0.85 | SSB | 1.3 × 10⁶ | 4 | 3.1 × 10⁵ | 2.89 | 0.048 |
| SSW | 2.2 × 10⁶ | 20 | 1.1 × 10⁵ |
Table 13.
The absolute value of the Pearson coefficient between crack angle and fatigue life.
Table 13.
The absolute value of the Pearson coefficient between crack angle and fatigue life.
| Stress Level | 0.55 | 0.65 | 0.75 | 0.85 |
| Absolute Value of Pearson Coefficient | 0.86 | 0.92 | 0.66 | 0.34 |


