

Gas Sensor Properties of (CuO/WO3)-CuWO4 Heterostructured Nanocomposite Materials

 , , and
 Highlights
- CuO, WO3, and (CuO/WO3)-CuWO4 heterostructure were obtained through a modified coprecipitation route.
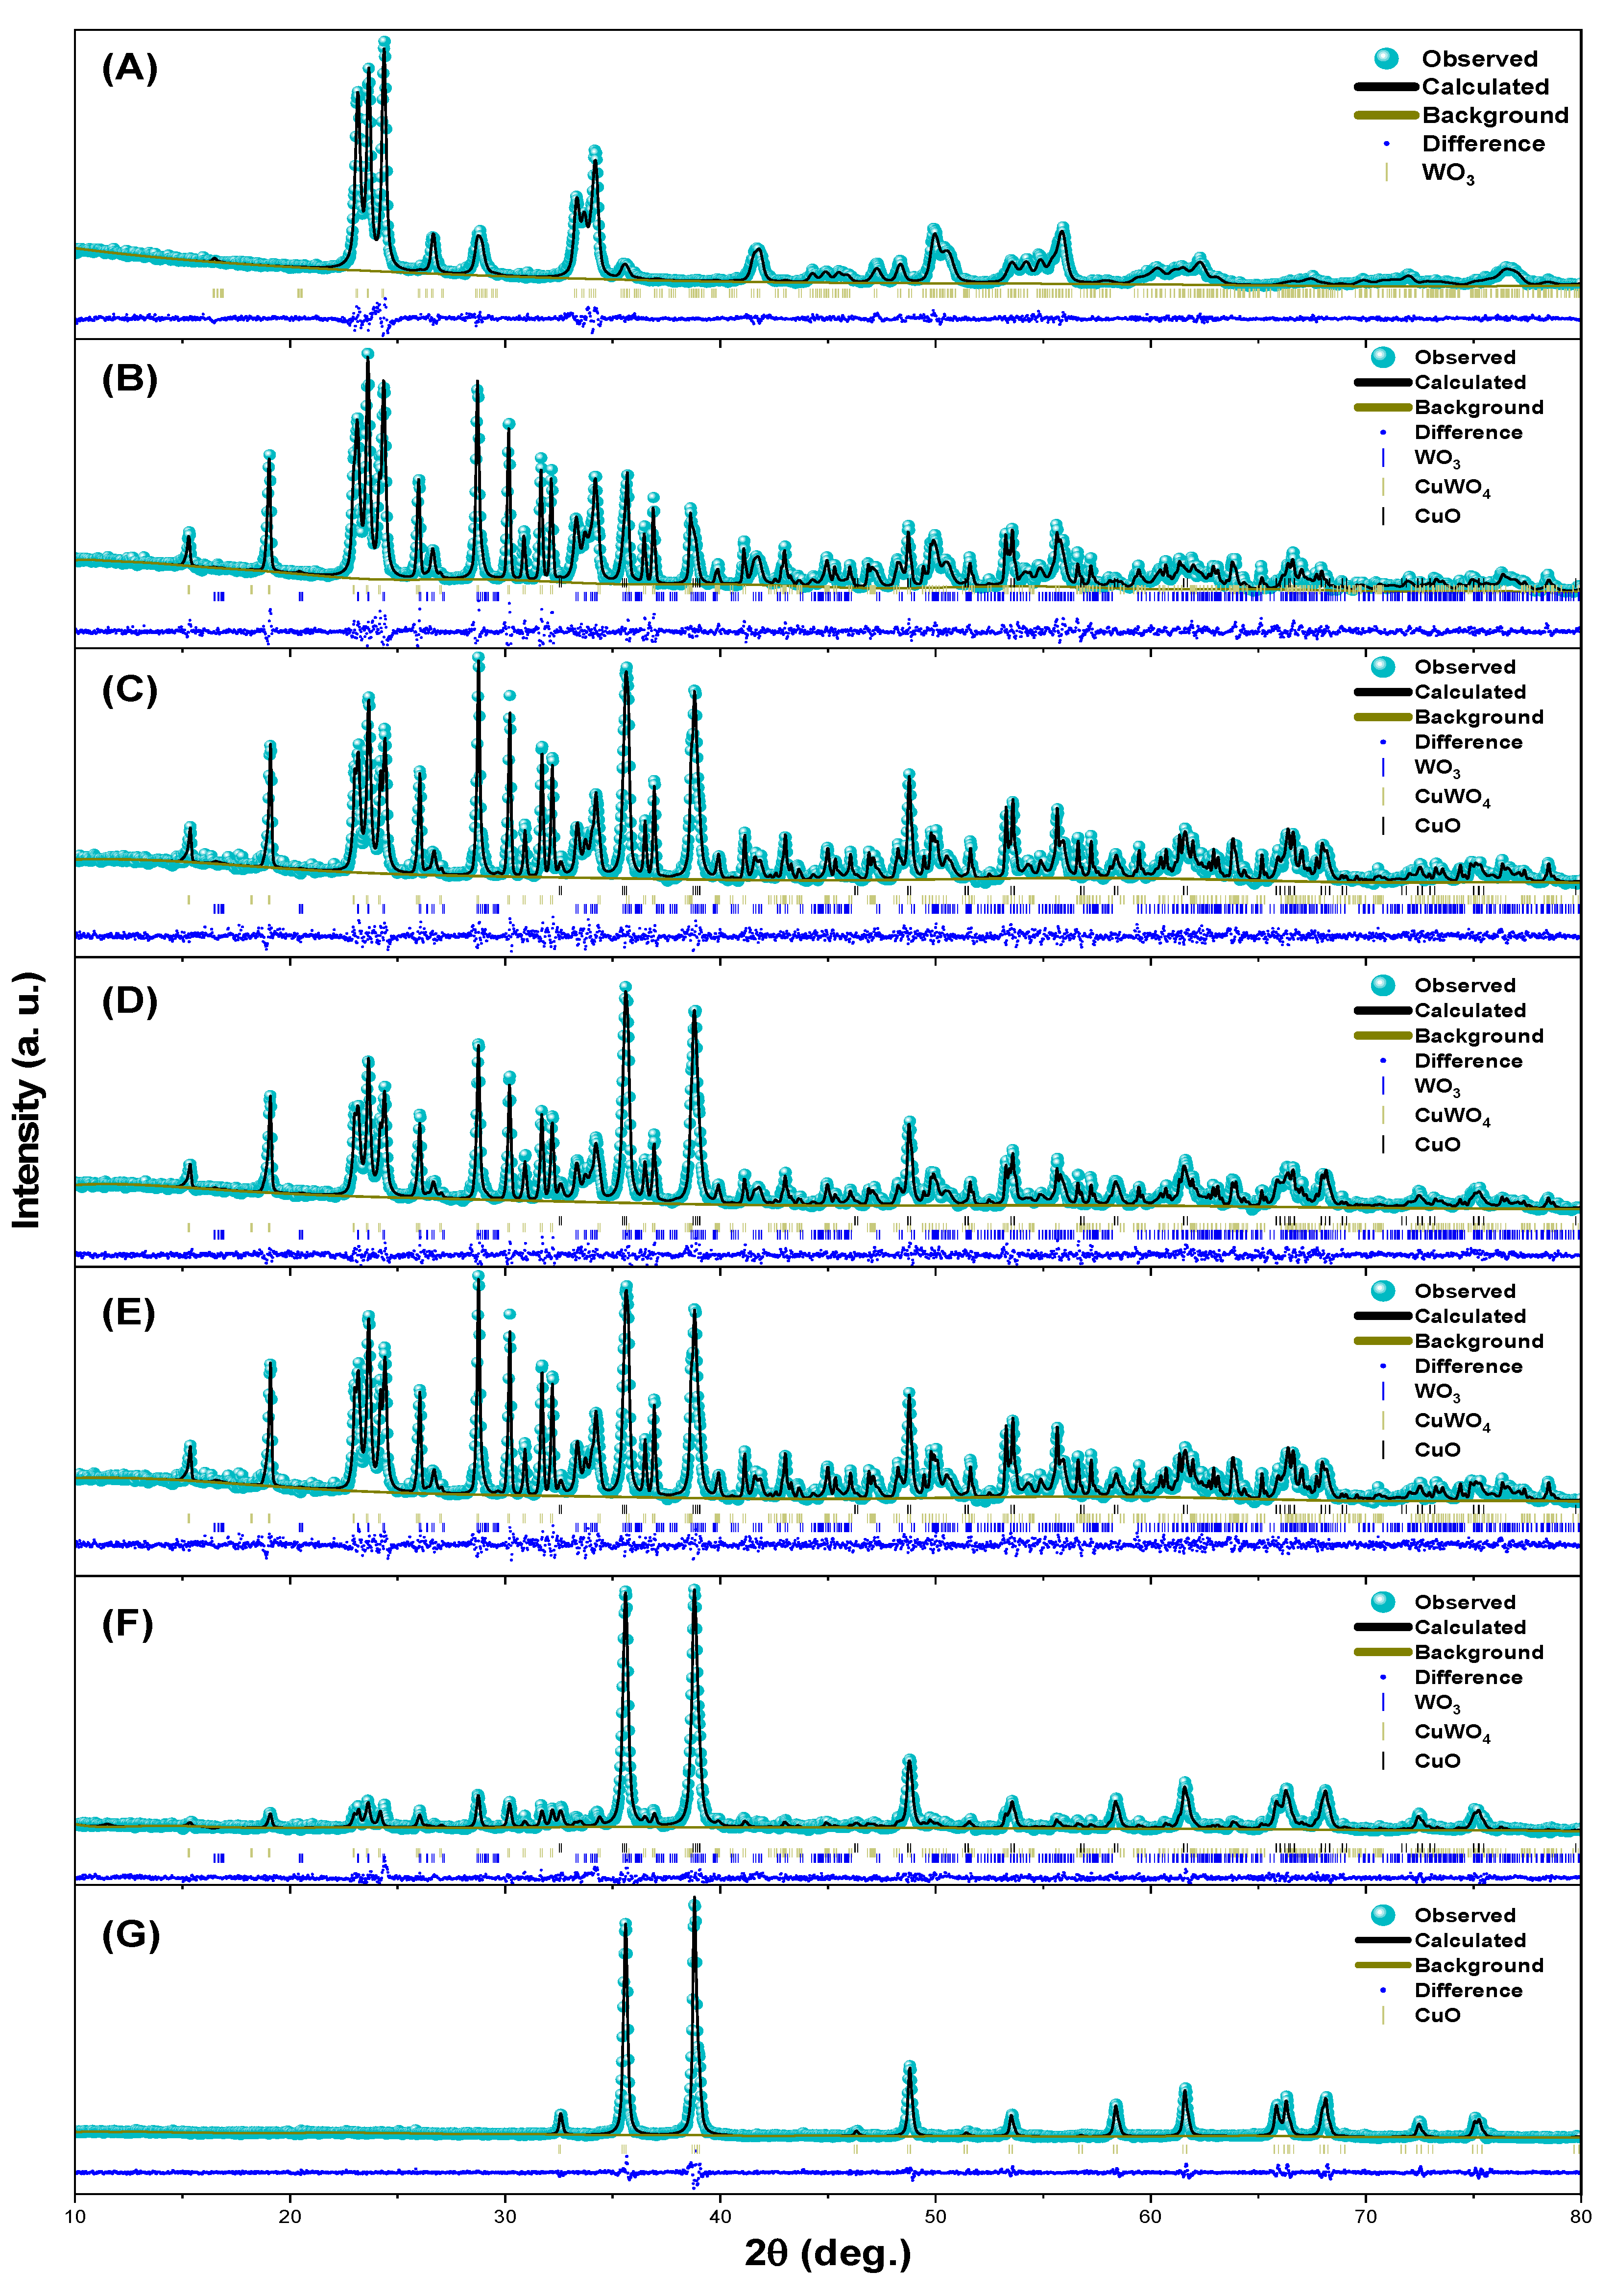
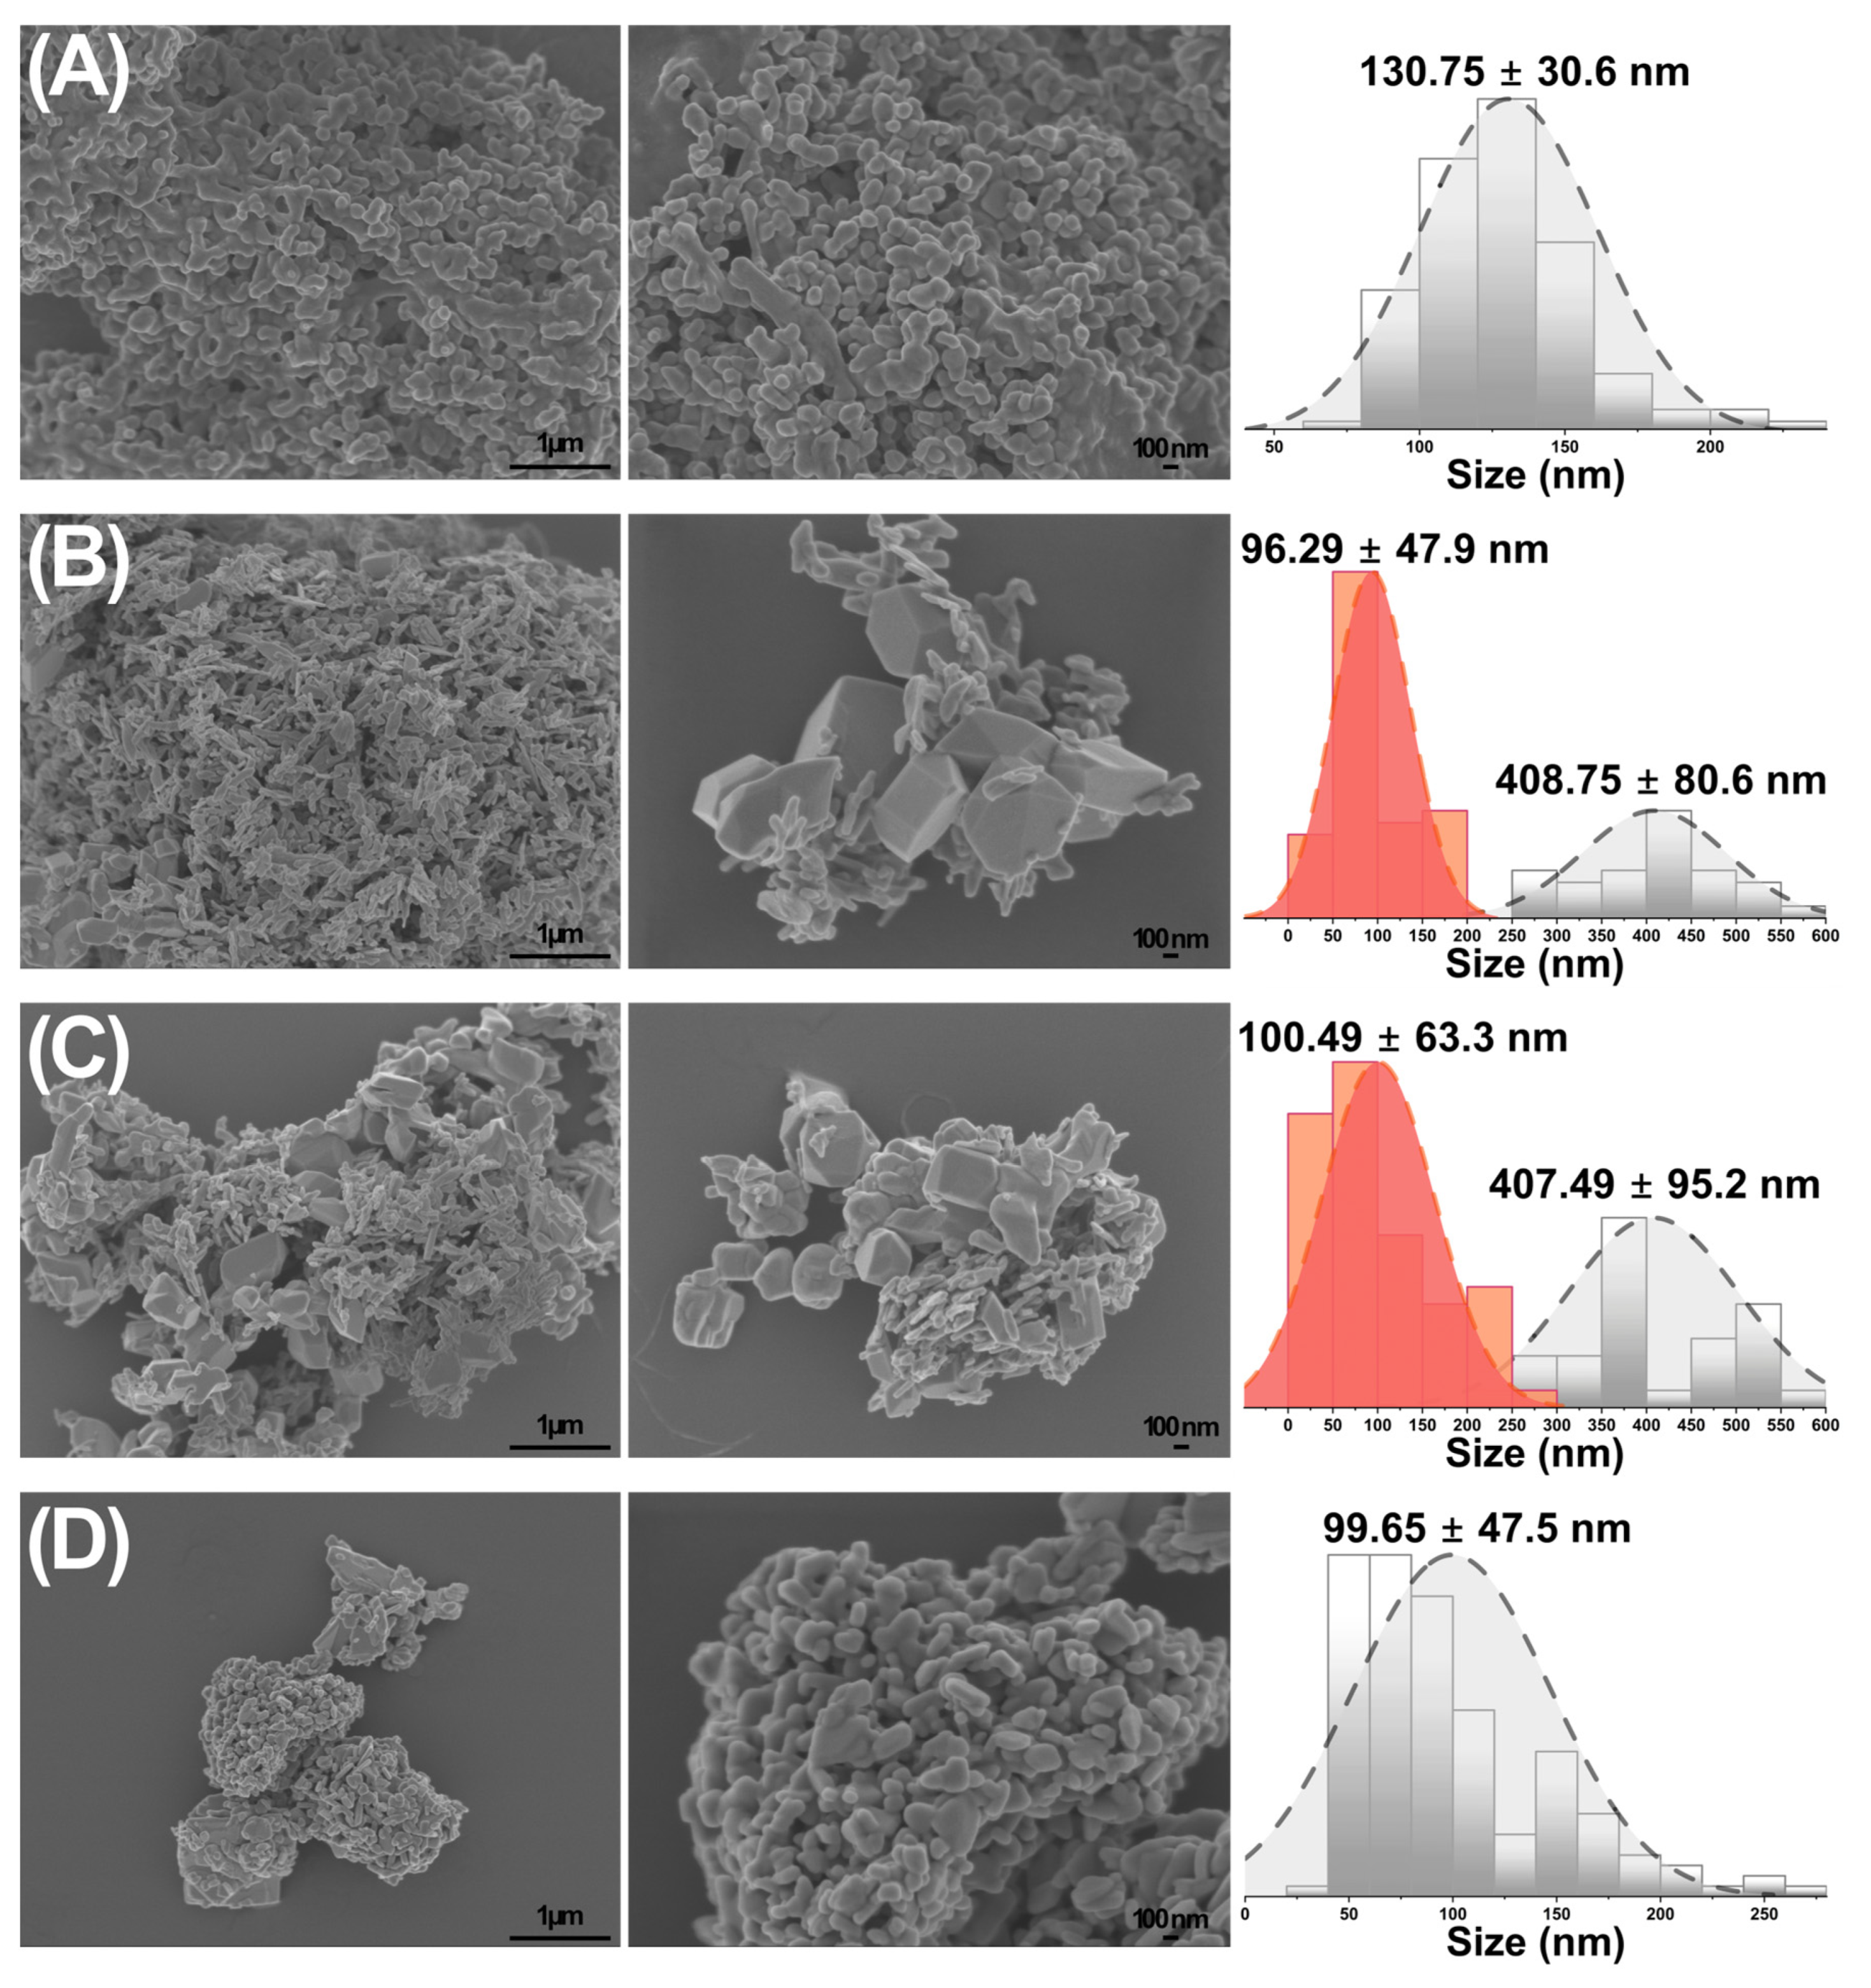
- The formation of the heterostructure was confirmed through XRD, FTIR and FE-SEM techniques.
- First time reported gas sensor response for methanol and acetone vapors of (CuO/WO3)-CuWO4 system.
Abstract
1. Introduction
2. Materials and Methods
2.1. Synthesis
2.2. Characterization
2.3. Methanol and Acetone Sensing Test
3. Results and Discussion
3.1. Structural Characterization
3.2. Morphological Characterization
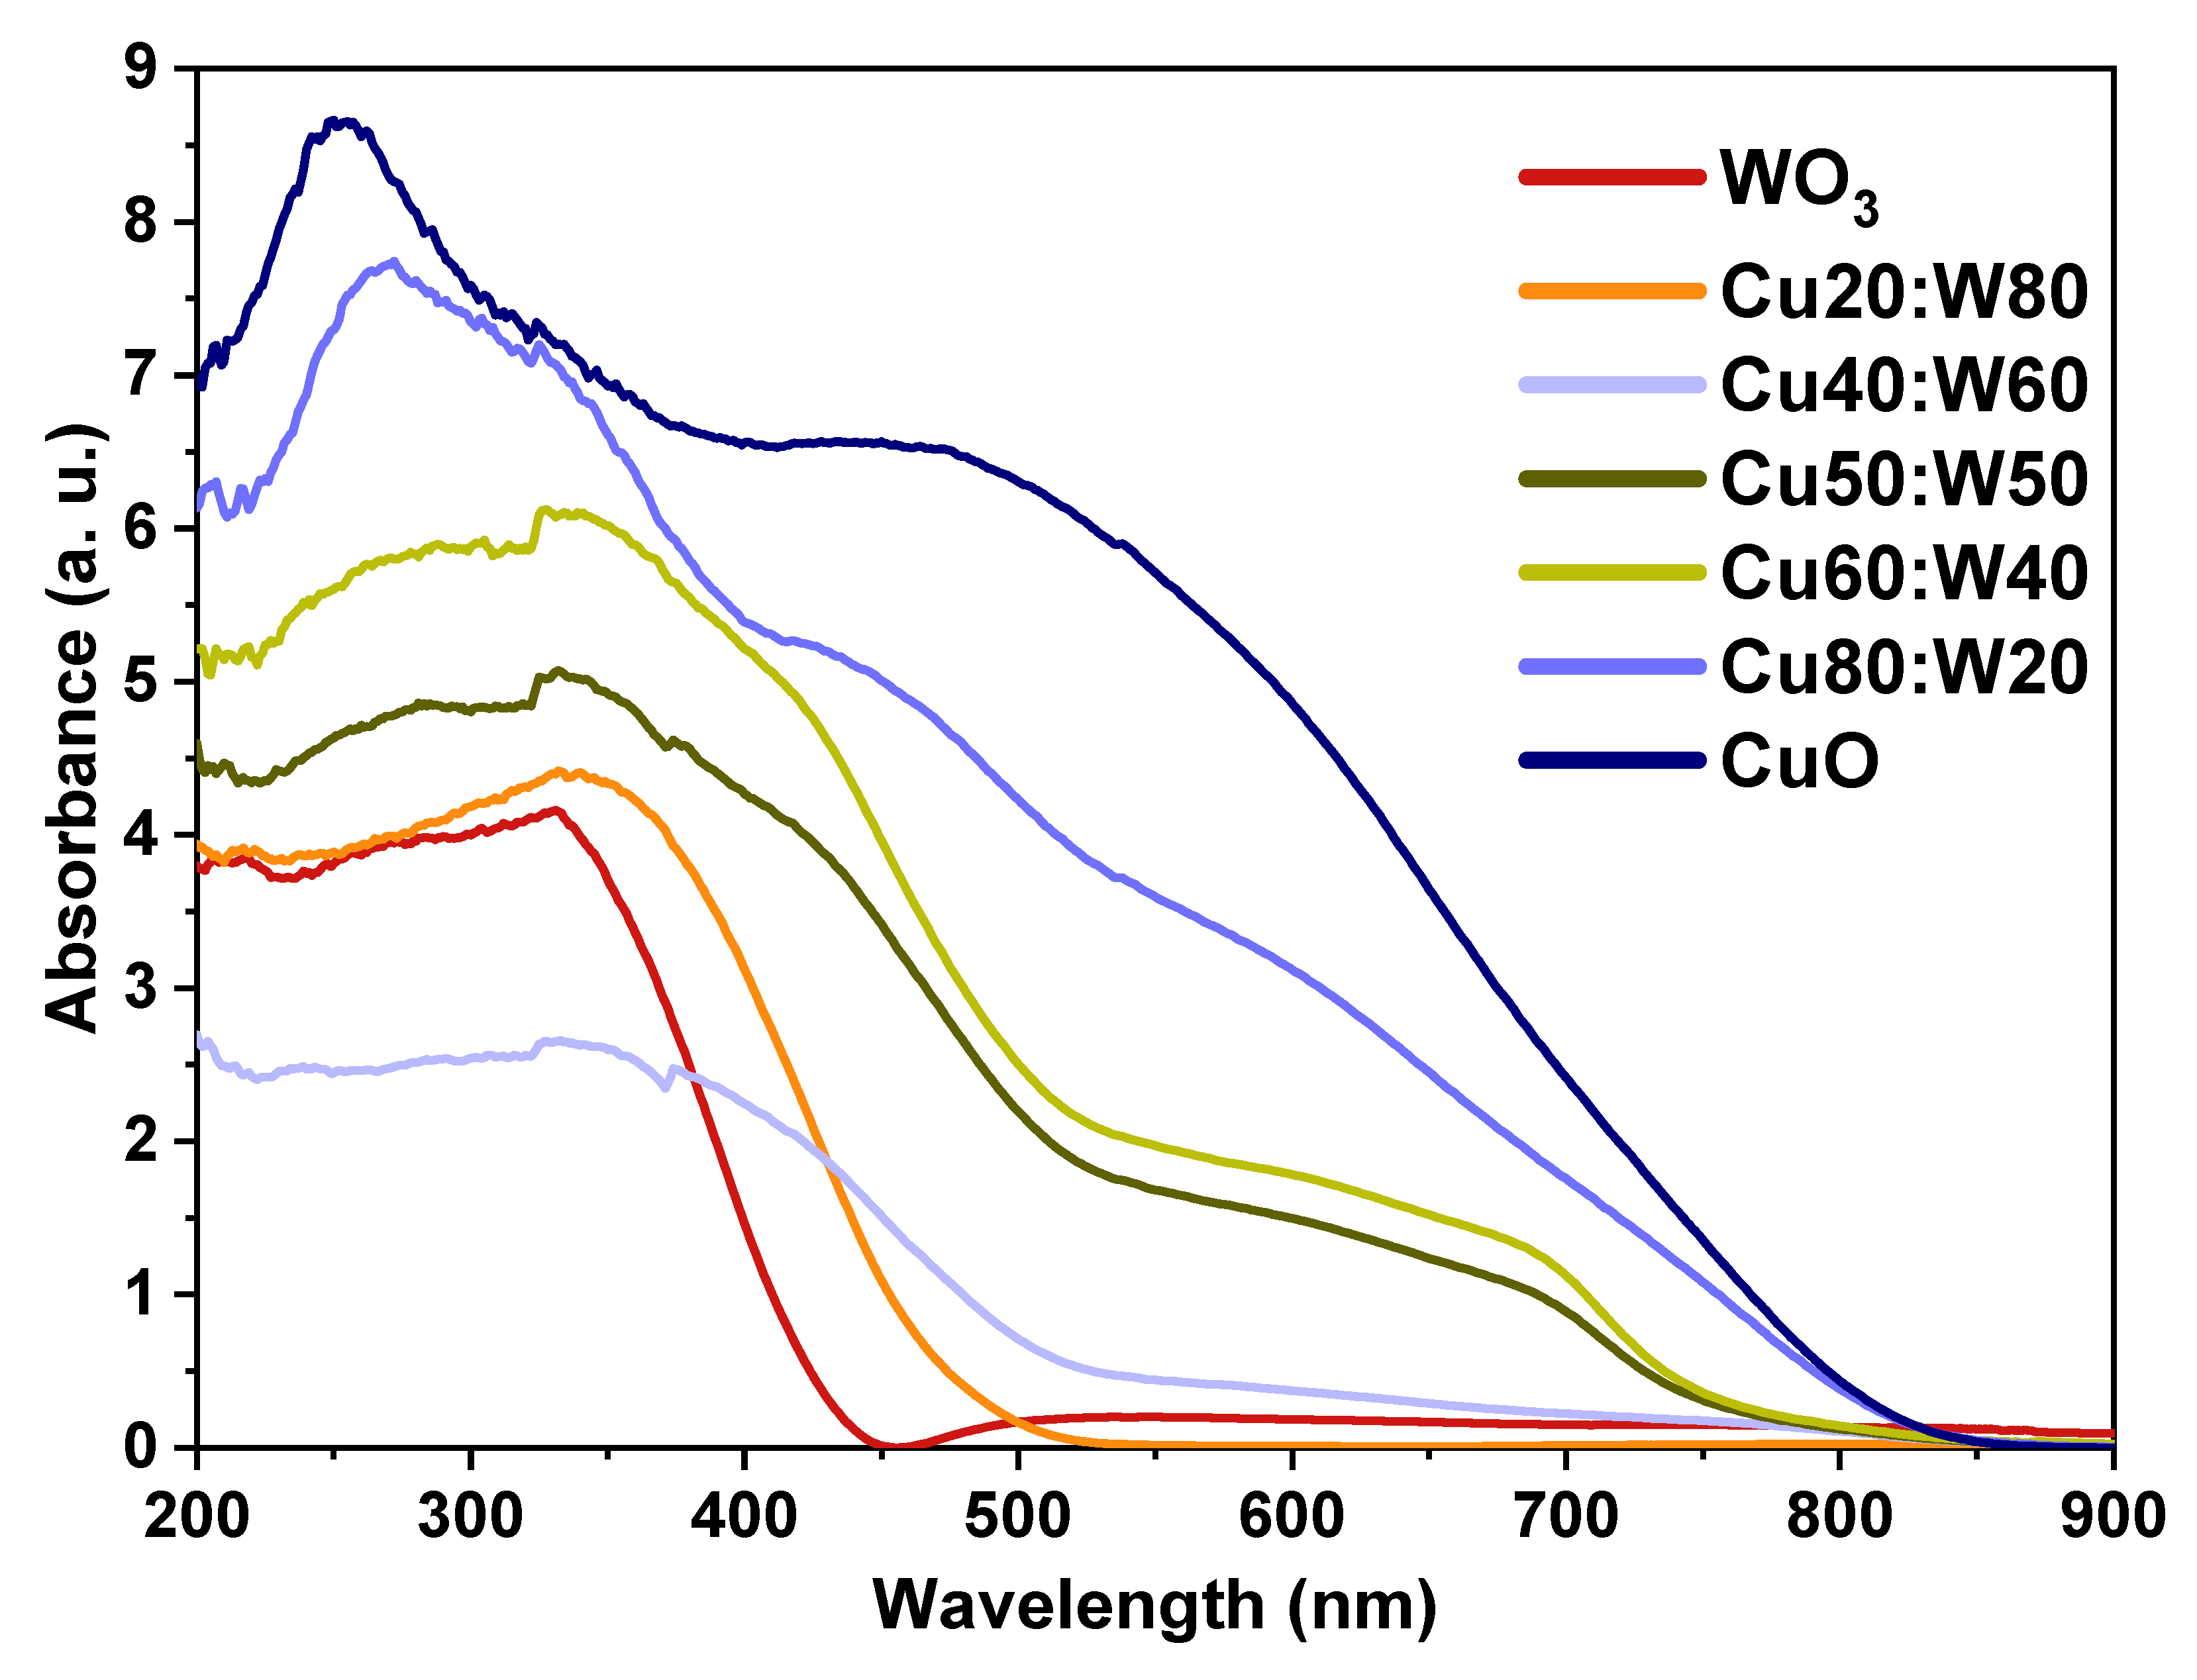
3.3. Optical Properties
3.4. Gas Sensing Test
4. Conclusions
Author Contributions
Funding
Institutional Review Board Statement
Informed Consent Statement
Data Availability Statement
Acknowledgments
Conflicts of Interest
References
- Hao, R.; Sun, J.; Liu, R.; Zhao, H.; Yao, Z.; Wang, H.; Hao, Z. Emission characteristics, environmental impact, and health risk assessment of volatile organic compounds (VOCs) during manicure processes. Sci. Total Environ. 2024, 906, 167464. [Google Scholar] [CrossRef] [PubMed]
- Dong, P.; Hou, G.; Xi, X.; Shao, R.; Dong, F. WO3-based photocatalysts: Morphology control, activity enhancement and multifunctional applications. Environ. Sci. Nano 2017, 4, 539–557. [Google Scholar] [CrossRef]
- Quan, H.; Gao, Y.; Wang, W. Tungsten oxide-based visible light-driven photocatalysts: Crystal and electronic structures and strategies for photocatalytic efficiency enhancement. Inorg. Chem. Front. 2020, 7, 817–838. [Google Scholar] [CrossRef]
- Adhikari, S.; Kim, D.-H.; Madras, G.; Sarkar, D. Understanding the morphological effects of WO3 photocatalysts for the degradation of organic pollutants. Adv. Powder Technol. 2018, 29, 1591–1600. [Google Scholar] [CrossRef]
- Gomis-Berenguer, A.; Celorrio, V.; Iniesta, J.; Fermin, D.J.; Ania, C.O. Nanoporous carbon/WO3 anodes for an enhanced water photooxidation. Carbon 2016, 108, 471–479. [Google Scholar] [CrossRef]
- Wang, L.; Hu, H.; Xu, J.; Zhu, S.; Ding, A.; Deng, C. WO3 nanocubes: Hydrothermal synthesis, growth mechanism, and photocatalytic performance. J. Mater. Res. 2019, 34, 2955–2963. [Google Scholar] [CrossRef]
- Abe, R.; Takami, H.; Murakami, N.; Ohtani, B. Pristine simple oxides as visible light driven photocatalysts: Highly efficient decomposition of organic compounds over platinum-loaded tungsten oxide. J. Am. Chem. Soc. 2008, 130, 7780–7781. [Google Scholar] [CrossRef]
- Dursun, S.; Kaya, İ.C.; Kocabaş, M.; Akyildiz, H.; Kalem, V. Visible light active heterostructured photocatalyst system based on CuO plate-like particles and SnO 2 nanofibers. Int. J. Appl. Ceram. Technol. 2020, 17, 1479–1489. [Google Scholar] [CrossRef]
- Çinar, B.; Keri̇moğlu, I.; Tönbül, B.; Demi̇rbüken, A.; Dursun, S.; Cihan Kaya, I.; Kalem, V.; Akyildiz, H. Hydrothermal/electrospinning synthesis of CuO plate-like particles/TiO2 fibers heterostructures for high-efficiency photocatalytic degradation of organic dyes and phenolic pollutants. Mater. Sci. Semicond. Process. 2020, 109, 104919. [Google Scholar] [CrossRef]
- Li, X.; Yu, J.; Jaroniec, M. Hierarchical photocatalysts. Chem. Soc. Rev. 2016, 45, 2603–2636. [Google Scholar] [CrossRef] [PubMed]
- Alizadeh, N.; Salimi, A.; Hallaj, R.; Fathi, F.; Soleimani, F. CuO/WO3 nanoparticles decorated graphene oxide nanosheets with enhanced peroxidase-like activity for electrochemical cancer cell detection and targeted therapeutics. Mater. Sci. Eng. C 2019, 99, 1374–1383. [Google Scholar] [CrossRef] [PubMed]
- Alali, K.T.; Liu, J.; Aljebawi, K.; Liu, P.; Chen, R.; Li, R.; Zhang, H.; Zhou, L.; Wang, J. Electrospun n-p WO3/CuO heterostructure nanofibers as an efficient sarin nerve agent sensing material at room temperature. J. Alloys Compd. 2019, 793, 31–41. [Google Scholar] [CrossRef]
- Wang, C.; Tang, J.; Zhang, X.; Qian, L.; Yang, H. WO3 nanoflakes decorated with CuO clusters for enhanced photoelectrochemical water splitting. Prog. Nat. Sci. Mater. Int. 2018, 28, 200–204. [Google Scholar] [CrossRef]
- Dursun, S.; Koyuncu, S.N.; Kaya, İ.C.; Kaya, G.G.; Kalem, V.; Akyildiz, H. Production of CuO–WO3 hybrids and their dye removal capacity/performance from wastewater by adsorption/photocatalysis. J. Water Process Eng. 2020, 36, 101390. [Google Scholar] [CrossRef]
- Wang, H.; Xiao, M.; Wang, Z.; Chen, X.; Dai, W.; Fu, X. Visible photocatalytic hydrogen production from CH3OH over CuO/WO3: The effect of electron transfer behavior of the adsorbed CH3OH. Chem. Eng. J. 2023, 459, 141616. [Google Scholar] [CrossRef]
- He, M.; Xie, L.; Zhao, X.; Hu, X.; Li, S.; Zhu, Z.-G. Highly sensitive and selective H2S gas sensors based on flower-like WO3/CuO composites operating at low/room temperature. J. Alloys Compd. 2019, 788, 36–43. [Google Scholar] [CrossRef]
- Zappa, D.; Galstyan, V.; Kaur, N.; Munasinghe Arachchige, H.M.M.; Sisman, O.; Comini, E. “Metal oxide—Based heterostructures for gas sensors”—A review. Anal. Chim. Acta 2018, 1039, 1–23. [Google Scholar] [CrossRef]
- Danish, M.S.S.; Estrella-Pajulas, L.; Alemaida, I.; Lisin, A.; Moiseev, N.; Ahmadi, M.; Nazari, M.; Wali, M.; Zaheb, H.; Senjyu, T. Photocatalytic Applications of Metal Oxides for Sustainable Environmental Remediation. Met.—Open Access Metall. J. 2021, 11, 80. [Google Scholar] [CrossRef]
- Yu, W.; Sun, Y.; Zhang, T.; Zhang, K.; Wang, S.; Chen, X.; Dai, N. CuO/WO3 Hybrid Nanocubes for High-Responsivity and Fast-Recovery H2S Sensors Operated at Low Temperature. Part. Part. Syst. Charact. 2016, 33, 15–20. [Google Scholar] [CrossRef]
- Li, J.; Hu, S.; Liu, S.; Hou, S.; Li, L.; Huang, J. In situ fabrication of WO3/CuWO4/CuO heterojunction photoanode for boosted interfacial charge transfer and enhanced photoelectrochemical water splitting. Int. J. Hydrog. Energy 2024, 61, 967–974. [Google Scholar] [CrossRef]
- Raba-Páez, A.M.; Malafatti, J.O.D.; Parra-Vargas, C.A.; Paris, E.C.; Rincón-Joya, M. Effect of tungsten doping on the structural, morphological and bactericidal properties of nanostructured CuO. PLoS ONE 2020, 15, e0239868. [Google Scholar] [CrossRef] [PubMed]
- Huang, J.; Wan, Q. Gas Sensors Based on Semiconducting Metal Oxide One-Dimensional Nanostructures. Sensors 2009, 9, 9903. [Google Scholar] [CrossRef] [PubMed]
- Gaona, I.M.S.; Mendoza, M.C.; Vargas, C.A.P. Structural and Magnetic Properties of Nd3Ba5Cu8O18+ẟ Superconductor. J. Low Temp. Phys. 2023, 211, 156–165. [Google Scholar] [CrossRef]
- Saavedra Gaona, I.M.; Supelano, G.I.; Suarez Vera, S.G.; Fonseca, L.C.I.; Castaneda Mendoza, M.; Sánchez Saenz, C.L.; Izquierdo, J.L.; Gómez, A.; Morán, O.; Parra Vargas, C.A. Magnetic and electrical behaviour of Yb substitution on Bi1-xYbxFeO3 (0.00 < x < 0.06) ceramic system. J. Magn. Magn. Mater. 2024, 593, 171827. [Google Scholar]
- Pallavolu, M.-R.; Banerjee, A.-N.; Joo, S.-W. Battery-Type Behavior of Al-Doped CuO Nanoflakes to Fabricate a High-Performance Hybrid Supercapacitor Device for Superior Energy Storage Applications. Coatings 2023, 13, 1337. [Google Scholar] [CrossRef]
- Jansanthea, P.; Inyai, N.; Chomkitichai, W.; Ketwaraporn, J.; Ubolsook, P.; Wansao, C.; Wanaek, A.; Wannawek, A.; Kuimalee, S.; Pookmanee, P. Green synthesis of CuO/Fe2O3/ZnO ternary composite photocatalyst using grape extract for enhanced photodegradation of environmental organic pollutant. Chemosphere 2024, 351, 141212. [Google Scholar] [CrossRef]
- Abdelkarem, K.; Saad, R.; Ahmed, A.M.; Fathy, M.I.; Shaban, M.; Hamdy, H. Efficient room temperature carbon dioxide gas sensor based on barium doped CuO thin films. J. Mater. Sci. 2023, 58, 11568–11584. [Google Scholar] [CrossRef]
- Kang, M.; Liang, J.; Wang, F.; Chen, X.; Lu, Y.; Zhang, J. Structural design of hexagonal/monoclinic WO3 phase junction for photocatalytic degradation. Mater. Res. Bull. 2020, 121, 110614. [Google Scholar] [CrossRef]
- Reis, L.R.M.; Costa, M.J.S.; Oliveira, Y.L.; Santos, R.S.; Sczancoski, J.C.; Cavalcante, L.S. Structure, optical, colorimetric, and supercapacitor properties of anode α-CuWO4 crystals. Mater. Lett. 2024, 354, 135340. [Google Scholar] [CrossRef]
- Ohyama, J.; Iwai, H.; Takahashi, D.; Tsushida, M.; Machida, M.; Nishimura, S.; Takahashi, K. Improved Catalytic Partial Oxidation of Methane via Lattice Oxygen Modification on Supported Copper Oxide Catalyst System. ChemCatChem 2024, 16, e202401045. [Google Scholar] [CrossRef]
- Zou, Z.; Zhao, Z.; Zhang, Z.; Tian, W.; Yang, C.; Jin, X.; Zhang, K. Room-Temperature Optoelectronic Gas Sensor Based on Core–Shell g-C3N4@WO3 Heterocomposites for Efficient Ammonia Detection. Anal. Chem. 2023, 95, 2110–2118. [Google Scholar] [CrossRef] [PubMed]
- Jeong, Y.; Hong, S.; Jung, G.; Shin, W.; Lee, C.; Park, J.; Kim, D.; Lee, J.-H. Effects of oxygen gas in the sputtering process of the WO3 sensing layer on NO2 sensing characteristics of the FET-type gas sensor. Solid-State Electron. 2023, 200, 108563. [Google Scholar] [CrossRef]
- Murugesan, S.; Thirumurugesan, R.; Mohandas, E.; Parameswaran, P. X-ray diffraction Rietveld analysis and Bond Valence analysis of nano titania containing oxygen vacancies synthesized via sol-gel route. Mater. Chem. Phys. 2019, 225, 320–330. [Google Scholar] [CrossRef]
- Cuervo Farfán, J.A. Producción y Propiedades Físicas de Nuevas Perovskitas Complejas del Tipo RAMOX (R = La, Nd, Sm, Eu; A = Sr, Bi; M = Ti, Mn, Fe). Ph.D. Thesis, Universidad Nacional de Colombia, Bogotá, Colombia, 2021. Available online: https://repositorio.unal.edu.co/handle/unal/79915 (accessed on 15 August 2024).
- Li, X.; Fu, L.; Karimi-Maleh, H.; Chen, F.; Zhao, S. Innovations in WO3 gas sensors: Nanostructure engineering, functionalization, and future perspectives. Heliyon 2024, 10, e27740. [Google Scholar] [CrossRef]
- Sen, S.K.; Dutta, S.; Paik, L.; Paul, T.C.; Manir, M.S.; Hossain, M.; Hossain, M.N. Dy-doped MoO3 nanobelts synthesized via hydrothermal route: Influence of Dy contents on the structural, morphological and optical properties. J. Alloys Compd. 2021, 876, 160070. [Google Scholar] [CrossRef]
- Sutapa, I.W.; Wahid Wahab, A.; Taba, P.; Nafie, N.L. Dislocation, crystallite size distribution and lattice strain of magnesium oxide nanoparticles. J. Phys. Conf. Ser. 2018, 979, 012021. [Google Scholar] [CrossRef]
- Jia, Y.; Zhou, K.; Sun, W.; Ding, M.; Wang, Y.; Kong, X.; Jia, D.; Wu, M.; Fu, Y. Enhancement mechanisms of mechanical, electrical and thermal properties of carbon nanotube-copper composites: A review. J. Mater. Res. Technol. 2024, 32, 1395–1415. [Google Scholar] [CrossRef]
- Hegde, V.N.; V, M.V.; M, P.T.; C, H.B. Study on structural, morphological, elastic and electrical properties of ZnO nanoparticles for electronic device applications. J. Sci. Adv. Mater. Devices 2024, 9, 100733. [Google Scholar] [CrossRef]
- Mariammal, R.N.; Ramachandran, K.; Kalaiselvan, G.; Arumugam, S.; Renganathan, B.; Sastikumar, D. Effect of magnetism on the ethanol sensitivity of undoped and Mn-doped CuO nanoflakes. Appl. Surf. Sci. 2013, 270, 545–552. [Google Scholar] [CrossRef]
- Vanasundari, K.; Ponnarasi, P.; Mahalakshmi, G. A eco-friendly, green synthesis of Ag loaded WO3/rGO nanocomposites for effective UV light photocatalytic degradation of 4-nitrophenol and antimicrobial activity. Diam. Relat. Mater. 2024, 142, 110859. [Google Scholar] [CrossRef]
- Fatima, R.; Warsi, M.F.; Sarwar, M.I.; Shakir, I.; Agboola, P.O.; Aly Aboud, M.F.; Zulfiqar, S. Synthesis and Characterization of Hetero-metallic Oxides-Reduced Graphene Oxide Nanocomposites for Photocatalytic Applications. Ceram. Int. 2021, 47, 7642–7652. [Google Scholar] [CrossRef]
- Capeli, R.A.; Belmonte, T.; Caierão, J.; Dalmaschio, C.J.; Teixeira, S.R.; Mastelaro, V.R.; Chiquito, A.J.; Teodoro, M.D.; Domenegueti, J.F.M.; Longo, E.; et al. Effect of hydrothermal temperature on the antibacterial and photocatalytic activity of WO3 decorated with silver nanoparticles. J. Sol-Gel Sci. Technol. 2021, 97, 228–244. [Google Scholar] [CrossRef]
- Pourmortazavi, S.M.; Rahimi-Nasrabadi, M.; Khalilian-Shalamzari, M.; Ghaeni, H.R.; Hajimirsadeghi, S.S. Facile Chemical Synthesis and Characterization of Copper Tungstate Nanoparticles. J. Inorg. Organomet. Polym. 2014, 24, 333–339. [Google Scholar] [CrossRef]
- Sreekanth, T.V.M.; Prasad, K.; Yoo, J.; Kim, J.; Yoo, K. CuWO4 as a cost-effective electrocatalyst for urea oxidation reaction. Inorg. Chem. Commun. 2023, 154, 110933. [Google Scholar] [CrossRef]
- Thanh, N.T.K.; Maclean, N.; Mahiddine, S. Mechanisms of Nucleation and Growth of Nanoparticles in Solution. Chem. Rev. 2014, 114, 7610–7630. [Google Scholar] [CrossRef]
- Xue, S.; Cao, S.; Huang, Z.; Yang, D.; Zhang, G. Improving Gas-Sensing Performance Based on MOS Nanomaterials: A Review. Materials 2021, 14, 4263. [Google Scholar] [CrossRef]
- Mohammed Harshulkhan, S.; Janaki, K.; Velraj, G.; Sakthi Ganapthy, R.; Nagarajan, M. Effect of Ag doping on structural, optical and photocatalytic activity of tungsten oxide (WO3) nanoparticles. J. Mater. Sci: Mater. Electron. 2016, 27, 4744–4751. [Google Scholar] [CrossRef]
- Wang, Z.; Wang, X.; Wang, H.; Chen, X.; Dai, W.; Fu, X. The role of electron transfer behavior induced by CO chemisorption on visible-light-driven CO conversion over WO3 and CuWO4/WO3. Appl. Catal. B Environ. 2020, 265, 118588. [Google Scholar] [CrossRef]
- Landi, S.; Segundo, I.R.; Freitas, E.; Vasilevskiy, M.; Carneiro, J.; Tavares, C.J. Use and misuse of the Kubelka-Munk function to obtain the band gap energy from diffuse reflectance measurements. Solid State Commun. 2022, 341, 114573. [Google Scholar] [CrossRef]
- Asiri, A.M.; Nawaz, T.; Tahir, M.B.; Fatima, N.; Khan, S.B.; Alamry, K.A.; Alfifi, S.Y.; Marwani, H.M.; Al-Otaibi, M.M.; Chakraborty, S. Fabrication of WO3 based nanocomposites for the excellent photocatalytic energy production under visible light irradiation. Int. J. Hydrog. Energy 2021, 46, 39058–39066. [Google Scholar] [CrossRef]
- Escobedo-Morales, A.; Ruiz-López, I.I.; Ruiz-Peralta, M.D.; Tepech-Carrillo, L.; Sánchez-Cantú, M.; Moreno-Orea, J.E. Automated method for the determination of the band gap energy of pure and mixed powder samples using diffuse reflectance spectroscopy. Heliyon 2019, 5, e01505. [Google Scholar] [CrossRef] [PubMed]
- Jubu, P.R.; Obaseki, O.S.; Yam, F.K.; Stephen, S.M.; Avaa, A.A.; McAsule, A.A.; Yusof, Y.; Otor, D.A. Influence of the secondary absorption and the vertical axis scale of the Tauc’s plot on optical bandgap energy. J. Opt. 2023, 52, 1426–1435. [Google Scholar] [CrossRef]
- Jubu, P.R.; Obaseki, O.S.; Ajayi, D.I.; Danladi, E.; Chahrour, K.M.; Muhammad, A.; Landi, S.; Igbawua, T.; Chahul, H.F.; Yam, F.K. Considerations about the determination of optical bandgap from diffuse reflectance spectroscopy using the tauc plot. J. Opt. 2024, 53, 5054–5064. [Google Scholar] [CrossRef]
- Zhang, H.; Yilmaz, P.; Ansari, J.O.; Khan, F.F.; Binions, R.; Krause, S.; Dunn, S. Incorporation of Ag nanowires in CuWO4 for improved visible light-induced photoanode performance. J. Mater. Chem. A 2015, 3, 9638–9644. [Google Scholar] [CrossRef]
- Raba-Páez, A.M.; Malafatti, J.O.D.; Parra-Vargas, C.A.; Paris, E.C.; Rincón-Joya, M. Structural evolution, optical properties, and photocatalytic performance of copper and tungsten heterostructure materials. Mater. Today Commun. 2021, 26, 101886. [Google Scholar] [CrossRef]
- Morales-Morales, G.; Manzanares-Martinez, J. Enlargement of band gaps on thermal wave crystals by using heterostructures. Results Phys. 2022, 42, 106019. [Google Scholar] [CrossRef]
- Yao, Y.; Sang, D.; Zou, L.; Wang, Q.; Liu, C. A Review on the Properties and Applications of WO3 Nanostructure-Based Optical and Electronic Devices. Nanomaterials 2021, 11, 2136. [Google Scholar] [CrossRef]
- Wei, Z.; Zhou, Q.; Lu, Z.; Xu, L.; Gui, Y.; Tang, C. Morphology controllable synthesis of hierarchical WO3 nanostructures and C2H2 sensing properties. Phys. E Low-Dimens. Syst. Nanostructures 2019, 109, 253–260. [Google Scholar] [CrossRef]
- Wang, L.; Cheng, S.; Wu, C.; Pei, K.; Song, Y.; Li, H.; Wang, Q.; Sang, D. Fabrication and high temperature electronic behaviors of n-WO3 nanorods/p-diamond heterojunction. Appl. Phys. Lett. 2017, 110, 052106. [Google Scholar] [CrossRef]
- Shen, Z.; Peng, Z.; Zhao, Z.; Fu, X. Nonlinear current-voltage characteristics of WO3-x nano-/micro-rods. Solid State Sci. 2018, 78, 126–132. [Google Scholar] [CrossRef]
- Krishna, K.G.; Parne, S.; Pothukanuri, N.; Kathirvelu, V.; Gandi, S.; Joshi, D. Nanostructured metal oxide semiconductor-based gas sensors: A comprehensive review. Sens. Actuators A Phys. 2022, 341, 113578. [Google Scholar] [CrossRef]
- Cho, S.-Y.; Jang, D.; Kang, H.; Koh, H.-J.; Choi, J.; Jung, H.-T. Ten Nanometer Scale WO3/CuO Heterojunction Nanochannel for an Ultrasensitive Chemical Sensor. Anal. Chem. 2019, 91, 6850–6858. [Google Scholar] [CrossRef] [PubMed]
- Goel, N.; Kunal, K.; Kushwaha, A.; Kumar, M. Metal oxide semiconductors for gas sensing. Eng. Rep. 2023, 5, e12604. [Google Scholar] [CrossRef]
- Karnati, P.; Akbar, S.; Morris, P.A. Conduction mechanisms in one dimensional core-shell nanostructures for gas sensing: A review. Sens. Actuators B Chem. 2019, 295, 127–143. [Google Scholar] [CrossRef]
- Gou, X.; Wang, G.; Yang, J.; Park, J.; Wexler, D. Chemical synthesis, characterisation and gas sensing performance of copper oxide nanoribbons. J. Mater. Chem. 2008, 18, 965–969. [Google Scholar] [CrossRef]
- Raksa, P.; Gardchareon, A.; Chairuangsri, T.; Mangkorntong, P.; Mangkorntong, N.; Choopun, S. Ethanol sensing properties of CuO nanowires prepared by an oxidation reaction. Ceram. Int. 2009, 35, 649–652. [Google Scholar] [CrossRef]
- Ahmad, M.Z.; Kang, J.H.; Sadek, A.Z.; Moafi, A.; Sberveglieri, G.; Wlodarski, W. Synthesis of WO3 Nanorod based Thin Films for Ethanol and H2 Sensing. Procedia Eng. 2012, 47, 358–361. [Google Scholar] [CrossRef]
- Yang, F.; Wang, F.; Guo, Z. Characteristics of binary WO3@CuO and ternary WO3@PDA@CuO based on impressive sensing acetone odor. J. Colloid Interface Sci. 2018, 524, 32–41. [Google Scholar] [CrossRef]


| Label | Weight Percentage (w-w %) | |
|---|---|---|
| Copper Precursor (A) | Tungsten Precursor (B) | |
| WO3 | 0 | 100 |
| Cu20:W80 | 20 | 80 |
| Cu40:W60 | 40 | 60 |
| Cu50:W50 | 50 | 50 |
| Cu60:W40 | 60 | 40 |
| Cu80:W20 | 80 | 20 |
| CuO | 100 | 0 |
| Phase | CuO | Cu80:W20 | Cu60:W40 | Cu50:W50 | Cu40:W60 | Cu20:W80 | WO3 | |
|---|---|---|---|---|---|---|---|---|
| a (Å) | CuO | 4.69 | 4.69 | 4.68 | 4.69 | 4.69 | 4.68 | - |
| WO3 | - | 7.50 | 7.30 | 7.31 | 7.31 | 7.33 | 7.32 | |
| CuWO4 | - | 4.70 | 4.70 | 4.71 | 4.71 | 4.70 | - | |
| b (Å) | CuO | 3.43 | 3.43 | 3.43 | 3.42 | 3.42 | 3.40 | - |
| WO3 | - | 7.60 | 7.52 | 7.53 | 7.53 | 7.56 | 7.54 | |
| CuWO4 | - | 5.84 | 5.83 | 5.84 | 5.84 | 5.83 | - | |
| c (Å) | CuO | 5.13 | 5.14 | 5.13 | 5.14 | 5.13 | 5.12 | - |
| WO3 | - | 7.65 | 7.67 | 7.69 | 7.69 | 7.72 | 7.71 | |
| CuWO4 | - | 4.88 | 4.87 | 4.88 | 4.88 | 4.88 | - | |
| V (Å3) | CuO | 82.52 | 82.69 | 82.35 | 82.44 | 82.28 | 81.47 | - |
| WO3 | - | 436.05 | 421.05 | 423.29 | 423.29 | 427.80 | 425.54 | |
| CuWO4 | - | 133.95 | 133.44 | 134.23 | 134.23 | 133.72 | - | |
| α (°) | CuO | 90 | - | |||||
| WO3 | - | 90 | ||||||
| CuWO4 | - | 91.67 | 91.66 | 91.66 | 91.65 | 91.66 | - | |
| β (°) | CuO | 99.52 | 99.52 | 99.55 | 99.54 | 99.54 | 99.60 | - |
| WO3 | - | 90.42 | 90.50 | 90.45 | 90.42 | 90.44 | 90.56 | |
| CuWO4 | - | 92.51 | 92.50 | 92.50 | 92.50 | 92.50 | - | |
| γ (°) | CuO | 90 | - | |||||
| WO3 | - | 90 | ||||||
| CuWO4 | - | 82.78 | 82.79 | 82.78 | 82.78 | 82.79 | - | |
| Chi | 1.28 | 1.78 | 1.85 | 1.48 | 1.92 | 2.81 | 1.70 | |
| Wavenumber Range (cm⁻¹) | Assignation | Reference | |
|---|---|---|---|
| 555–560 | Metal–oxygen–metal bond vibrations (W-O-W, Cu-O-Cu) | [41,42] | |
| 590–605 | |||
| 620–650 | W-O-W stretch vibration modes | [14] | |
| 670–720 | Vibration of O-W-O-W-O flexion | [43] | |
| 800–810 | O-W-O stretch modes | [14] | |
| 870–920 | W-O bond stretch mode in the octahedral WO6 structure (CuWO4) | [29,44,45] |
| Sample | Small Particle Size (nm) | Large Particle Size (nm) |
|---|---|---|
| CuO | 130.8 ± 30.6 | - |
| Cu80:W20 | 80.9 ± 28.3 | - |
| Cu60:W40 | 100.5 ± 63.3 | 407.5 ± 95.2 |
| Cu50:W50 | 96.3 ± 47.9 | 408.8 ± 80.6 |
| Cu40:W60 | 84.9 ± 24.9 | 407.1 ± 81.2 |
| Cu20:W80 | 82.6 ± 45.9 | 426.5 ± 159.3 |
| WO3 | 99.7 ± 47.5 | - |
| Direct Gap (eV) | Indirect Gap (eV) | ||
|---|---|---|---|
| CuO | 2.44 | 1.28 | - |
| Cu80:W20 | 2.68 | 1.39 | - |
| Cu60:W40 | 2.43 | 1.48 | 1.62 |
| Cu50:W50 | 2.45 | 1.48 | 1.60 |
| Cu40:W60 | 2.46 | 1.33 | 1.93 |
| Cu20:W80 | 2.72 | - | 2.04 |
| WO3 | 2.96 | - | 2.44 |
Disclaimer/Publisher’s Note: The statements, opinions and data contained in all publications are solely those of the individual author(s) and contributor(s) and not of MDPI and/or the editor(s). MDPI and/or the editor(s) disclaim responsibility for any injury to people or property resulting from any ideas, methods, instructions or products referred to in the content. |
© 2025 by the authors. Licensee MDPI, Basel, Switzerland. This article is an open access article distributed under the terms and conditions of the Creative Commons Attribution (CC BY) license (https://creativecommons.org/licenses/by/4.0/).
Share and Cite
Castaneda Mendoza, M.; Parra Vargas, C.A.; Rincón Joya, M.; Chiquito, A.J.; Raba-Páez, A.M. Gas Sensor Properties of (CuO/WO3)-CuWO4 Heterostructured Nanocomposite Materials. Materials 2025, 18, 2896. https://doi.org/10.3390/ma18122896
Castaneda Mendoza M, Parra Vargas CA, Rincón Joya M, Chiquito AJ, Raba-Páez AM. Gas Sensor Properties of (CuO/WO3)-CuWO4 Heterostructured Nanocomposite Materials. Materials. 2025; 18(12):2896. https://doi.org/10.3390/ma18122896
Chicago/Turabian StyleCastaneda Mendoza, Michael, Carlos A. Parra Vargas, Miryam Rincón Joya, Adenilson J. Chiquito, and Angela M. Raba-Páez. 2025. "Gas Sensor Properties of (CuO/WO3)-CuWO4 Heterostructured Nanocomposite Materials" Materials 18, no. 12: 2896. https://doi.org/10.3390/ma18122896
APA StyleCastaneda Mendoza, M., Parra Vargas, C. A., Rincón Joya, M., Chiquito, A. J., & Raba-Páez, A. M. (2025). Gas Sensor Properties of (CuO/WO3)-CuWO4 Heterostructured Nanocomposite Materials. Materials, 18(12), 2896. https://doi.org/10.3390/ma18122896