
Numerical Simulation of In-Situ Direct Shear Test and Damage Failure Mechanism Study of Concrete-Bedrock Cementation Surface
Abstract
1. Introduction
2. In-Situ Direct Shear Test Principle and Test Process
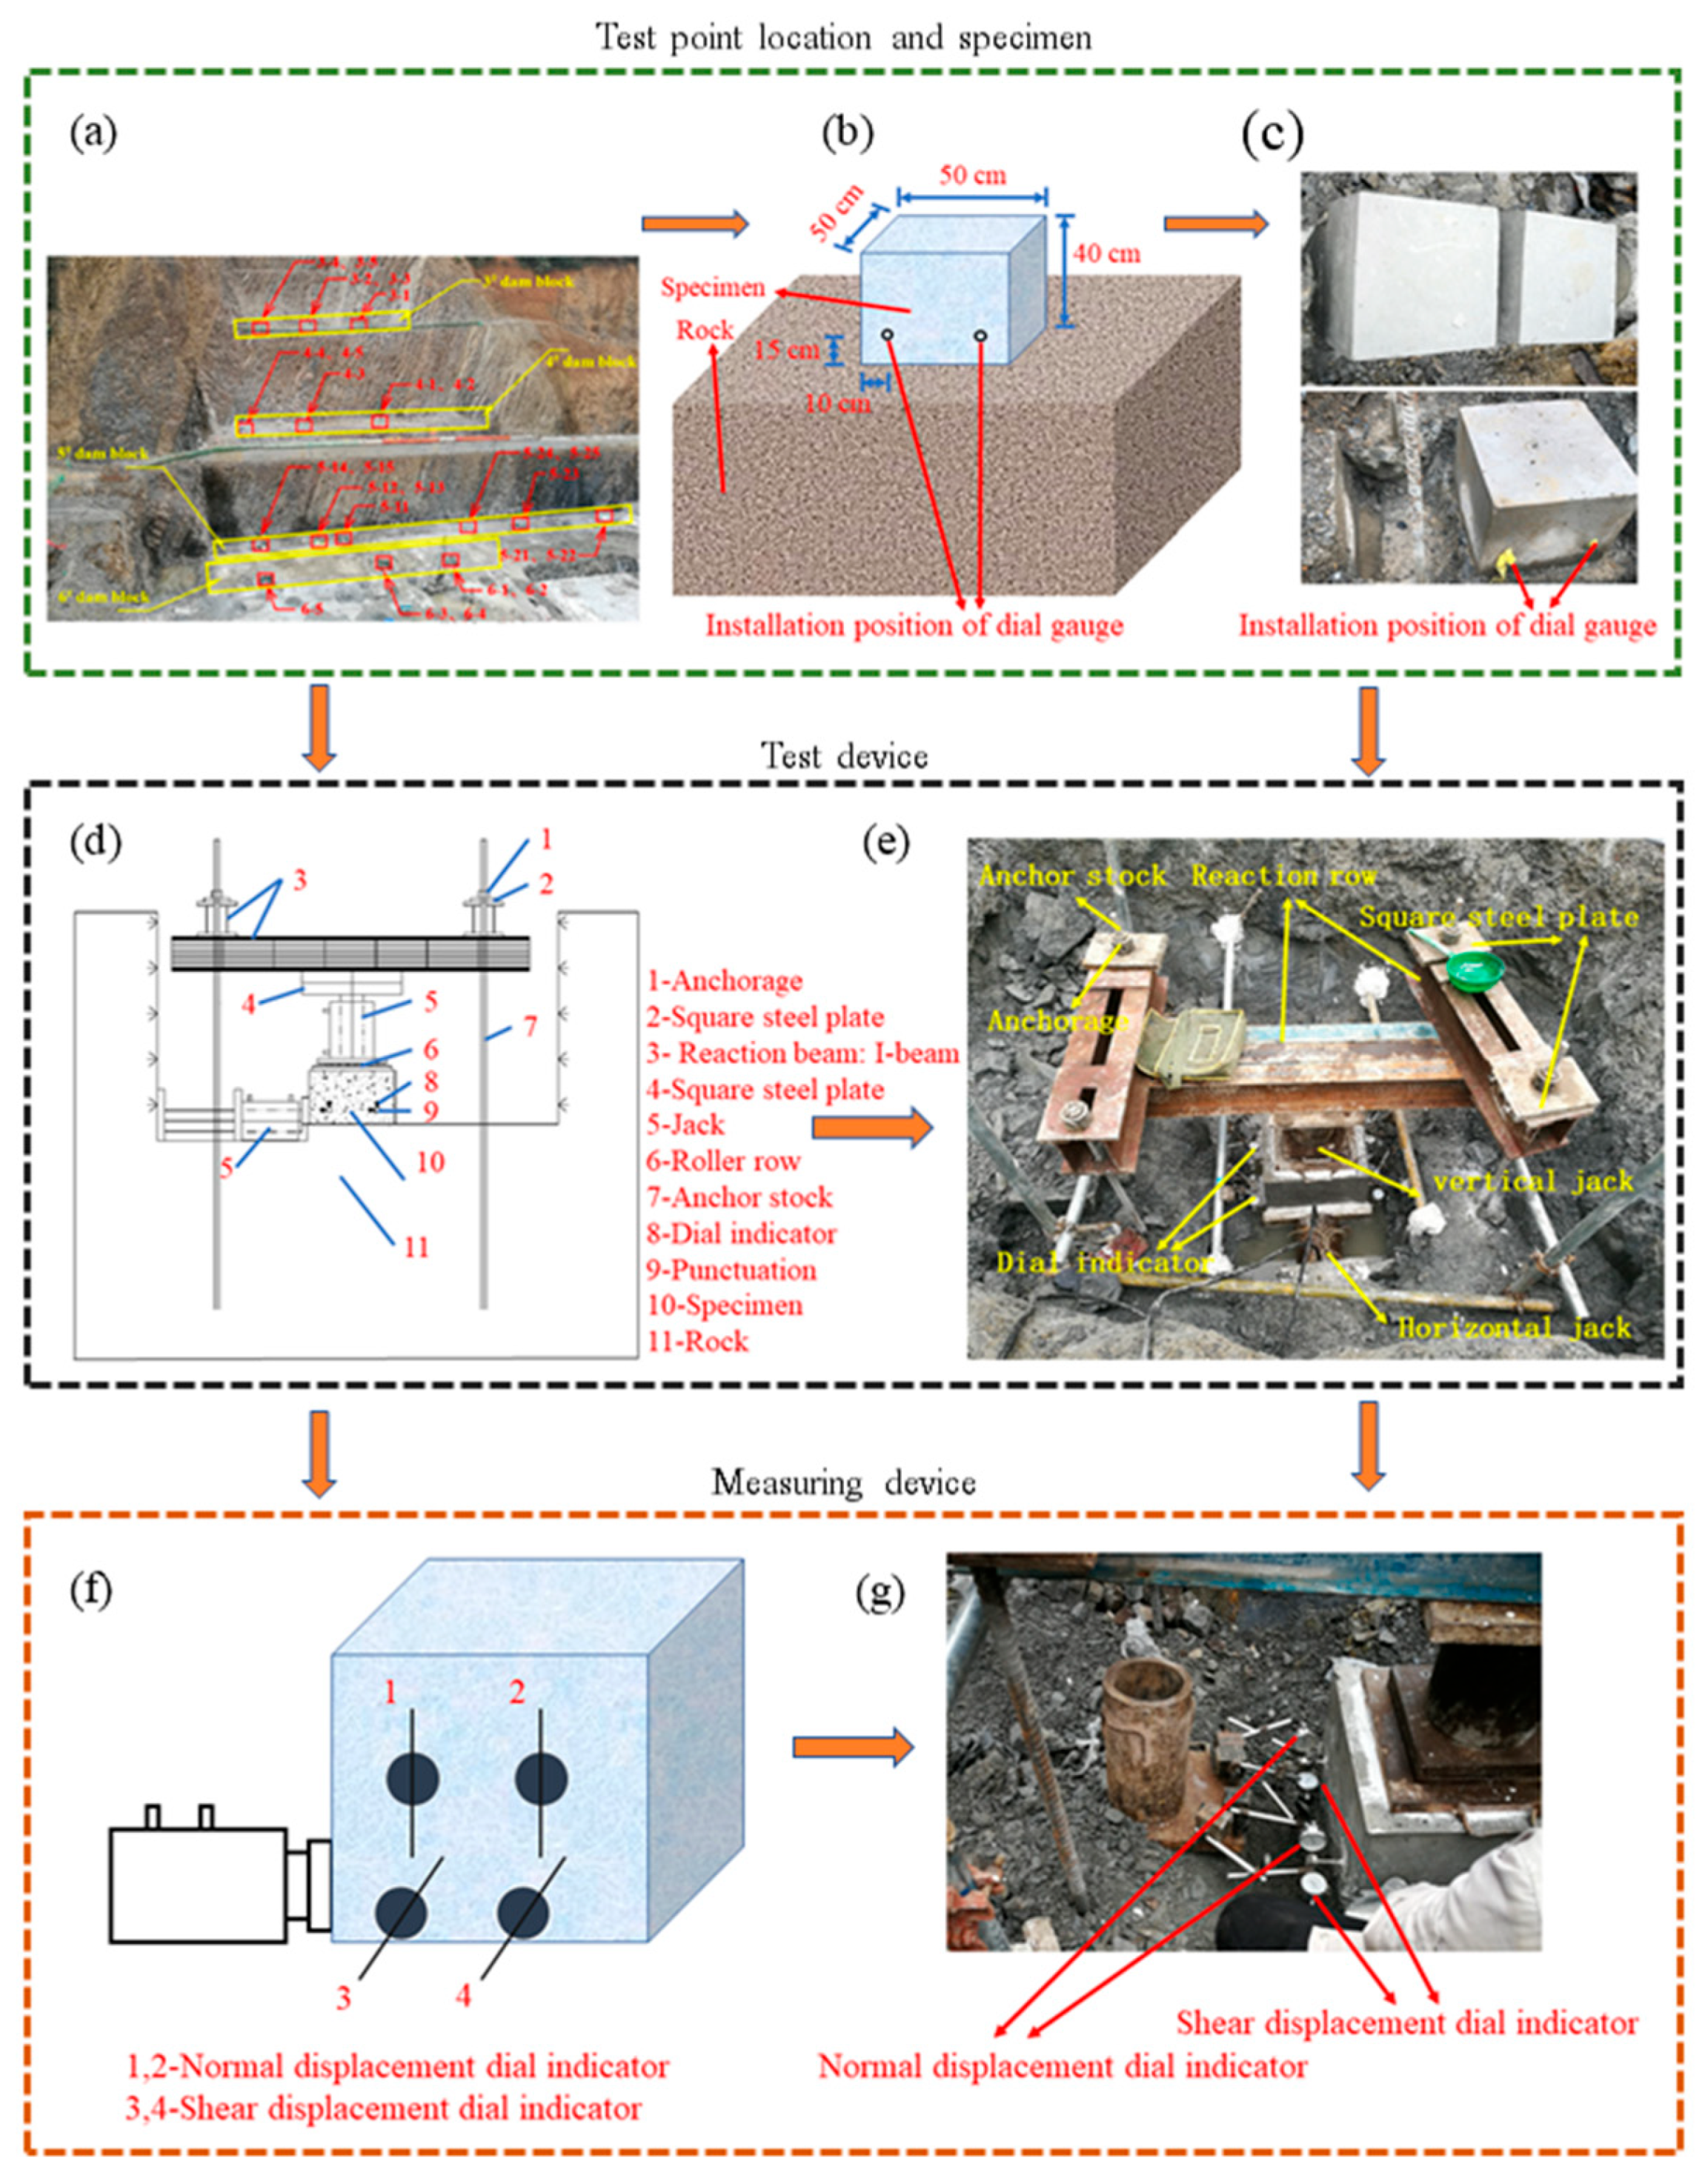
2.1. Testing Overview
2.2. Testing Methodology and Procedures
3. Numerical Simulation of the Direct Shear Test
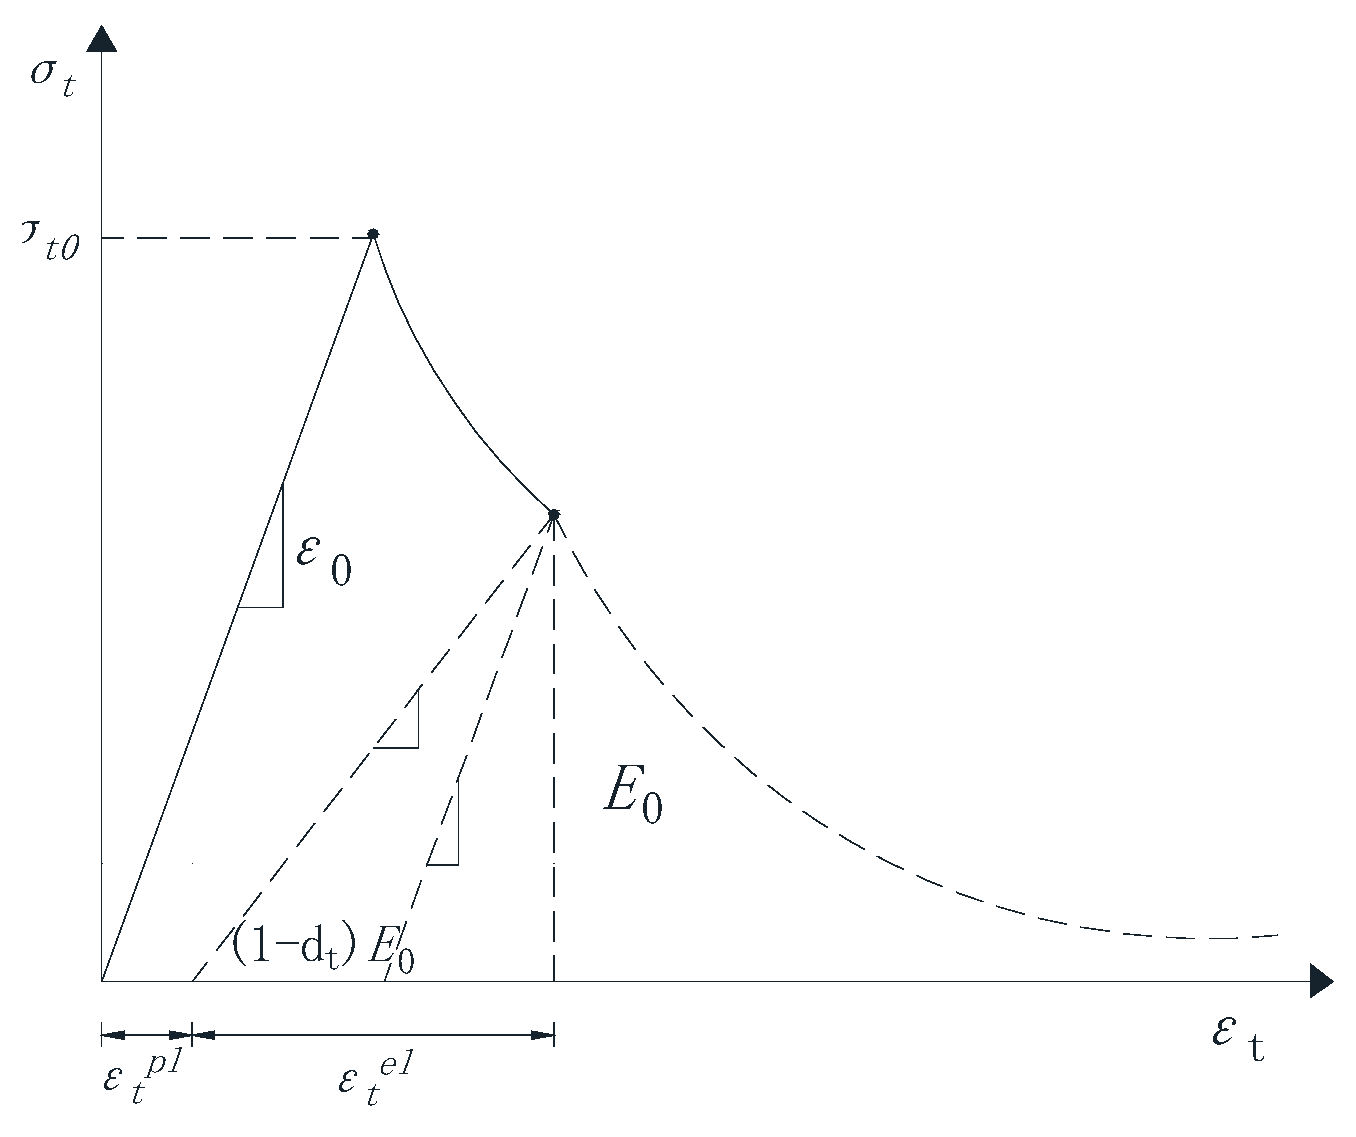
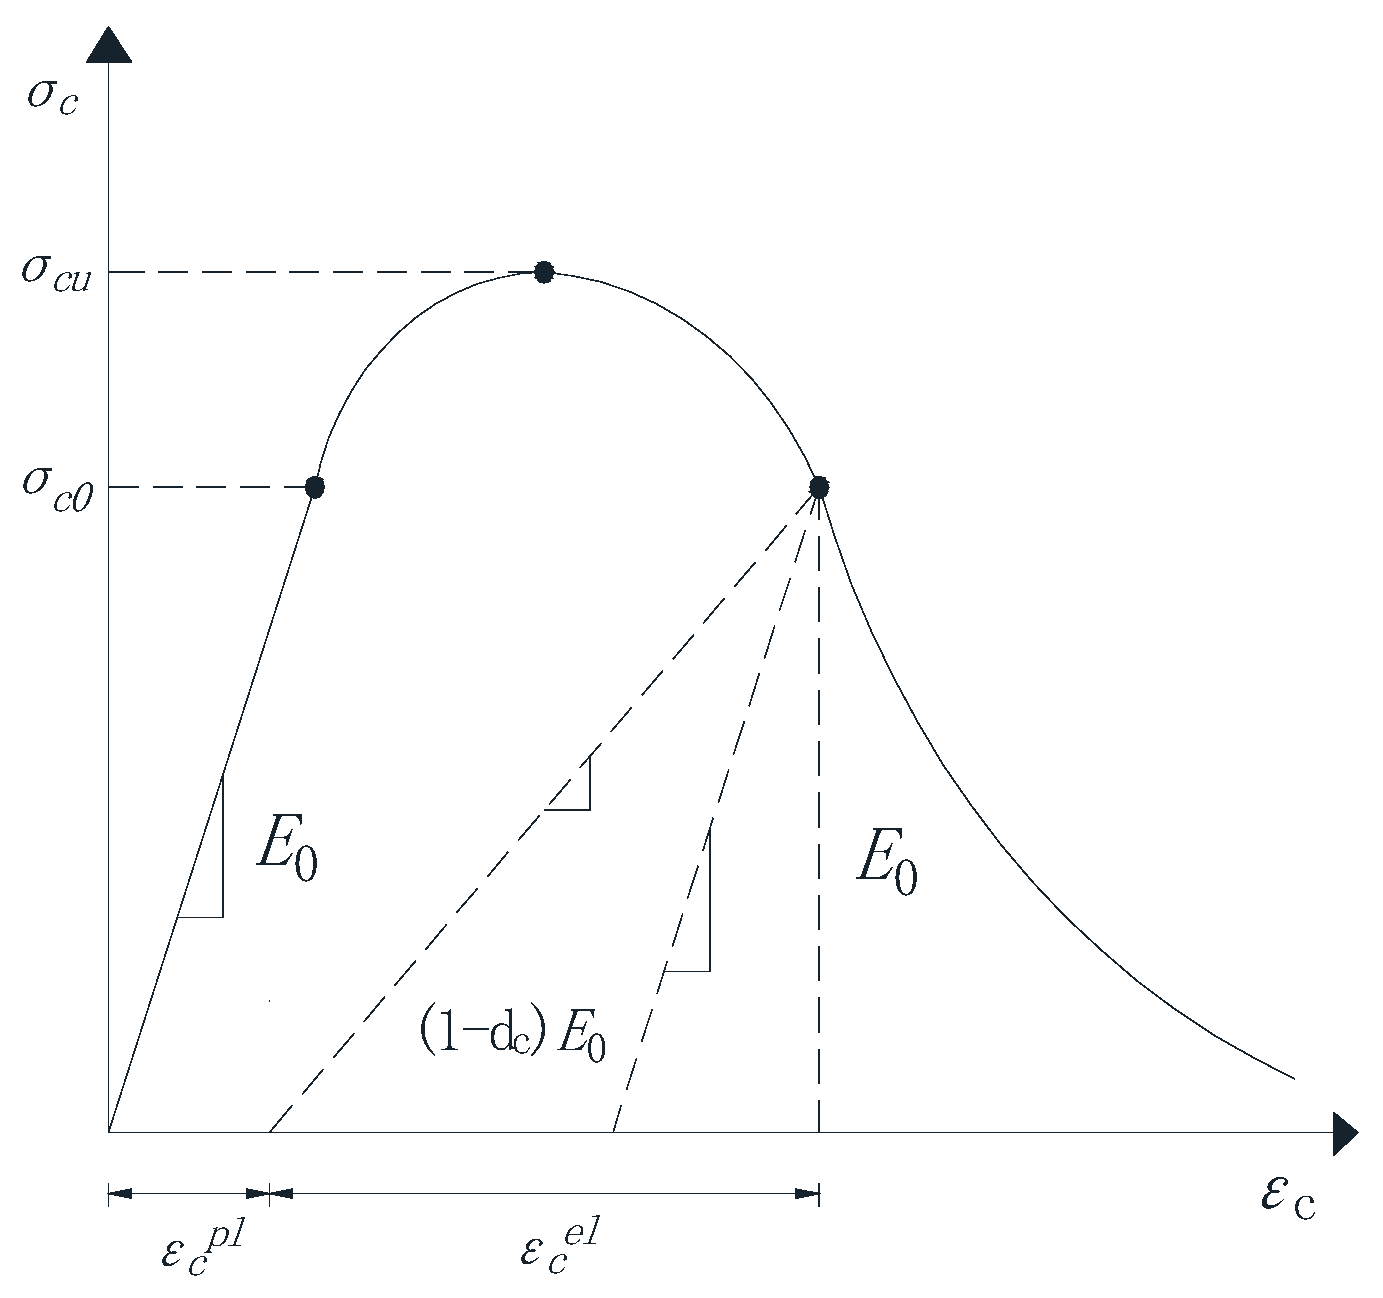
3.1. Plastic Damage Constitutive Model of CDP Concrete
3.2. Mohr-Coulomb Failure Criterion
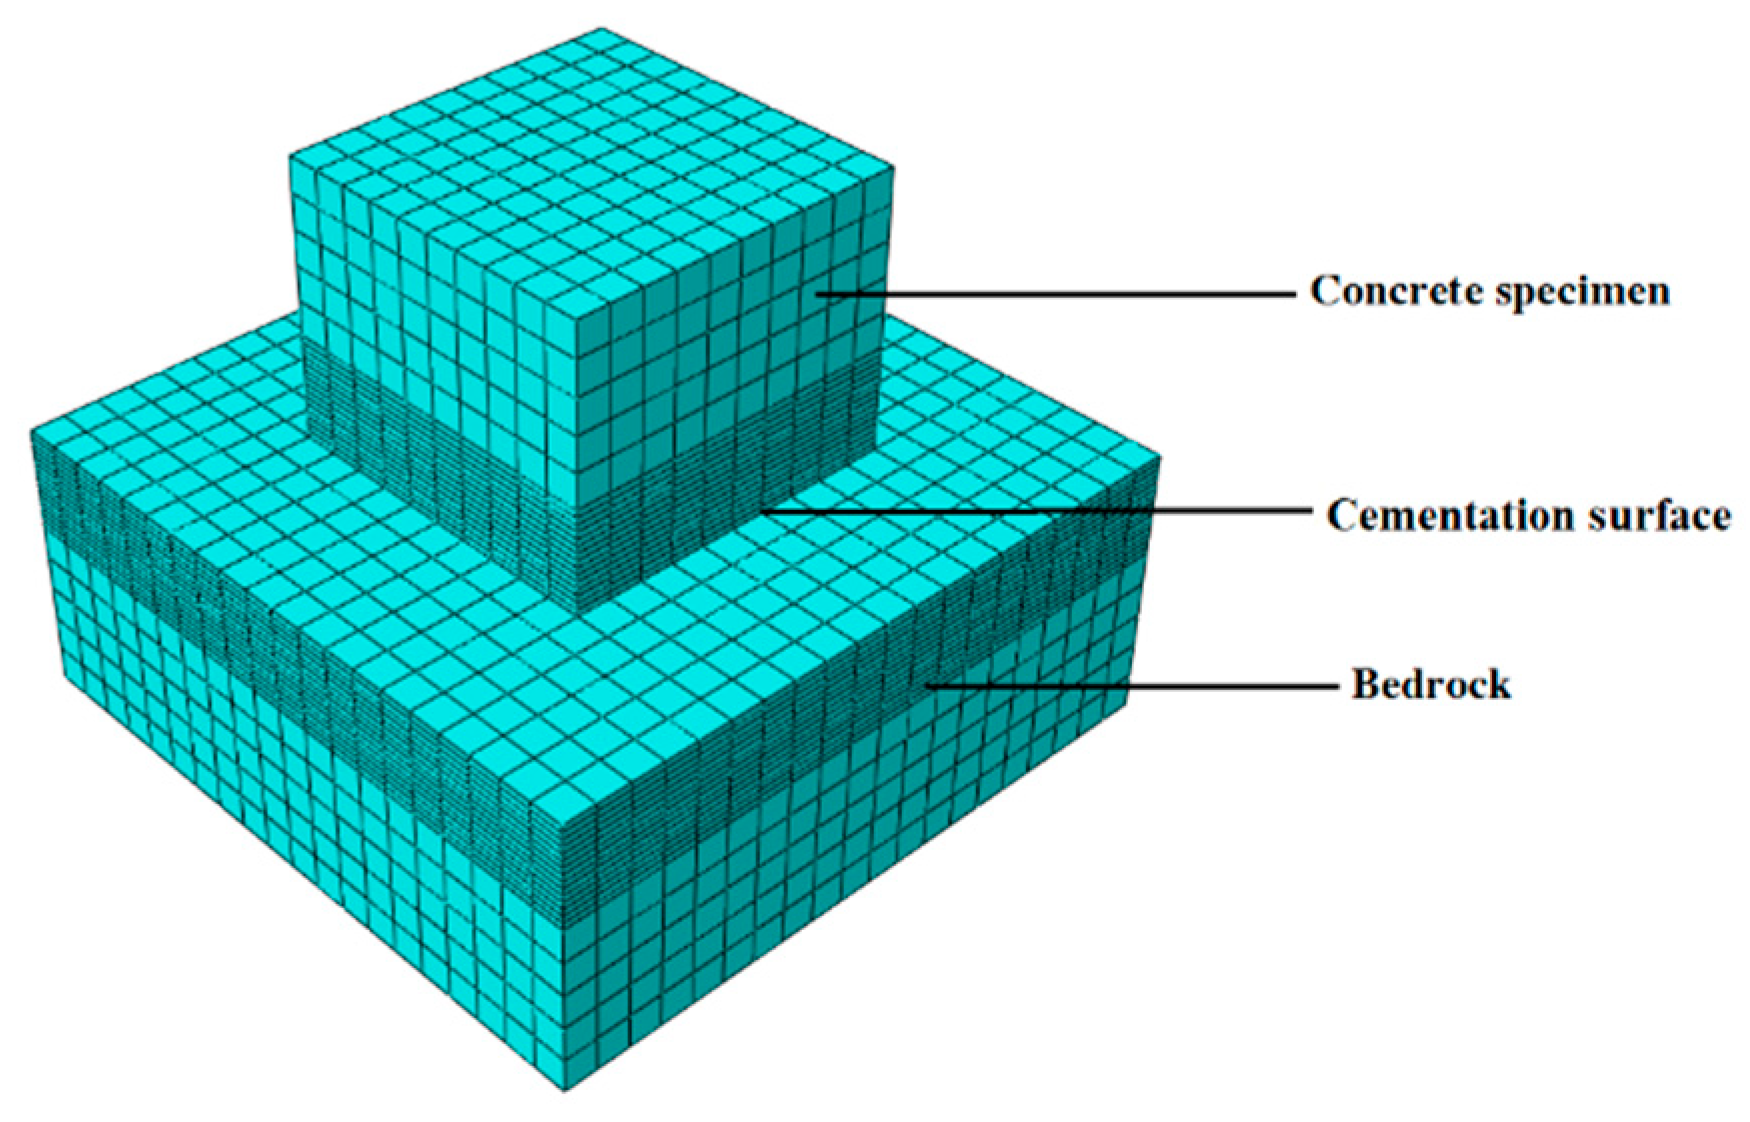
3.3. The Simulation Model Establishment and Parameter Selection of the In-Situ Direct Shear Test
4. Numerical Simulation Results and Experimental Verification
5. Analysis of Simulation Results of Direct Shear Test
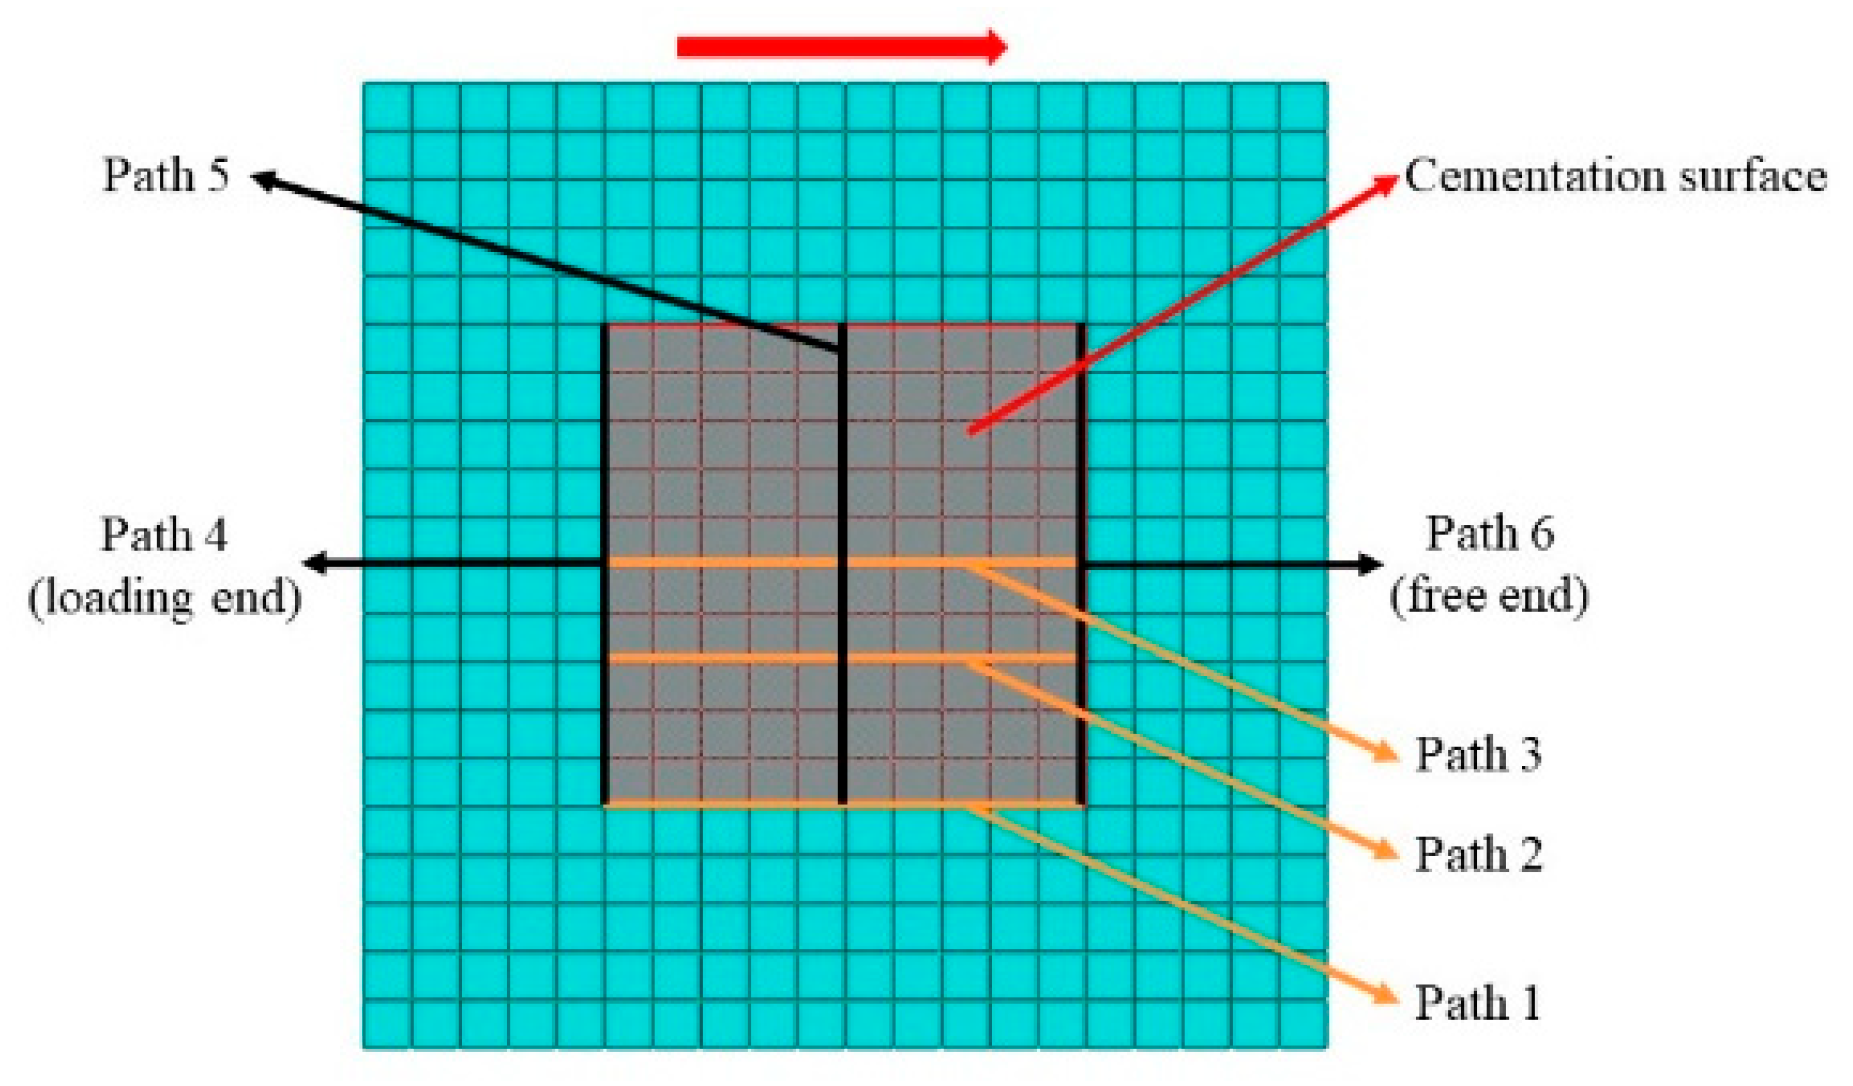
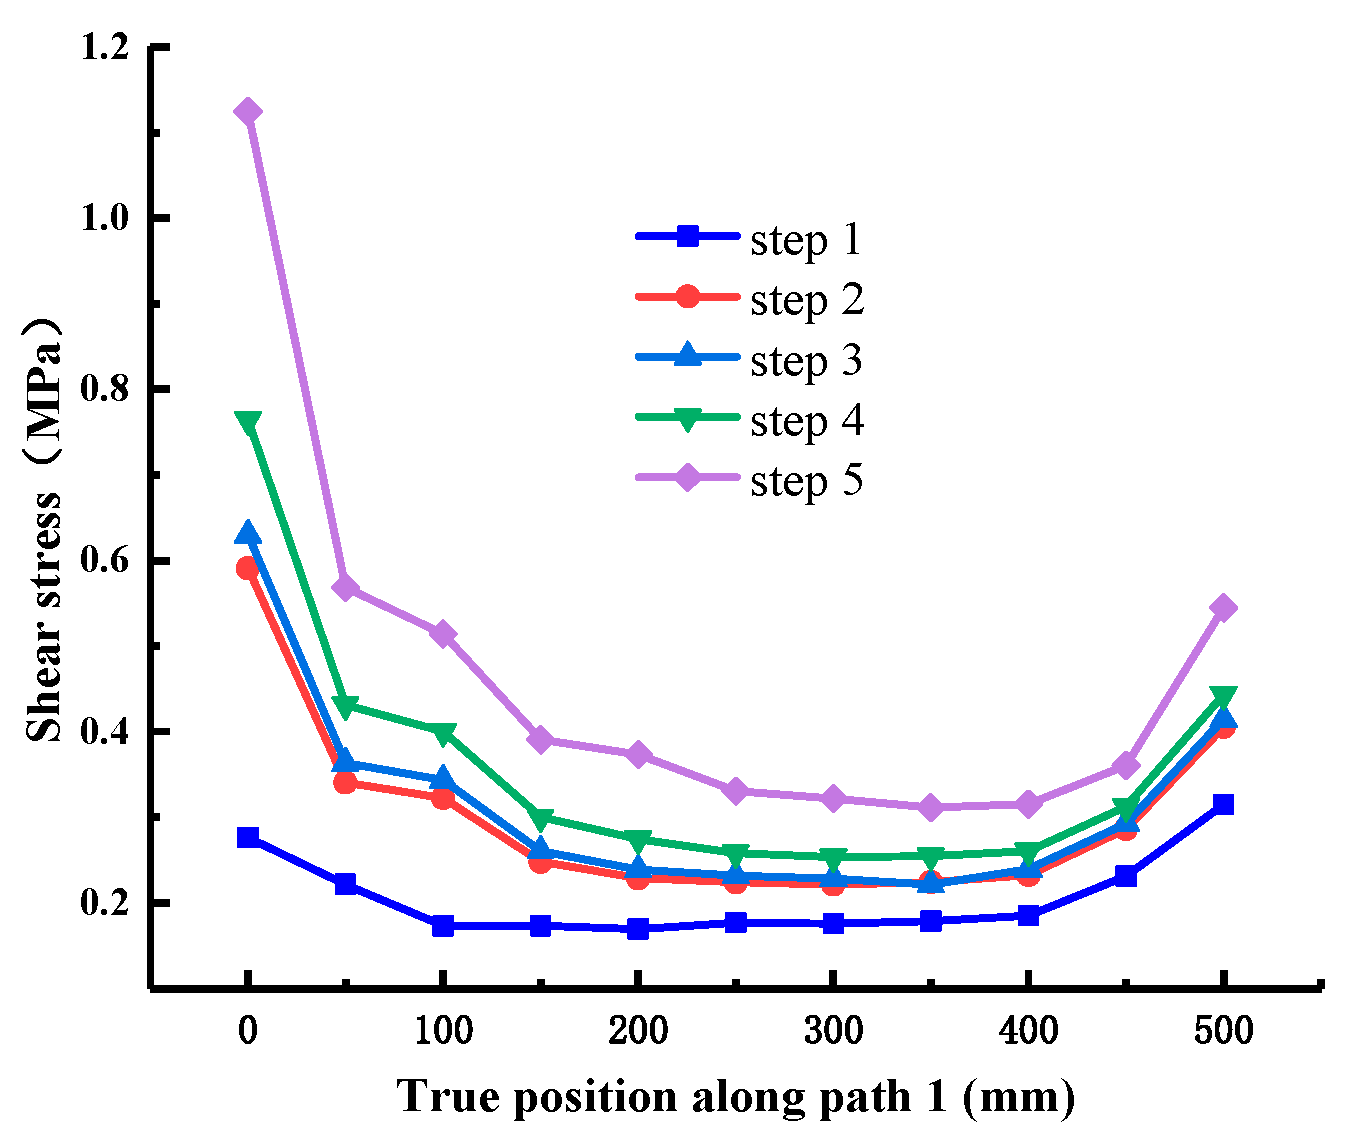
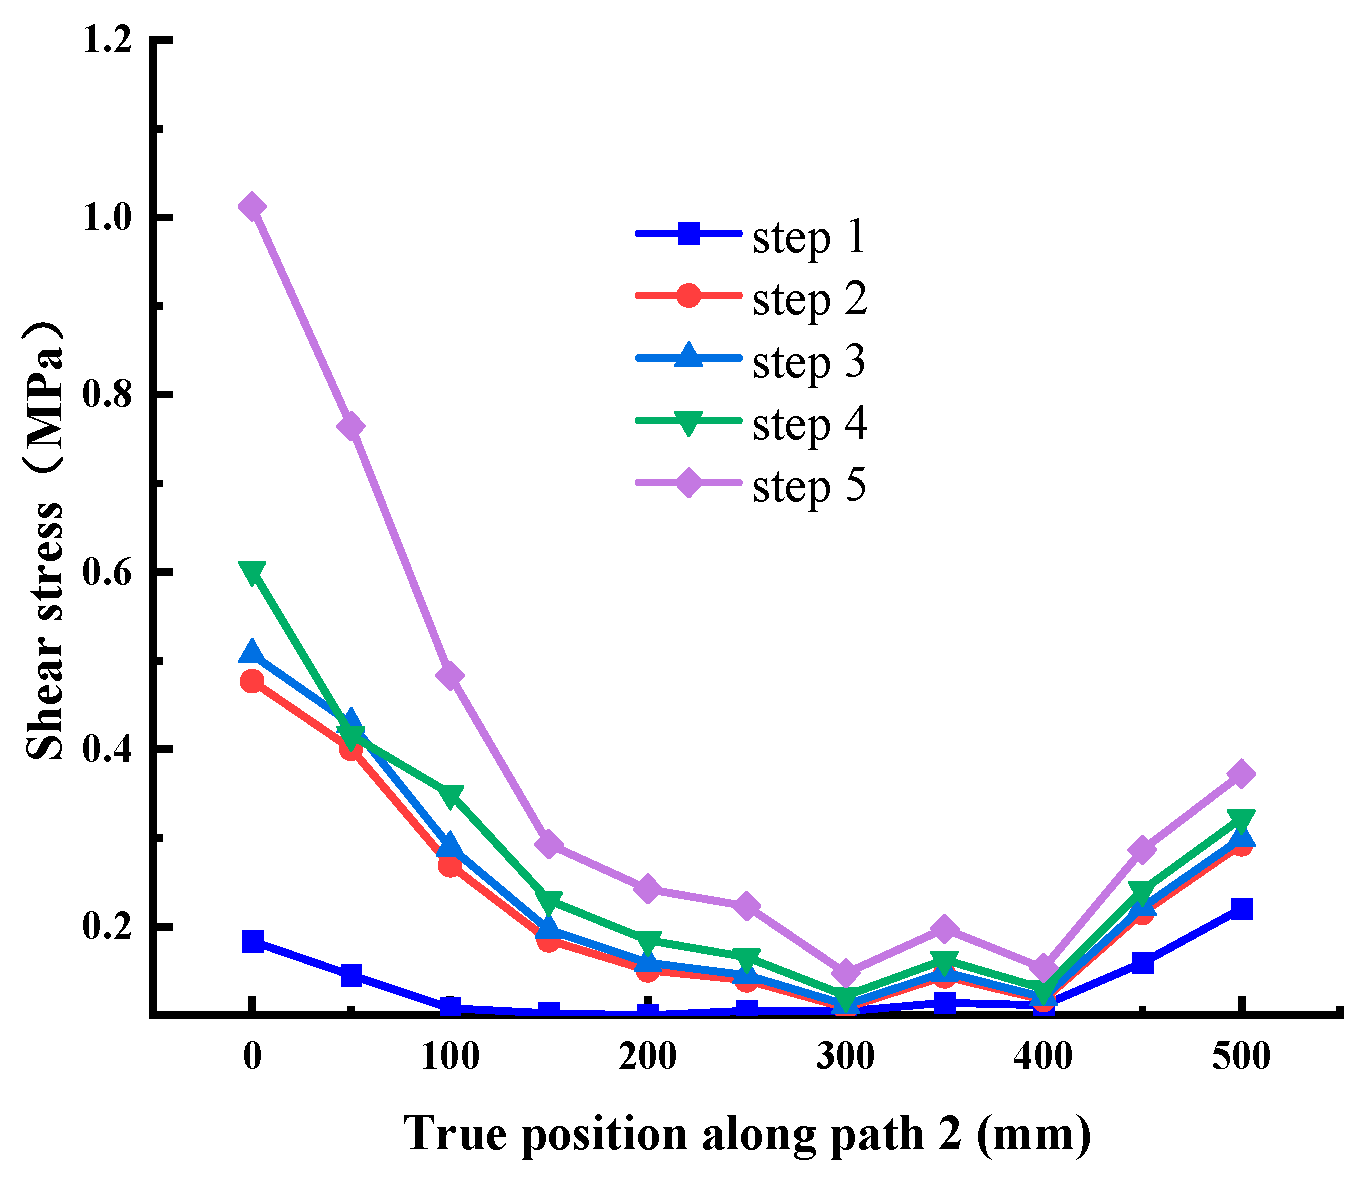
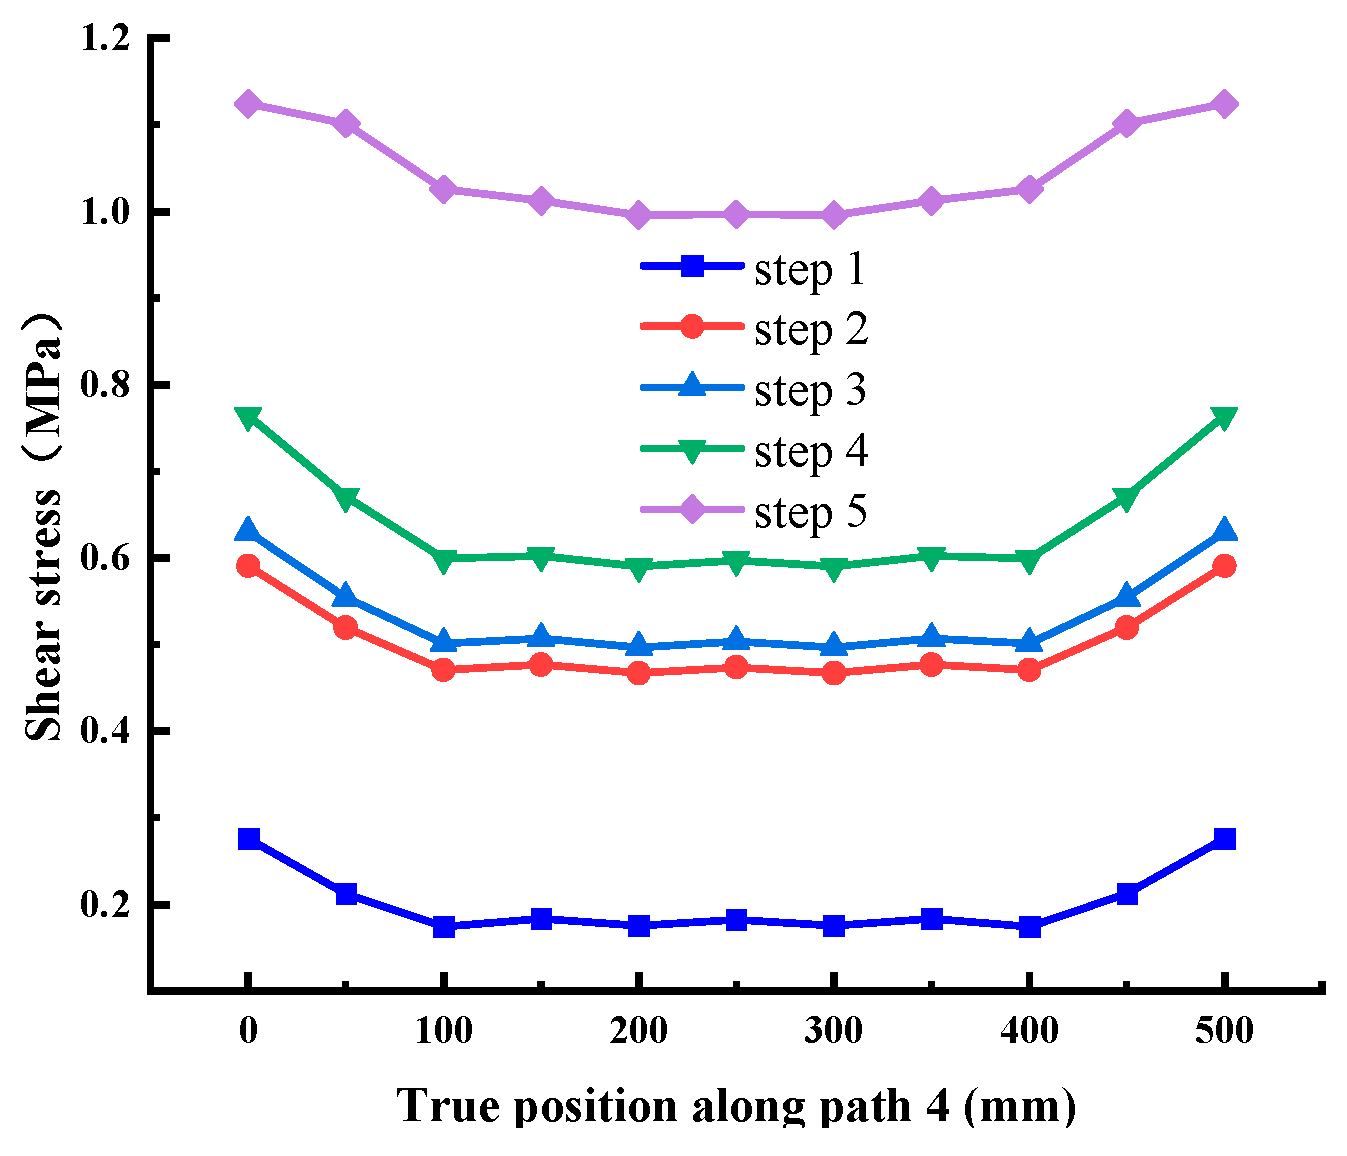
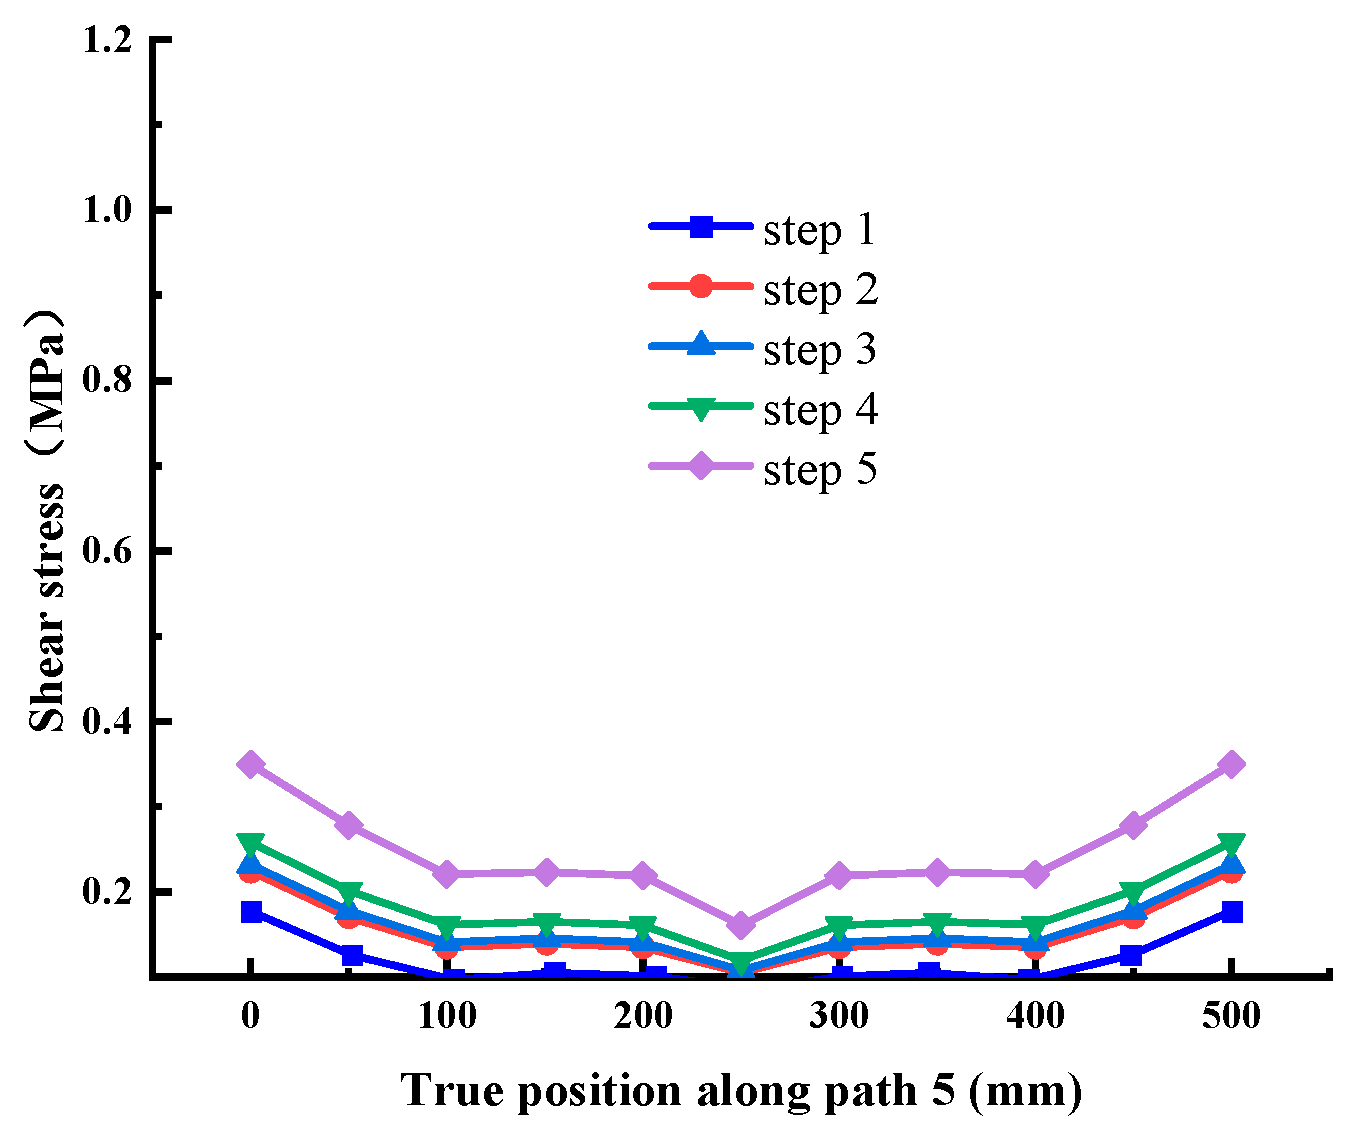
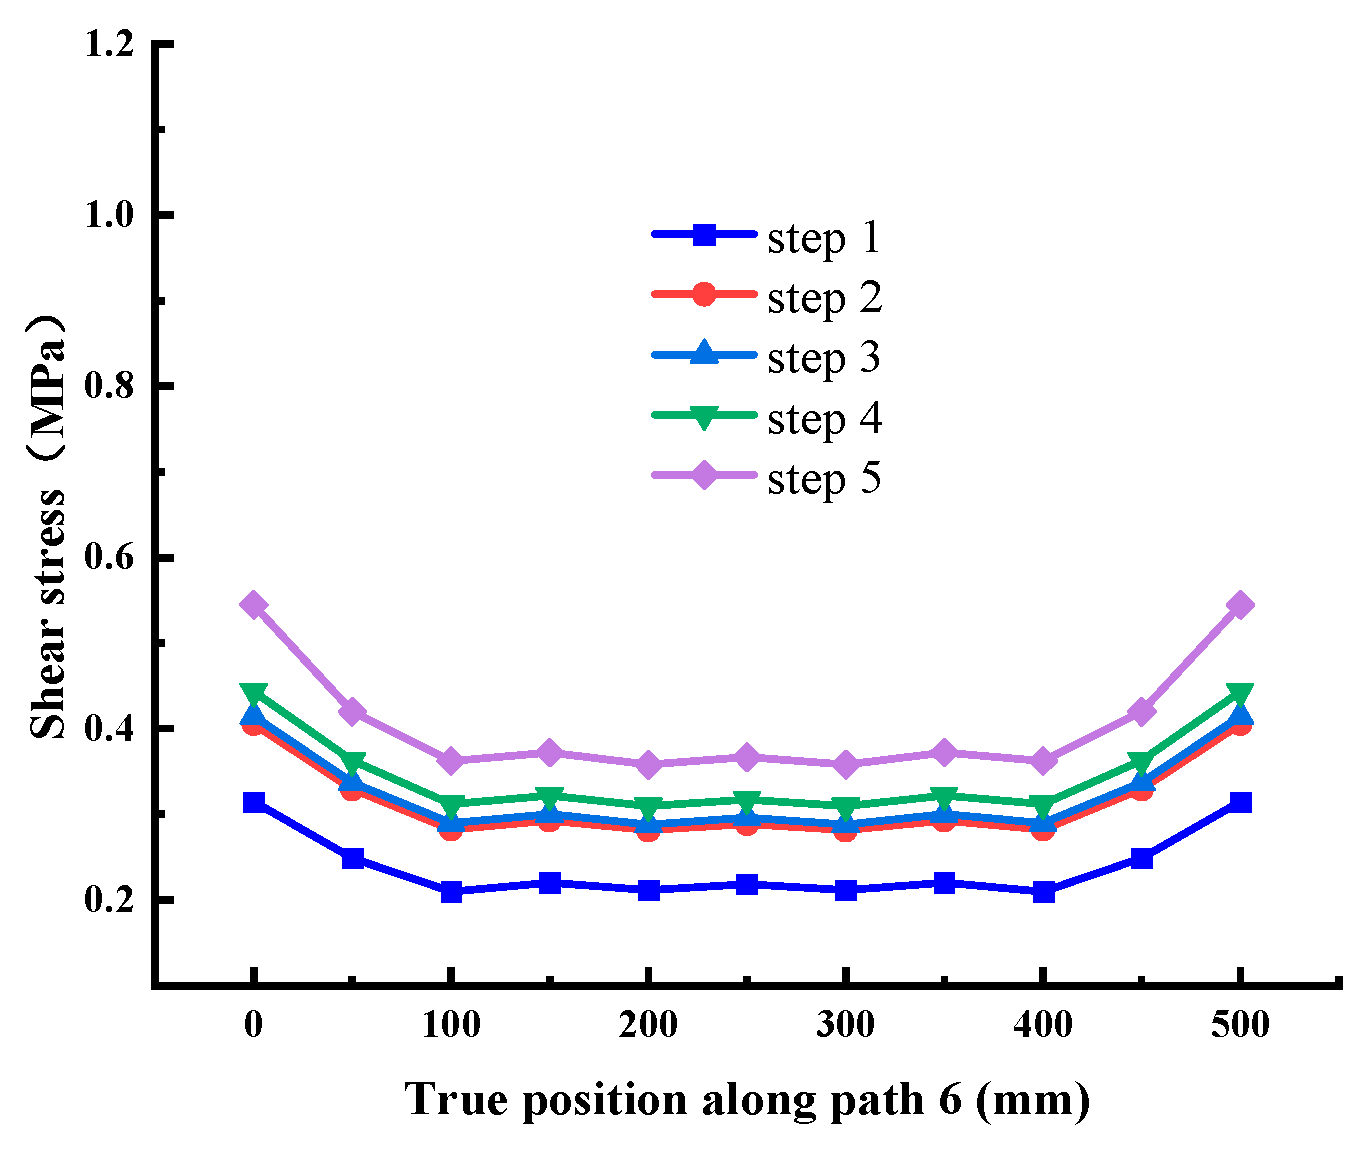
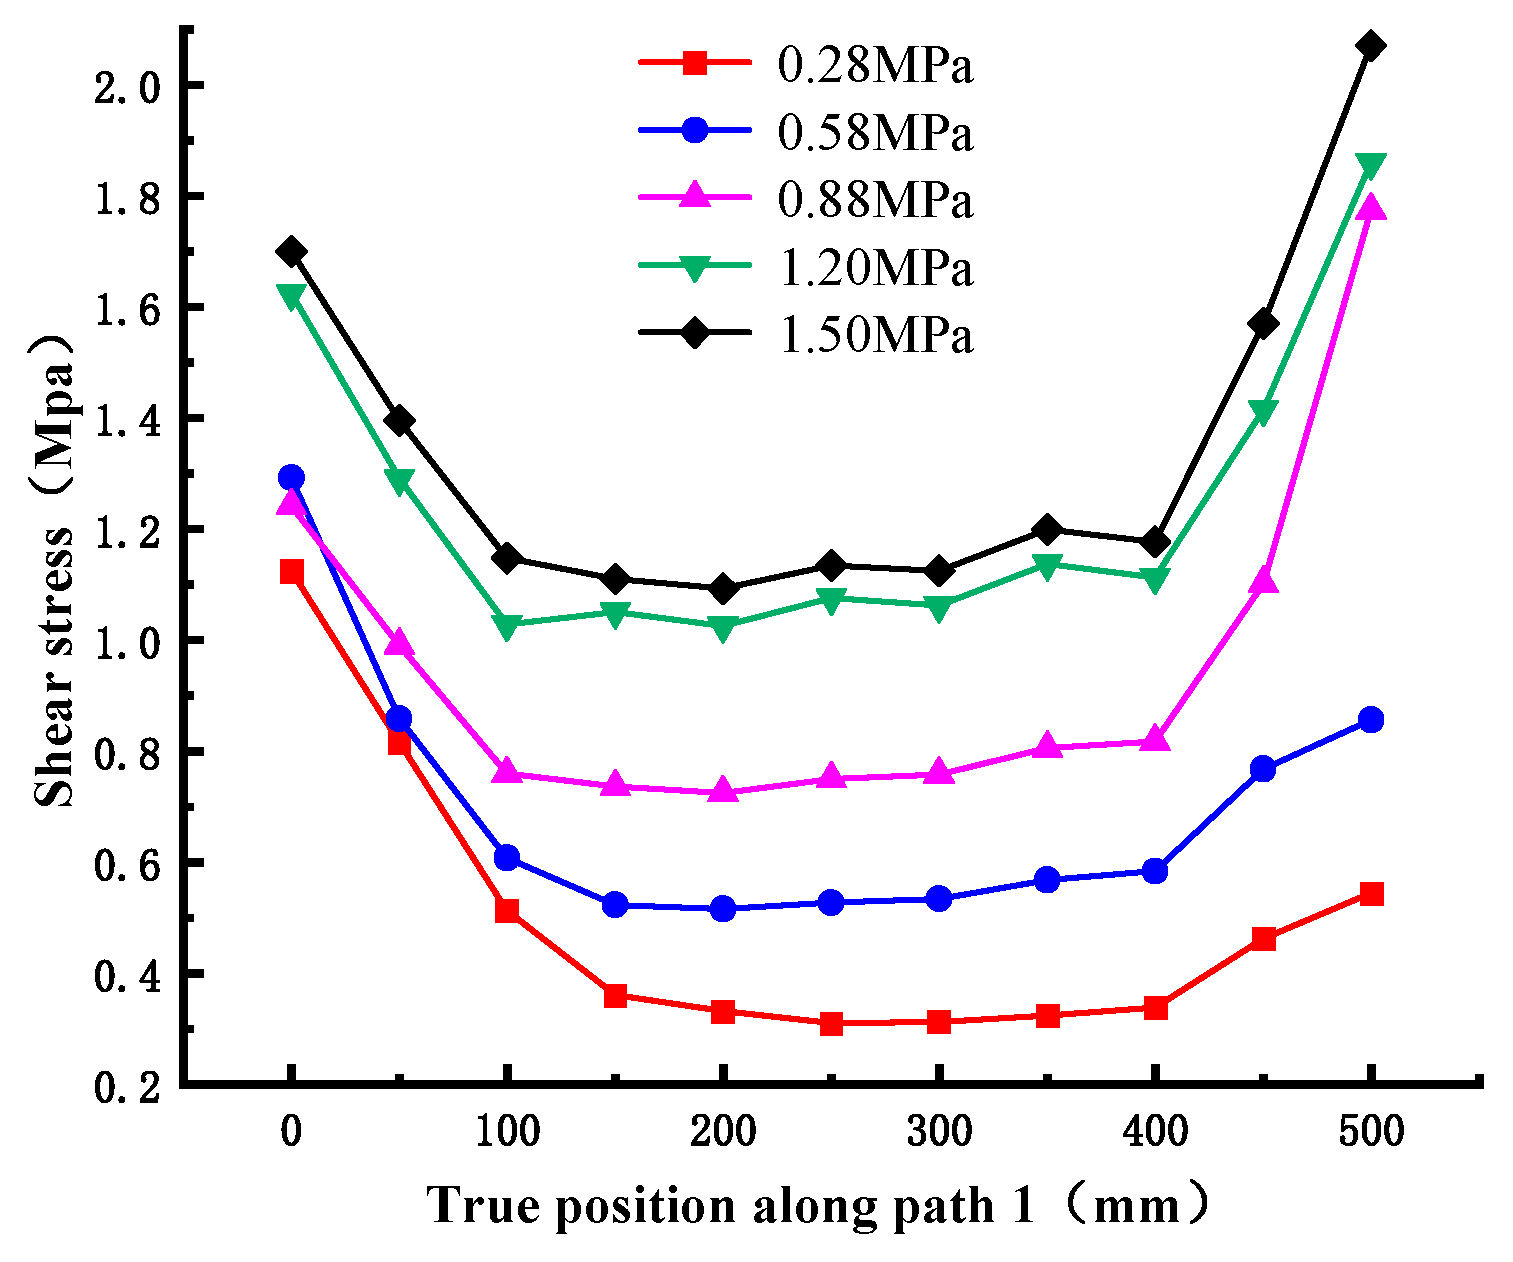
5.1. Shear Stress Distribution on Cementation Surface
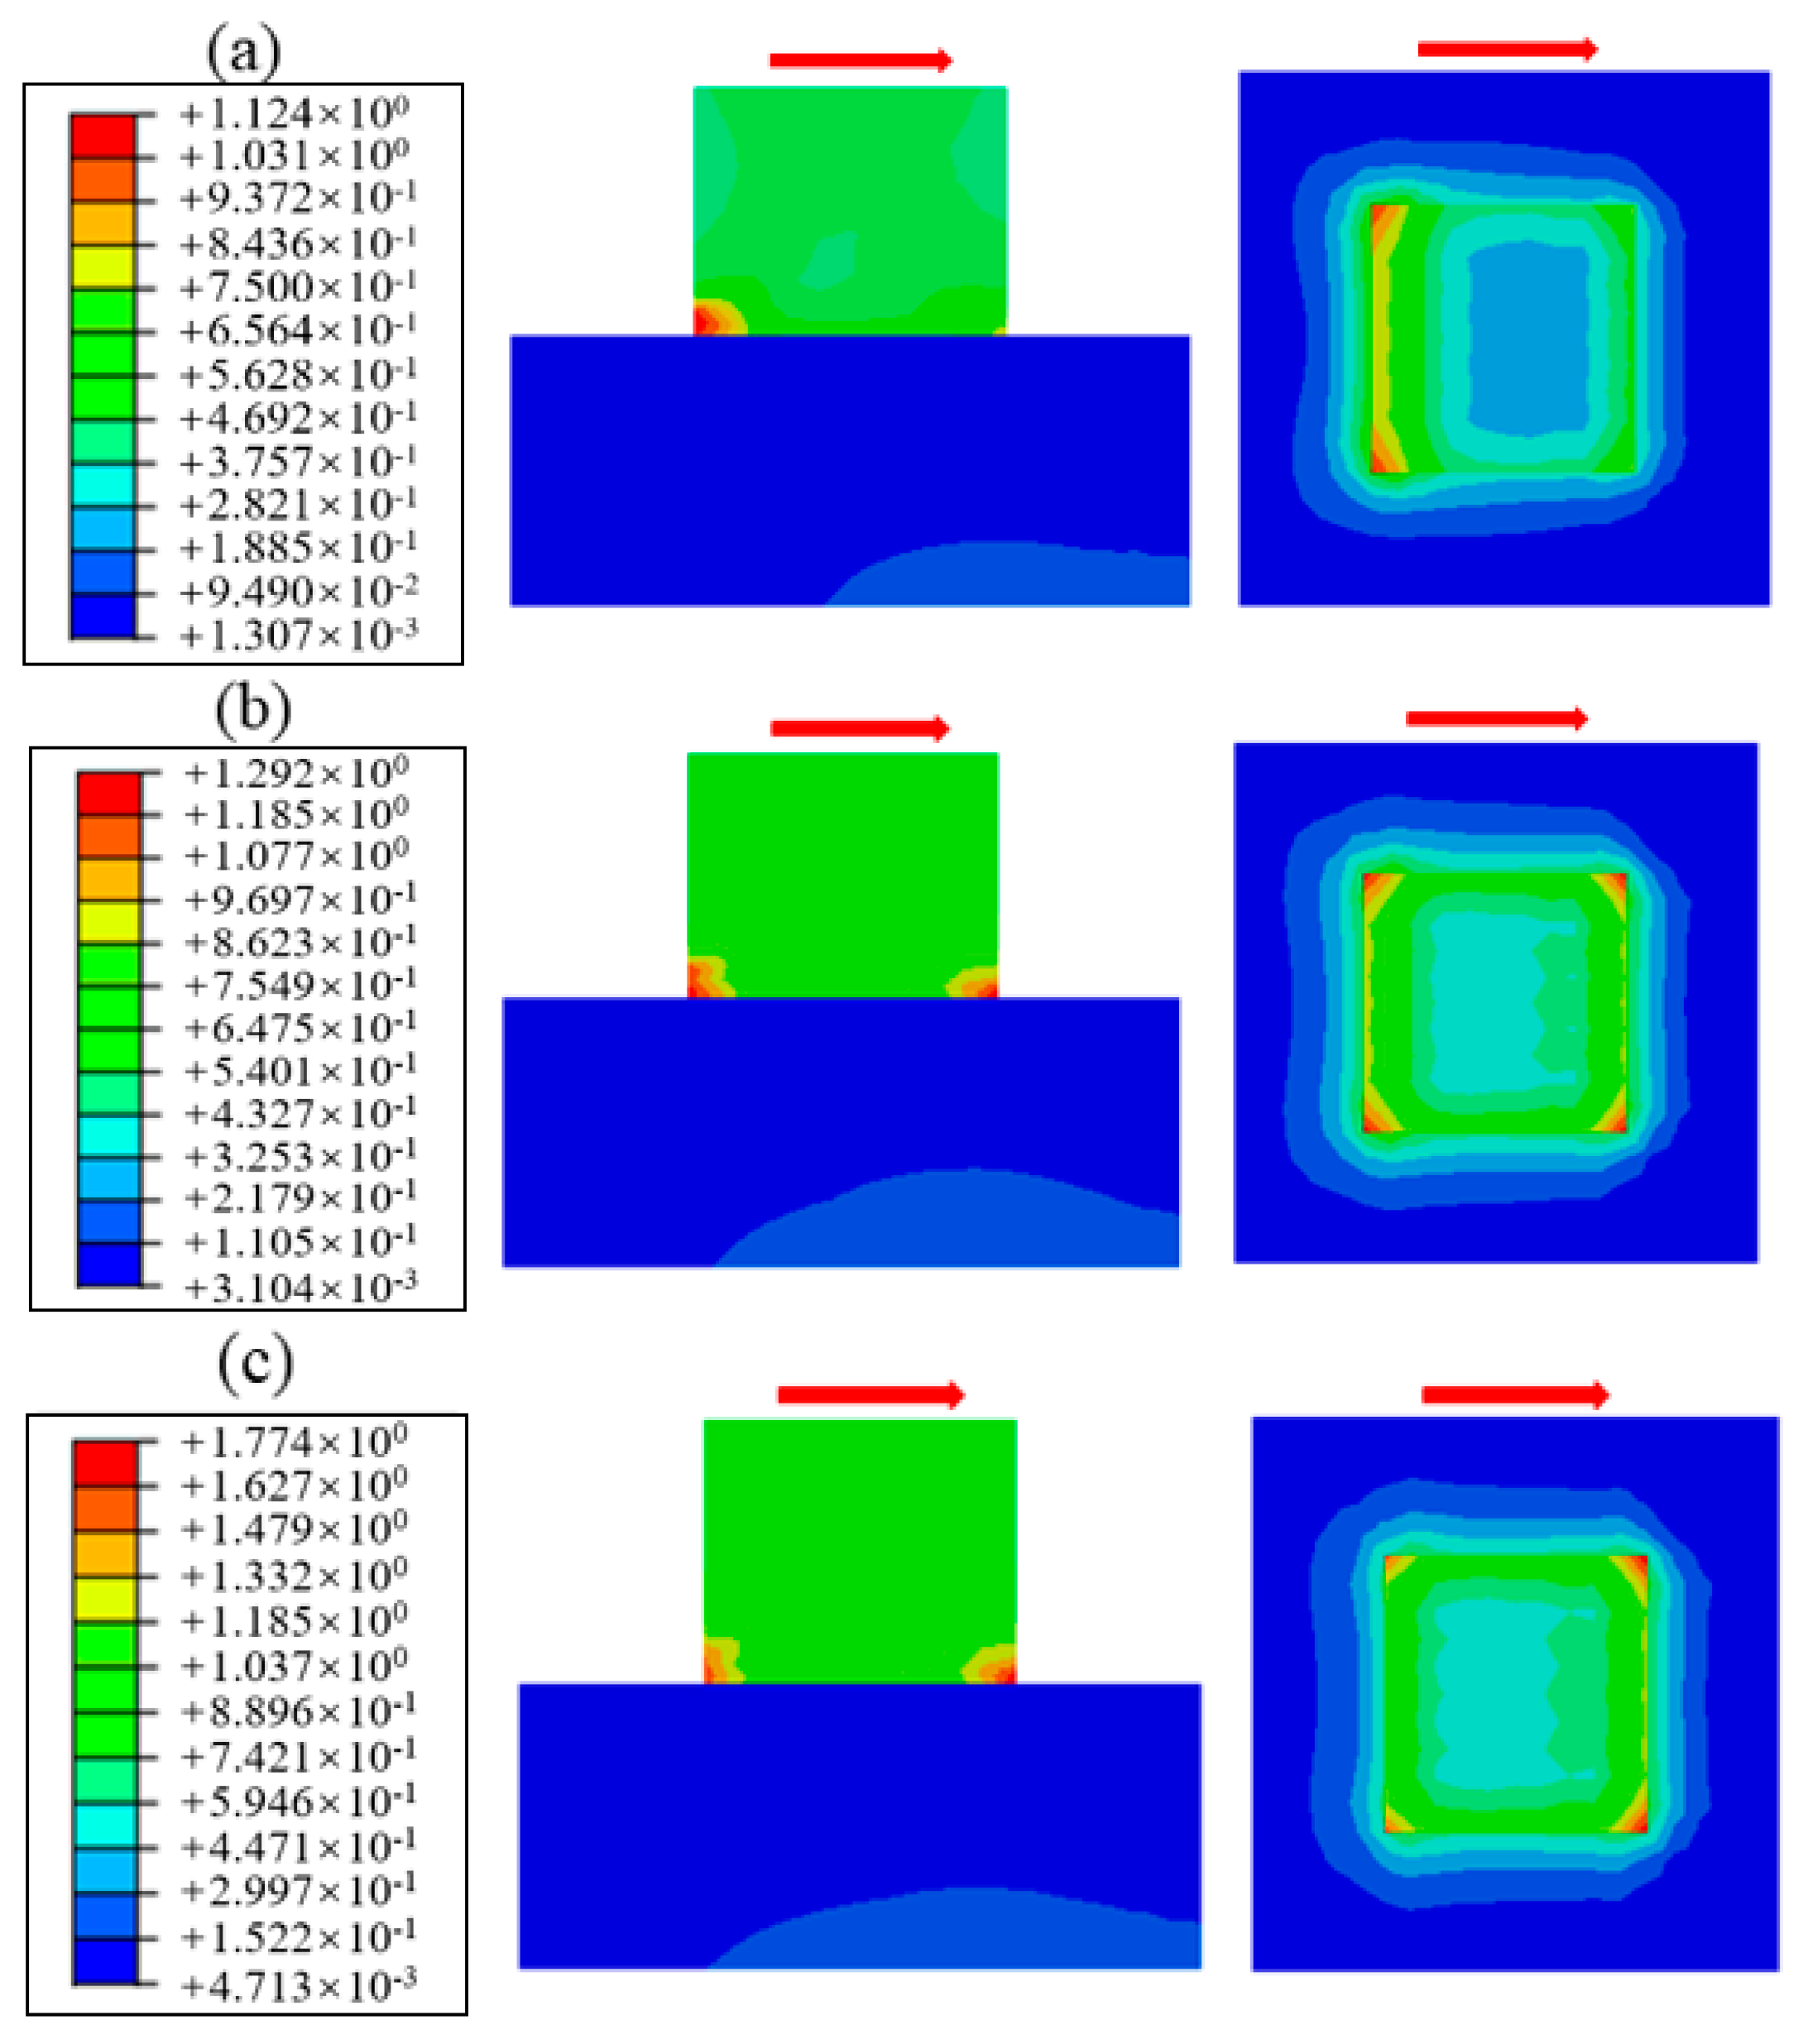
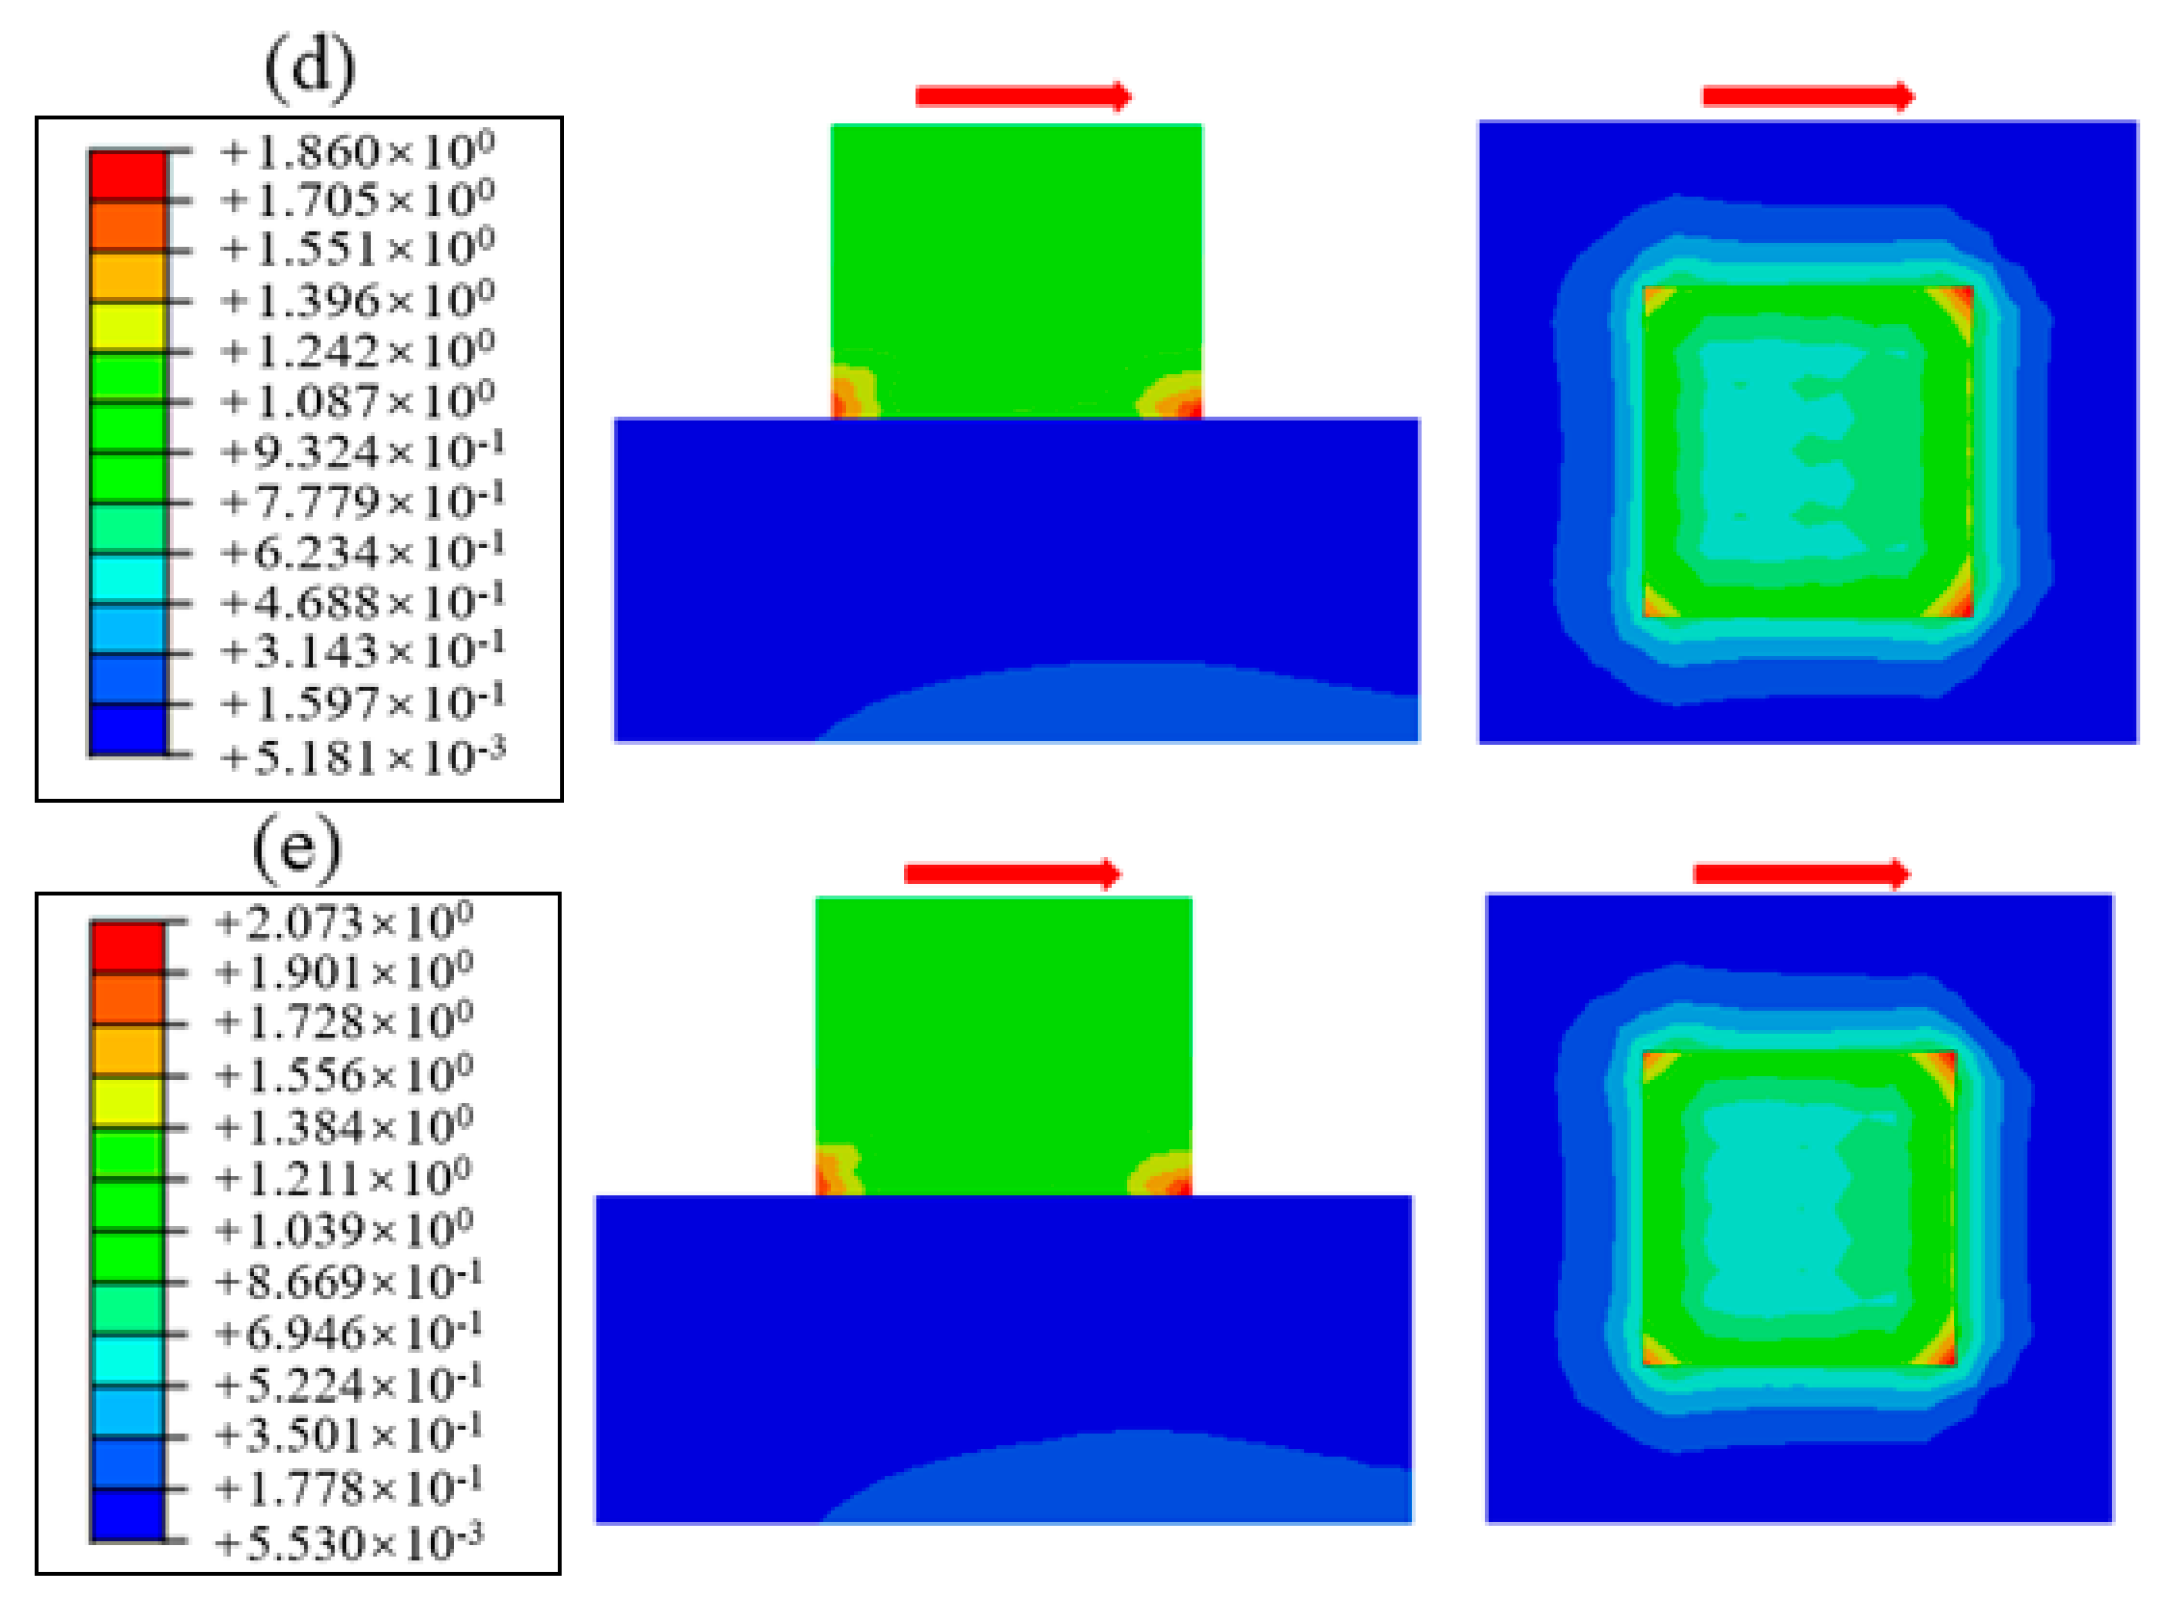
5.2. Failure Analysis of Cementation Surface
5.2.1. Failure Criterion
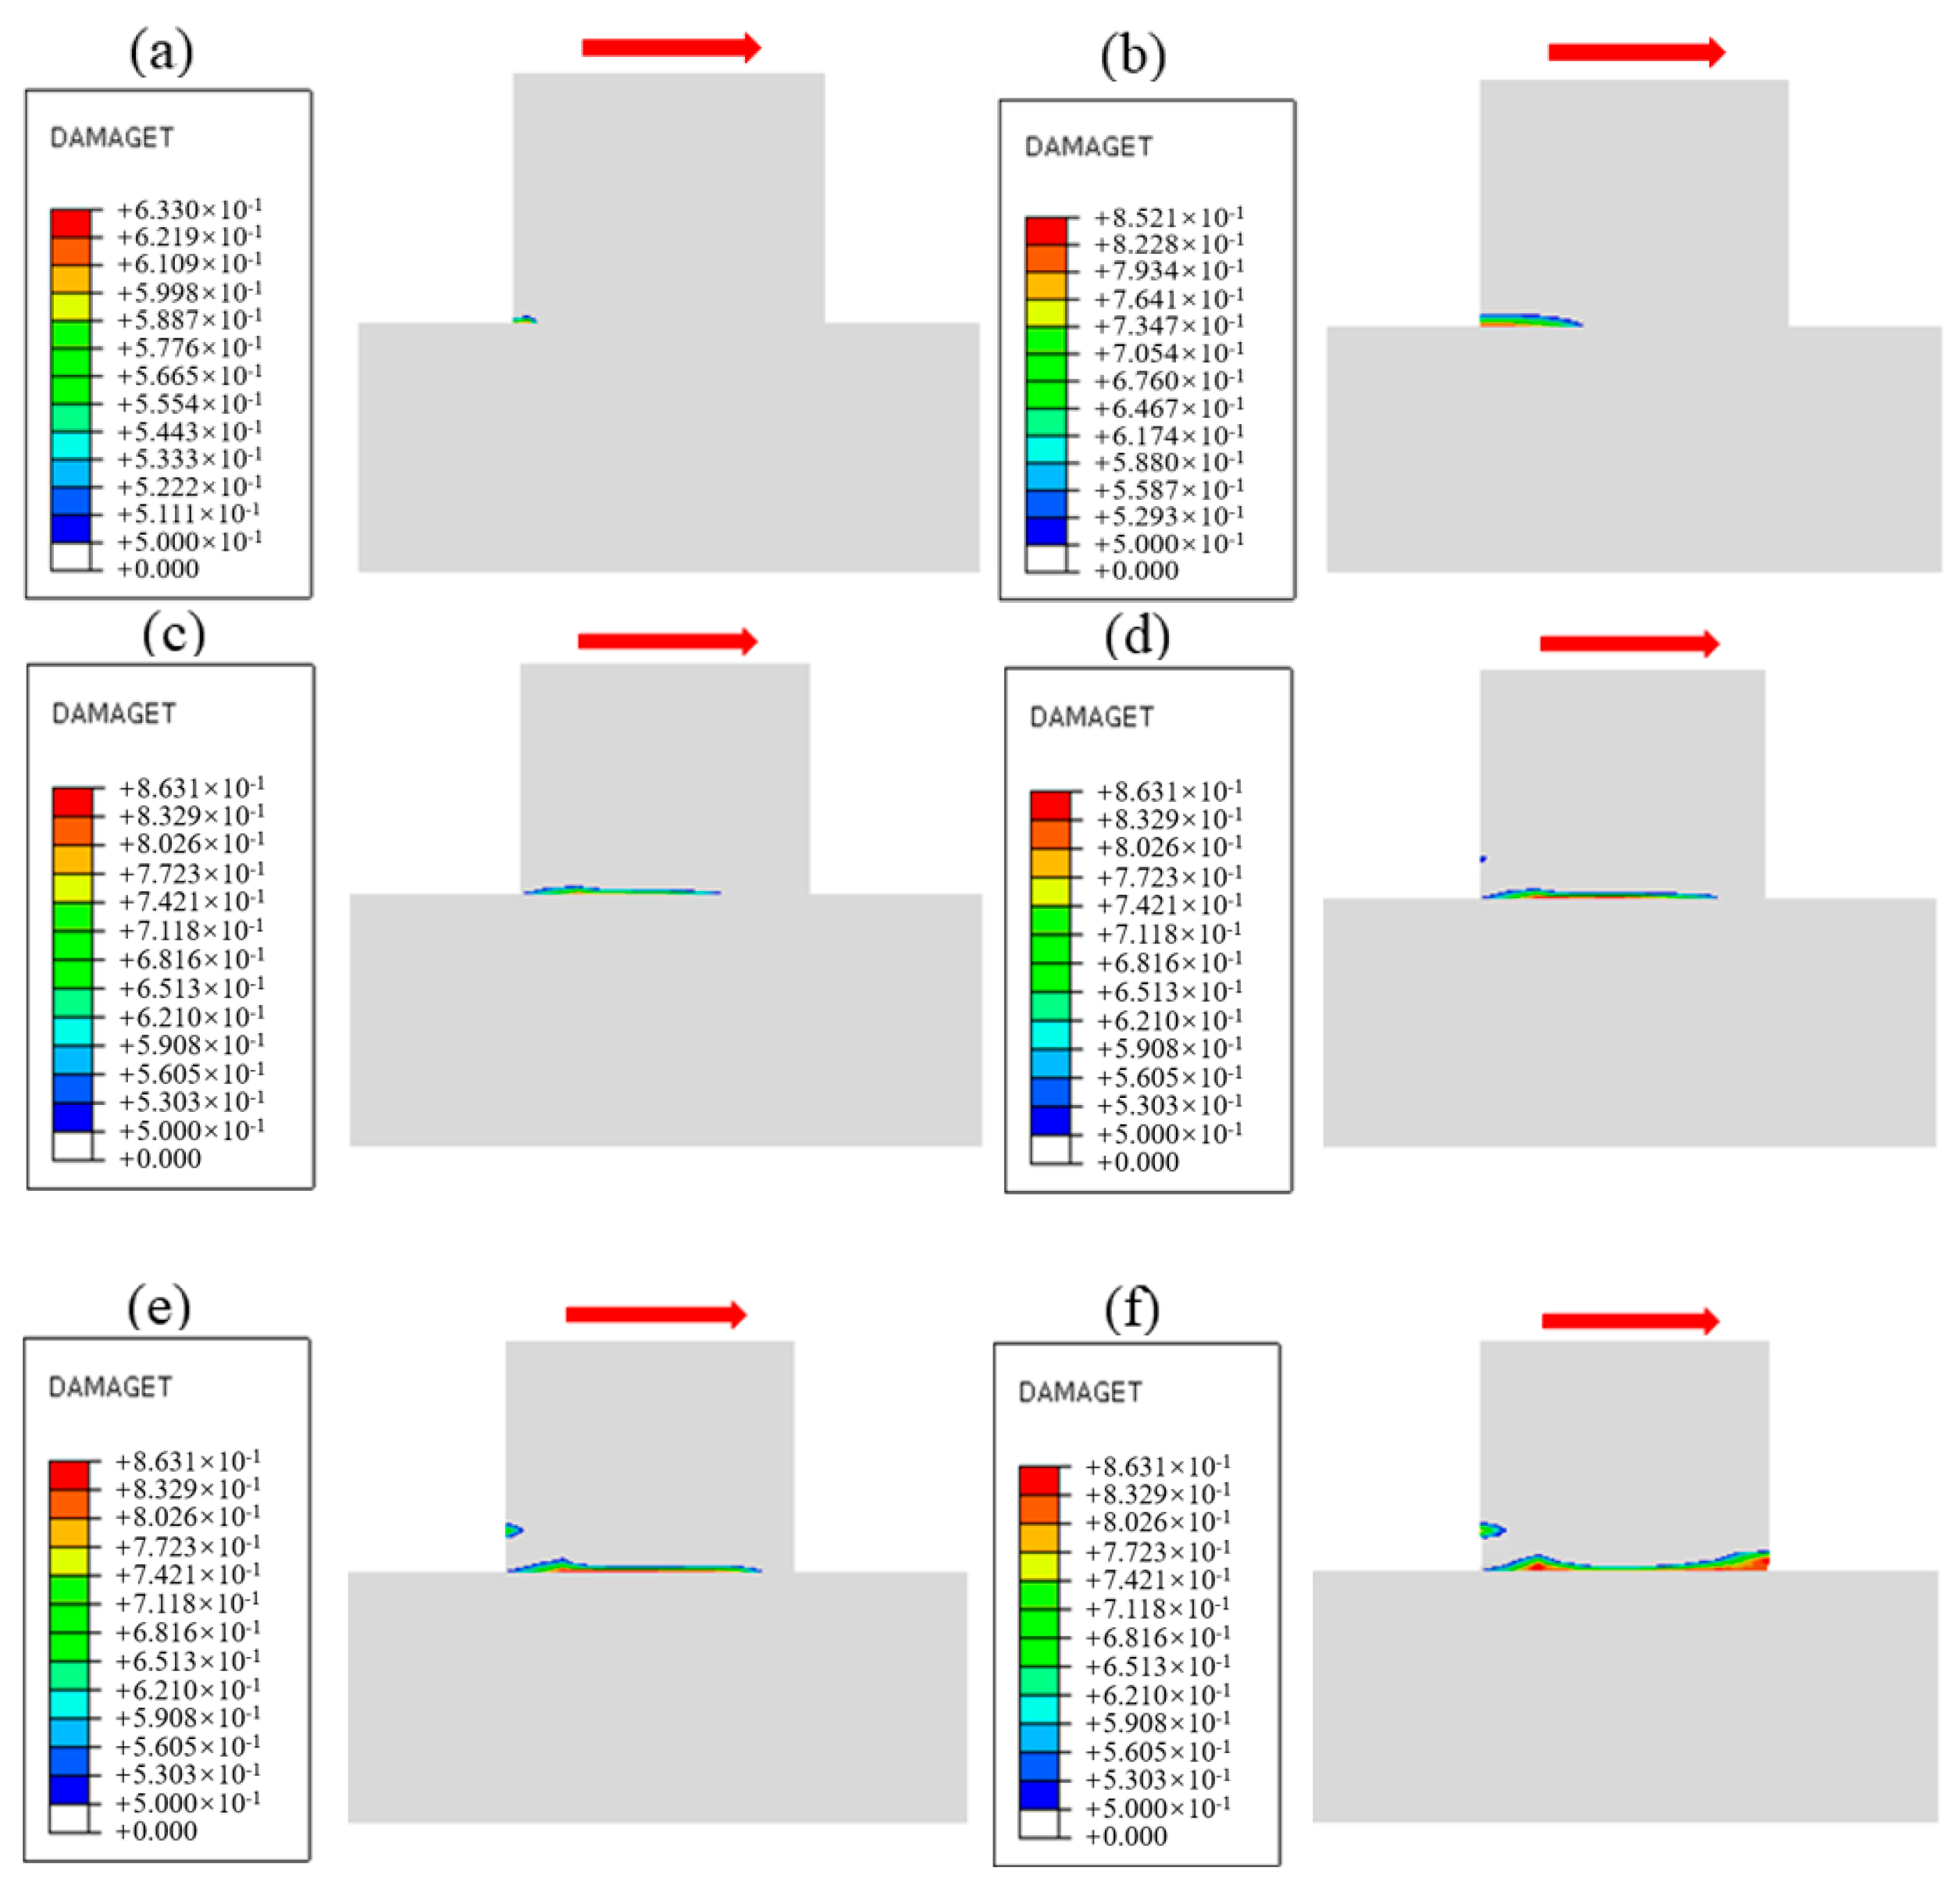
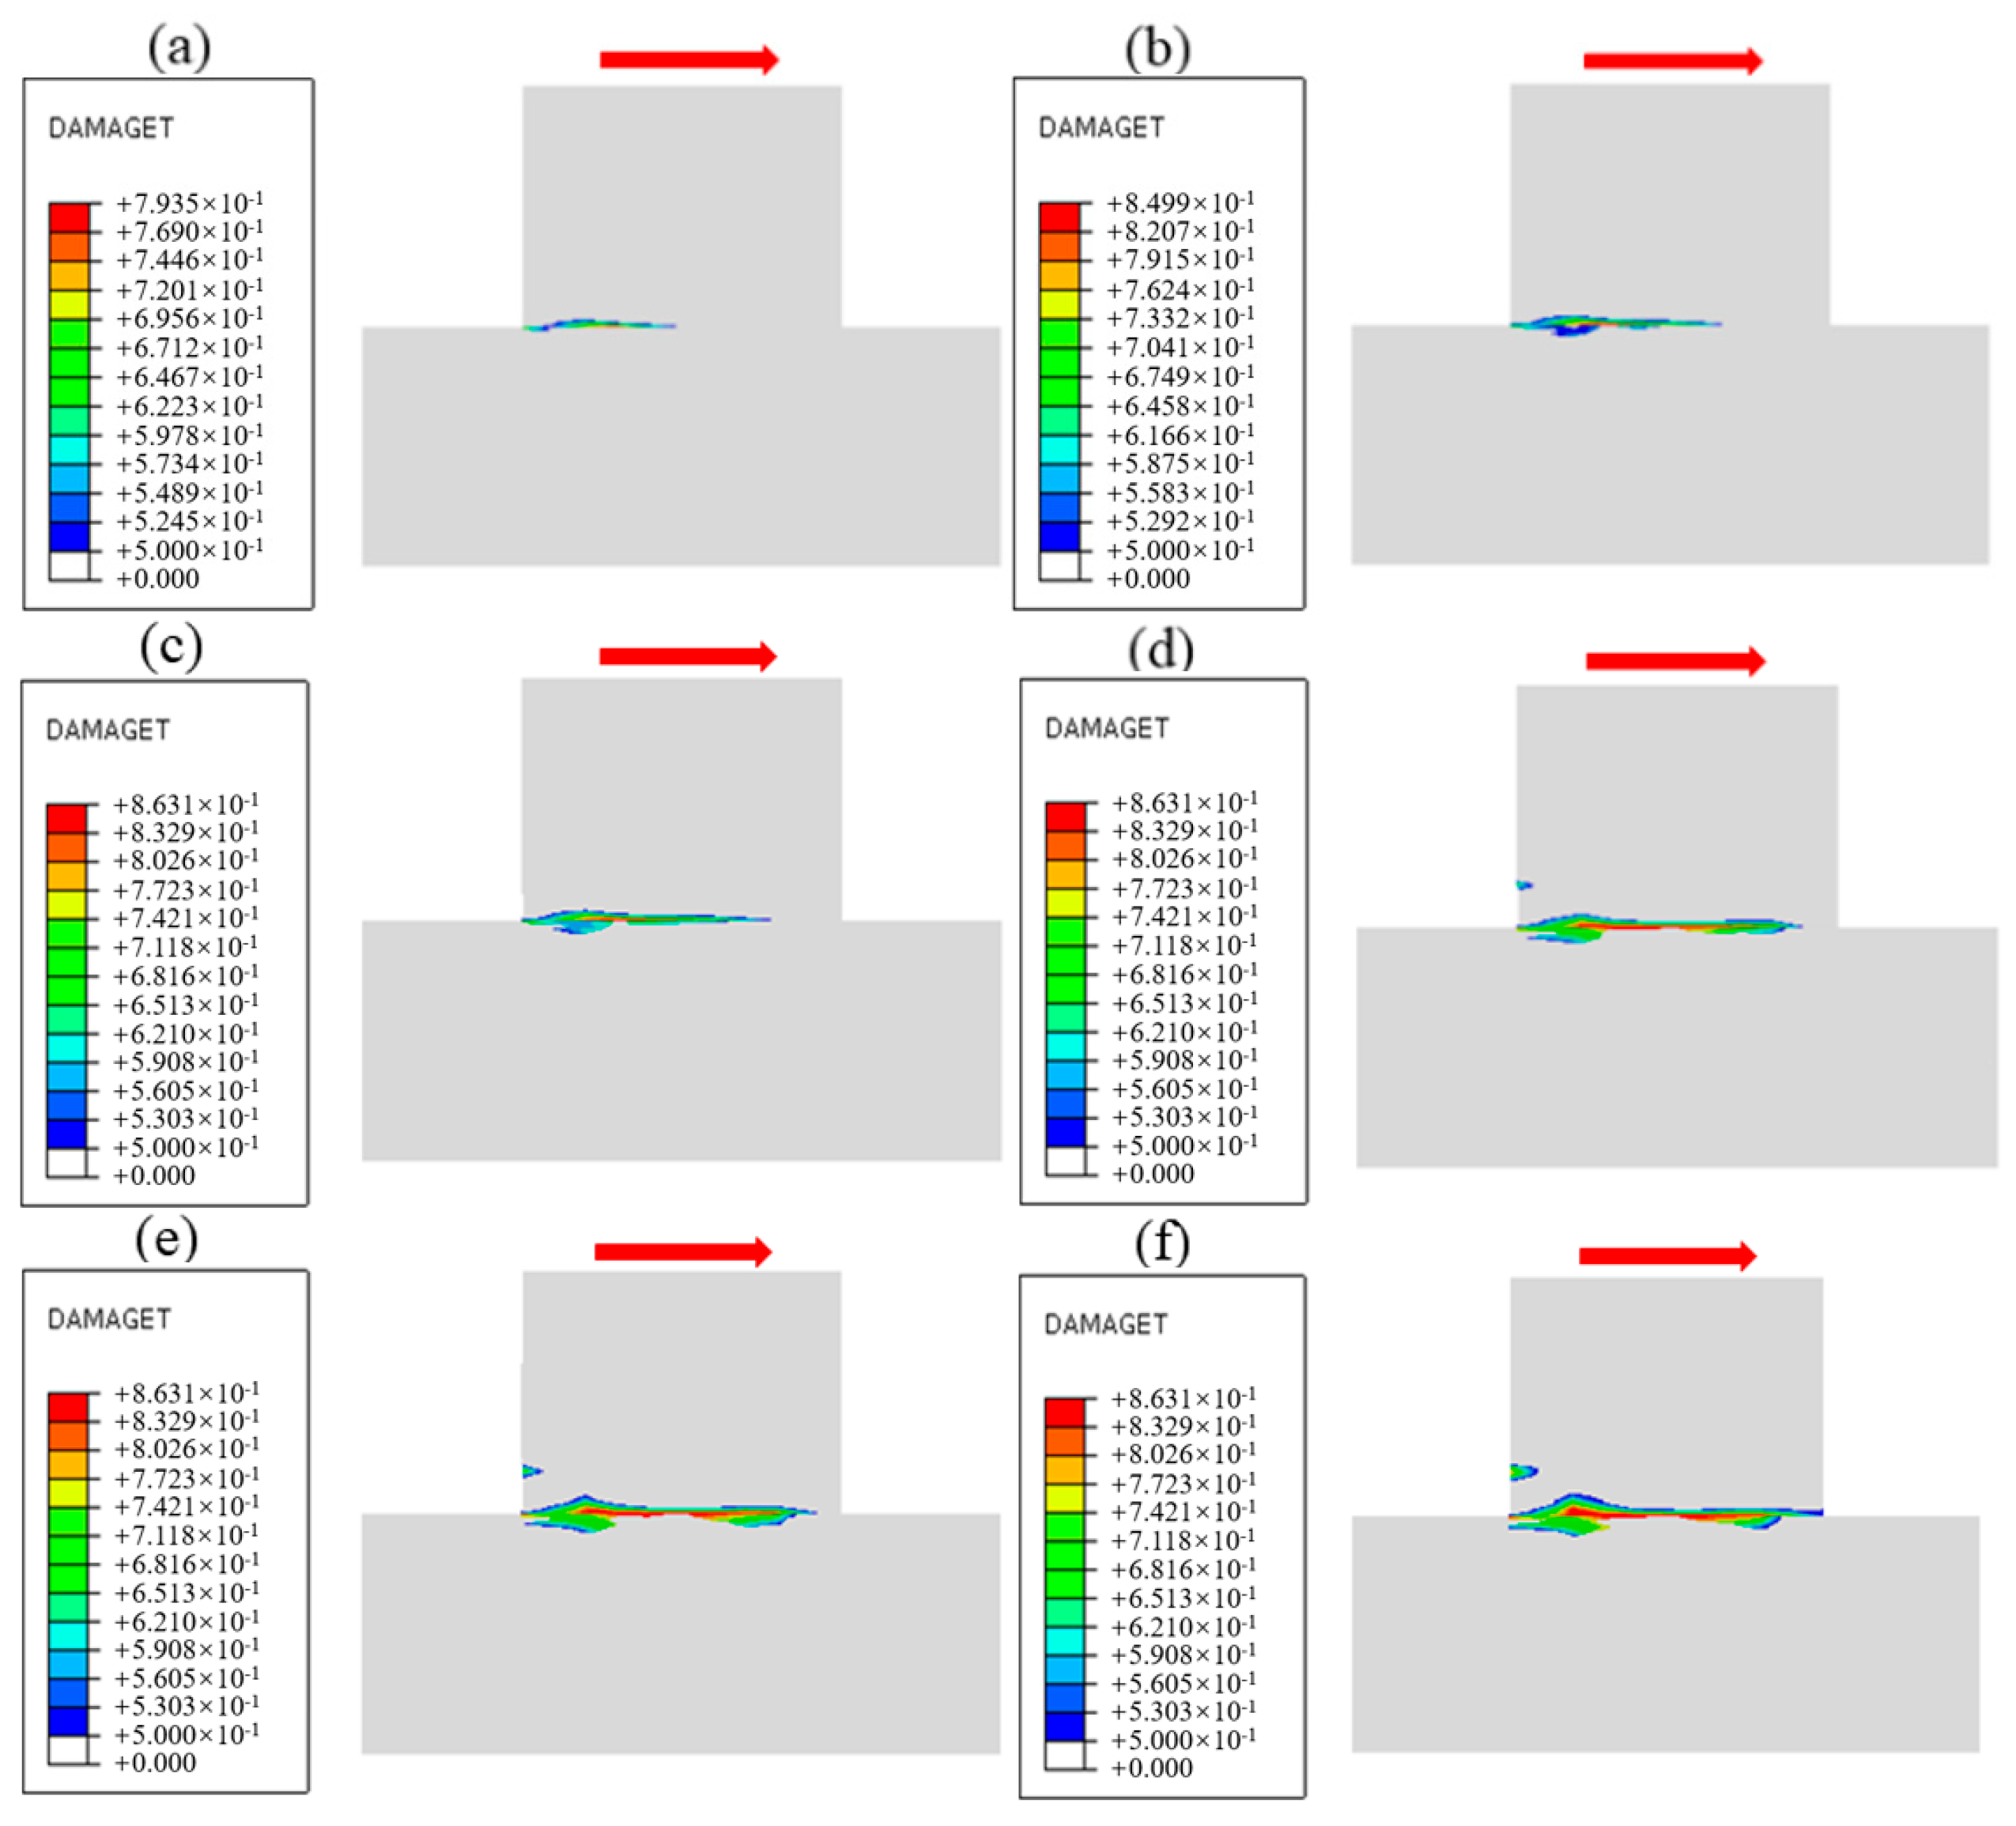
5.2.2. Analysis of Failure Process
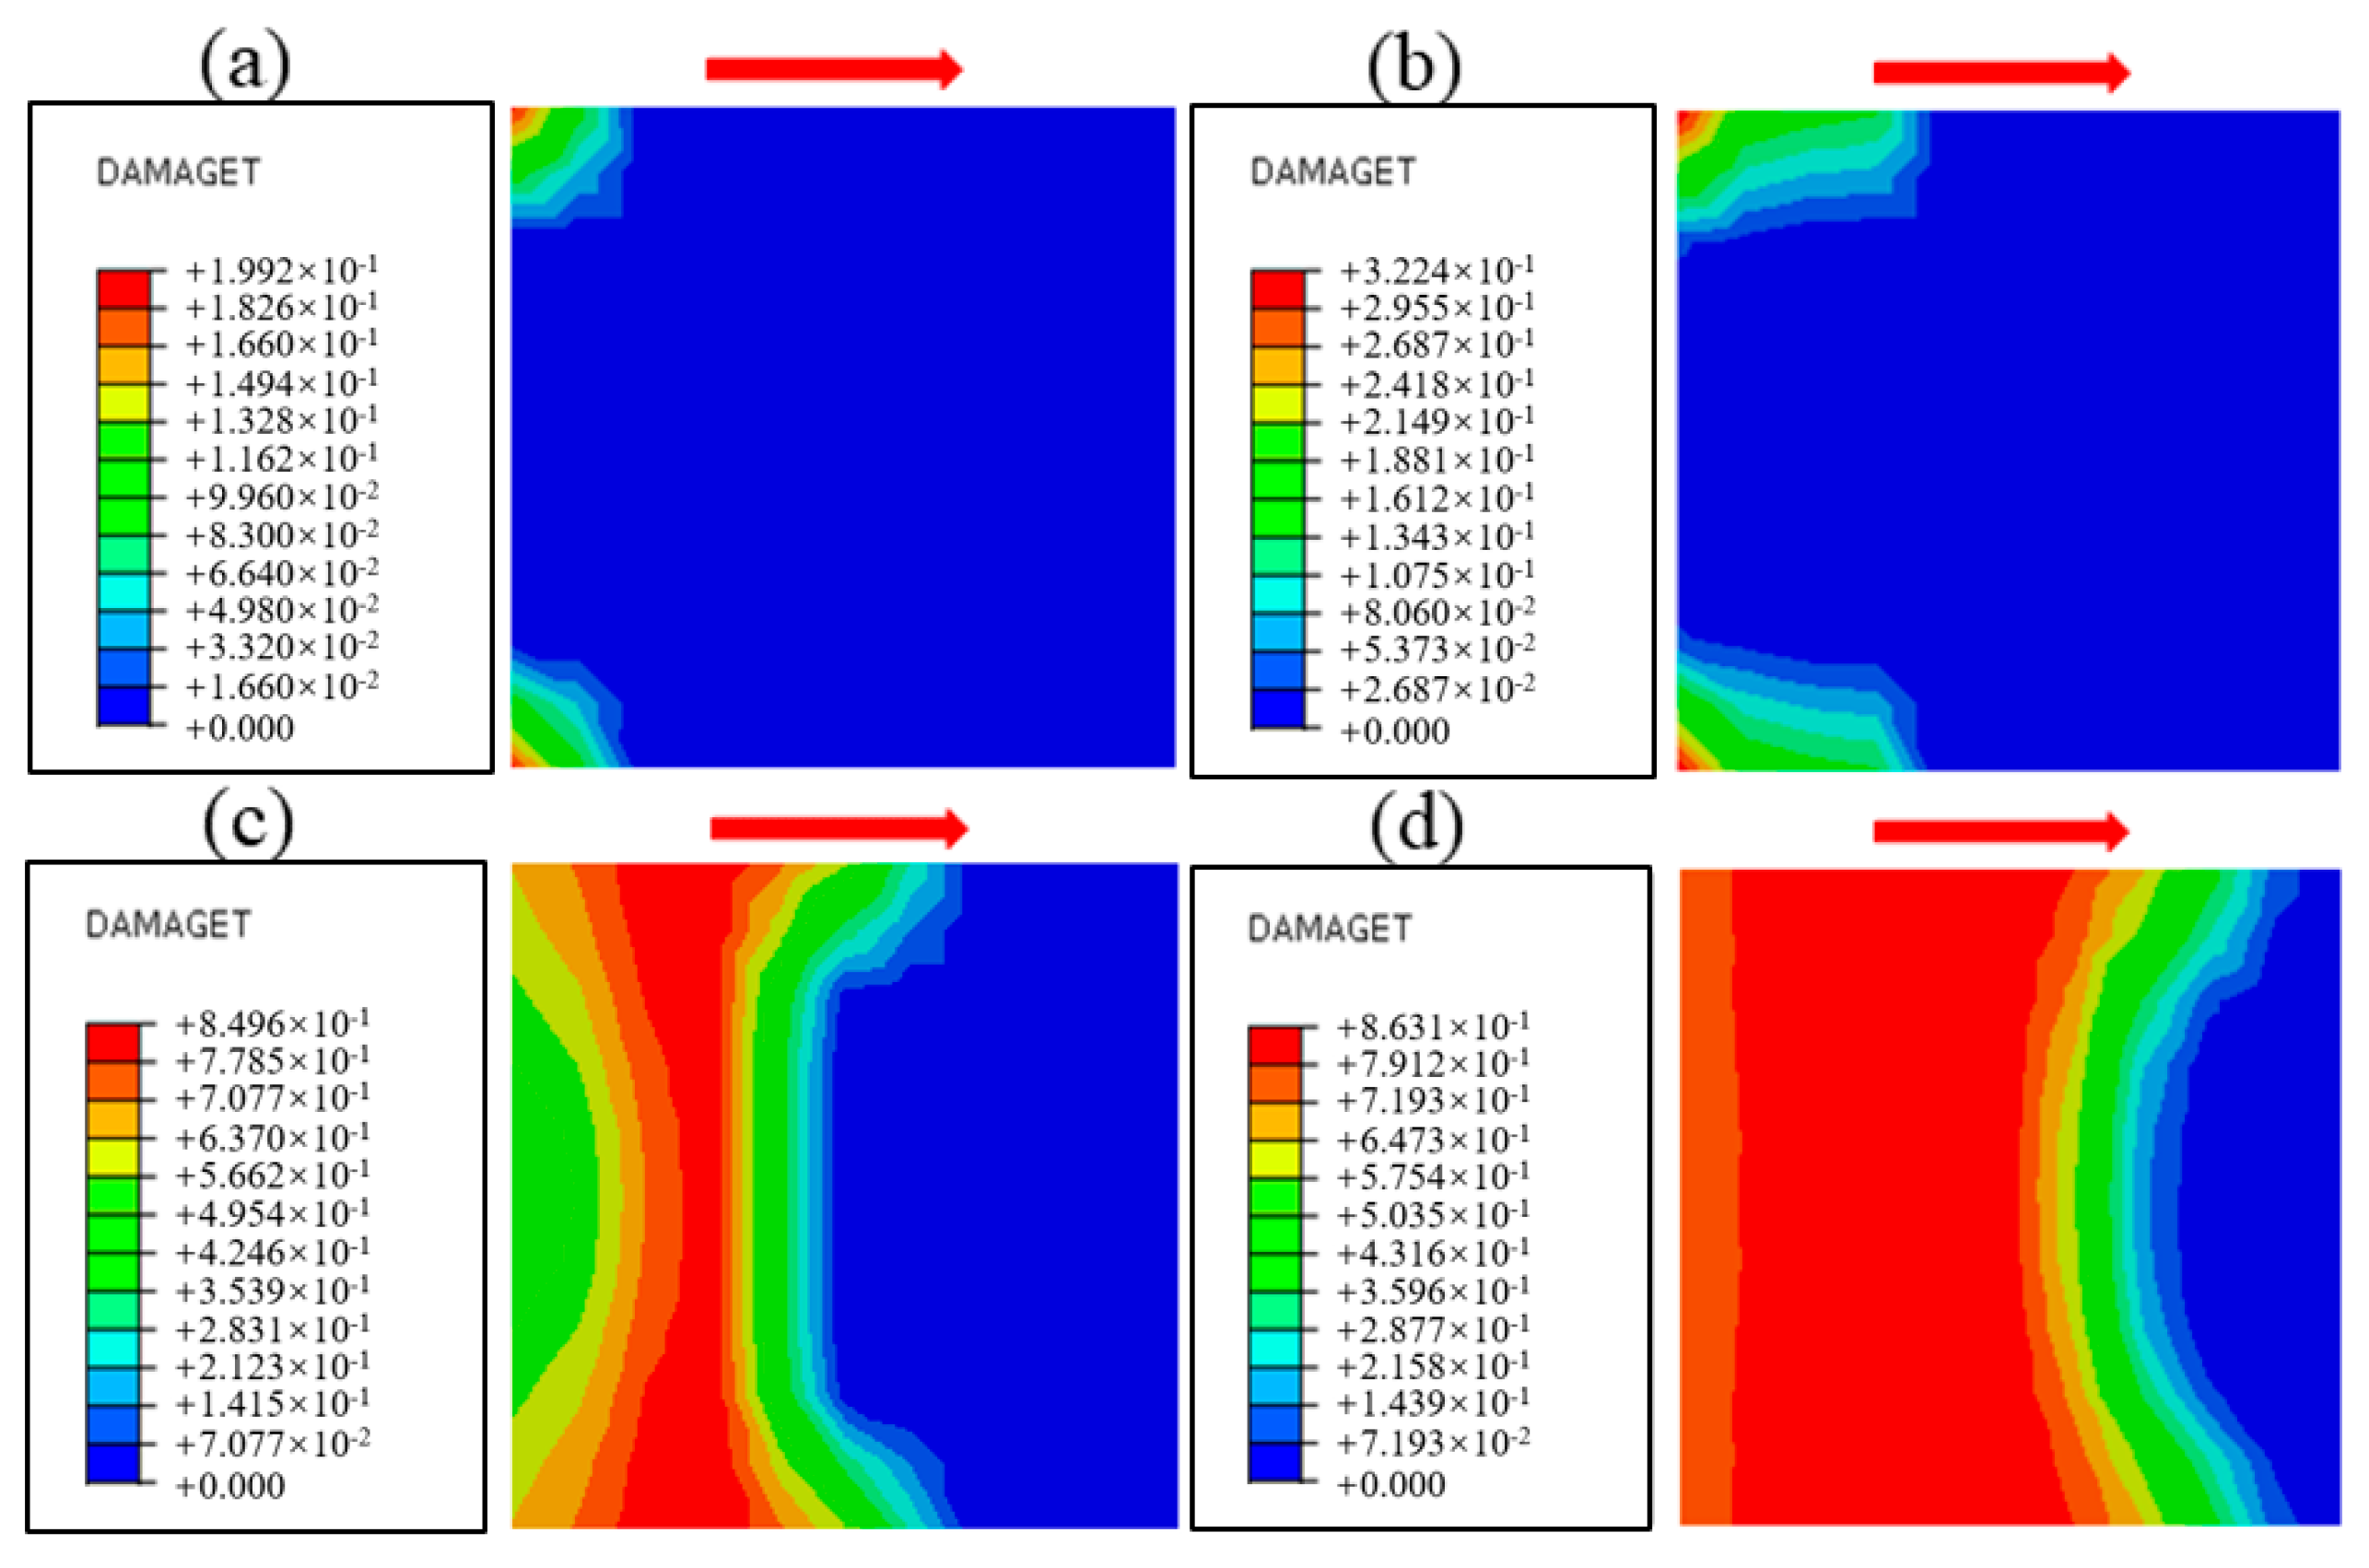
5.3. Analysis of Failure Mode and Failure Mechanism
6. Conclusions
- (1)
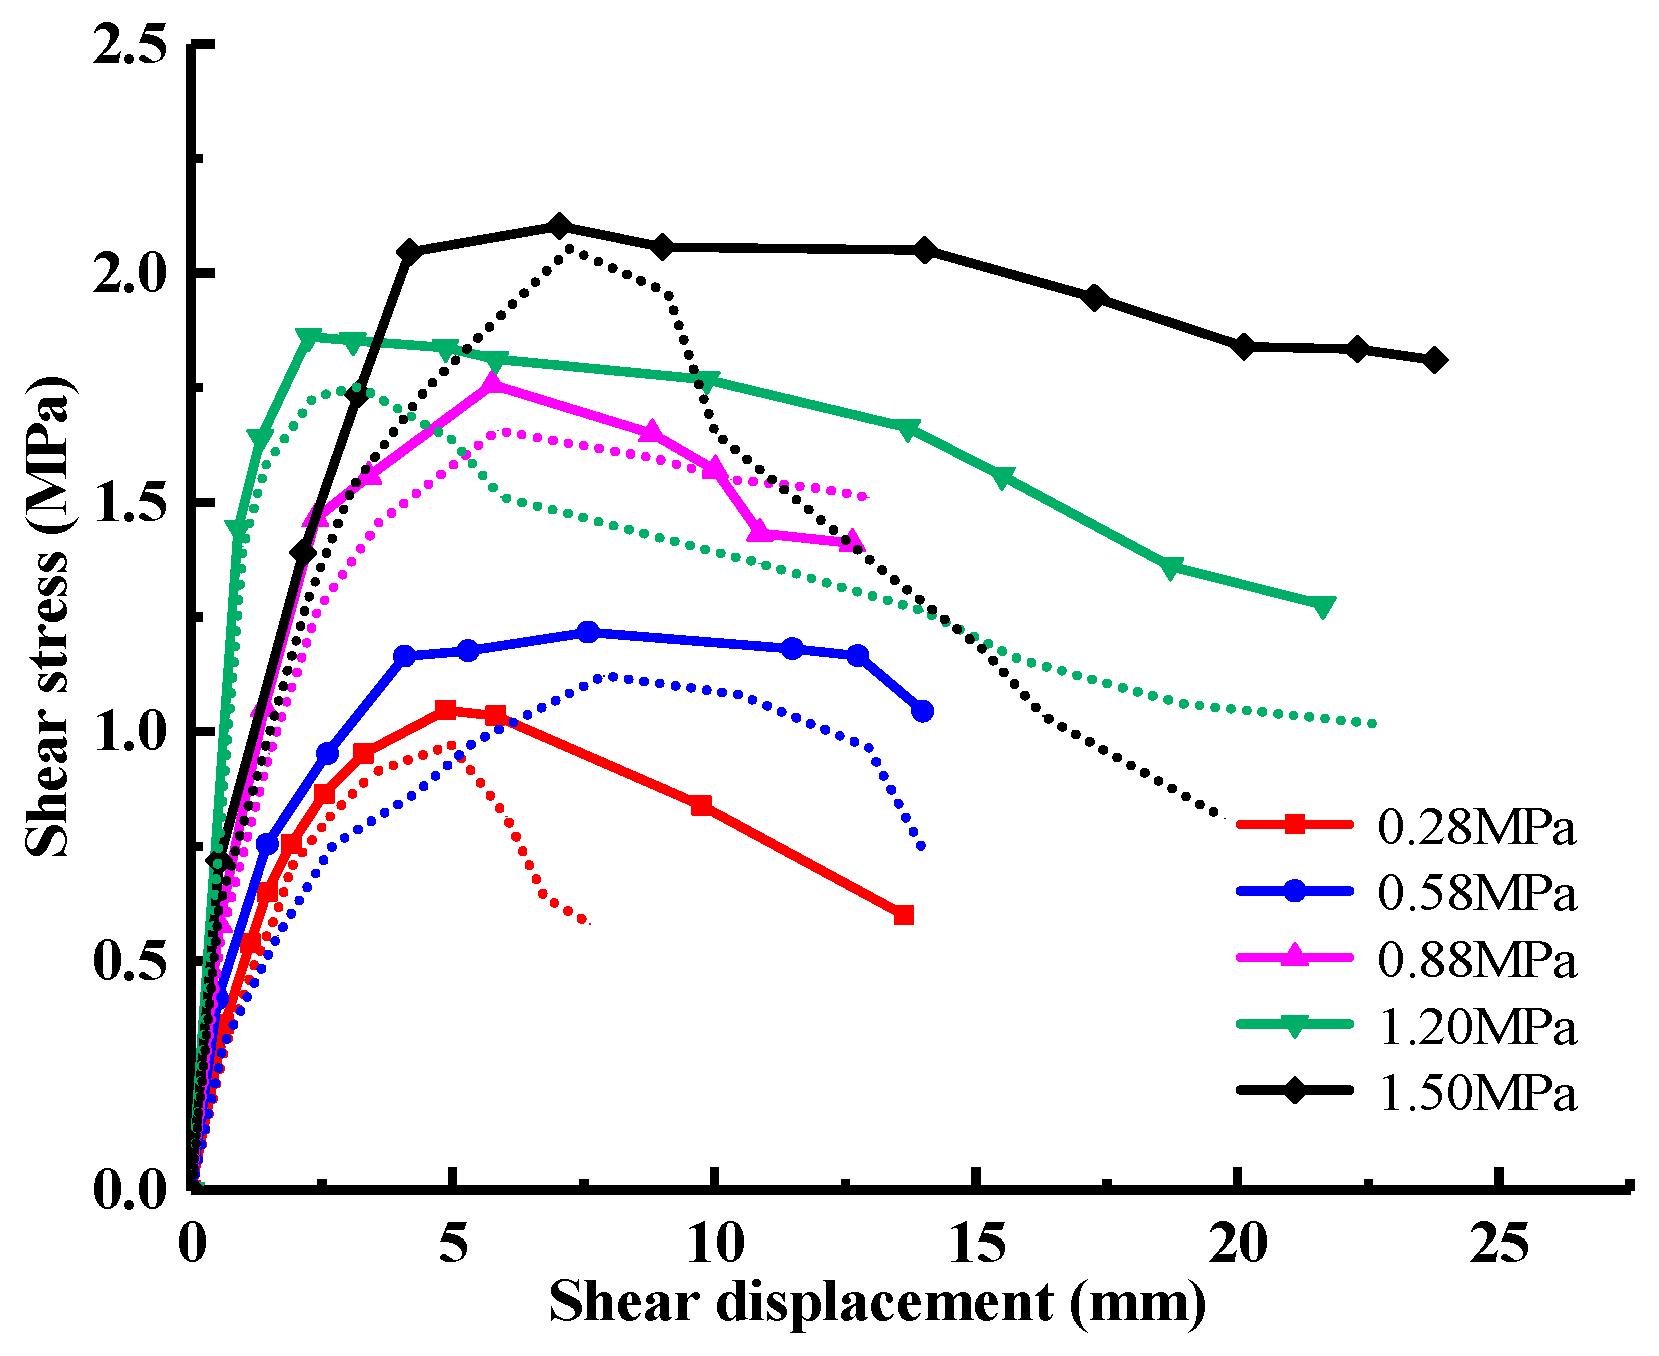
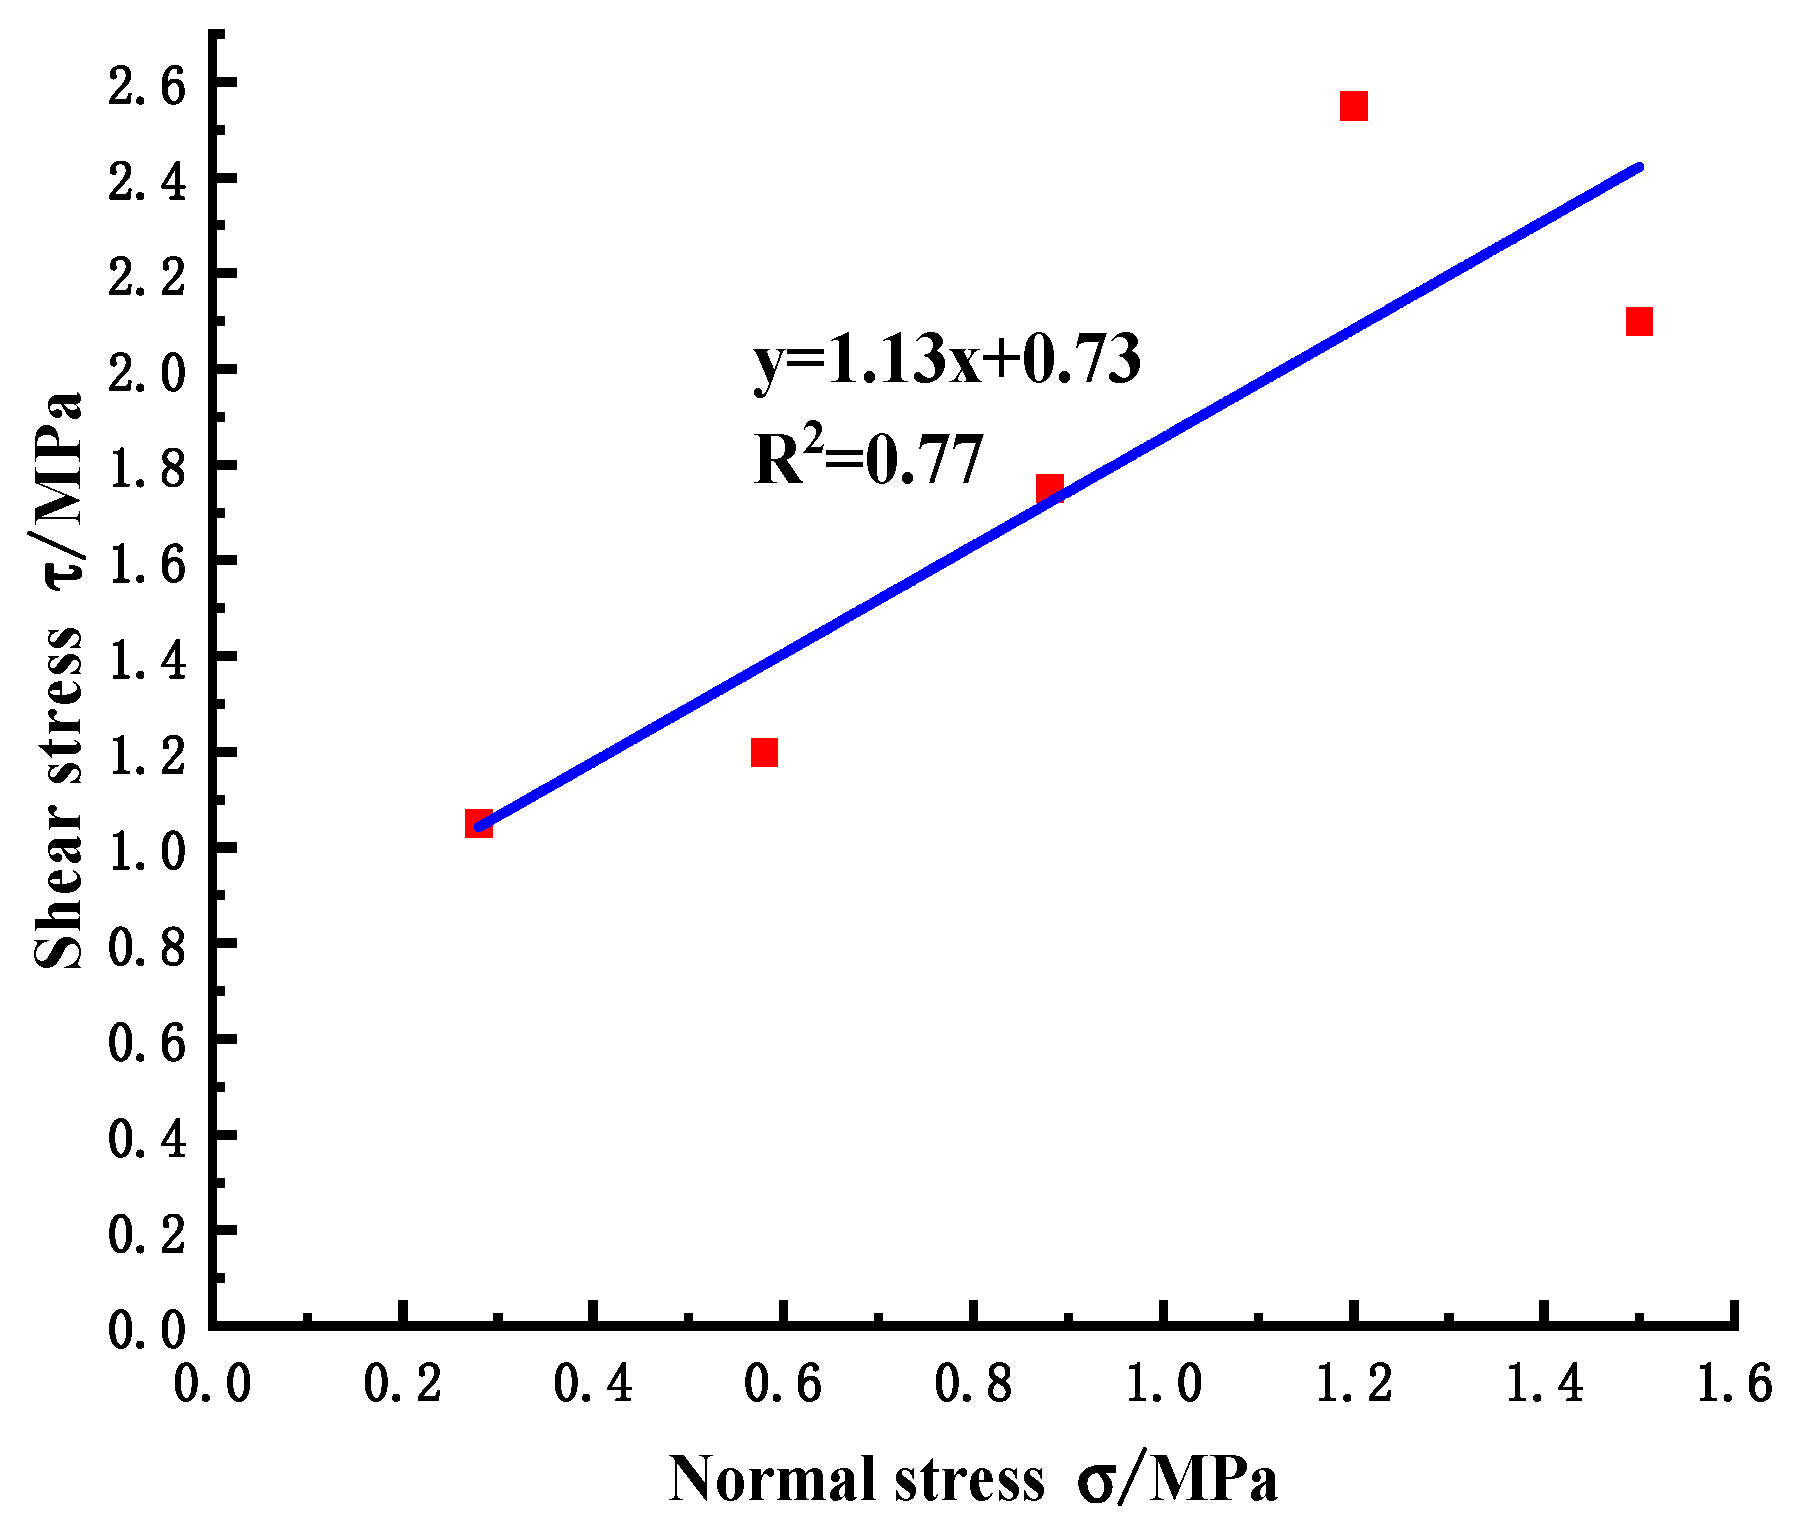
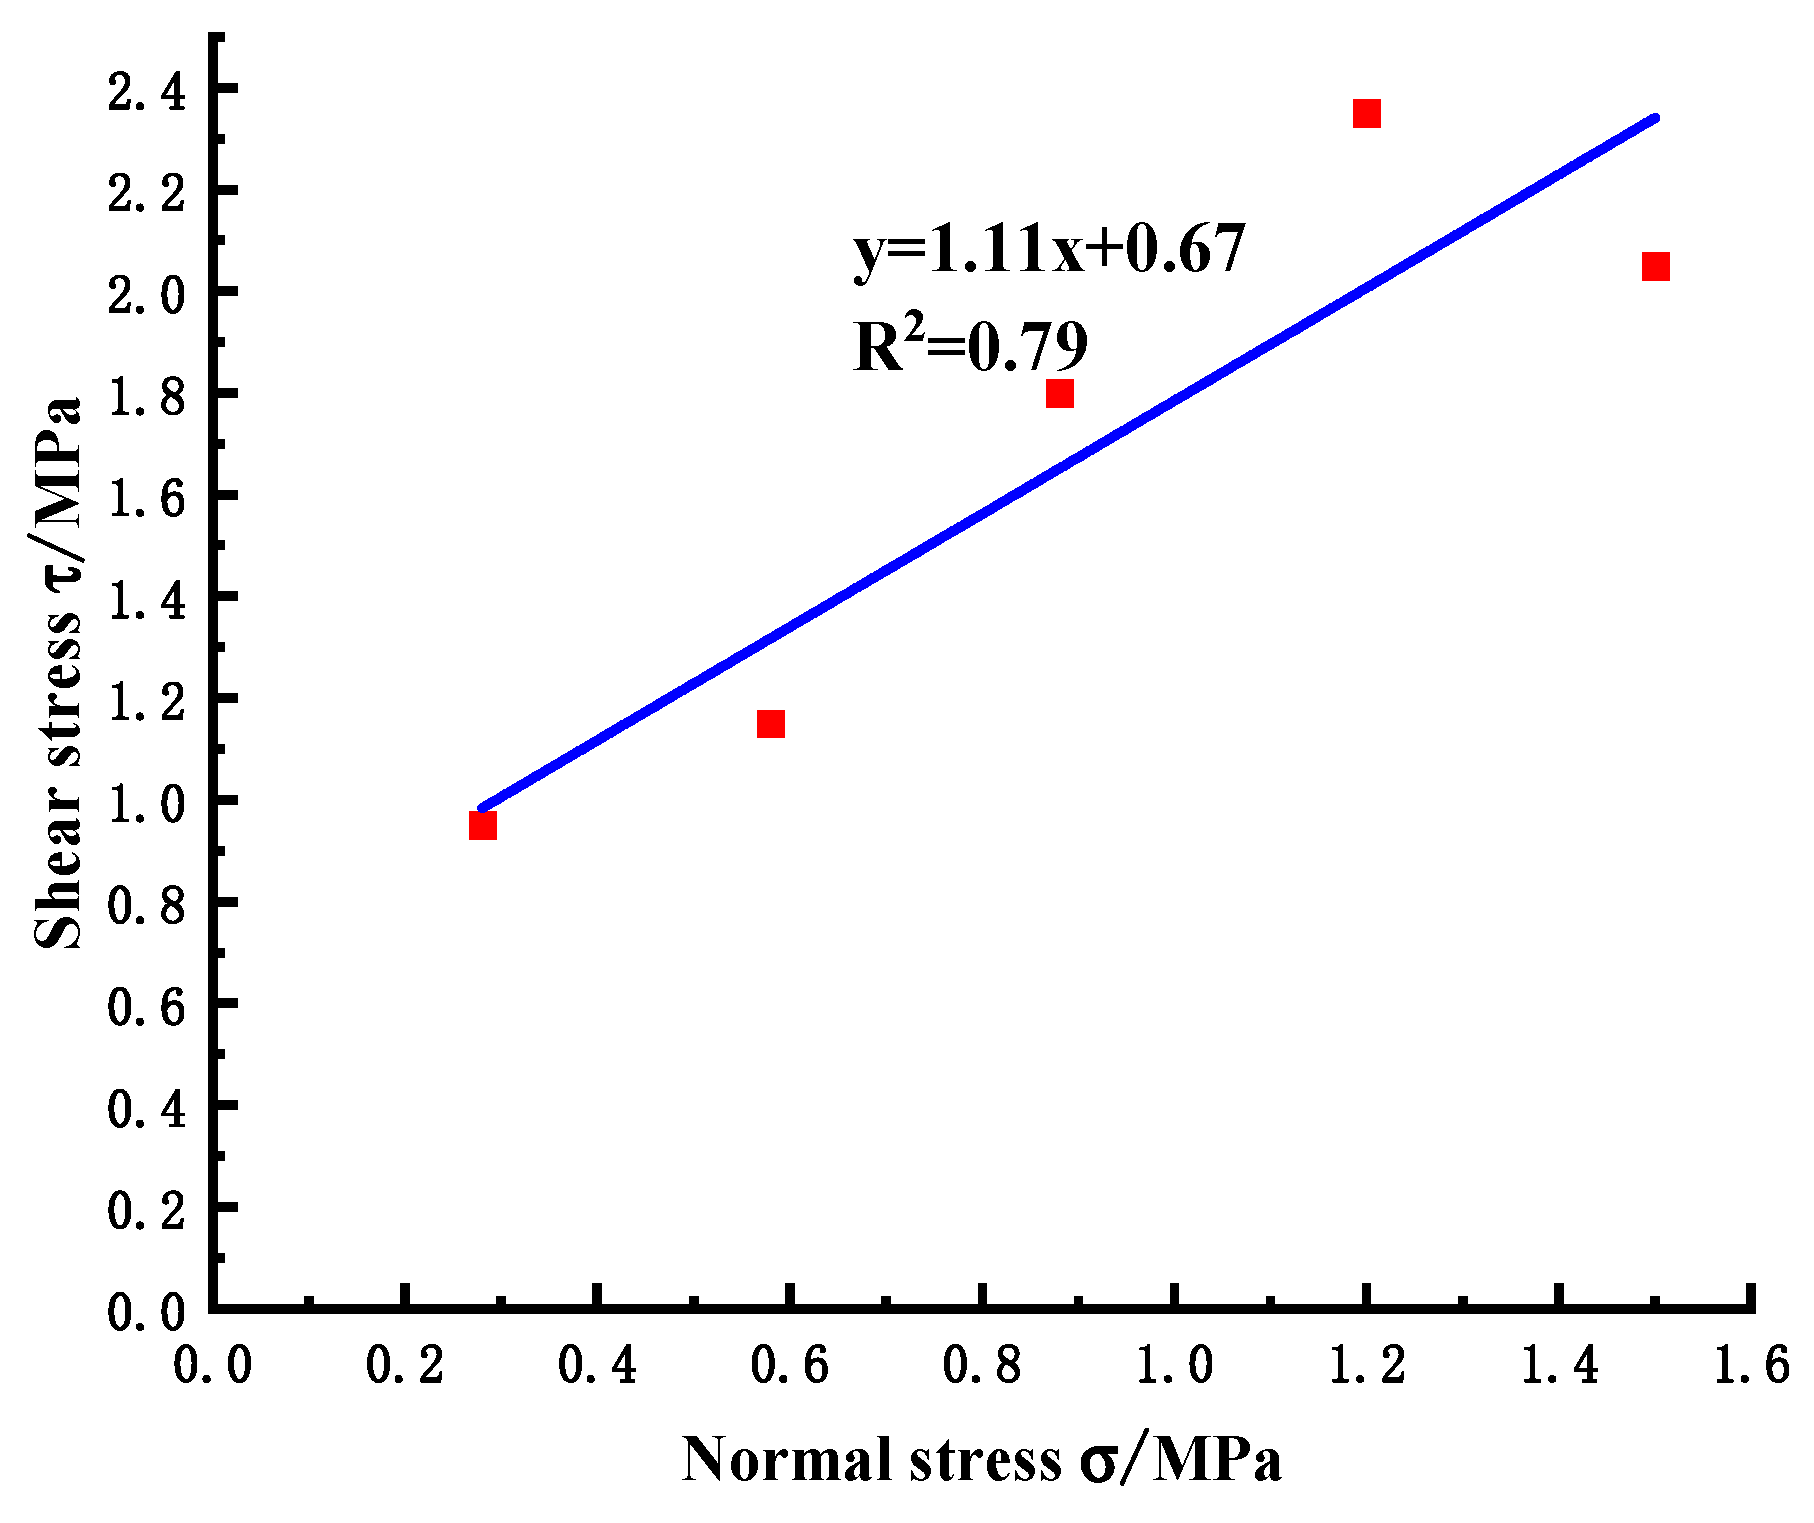
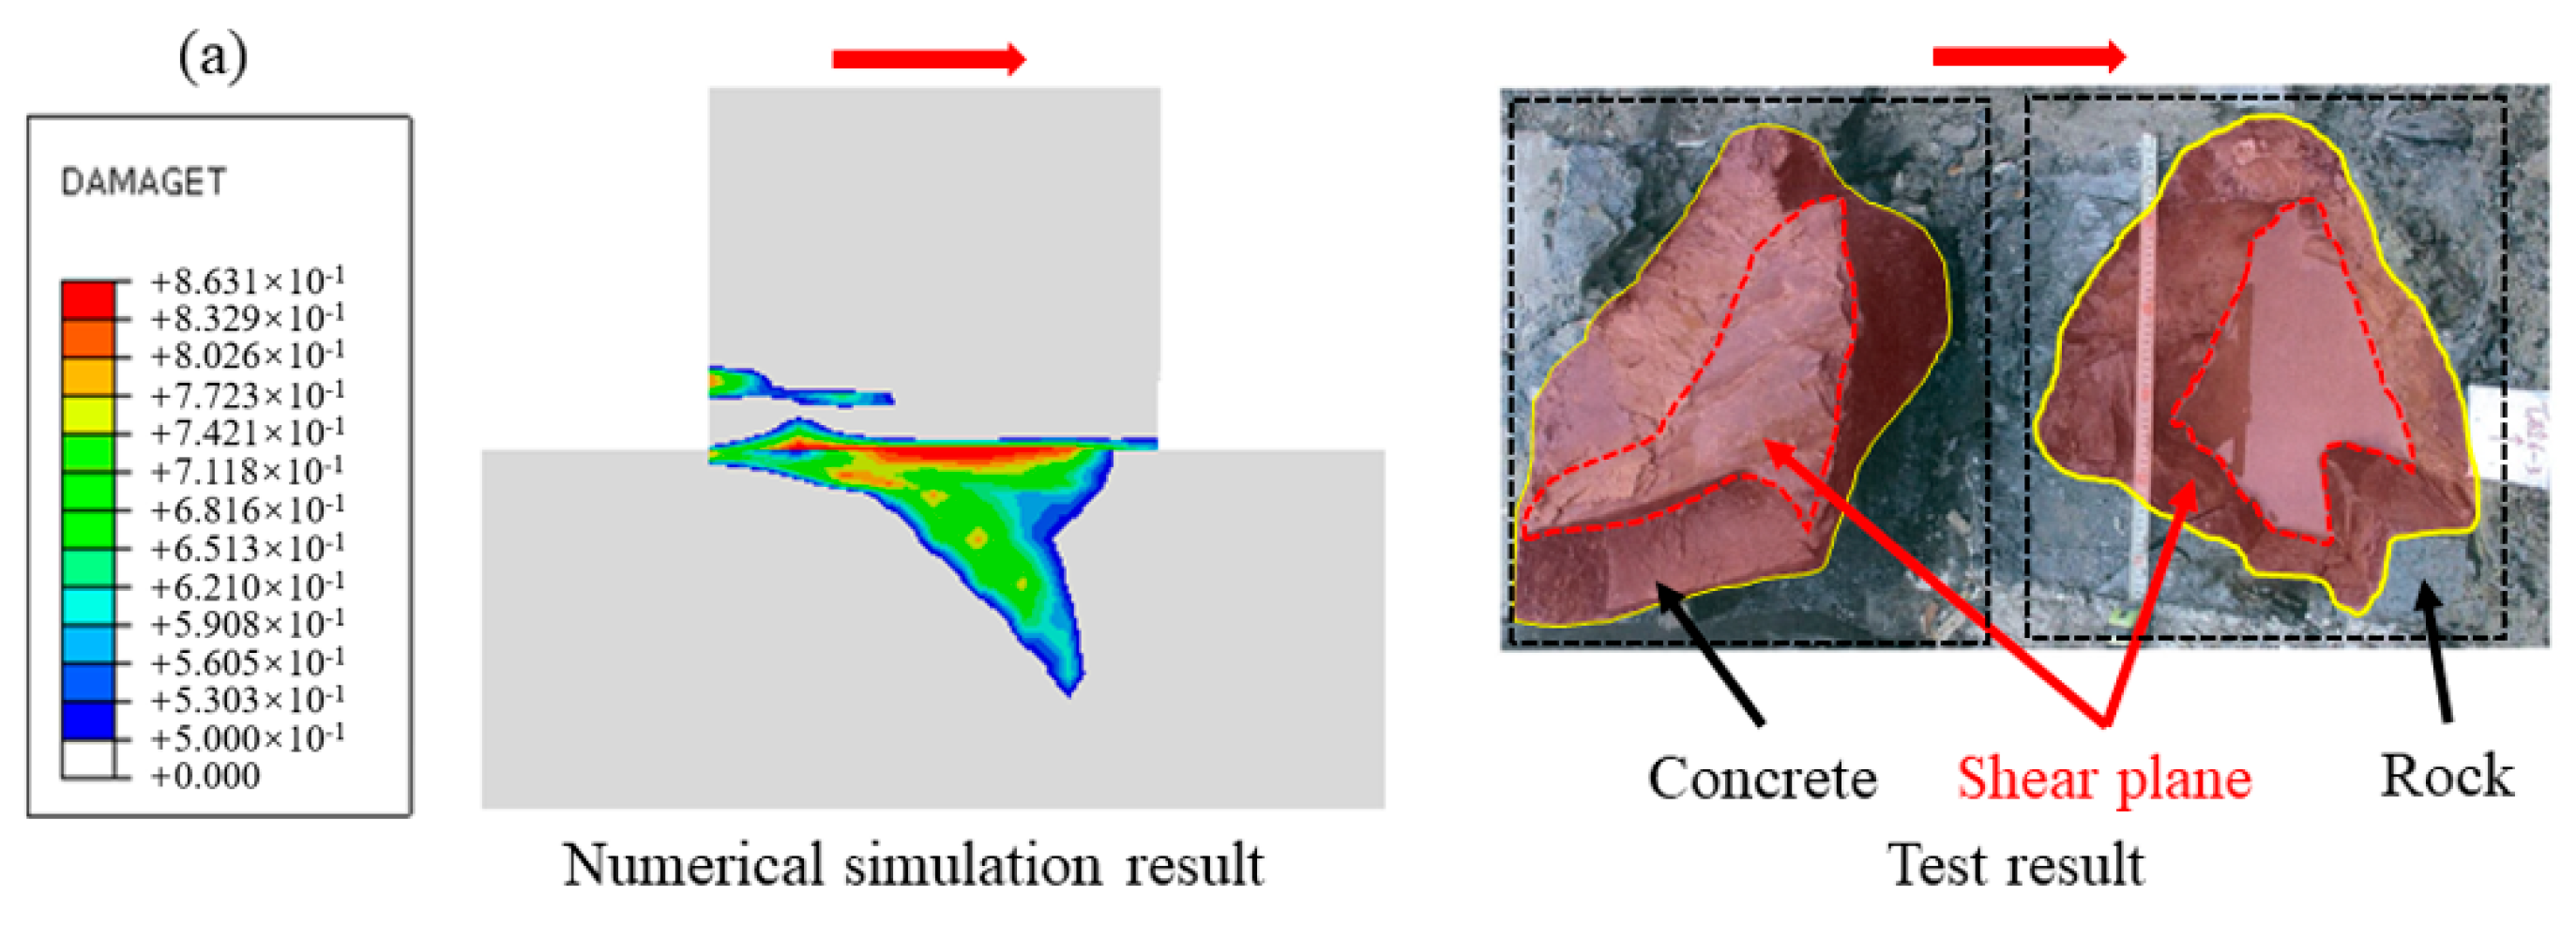
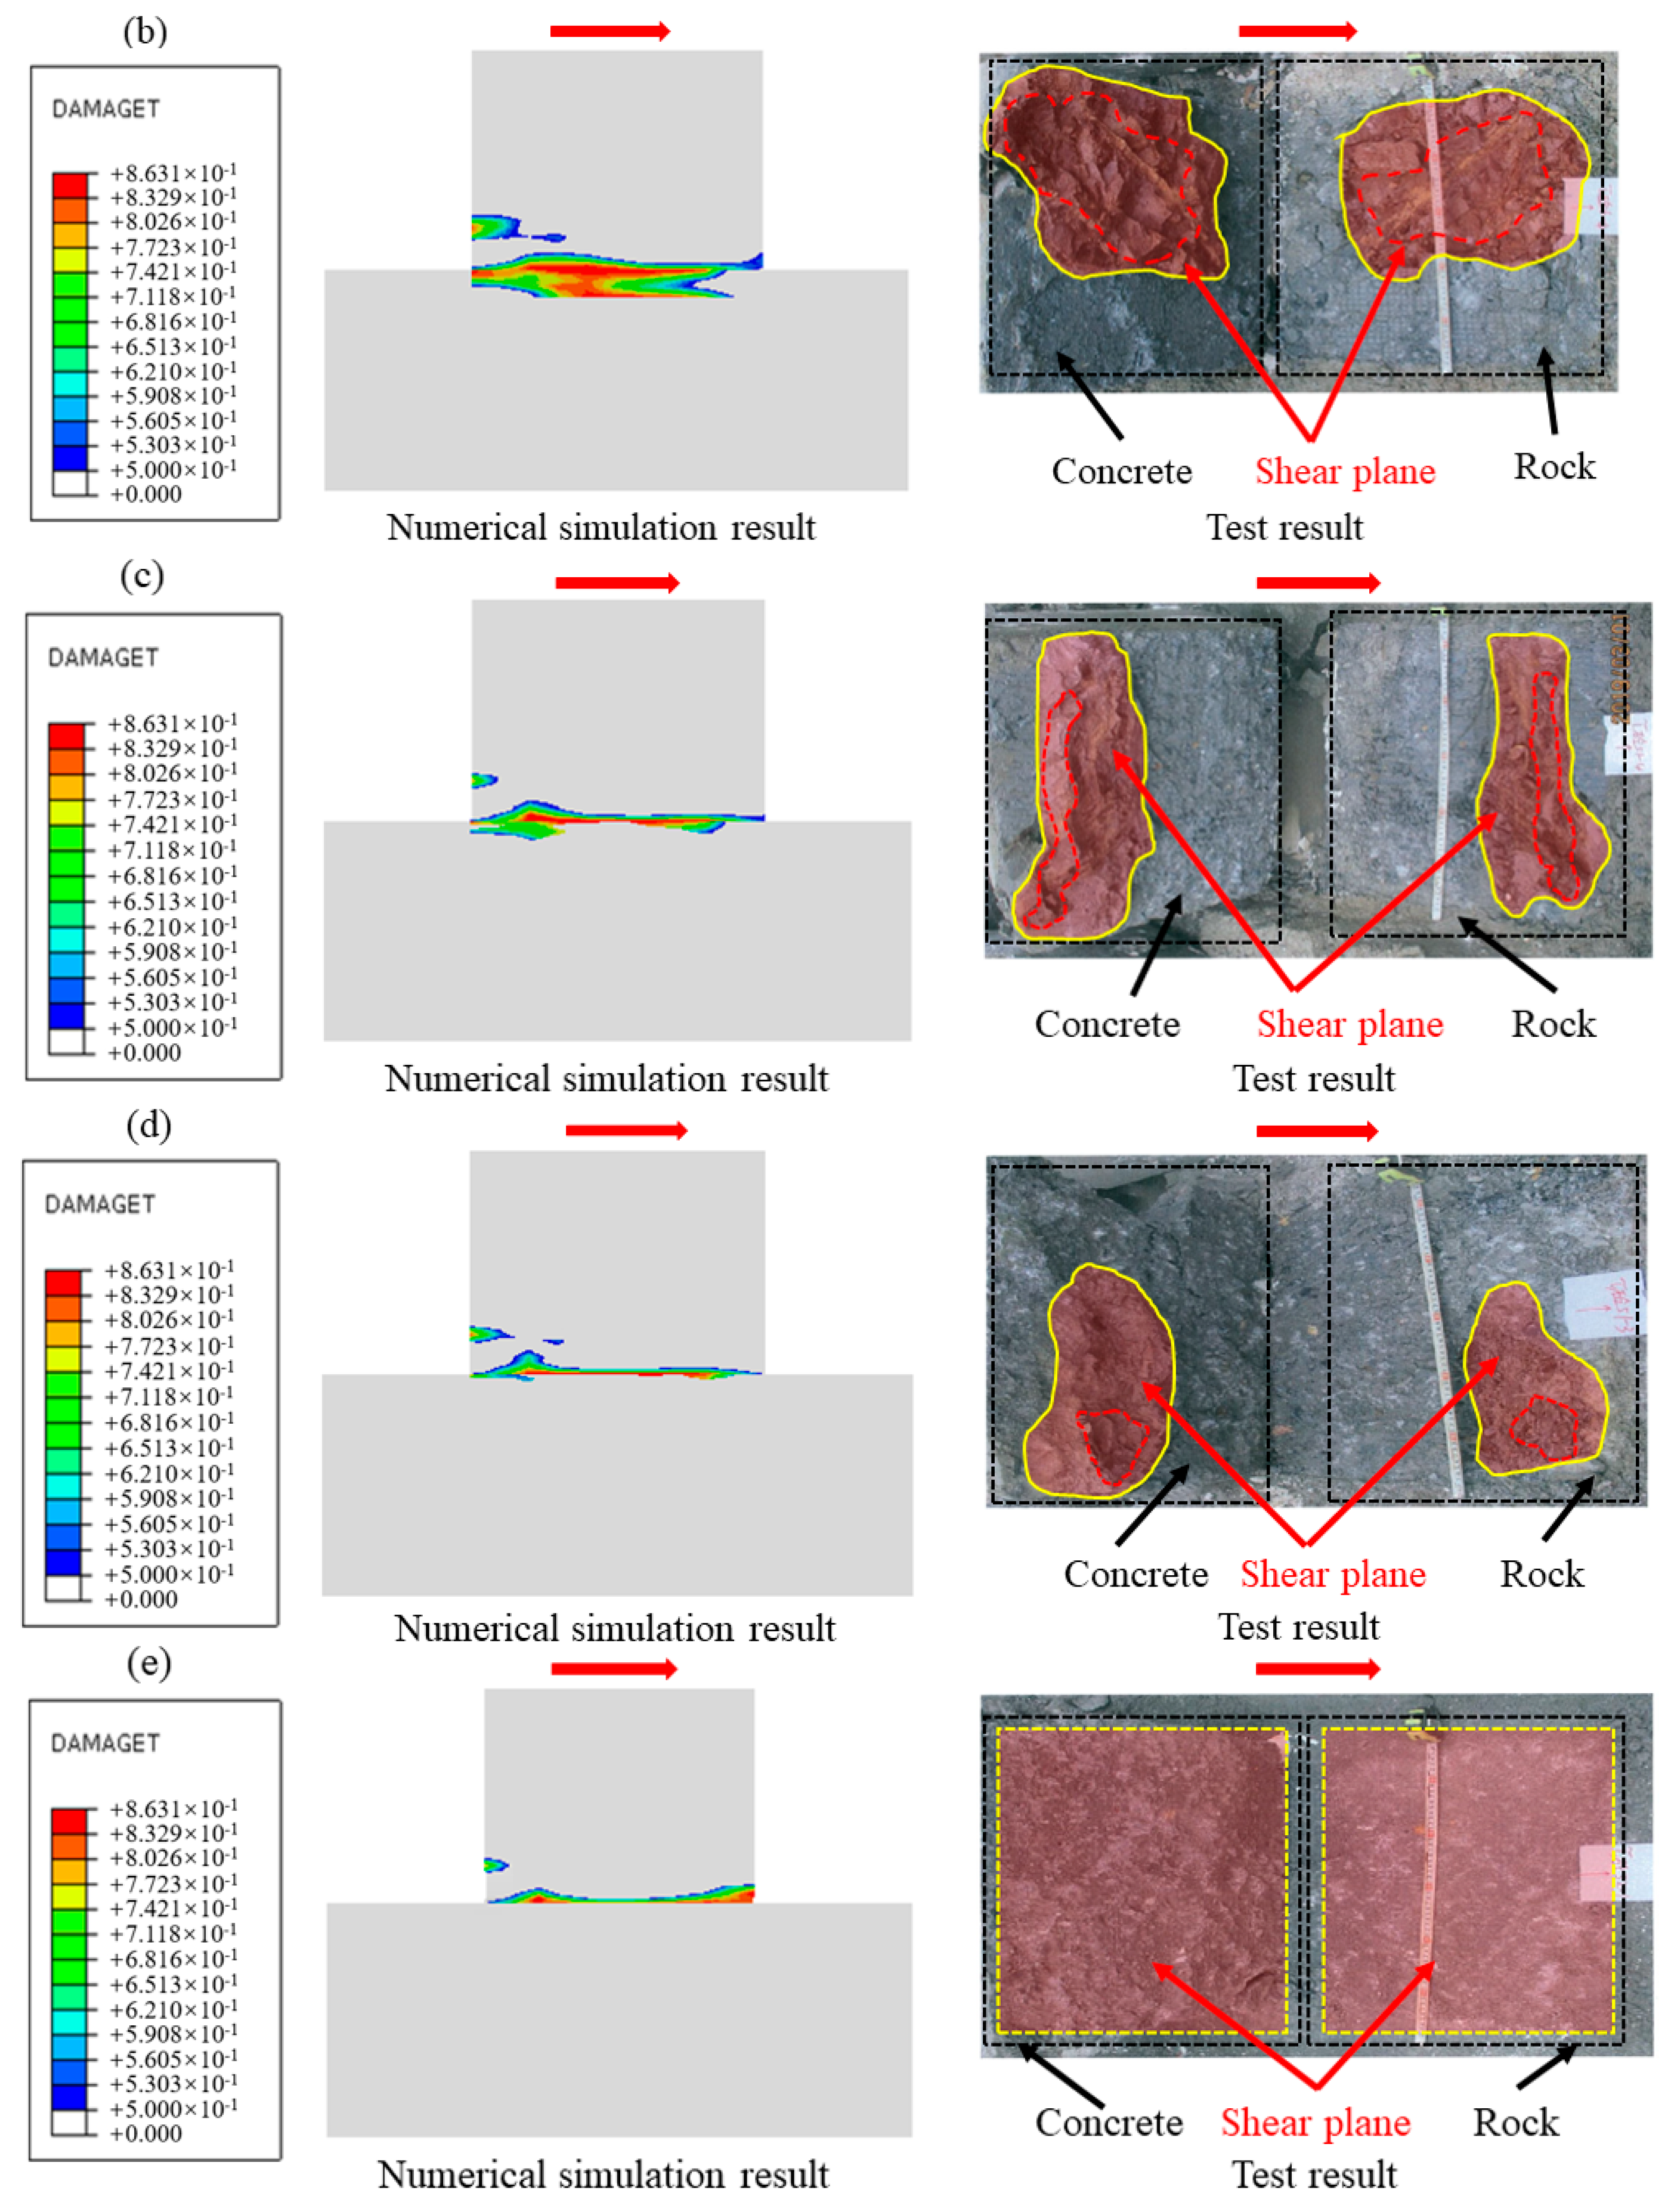
- The shear stress-shear displacement relationship curve at the concrete-bedrock cementation surface demonstrates an initial ascending trend followed by a gradual softening phase. Numerical simulations yield peak shear strength and shear strength parameters with relative errors below 10%, while accurately replicating the experimental failure modes. These results validate the numerical approach as an effective methodology for investigating the failure mechanisms and damage evolution of concrete-bedrock surfaces, elucidating the complete damage progression from initiation, accumulation, and propagation to final rupture at the cementation plane.
- (2)
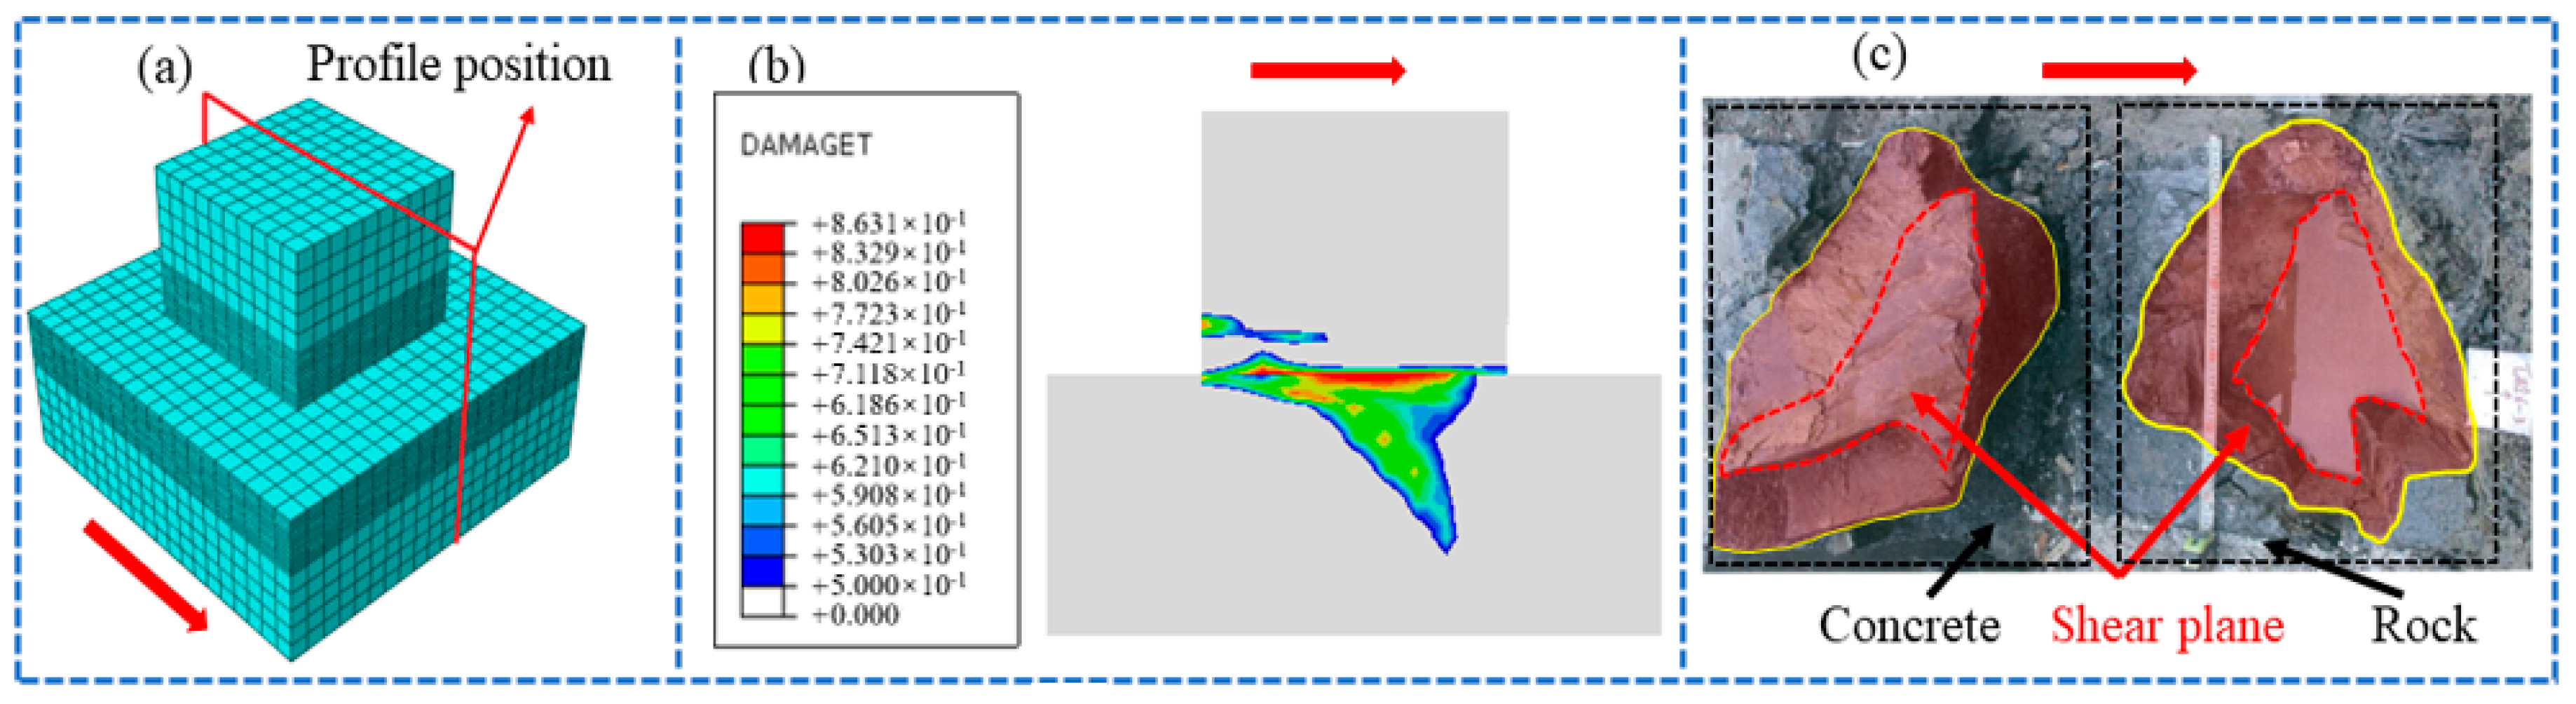
- The failure modes under various loading conditions can be classified into three distinct categories: surface failure, composite shear failure, and bedrock failure. Surface failure exhibits a relatively planar shear surface with fractures propagating along the cementation plane. Composite shear failure manifests as partial shear propagation along rock mass discontinuities, intersecting with the surface to form an undulating failure surface. Bedrock failure features pronounced shear penetration into the intact rock matrix, resulting in substantial surface asperities.
- (3)
- The experimental data obtained in this study are relatively limited. In subsequent research, we will conduct more extensive studies to acquire additional data for further refinement of the constitutive model. Meanwhile, a more sophisticated model will be established to enable deeper investigation.
Author Contributions
Funding
Institutional Review Board Statement
Informed Consent Statement
Data Availability Statement
Conflicts of Interest
References
- Zhao, W.; Chen, W.; Zhao, K. Laboratory test on foamed concrete-rock joints in direct shear. Constr. Build. Mater. 2018, 173, 69–80. [Google Scholar] [CrossRef]
- Tian, H.M.; Chen, W.Z.; Yang, D.S.; Yang, J.P. Experimental and Numerical Analysis of the Shear Behaviour of Cemented Concrete–Rock Joints. Rock Mech. Rock Eng. 2015, 48, 213–222. [Google Scholar] [CrossRef]
- Krounis, A.; Johansson, F.; Larsson, S. Shear Strength of Partially Bonded Concrete–Rock Interfaces for Application in Dam Stability Analyses. Rock Mech. Rock Eng. 2016, 49, 2711–2722. [Google Scholar] [CrossRef]
- Zhong, H.; Ooi, E.T.; Song, C.; Ding, T.; Lin, G.; Li, H. Experimental and numerical study of the dependency of interface fracture in concrete–rock specimens on mode mixity. Eng. Fract. Mech. 2014, 124–125, 287–309. [Google Scholar] [CrossRef]
- Dong, W.; Wu, Z.; Zhou, X.; Wang, N.; Kastiukas, G. An experimental study on crack propagation at rock-concrete interface using digital image correlation technique. Eng. Fract. Mech. 2017, 171, 50–63. [Google Scholar] [CrossRef]
- Vizini, V.O.S.; Futai, M.M. Modified Direct Shear Test for Determining Shear Strength of Rock and Concrete. Geotech. Test. J. 2021, 44, 1782–1800. [Google Scholar] [CrossRef]
- Dong, W.; Zhang, L.; Wu, Z. Experiment study on tension softening constitutive relation of rock-concrete interface. J. Hydraul. Eng. 2014, 45, 712–719. [Google Scholar]
- Liu, Q.; Tian, Y.; Ji, P.; Ma, H. Experimental Investigation of the Peak Shear Strength Criterion Based on Three-Dimensional Surface Description. Rock Mech. Rock Eng. 2018, 51, 1005–1025. [Google Scholar] [CrossRef]
- Hu, J.; Li, S.; Liu, H.; Li, L.; Shi, S.; Qin, C. New Modified Model for Estimating the Peak Shear Strength of Rock Mass Containing Nonconsecutive Joint Based on a Simulated Experiment. Int. J. Geomech. 2020, 20, 04020091. [Google Scholar] [CrossRef]
- Wang, Y.; Zhao, Y.; Zeng, X.; Xu, J.; Liu, L. An in-situ method for determining shear strength parameters of rock masses and its applications. Rock Soil Mech. 2011, 32, 779–786. [Google Scholar]
- Li, W.; Bai, J.; Cheng, J.; Peng, S.; Liu, H. Determination of coal–rock interface strength by laboratory direct shear tests under constant normal load. Int. J. Rock Mech. Min. Sci. 2015, 77, 60–67. [Google Scholar] [CrossRef]
- Tong, J.; Karakus, M.; Wang, M.; Dong, C.; Tang, X. Shear strength characteristics of shotcrete–rock interface for a tunnel driven in high rock temperature environment. Geomech. Geophys. Geo-Energy Geo-Resour. 2016, 2, 331–341. [Google Scholar] [CrossRef]
- Dang, W.; Konietzky, H.; Frühwirt, T. Direct shear behavior of a plane joint under dynamic normal load (DNL) conditions. Eng. Geol. 2016, 213, 133–141. [Google Scholar] [CrossRef]
- Bahaaddini, M.; Hagan, P.; Mitra, R.; Khosravi, M. Experimental and numerical study of asperity degradation in the direct shear test. Eng. Geol. 2016, 204, 41–52. [Google Scholar] [CrossRef]
- Cen, D.; Huang, D. Direct Shear Tests of Sandstone Under Constant Normal Tensile Stress Condition Using a Simple Auxiliary Device. Rock Mech. Rock Eng. 2017, 50, 1425–1438. [Google Scholar] [CrossRef]
- Sanei, M.; Faramarzi, L.; Fahimifar, A.; Goli, S.; Mehinrad, A.; Rahmati, A. Shear strength of discontinuities in sedimentary rock masses based on direct shear tests. Int. J. Rock Mech. Min. Sci. 2015, 75, 119–131. [Google Scholar] [CrossRef]
- Mouzannar, H.; Bost, M.; Leroux, M.; Virely, D. Experimental study of the shear strength of bonded concrete-rock interfaces: Surface morphology and scale effect. Rock Mech. Rock Eng. 2017, 50, 2601–2625. [Google Scholar] [CrossRef]
- Ren, F.; Zhang, L.; Wu, X.; Liu, W. Experimental study on shear failure characteristics of jointed rock mass based on direct shear tests and digital image correction techniques. Adv. Civ. Eng. 2021, 6684859. [Google Scholar] [CrossRef]
- Zhang, Q.-Y.; Chen, F.; Yang, W.; Li, W.G. Field shear creep test and creep parameters inversion for dam zone rock mass of Dagangshan hydropower station. Rock Soil Mech. 2011, 32, 2584–2590+2602. [Google Scholar]
- Guo, X.; Yan, E.; Wu, X.; Yin, J.; He, P. Research on shear strength characteristics of slope rock mass on project of water diversion from Han to Wei river project. Chin. J. Rock Mech. Eng. 2014, 33, 3589–3594. [Google Scholar]
- Zhang, K.; Cao, P.; Meng, J.; Li, K.; Fan, W. Modeling the progressive failure of jointed rock slope using fracture mechanics and the strength reduction method. Rock Mech. Rock Eng. 2015, 48, 771–785. [Google Scholar] [CrossRef]
- Rong, H.; Wang, Y.; Zhao, X.; She, J. Research on fracture characteristics of rock-concrete interface with different roughness. Eng. Mech. 2019, 36, 96–103+163. [Google Scholar]
- Yin, A.; Yang, X.; Zeng, G.; Gao, H. Experimental and numerical investigation of fracture behavior of asphalt mixture under direct shear loading. Constr. Build. Mater. 2015, 86, 21–32. [Google Scholar] [CrossRef]
- Cusatis, G.; Cedolin, L. Two-scale study of concrete fracturing behavior. Eng. Fract. Mech. 2007, 74, 3–17. [Google Scholar] [CrossRef]
- Xiong, X.Y.; Xiao, Q.S. A unified meso-scale simulation method for concrete under both tension and compression based on Cohesive Zone Model. J. Hydraul. Eng. 2019, 50, 448–462. [Google Scholar]
- Bahaaddini, M.; Sharrock, G.; Hebblewhite, B. Numerical direct shear tests to model the shear behaviour of rock joints. Comput. Geotech. 2013, 51, 101–115. [Google Scholar] [CrossRef]
- Lee, J.H.; Fenves, G.L. Plastic-Damage Model for cyclic loading of concrete structures. J. Eng. Mech. 1998, 124, 892–900. [Google Scholar] [CrossRef]
- Geers, M.; Borst, R.D.; Peerlings, R. Damage and crack modeling in single-edge and double-edge notched concrete beams. Eng. Fract. Mech. 2000, 65, 247–261. [Google Scholar] [CrossRef]
- Dong, W.; Wu, Z.; Zhou, X. Fracture mechanisms of rock-concrete interface: Experimental and numerical. J. Eng. Mech. 2016, 142, 04016040. [Google Scholar] [CrossRef]
- Tan, X.; Ren, Y.-K.; Li, T.-L.; Zhou, S.-H.; Zhang, J.-C.; Zhou, S.-K. In-situ direct shear test and numerical simulation of slate structural planes with thick muddy interlayer along bedding slope. Int. J. Rock Mech. Min. Sci. 2016, 143, 104791. [Google Scholar] [CrossRef]
- Yu, Z.; Wu, L.; Shan, Z. Models for deterministic and stochastic damage constitutions of concrete—A short review. Eng. Mech. 2017, 34, 1–12. [Google Scholar] [CrossRef]
- Hu, L.; Ma, J.; Zhang, B. Numerical simulation of interface failure during direct shear tests. J. Tsinghua Univ. (Sci. Technol.) 2008, 48, 943–946. [Google Scholar]
- Zhao, W.; Li, G.; Han, B.; Li, X.; Xu, Y. Experimental study on bonding behavior of ECC-coal gangue concrete interface based on DIC and acoustic emission. J. Build. Struct. 2025, 46, 186–199. [Google Scholar]
- Fan, X.; Tian, X.; Jiang, S.; Qiu, C.; Chen, R. Study on the Shear Mechanical Properties of Cured Silt-Concrete Interface. Chin. J. Undergr. Space Eng. 2025, 21, 540–550. [Google Scholar]
- Xie, X.; Guo, H.; Jiang, H.; Yang, K.; Du, T.; Wang, Y.; Cheng, Y.; Luo, T. Influence of Mesoscopic Parameters on Macroscopic Characteristics in Concrete Direct Shear Test Based on PFC3D Simulation. J. Water Resour. Archit. Eng. 2024, 22, 60–66. [Google Scholar]
- Liu, H.; Wei, H.; Wang, L.; Ma, X.; Zhang, Y.; Bai, M. Roughness effects on the shear bonding properties of interface between magnesium potassium phosphate cement mortar and concrete. Concrete 2024, 9, 40–45+52. [Google Scholar]
- Yang, K.; Liu, Y.; Zhao, H.; Zhao, M. Experimental Investigation on Sandstone-concrete Interface Shearing Property and Its Discrete Element Modeling. J. Hunan Univ. (Nat. Sci.) 2024, 51, 165–176. [Google Scholar]
- Sun, J.; Guo, B.; Tian, S.; Cheng, T. Experimental study of direct shear failure characteristics of sandstone joints based on characteristic parameters of acoustic emission. Rock Soil Mech. 2024, 45, 167–177. [Google Scholar]
- Lu, Z.; Zhang, G.; Yang, C.; Du, W.; Li, C. Experimental Study on Shear Performance of the Interface Between Early-Strength Self-Compacting Shrinkage-Compensating High-Performance Concrete and Existing Concrete. Concrete 2025. Available online: https://link.cnki.net/urlid/21.1259.tu.20240516.1956.002 (accessed on 23 May 2025).
- Wu, F.; Mei, Y.; He, L.; Liu, Y.; Bian, Z.; Wu, J.; Cheng, W. Experimental Study on Interfacial Direct Shear Performance Between Magnesium Phosphate Cement Concrete and Normal Concrete. Eng. Mech. 2025. Available online: https://link.cnki.net/urlid/11.2595.O3.20231106.1349.008 (accessed on 23 May 2025).
- Qin, X.; Xu, Q. Research on Meso Parameters of Concrete Direct Shear Test Based on Discrete Element Simulation. Water Resour. Power 2023, 41, 156–160. [Google Scholar]
- Liu, F.; Zhang, S.; Xiong, B. Effect of roughness on shear properties of sand-concrete interface with different particle sizes. Rock Soil Mech. 2023, 44, 419–426. [Google Scholar]
- Wu, C.; Chu, F.; Gong, M.; Zeng, Z. Experimental Investigation of Interfacial Bond Behavior Between Non-autoclave Curing Ultra-high Performance Concrete and Existing Normal Concrete. Mater. Rep. 2023, 37, 163–170. [Google Scholar]
- Liu, J.; Guo, B.; Cheng, T.; Sun, J.; Tian, S.; Chen, Y. Experimental study on empirical formula of peak shear strength for rock-concrete interface. Chin. J. Rock Mech. Eng. 2023, 42, 2552–2565. [Google Scholar]
- Zhao, H.; Hou, J.; Zhao, M. Generalized Patton shear model for rock-concrete joints. Chin. J. Geotech. Eng. 2022, 44, 2106–2114. [Google Scholar]
- Zhang, Q.; Zhang, J.; Zhang, B.; Zhang, T.; Wang, H.; Li, Y. Influencing factors and constitutive model of interface between warm frozen soil and cast-in-place concrete. J. Cent. South Univ. (Sci. Technol.) 2022, 53, 3021–3030. [Google Scholar]
- Li, M.; Li, Y.; Lv, M. Comparative Shear Test Study on Silt-concrete Interface and Silt. Chin. J. Undergr. Space Eng. 2022, 18, 171–178+217. [Google Scholar]
- GB/T 50266-2013; Standard for Test Methods of Engineering Rock Mass. Standardization Administration of China (SAC): Beijing, China, 2013.
- Lubliner, J.; Oliver, J.; Oller, S.; Oñate, E. A plastic-damage model for concrete. J. Solids Struct. 1989, 25, 299–326. [Google Scholar] [CrossRef]
- Galindo, R.A.; Serrano, A.; Olalla, C. Ultimate bearing capacity of rock masses based on modified Mohr-Coulomb strength criterion. Int. J. Rock Mech. Min. Sci. 2014, 93, 215–225. [Google Scholar] [CrossRef]
- Yin, Y.; Ren, Q.; Shen, L.; Zhou, J. Study on crack propagation and damage evolution process of concrete based on fractal dimension. J. Hydraul. Eng. 2021, 52, 1270–1280. [Google Scholar]


| Dam Block | Test Site Label | ||||
|---|---|---|---|---|---|
| 3# dam block | 3-1 | 3-2 | 3-3 | 3-4 | 3-5 |
| 4# dam block | 4-1 | 4-2 | 4-3 | 4-4 | 4-5 |
| 5# dam block | 5-11 | 5-12 | 5-13 | 5-14 | 5-15 |
| 5# dam block | 5-21 | 5-22 | 5-23 | 5-24 | 5-25 |
| 6# dam block | 6-1 | 6-2 | 6-3 | 6-4 | 6-5 |
| Material | Density | Elastic Modulus | Poisson’s Ratio | |||||
|---|---|---|---|---|---|---|---|---|
| Concrete | 2400 kg/m3 | 25,500 MPa | 0.167 | 30 | 0.1 | 1.16 | 0.667 | 0 |
| Bedrock | 2710 kg/m3 | 12,900 MPa | 0.23 |
| Normal Load MPa | Shear Load/MPa | ||||
|---|---|---|---|---|---|
| Step-1 | Step-2 | Step-3 | Step-4 | Step-5 | |
| 0.28 | 1.5 | 2 | 4 | 2 | 1 |
| 0.58 | 1.5 | 2 | 4 | 3 | 1.5 |
| 0.88 | 1.5 | 4 | 4 | 4 | 4 |
| 1.20 | 1.5 | 6 | 6 | 6 | 6 |
| 1.50 | 2.5 | 7 | 5 | 4 | 4 |
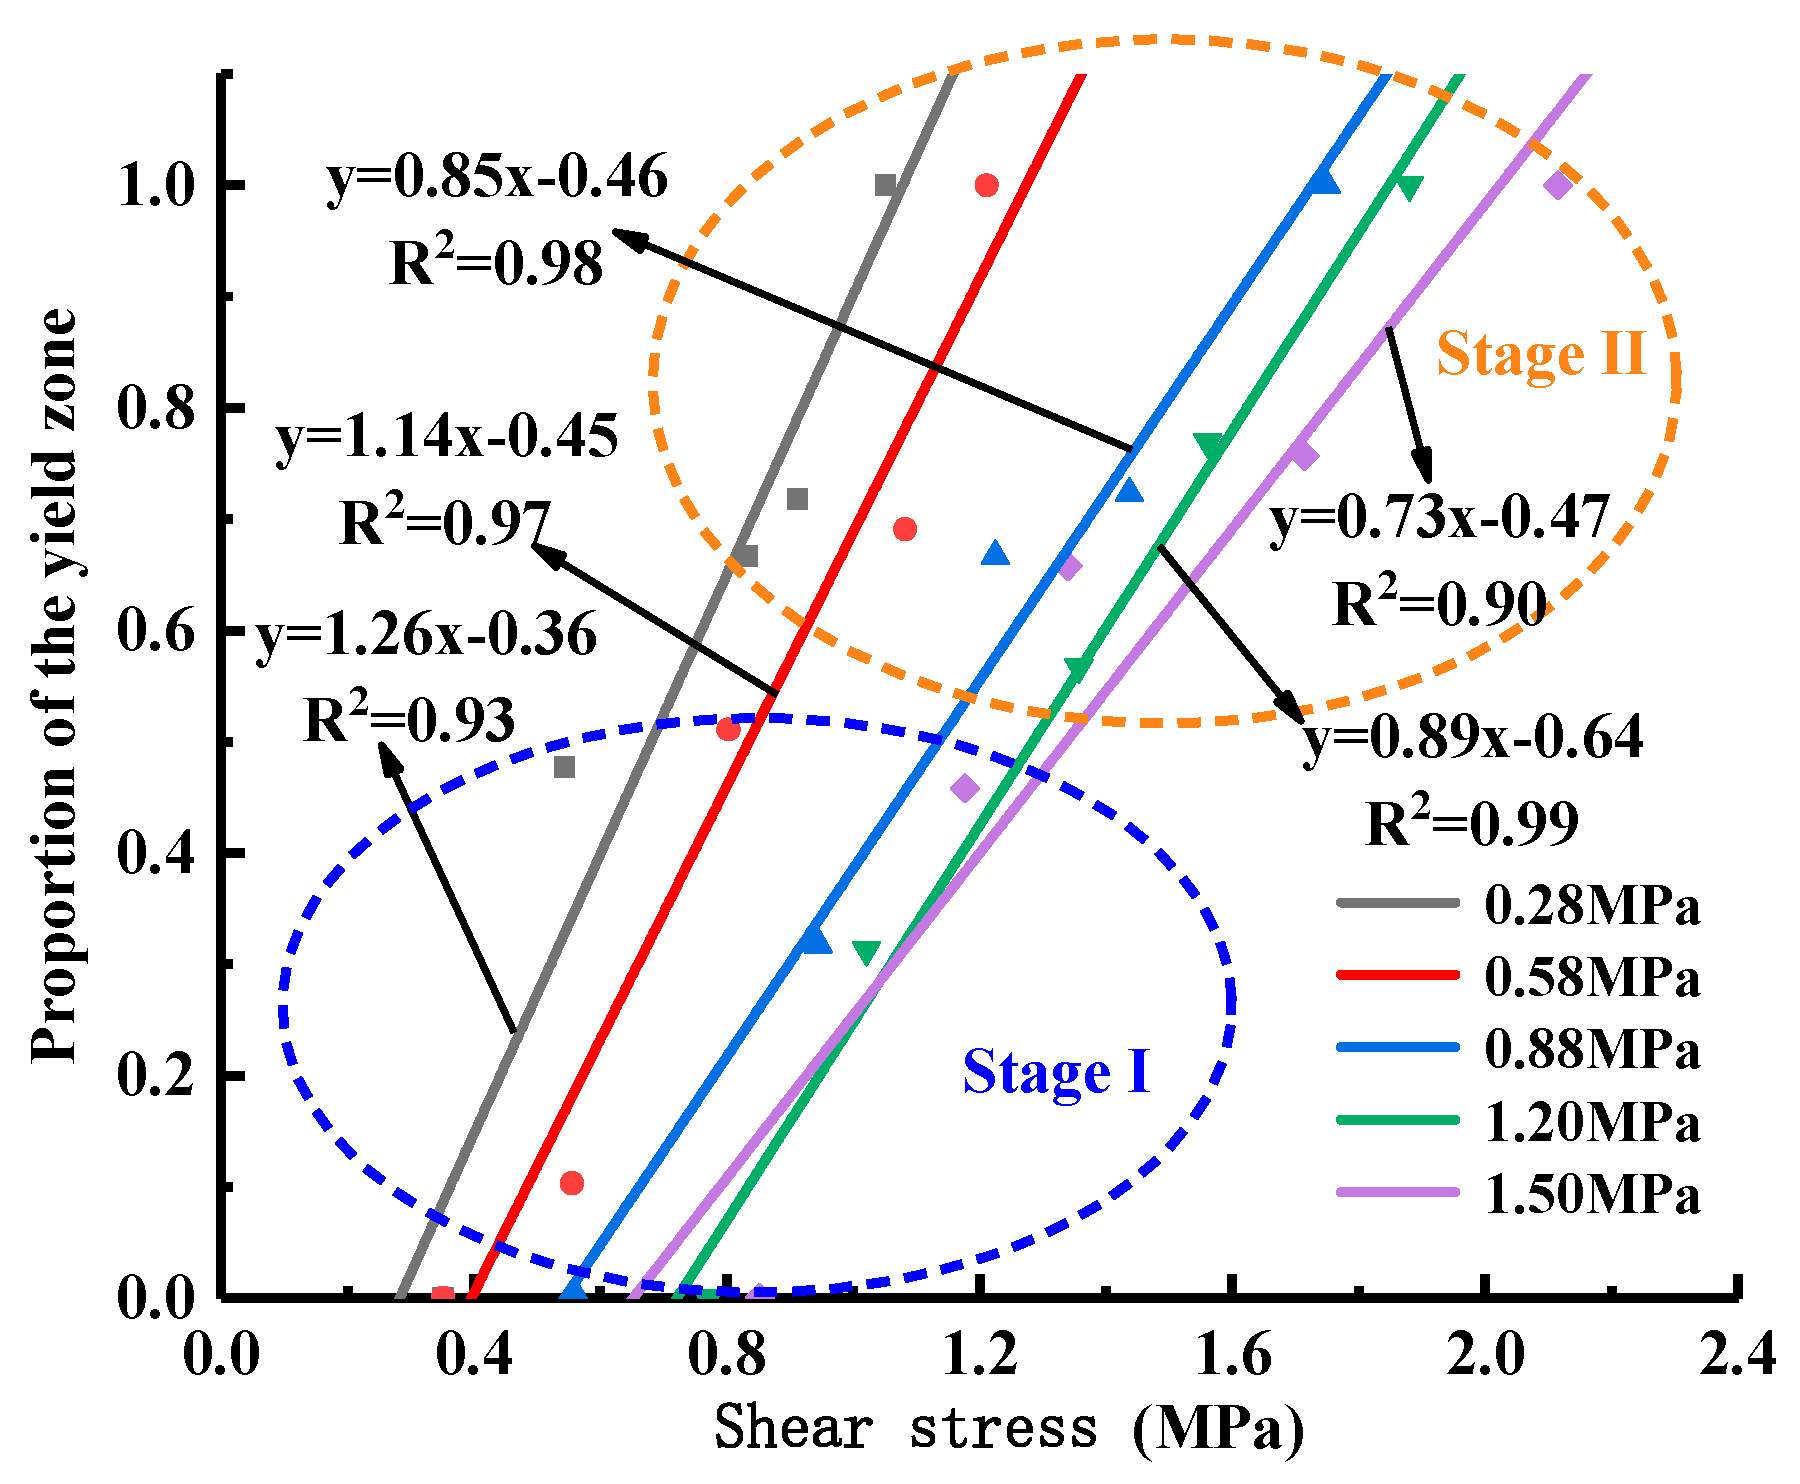
| Normal Stress/MPa | Slope | Intercept | Correlation Coefficient |
|---|---|---|---|
| 0.28 | 1.26 | −0.36 | 0.93 |
| 0.58 | 1.14 | −0.45 | 0.97 |
| 0.88 | 0.85 | −0.46 | 0.98 |
| 1.20 | 0.89 | −0.64 | 0.99 |
| 1.50 | 0.73 | −0.47 | 0.90 |
| Normal Stress MPa | Test Result | Simulation Result | Error | ||
|---|---|---|---|---|---|
| Cementation Surface | Bedrock | Cementation Surface | Bedrock | ||
| 0.28 | 55% | 45% | 58% | 42% | 5.5% |
| 0.58 | 70% | 30% | 65% | 35% | −7.1% |
| 0.88 | 85% | 15% | 80% | 20% | −5.9% |
| 1.20 | 80% | 20% | 80% | 20% | 0 |
| 1.50 | 90% | 10% | 97% | 3% | 7.8% |
Disclaimer/Publisher’s Note: The statements, opinions and data contained in all publications are solely those of the individual author(s) and contributor(s) and not of MDPI and/or the editor(s). MDPI and/or the editor(s) disclaim responsibility for any injury to people or property resulting from any ideas, methods, instructions or products referred to in the content. |
© 2025 by the authors. Licensee MDPI, Basel, Switzerland. This article is an open access article distributed under the terms and conditions of the Creative Commons Attribution (CC BY) license (https://creativecommons.org/licenses/by/4.0/).
Share and Cite
Ye, H.; Huang, J.; Zhang, J.; Lai, Y.; Cao, K.; Wang, Y.; Wang, W. Numerical Simulation of In-Situ Direct Shear Test and Damage Failure Mechanism Study of Concrete-Bedrock Cementation Surface. Materials 2025, 18, 2718. https://doi.org/10.3390/ma18122718
Ye H, Huang J, Zhang J, Lai Y, Cao K, Wang Y, Wang W. Numerical Simulation of In-Situ Direct Shear Test and Damage Failure Mechanism Study of Concrete-Bedrock Cementation Surface. Materials. 2025; 18(12):2718. https://doi.org/10.3390/ma18122718
Chicago/Turabian StyleYe, Hexin, Jinlin Huang, Jianwei Zhang, Yu Lai, Kelei Cao, Yong Wang, and Wenxuan Wang. 2025. "Numerical Simulation of In-Situ Direct Shear Test and Damage Failure Mechanism Study of Concrete-Bedrock Cementation Surface" Materials 18, no. 12: 2718. https://doi.org/10.3390/ma18122718
APA StyleYe, H., Huang, J., Zhang, J., Lai, Y., Cao, K., Wang, Y., & Wang, W. (2025). Numerical Simulation of In-Situ Direct Shear Test and Damage Failure Mechanism Study of Concrete-Bedrock Cementation Surface. Materials, 18(12), 2718. https://doi.org/10.3390/ma18122718