
Deep Reinforcement Learning-Guided Inverse Design of Transparent Heat Mirror Film for Broadband Spectral Selectivity


Highlights
- A method for the inverse design of multilayer thin-film structures based on deep reinforcement learning is proposed;
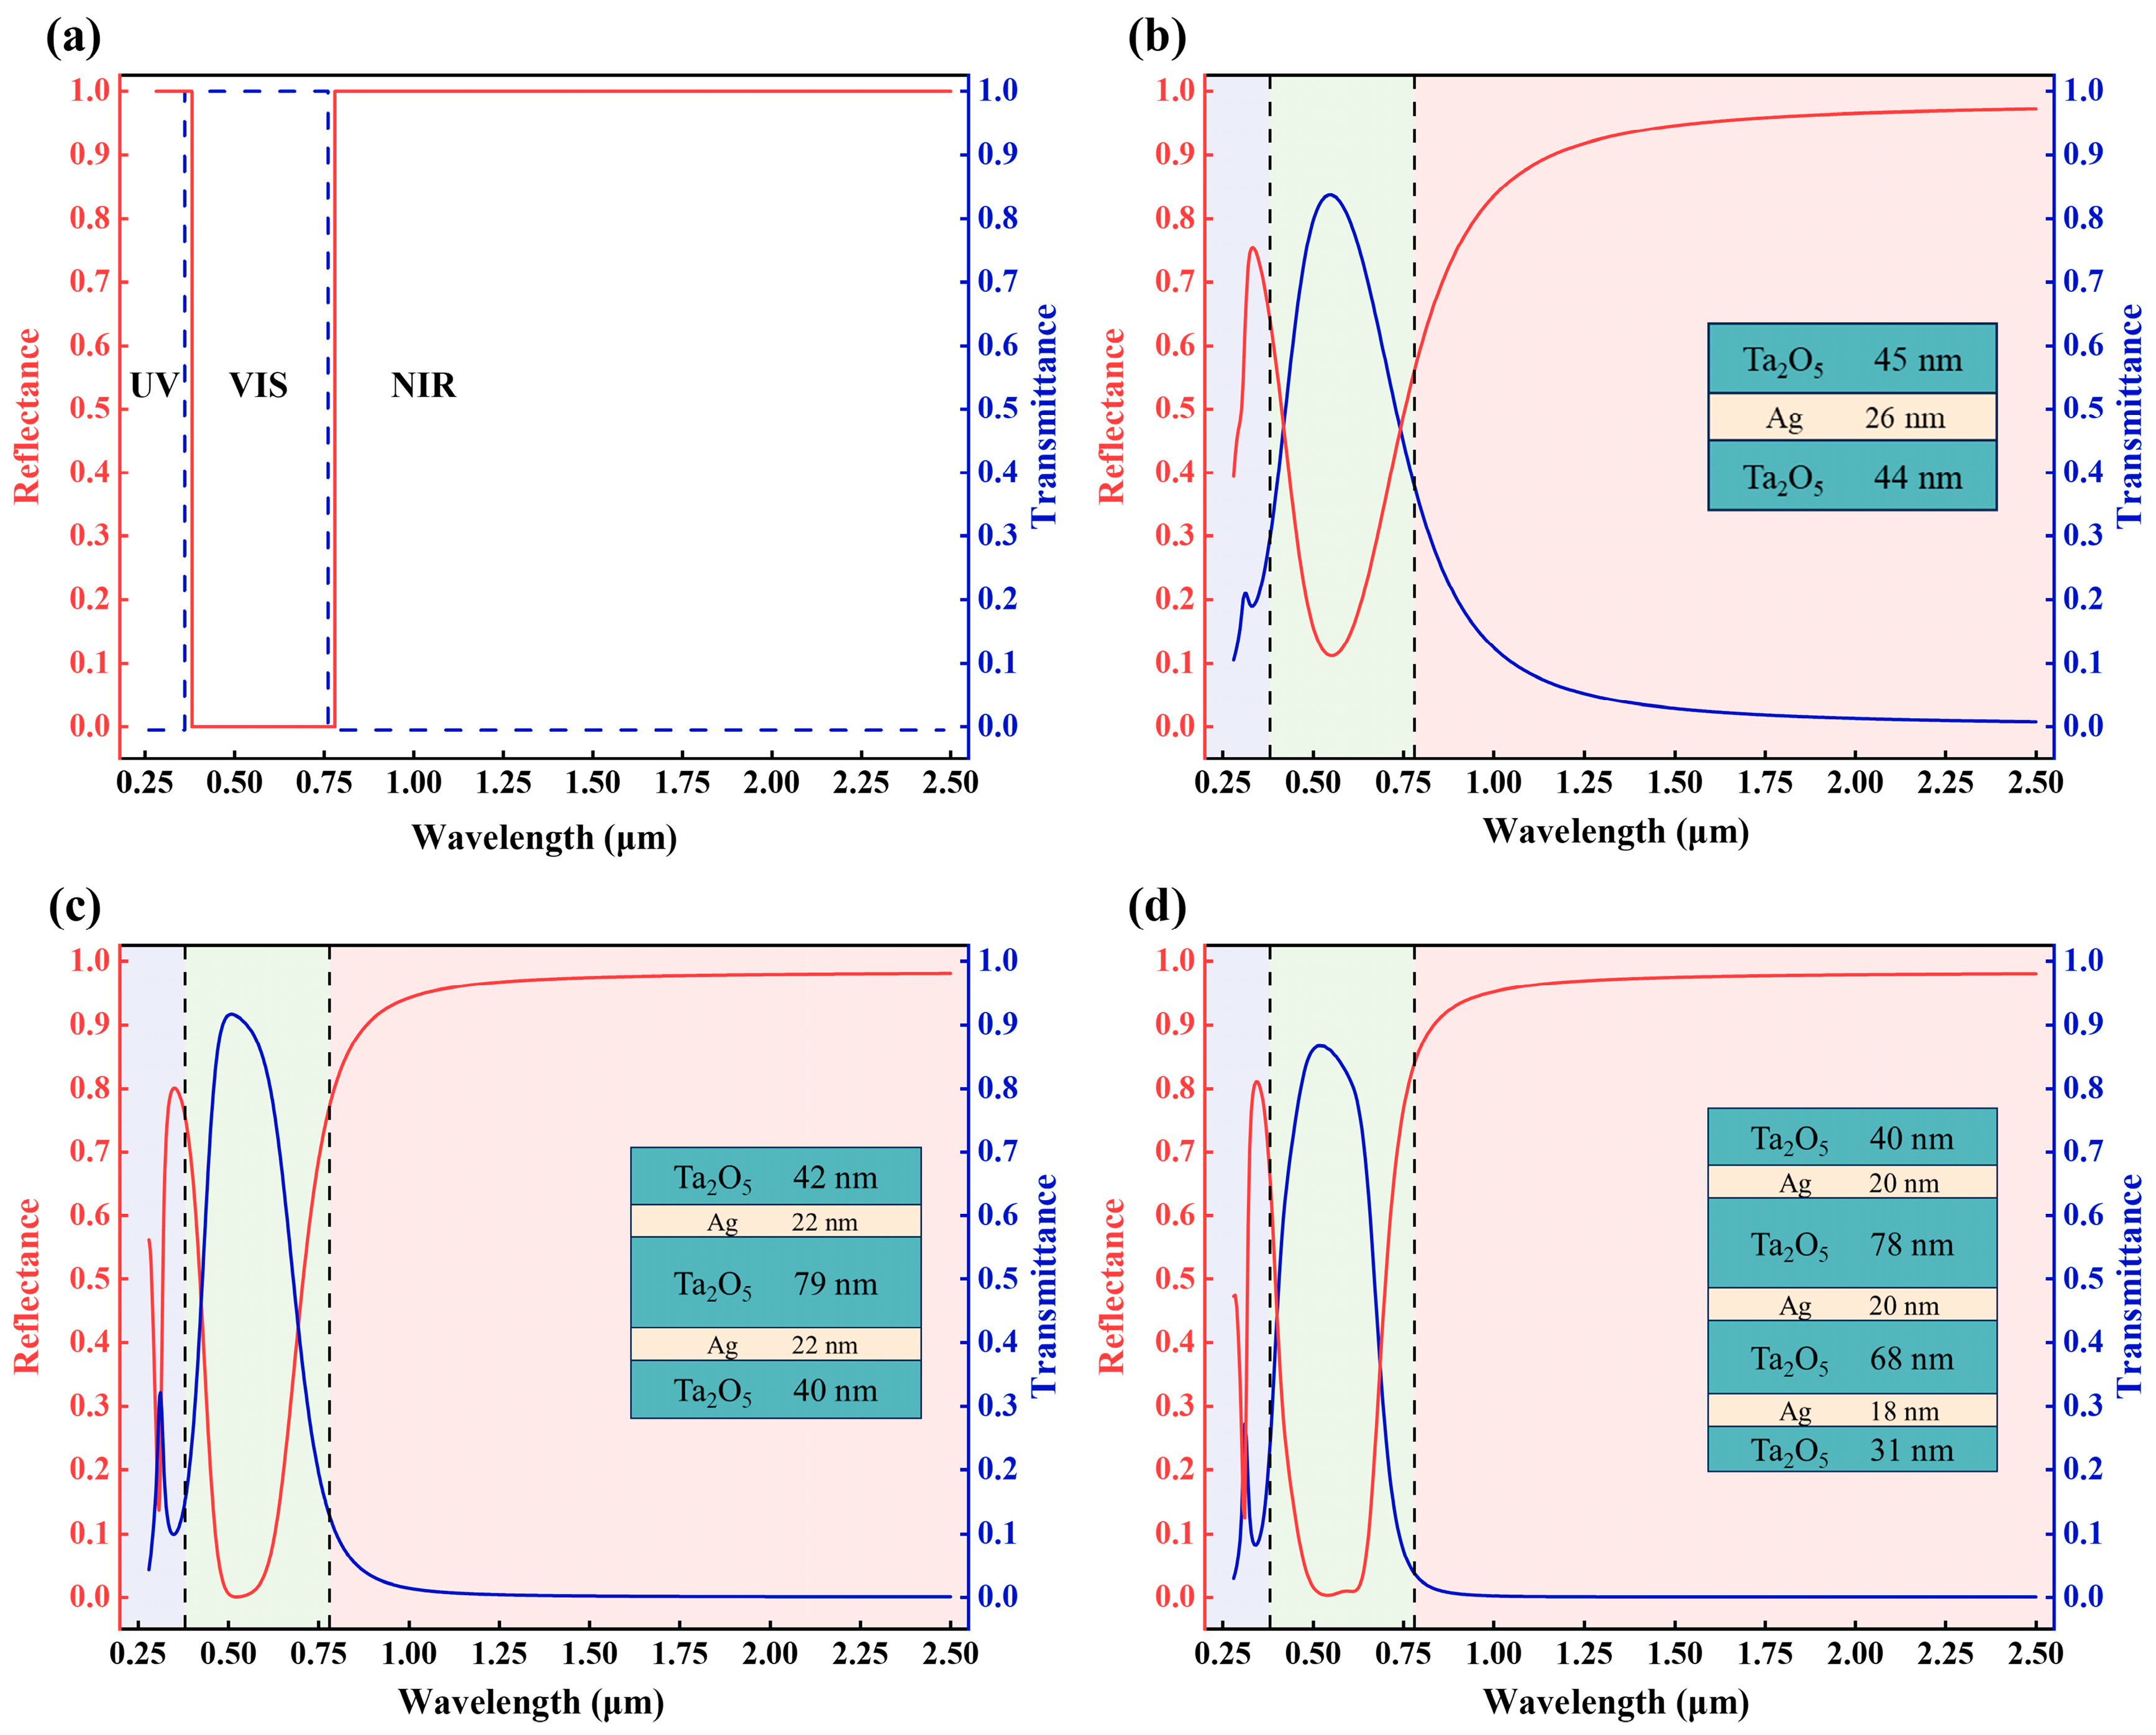
- A transparent heat mirror film is designed with average reflectance of 75.5% in the UV, 93.2% in the NIR, and 87.0% visible transmittance;
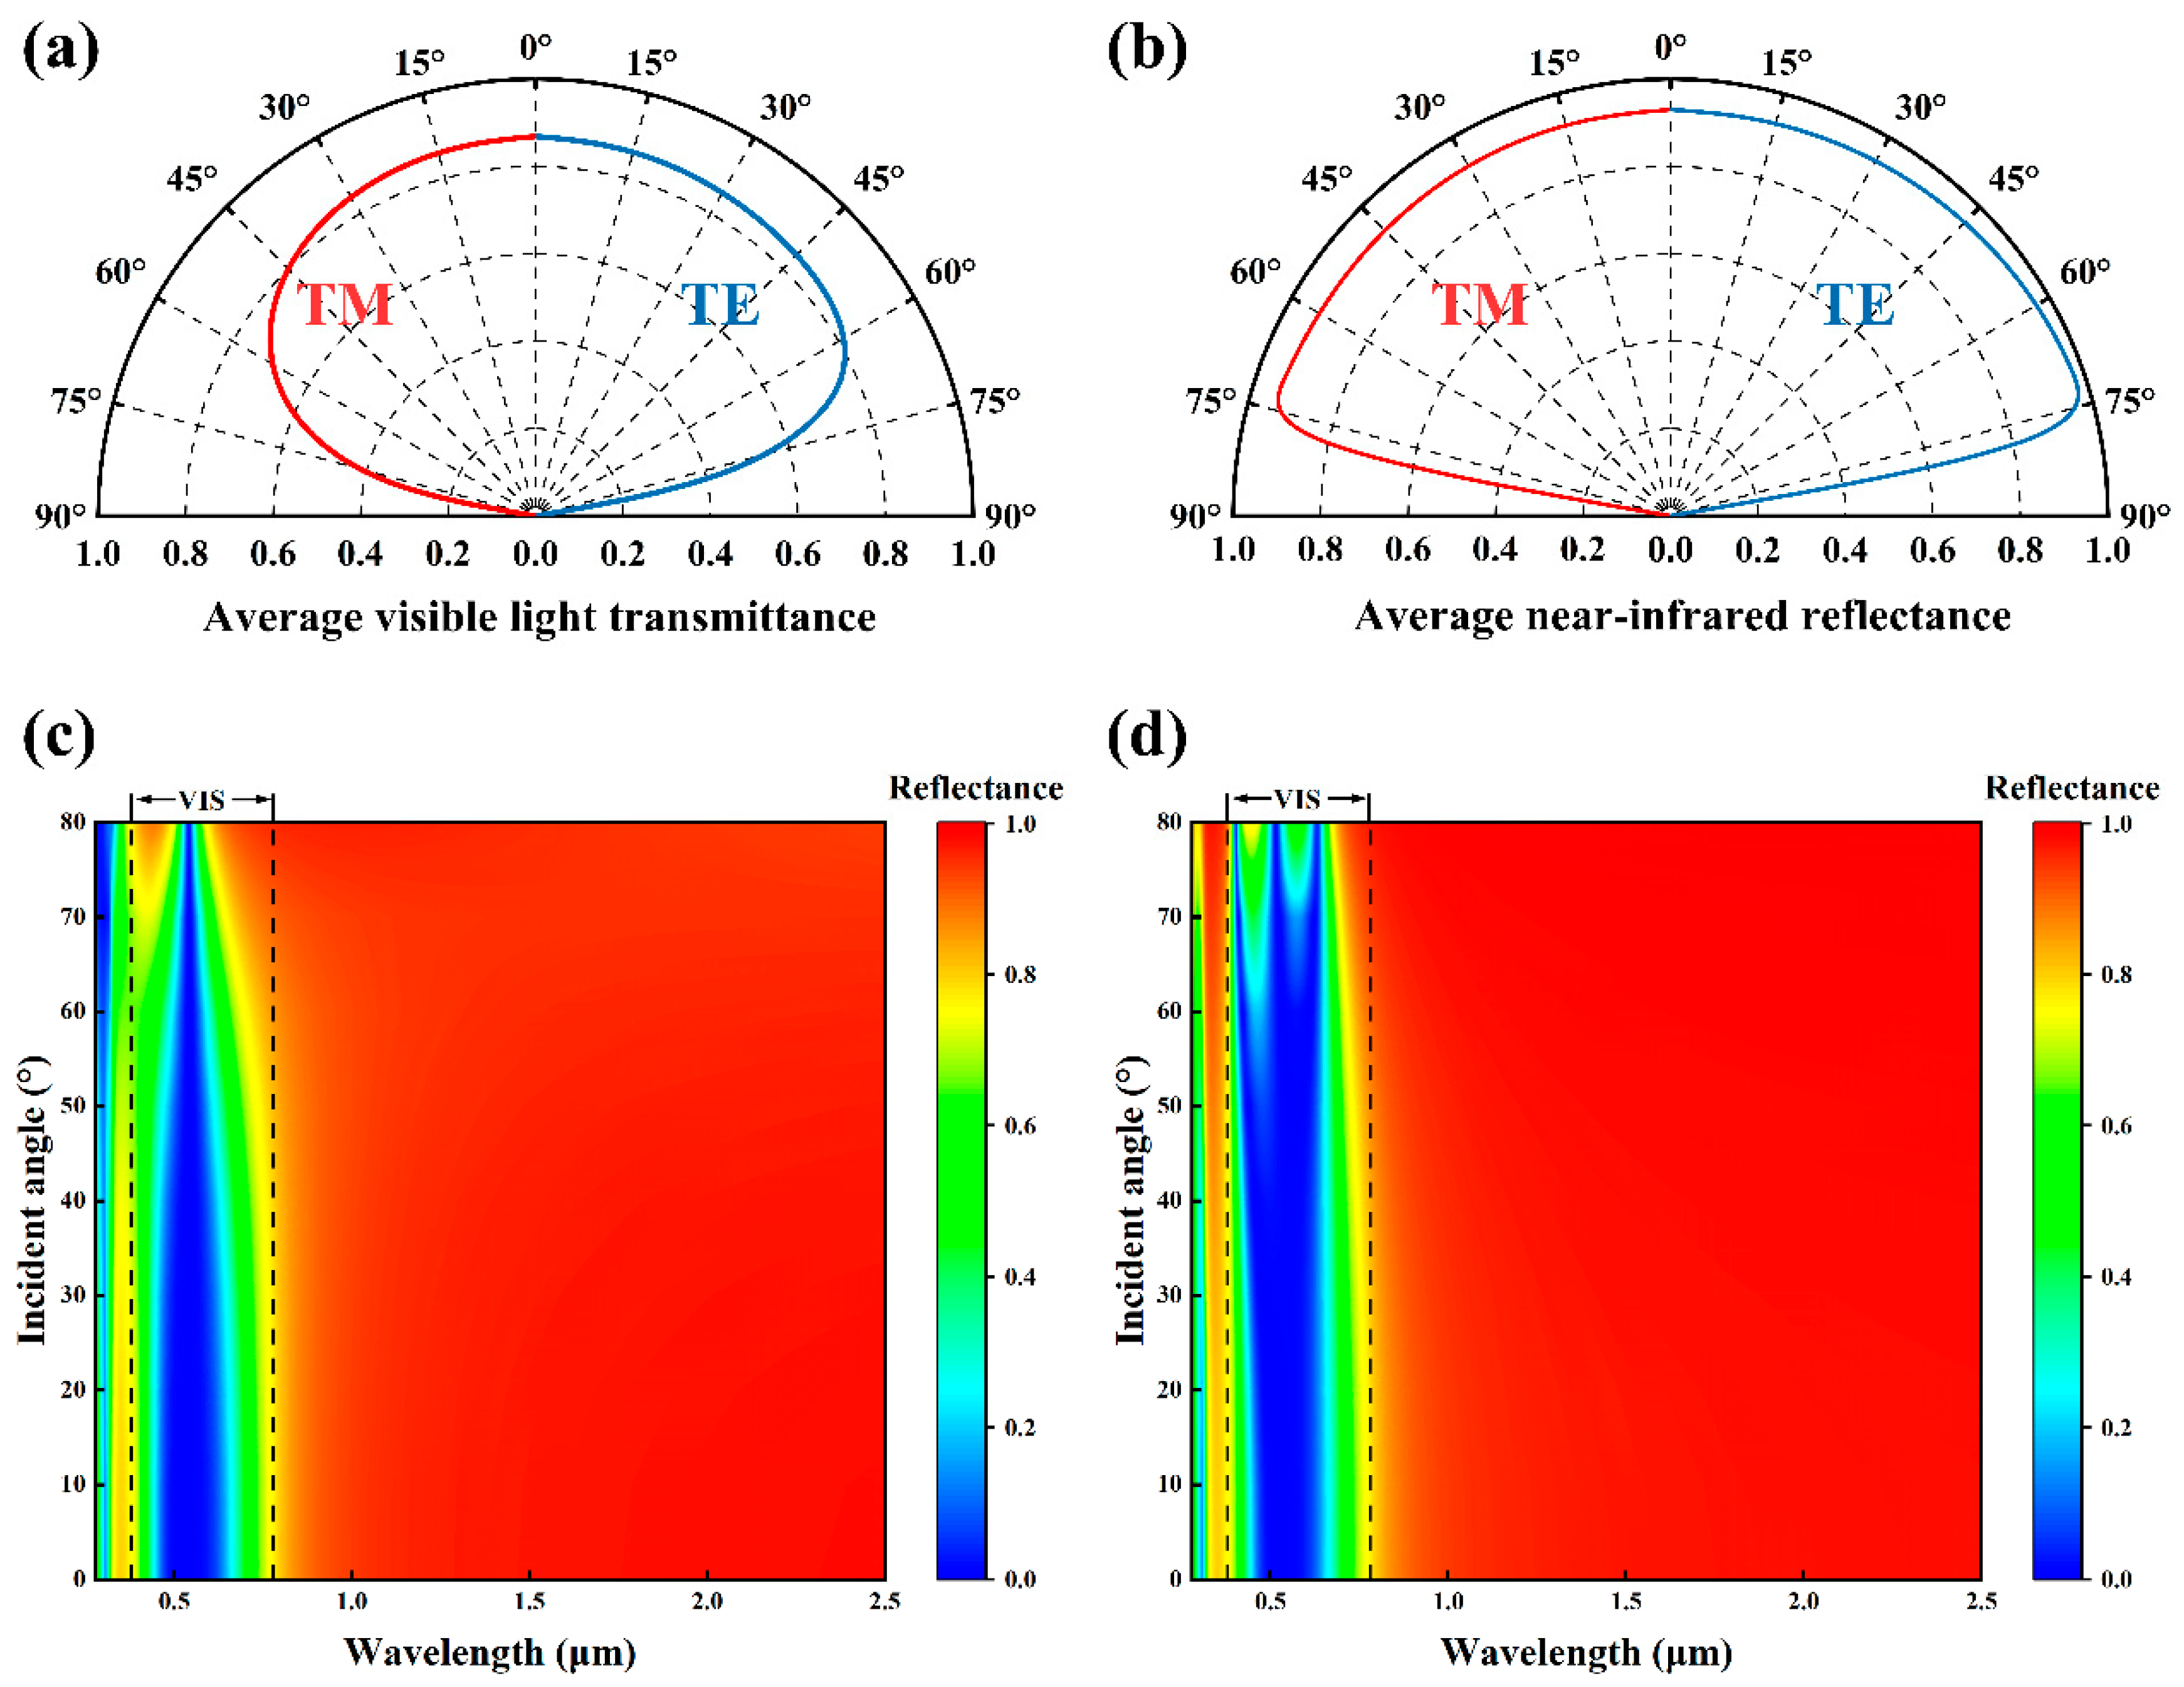
- The film maintains good optical performance over a wide range of incident angles;
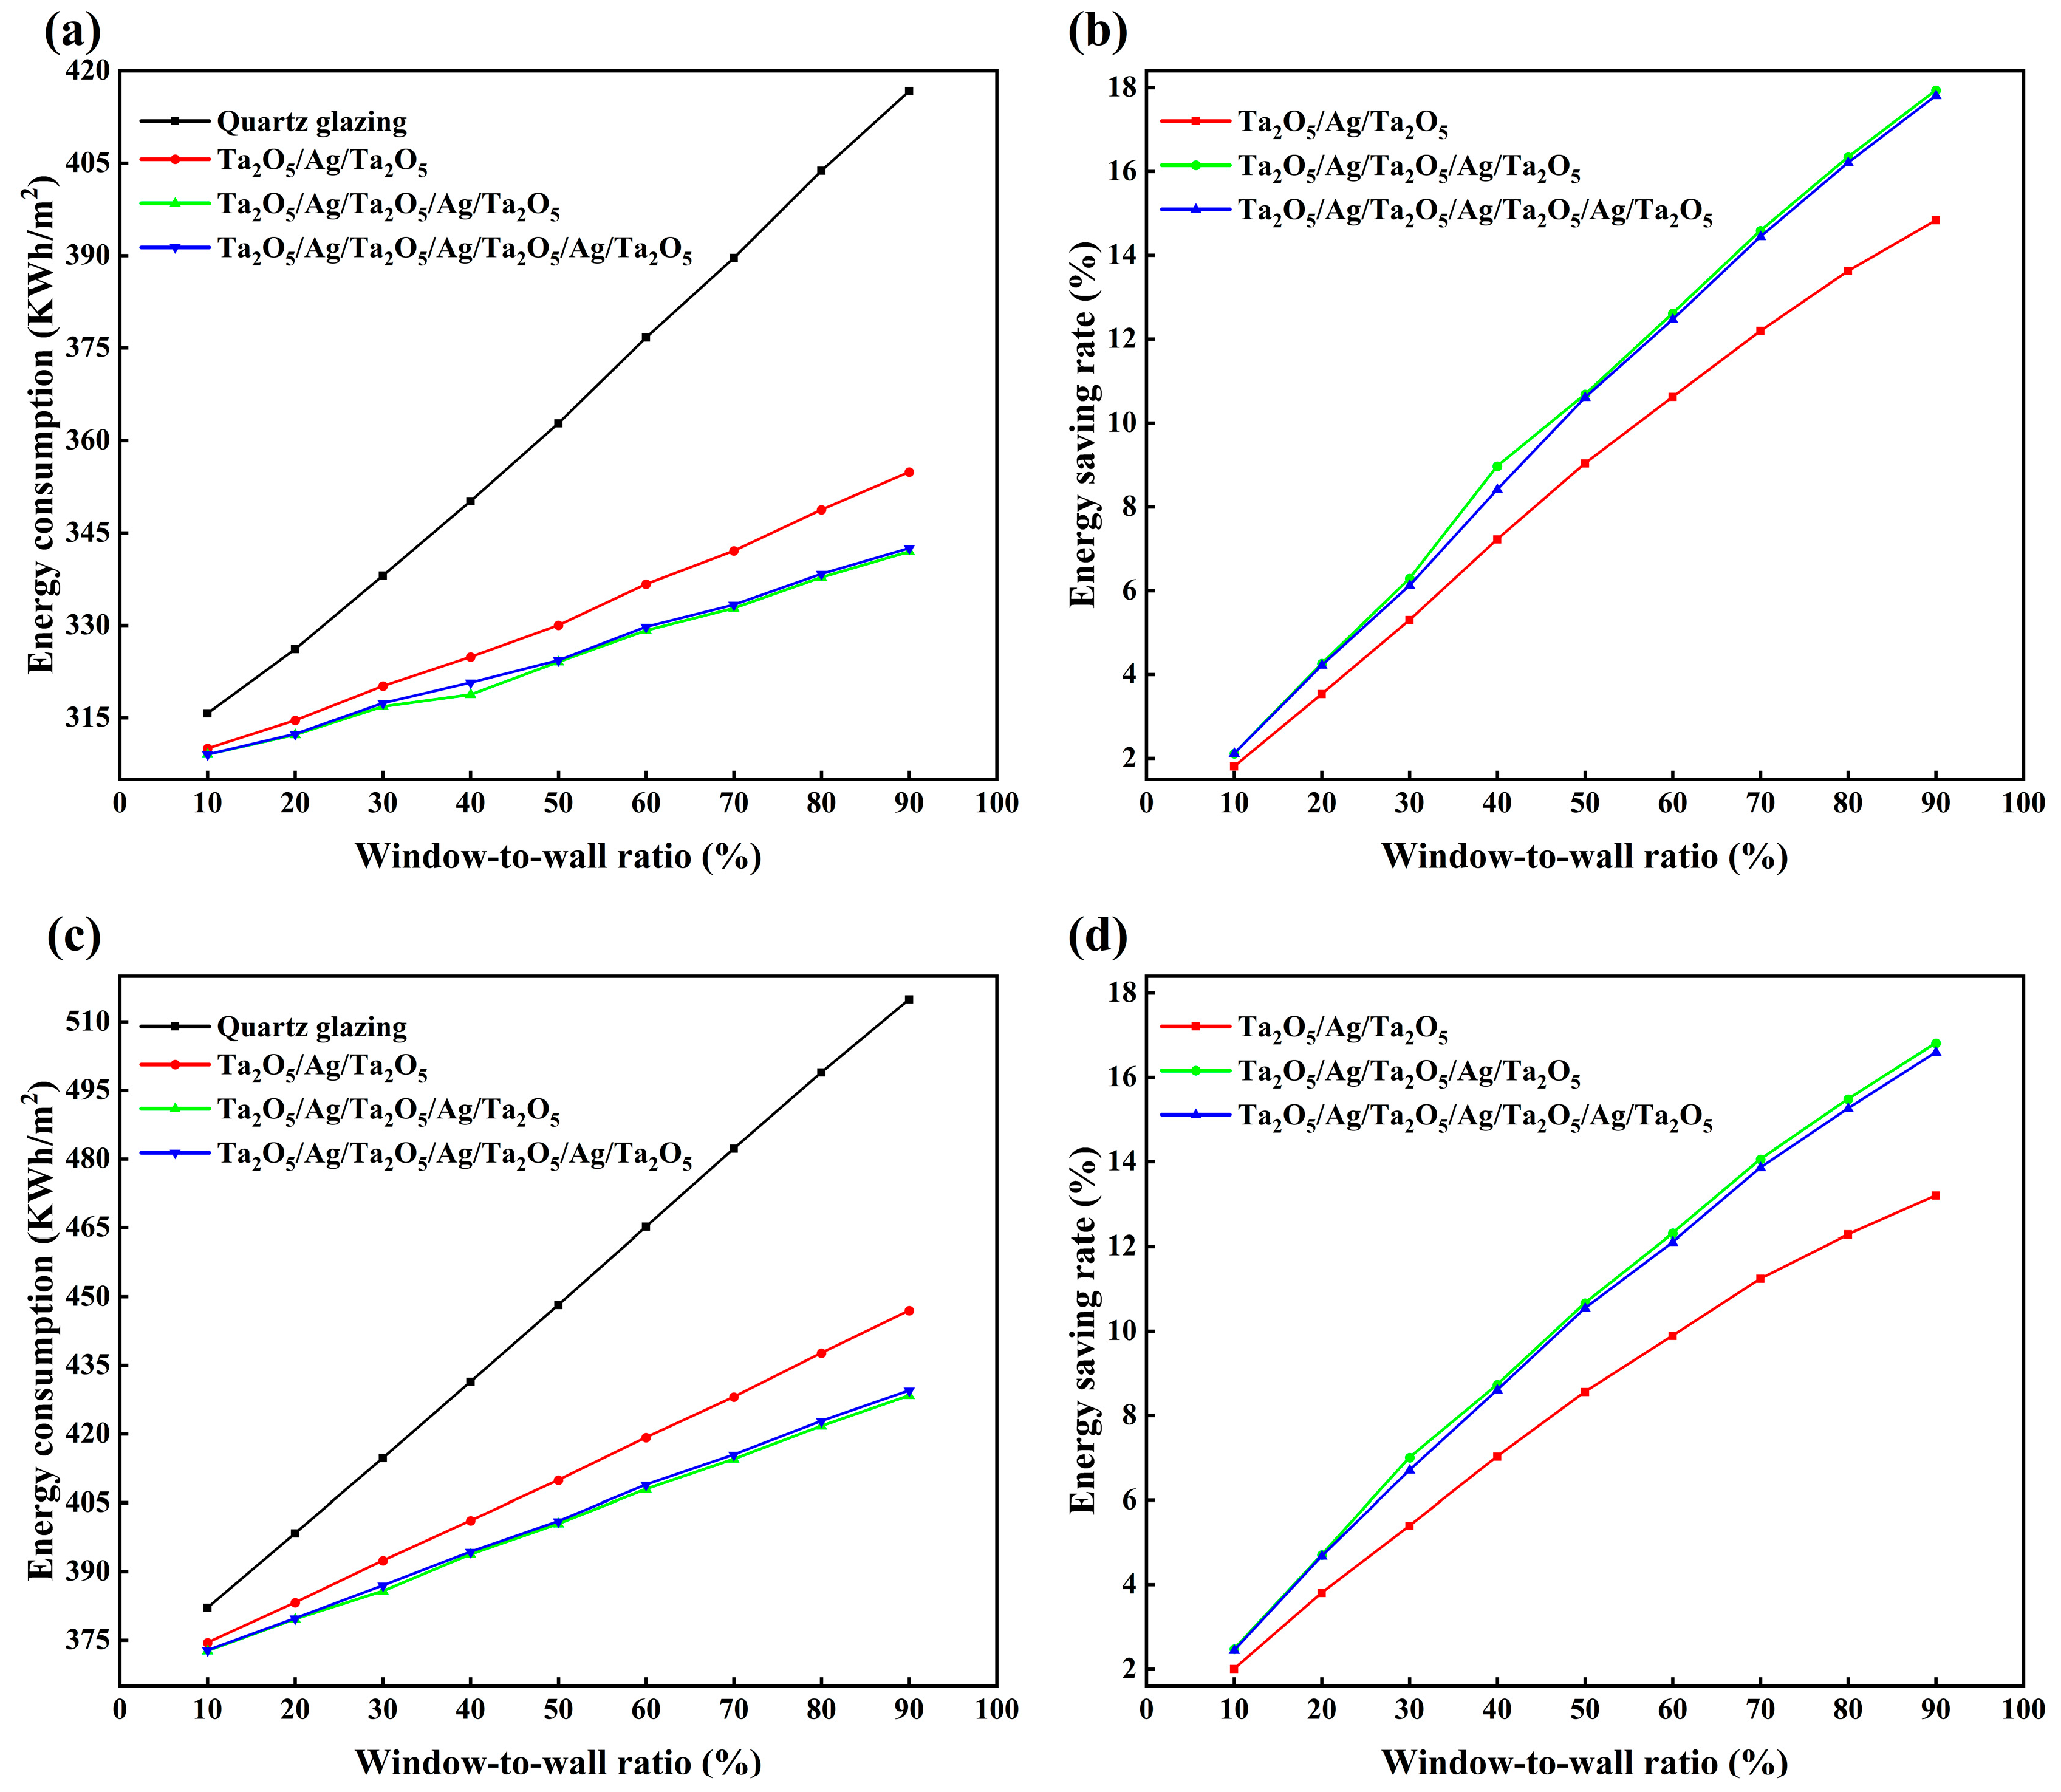
- A 17.93% energy saving rate is achieved at a window-to-wall ratio of 90%.
Abstract

1. Introduction
2. Methodology
2.1. Data Preparation and Preprocessing
2.2. Optimization Framework Design
2.3. Model Training
2.4. Optical Simulations
2.5. Building Energy Consumption Simulation
3. Results and Discussion
3.1. Evaluation of the Optimized Film Performance
3.2. Simulated Optical Properties
3.3. Building Energy Performance
4. Conclusions
Supplementary Materials
Author Contributions
Funding
Institutional Review Board Statement
Informed Consent Statement
Data Availability Statement
Conflicts of Interest
References
- Zhang, L.; Yang, L.; Zohner, C.M.; Crowther, T.W.; Li, M.; Shen, F.; Guo, M.; Qin, J.; Yao, L.; Zhou, C. Direct and indirect impacts of urbanization on vegetation growth across the world’s cities. Sci. Adv. 2022, 8, eabo0095. [Google Scholar] [CrossRef] [PubMed]
- Abbasi, K.R.; Shahbaz, M.; Zhang, J.; Irfan, M.; Alvarado, R. Analyze the environmental sustainability factors of China: The role of fossil fuel energy and renewable energy. Renew. Energy 2022, 187, 390–402. [Google Scholar] [CrossRef]
- Chu, S.; Majumdar, A. Opportunities and challenges for a sustainable energy future. Nature 2012, 488, 294–303. [Google Scholar] [CrossRef] [PubMed]
- Zhou, Y.; Jin, H.; Li, C.; Ding, L. Spatio-temporal patterns and impact mechanisms of CO2 emissions from China's construction industry under urbanization. Sustain. Cities Soc. 2024, 106, 105353. [Google Scholar] [CrossRef]
- Tan, J.; Peng, S.; Liu, E. Spatio-temporal distribution and peak prediction of energy consumption and carbon emissions of residential buildings in China. Appl. Energy 2024, 376, 124330. [Google Scholar] [CrossRef]
- Zhang, R.; Li, R.; Xu, P.; Zhong, W.; Zhang, Y.; Luo, Z.; Xiang, B. Thermochromic smart window utilizing passive radiative cooling for self-adaptive thermoregulation. Chem. Eng. J. 2023, 471, 144527. [Google Scholar] [CrossRef]
- Rezaei, S.D.; Shannigrahi, S.; Ramakrishna, S. A review of conventional, advanced, and smart glazing technologies and materials for improving indoor environment. Sol. Energy Mater. Sol. Cells 2017, 159, 26–51. [Google Scholar] [CrossRef]
- Gao, Y.; Jonsson, J.C.; Curcija, D.C.; Vidanovic, S.; Hong, T. Global and regional perspectives on optimizing thermo-responsive dynamic windows for energy-efficient buildings. Nat. Commun. 2025, 16, 199. [Google Scholar] [CrossRef]
- Raman, A.P.; Anoma, M.A.; Zhu, L.; Rephaeli, E.; Fan, S. Passive radiative cooling below ambient air temperature under direct sunlight. Nature 2014, 515, 540–544. [Google Scholar] [CrossRef]
- Cuce, E.; Riffat, S.B. A state-of-the-art review on innovative glazing technologies. Renew. Sustain. Energy Rev. 2015, 41, 695–714. [Google Scholar] [CrossRef]
- Wang, Y.; Ji, H.; Liu, B.; Tang, P.; Chen, Y.; Huang, J.; Ou, Y.; Tao, J. Radiative cooling: Structure design and application. J. Mater. Chem. A 2024, 12, 9962–9978. [Google Scholar] [CrossRef]
- Wang, S.; Zhou, Y.; Jiang, T.; Yang, R.; Tan, G.; Long, Y. Thermochromic smart windows with highly regulated radiative cooling and solar transmission. Nano Energy 2021, 89, 106440. [Google Scholar] [CrossRef]
- Wang, S.; Jiang, T.; Meng, Y.; Yang, R.; Tan, G.; Long, Y. Scalable thermochromic smart windows with passive radiative cooling regulation. Science 2021, 374, 1501–1504. [Google Scholar] [CrossRef]
- Hong, X.; Yang, Y.; Chen, H.; Tao, Q. Design, fabrication and energy-saving evaluation of five-layer structure based transparent heat mirror coatings for windows application. Build. Simul. 2023, 16, 2333–2342. [Google Scholar] [CrossRef]
- Lanfranchi, A.; Megahd, H.; Lova, P.; Comoretto, D. Multilayer polymer photonic aegises against near-infrared solar irradiation heating. ACS Appl. Mater. Interfaces 2022, 14, 14550–14560. [Google Scholar] [CrossRef] [PubMed]
- D’Orazio, J.; Jarrett, S.; Amaro-Ortiz, A.; Scott, T. UV radiation and the skin. Int. J. Mol. Sci. 2013, 14, 12222–12248. [Google Scholar] [CrossRef]
- Zhang, J.; Xi, S.; Mao, G.; Yin, R.; Zhu, L.; Li, D.; Yao, Z.; Mi, H.-Y.; Han, J.; Liu, C. Robust and efficient UV-reflecting one-dimensional photonic crystals enabled by organic/inorganic nanocomposite thin films for photoprotection of transparent polymers. J. Mater. Chem. C 2021, 9, 4223–4232. [Google Scholar] [CrossRef]
- Fan, J.C.; Bachner, F.J. Transparent heat mirrors for solar-energy applications. Appl. Opt. 1976, 15, 1012–1017. [Google Scholar] [CrossRef]
- Dalapati, G.K.; Masudy-Panah, S.; Chua, S.T.; Sharma, M.; Wong, T.I.; Tan, H.R.; Chi, D. Color tunable low cost transparent heat reflector using copper and titanium oxide for energy saving application. Sci. Rep. 2016, 6, 20182. [Google Scholar] [CrossRef]
- Sibin, K.; Selvakumar, N.; Kumar, A.; Dey, A.; Sridhara, N.; Shashikala, H.; Sharma, A.K.; Barshilia, H.C. Design and development of ITO/Ag/ITO spectral beam splitter coating for photovoltaic-thermoelectric hybrid systems. Sol. Energy 2017, 141, 118–126. [Google Scholar] [CrossRef]
- Chen, Y.; Long, P.; Liu, B.; Wang, Y.; Wang, J.; Ma, T.; Wei, H.; Kang, Y.; Ji, H. Development and application of Few-shot learning methods in materials science under data scarcity. J. Mater. Chem. A 2024, 12, 30249–30268. [Google Scholar] [CrossRef]
- Lu, M.; Ji, H.; Chen, Y.; Gao, F.; Liu, B.; Long, P.; Deng, C.; Wang, Y.; Tao, J. Machine learning assisted layer-controlled synthesis of MoS2. J. Mater. Chem. C 2024, 12, 8893–8900. [Google Scholar] [CrossRef]
- Narvaez, G.; Giraldo, L.F.; Bressan, M.; Pantoja, A. Machine learning for site-adaptation and solar radiation forecasting. Renew. Energy 2021, 167, 333–342. [Google Scholar] [CrossRef]
- Chen, Y.; Ji, H.; Lu, M.; Liu, B.; Zhao, Y.; Ou, Y.; Wang, Y.; Tao, J.; Zou, T.; Huang, Y. Machine learning guided hydrothermal synthesis of thermochromic VO2 nanoparticles. Ceram. Int. 2023, 49, 30794–30800. [Google Scholar] [CrossRef]
- Lu, M.; Ji, H.; Zhao, Y.; Chen, Y.; Tao, J.; Ou, Y.; Wang, Y.; Huang, Y.; Wang, J.; Hao, G. Machine learning-assisted synthesis of two-dimensional materials. ACS Appl. Mater. Interfaces 2022, 15, 1871–1878. [Google Scholar] [CrossRef]
- Xu, X.; Shen, B.; Ding, S.; Srivastava, G.; Bilal, M.; Khosravi, M.R.; Menon, V.G.; Jan, M.A.; Wang, M. Service offloading with deep Q-network for digital twinning-empowered Internet of Vehicles in edge computing. IEEE Trans. Ind. Inform. 2020, 18, 1414–1423. [Google Scholar] [CrossRef]
- Heil, C.M.; Patil, A.; Dhinojwala, A.; Jayaraman, A. Computational reverse-engineering analysis for scattering experiments (CREASE) with machine learning enhancement to determine structure of nanoparticle mixtures and solutions. ACS Cent. Sci. 2022, 8, 996–1007. [Google Scholar] [CrossRef]
- Chen, Y.; Ji, H.; Long, P.; Liu, B.; Wang, Y.; Ou, Y.; Deng, C.; Huang, Y.; Wang, J. Reinforcement learning-based inverse design of composite films for spacecraft smart thermal control. Phys. Chem. Chem. Phys. 2025, 27, 7753–7762. [Google Scholar] [CrossRef]
- Ladosz, P.; Weng, L.; Kim, M.; Oh, H. Exploration in deep reinforcement learning: A survey. Inf. Fusion 2022, 85, 1–22. [Google Scholar] [CrossRef]
- Al-Kuhaili, M. Enhancement of plasmonic transmittance of porous gold thin films via gold/metal oxide bi-layers for solar energy-saving applications. Sol. Energy 2019, 181, 456–463. [Google Scholar] [CrossRef]
- Okada, M.; Tazawa, M.; Jin, P.; Yamada, Y.; Yoshimura, K. Fabrication of photocatalytic heat-mirror with TiO2/TiN/TiO2 stacked layers. Vacuum 2006, 80, 732–735. [Google Scholar] [CrossRef]
- Chang, T.; Cao, X.; Long, Y.; Luo, H.; Jin, P. How to properly evaluate and compare the thermochromic performance of VO2-based smart coatings. J. Mater. Chem. A 2019, 7, 24164–24172. [Google Scholar] [CrossRef]
- Dang, S.; Yi, Y.; Ye, H. A visible transparent solar infrared reflecting film with a low long-wave emittance. Sol. Energy 2020, 195, 483–490. [Google Scholar] [CrossRef]
- Luce, A.; Mahdavi, A.; Marquardt, F.; Wankerl, H. TMM-Fast, a transfer matrix computation package for multilayer thin-film optimization: Tutorial. J. Opt. Soc. Am. A 2022, 39, 1007–1013. [Google Scholar] [CrossRef]
- Volterrani, M.; Minelli, A.; Gaetani, M.; Grossi, N.; Magni, S.; Caturegli, L. Reflectance, absorbance and transmittance spectra of bermudagrass and manilagrass turfgrass canopies. PLoS ONE 2017, 12, e0188080. [Google Scholar] [CrossRef]
- Hao, X.; Wei, G.; Zhang, H.; Tan, S.; Ji, G. Defect chemistry-regulated design of doping CeO2 with the enhanced high-temperature low infrared emissivity property. Mater. Today Nano 2025, 30, 100614. [Google Scholar] [CrossRef]
- Xu, G.; Kang, Q.; Zhang, X.; Wang, W.; Guo, K.; Guo, Z. Inverse-design laser-infrared compatible stealth with thermal management enabled by wavelength-selective thermal emitter. Appl. Therm. Eng. 2024, 255, 124063. [Google Scholar] [CrossRef]
- Quan, C.; Gu, S.; Liu, P.; Xu, W.; Guo, C.; Zhang, J.; Zhu, Z. Spectrally selective radiation infrared stealth based on a simple Mo/Ge bilayer metafilm. Opt. Lasers Eng. 2024, 180, 108328. [Google Scholar] [CrossRef]
- Fenjiro, Y.; Benbrahim, H. Deep reinforcement learning overview of the state of the art. J. Autom. Mob. Robot. Intell. Syst. 2018, 12, 20–39. [Google Scholar] [CrossRef]
- Timofeev, V.A.; Skvortsov, I.V.; Mashanov, V.I.; Gayduk, A.E.; Bloshkin, A.A.; Kirienko, V.V.; Utkin, D.E.; Nikiforov, A.I.; Kolyada, D.V.; Firsov, D.D. Excitation of hybrid modes in plasmonic nanoantennas coupled with GeSiSn/Si multiple quantum wells for the photoresponse enhancement in the short-wave infrared range. Appl. Surf. Sci. 2024, 659, 159852. [Google Scholar] [CrossRef]
- Liu, X. Three-dimensional visualized urban landscape planning and design based on virtual reality technology. IEEE Access 2020, 8, 149510–149521. [Google Scholar] [CrossRef]
- Jia, Y.; Liu, D.; Chen, D.; Jin, Y.; Chen, C.; Tao, J.; Cheng, H.; Zhou, S.; Cheng, B.; Wang, X. Transparent dynamic infrared emissivity regulators. Nat. Commun. 2023, 14, 5087. [Google Scholar] [CrossRef] [PubMed]
- Long, L.; Ye, H. Dual-intelligent windows regulating both solar and long-wave radiations dynamically. Sol. Energy Mater. Sol. Cells 2017, 169, 145–150. [Google Scholar] [CrossRef]
- Al-Kuhaili, M.; Al-Aswad, A.; Durrani, S.; Bakhtiari, I. Energy-saving transparent heat mirrors based on tungsten oxide–gold WO3/Au/WO3 multilayer structures. Sol. Energy 2012, 86, 3183–3189. [Google Scholar] [CrossRef]
- Zheng, L.; Zhang, S.; Yao, Q.; Lin, K.; Rao, A.; Niu, C.; Yang, M.; Wang, L.; Lv, Y. High reflectance tunable multi-color electrochromic films based on Fabry–Perot cavity. Ceram. Int. 2023, 49, 13355–13362. [Google Scholar] [CrossRef]
- Ciesielski, A.; Skowronski, L.; Trzcinski, M.; Górecka, E.; Trautman, P.; Szoplik, T. Evidence of germanium segregation in gold thin films. Surf. Sci. 2018, 674, 73–78. [Google Scholar] [CrossRef]
- Luke, K.; Okawachi, Y.; Lamont, M.R.; Gaeta, A.L.; Lipson, M. Broadband mid-infrared frequency comb generation in a Si3N4 microresonator. Opt. Lett. 2015, 40, 4823–4826. [Google Scholar] [CrossRef]
- Gao, L.; Lemarchand, F.; Lequime, M. Exploitation of multiple incidences spectrometric measurements for thin film reverse engineering. Opt. Express 2012, 20, 15734–15751. [Google Scholar] [CrossRef]
- Babar, S.; Weaver, J. Optical constants of Cu, Ag, and Au revisited. Appl. Opt. 2015, 54, 477–481. [Google Scholar] [CrossRef]
- Franta, D.; Nečas, D.; Ohlídal, I.; Giglia, A. Dispersion model for optical thin films applicable in wide spectral range. In Proceedings of the SPIE 9628, Optical Systems Design 2015: Optical Fabrication, Testing, and Metrology V, 96281U, Jena, Germany, 24 September 2015; pp. 342–353. [Google Scholar]
- Pflüger, J.; Fink, J. Determination of optical constants by high-energy, electron-energy-loss spectroscopy (EELS). In Handbook of Optical Constants of Solids; Elsevier: Amsterdam, The Netherlands, 1997; pp. 293–311. [Google Scholar]
- Aguilar, O.; de Castro, S.; Godoy, M.P.; Rebello Sousa Dias, M. Optoelectronic characterization of Zn1-xCdxO thin films as an alternative to photonic crystals in organic solar cells. Opt. Mater. Express 2019, 9, 3638–3648. [Google Scholar] [CrossRef]
- Beliaev, L.Y.; Shkondin, E.; Lavrinenko, A.V.; Takayama, O. Thickness-dependent optical properties of aluminum nitride films for mid-infrared wavelengths. J. Vac. Sci. Technol. A 2021, 39, 043408. [Google Scholar] [CrossRef]
- Ozaki, S.O.S.; Adachi, S.A.S. Optical constants of cubic ZnS. Jpn. J. Appl. Phys. 1993, 32, 5008. [Google Scholar] [CrossRef]
- Franta, D.; Nečas, D.; Ohlídal, I. Universal dispersion model for characterization of optical thin films over a wide spectral range: Application to hafnia. Appl. Opt. 2015, 54, 9108–9119. [Google Scholar] [CrossRef] [PubMed]
- Kulikova, D.P.; Dobronosova, A.A.; Kornienko, V.V.; Nechepurenko, I.A.; Baburin, A.S.; Sergeev, E.V.; Lotkov, E.S.; Rodionov, I.A.; Baryshev, A.V.; Dorofeenko, A.V. Optical properties of tungsten trioxide, palladium, and platinum thin films for functional nanostructures engineering. Opt. Express 2020, 28, 32049–32060. [Google Scholar] [CrossRef]
- Minenkov, A.; Hollweger, S.; Duchoslav, J.; Erdene-Ochir, O.; Weise, M.; Ermilova, E.; Hertwig, A.; Schiek, M. Monitoring the electrochemical failure of indium tin oxide electrodes via operando ellipsometry complemented by electron microscopy and spectroscopy. ACS Appl. Mater. Interfaces 2024, 16, 9517–9531. [Google Scholar] [CrossRef]
- Treharne, R.; Seymour-Pierce, A.; Durose, K.; Hutchings, K.; Roncallo, S.; Lane, D. Optical design and fabrication of fully sputtered CdTe/CdS solar cells. J. Phys. Conf. Ser. 2011, 286, 012038. [Google Scholar] [CrossRef]


| Structure | (%) | (%) | Optimization Method | Reference |
|---|---|---|---|---|
| TiO2/Ag/TiO2 | 62.5 | 71.9 | PSO | Dalapati et al. [19] |
| ZnO/Ag/ZnO | 87.1 | 58.9 | PSO | Dang et al. [33] |
| Si3N4/Ag/Si3N4 | 92.5 | 74.6 | PSO | Hong et al. [14] |
| WO3/Au/WO3 | 79.0 | 60.3 | PSO | Al-Kuhaili et al. [44] |
| Ta2O5/Ag/Ta2O5 | 83.0 | 81.7 | DRL | This work |
| TiO2/Ag/TiO2/Ag/TiO2 | 87 | 93.2 | DRL | This work |
Disclaimer/Publisher’s Note: The statements, opinions and data contained in all publications are solely those of the individual author(s) and contributor(s) and not of MDPI and/or the editor(s). MDPI and/or the editor(s) disclaim responsibility for any injury to people or property resulting from any ideas, methods, instructions or products referred to in the content. |
© 2025 by the authors. Licensee MDPI, Basel, Switzerland. This article is an open access article distributed under the terms and conditions of the Creative Commons Attribution (CC BY) license (https://creativecommons.org/licenses/by/4.0/).
Share and Cite
Zeng, Z.; Ji, H.; Xiao, T.; Long, P.; Liu, B.; Jin, S.; Cao, Y. Deep Reinforcement Learning-Guided Inverse Design of Transparent Heat Mirror Film for Broadband Spectral Selectivity. Materials 2025, 18, 2677. https://doi.org/10.3390/ma18122677
Zeng Z, Ji H, Xiao T, Long P, Liu B, Jin S, Cao Y. Deep Reinforcement Learning-Guided Inverse Design of Transparent Heat Mirror Film for Broadband Spectral Selectivity. Materials. 2025; 18(12):2677. https://doi.org/10.3390/ma18122677
Chicago/Turabian StyleZeng, Zhi, Haining Ji, Tianjian Xiao, Peng Long, Bin Liu, Shisong Jin, and Yuxin Cao. 2025. "Deep Reinforcement Learning-Guided Inverse Design of Transparent Heat Mirror Film for Broadband Spectral Selectivity" Materials 18, no. 12: 2677. https://doi.org/10.3390/ma18122677
APA StyleZeng, Z., Ji, H., Xiao, T., Long, P., Liu, B., Jin, S., & Cao, Y. (2025). Deep Reinforcement Learning-Guided Inverse Design of Transparent Heat Mirror Film for Broadband Spectral Selectivity. Materials, 18(12), 2677. https://doi.org/10.3390/ma18122677