
Methods for Quantitative Determination of Iron Sulfides in Rocks

 ,
,
Abstract
1. Introduction
2. Materials and Methods
2.1. Materials
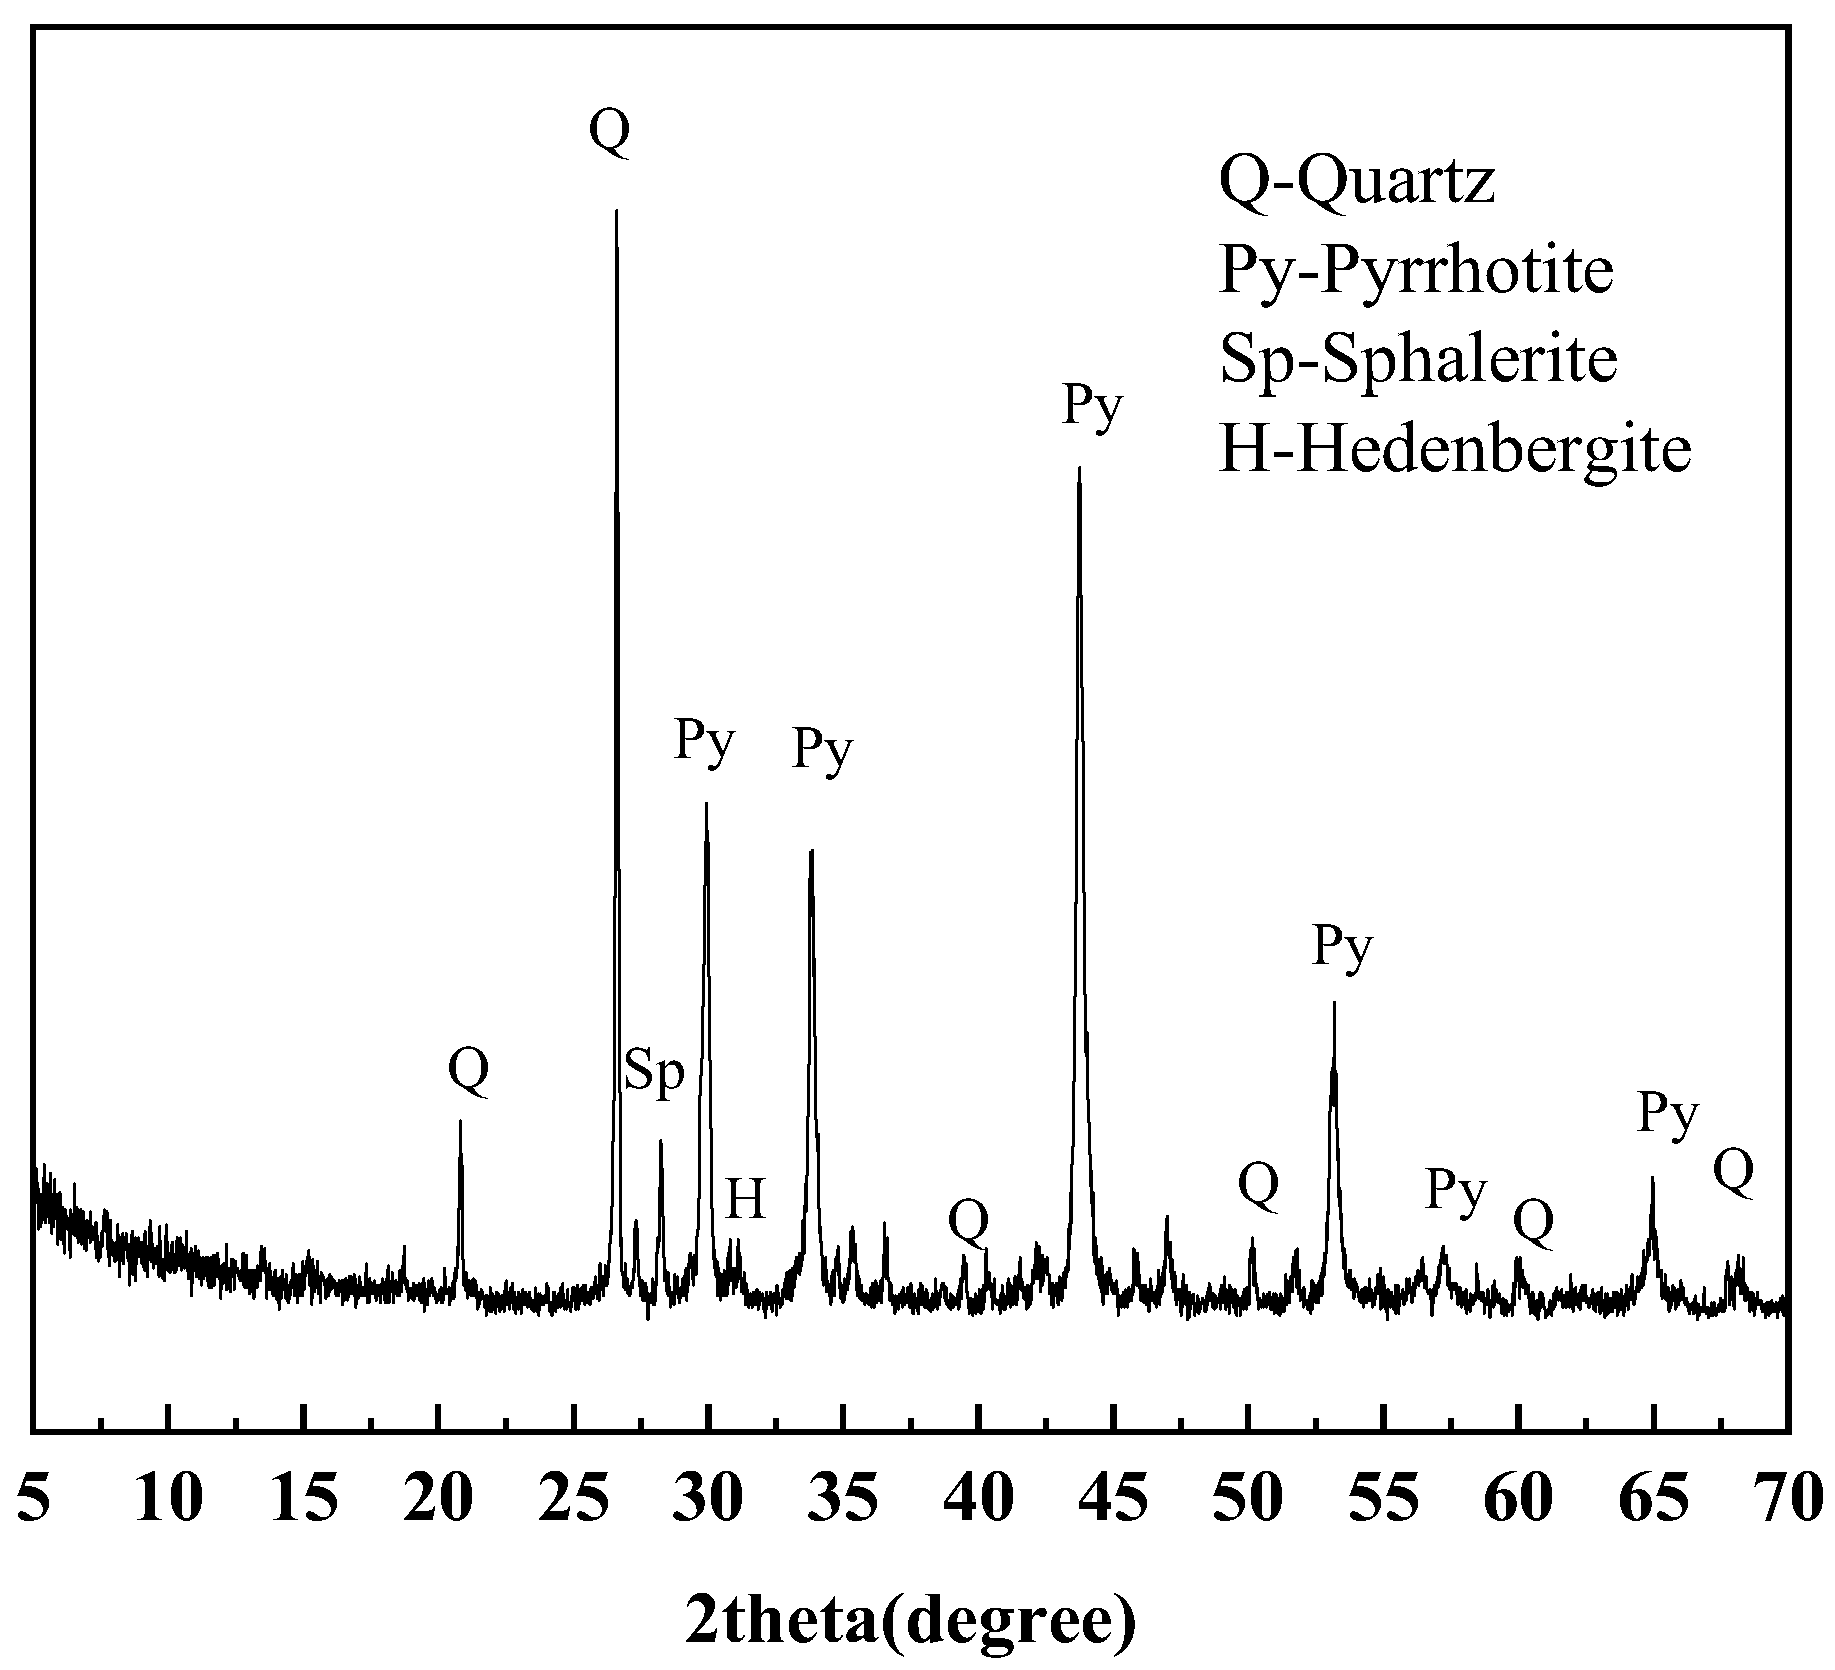
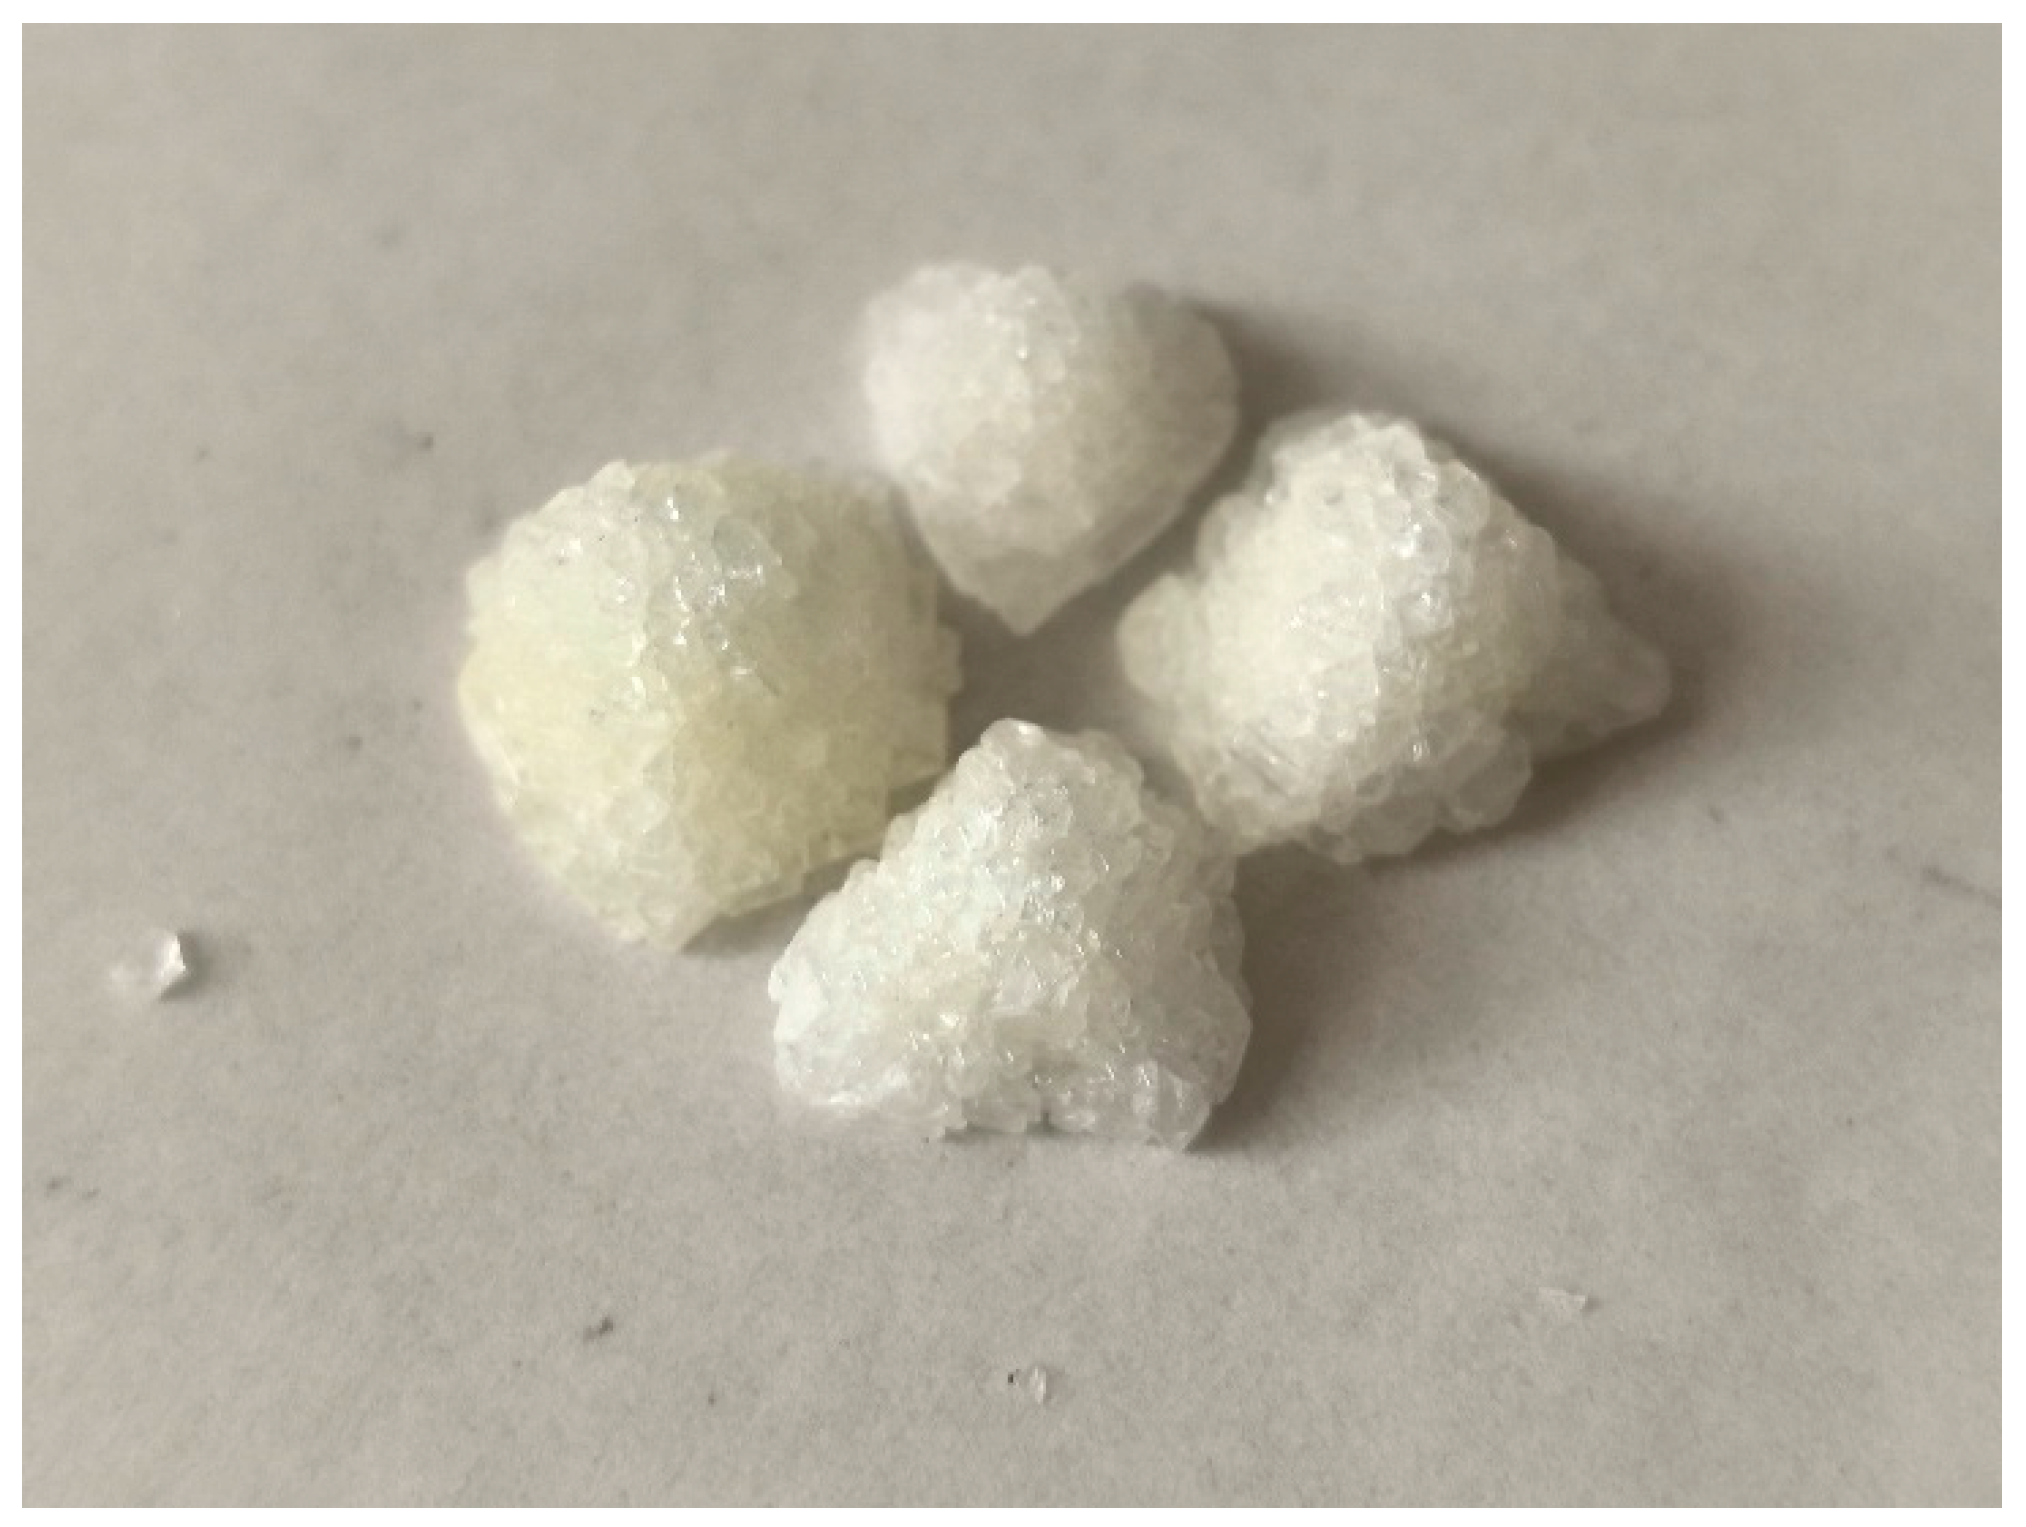
2.1.1. Pyrrhotite
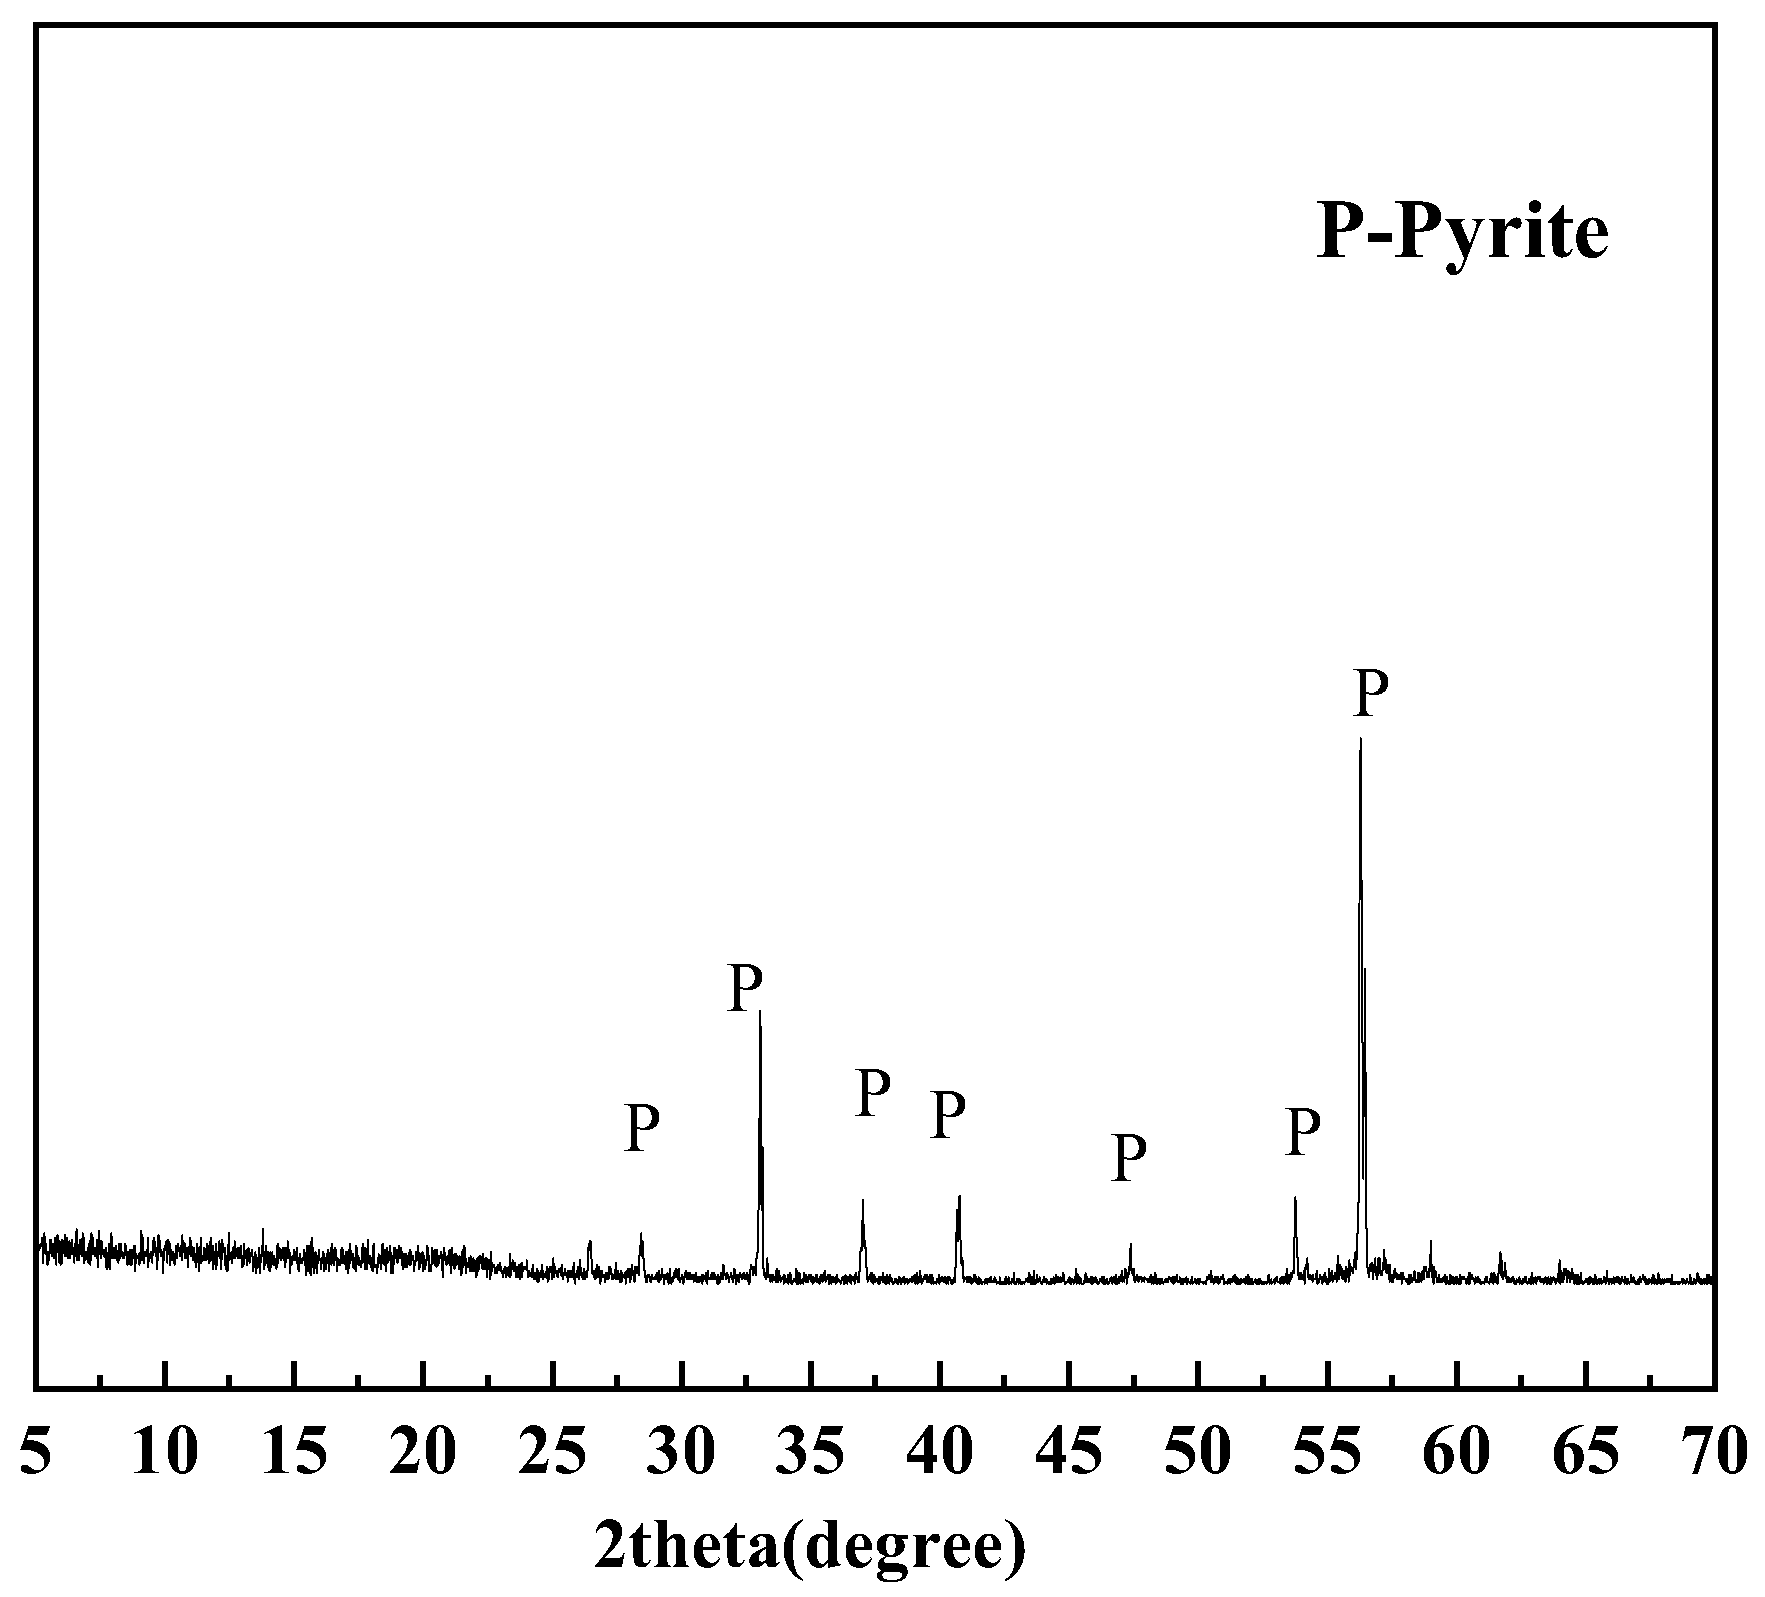
2.1.2. Pyrite
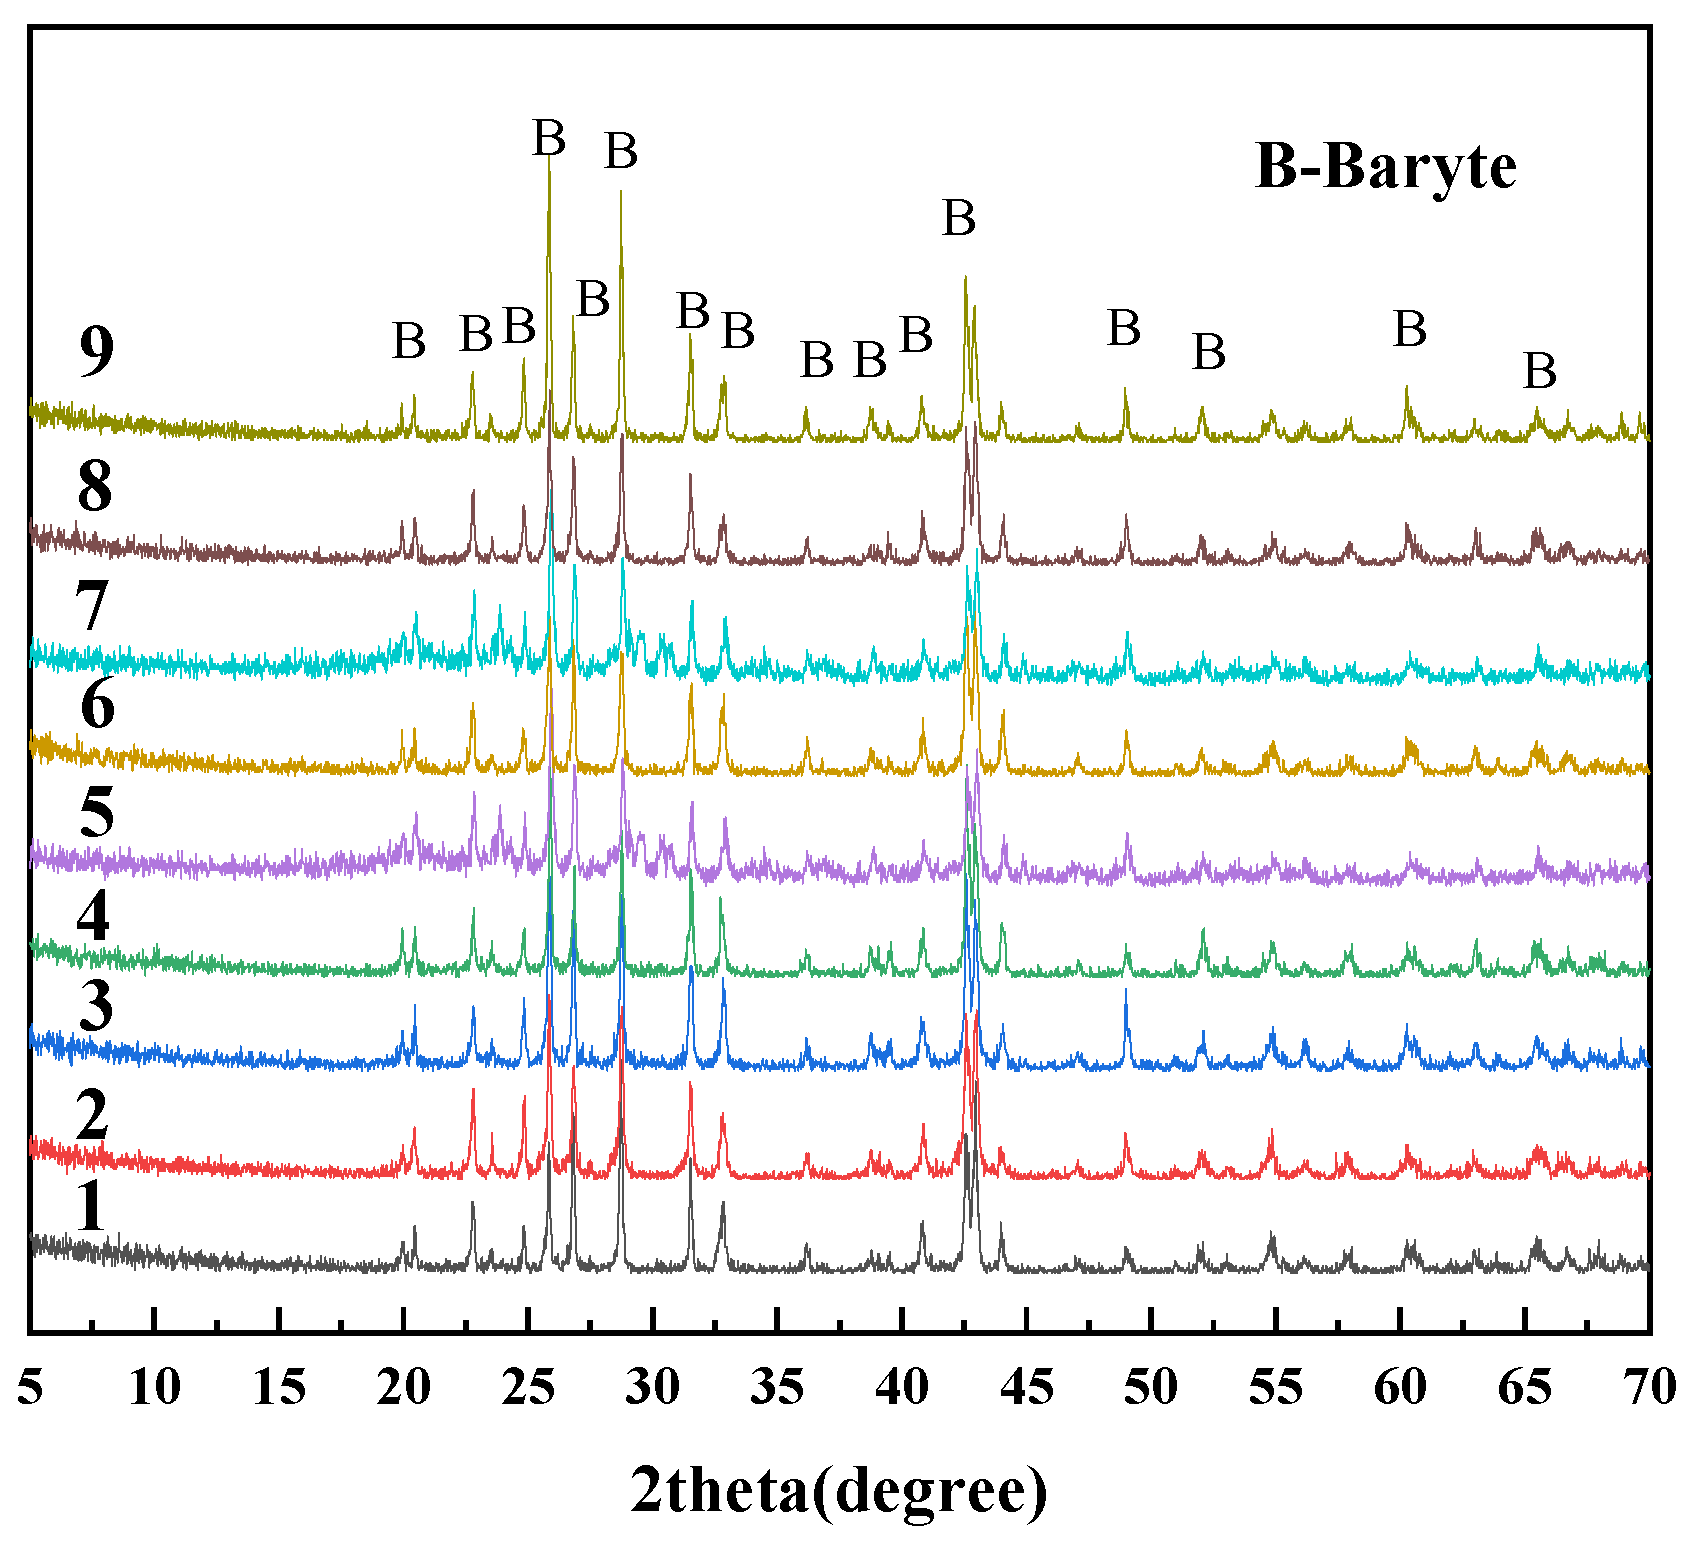
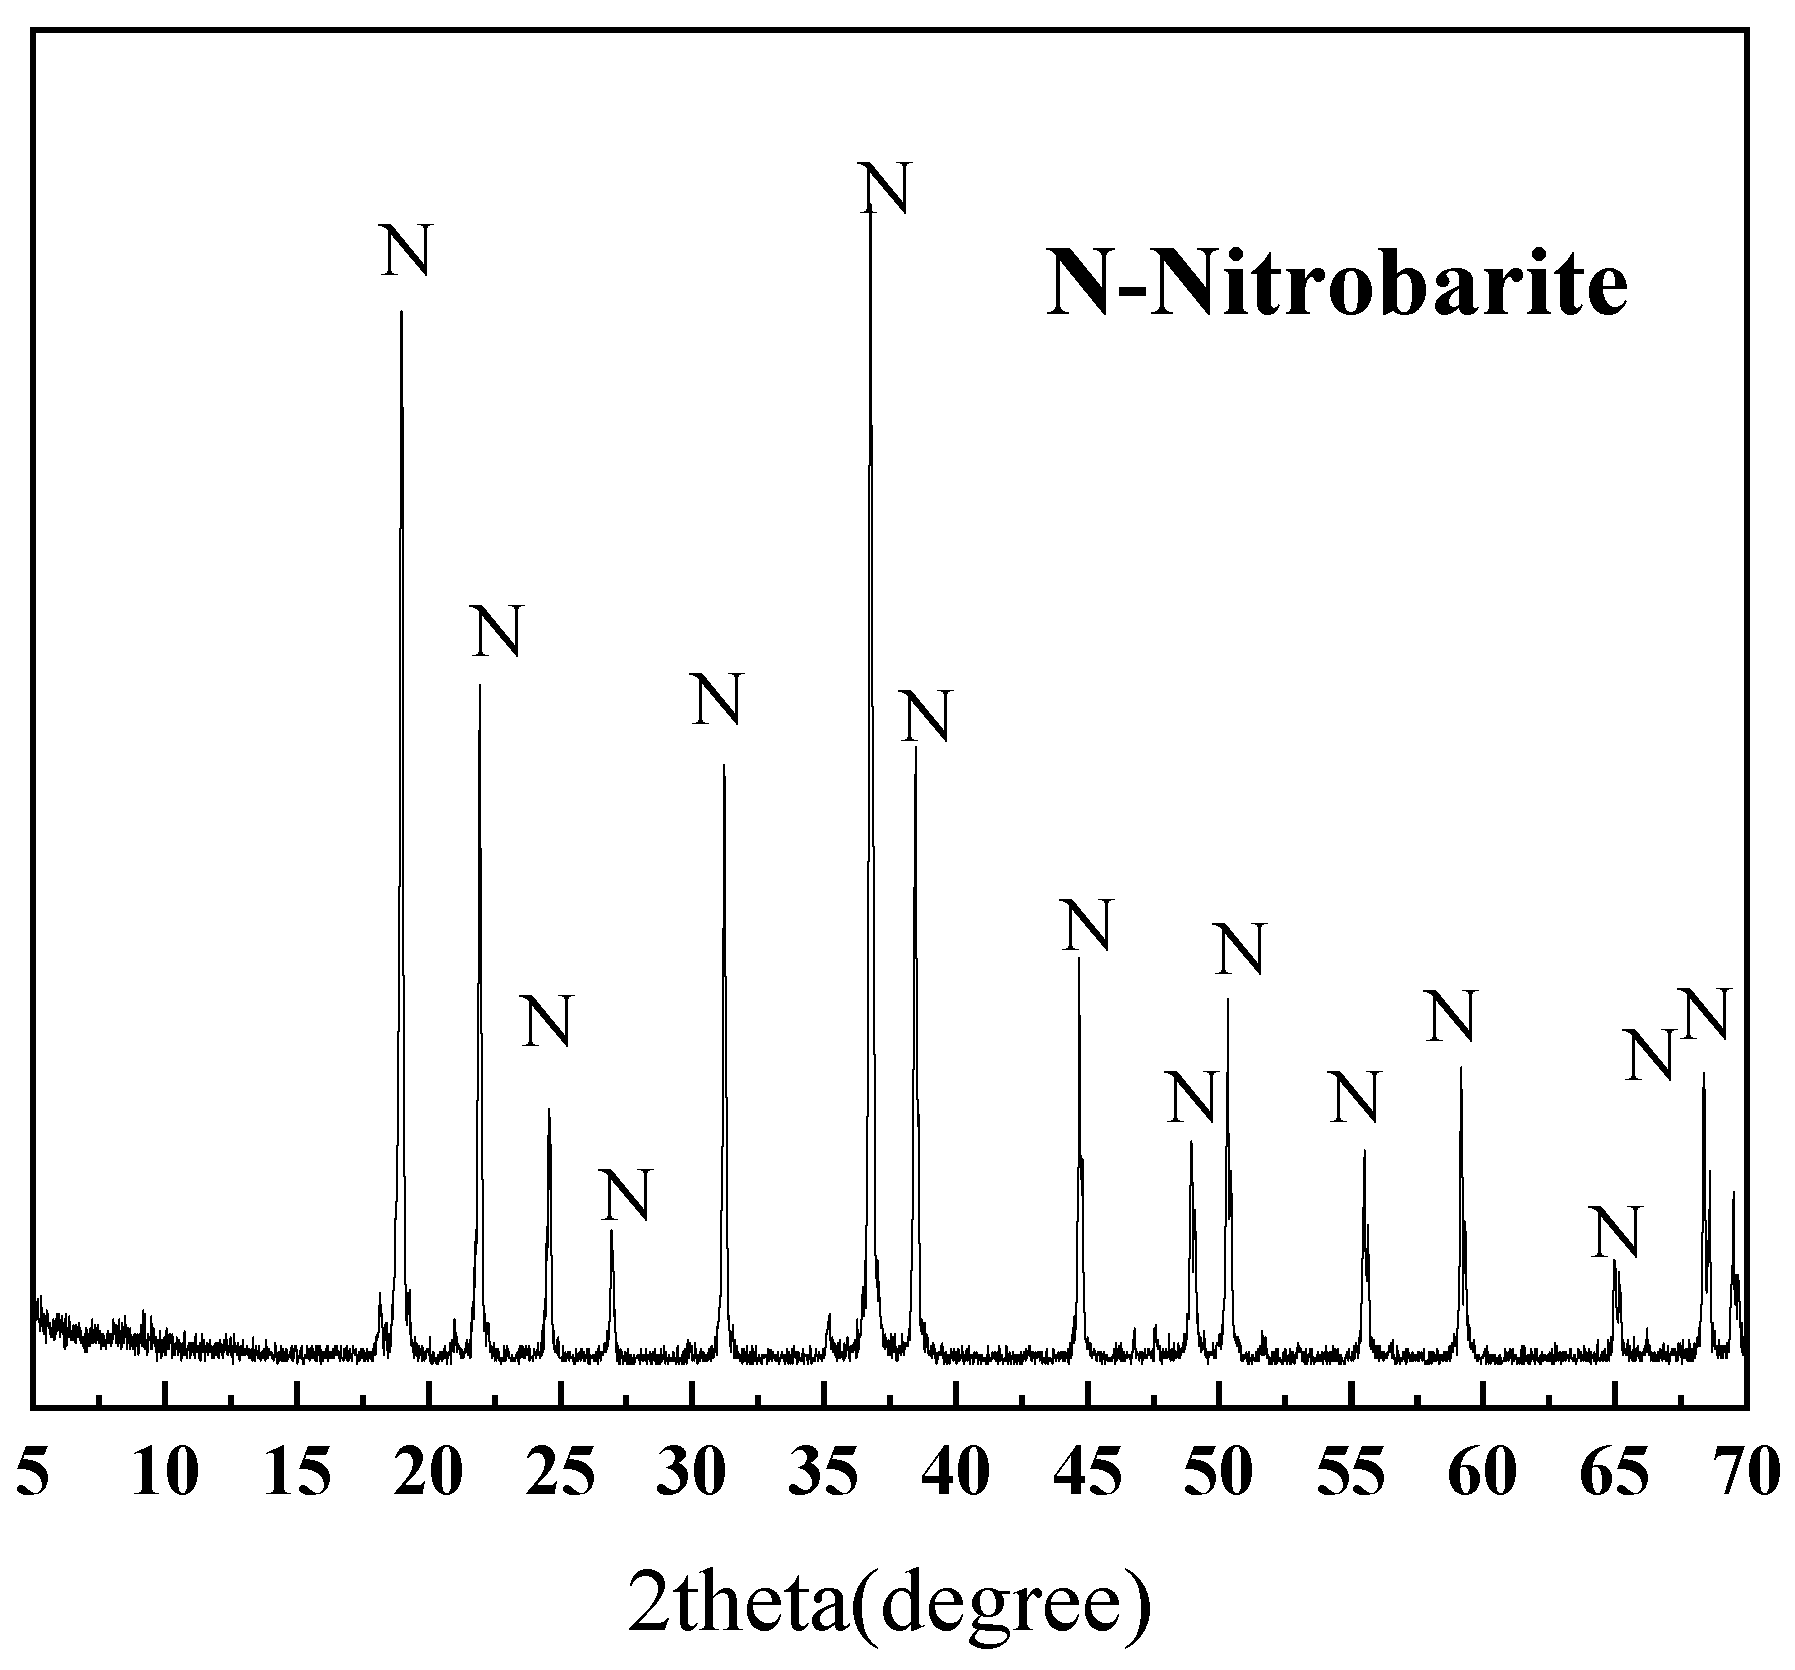
2.1.3. Iron Ore Tailings
2.2. Methods and Device
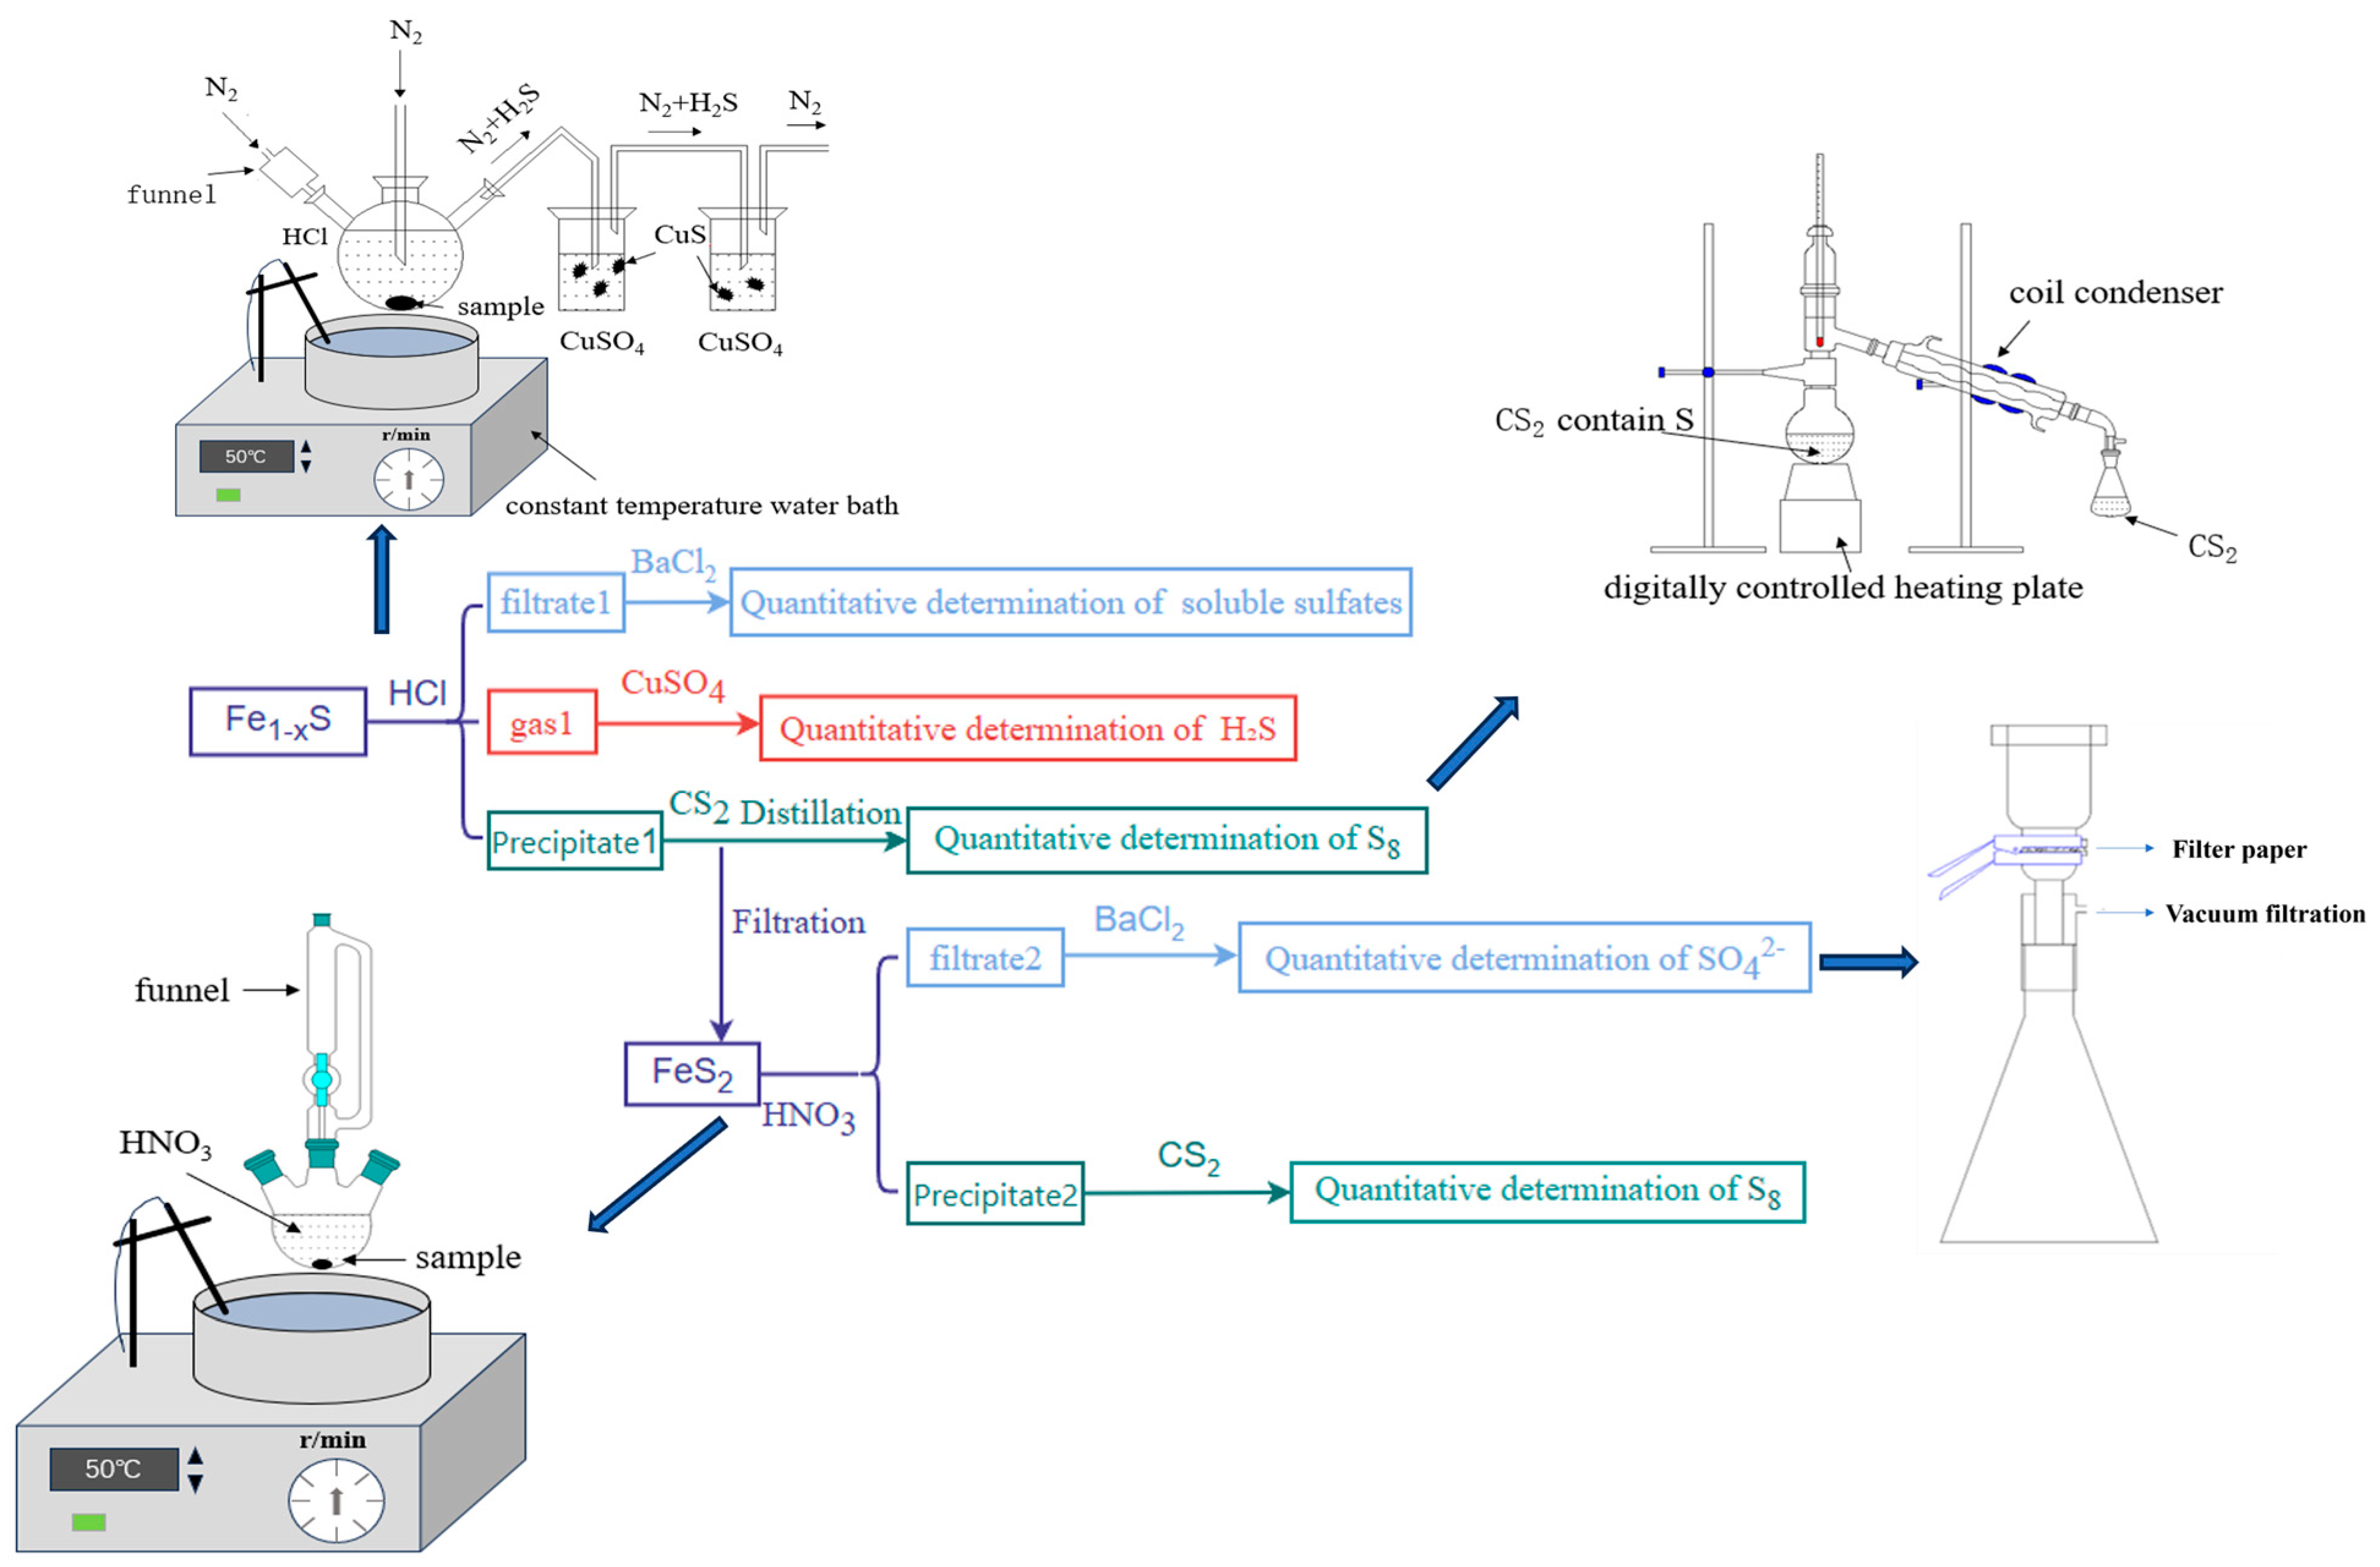
2.2.1. Chemical Dissolution Method
- The pyrrhotite was added to HCl, and the evolved gas was purified using two gas-washing bottles containing CuSO4 solution.
- After the reaction is complete, the reaction mixture is filtered. The filtrate (Filtrate 1) is added with BaCl2 to form precipitate BaSO4, which allows for the quantitative determination of soluble sulfate content.
- While the filter precipitate (precipitate 1) was dried, the dried precipitate 1 was then washed with CS2, followed by filtration. The solution was evaporated to recover elemental sulfur.
- The precipitate in the two gas-washing bottles is filtered, dried, and weighed to obtain the mass of CuS.
- The presence of sphalerite and galena as impurities in the pyrrhotite ore introduces analytical interference, as these minerals are also soluble in HCl. This may affect the accuracy of sulfur quantification. To quantitatively analyze the Pb2+ and Zn2+ ion concentrations in the sample, H2SO4 is added to the filtrate to precipitate Pb2+ ions as PbSO4. The resulting PbSO4 precipitate is dissolved in a pH 5.7 buffer solution (acetic acid/sodium acetate), and the lead content is determined via EDTA complexometric titration. In an ammoniacal medium with the presence of an oxidizing agent, Fe2+ interference is precipitated and separated. Na2S2O3 and NH4F are used as masking agents to eliminate the interference from Cu2+ and Al3+. Zn2+ content is determined by EDTA standard solution titration at pH 5.5–6.0, using xylenol orange as the indicator.
- The pyrite was added to HNO3 solution.
- After the reaction was completed, the mixture was filtered through filter paper to obtain precipitate 2, while filtrate 2 was diluted to 100 mL. BaCl2 solution was added to filtrate 2 to quantitatively precipitate SO42− ions.
- The remaining precipitate was dried, washed with carbon disulfide, and filtered. The resulting solution was then distilled to recover elemental sulfur.
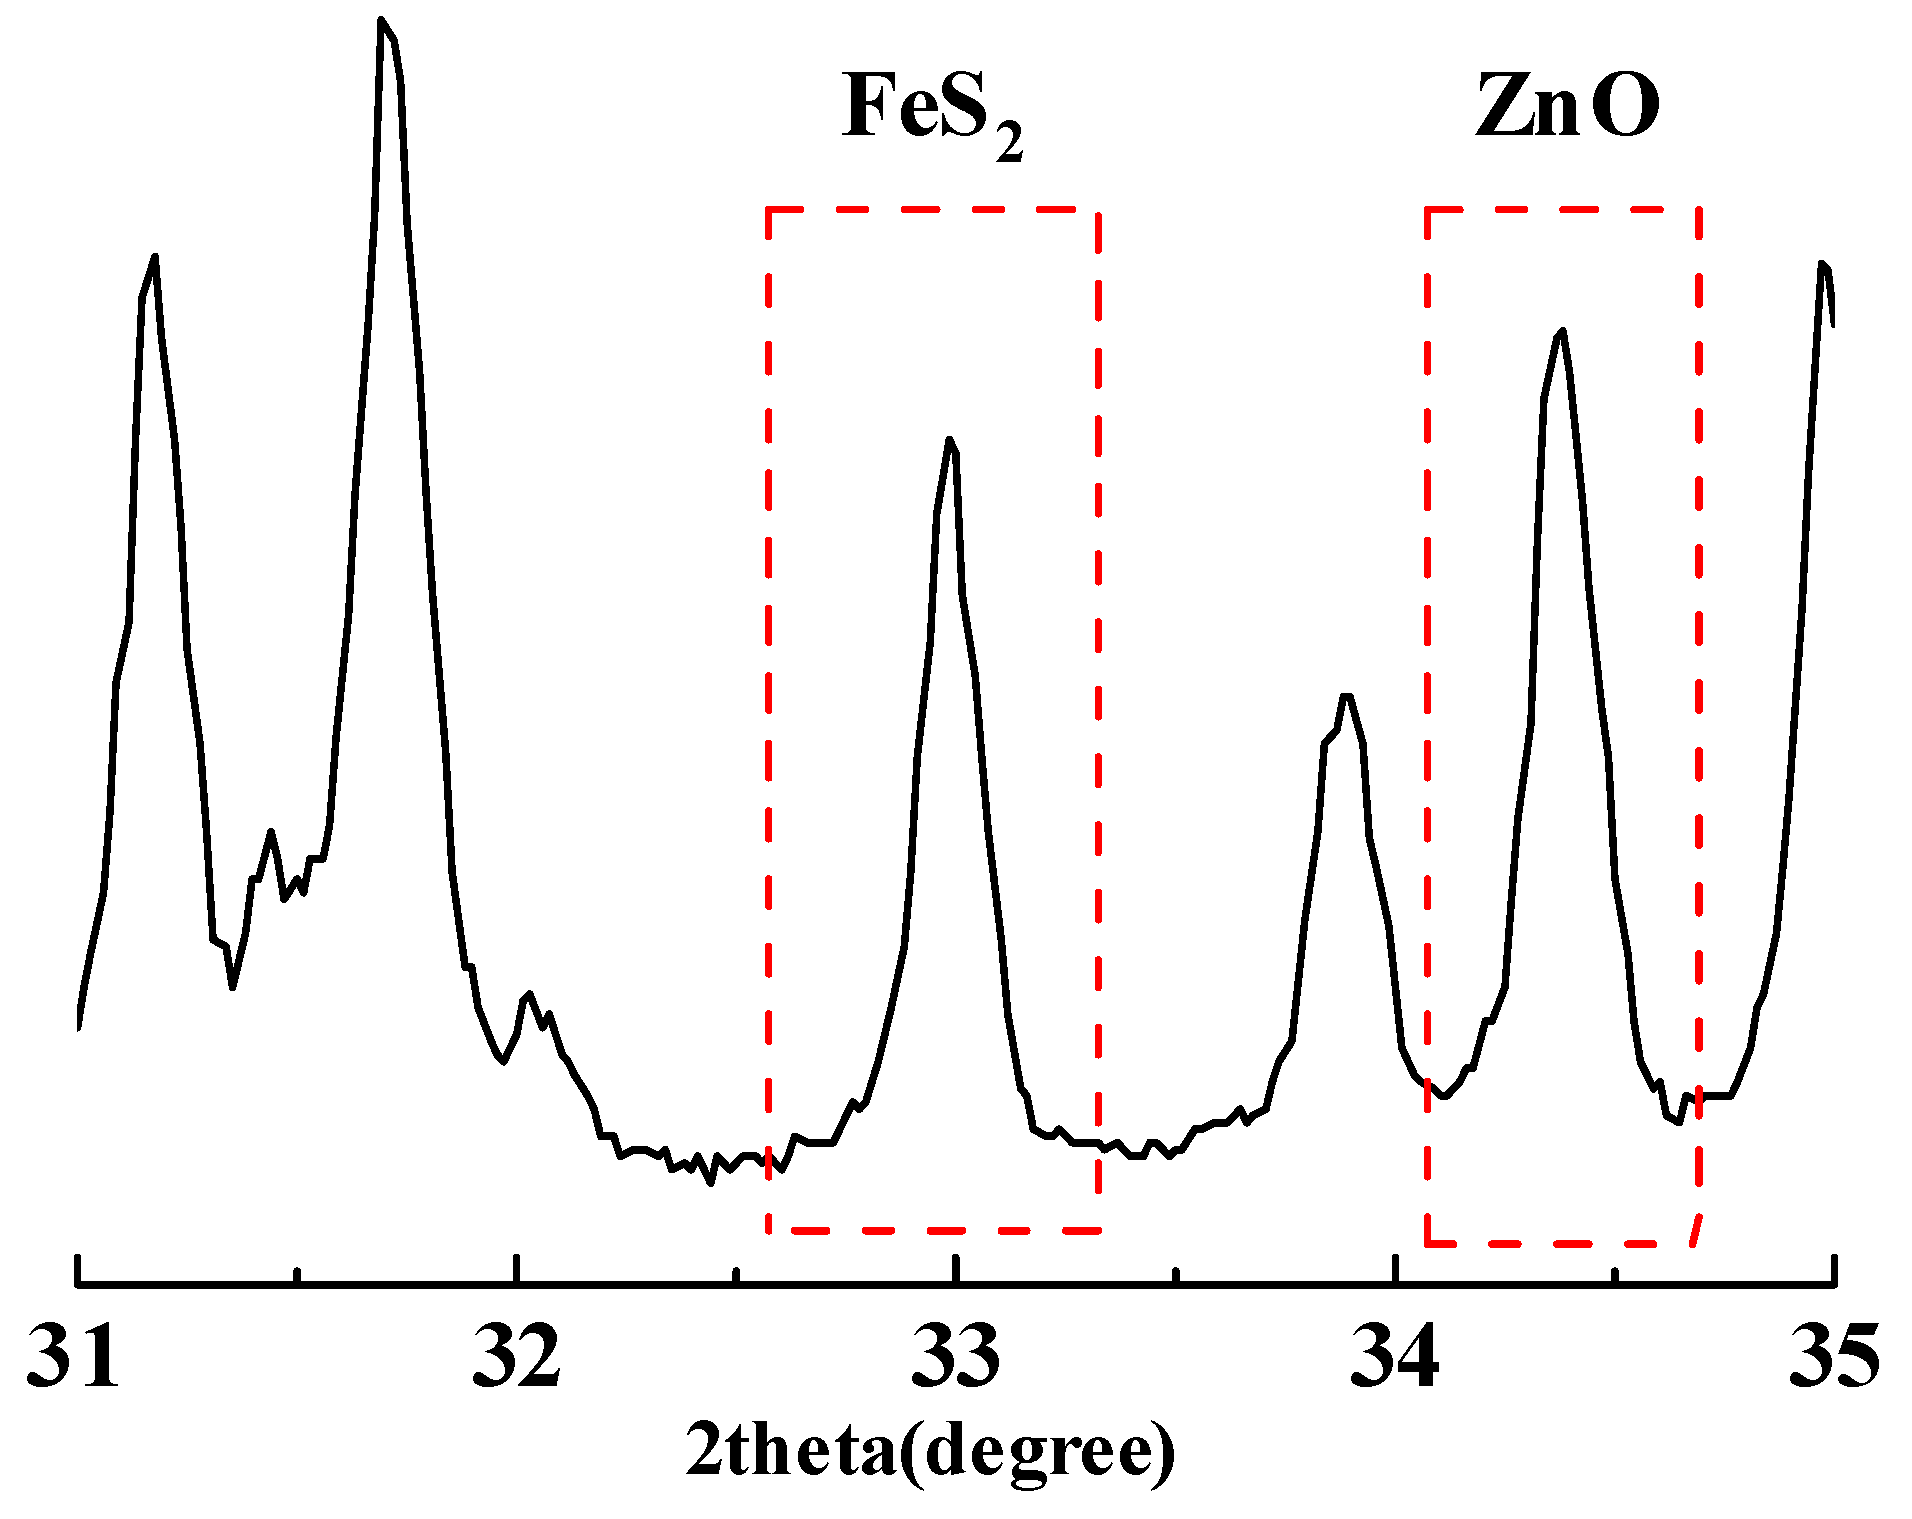
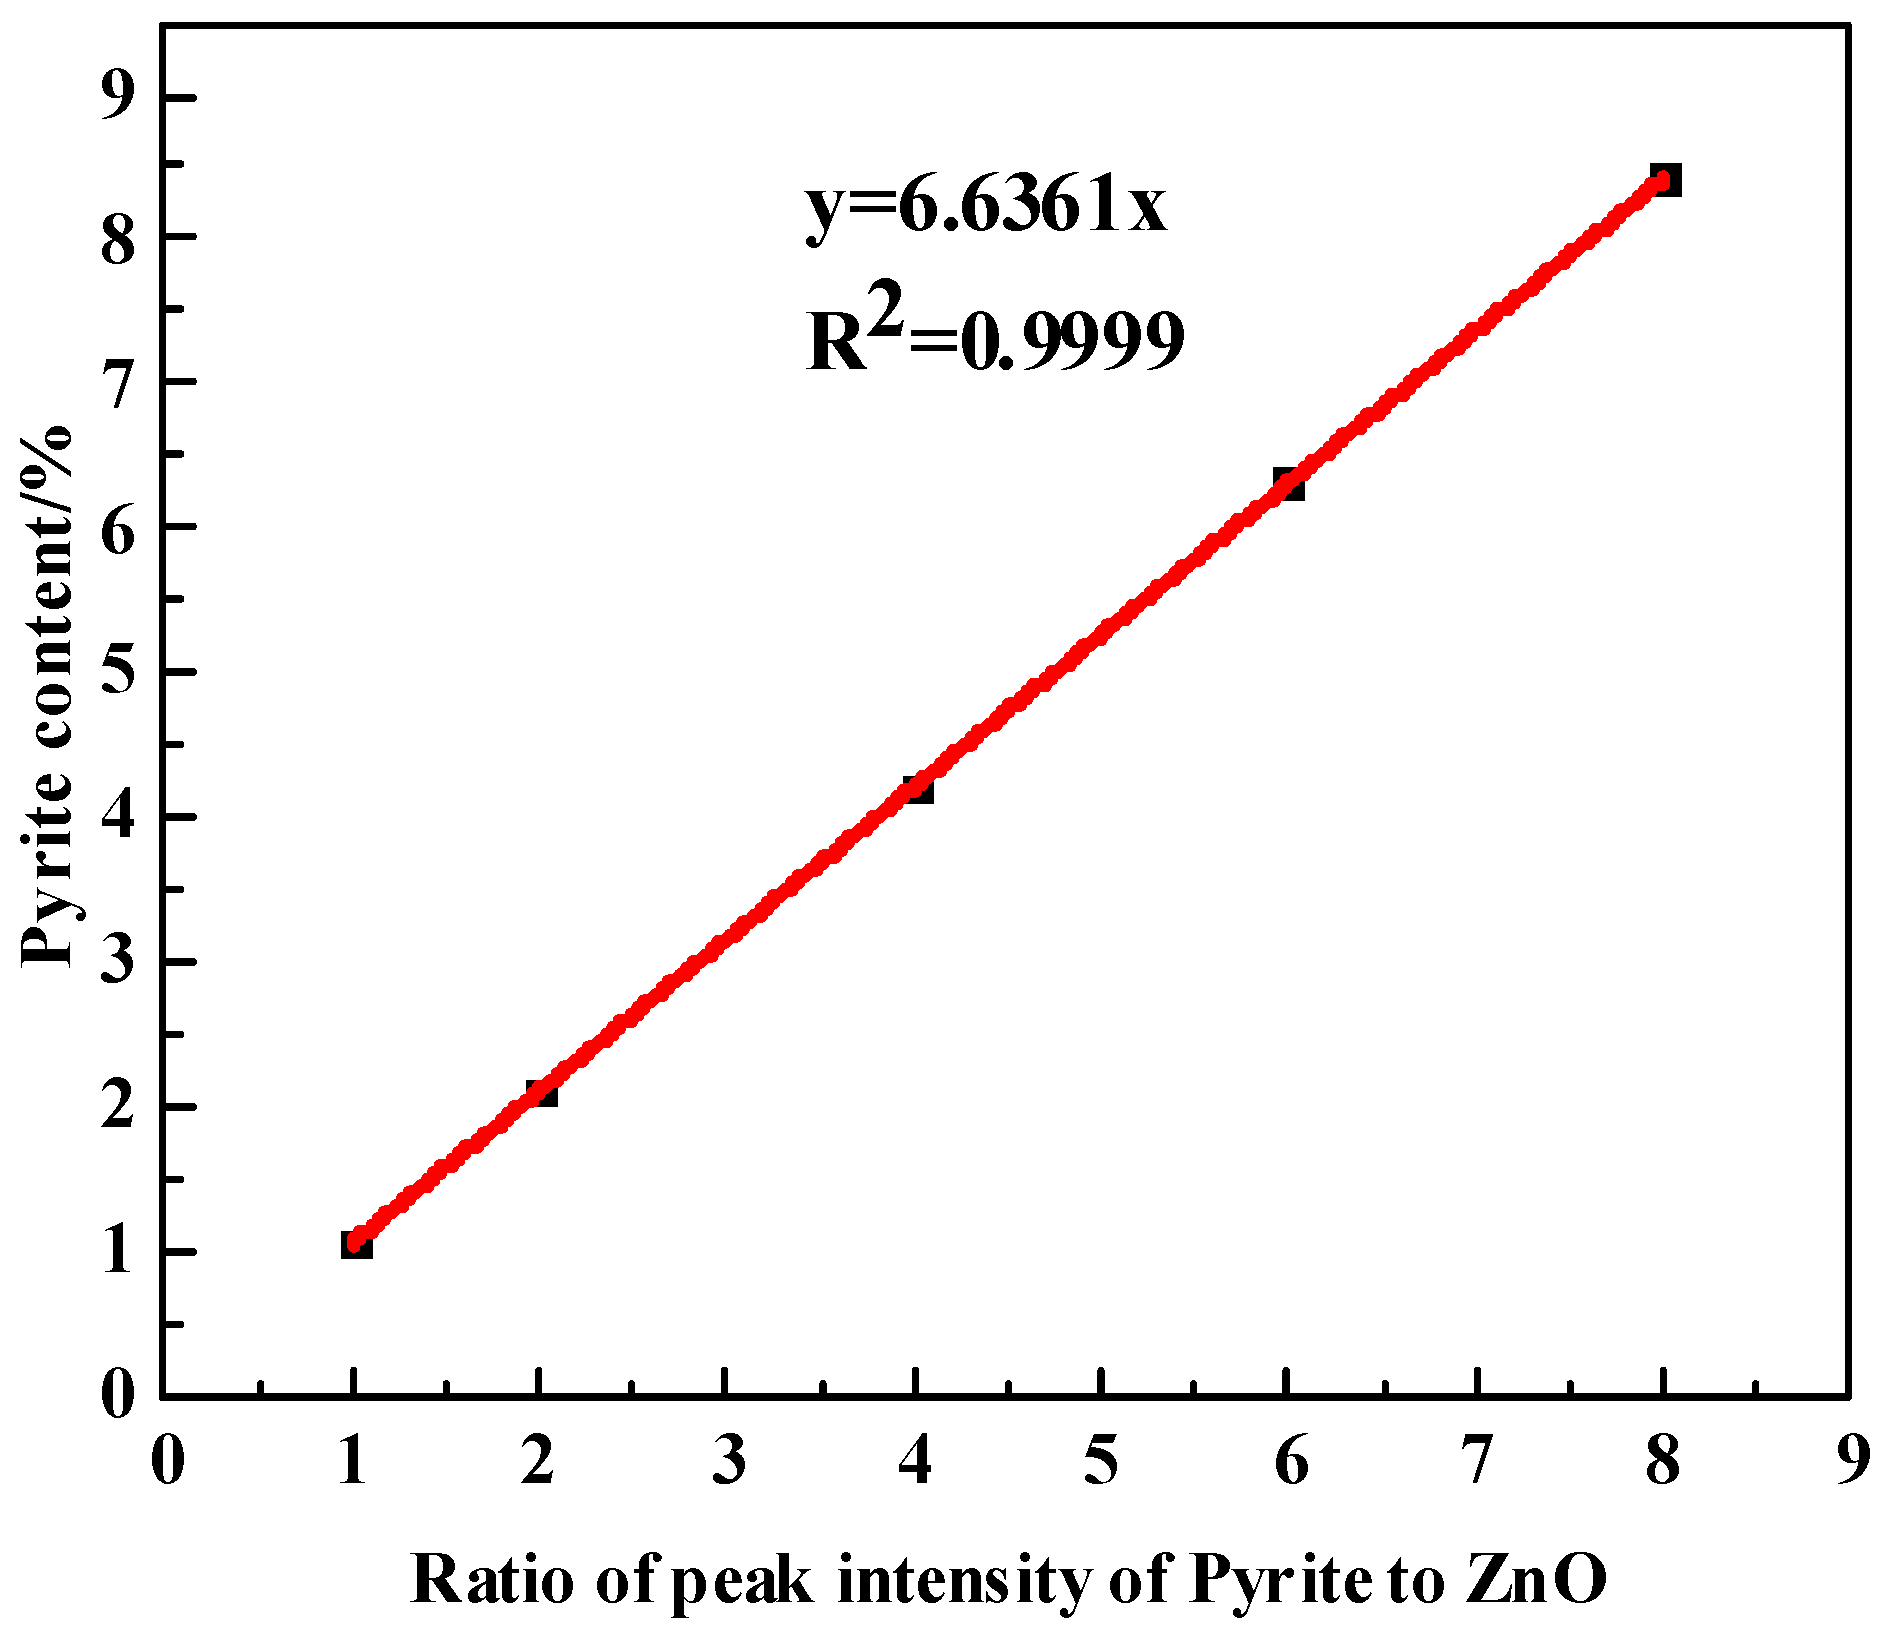
2.2.2. The Internal Standard Method of XRD
2.3. Orthogonal Design of Experiments
3. Results and Discussion
3.1. Quantification of Pyrrhotite
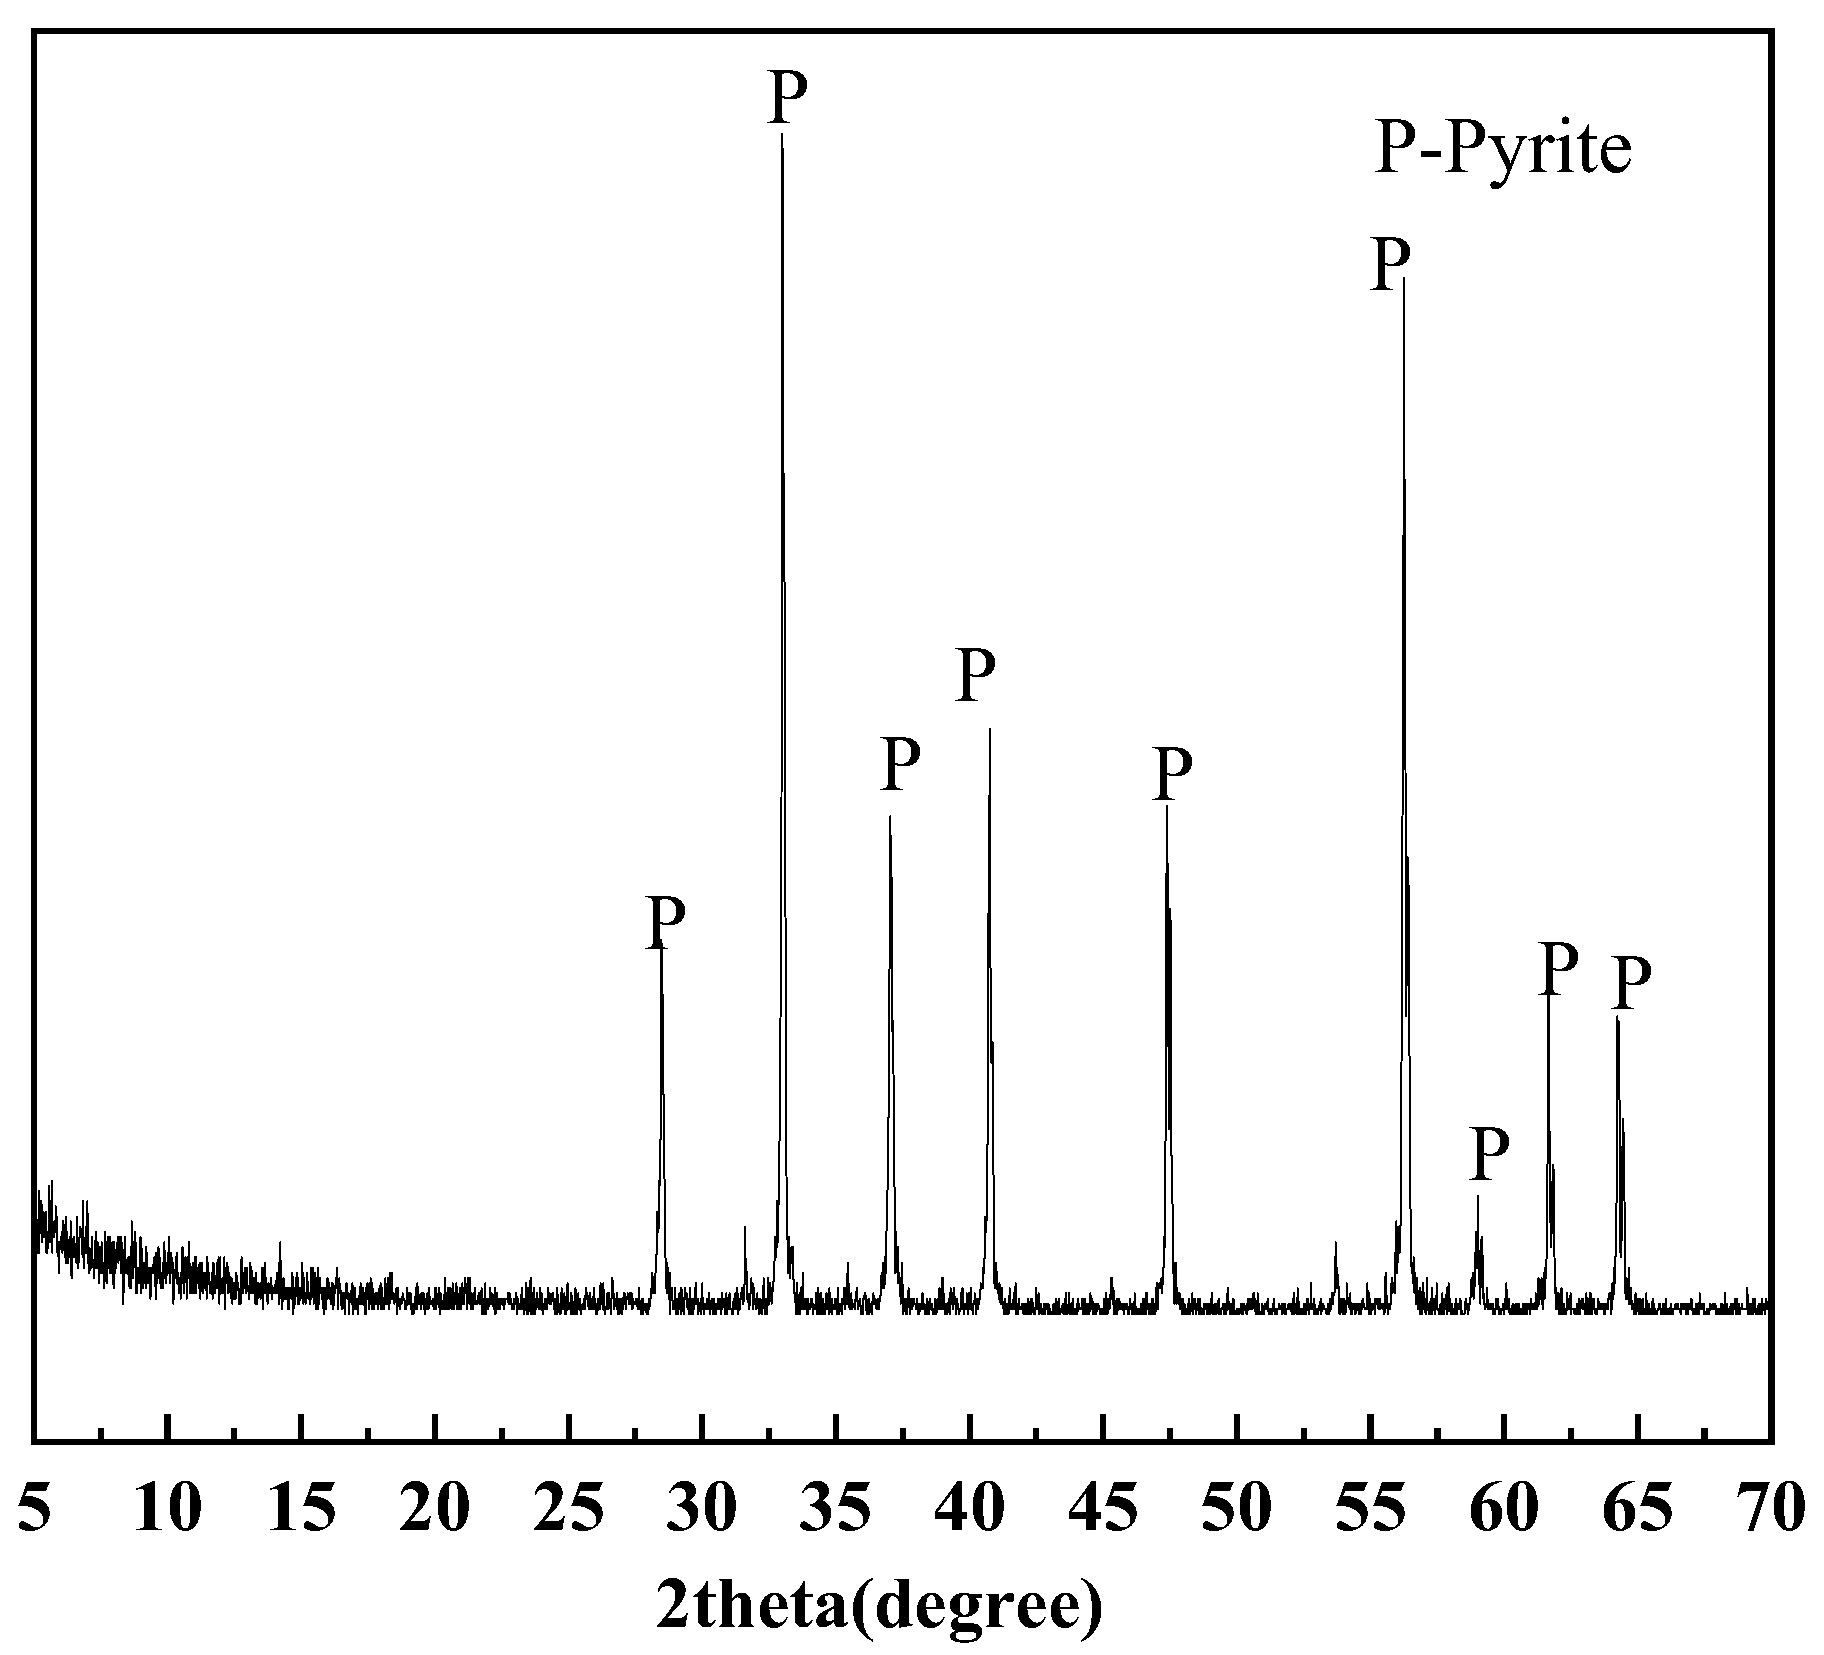
3.2. Quantification of Pyrite
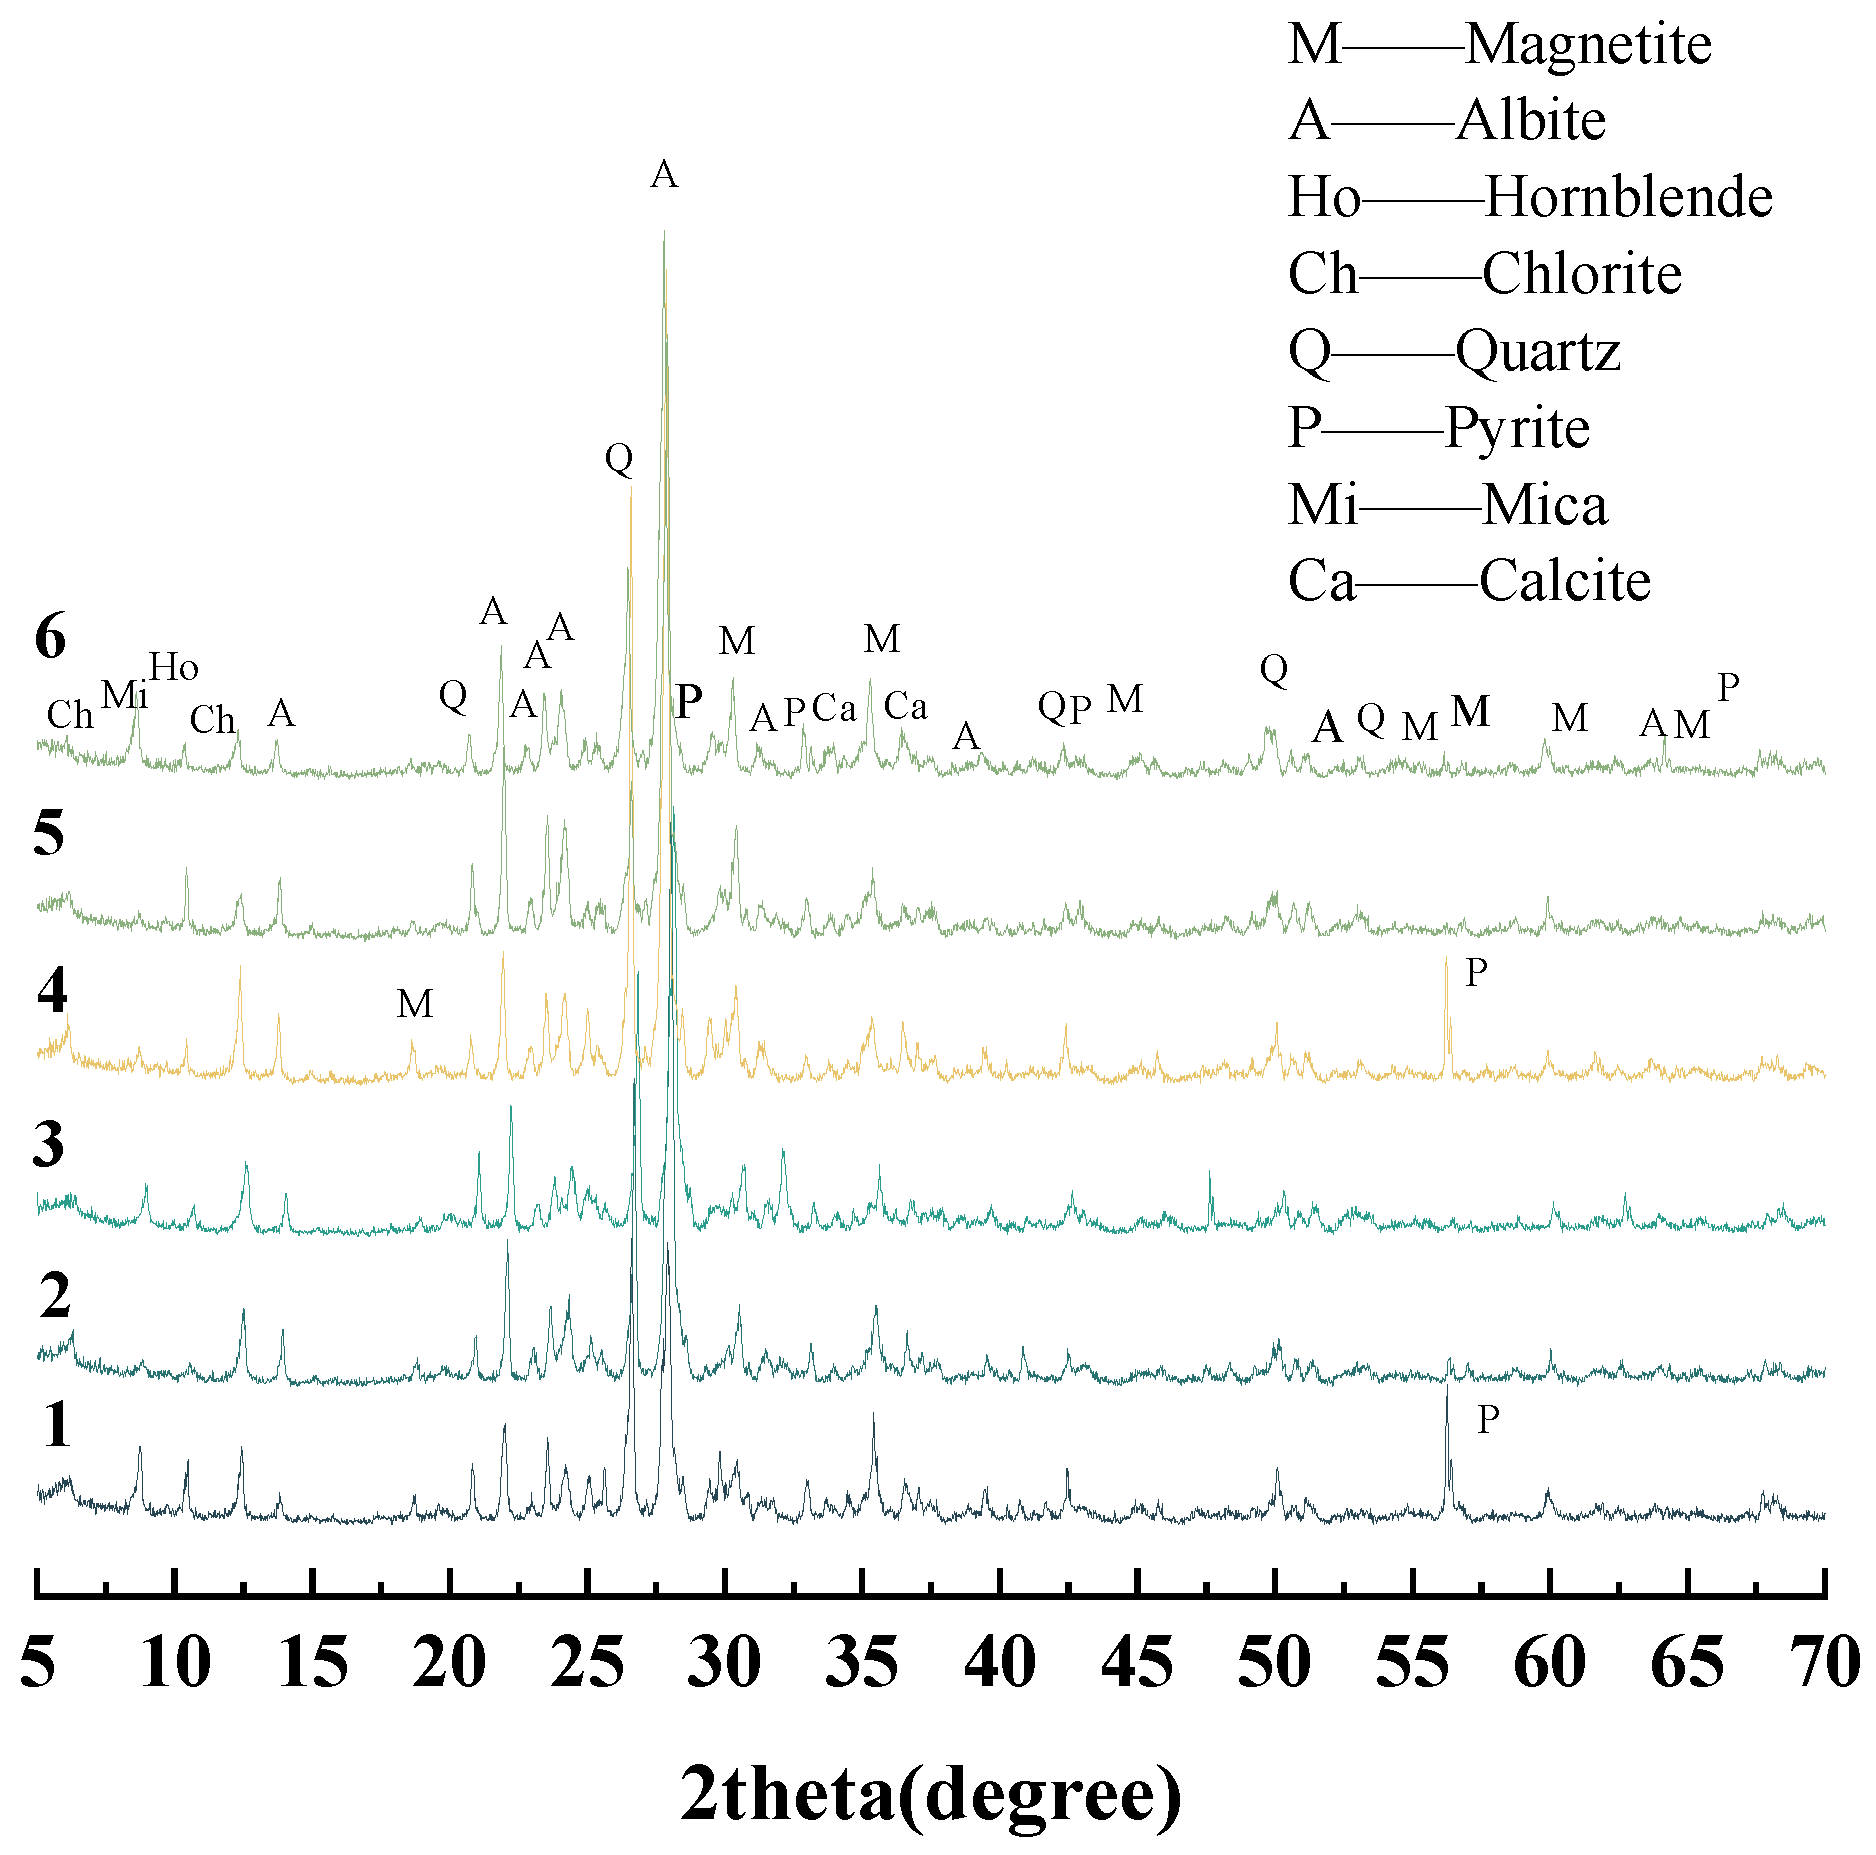
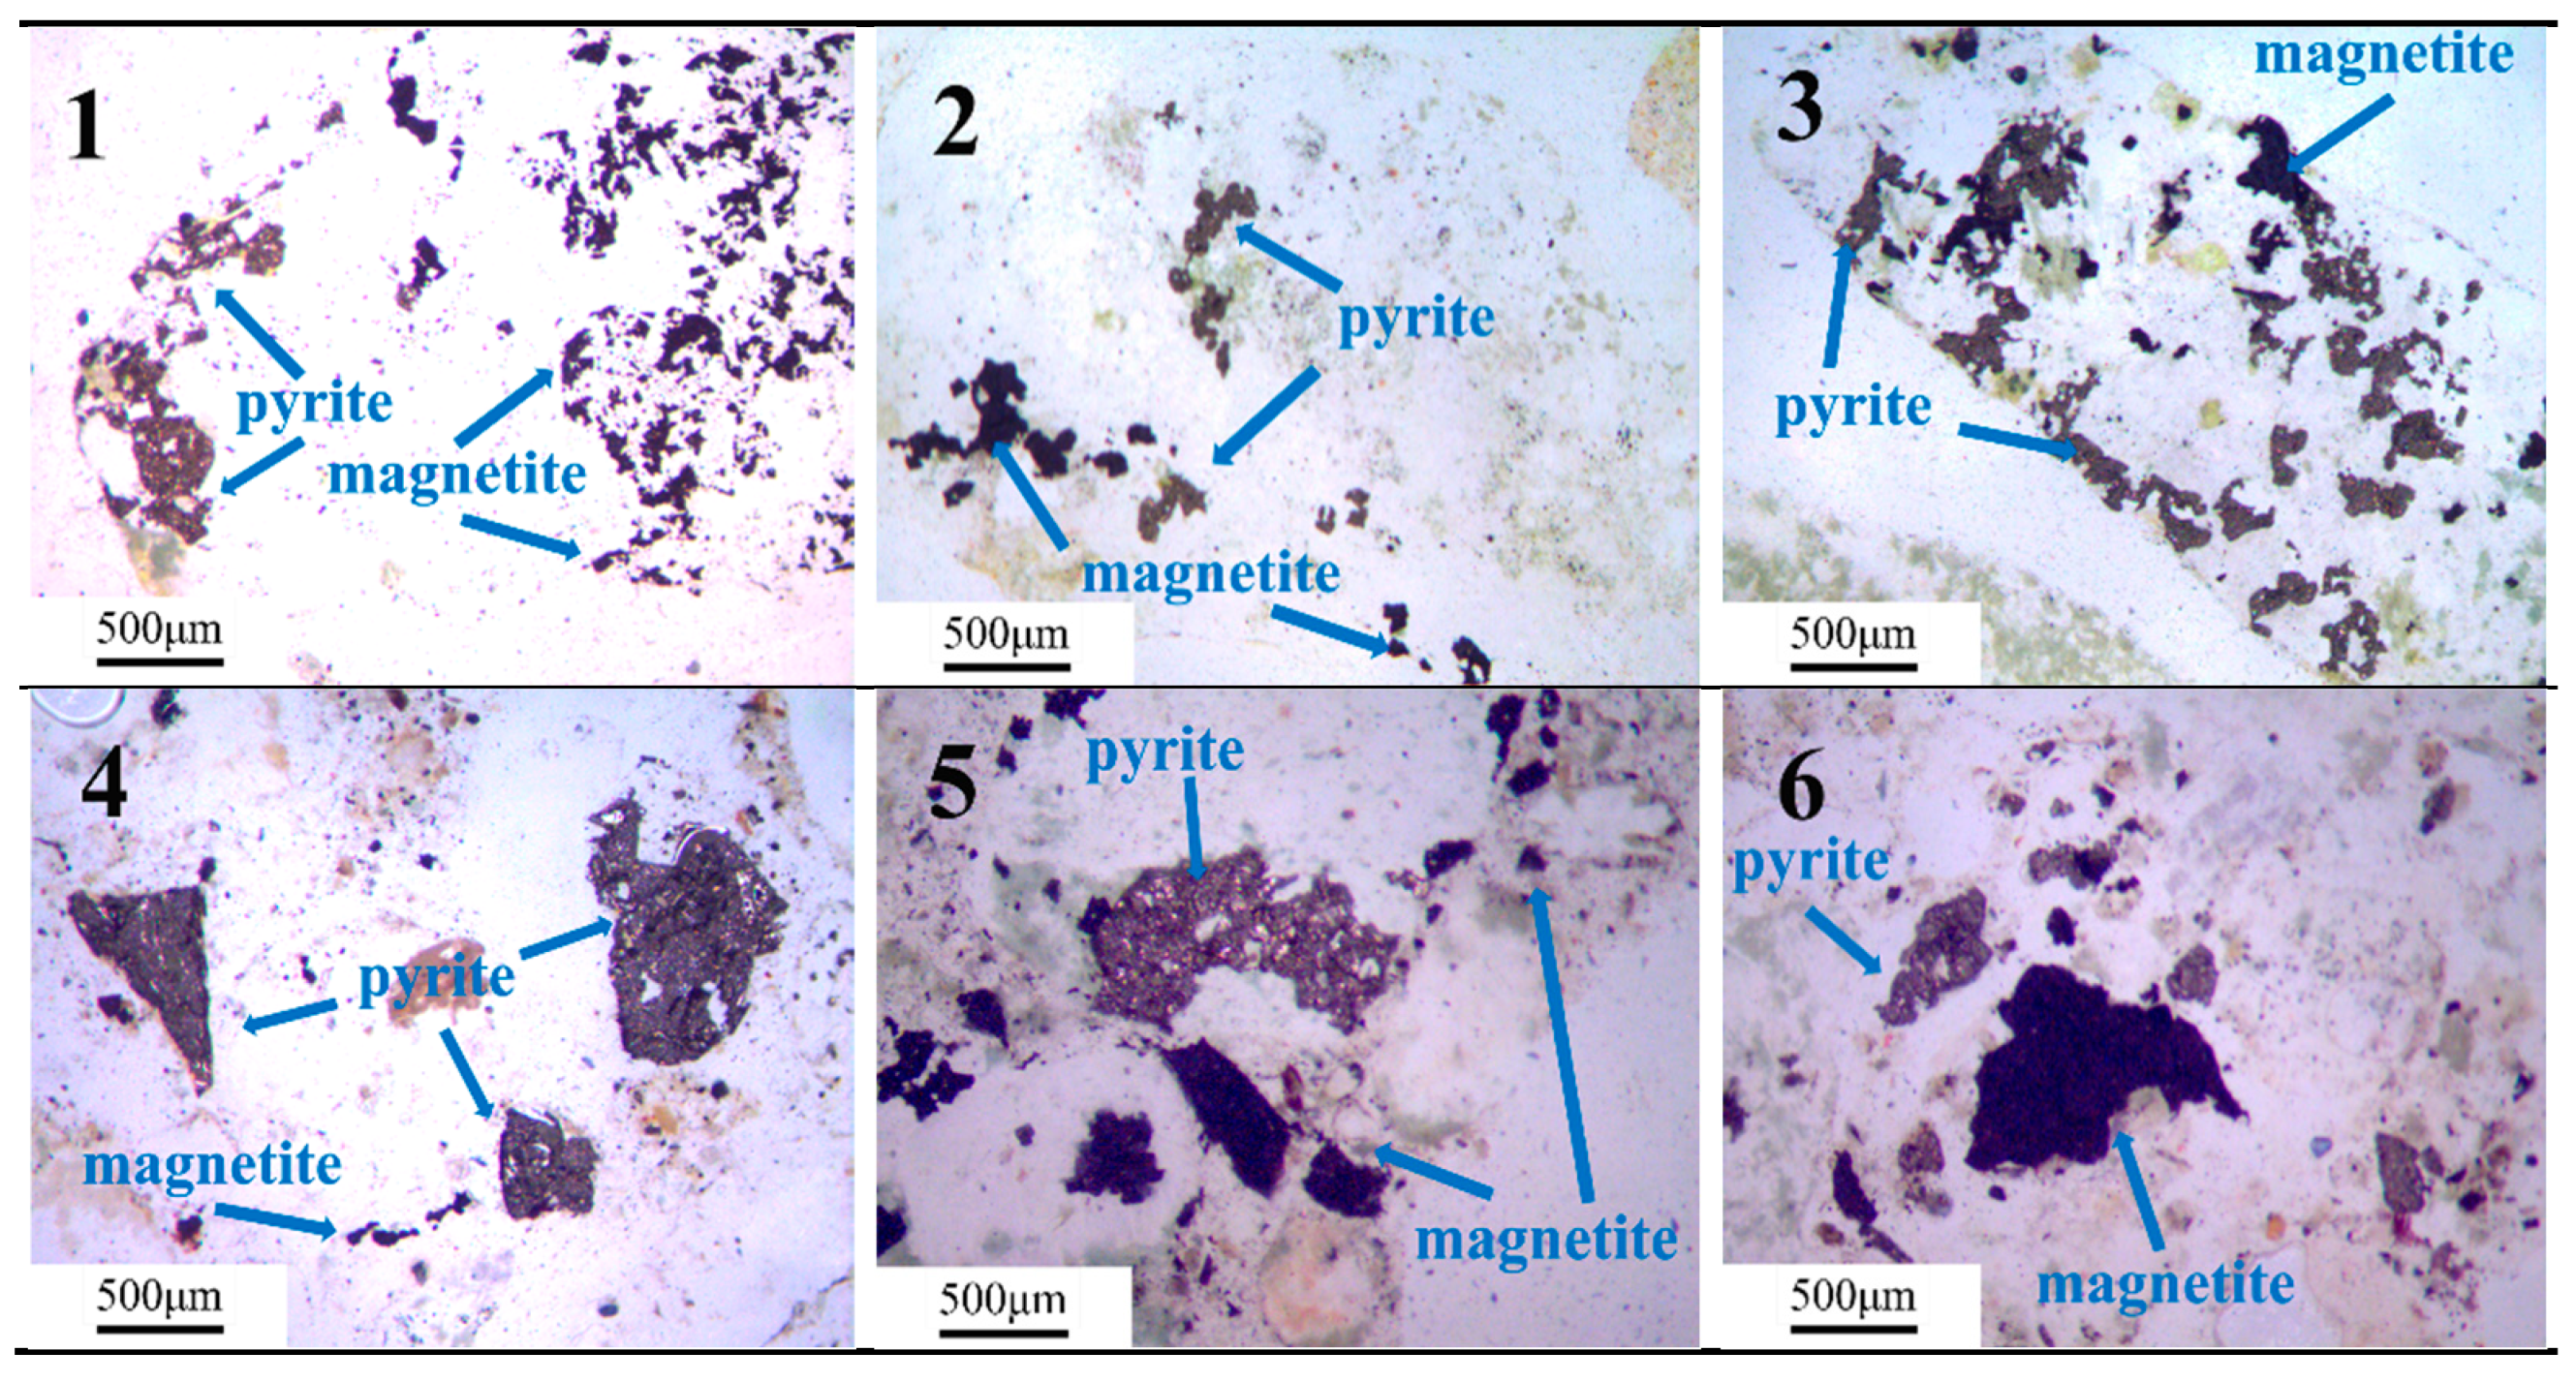
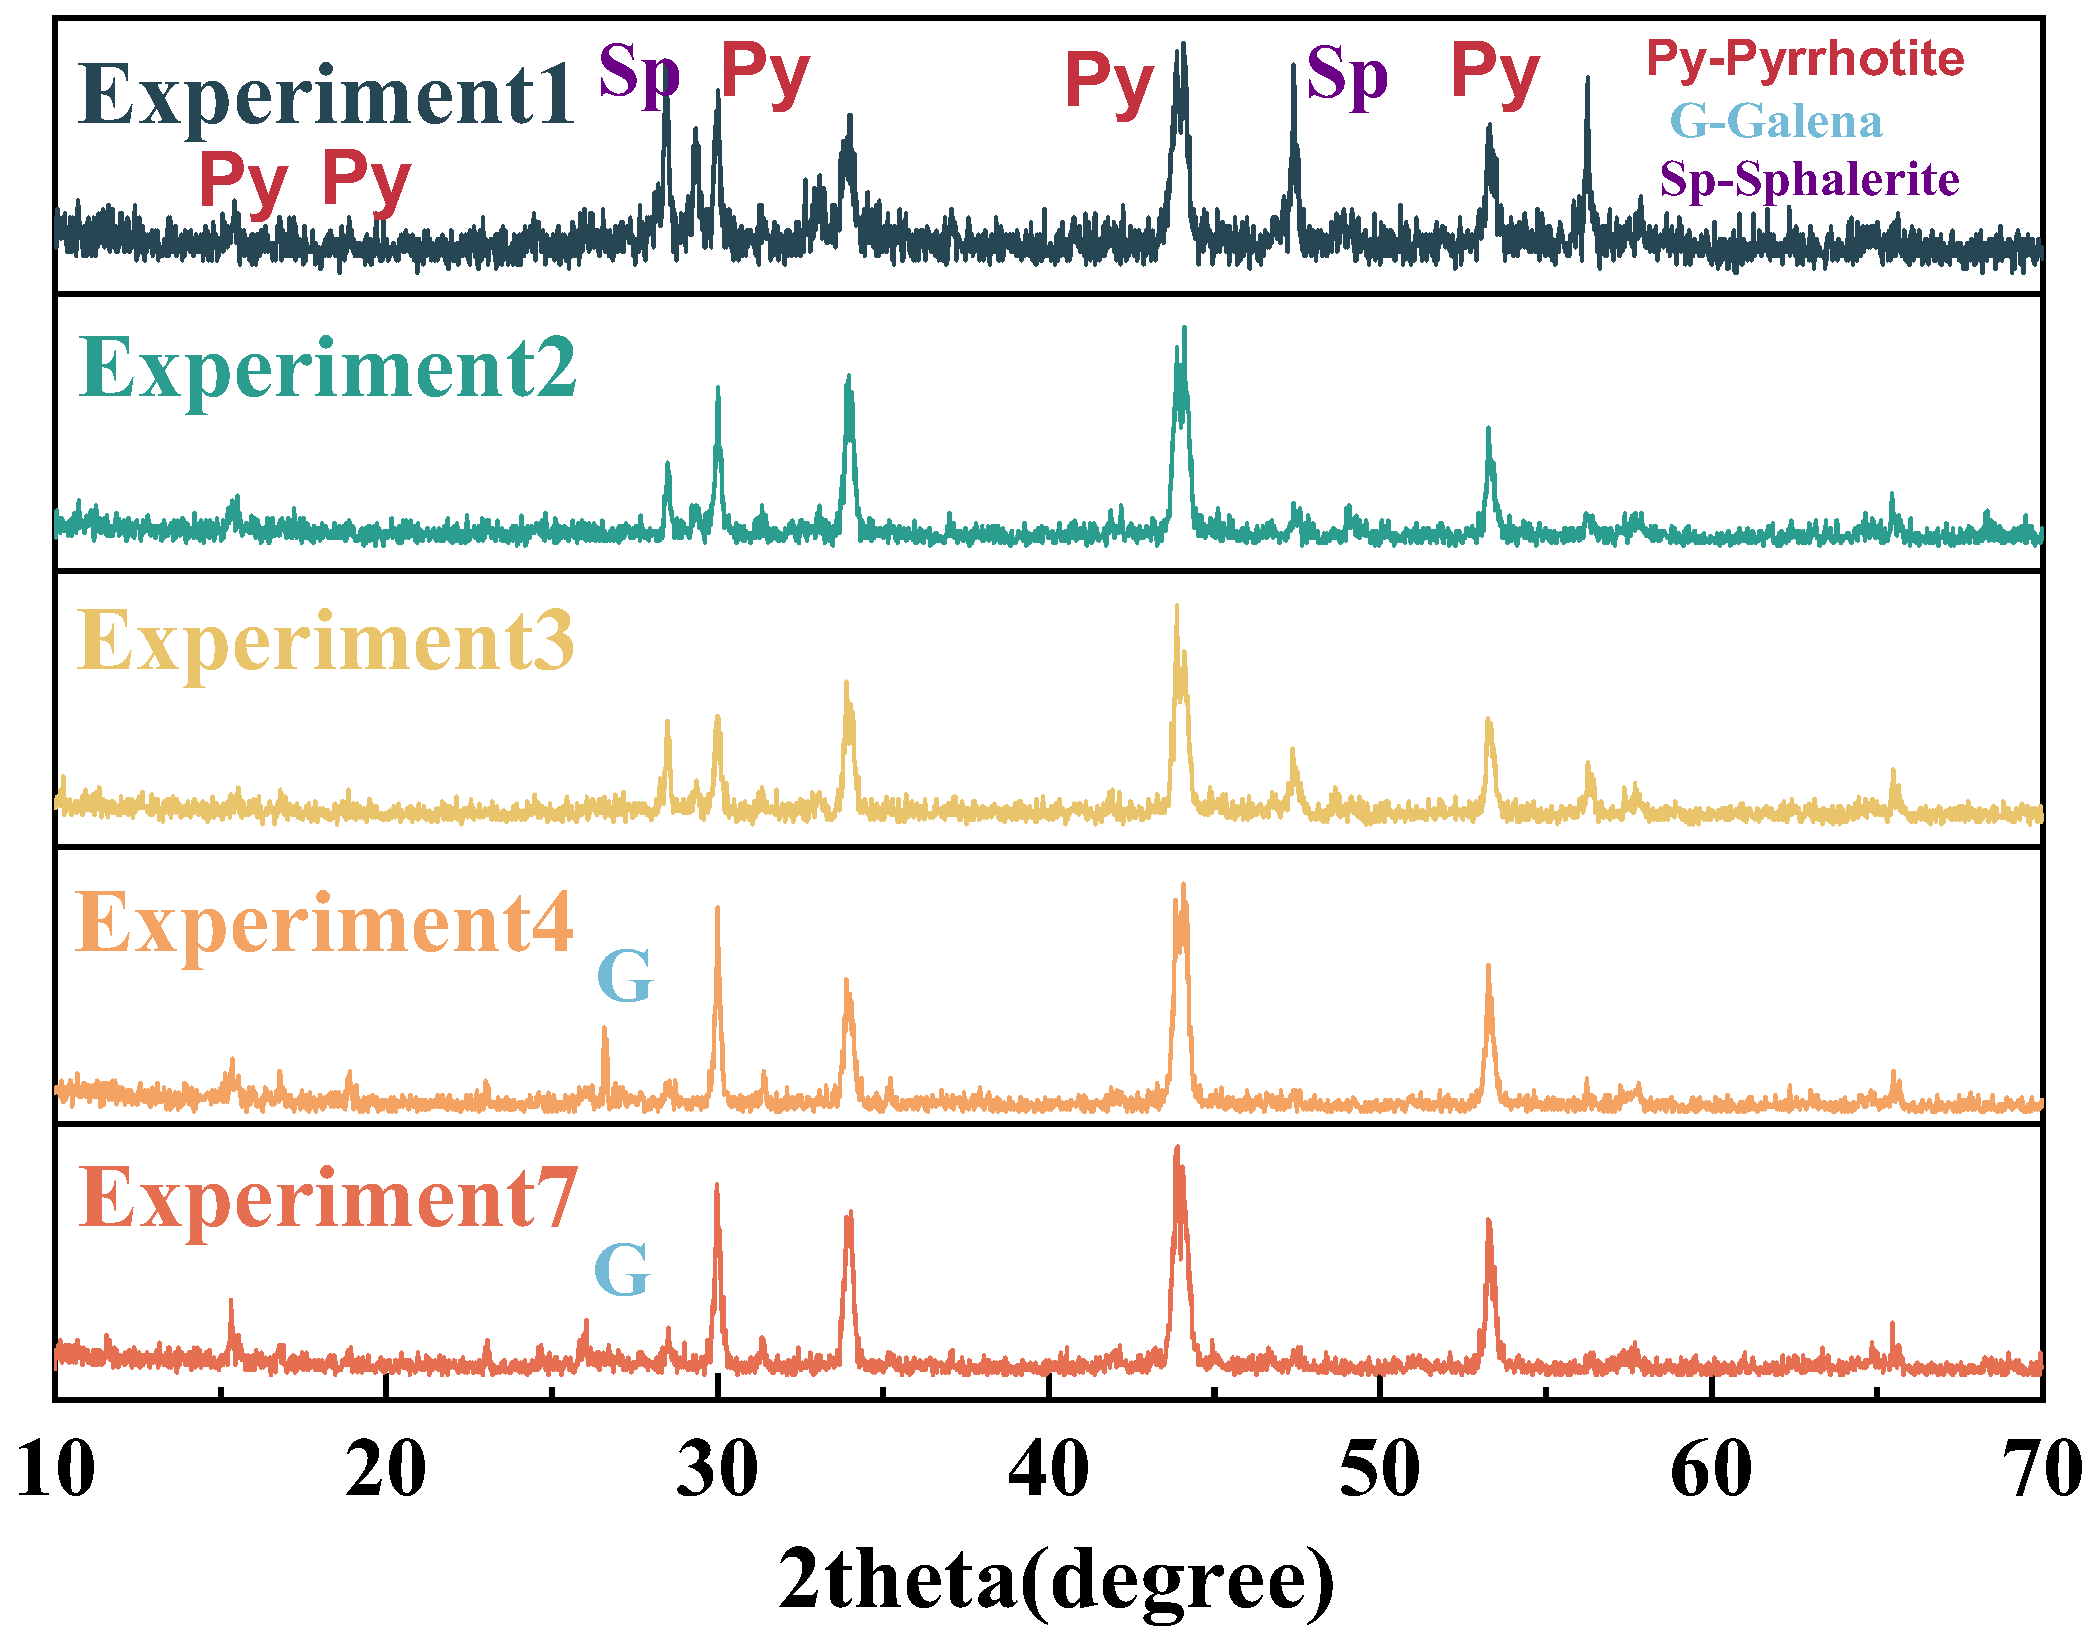
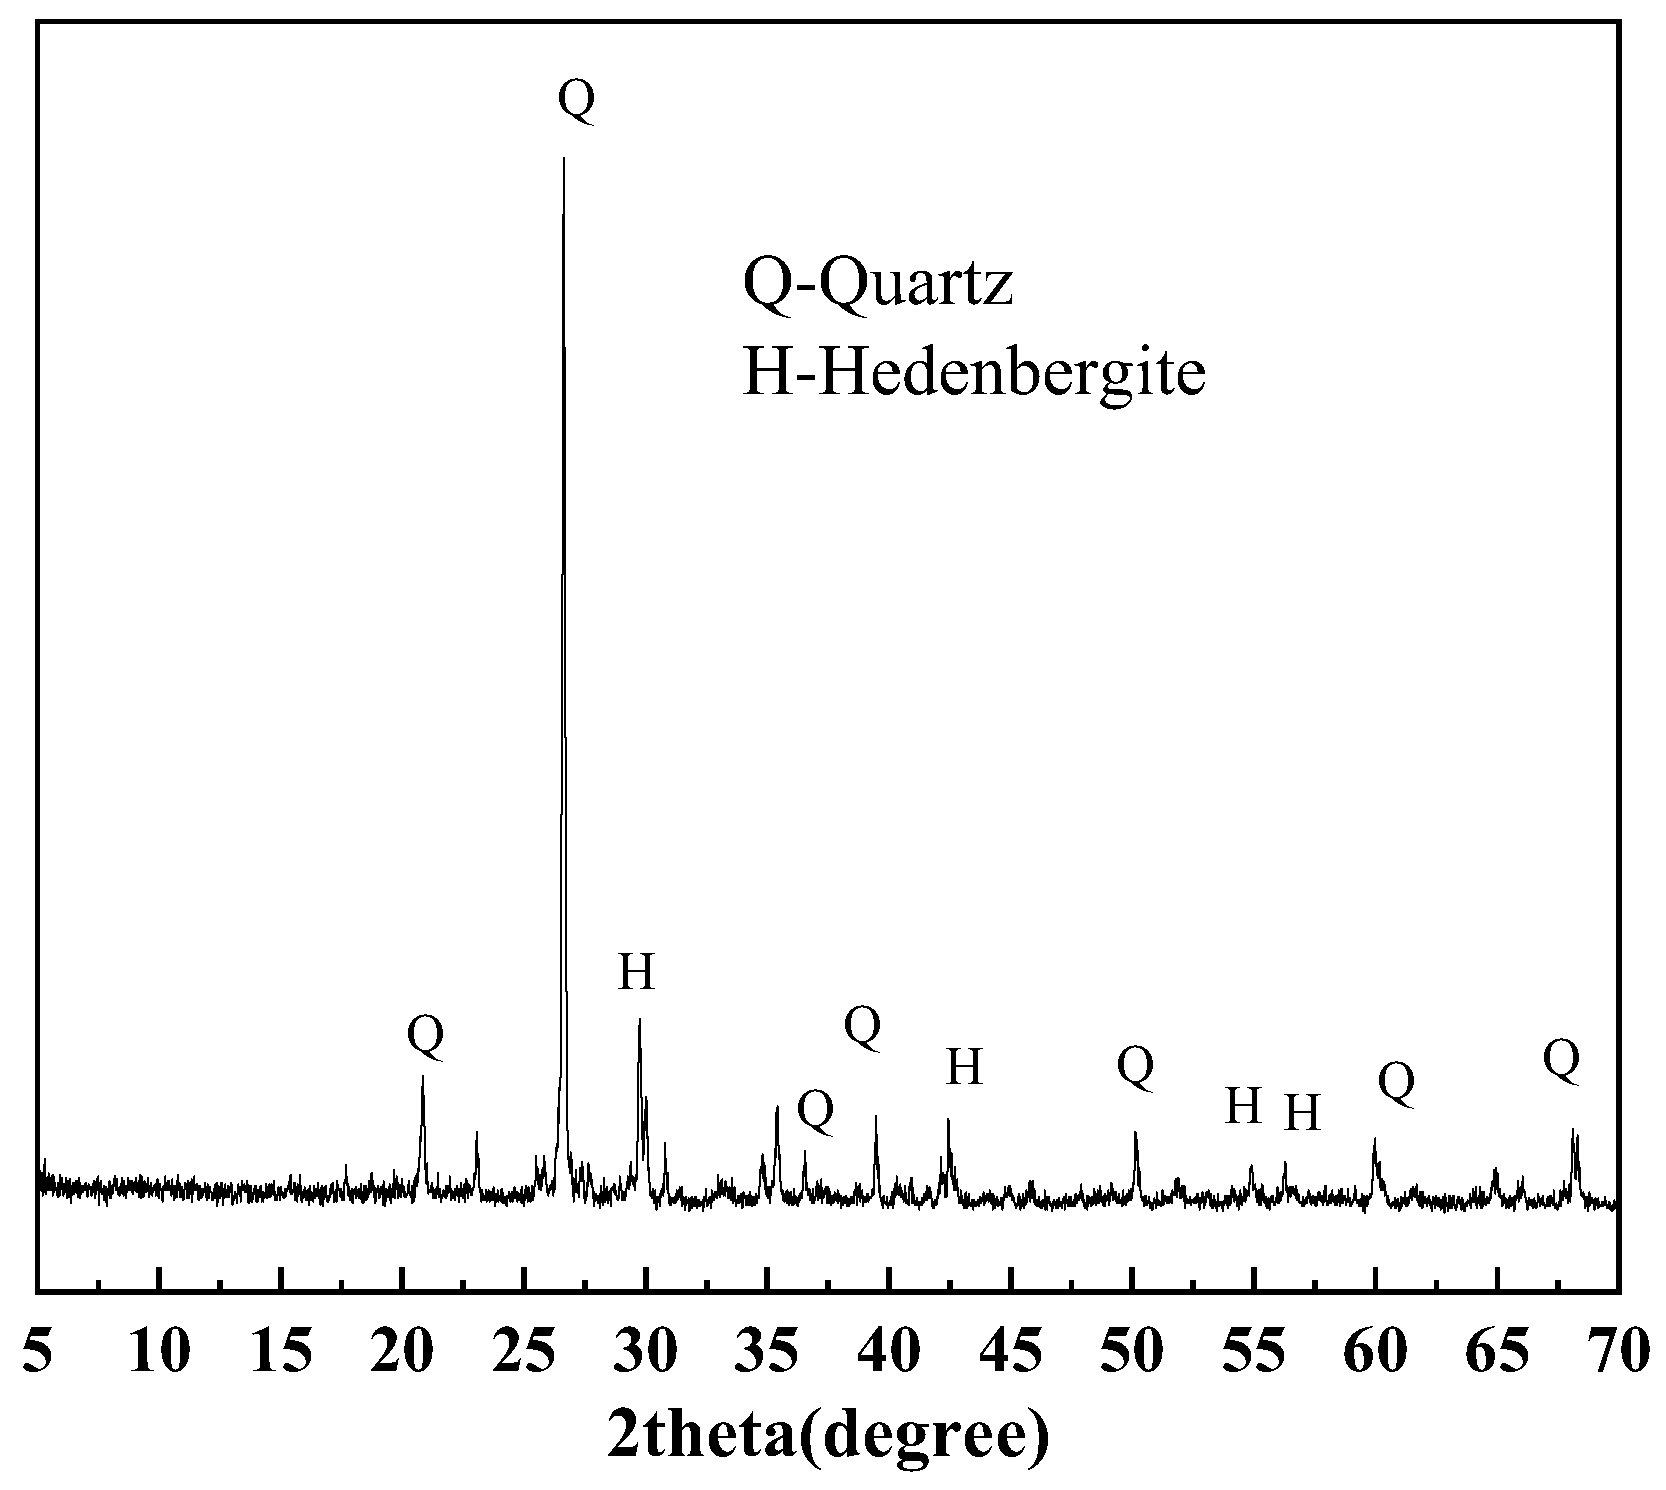
3.3. Quantification of Iron Sulfide in Iron Ore Tailings
3.3.1. Quantification with Chemical Dissolution Methods
3.3.2. Quantification with the Internal Standard Method of XRD
4. Discussion
4.1. Optimization of Experimental Conditions
4.2. Accuracy and Precision of Chemical Dissolution Methods
4.3. Method Comparisons
5. Conclusions
- (1)
- The optimal quantitative conditions were determined as grinding pyrrhotite to 0.045–0.075 mm, followed by digestion in 1:1 HCl at 80 °C for 1.5 h, while pyrite required finer grinding to 0.015–0.030 mm with a subsequent treatment in 2:1 HNO3 at 80 °C for 1 h to achieve complete dissolution.
- (2)
- The pyrrhotite quantification method exhibited a relative standard deviation (RSD) of 3.60% (<5%) and a mean relative error of 3.19% (<5%), while the pyrite quantification method showed an RSD of 3.11% (<5%) with a mean relative error of 4.70% (<5%).
- (3)
- The dissolution process was improved, the cost was reduced, and on-site well completion was achieved. The quantitative results of pyrite in mineral samples were verified by the XRD internal standard method, and the error was less than 0.6%.
Author Contributions
Funding
Institutional Review Board Statement
Informed Consent Statement
Data Availability Statement
Acknowledgments
Conflicts of Interest
References
- Saedi, A.; Jamshidi-Zanjani, A. Addition of silane nanoparticles combined with mechanical activation for efficient reuse of sulfidic tailings for concrete construction. Dev. Built Environ. 2025, 21, 100606. [Google Scholar] [CrossRef]
- Li, L.J.; Mao, X.C.; Liu, Z.K.; Wang, Y.C.; Li, D.X.; Ai, Q.X.; Wang, Y.Q. Variation of chalcophile elements in base metal sulfide minerals from the Jinchuan magmatic Ni—Cu sulfide deposit, NW China: Implications for mineral exploration. J. Geochem. Explor. 2024, 259, 107440. [Google Scholar] [CrossRef]
- Li, S.; Xiao, W.; Chen, C.; Sang, M.; Mao, Q.; Gao, L.; Xia, F.; Li, X.; Du, X. Two-episode mineralization in the Haerdaban Pb—Zn deposit, NW China: Insights from sulfide trace elements, in situ S—Pb isotopes, and Rb-Sr geochronology. Precambrian Res. 2024, 412, 107550. [Google Scholar] [CrossRef]
- Wang, Y.; Lai, J.; Cao, Y.; Brzozowski, M.; Mao, X.; Peng, H.; Ai, Q. Controls on the metal tenors of sulfide ores in the Jinchuan Ni-Cu-PGE sulfide deposit, NW China: Implications for the formation of distinct textural types of sulfide ores in magma conduits. Ore Geol. Rev. 2023, 163, 105810. [Google Scholar] [CrossRef]
- Zhong, R.; Wille, K. Deterioration of residential concrete foundations: The role of pyrrhotite-bearing aggregate. Cem. Concr. Compos. 2018, 94, 53–61. [Google Scholar] [CrossRef]
- Glasser, F.P.; Marchand, J.; Samson, E. Durability of concrete—Degradation phenomena involving detrimental chemical reactions. Cem. Concr. Res. 2008, 38, 226–246. [Google Scholar] [CrossRef]
- Rodrigues, A.; Duchesne, J.; Fournier, B.; Durand, B.; Rivard, P.; Shehata, M. Mineralogical and chemical assessment of concrete damaged by the oxidation of sulfide—Bearing aggregates: Importance of thaumasite formation on reaction mechanisms. Cem. Concr. Res. 2012, 42, 1336–1347. [Google Scholar] [CrossRef]
- Schmidt, T.; Leemann, A.; Gallucci, E.; Scrivener, K. Physical and microstructural aspects of iron sulfide degradation in concrete. Cem. Concr. Res. 2011, 41, 263–269. [Google Scholar] [CrossRef]
- Jana, D. Cracking of residential concrete foundations in eastern Connecticut, USA from oxidation of pyrrhotite. Case Stud. Constr. Mater. 2022, 16, e00909. [Google Scholar] [CrossRef]
- Marcelino, A.P.; Calixto, J.M.; Gumieri, A.G.; Caldeira, C.L.; Delbem, I.D.; Ferreira, M.C. A feasible evaluation protocol to determine the most reactive sulfide-bearing aggregate for use in concrete. Constr. Build. Mater. 2020, 242, 118031. [Google Scholar] [CrossRef]
- Strongman, K.R.; Gibson, H.L.; Howard, A.E.; Lafrance, B.; Hamilton, M.A. Relative timing and controls on advanced argillic and conventional alteration of the Neoarchean Onaman volcanogenic massive sulfide deposit, Ontario, Canada. Can. J. Earth Sci. 2025, 62, 41–65. [Google Scholar] [CrossRef]
- Titon, B.; Duchesne, J.; Fournier, B.; Rodrigues, A. Concrete deterioration due to sulfide-bearing aggregates: Mineralogical and chemical characteristics of pyrrhotite in concrete aggregates from Trois-Rivières, Canada. Constr. Build. Mater. 2025, 458, 139670. [Google Scholar] [CrossRef]
- Jana, D. Pyrrhotite Epidemic in Eastern Connecticut: Diagnosis and Prevention. Aci Mater. J. 2020, 117, 61–70. [Google Scholar] [CrossRef]
- Fan, Z.; Zou, D.; Zhang, M.; Qin, S.; Liu, T. Numerical modeling of unidirectional sulfate attack on tunnel lining concrete considering water evaporation at free face. Cem. Concr. Res. 2025, 190, 107813. [Google Scholar] [CrossRef]
- Nehdi, M.L.; Suleiman, A.R.; Soliman, A.M. Investigation of concrete exposed to dual sulfate attack. Cem. Concr. Res. 2014, 64, 42–53. [Google Scholar] [CrossRef]
- Ragoug, R.; Metalssi, O.O.; Barberon, F.; Torrenti, J.M.; Roussel, N.; Divet, L.; de Lacaillerie, J.B.D.E. Durability of cement pastes exposed to external sulfate attack and leaching: Physical and chemical aspects. Cem. Concr. Res. 2019, 116, 134–145. [Google Scholar] [CrossRef]
- Andrews, A.; Nyarko, E.F.; Adjaottor, A.A.; Nsiah-Baafi, E.; Adom-Asamoah, M. Reuse and stabilization of sulphide mine tailings as fine aggregate for construction mortar. J. Clean. Prod. 2022, 357, 131971. [Google Scholar] [CrossRef]
- Rimstidt, J.; Vaughan, D.J. Pyrite oxidation: A state-of-the-art assessment of the reaction mechanism. Geochim. Cosmochim. Acta 2003, 67, 873–880. [Google Scholar] [CrossRef]
- Janzen, M.P.; Nicholson, R.V.; Scharer, J.M. Pyrrhotite reaction kinetics: Reaction rates for oxidation by oxygen, ferric iron, and for nonoxidative dissolution. Geochim. Cosmochim. Acta 2000, 64, 1511–1522. [Google Scholar] [CrossRef]
- Hamilton, I.C.; Woods, R. An investigation of surface oxidation of pyrite and pyrrhotite by linear potential sweep voltammetry. J. Electroanal. Chem. 1981, 118, 327–343. [Google Scholar] [CrossRef]
- Oliveira, I.; Cavalaro, S.H.; Aguado, A. New kinetic model to quantify the internal sulfate attack in concrete. Cem. Concr. Res. 2013, 43, 95–104. [Google Scholar] [CrossRef]
- Wang, H.; Dowd, P.A.; Xu, C. A reaction rate model for pyrite oxidation considering the influence of water content and temperature. Miner. Eng. 2019, 134, 345–355. [Google Scholar] [CrossRef]
- Chirita, P.; Schlegel, M.L. Pyrite oxidation in air-equilibrated solutions: An electrochemical study. Chem. Geol. 2017, 470, 67–74. [Google Scholar] [CrossRef]
- Belzile, N.; Chen, Y.W.; Cai, M.F.; Li, Y. A review on pyrrhotite oxidation. J. Geochem. Explor. 2004, 84, 65–76. [Google Scholar] [CrossRef]
- Luo, T.; Guo, Y.; Deng, Z.; Liu, X.; Sun, Z.; Qi, Y.; Yang, M. Energy-dispersive X-ray spectroscopy for the quantitative analysis of pyrite thin specimens. J. Wuhan Univ. Technol.-Mater. Sci. Ed. 2023, 38, 1304–1310. [Google Scholar] [CrossRef]
- Mcdougall, H.; Hibberd, M.; Tong, A.; Neville, S.; Peterson, V.; Didier, C. Preparation of pyrite concentrate powder from the Thackaringa mine for quantitative phase analysis using X-ray diffraction. J. Appl. Crystallogr. 2022, 55, 1572–1582. [Google Scholar] [CrossRef]
- Del Real, I.; Smieska, L.; Thompson, J.F.H.; Martinez, C.; Thomas, J.; Layton-Matthews, D. Using multiple micro-analytical techniques for evaluating quantitative synchrotron-XRF elemental mapping of hydrothermal pyrite. J. Anal. At. Spectrom. 2019, 34, 1724–1738. [Google Scholar] [CrossRef]
- Bolin, T.B. Direct Determination of Pyrite Content in Argonne Premium Coals by the Use of Sulfur X-ray Near Edge Absorption Spectroscopy (S-XANES). Energy Fuels 2010, 24, 5479–5482. [Google Scholar] [CrossRef]
- GB/T 31288; Iron Tailings Sand. Standardization Administration of China: Beijing, China, 2014. (In Chinese)
- EN 12620:2008; Aggregates for Concrete. European Committee for Standardization: Brussels, Belgium, 2008.
- ACI 201.2R; Guide to Durable Concrete. Asian Culinary Institute (ACI): Singapore, 2016.


| Particle Size/mm | Elemental Composition/wt% | |||||||
|---|---|---|---|---|---|---|---|---|
| Fe | S | Pb | Zn | Si | Cu | Sb | Al | |
| 0.015–0.030 | 58.42 | 33.84 | 2.23 | 0.95 | 0.49 | 0.20 | 0.19 | 0.11 |
| 0.030–0.045 | 60.33 | 34.18 | 0.95 | 0.47 | 0.39 | 0.09 | 0.07 | 0.05 |
| 0.045–0.075 | 59.19 | 35.15 | 1.36 | 0.72 | 0.37 | 0.15 | 0.12 | 0.07 |
| Particle Size/mm | Elemental Composition/wt% | |||||||
|---|---|---|---|---|---|---|---|---|
| S | Fe | Si | Ca | W | Mg | Al | Cl | |
| 0.015–0.030 | 48.79 | 47.05 | 0.57 | 0.30 | 0.18 | 0.10 | 0.04 | 0.03 |
| 0.030–0.045 | 46.62 | 49.62 | 0.48 | 0.23 | 0.11 | 0.06 | 0.03 | 0.03 |
| 0.045–0.075 | 47.95 | 49.06 | 0.44 | 0.19 | 0.10 | 0.05 | 0.03 | 0.03 |
| Sample | Percentage/% | ||||
|---|---|---|---|---|---|
| Albite | 94 | 93 | 91 | 89 | 87 |
| Pyrite | 1 | 2 | 4 | 6 | 8 |
| ZnO | 5 | 5 | 5 | 5 | 5 |
| Level | A Particle Size/mm | B Temperature/°C | C HCl Concentration | D Time/h |
|---|---|---|---|---|
| 1 | 0.015–0.030 | 20 | 1:1 | 1.5 |
| 2 | 0.030–0.045 | 50 | 1:3 | 2.0 |
| 3 | 0.045–0.075 | 80 | 1:5 | 2.5 |
| Level | A Particle Size/mm | B Temperature/°C | C HNO3 Concentration | D Time/h |
|---|---|---|---|---|
| 1 | 0.045–0.075 | 20 | 1:1 | 0.5 |
| 2 | 0.030–0.045 | 50 | 2:1 | 1.0 |
| 3 | 0.015–0.030 | 80 | 3:1 | 1.5 |
| Experiment | A | B | C | D | Sample/g | Elemental Sulfur/g | CuS/g | Fe7S8/% |
|---|---|---|---|---|---|---|---|---|
| 1 | A1 * | B1 | C1 | D1 | 0.4997 | 0.0120 | 0.1653 | 33.15 |
| 2 | A1 | B2 | C2 | D2 | 0.5007 | 0.0189 | 0.1067 | 26.41 |
| 3 | A1 | B3 | C3 | D3 | 0.4873 | 0.0250 | 0.3520 | 72.91 |
| 4 | A2 | B1 | C2 | D3 | 0.5051 | 0.0000 | 0.0000 | 0.00 |
| 5 | A2 | B2 | C3 | D1 | 0.5340 | 0.0239 | 0.4276 | 81.85 |
| 6 | A2 | B3 | C1 | D2 | 0.4974 | 0.0184 | 0.4867 | 83.32 |
| 7 | A3 | B1 | C3 | D2 | 0.4995 | 0.0000 | 0.0000 | 0.00 |
| 8 | A3 | B2 | C1 | D3 | 0.5041 | 0.0261 | 0.4611 | 88.70 |
| 9 | A3 | B3 | C2 | D1 | 0.5000 | 0.0295 | 0.4026 | 83.17 |
| Experiment | A | B | C | D | The Reacted Fe7S8/% | Reference Value/% | Ratio/% |
|---|---|---|---|---|---|---|---|
| 1 | 1 | 1 | 1 | 1 | 33.15 | 83.32 | 60.21 |
| 2 | 1 | 2 | 2 | 2 | 26.41 | 83.32 | 68.30 |
| 3 | 1 | 3 | 3 | 3 | 72.91 | 83.32 | 12.50 |
| 4 | 2 | 1 | 2 | 3 | 0.00 | 85.32 | 100.00 |
| 5 | 2 | 2 | 3 | 1 | 81.85 | 85.32 | 4.07 |
| 6 | 2 | 3 | 1 | 2 | 83.32 | 85.32 | 2.34 |
| 7 | 3 | 1 | 3 | 2 | 0.00 | 87.30 | 100.00 |
| 8 | 3 | 2 | 1 | 3 | 88.70 | 87.30 | 1.60 |
| 9 | 3 | 3 | 2 | 1 | 83.17 | 87.30 | 4.73 |
| k1 | 47.00 | 86.74 | 21.38 | 23.00 | |||
| k2 | 35.47 | 24.66 | 57.68 | 56.88 | |||
| k3 | 35.44 | 6.52 | 38.86 | 38.03 | |||
| Range | 11.56 | 80.21 | 36.29 | 33.88 | |||
| Optimization Plan | A3 | B3 | C1 | D1 |
| Experiment | A | B | C | D | Sample/g | Elemental Sulfur/g | BaSO4/(g/5 mL) | FeS2/% |
|---|---|---|---|---|---|---|---|---|
| 1 | A1 | B1 | C1 | D1 | 0.5120 | 0.0032 | 0.0721 | 73.57 |
| 2 | A1 | B2 | C2 | D2 | 0.5084 | 0.0000 | 0.0933 | 94.35 |
| 3 | A1 | B3 | C3 | D3 | 0.5067 | 0.0000 | 0.0949 | 96.29 |
| 4 | A2 | B1 | C2 | D3 | 0.4966 | 0.0025 | 0.0906 | 94.74 |
| 5 | A2 | B2 | C3 | D1 | 0.4982 | 0.0000 | 0.0939 | 96.90 |
| 6 | A2 | B3 | C1 | D2 | 0.5020 | 0.0000 | 0.0857 | 87.77 |
| 7 | A3 | B1 | C3 | D2 | 0.5082 | 0.0000 | 0.0906 | 91.66 |
| 8 | A3 | B2 | C1 | D3 | 0.5064 | 0.0000 | 0.0911 | 92.49 |
| 9 | A3 | B3 | C2 | D1 | 0.5008 | 0.0000 | 0.0916 | 94.04 |
| Experiment | A | B | C | D | The Reacted FeS2/% | Reference Value/% | Ratio/% |
|---|---|---|---|---|---|---|---|
| 1 | 1 | 1 | 1 | 1 | 73.57 | 89.71 | 17.99 |
| 2 | 1 | 2 | 2 | 2 | 94.35 | 89.71 | 5.18 |
| 3 | 1 | 3 | 3 | 3 | 96.29 | 89.71 | 7.34 |
| 4 | 2 | 1 | 2 | 3 | 94.74 | 87.22 | 8.62 |
| 5 | 2 | 2 | 3 | 1 | 96.90 | 87.22 | 11.10 |
| 6 | 2 | 3 | 1 | 2 | 87.77 | 87.22 | 0.63 |
| 7 | 3 | 1 | 3 | 2 | 91.66 | 91.28 | 0.41 |
| 8 | 3 | 2 | 1 | 3 | 92.49 | 91.28 | 1.33 |
| 9 | 3 | 3 | 2 | 1 | 94.04 | 91.28 | 3.02 |
| k1 | 10.17 | 9.01 | 6.65 | 10.70 | |||
| k2 | 6.78 | 5.87 | 5.61 | 2.07 | |||
| k3 | 1.59 | 3.66 | 6.28 | 5.76 | |||
| Range | 8.58 | 5.34 | 1.04 | 8.63 | |||
| Optimization Plan | A3 | B3 | C2 | D2 |
| Sample | Soluble Sulfates (in Terms of SO3/%) | Fe1−xS (in Terms of Fe1−xS Mass/%) | FeS2 (in Terms of FeS2 Mass/%) |
|---|---|---|---|
| 1 | 0.09 | 0.00 | 3.20 |
| 2 | 0.10 | 0.00 | 0.80 |
| 3 | 0.09 | 0.00 | 5.62 |
| 4 | 0.10 | 0.00 | 6.47 |
| 5 | 0.12 | 0.00 | 1.71 |
| 6 | 0.10 | 0.00 | 2.87 |
Disclaimer/Publisher’s Note: The statements, opinions and data contained in all publications are solely those of the individual author(s) and contributor(s) and not of MDPI and/or the editor(s). MDPI and/or the editor(s) disclaim responsibility for any injury to people or property resulting from any ideas, methods, instructions or products referred to in the content. |
© 2025 by the authors. Licensee MDPI, Basel, Switzerland. This article is an open access article distributed under the terms and conditions of the Creative Commons Attribution (CC BY) license (https://creativecommons.org/licenses/by/4.0/).
Share and Cite
Wang, Z.; Wang, S.; Li, W.; Cao, B.; Huang, X.; Chuai, X.; Zhang, X.; Deng, M. Methods for Quantitative Determination of Iron Sulfides in Rocks. Materials 2025, 18, 2647. https://doi.org/10.3390/ma18112647
Wang Z, Wang S, Li W, Cao B, Huang X, Chuai X, Zhang X, Deng M. Methods for Quantitative Determination of Iron Sulfides in Rocks. Materials. 2025; 18(11):2647. https://doi.org/10.3390/ma18112647
Chicago/Turabian StyleWang, Zhixin, Shaoping Wang, Wei Li, Bing Cao, Xiaojun Huang, Xin Chuai, Xinyu Zhang, and Min Deng. 2025. "Methods for Quantitative Determination of Iron Sulfides in Rocks" Materials 18, no. 11: 2647. https://doi.org/10.3390/ma18112647
APA StyleWang, Z., Wang, S., Li, W., Cao, B., Huang, X., Chuai, X., Zhang, X., & Deng, M. (2025). Methods for Quantitative Determination of Iron Sulfides in Rocks. Materials, 18(11), 2647. https://doi.org/10.3390/ma18112647