
The Interface of Additive Manufactured Tungsten–Diamond Composites

 and
and Highlights
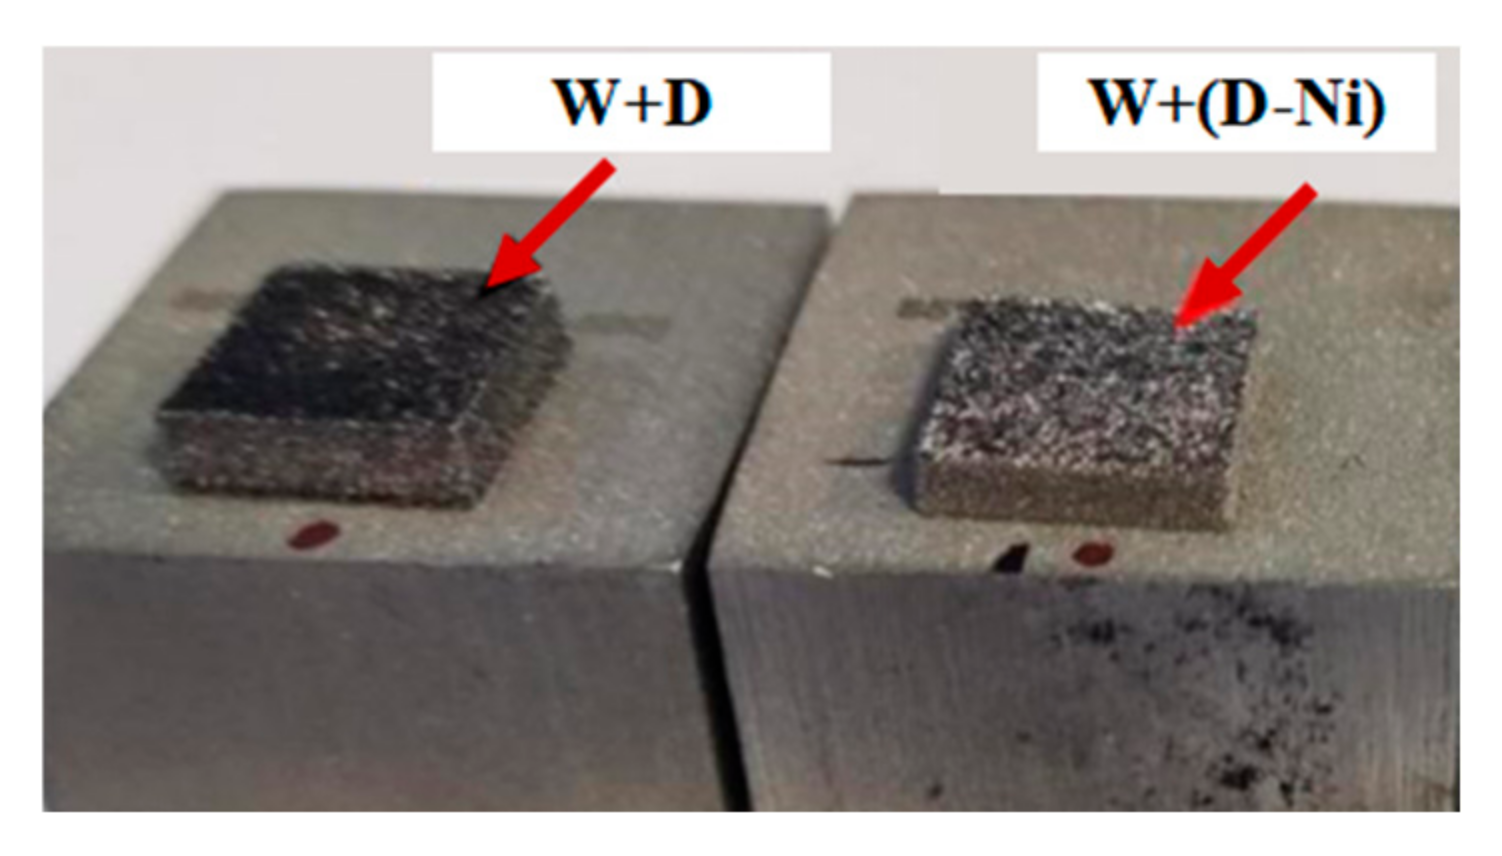
- The W+D and W+(D-Ni) composites are firstly fabricated by L-PBF technology using tungsten (W), diamond (D), and diamond with Ni coating (D-Ni) powders;
- The diffusion behavior and microstructure evolution on the interface of W+D and W+(D-Ni) composites fabricated by L-PBF are studied;
- The effect of Ni coating on preventing the graphitization of diamond powder and reducing the cracks of W phase during are discussed.
Abstract
1. Introduction
2. Experimental Materials and Methods
2.1. Material Preparation
2.2. Material Characterization
3. Results
3.1. Morphology and Defects
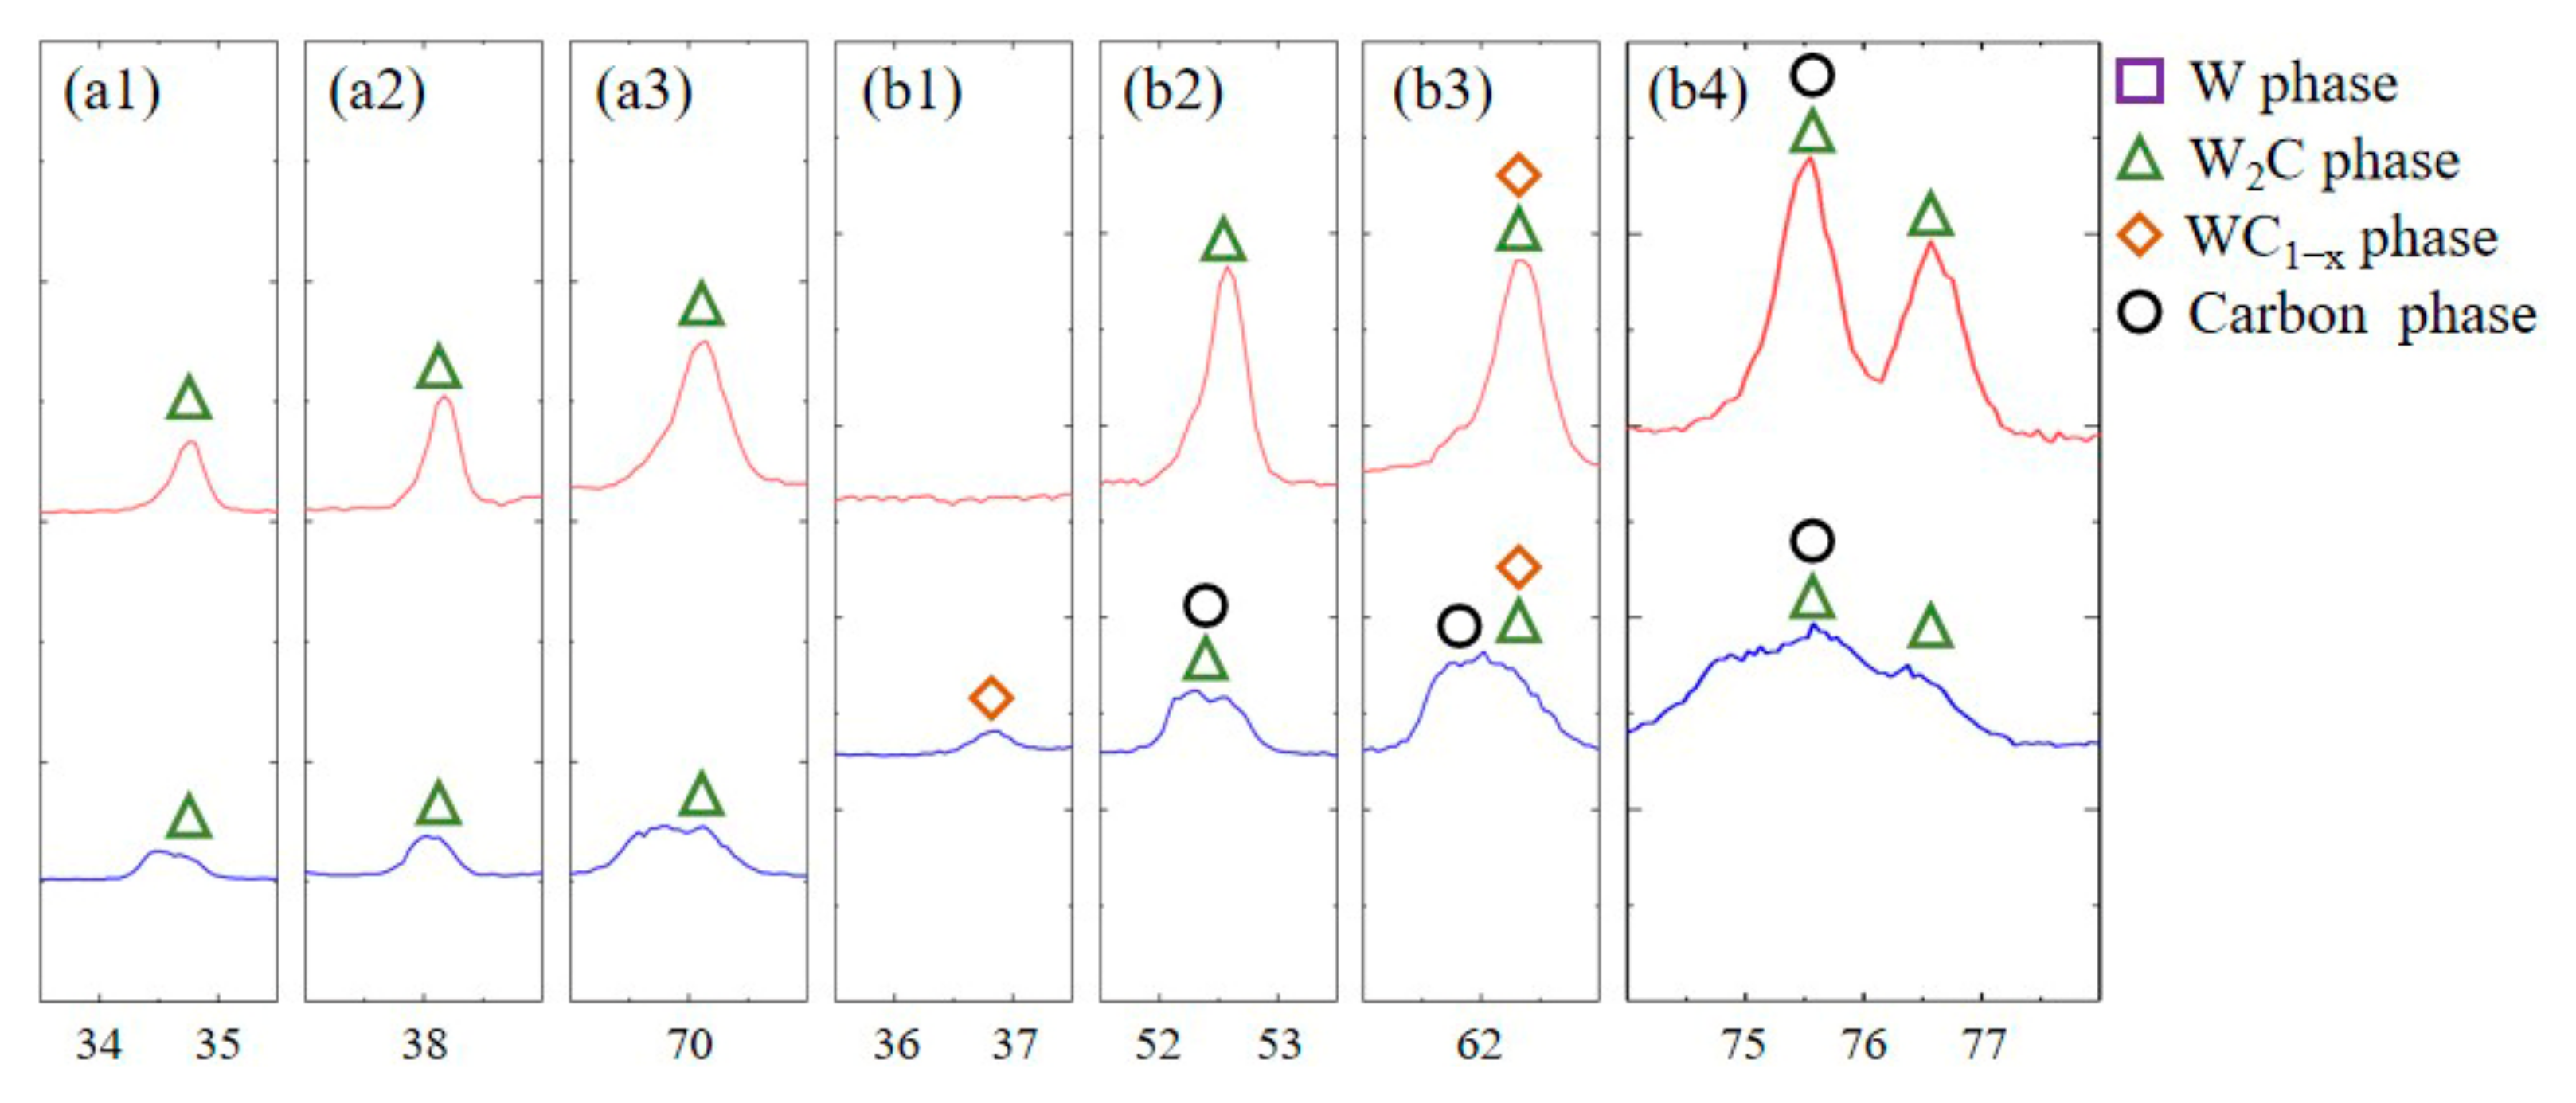
3.2. Phase Analysis of XRD
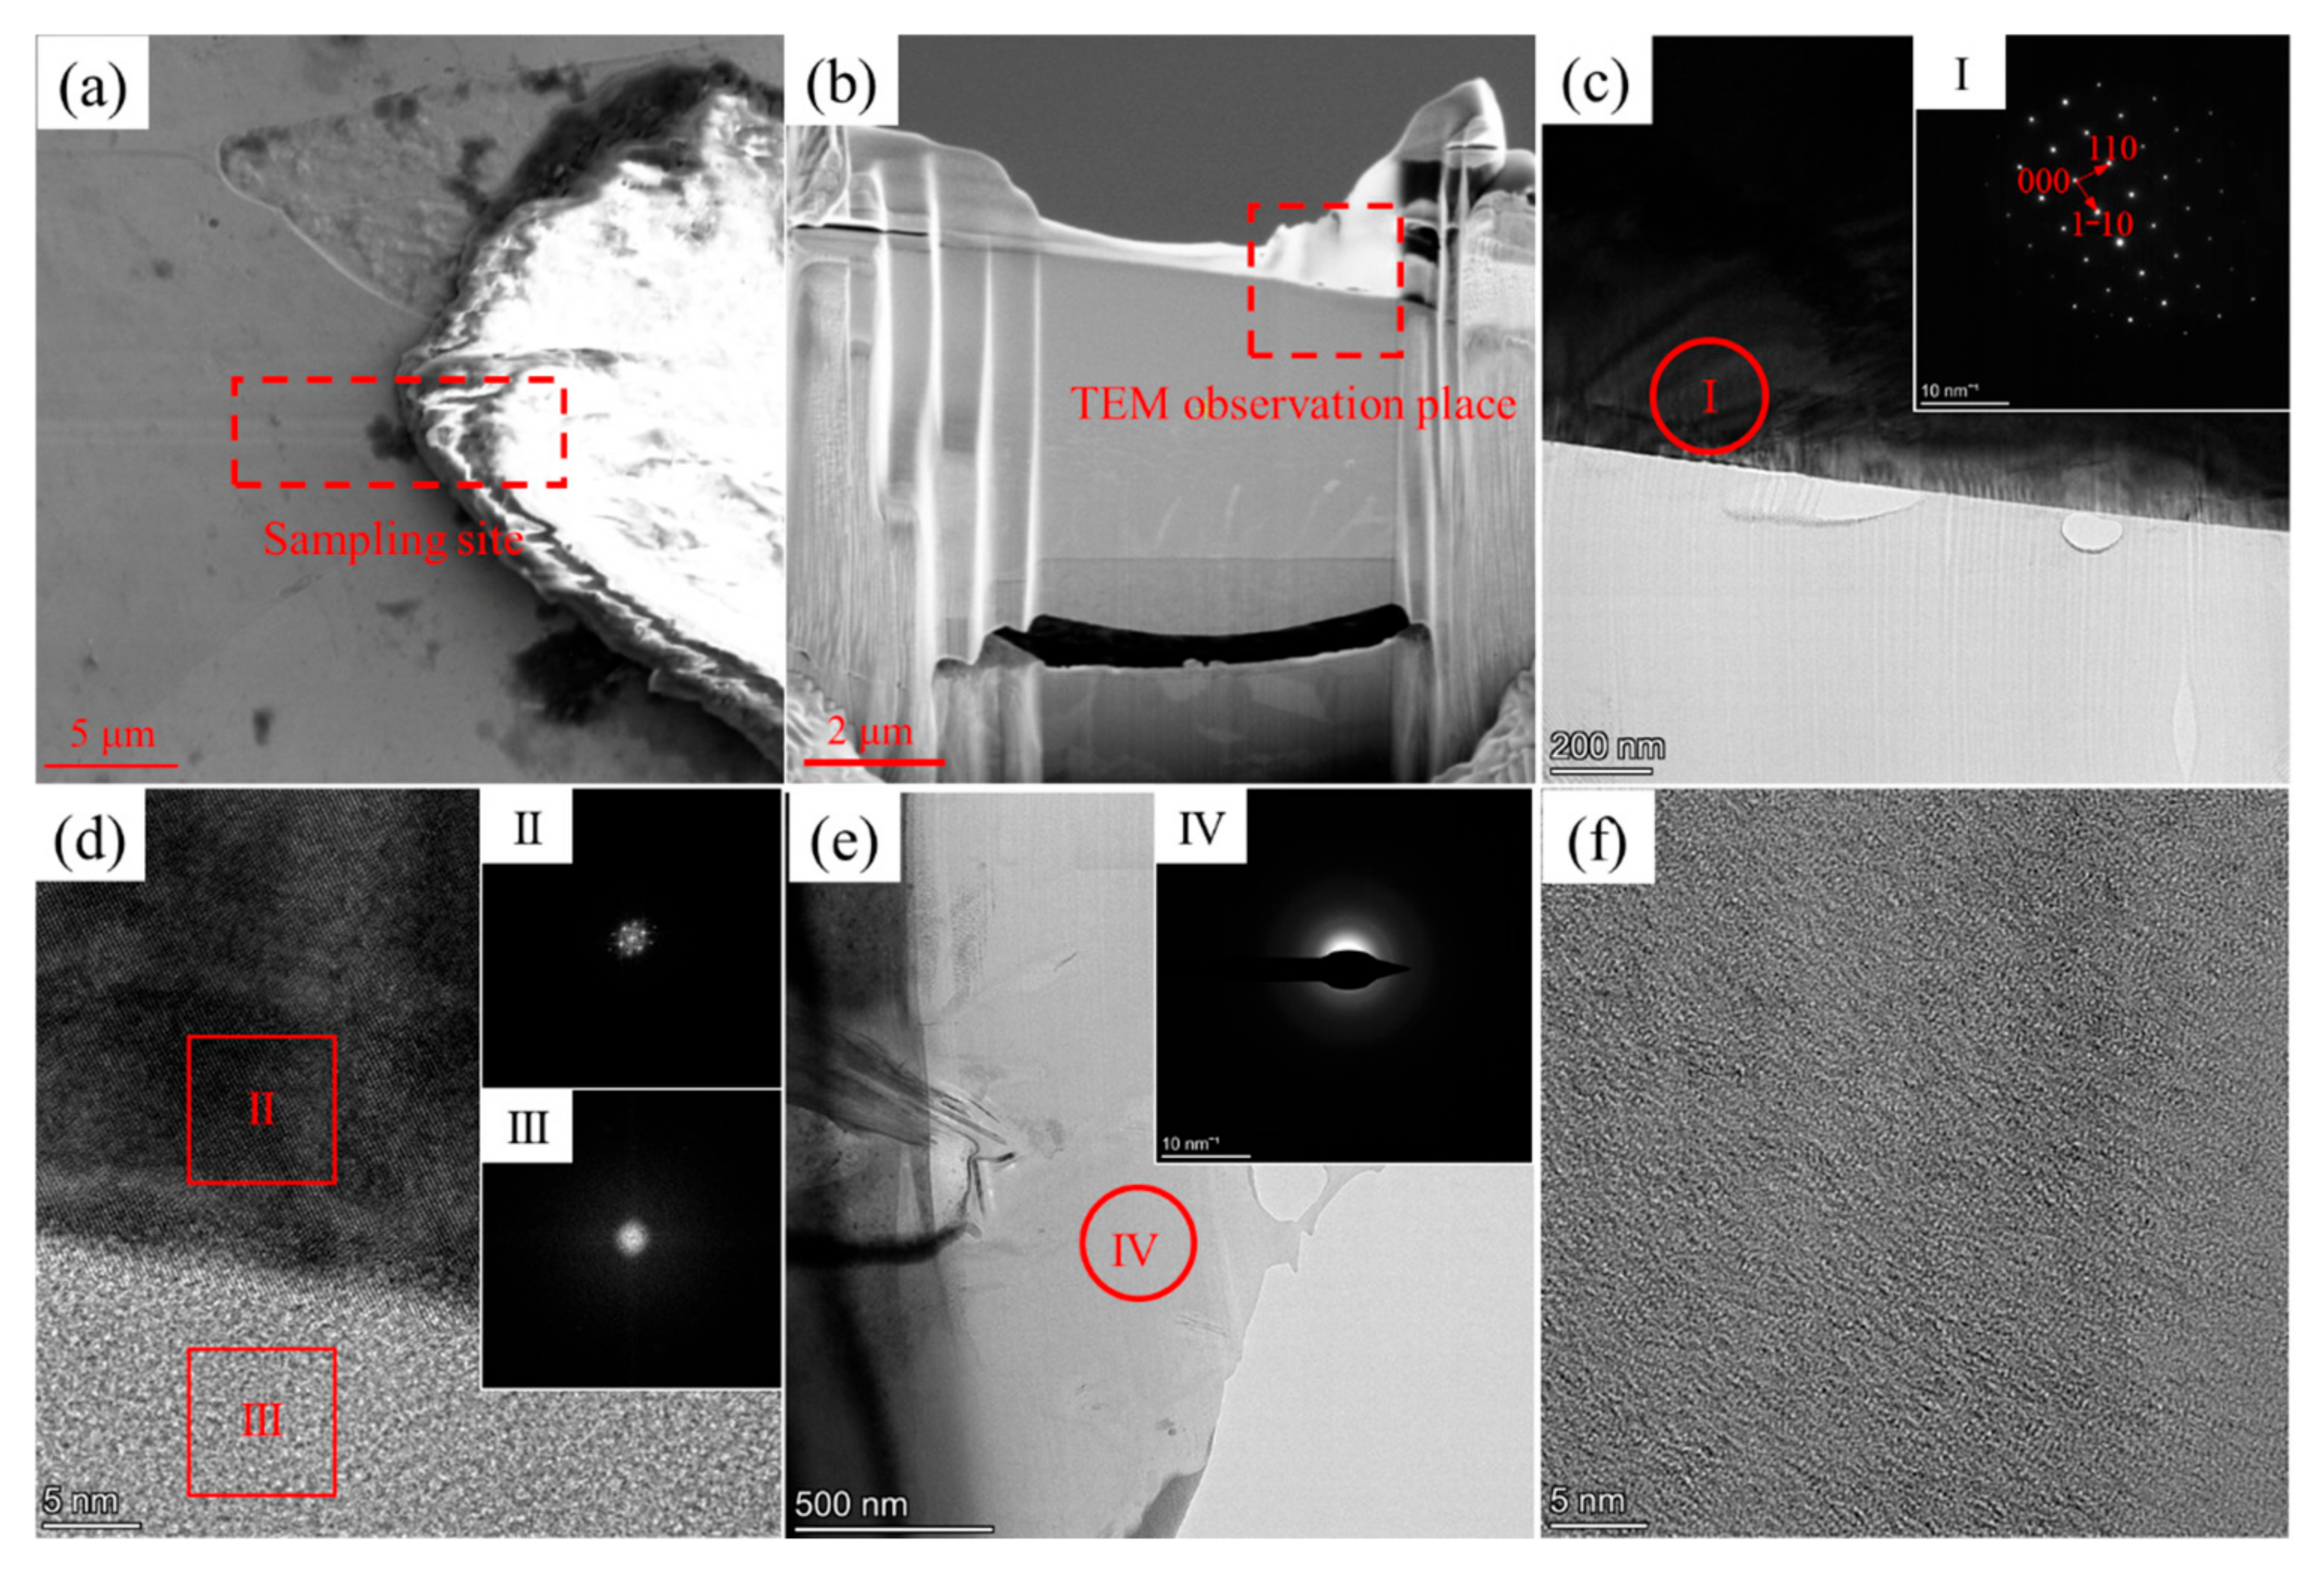
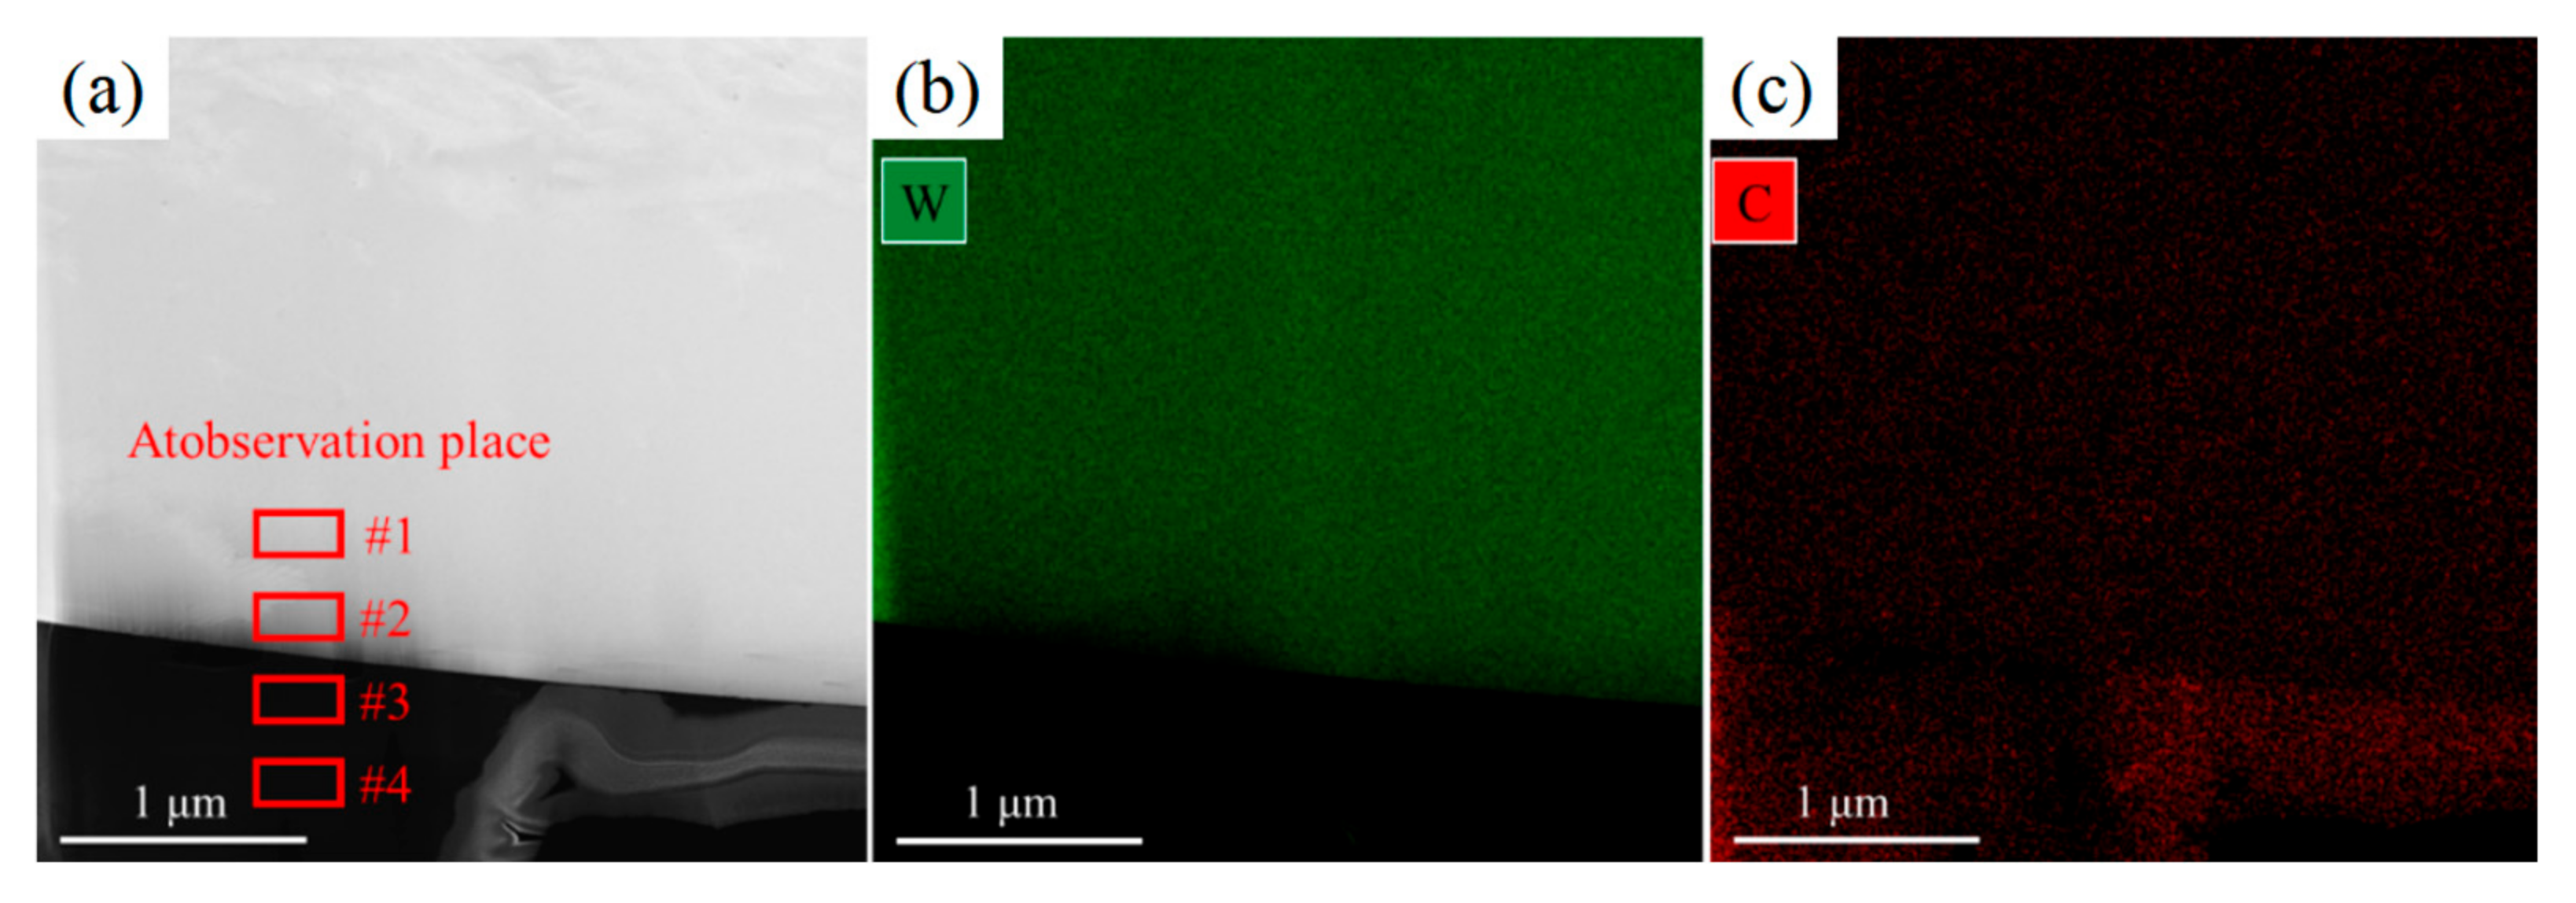
3.3. Phases Structure and Composition
3.4. Bond Composition of Raman Spectrum
4. Discussion
4.1. Melt Flow and Element Diffusion Behavior
- (1)
- The interface of W+D sample
- (2)
- The interface of W+(D-Ni) sample
4.2. Microstructure Evolution and Amorphization Mechanism
- (1)
- The effect of Ni coating on phase precipitation
- (2)
- DLC phase formation and nanocrystalline precipitation
- (3)
- The effect of Ni coating on W phase at the interface
5. Conclusions
- (1)
- At the interface of the W+D sample, the W powder melts while the D powder remains in the solid state during the L-PBF processing. W and C elements gradually diffuse into each other. Due to the high cooling rate of L-PBF processing, the C phase forms a DLC phase with an amorphous structure, and the W phase becomes a supersaturated solid solution of the C element.
- (2)
- At the interface of the W+(D-Ni) sample, the Ni coating melts first, followed by the W powder melting shortly afterward, while the D powder remains in the solid state during the L-PBF processing. C and W elements diffuse into the Ni melt, forming a rich Ni area of the DLC phase. The diffusion capacity of Ni and W elements in the solid state is weaker than in the molten state; however, they still diffuse into the solid D powder, forming a lean Ni area of the DLC phase.
- (3)
- In the rich Ni area of the DLC phase, the bond energy differences among W-C, Ni-C, and W-Ni lead to Ni segregation in the melt and the precipitation of nanocrystals (several hundred nanometers) in the DLC phase. Compared with the rich Ni area of the DLC phase, the diffusion capacity of Ni and W elements in the solid D powder is limited, resulting in nanocrystalline sizes of only about tens of nanometers in the lean Ni area of the DLC phase.
- (4)
- During W dendrite growth, the addition of Ni element and the expelling of the C phenomenon leads to W grain refinement at the interface, which reduces both the number and length of cracks in the W+(D-Ni) sample.
Author Contributions
Funding
Institutional Review Board Statement
Informed Consent Statement
Data Availability Statement
Conflicts of Interest
References
- Luo, C.Y.; Xu, L.J.; Zong, L.; Shen, H.H.; Wei, S.Z. Research status of tungsten-based plasma-facing materials: A review. Fusion Eng. Des. 2023, 190, 113487. [Google Scholar] [CrossRef]
- Yang, Z.B.; Zhang, M.J.; Zhang, Z.Z.; Liu, A.J.; Yang, R.Y.; Liu, S.A. A study on diamond grinding wheels with regular grain distribution using additive manufacturing (AM) technology. Mater. Desigh. 2016, 104, 292–297. [Google Scholar] [CrossRef]
- Zhao, Q.L.; Guo, B. Ultra-precision grinding of optical glasses using mono-layer nickel electroplated coarse-grained diamond wheels. Part 1: ELID assisted precision conditioning of grinding wheels. Precis. Eng. 2015, 39, 56–66. [Google Scholar] [CrossRef]
- Liang, C.F.; Zhang, K.; Wang, Y.; Liu, B.L.; Kong, L.R.; Xue, T. Application and development of superhard materials in geological drilling field. Superhard Mater. Eng. 2024, 36, 53–58. [Google Scholar]
- Cao, Z.Y.; Jiang, Z.Z.; Chen, H.; Sun, J.L.; Chen, S.; Huang, Q.Y.; Huang, J.H. Synthesizing SiC layer on diamond by heat treatment and its effects on density and thermal conductivity of diamond/W composite. J. Alloys Compd. 2023, 960, 170894. [Google Scholar] [CrossRef]
- Liao, Z.R.; Abdelhafeez, A.L.; Li, H.N.; Yang, Y.; Diaz, O.G.; Axinte, D. State-of-the-art of surface integrity in machining of metal matrix composites. Int. J. Mach. Tool. Manuf. 2019, 143, 63–91. [Google Scholar] [CrossRef]
- Liu, J.; Li, J.; Xu, C.Y. Interaction of the cutting tools and the ceramic-reinforced metal matrix composites during micro-machining: A review. CIRP J. Manuf. Sci. Technol. 2014, 7, 55–70. [Google Scholar] [CrossRef]
- Du, X.D.; He, J.W.; Chen, W.; Wang, C.R.; Tian, W.; Liao, W.H.; He, X.X. Research Progress of Diamond-reinforced Metal Matrix Composites. Electro-Mech. Eng. 2024, 40, 1–12. [Google Scholar]
- Cao, Z.Y. Design, Fabrication and Thermal Conductivity Investigation for Diamond/Composites with Doped Diamond. Ph.D. Thesis, University of Science and Technology of China, Hefei, China, 2023. [Google Scholar]
- Cao, Z.Y.; Chen, S.; Jiang, Z.Z.; Chen, H.; Sun, J.L.; Jing, K.; Huang, Q.Y.; Huang, J.H. Effect of Si-coated diamond on the relative density and thermal conductivity of diamond/W composites prepared by SPS. Vacuum 2023, 209, 111728. [Google Scholar] [CrossRef]
- Hu, D.C.; Wang, L.; Chen, M.H.; Feng, S.H.; Wang, N.; Zhou, Y. Thermal conduction and strength of diamond copper composite sandwich obtained by SPS diffusion bonding with Ti interlayer. J. Mater. Res. Technol. 2023, 26, 8806–8812. [Google Scholar] [CrossRef]
- DebRoy, T.; Wei, H.L.; Zuback, J.S.; Mukherjee, T.; Elmer, J.W.; Milewski, J.O.; Beese, A.M.; Wilson-Heid, A.; De, A.; Zhang, W. Additive manufacturing of metallic components-Process, structure and properties. Prog. Mater. Sci. 2018, 92, 112–224. [Google Scholar] [CrossRef]
- Wang, H.; He, W.W.; Cheng, K.K.; Li, H.X.; Zhao, P.; Wang, X.F.; Wang, Y. Research progress in diamond-reinforced metal matrix composites fabricated by additive manufacturing. J. Aeronaut. Mater. 2025, 45, 18–27. [Google Scholar]
- Wang, B.; Yang, F.; Zhang, H.T.; He, P. Microstructure and interface evolution of diamond/Cu composites prepared via ultrasonic additive manufacturing (UAM). J. Mater. Res. Technol. 2023, 25, 546–551. [Google Scholar] [CrossRef]
- Constantin, L.; Fan, L.S.; Pontoreau, M.; Wang, F.; Cui, B.; Battaglia, J.L.; Silvain, J.F.; Lu, Y.F. Additive manufacturing of copper/diamond composites for thermal management applications. Manuf. Lett. 2020, 24, 61–66. [Google Scholar] [CrossRef]
- Ding, M.M.; Fu, H.; Tian, Y.F.; Sun, J.; Yang, X.; Luo, L.M. Shape, microstructure and properties of diamond/copper composites prepared by binder jet additive manufacturing. Int. J. Refract. Met. Hard Mater. 2025, 130, 107148. [Google Scholar] [CrossRef]
- Feng, Z.; Wang, G.; Hao, Z.W.; Wang, Y.X.; Tan, H.; Fan, W.; Dang, M.J.; Zhang, S.Y.; Chen, Y.G.; Peng, Y.J.; et al. Influence of scale effect on surface morphology in laser powder bed fusion technology. Virtual Phys. Prototyp. 2024, 19, e2336157. [Google Scholar] [CrossRef]
- Peng, Y.B.; Jin, T.T.; Yang, B.Y.; Shi, Y.S.; Gao, Y.; Zhang, W. Thermal-mechanical evolution behaviors of metal matrix diamond composite by powder bed fusion-laser beam. J. Mater. Res. Technol. 2024, 31, 618–634. [Google Scholar] [CrossRef]
- Zhang, L.; Li, Y.; Hu, R.; Yin, J.; Sun, Q.L.; Li, X.D.; Gao, L.; Wang, H.S.; Xiong, W.; Hao, L. Freeform thermal-mechanical Bi-functional Cu-plated diamond/Cu metamaterials manufactured by selective laser melting. J. Alloys Compd. 2023, 968, 172010. [Google Scholar] [CrossRef]
- Tao, Y.K.; Sun, W.C.; Gan, J.; Wang, X.Q.; Zhou, Y.; Duan, L.C.; Wen, S.F.; Shi, Y.S. Effect of Cu-coated diamond on the formation of Cu-Sn-based diamond composites fabricated by laser-powder bed fusion. Int. J. Refract. Met. Hard Mater. 2024, 119, 106526. [Google Scholar] [CrossRef]
- Peng, Y.B.; Wang, Y.; Ding, J.W.; Shi, Y.S.; Jin, T.T.; Zhang, W. Balling behavior and diamond graphitization of metal-matrix diamond composites by selective laser melting: A quantitative investigation. Int. J. Refract. Met. Hard Mater. 2024, 124, 106830. [Google Scholar] [CrossRef]
- Li, K.; Hu, Z.J.; Yang, W.X.; Duan, W.; Ni, X.N.; Hu, Z.J.; He, W.T.; Cai, Z.C.; Liu, Y.K.; Zhao, Z.; et al. Selective laser melting and mechanical behavior of Mo-coated diamond particle reinforced metal matrix composites. Diam. Relat. Mater. 2024, 144, 110952. [Google Scholar] [CrossRef]
- Wang, R.C.; Zhou, R.; Zhou, J.Z.; Chen, J.Z.; Li, H.X.; He, W.W.; Zhang, W.; Wang, L.; Lu, Y.; Liu, Y. Additive manufacturing of high-quality NiCu/diamond composites through powder bed fusion. Addit. Manuf. 2024, 89, 104288. [Google Scholar] [CrossRef]
- Zhang, J.T.; Huang, G.Q.; Xu, Y.L.; Wang, J.Y.; Han, G.Y.; Tan, Y.Q. Dynamic simulation of powder spreading processes toward the fabrication of metal-matrix diamond composites in selective laser melting. Int. J. Refract. Met. Hard Mater. 2024, 118, 106500. [Google Scholar] [CrossRef]
- Wei, C.; Liu, L.C.; Gu, Y.C.; Huang, Y.H.; Chen, Q.; Li, Z.Q.; Li, L. Multi-material additive-manufacturing of tungsten—Copper alloy bimetallic structure with a stainless-steel interlayer and associated bonding mechanisms. Addit. Manuf. 2022, 50, 102574. [Google Scholar] [CrossRef]
- Thapliyal, V.; Alabdulkarim, M.E.; Whelan, D.R.; Mainali, B.; Maxwell, J.L. A concise review of the Raman spectra of carbon allotropes. Diam. Relat. Mater. 2022, 127, 109180. [Google Scholar] [CrossRef]
- Robertson, J. Diamond-like amorphous carbon. Mat. Sci. Eng. R. 2002, 37, 129–281. [Google Scholar] [CrossRef]
- Tang, Z.Y.; Wei, J.; Chen, R.D.; Cui, L.; Guo, P.; Wang, A.Y. Research Progress on Thermal Stability of Diamond-like Carbon-based Coatings. Surf. Technol. 2024, 1–20. [Google Scholar] [CrossRef]
- Lu, K.; Xu, J.X.; Sun, Q.; Chu, Z.H. Research Progress on Induction Mechanism of Graphitization Phase Transition of Diamond Materials. Mater. China 2022, 41, 536–546. [Google Scholar]
- Wannapraphai, P.; Panwisawas, C.; Houghton, O.S.; Shinjo, J.; Wakabayashi, H.; Phetrattanarangsi, T.; Kuimalee, S.; Reed, R.C.; Greer, A.L.; Lohwongwatana, B.; et al. Quantifying chemical homogeneity across the melt pool in laser powder-bed fusion of metallic glass matrix composites from blended elemental powders. J. Mater. Res. Technol. 2025, 35, 6397–6407. [Google Scholar] [CrossRef]
- Fan, W.; Peng, Y.J.; Qi, Y.; Tan, H.; Feng, Z.; Wang, Y.X.; Zhang, F.Y.; Lin, X. Partially melted powder in laser based directed energy deposition: Formation mechanism and its influence on microstructure. Int. J. Mach. Tool. Manuf. 2023, 192, 104072. [Google Scholar] [CrossRef]
- Fan, W.; Peng, Y.J.; Zhang, S.Y.; Hao, Z.W.; Feng, Z.; Tan, H.; Yao, L.M.; Zhang, F.Y.; Lin, X. On the powder chilling effect in laser based directed energy deposition. Addit. Manuf. 2025, 105, 104789. [Google Scholar] [CrossRef]
- Kurlov, A.S.; Gusev, A.I. Tungsten Carbides and W–C Phase Diagram. Inorg. Mater. 2006, 42, 121–127. [Google Scholar] [CrossRef]
- Kublii, V.Z.; Velikanova, T.Y. Ordering in the carbide W2C and phase equilibria in the tungsten-carbon system in the region of its existence. Powder Metall. Met. Ceram. 2004, 43, 11–12. [Google Scholar] [CrossRef]
- Lu, Y.M.; Huang, G.J.; Wang, S.; Mi, C.W.; Wei, S.F.; Tian, F.T.; Li, W.; Cao, H.Y.; Cheng, Y. A review on diamond-like carbon films grown by pulsed laser deposition. Appl. Surf. Sci. 2021, 541, 148573. [Google Scholar] [CrossRef]
- Abad, M.D.; Muñoz-Márquez, M.A.; El Mrabet, S.; Justo, A.; Sánchez-López, J.C. Tailored synthesis of nanostructured WC/a-C coatings by dual magnetron sputtering. Surf. Coat. Technol. 2010, 204, 3490–3500. [Google Scholar] [CrossRef]
- Takeuchi, A.; Inoue, A. Classification of bulk metallic glasses by atomic size difference, heat of mixing and period of constituent elements and its application to characterization of the main alloying element. Mater. Trans. 2005, 46, 2817–2829. [Google Scholar] [CrossRef]
- Corbella, C.; Echebarria, B.; Ramírez-Piscina, L.; Pascual, E.; Andu, J.L.; Bertran, E. Growth kinetics of nanometric dendrites in metal–carbon thin films. Acta Mater. 2009, 57, 4948–4956. [Google Scholar] [CrossRef]
- Sahay, S.; Pandey, M.K.; Kar, A.K. Metal concentration dependent mechanical properties of electrodeposited nickel incorporated diamond like carbon (Ni-DLC) thin films studied by nanoindentation. Appl. Surf. Sci. 2019, 489, 73–79. [Google Scholar] [CrossRef]
- Boubichea, N.; El Hamouchi, J.; Hulik, J.; Abdesslam, M.; Speisser, C.; Djeffal, F.; Le Normand, F. Kinetics of graphitization of thin diamond-like carbon (DLC) films catalyzed by transition metal. Diam. Relat. Mater. 2019, 91, 190–198. [Google Scholar] [CrossRef]
- Talignani, A.; Seede, R.Y.; Whitt, A.; Zheng, S.Q.; Ye, J.C.; Karaman, I.; Kirka, M.M.; Katoh, Y.; Wang, Y.M. A review on additive manufacturing of refractory tungsten and tungsten alloys. Addit. Manuf. 2022, 58, 103009. [Google Scholar] [CrossRef]
- Pan, S.H.; Yao, G.C.; Cui, Y.N.; Meng, F.S.; Luo, C.; Zheng, T.Q.; Singh, G.M. Additive manufacturing of tungsten, Tungsten-based alloys, and tungsten matrix composites. Tungsten 2023, 5, 1–31. [Google Scholar] [CrossRef]
- Guo, M.; Liu, K.; Sun, J.J.; Gu, D.D. Laser powder bed fusion of a novel nano-modified tungsten alloy with refined microstructure and enhanced strength. Mater. Sci. Eng. A 2022, 843, 143096. [Google Scholar] [CrossRef]
- Hu, Y.J.; Fellinger, M.R.; Butler, B.G.; Wang, Y.; Darling, K.A.; Kecskes, L.J.; Trinkle, D.R.; Liu, Z.K. Solute-induced solid-solution softening and hardening in bcc tungsten. Acta. Mater. 2017, 141, 304–316. [Google Scholar] [CrossRef]
- Zhang, W.T.; Zhou, Z.L.; Li, Y.; Hui, Z.L.; He, X.L.; Chen, W.S. Research Progress on Microalloying of Refractory Metals Molybdenum and Tungsten. Chin. J. Rare Met. 2022, 48, 695–704. [Google Scholar]


| Material | Powder Size | Supplier |
|---|---|---|
| W powder | 15 µm to 45 µm | TEKNA Advanced Materials Inc., Sherbrooke, QC, Canada |
| D powder | 25 µm to 38 µm | HongXiang Superhard Material Co., Ltd., Shangqiu, China |
| D-Ni powder | 25 µm to 38 µm | HongXiang Superhard Material Co., Ltd., Shangqiu, China |
| Average Composition | C (at%) | W (at%) |
|---|---|---|
| Zone #1 | 8.45 | 91.55 |
| Zone #2 | 11.62 | 88.38 |
| Zone #3 | 97.68 | 2.32 |
| Zone #4 | 98.46 | 1.54 |
| Average Composition | W (at%) | C (at%) | Ni (at%) |
|---|---|---|---|
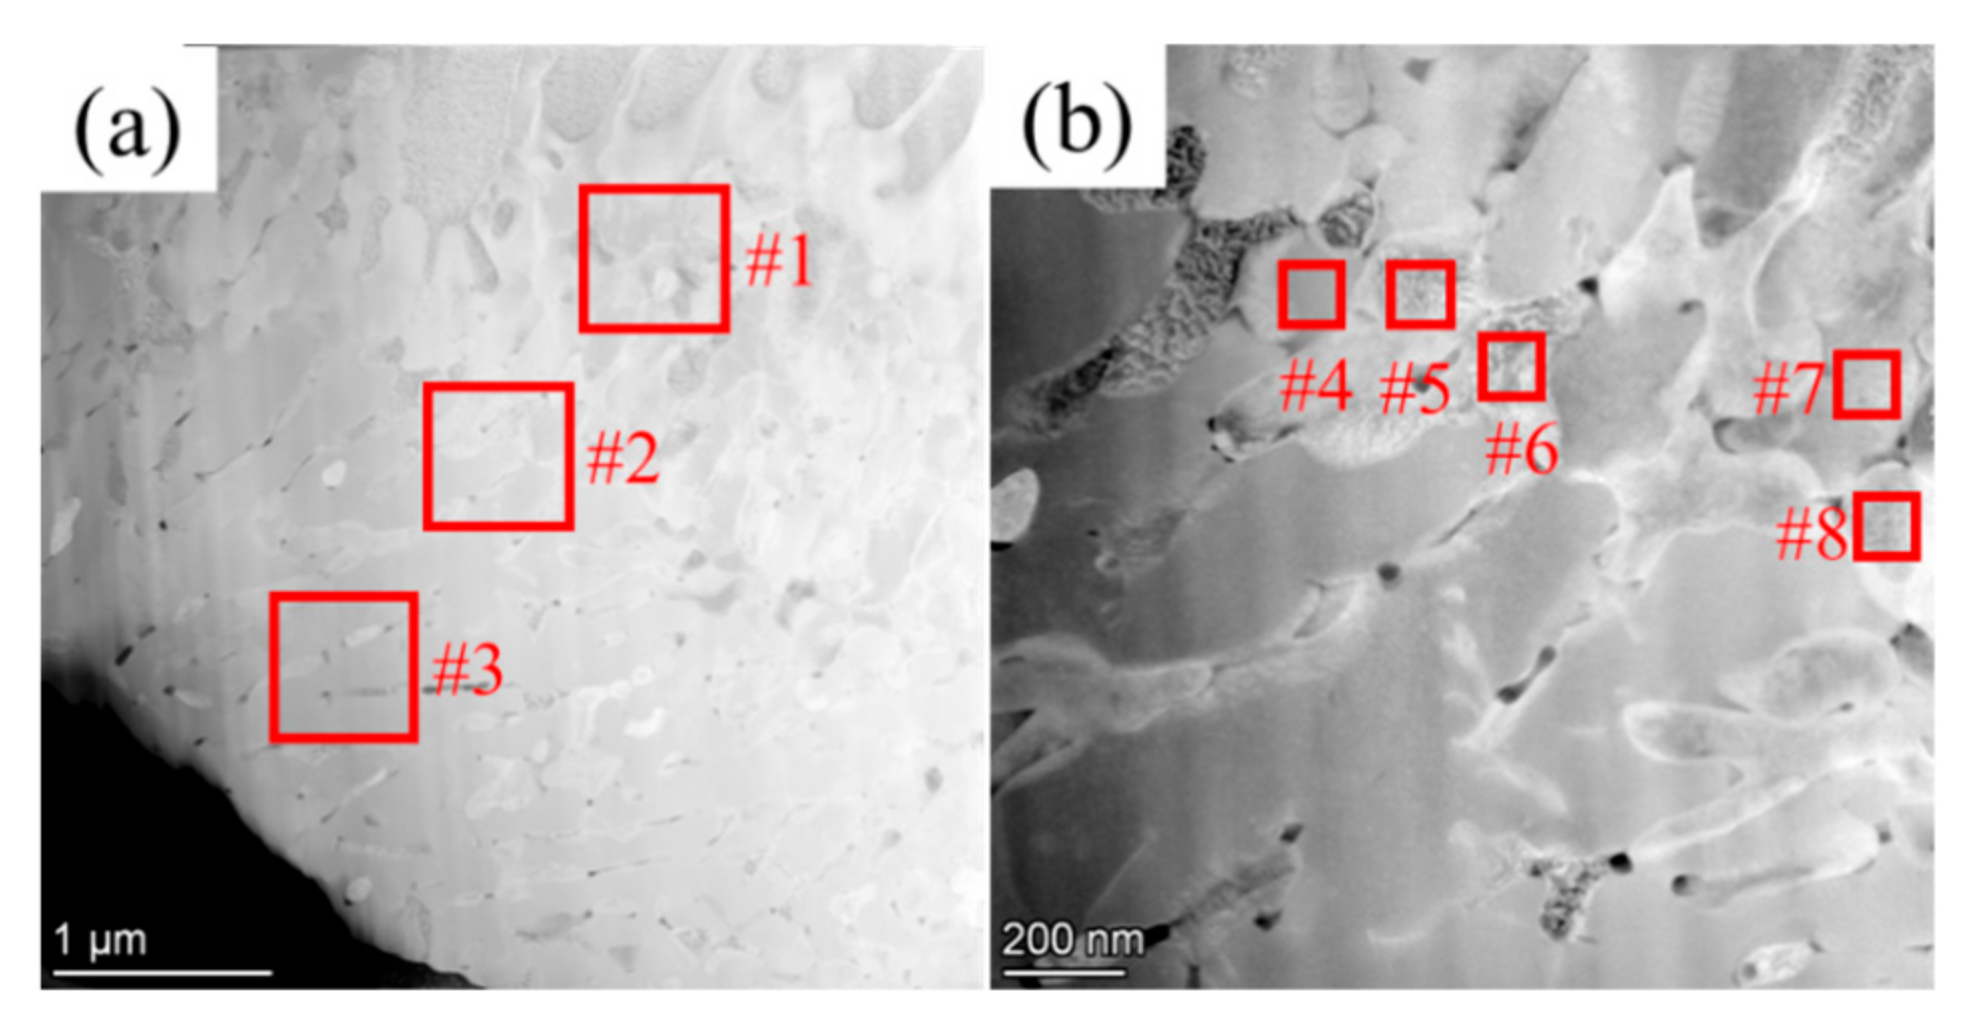
| Zone #1 | 90.93 | 6.35 | 2.72 |
| Zone #2 | 89.11 | 7.82 | 3.07 |
| Zone #3 | 86.15 | 11.06 | 2.79 |
| Average Composition | W (at%) | C (at%) | Ni (at%) |
|---|---|---|---|
| C rich zone (W phase #4 and #7) | 89.71 | 8.39 | 1.9 |
| C lean zone (W phase #5, #6, and #8) | 93.83 | 3.2 | 2.97 |
| Average Composition | C (at%) | W (at%) | Ni (at%) |
|---|---|---|---|
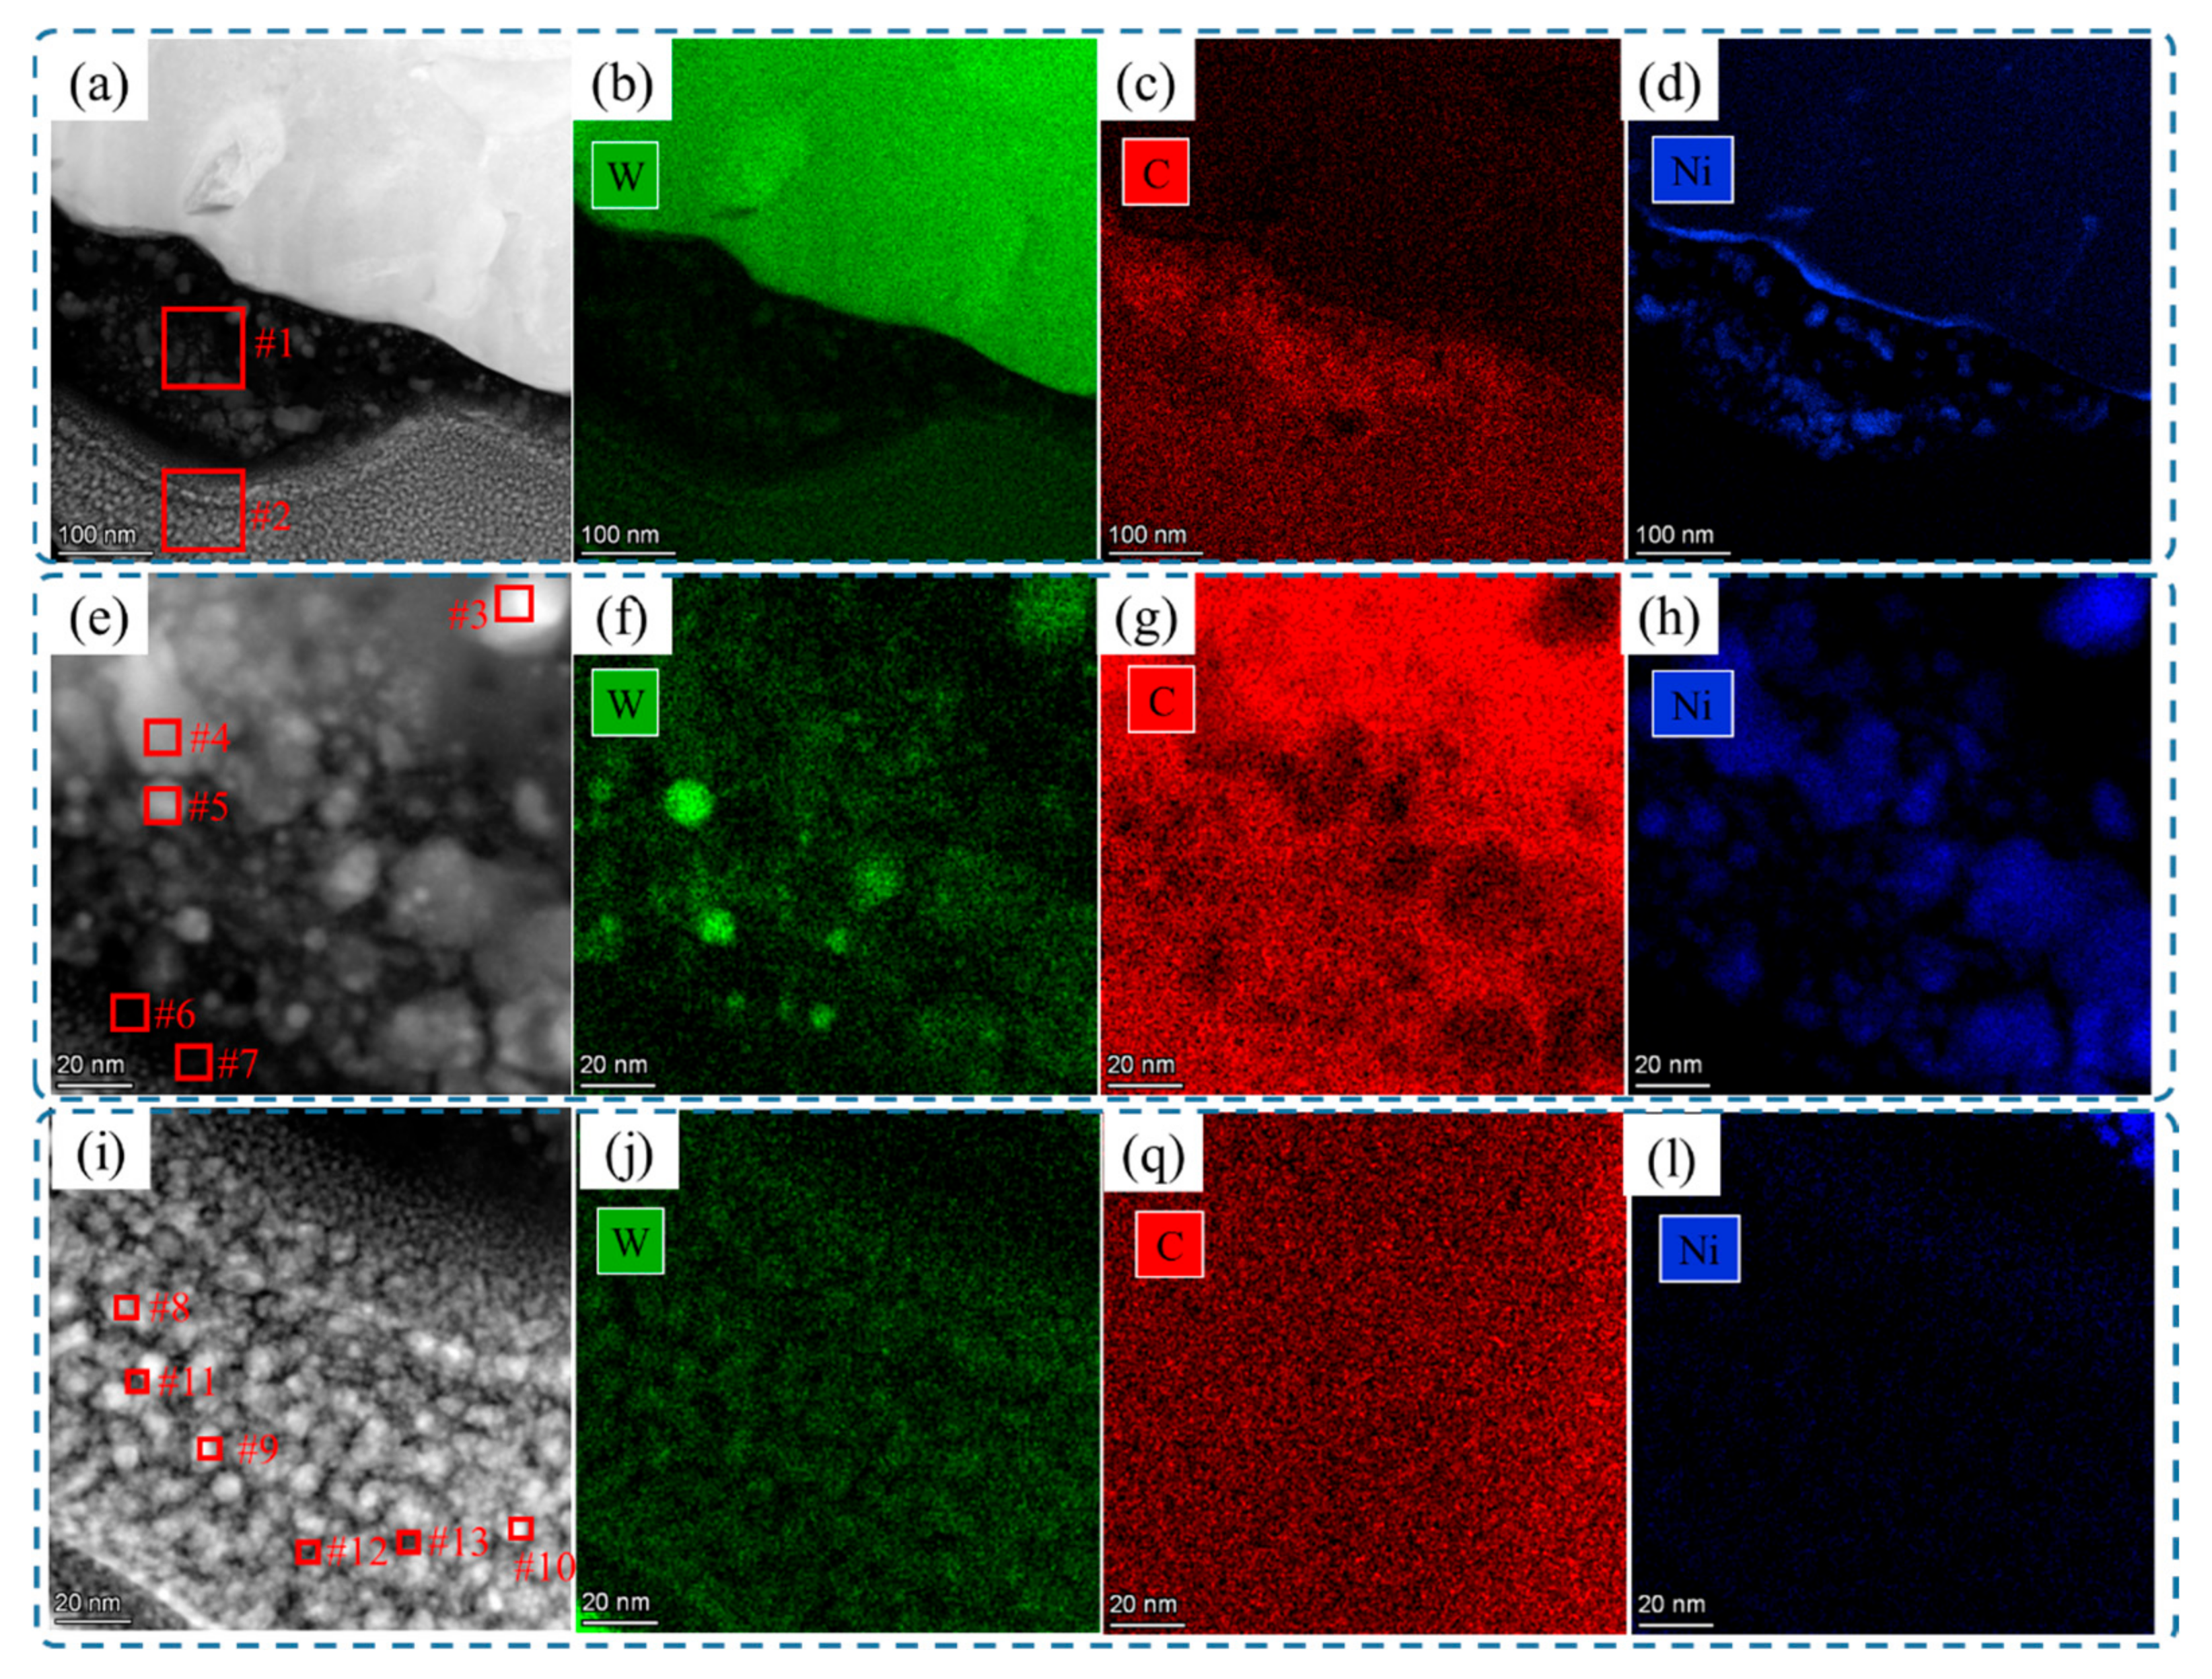
| Zone #1 | 81.30 | 2.61 | 16.09 |
| Zone #2 | 94.09 | 4.57 | 1.34 |
| Average Composition | C (at%) | W (at%) | Ni (at%) |
|---|---|---|---|
| Ni rich in nanocrystals (middle area #3, #4, and #5) | 62.58 | 7.55 | 29.87 |
| Ni lean in amorphous phase (middle area #6 and #7) | 97.64 | 1.06 | 1.3 |
| Ni rich in nanocrystals (bottom area #8, #9, and #10) | 92.74 | 5.05 | 2.21 |
| Ni lean in amorphous phase (bottom area #11, #12, and #13) | 97.48 | 1.46 | 1.06 |
Disclaimer/Publisher’s Note: The statements, opinions and data contained in all publications are solely those of the individual author(s) and contributor(s) and not of MDPI and/or the editor(s). MDPI and/or the editor(s) disclaim responsibility for any injury to people or property resulting from any ideas, methods, instructions or products referred to in the content. |
© 2025 by the authors. Licensee MDPI, Basel, Switzerland. This article is an open access article distributed under the terms and conditions of the Creative Commons Attribution (CC BY) license (https://creativecommons.org/licenses/by/4.0/).
Share and Cite
Gao, X.; Cheng, D.; Sun, Z.; Huang, Y.; Ouyang, W.; Lan, C.; Li, Z.; Li, L. The Interface of Additive Manufactured Tungsten–Diamond Composites. Materials 2025, 18, 2574. https://doi.org/10.3390/ma18112574
Gao X, Cheng D, Sun Z, Huang Y, Ouyang W, Lan C, Li Z, Li L. The Interface of Additive Manufactured Tungsten–Diamond Composites. Materials. 2025; 18(11):2574. https://doi.org/10.3390/ma18112574
Chicago/Turabian StyleGao, Xuehao, Dongxu Cheng, Zhe Sun, Yihe Huang, Wentai Ouyang, Cunxiao Lan, Zhaoqing Li, and Lin Li. 2025. "The Interface of Additive Manufactured Tungsten–Diamond Composites" Materials 18, no. 11: 2574. https://doi.org/10.3390/ma18112574
APA StyleGao, X., Cheng, D., Sun, Z., Huang, Y., Ouyang, W., Lan, C., Li, Z., & Li, L. (2025). The Interface of Additive Manufactured Tungsten–Diamond Composites. Materials, 18(11), 2574. https://doi.org/10.3390/ma18112574