

Meso-Structural Modeling of Asphalt Mixtures Using Computed Tomography and Discrete Element Method with Indirect Tensile Testing


Abstract
1. Introduction
2. Materials and Specimen Preparation
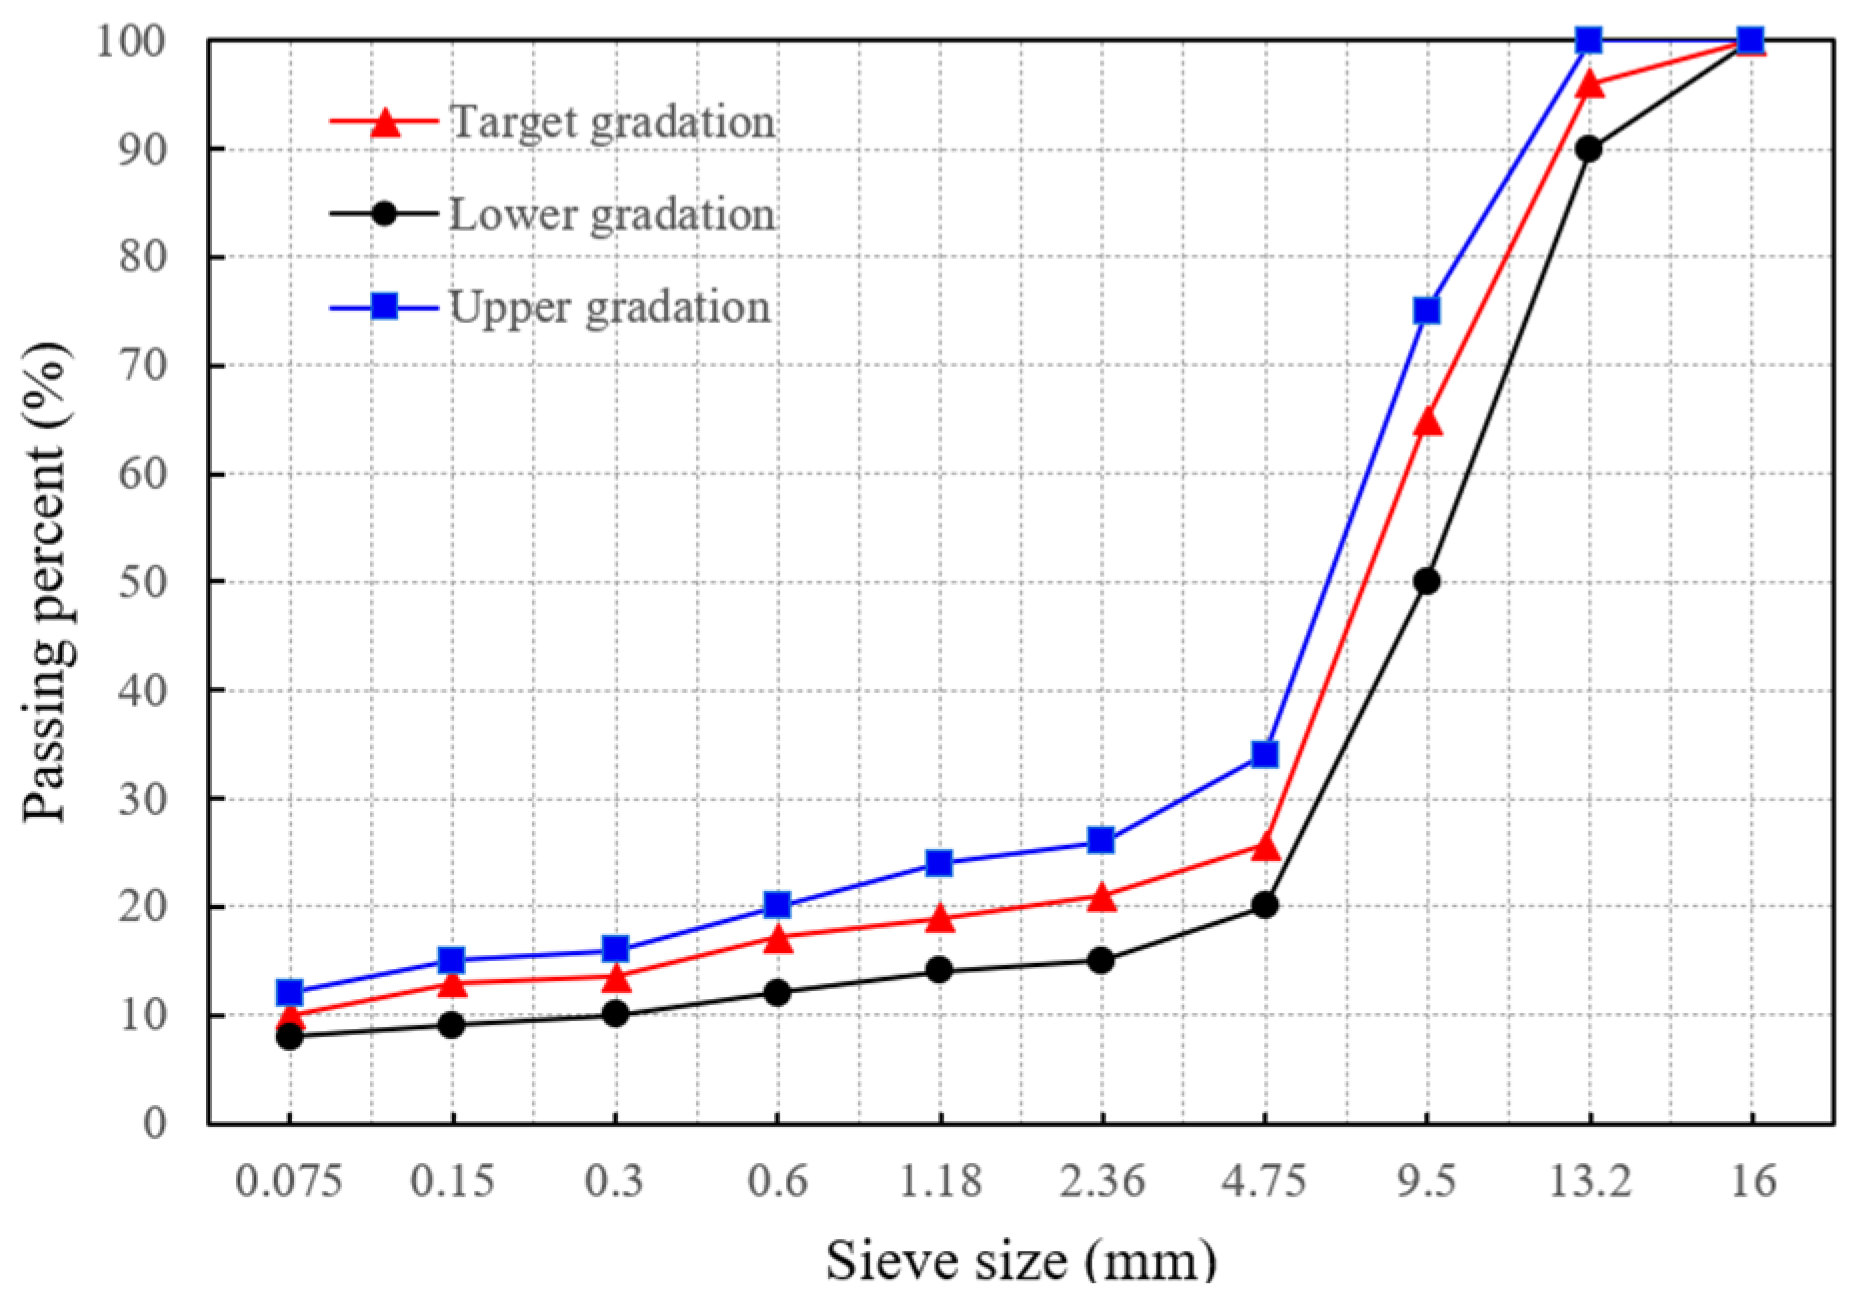
2.1. Materials
2.2. Preparation of Indirect Tensile Test Specimens
3. Test Methods
3.1. Indirect Tensile Test
3.2. X-Ray CT Scanning
4. Meso-Structural Modeling Based on CT-DEM
4.1. Meso-Structure-Incorporating Geometric Modeling
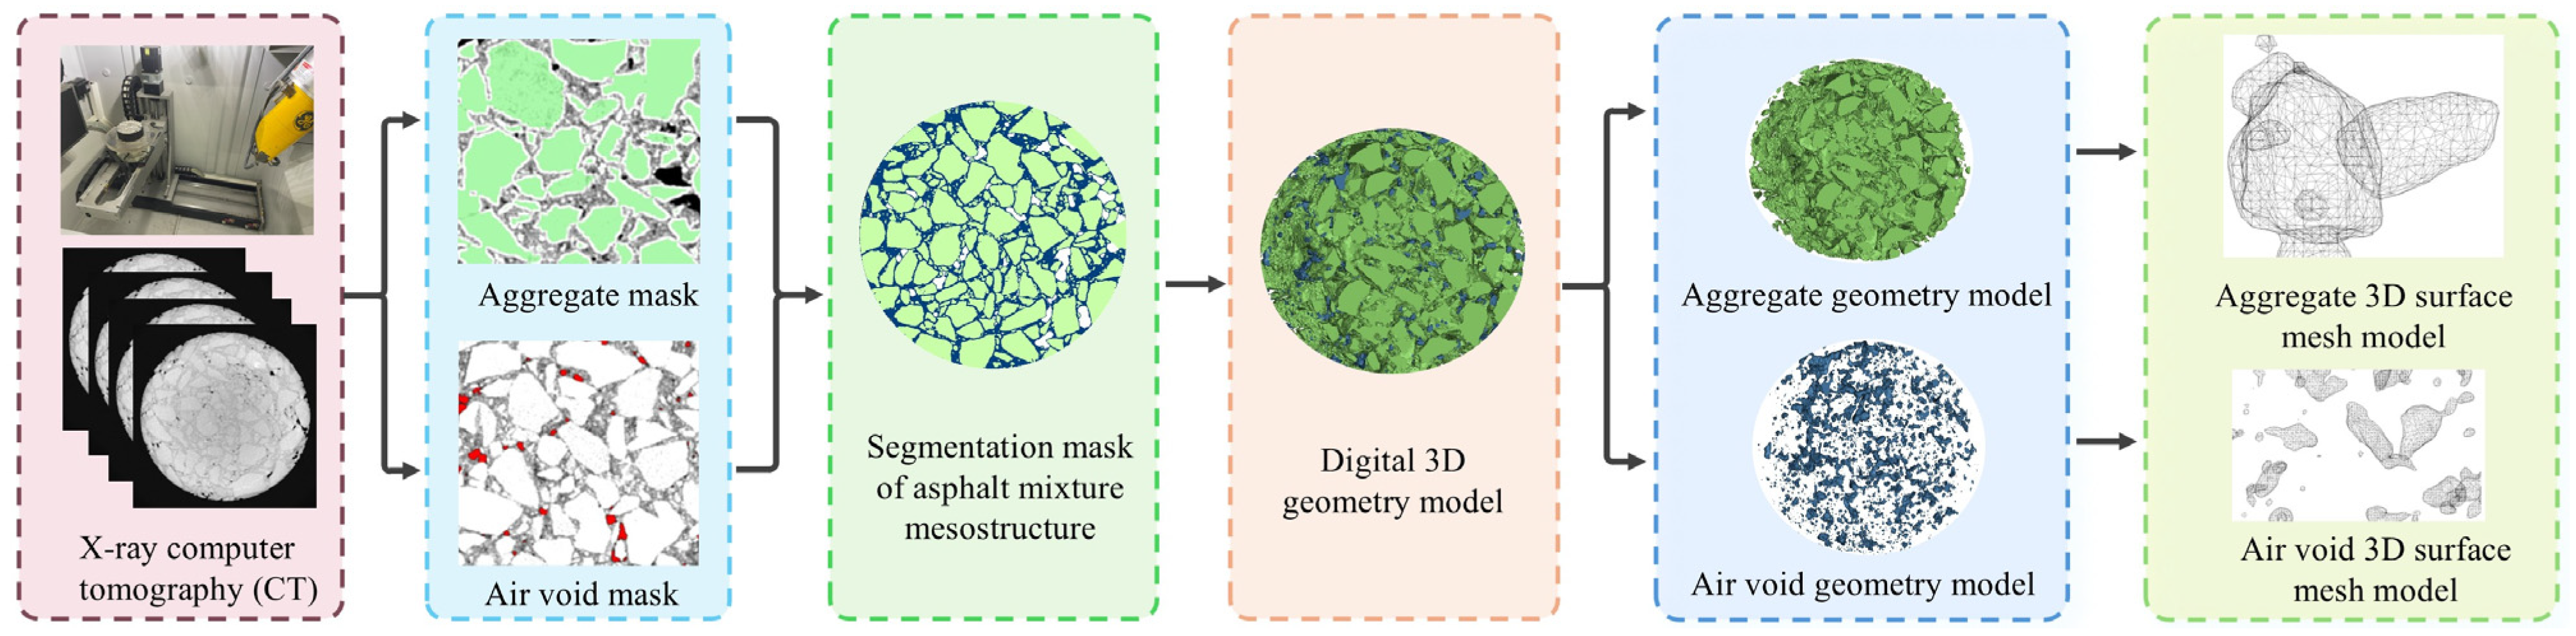
- Two-dimensional tomography. X-ray CT scanning was performed on the asphalt mixture specimen to obtain 2D cross-sectional images of its internal structure;
- Generation of 2D aggregate and void masks. The 2D compositional structure of aggregates and voids was extracted from CT images using digital image processing techniques based on adaptive thresholding and morphological operations. Separate masks were generated for each phase;
- Generation of 2D masks for aggregates, voids, and asphalt mortar. Boolean operations were employed to derive the asphalt mortar mask, resulting in complete 2D masks of the three components: aggregates, voids, and asphalt mortar. This study focused on aggregates larger than 2.36 mm, while smaller aggregates, including mineral fillers and asphalt, were incorporated into the asphalt mortar phase. Voids with diameters less than 0.6 mm were excluded from the analysis;
- Generation of 3D geometric model. The processed 2D masks of aggregates, asphalt mortar, and voids were converted into a 3D geometric model using 3D reconstruction technology;
- Generation of 3D surface mesh. The 3D geometric model was converted into a DXF-format 3D surface mesh model at a 1:1 scale, followed by verification of the surface mesh’s integrity.
4.2. Meso-Structure Incorporated Physical Modeling
- Generation of discrete element segmentation domain (DESD). The DESD was generated based on the dimensional parameters of the digitized asphalt mixture model. Within the boundaries of the asphalt mixture model, spherical discrete elements with diameters ranging from 0.6 to 0.8 mm were randomly distributed to establish the DESD;
- Importation of digitized 3D surface mesh model into DESD. The digitized 3D surface meshes of aggregates and voids were imported into the discrete element segmentation domain through nodal coordinate matching, ensuring spatial alignment with the geometric model;
- Segmentation. The DESD was partitioned based on the 3D surface mesh models of aggregates and voids, resulting in discrete element assemblies (DEAs) for the aggregate and void phases. The asphalt mortar’s DEA was then derived using Boolean operations;
- Contact model. The linear parallel-bond model was applied to simulate intra-phase interactions within the DEAs of the aggregates and asphalt mortar, as well as inter-phase interactions between aggregate and asphalt mortar DEAs;
- Discrete element assembly of voids. The voids’ DEAs were removed to achieve a realistic void structure simulation.
5. CT-DEM Numerical Modeling Based on IDT Test
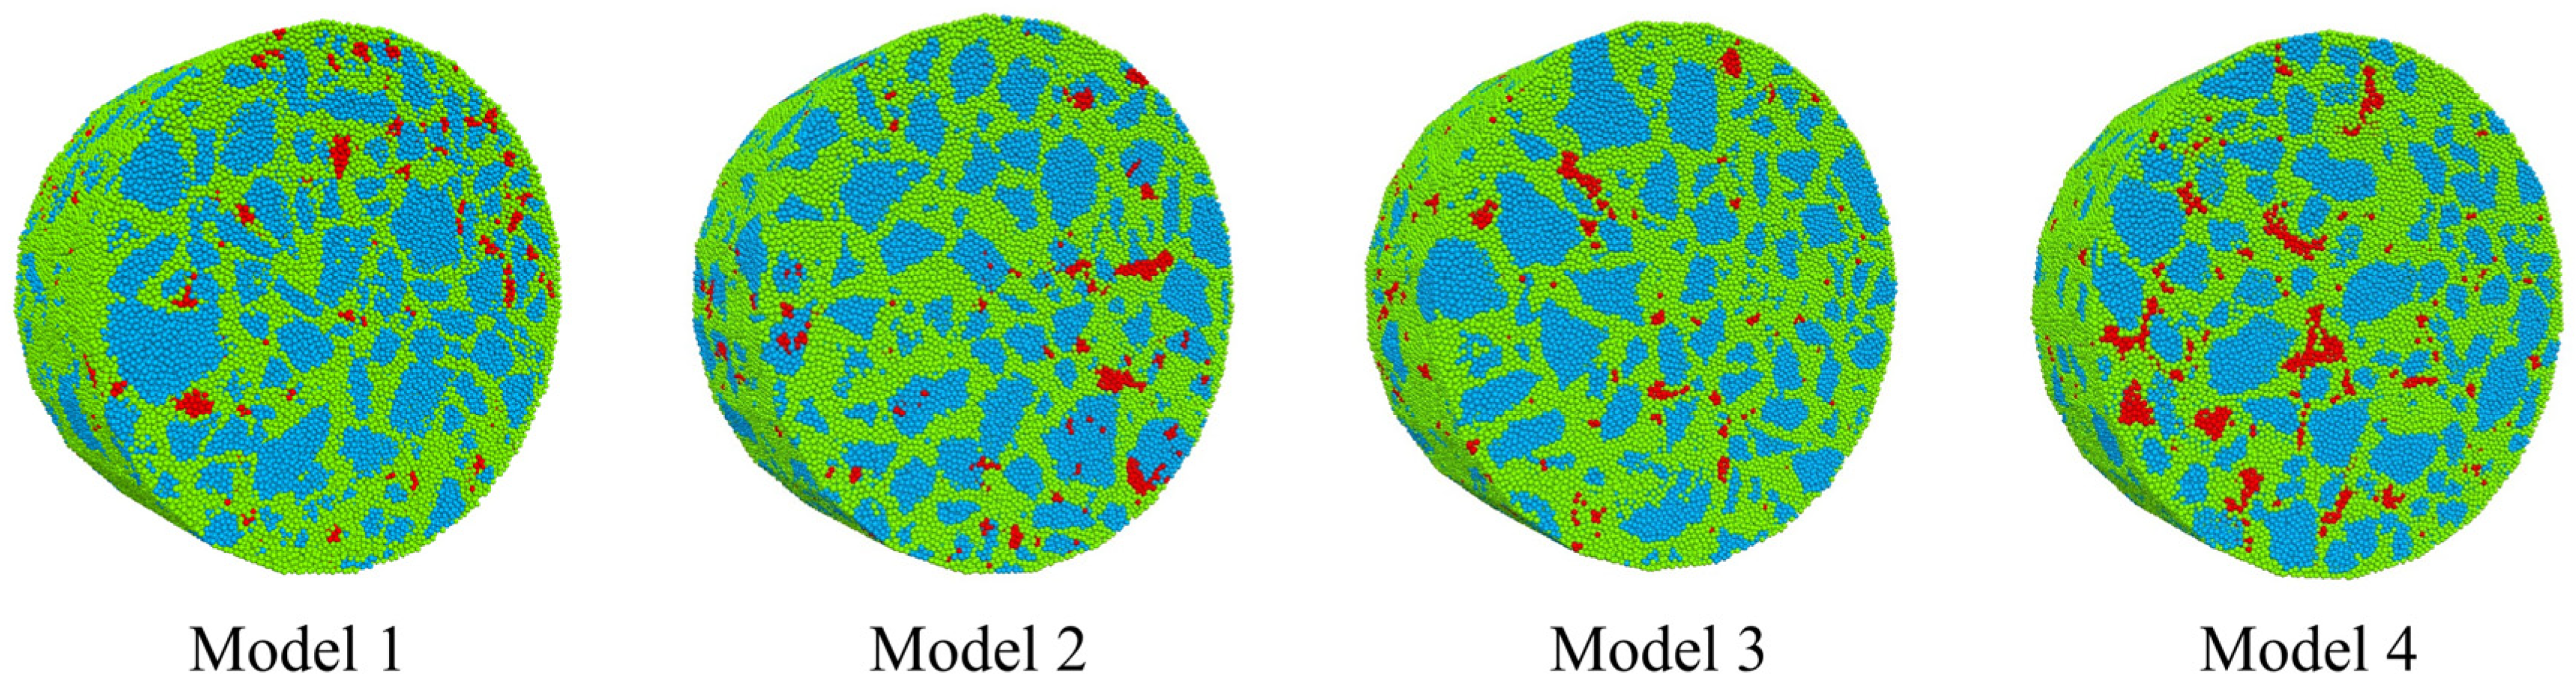
5.1. Model Establishment
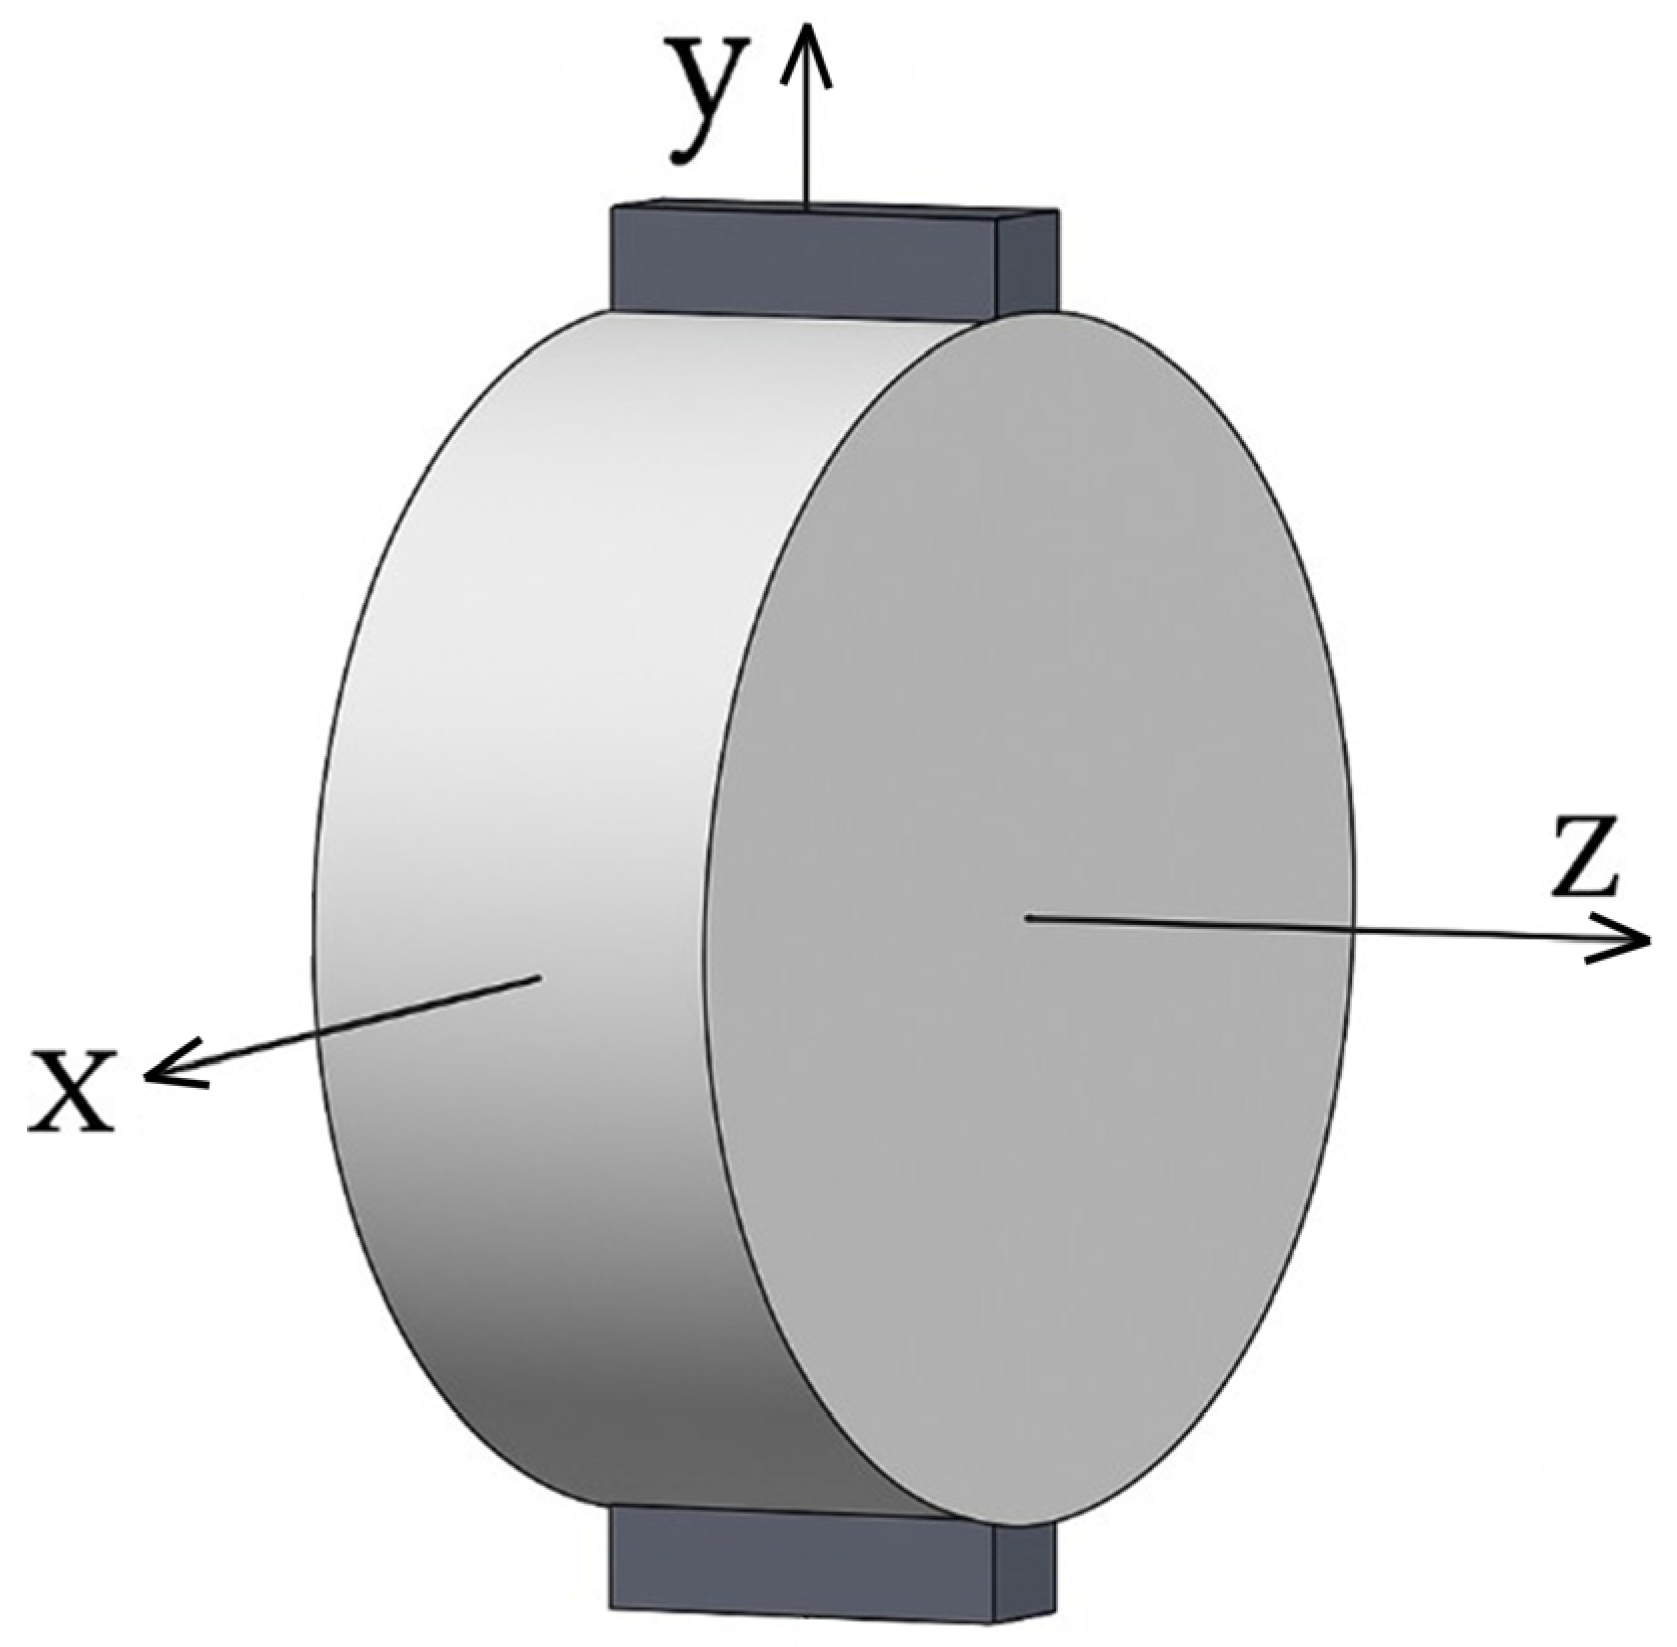
5.2. Boundary Conditions
5.3. Contact Model Parameters
6. Model Validation
7. Analysis and Discussions
7.1. Multi-Scale Internal Force Analysis
7.1.1. Internal Force Response Path
7.1.2. Mesoscopic Internal Forces
7.2. Fracture Propagation Process
7.3. Meso-Crack Propagation Behavior
8. Summary and Conclusions
- The IDT specimens contain two distinct force chain systems: vertically oriented chains resisting compression forces and horizontally oriented chains resisting tension forces. These force chains exhibit distinct correlations in quantity and morphology. With increasing displacement and the specimen’s fracture, the horizontal force chains rupture, while the vertical force chains develop an increased curvature, reducing their vertical deformation resistance. Concurrently, the increase in the number of horizontal force chains accelerates the specimen’s fracture;
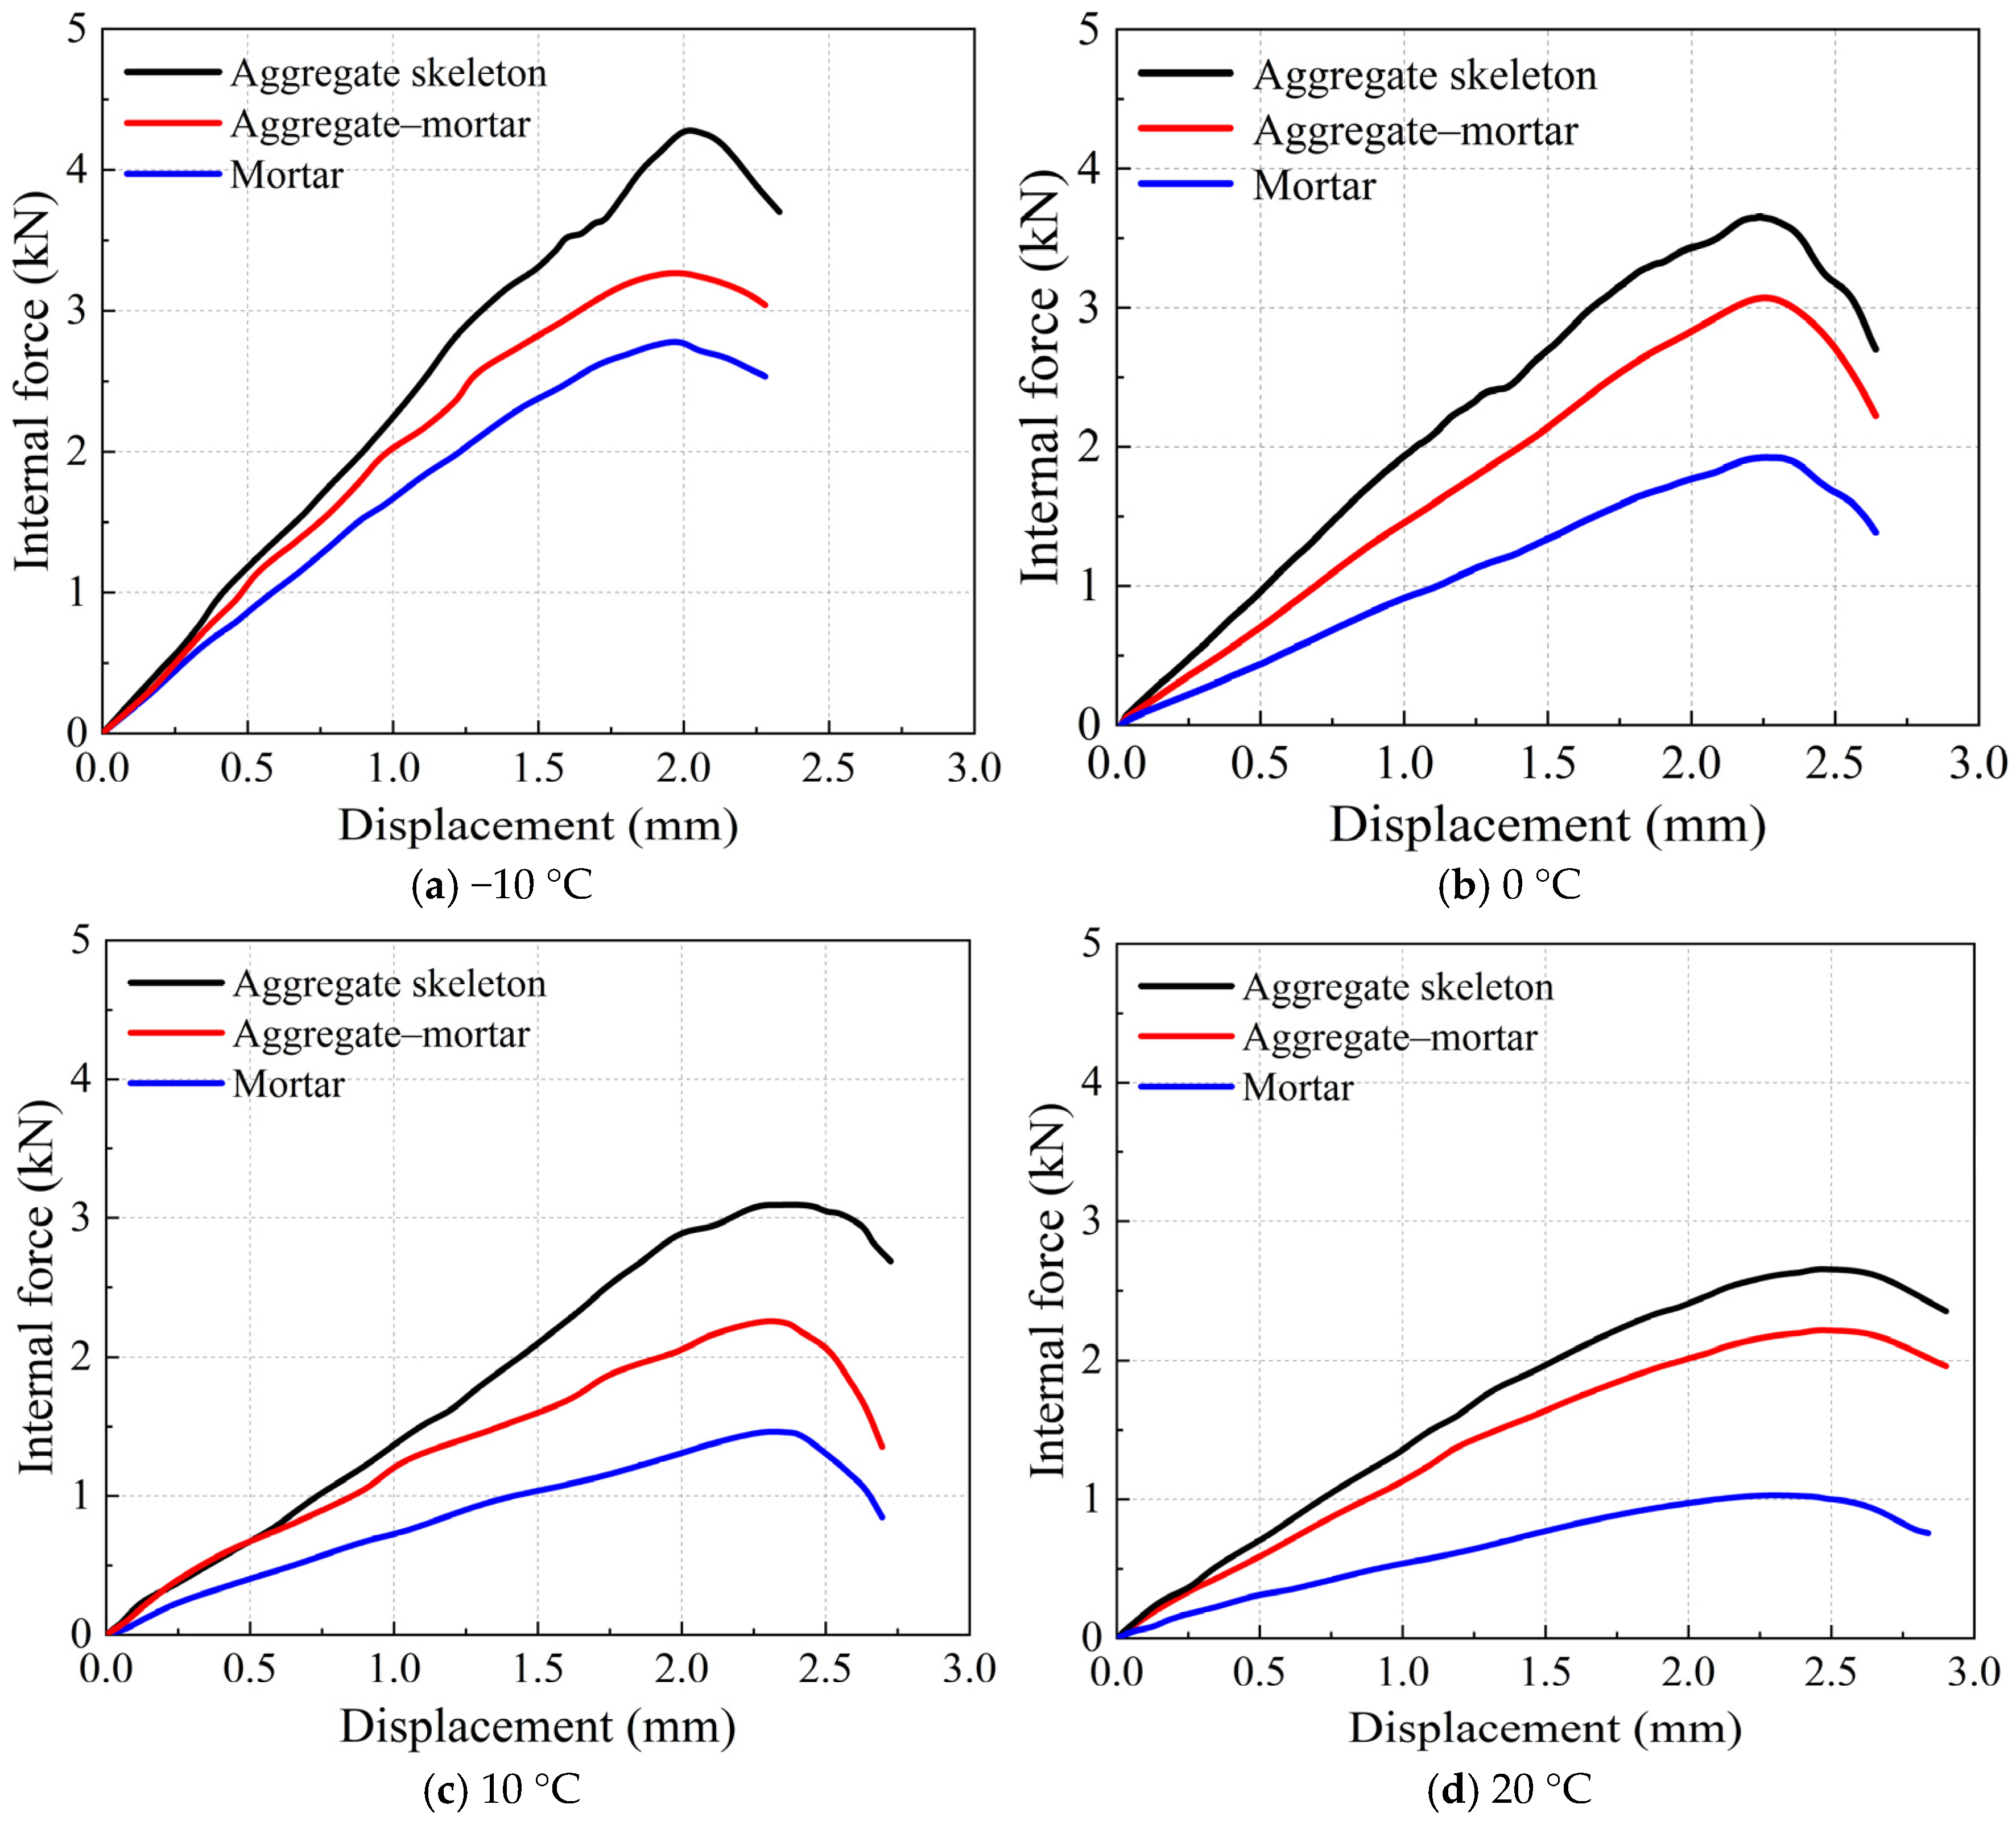
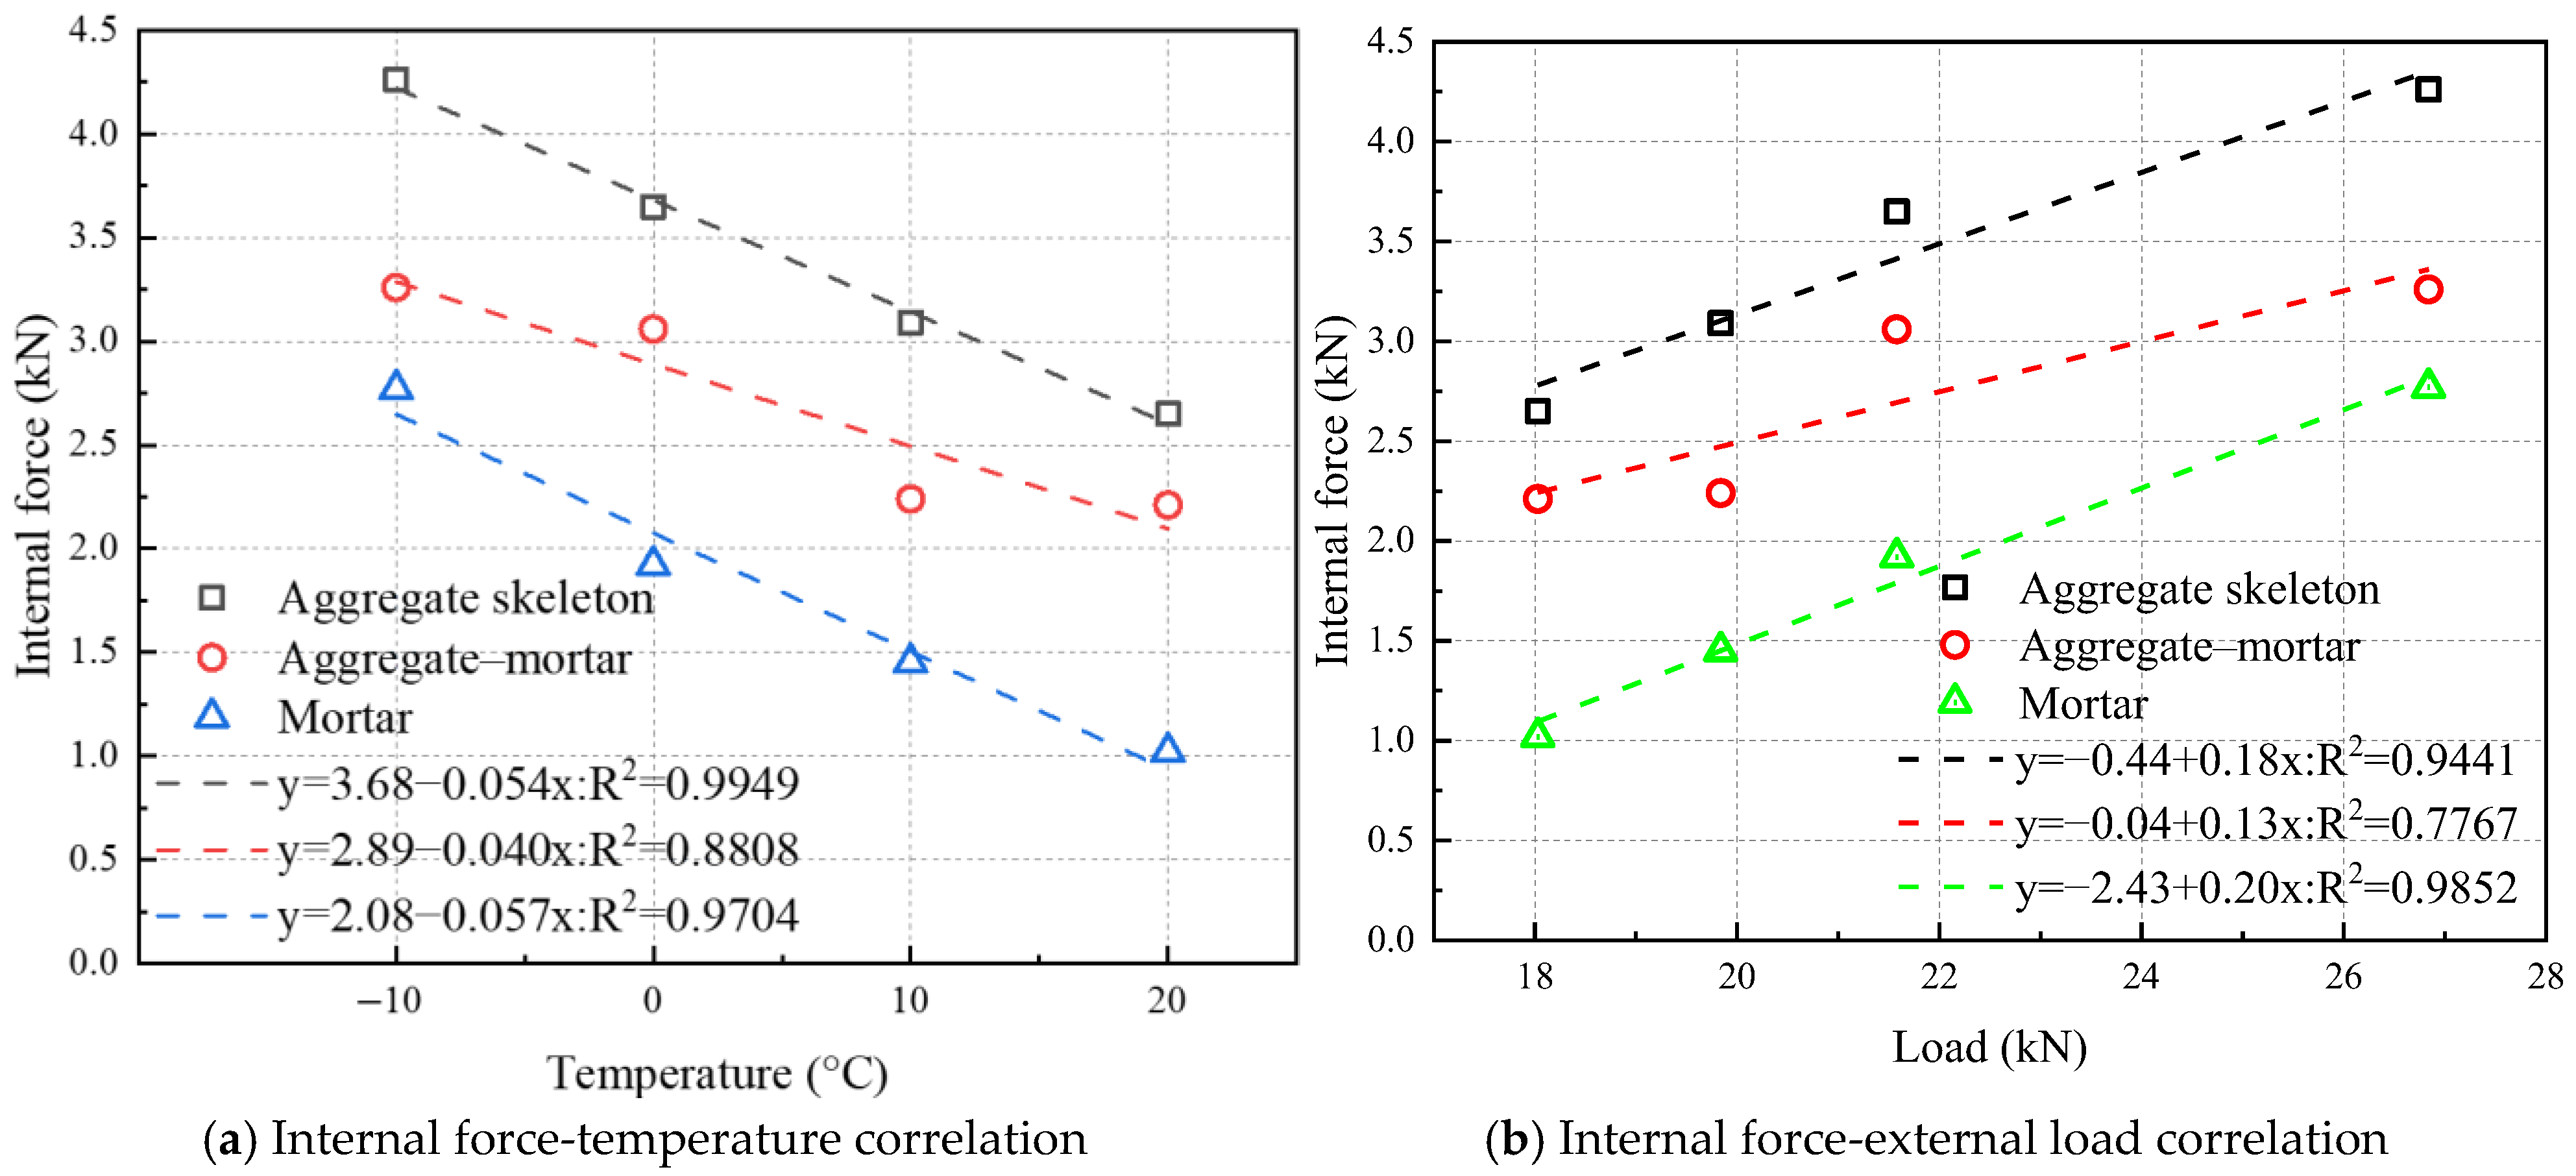
- During IDT numerical simulations, the aggregate skeleton sustains the highest internal forces, while the mortar carries minimal forces. The contact forces between mortar and aggregates maintain intermediate magnitudes. The aggregate skeleton serves as the primary load-bearing structure, with the aggregate–mortar interface as the secondary load-bearing structure. Both the internal forces within the aggregate skeleton and the mortar exhibit strong linear correlations with temperature, with the mortar showing a significantly higher temperature sensitivity. Additionally, the mortar’s internal forces maintain the most substantial linear relationship with externally applied loads;
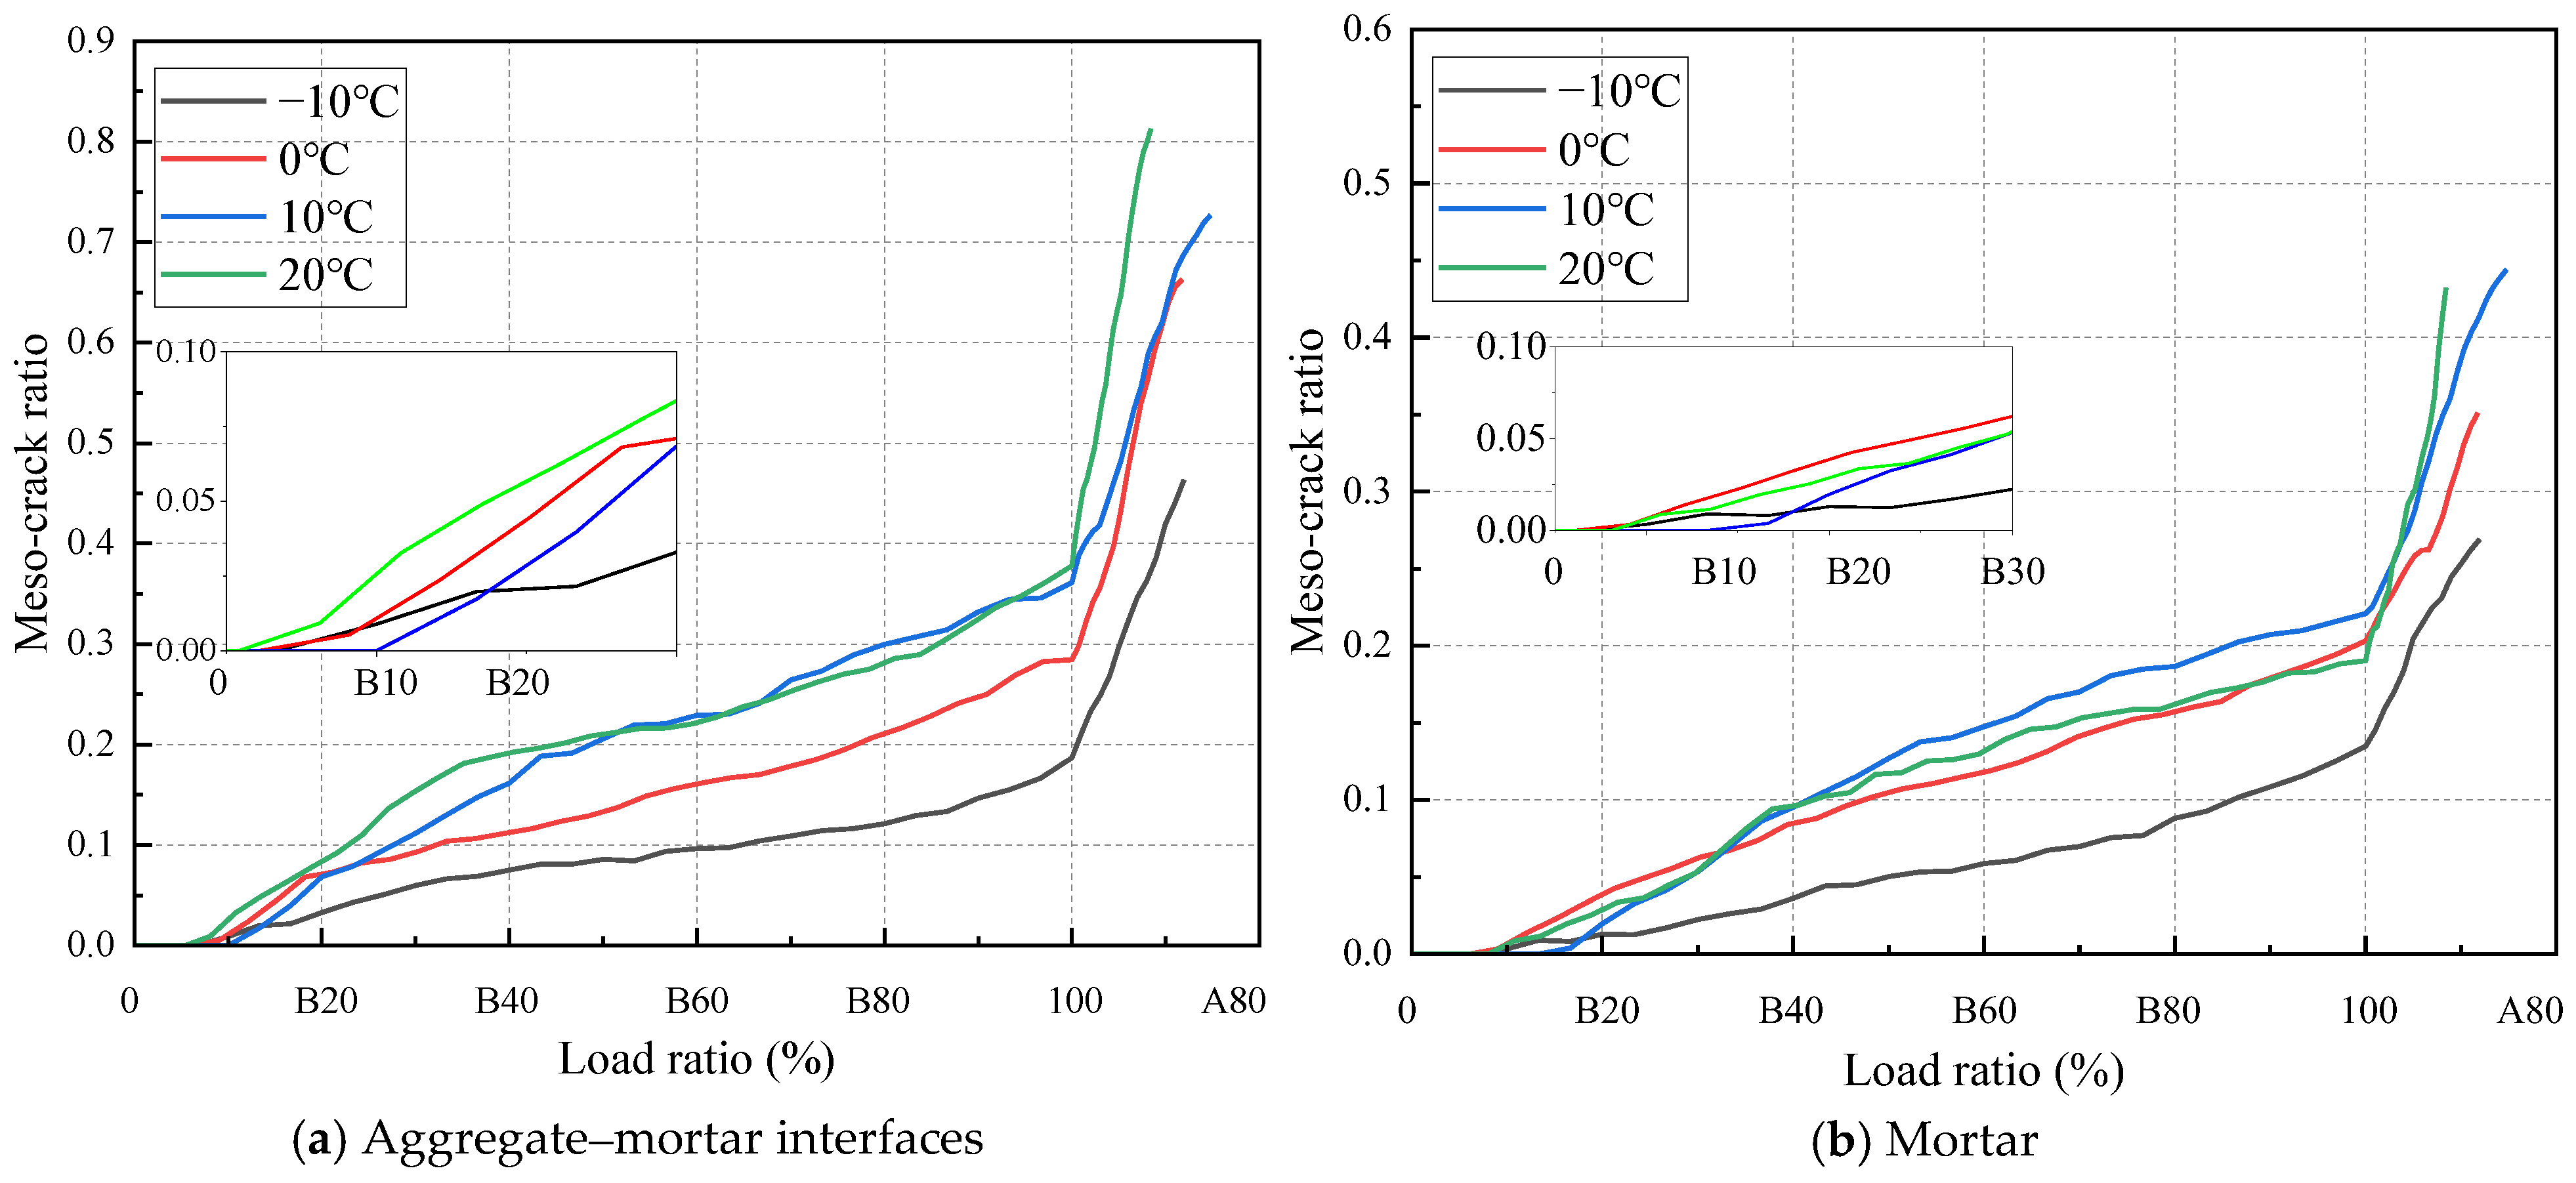
- The evolution of internal meso-cracks undergoes three characteristic phases: Phase I (0–10% of peak load) with no crack formation, Phase II (10–100% of peak load) exhibiting stable crack propagation, and Phase III (post-peak load) showing accelerated crack growth. The aggregate–mortar interface maintains consistently higher meso-crack quantities throughout these stages than the mortar;
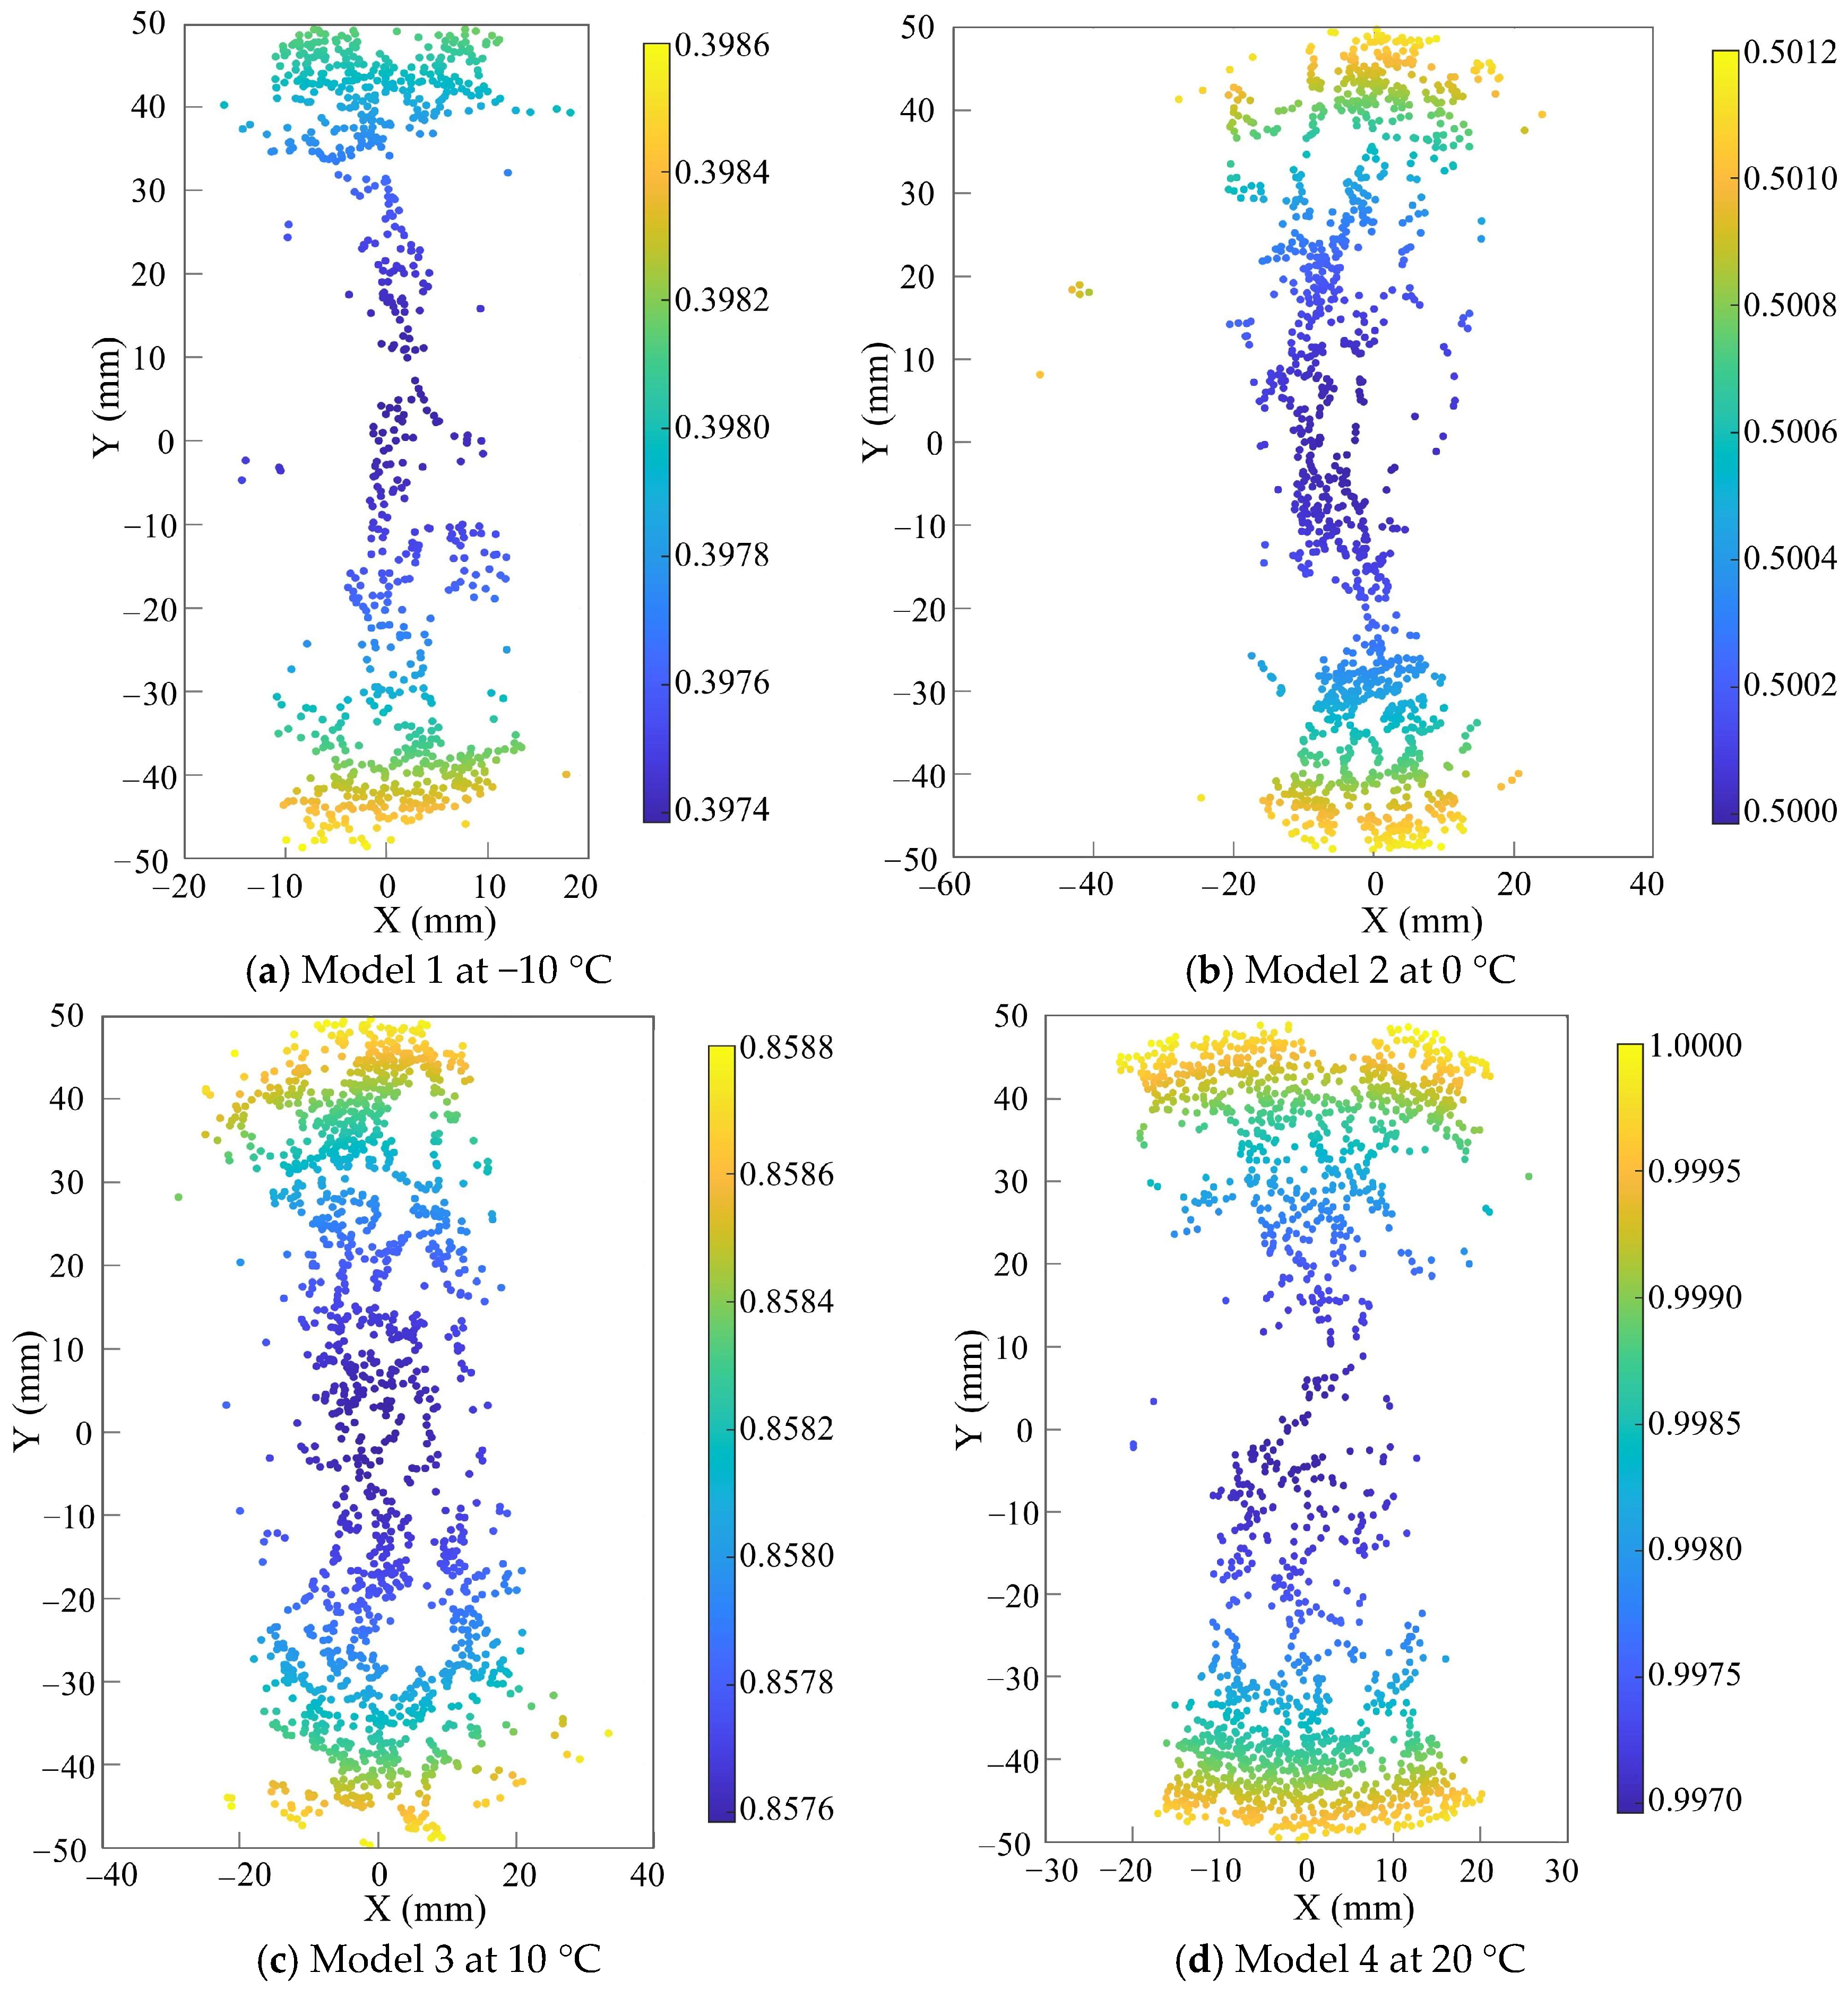
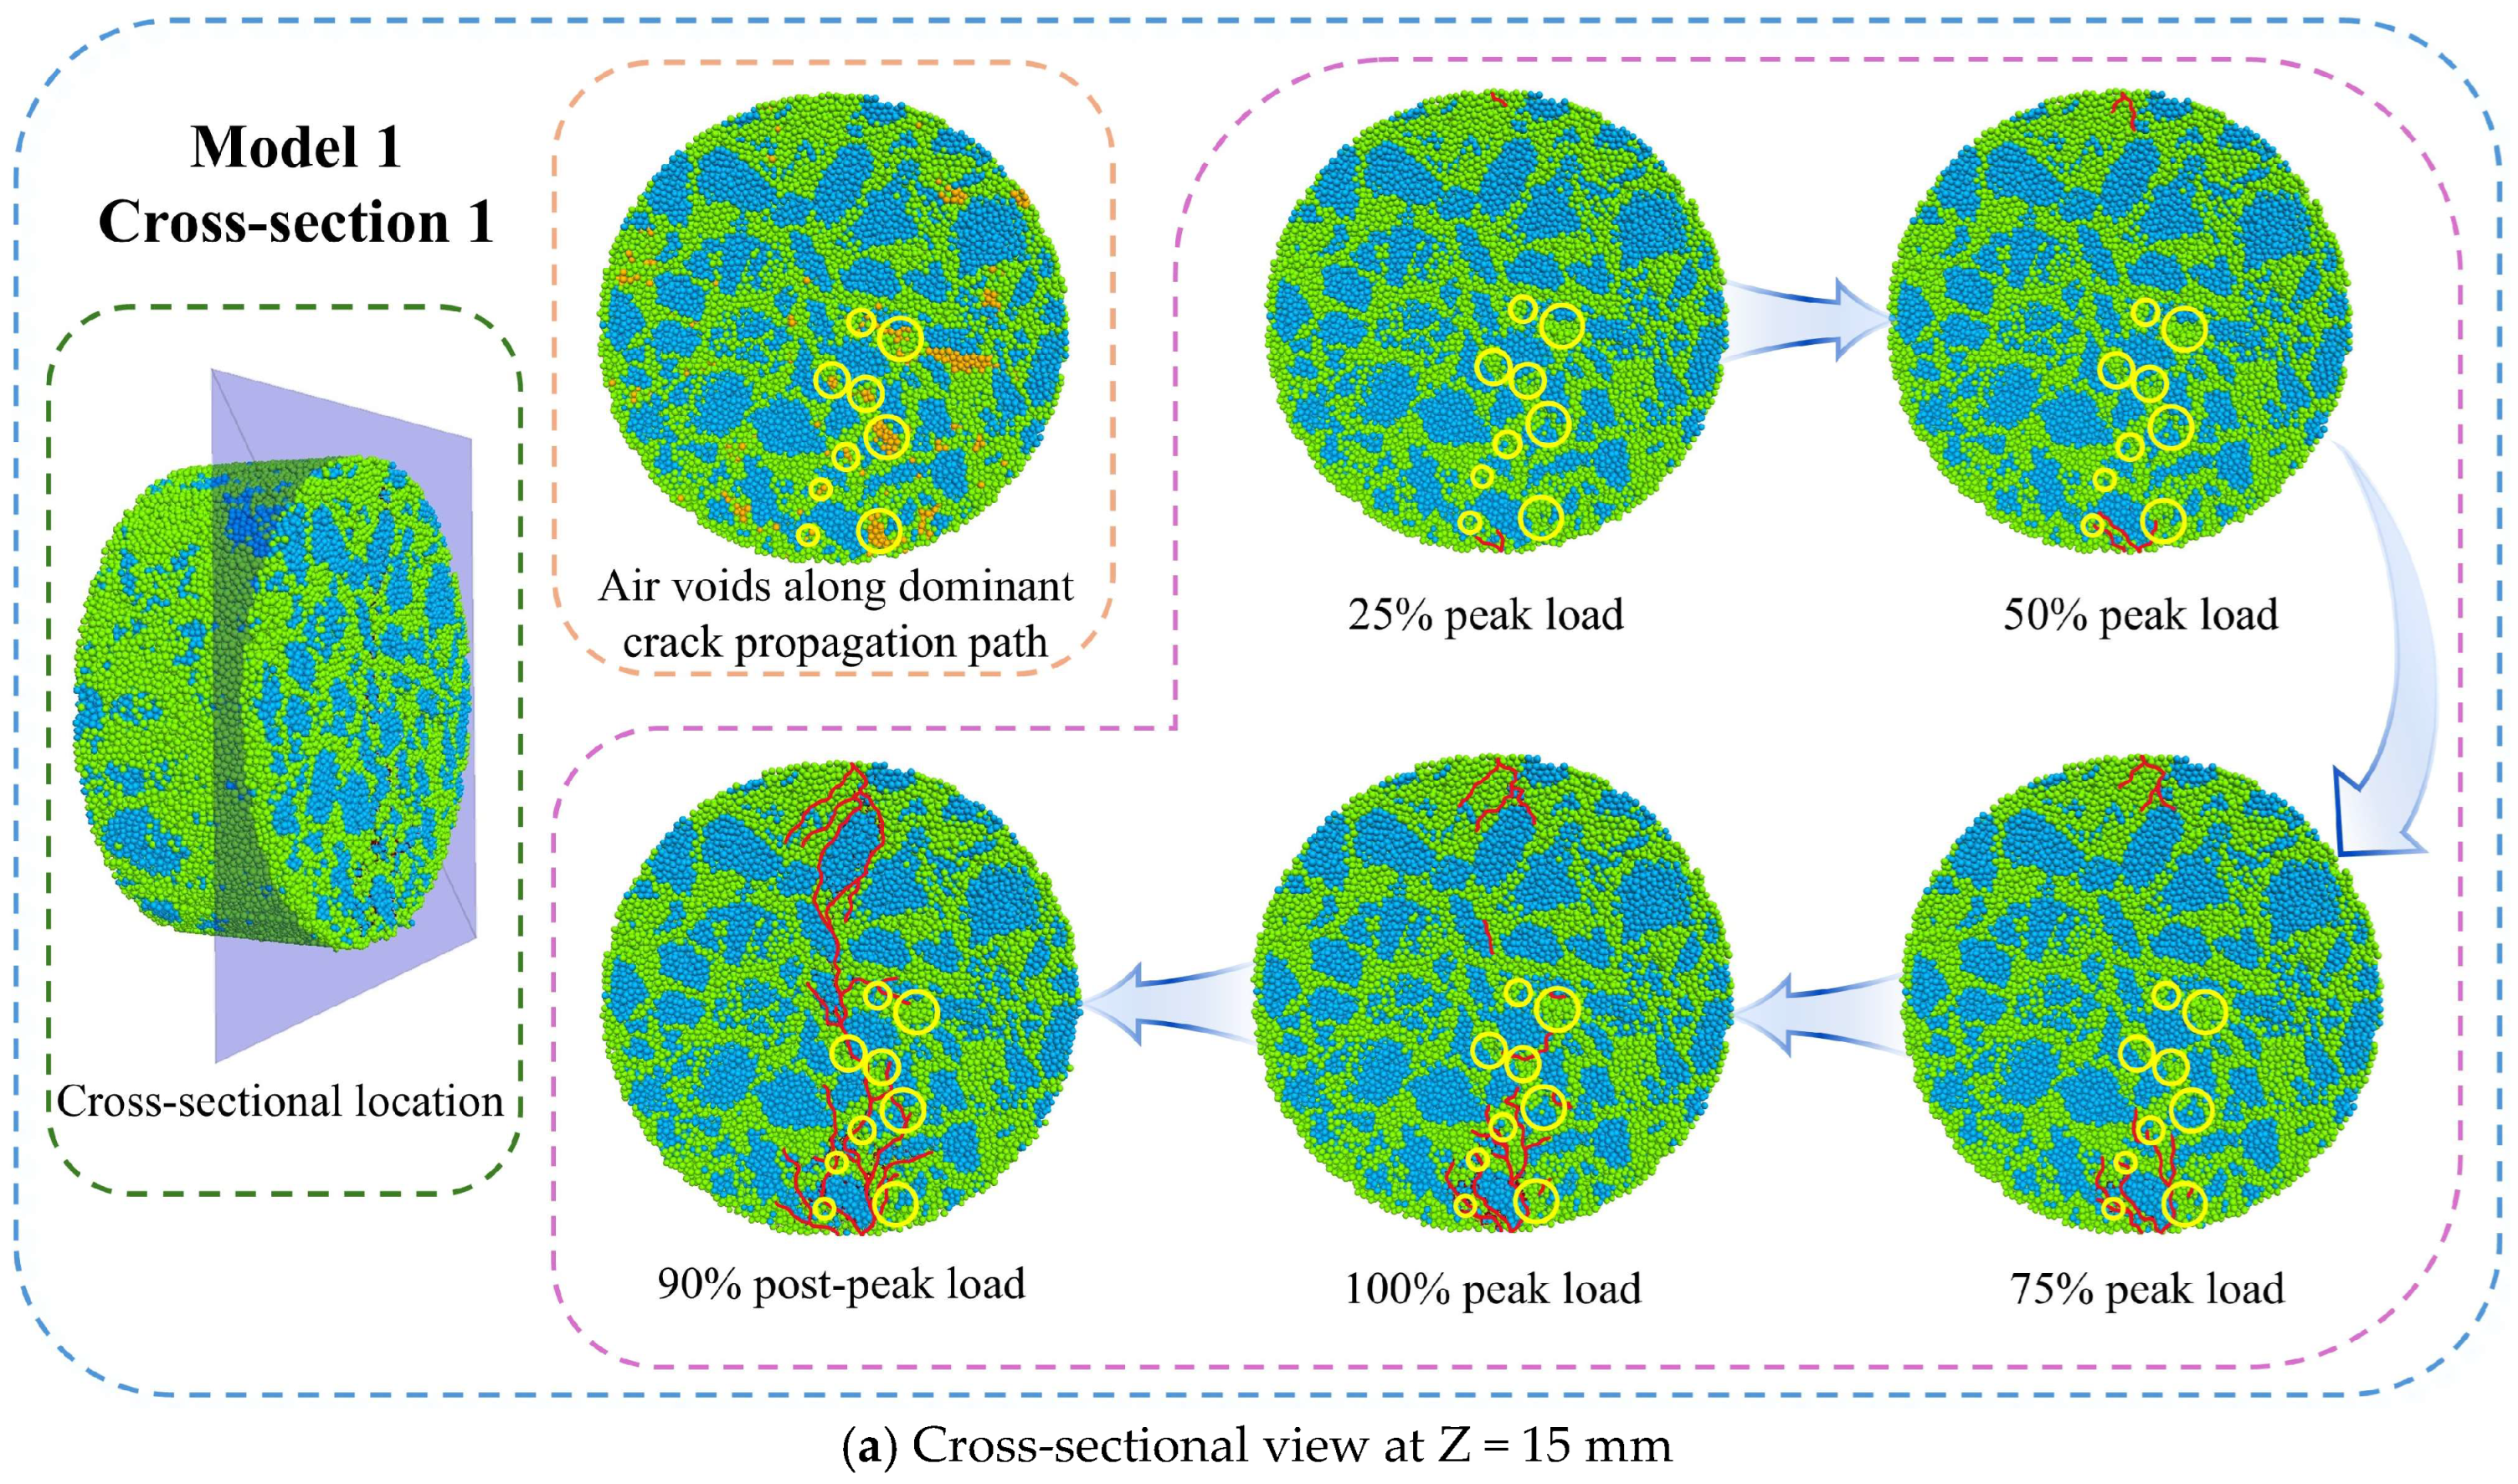
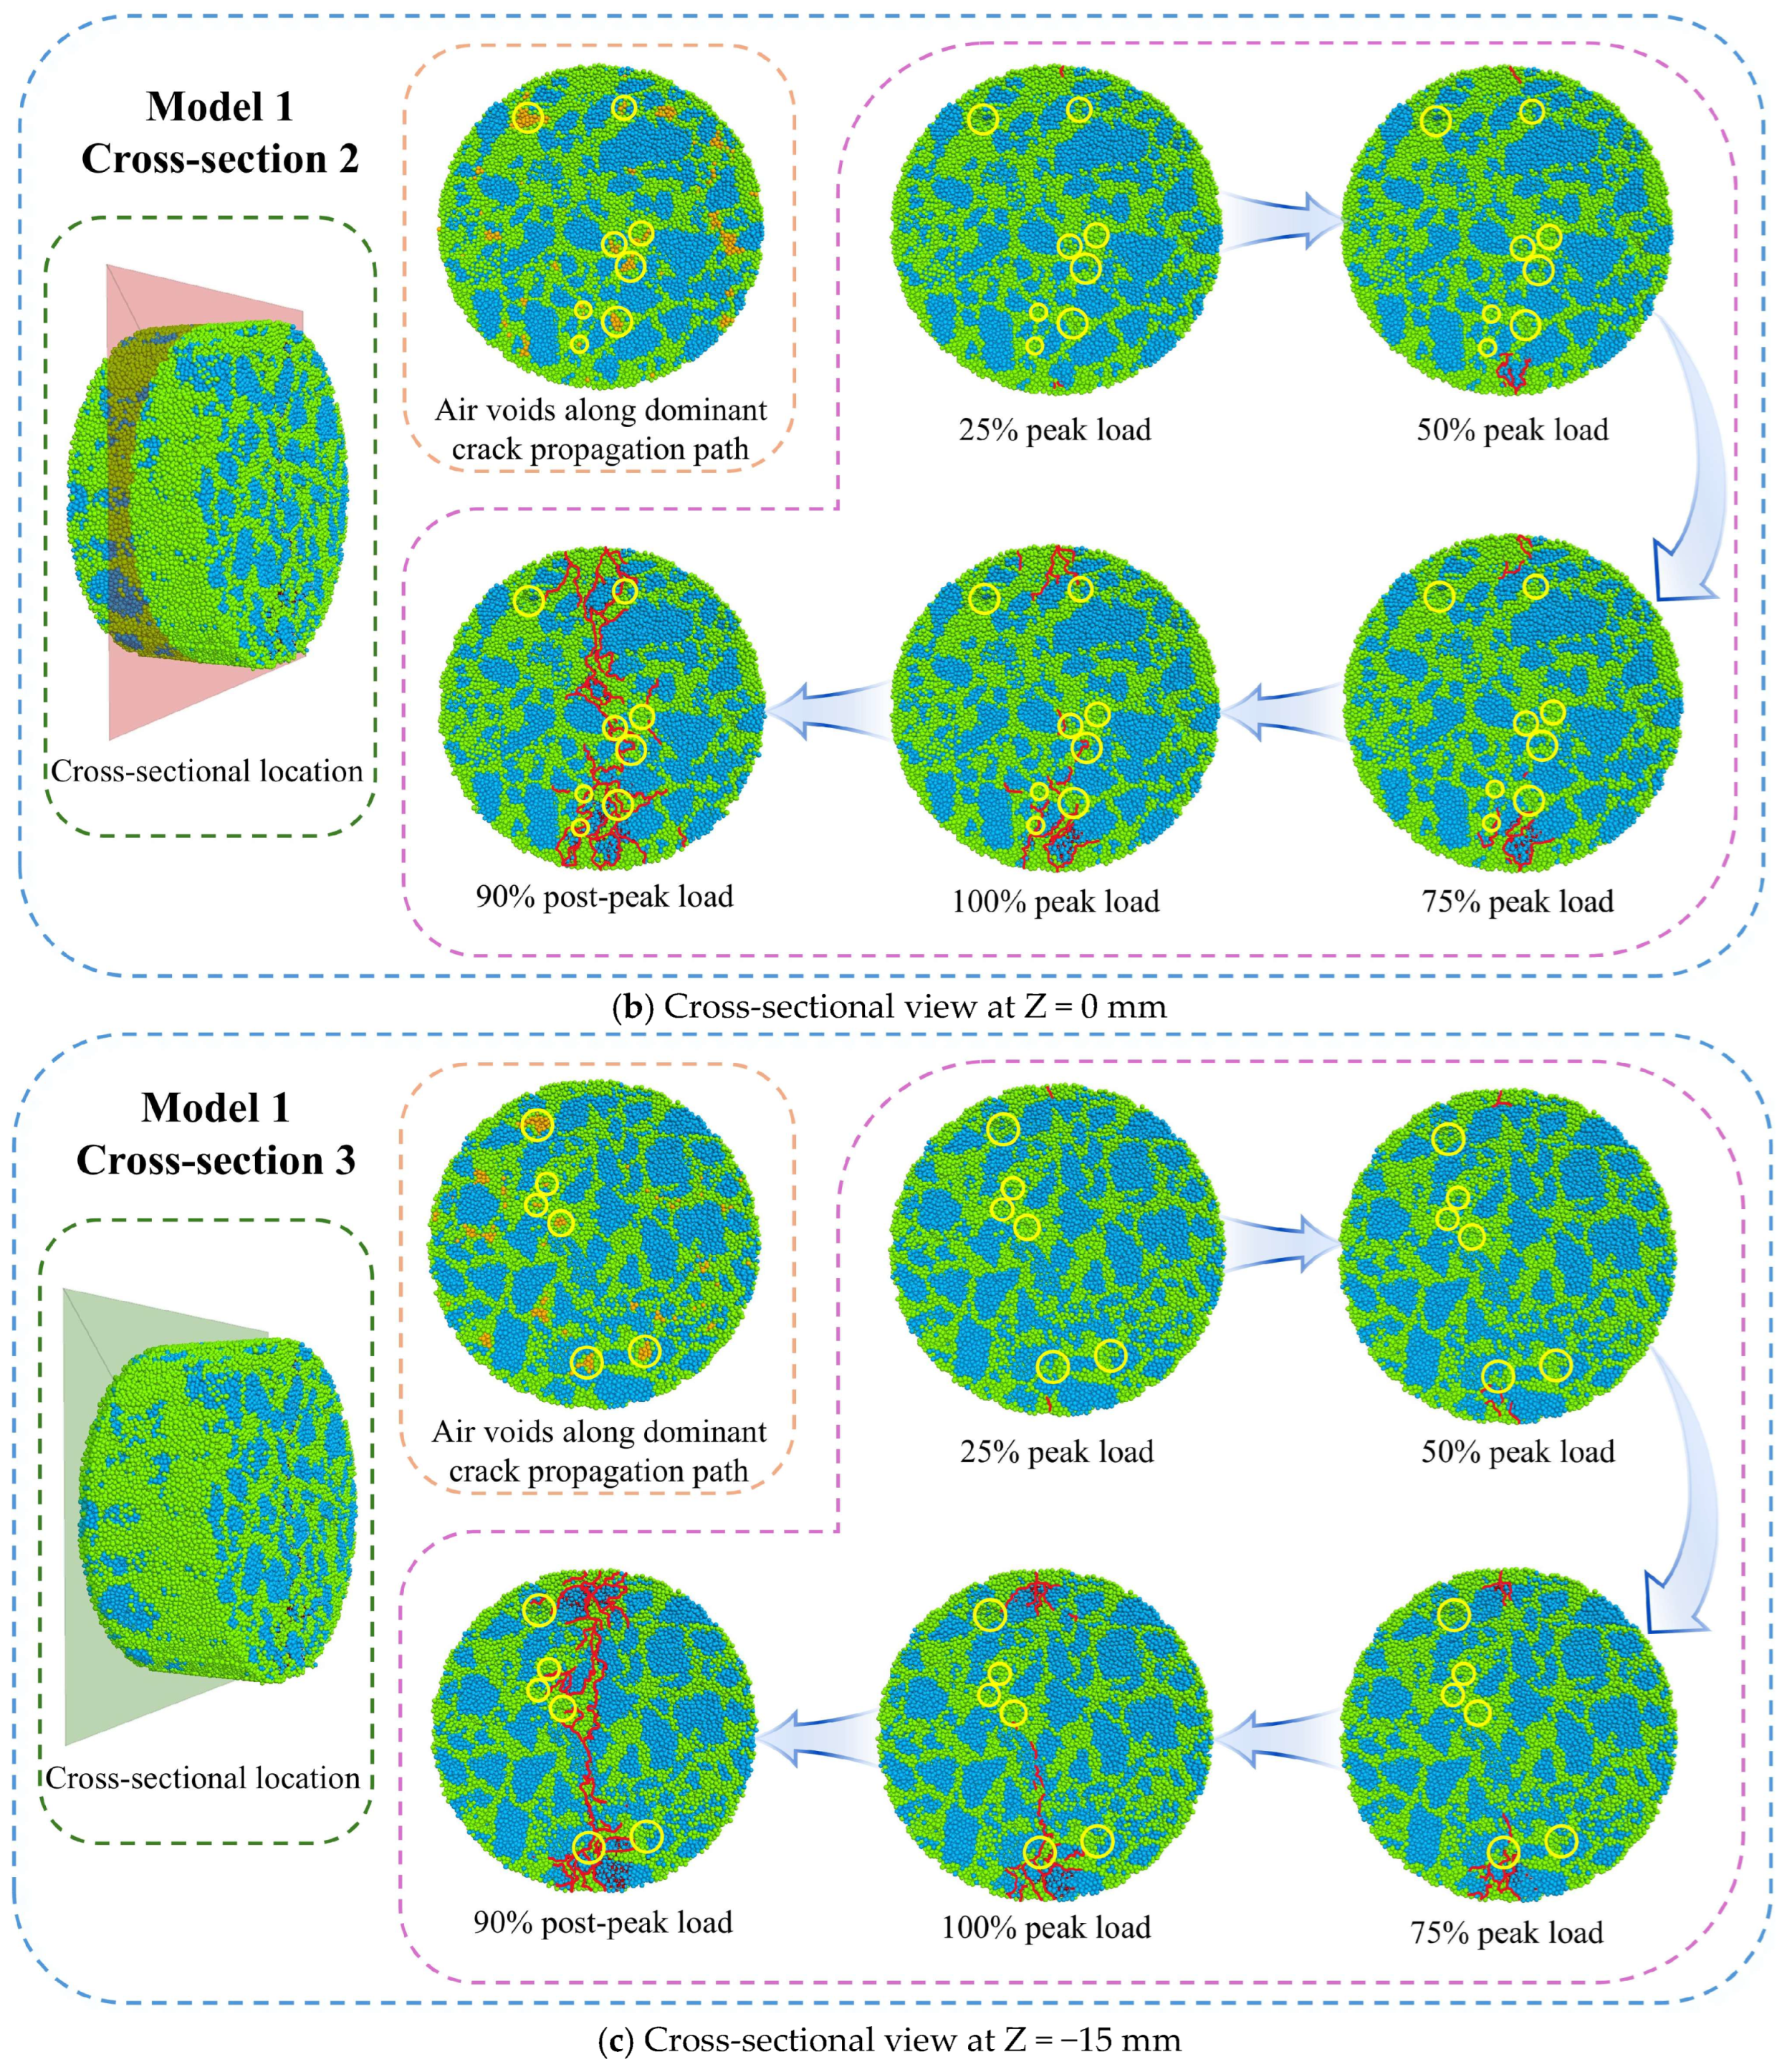
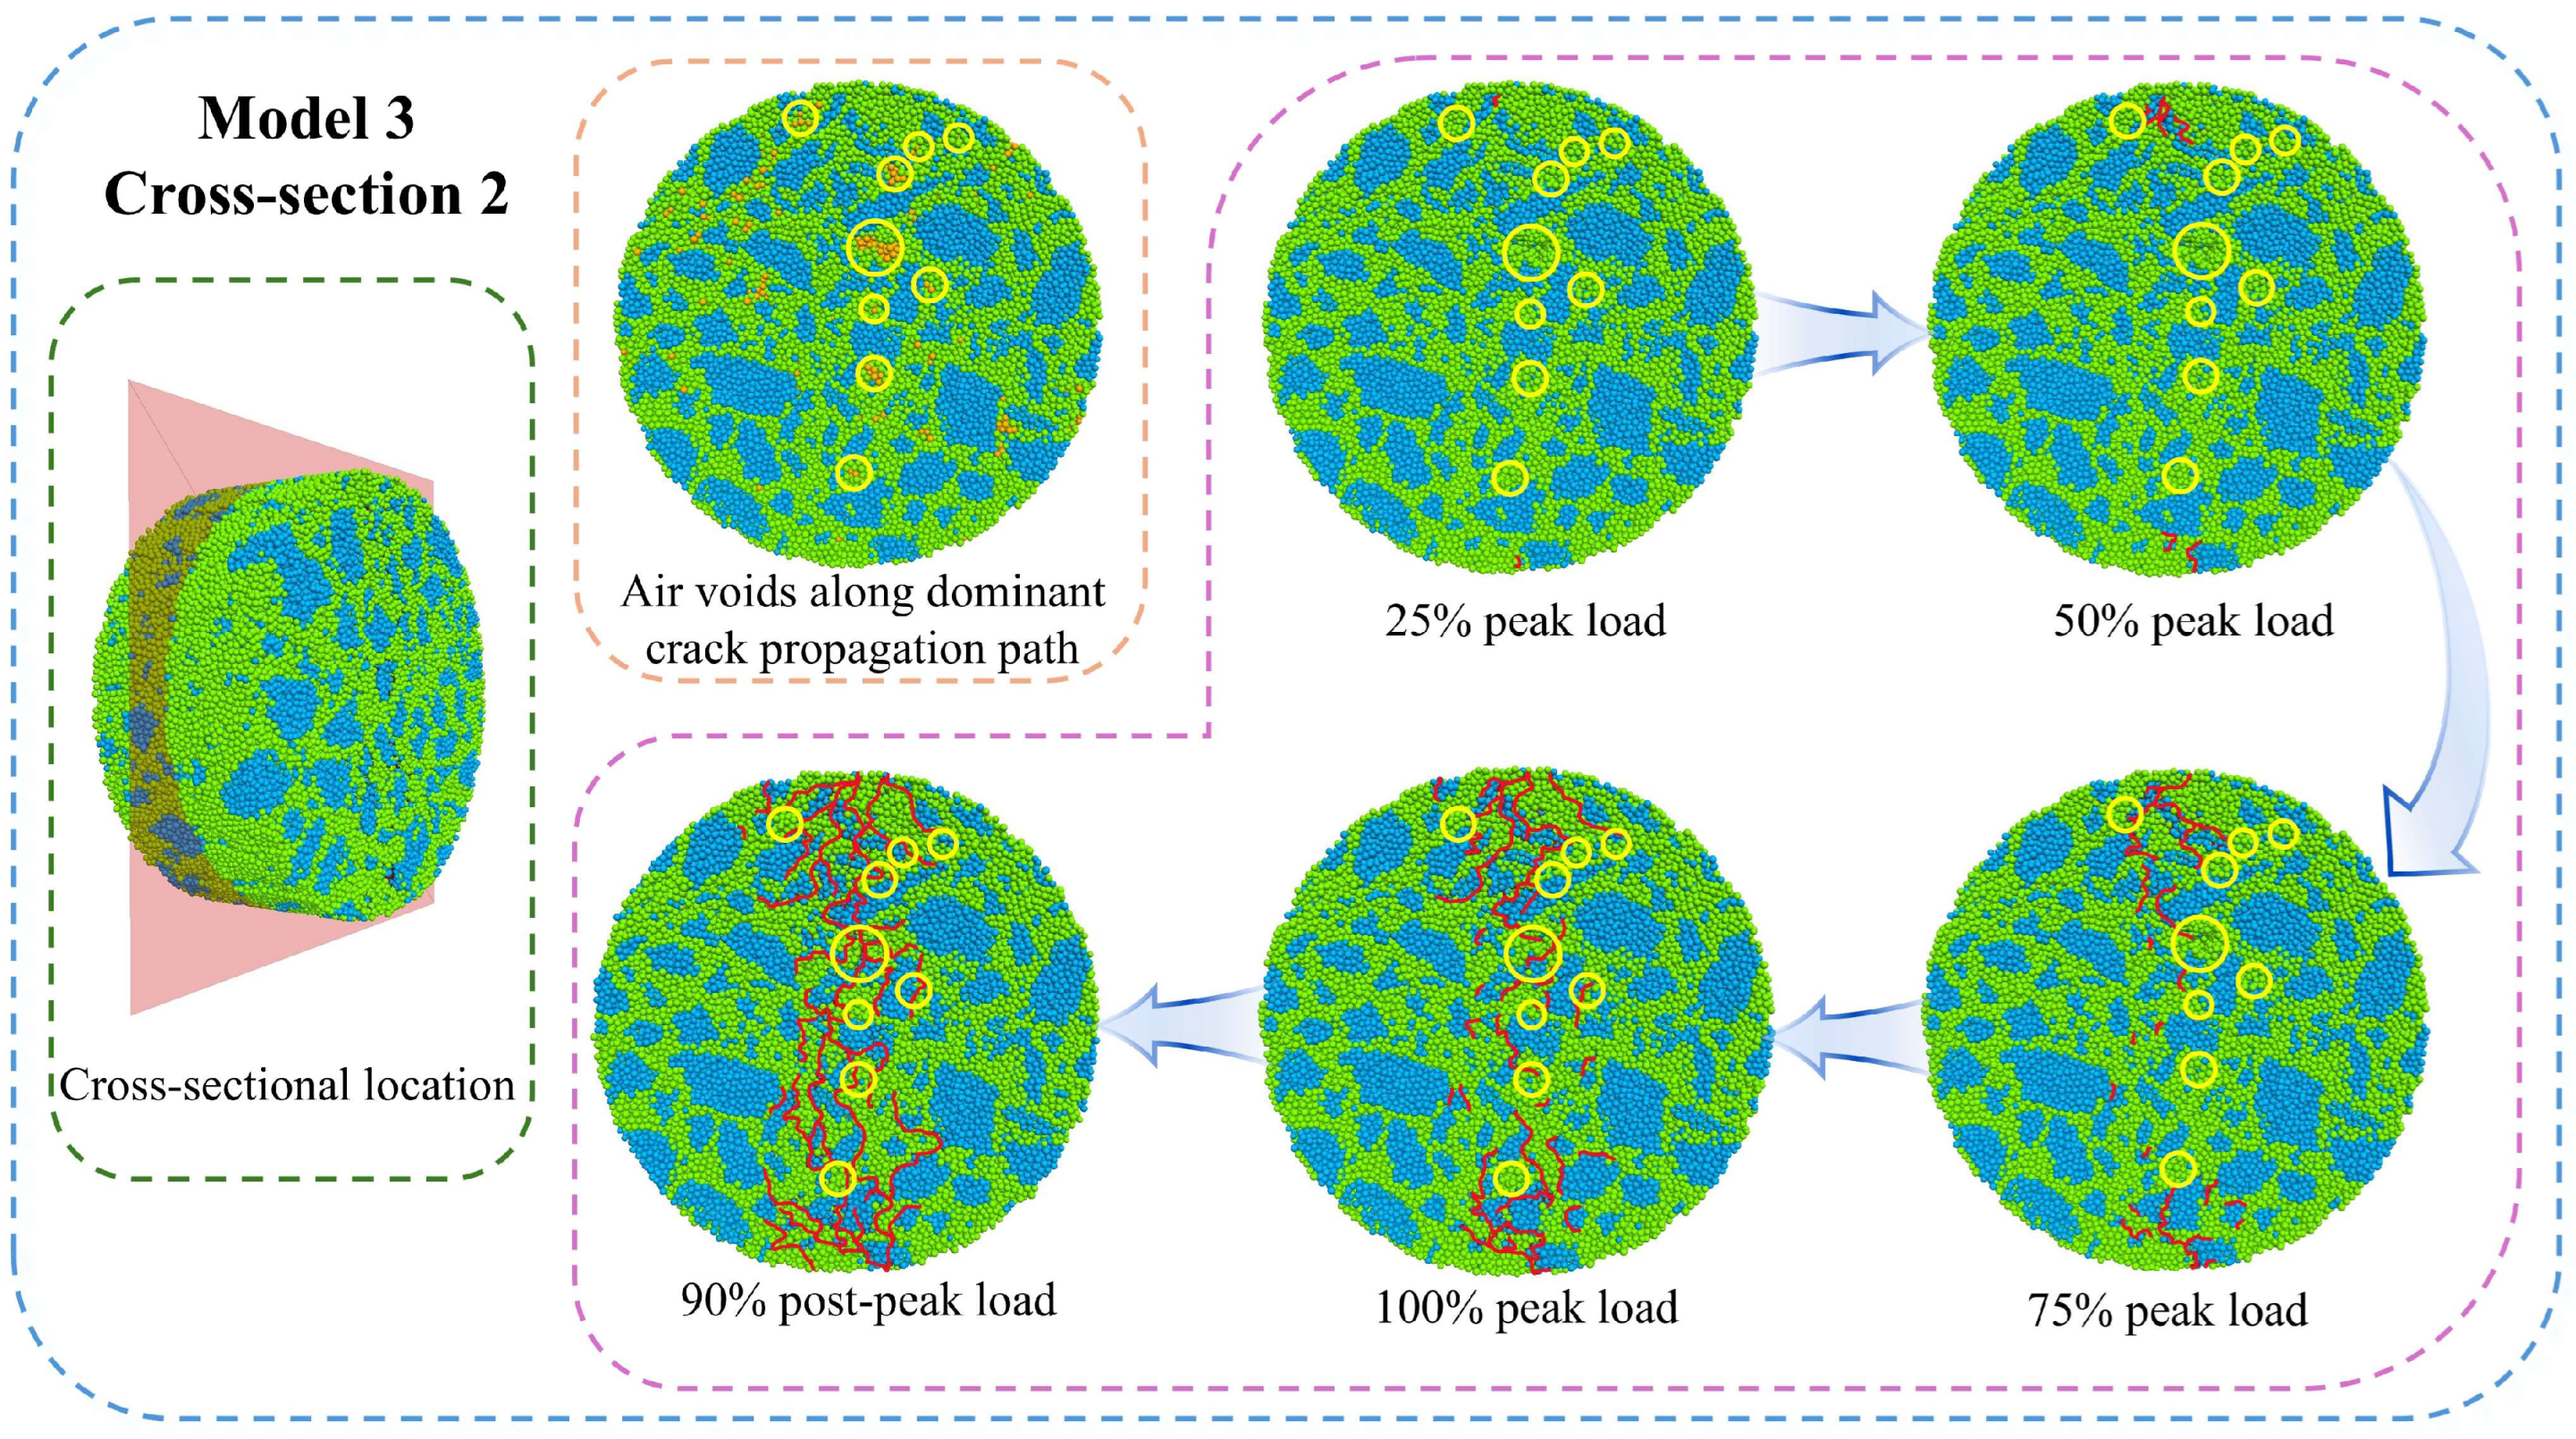
- In the IDT test, the crack-influencing zone is concentrated within a 20 mm radius from the specimen center. Meso-cracks initially form at both the upper and the lower platen contact points and progressively develop in the central region as loading continues, ultimately interconnecting to cause complete specimen failure. Meso-cracks preferentially originate at aggregate–mortar interfaces and void boundaries, with propagation primarily following interfacial paths adjacent to the main fracture trajectory;
- The initiation of meso-cracks in IDT tests correlates with the strength and deformation capacity of asphalt mixtures. Enhanced strength combined with an improved deformation capacity delays the initiation of meso-cracks. Furthermore, the aggregate–mortar interface plays a significant role in the fracture performance of asphalt mixtures. The aggregate–mortar interfacial zone should be prioritized as a key research focus for understanding and improving the crack resistance of asphalt mixtures.
9. Research Significance and Engineering Application Values
- From a theoretical perspective, this study presents a preliminary exploration of digital twin modeling for asphalt mixtures, in line with current research trends. It also expands the theoretical foundation and broadens the scope of digital twin modeling applications in asphalt mixtures;
- In terms of engineering applications, the simulation method proposed in this study enables the rapid evaluation of asphalt mixture’s performance, reducing reliance on experimental testing in materials’ design and performance assessment. Moreover, it provides practical guidance for improving the crack resistance of asphalt mixtures.
10. Limitations and Future Research Directions
- The aggregate–mortar interface was modeled solely through contact mechanics, without considering the actual interfacial thickness. Future research should consider the interfacial thickness in multiscale simulation analyses;
- Aggregates smaller than 2.36 mm, along with mineral filler and asphalt, were collectively treated as asphalt mortar, and voids smaller than 0.6 mm in diameter were neglected. The current constitutive model does not incorporate the microscale structure, elemental composition, or viscoelastic characteristics of asphalt. To address this limitation, future research will employ Scanning Electron Microscopy and Energy-Dispersive X-Ray Spectroscopy to comprehensively characterize the asphalt’s microstructure and elemental distribution. In addition, viscoelastic parameters will be determined through linear amplitude sweep testing. On the basis of these microscale insights, a more refined constitutive model for asphalt mortar will be developed, aiming to enhance the physical accuracy and predictive capability of numerical simulations;
- This study has yielded several key findings through numerical simulations, including the distribution of force chains during the IDT test, mesoscale internal forces, fracture processes, crack propagation behavior, and crack resistance-improving strategies. Future work will include extended experimental investigations of the IDT test. Full-field strain measurements will be performed using the Digital Image Correlation method. These efforts, combined with fracture testing and theoretical analysis, will validate and expand upon the conclusions drawn in this study.
Author Contributions
Funding
Institutional Review Board Statement
Informed Consent Statement
Data Availability Statement
Conflicts of Interest
References
- Wang, K.F.; Cheng, X.J.; Zhu, Y.S.; Li, H.C. Study on performance deterioration regularity of hot regenerated asphalt mixture under multiple aging factors. Constr. Build. Mater. 2023, 369, 130568. [Google Scholar] [CrossRef]
- Zhang, R.H.; Sias, J.E.; Dave, E.V. Development of a rheology-based mixture aging model for asphalt material cracking performance evaluation. Mater. Struct. 2021, 54, 150. [Google Scholar] [CrossRef]
- Walubita, L.F.; Faruk, A.N.M.; Zhang, J.; Hu, X. Characterizing the cracking and fracture properties of geosynthetic interlayer reinforced HMA samples using the Overlay Tester (OT). Constr. Build. Mater. 2015, 93, 695–702. [Google Scholar] [CrossRef]
- Ling, M.; Ji, J.; Tanvir, H.; Fuentes, L.; Walubita, L.F. Simultaneous evaluation of rutting-stripping performance and cracking resistance for asphalt mixtures. Constr. Build. Mater. 2023, 408, 133581. [Google Scholar] [CrossRef]
- Im, S.; Ban, H.; Kim, Y.R. Characterization of mode-I and mode-II fracture properties of fine aggregate matrix using a semicircular specimen geometry. Constr. Build. Mater. 2014, 52, 413–421. [Google Scholar] [CrossRef]
- Yu, H.N.; Shen, S.H.; Qian, G.P.; Gong, X.B. Packing Theory and Volumetrics-Based Aggregate Gradation Design Method. J. Mater. Civ. Eng. 2020, 32, 04020110. [Google Scholar] [CrossRef]
- Ma, T.; Zhang, D.Y.; Zhang, Y.; Wang, S.Q.; Huang, X.M. Simulation of wheel tracking test for asphalt mixture using discrete element modelling. Road Mater. Pavement Des. 2018, 19, 367–384. [Google Scholar] [CrossRef]
- Kusumawardani, D.M.; Wong, Y.D. The influence of aggregate shape properties on aggregate packing in porous asphalt mixture (PAM). Constr. Build. Mater. 2020, 255, 119379. [Google Scholar] [CrossRef]
- Jiang, Y.J.; Deng, C.Q.; Xue, J.S.; Chen, Z.J. Investigation into the performance of asphalt mixture designed using different methods. Constr. Build. Mater. 2018, 177, 378–387. [Google Scholar] [CrossRef]
- Zhang, Y.; Ma, T.; Luo, X.; Huang, X.M.; Lytton, R.L. Prediction of dynamic shear modulus of fine aggregate matrix using discrete element method and modified Hirsch model. Mech. Mater. 2019, 138, 103148. [Google Scholar] [CrossRef]
- Rami, K.Z.; Amelian, S.; Kim, Y.R.; You, T.; Little, D.N. Modeling the 3D fracture-associated behavior of viscoelastic asphalt mixtures using 2D microstructures. Eng. Fract. Mech. 2017, 182, 86–99. [Google Scholar] [CrossRef]
- Du, C.; Liu, P.; Liu, Q.; Leischner, S.; Sun, Y.; Chen, J.; Oeser, M. Development of locally homogeneous finite element model for simulating the mesoscale structure of asphalt mixture. Comput. Struct. 2021, 248, 106517. [Google Scholar] [CrossRef]
- Füssl, J.; Hengl, H.; Eberhardsteiner, L.; Kluger-Eigl, W.; And Blab, R. Numerical simulation tool for paving block structures assessed by means of full-scale accelerated pavement tests. Int. J. Pavement Eng. 2018, 19, 917–929. [Google Scholar] [CrossRef]
- Bakhshi, B.; Arabani, M. Numerical Evaluation of Rutting in Rubberized Asphalt Mixture Using Finite Element Modeling Based on Experimental Viscoelastic Properties. J. Mater. Civ. Eng. 2018, 30, 04018088. [Google Scholar] [CrossRef]
- Zhao, Y.J.; Jiang, L.; Jiang, J.W.; Ni, F.J. Accuracy Improvement for Two-Dimensional Finite-Element Modeling while Considering Asphalt Mixture Meso-Structure Characteristics in Indirect Tensile Test Simulation. J. Mater. Civ. Eng. 2020, 32, 04020275. [Google Scholar] [CrossRef]
- Zhao, Y.J.; Jiang, J.W.; Dai, Y.Q.; Zhou, L.; Ni, F.J. Thermal Property Evaluation of Porous Asphalt Concrete Based on Heterogeneous Meso-Structure Finite Element Simulation. Appl. Sci. 2020, 10, 1671. [Google Scholar] [CrossRef]
- Liu, Y.; Xu, X.N.; Huang, Z.R.; Zhao, M.H. Discrete-continuous coupling simulation and analysis for asphalt pavement dynamic stress responses under a moving wheel load. CASE Stud. Constr. Mater. 2023, 18, e01932. [Google Scholar] [CrossRef]
- Zhou, F.; Hu, X.; Hu, S.; Walubita, L.F.; And Scullion, T. Incorporation of Crack Propagation in the M-E Fatigue Cracking Prediction. Road Mater. Pavement Des. 2008, 9, 433–465. [Google Scholar] [CrossRef]
- Ribas, C.Y.; Thives, L.P. Evaluation of effect of compaction method on the macrostructure of asphalt mixtures through digital image processing under Brazilian conditions. Constr. Build. Mater. 2019, 228, 116821. [Google Scholar] [CrossRef]
- Fu, J.; Yang, Y.Q.; Zhang, X.Q.; Wang, F.Z. Different strain distributions of cement-emulsified asphalt concrete pavement between the macro- and meso-scale. Road Mater. Pavement Des. 2018, 19, 470–483. [Google Scholar] [CrossRef]
- You, Z.P.; Liu, Y.; Dai, Q.L. Three-Dimensional Microstructural-Based Discrete Element Viscoelastic Modeling of Creep Compliance Tests for Asphalt Mixtures. J. Mater. Civ. Eng. 2011, 23, 79–87. [Google Scholar] [CrossRef]
- Wang, S.D.; Miao, Y.H.; Wang, L.B. Investigation of the force evolution in aggregate blend compaction process and the effect of elongated and flat particles using DEM. Constr. Build. Mater. 2020, 258, 119674. [Google Scholar] [CrossRef]
- Liang, H.H.; Wang, D.Y.; Shi, L.W.; Liang, X.Y.; Tang, C. Use of digital images for fracture performance evaluation of asphalt mixtures. Constr. Build. Mater. 2020, 253, 119152. [Google Scholar] [CrossRef]
- Huang, K.; Xu, T.; Li, G.F.; Jiang, R.L. The feasibility of DEM to analyze the temperature field of asphalt mixture. Constr. Build. Mater. 2016, 106, 592–599. [Google Scholar] [CrossRef]
- Klimczak, M.; Jaworska, I.; Tekieli, M. 2D Digital Reconstruction of Asphalt Concrete Microstructure for Numerical Modeling Purposes. Materials 2022, 15, 5553. [Google Scholar] [CrossRef] [PubMed]
- Chang, M.; Pei, J.; Zhang, J.; Xing, X.; Xu, S.; Xiong, R.; Sun, J. Quantitative distribution characteristics of force chains for asphalt mixtures with three skeleton structures using discrete element method. Granul. Matter 2020, 22, 87. [Google Scholar] [CrossRef]
- Gajewski, M.D.; Król, J.B. The Influence of Mortar’s Poisson Ratio and Viscous Properties on Effective Stiffness and Anisotropy of Asphalt Mixture. Materials 2022, 15, 8946. [Google Scholar] [CrossRef]
- Wang, C.; Xu, H.; Zhang, Y.; Sun, Y.; Wang, W.; Chen, J. Improved Procedure for the 3D Reconstruction of Asphalt Concrete Mesostructures Considering the Similarity of Aggregate Phase Geometry between Adjacent CT Slices. Materials 2023, 16, 234. [Google Scholar] [CrossRef]
- Zhou, L.; Wu, G.; Zuo, Y.; Chen, X.; Hu, H. A Comprehensive Review of Vision-Based 3D Reconstruction Methods. Sensors 2024, 24, 2314. [Google Scholar] [CrossRef]
- Yu, D.; Jing, H.; Liu, J. Effects of Freeze–Thaw Cycles on the Internal Voids Structure of Asphalt Mixtures. Materials 2022, 15, 3560. [Google Scholar] [CrossRef]
- Li, X.; Lv, X.; Liu, X.; Ye, J. Discrete Element Analysis of Indirect Tensile Fatigue Test of Asphalt Mixture. Appl. Sci. 2019, 9, 327. [Google Scholar] [CrossRef]
- Jin, C.; Zou, F.L.; Yang, X.; Liu, K. 3-D virtual design and microstructural modeling of asphalt mixture based on a digital aggregate library. Comput. Struct. 2021, 242, 106378. [Google Scholar] [CrossRef]
- Zhou, W.; Huang, X.M.; Wang, L.B. Study on the void reduction behaviour of porous asphalt pavement based on discrete element method. Int. J. Pavement Eng. 2017, 18, 285–291. [Google Scholar] [CrossRef]
- Gao, L.; Zhang, Y.; Liu, Y.; Wang, Z.; Ji, X. Study on the cracking behavior of asphalt mixture by discrete element modeling with real aggregate morphology. Constr. Build. Mater. 2023, 368, 130406. [Google Scholar] [CrossRef]
- Zhang, H.; Ding, H.; Rahman, A. Effect of Asphalt Mortar Viscoelasticity on Microstructural Fracture Behavior of Asphalt Mixture Based on Cohesive Zone Model. J. Mater. Civ. Eng. 2022, 34, 04022122. [Google Scholar] [CrossRef]
- Wang, J.; Jivkov, A.P.; Engelberg, D.L.; Li, Q. Image-Based vs. Parametric Modelling of Concrete Meso-Structures. Materials 2022, 15, 704. [Google Scholar] [CrossRef]
- Dai, Q. Two- and three-dimensional micromechanical viscoelastic finite element modeling of stone-based materials with X-ray computed tomography images. Constr. Build. Mater. 2011, 25, 1102–1114. [Google Scholar] [CrossRef]
- Wu, K.; Deng, Q.; Deng, N.; Cai, X.; Huang, W. Size Effects of Finite Element Model for Three-Dimensional Microstructural Modeling of Asphalt Mixture. Adv. Mater. Sci. Eng. 2019, 2019, 1–9. [Google Scholar] [CrossRef]
- Liu, W.; Li, L.; Tian, B.; Liu, F.; Cheng, Y. Evaluation Indices of an Asphalt-Mixture Digital Specimen Based on the Discrete-Element Method. J. Test. Eval. 2016, 44, 812–819. [Google Scholar] [CrossRef]
- Dong, Z.J.; Ma, X.Y.; Gong, X.B.; Oeser, M. Theoretical evaluation of the measurement accuracy of fiber Bragg grating strain sensors within randomly filled asphalt mixtures based on finite element simulation. Struct. Control. Health Monit. 2018, 25, e2057. [Google Scholar] [CrossRef]
- Shan, J.S.; Zhang, Y.; Wu, S.Y.; Wu, Q.L.; Jiao, Y.Y.; Du, Y. Cracking behavior of asphalt pavement with a graded gravel layer based on computational granular mechanics. Constr. Build. Mater. 2022, 345, 128199. [Google Scholar] [CrossRef]
- Gao, L.; Kong, H.; Deng, X.; Wang, Z. Multi-scale finite element simulation of asphalt mixture anti-cracking performance. Theor. Appl. Fract. Mech. 2022, 121, 103490. [Google Scholar] [CrossRef]
- Wei, X.; Sun, Y.; Gong, H.; Li, Y.; Chen, J. 3D Mesomechanical Simulation–Based Approach to Determining Representative Volume Element of Asphalt Concrete. J. Transp. Eng. Part B Pavements 2024, 150, 04024001. [Google Scholar] [CrossRef]
- Tian, X.; Wang, X.; Yuan, H. Standard of Crushing Value of Coarse Aggregates for Permeable Asphalt Mixture Based on Contact Stress between Aggregates. J. Eng. 2020, 2020, 1–7. [Google Scholar] [CrossRef]
- Shi, L.; Wang, Y.; Li, H.; Liang, H.; Lin, B.; Wang, D. Recycled asphalt mixture’s discrete element model-based composite structure and mesoscale-mechanical properties. Case Stud. Constr. Mater. 2023, 18, e01987. [Google Scholar] [CrossRef]
- Jiang, D.; Wang, D.; Chen, Z.; Fan, L.; Yi, J. Research on the mesoscopic viscoelastic property of semi-flexible pavement mixture based on discrete element simulation. Case Stud. Constr. Mater. 2022, 17, e01282. [Google Scholar] [CrossRef]
- Zhu, X.; Yu, H.; Qian, G.; Yao, D.; Dai, W.; Zhang, H.; Li, J.; Zhong, H. Evaluation of asphalt mixture micromechanical behavior evolution in the failure process based on Discrete Element Method. Case Stud. Constr. Mater. 2023, 18, e01773. [Google Scholar] [CrossRef]
- Ma, T.; Zhang, D.Y.; Zhang, Y.; Zhao, Y.I.; Huang, X.-m. Microstructure modeling and virtual test of asphalt mixture based on three-dimensional discrete element method. J. Cent. South Univ. 2016, 23, 1525–1534. [Google Scholar] [CrossRef]
- Luo, L.; Yang, S.; Oeser, M.; Liu, P. Moisture damage mechanism of asphalt mixtures containing reclaimed asphalt pavement binder: A novel molecular dynamics study. J. Clean. Prod. 2024, 475, 143711. [Google Scholar] [CrossRef]
- Xu, G.; And Wang, H. Diffusion and interaction mechanism of rejuvenating agent with virgin and recycled asphalt binder: A molecular dynamics study. Mol. Simul. 2018, 44, 1433–1443. [Google Scholar] [CrossRef]
- Yu, T.; Zhang, H.; Sun, J.; Chen, D.; Wang, H.; And Feng, Y. Influence of freezing and thawing on drainage behaviour for porous asphalt pavement based on molecular dynamics simulation. Int. J. Pavement Eng. 2022, 23, 4897–4908. [Google Scholar] [CrossRef]
- Peng, Y.; Bao, J.X. Comparative Study of 2D and 3D Micromechanical Discrete Element Modeling of Indirect Tensile Tests for Asphalt Mixtures. Int. J. Geomech. 2018, 18, 04018046. [Google Scholar] [CrossRef]
- Dan, H.C.; Zhang, Z.; Chen, J.Q.; Wang, H. Numerical Simulation of an Indirect Tensile Test for Asphalt Mixtures Using Discrete Element Method Software. J. Mater. Civ. Eng. 2018, 30, 04018067. [Google Scholar] [CrossRef]
- Nian, T.; Ge, J.; Li, P.; Guo, R.; Li, J.; Wang, M. Improved three-dimensional discrete modeling method and anti-cracking properties of asphalt mixture. Constr. Build. Mater. 2022, 321, 126405. [Google Scholar] [CrossRef]
- Nian, T.; Ge, J.; Li, P.; Wang, M.; Mao, Y. Improved discrete element numerical simulation and experiment on low-temperature anti-cracking performance of asphalt mixture based on PFC2D. Constr. Build. Mater. 2021, 283, 122792. [Google Scholar] [CrossRef]
- JTG E20-2011; Test Methods of Bitumen and Bituminous Mixtures for Highway Engineering. Ministry of Transport of the People’s Republic of China: Beijing, China, 2011.
- JTG 3432-2024; Standard Test Methods for Aggregates in Highway Engineering. Ministry of Transport of the People’s Republic of China: Beijing, China, 2024.
- Zhang, J.; Fan, Z.; Pei, J.; Li, R.; Chang, M. Multiscale validation of the applicability of micromechanical models for asphalt mixture. Adv. Mater. Sci. Eng. 2015, 2015, 937126. [Google Scholar] [CrossRef]
- Yu, H.N.; Yao, D.; Qian, G.P.; Zhu, X.; Shi, C.Y.; Zhang, C.; Li, P. Review of digital twin model of asphalt mixture performance based on mesostructure characteristics. China J. Highw. Transp. 2023, 36, 20–44. [Google Scholar] [CrossRef]
- Xue, B.; Que, Y.; Pei, J.; Ma, X.; Wang, D.; Yuan, Y.; Zhang, H. A state-of-the-art review of discrete element method for asphalt mixtures: Model generation methods, contact constitutive models and application directions. Constr. Build. Mater. 2024, 414, 134842. [Google Scholar] [CrossRef]
- JTG E40-2007; Test Methods of Soils for Highway Engineering. Ministry of Transport of the People’s Republic of China: Beijing, China, 2007.
- Xu, L.; Wang, F.; Yu, H.; Li, H.; Zhao, J.; Pei, J. Freeze-thaw damage characteristics and discrete element simulation analysis of composite fibers asphalt mixture. Constr. Build. Mater. 2025, 472, 140918. [Google Scholar] [CrossRef]
- Jin, C.; Feng, Y.J.; Yang, X.; Liu, P.F.; Ding, Z.J.; Oeser, M. Virtual design of asphalt mixtures using a growth and contact model based on realistic aggregates. Constr. Build. Mater. 2022, 320, 126322. [Google Scholar] [CrossRef]
- Yu, H.A.; Zhou, S.H.; Qian, G.P.; Zhang, C.; Shi, C.Y.; Yao, D.; Ge, J.G. Evaluation of the microscale structure and performance of asphalt mixtures under different design methods. Constr. Build. Mater. 2023, 400, 132810. [Google Scholar] [CrossRef]
- Walubita Lubinda, F.; Ling, M.; Pianeta Lorena, M.R.; Fuentes, L.; Komba Julius, J.; Mabrouk Gamal, M. Correlating the Asphalt-Binder MSCR Test Results to the HMA HWTT and Field Rutting Performance. J. Transp. Eng. Part B Pavements 2022, 148, 04022047. [Google Scholar] [CrossRef]


| Technical Indicators | Requirements | Test Results | Test Methods |
|---|---|---|---|
| Penetration at 25 °C (0.1 mm) | 60–80 | 68 | T0604 |
| Softening point (°C) | ≥55 | 65 | T0606 |
| Ductility at 5 °C (cm) | ≥30 | 60 | T0605 |
| Flash point (°C) | ≥230 | 259 | T0611 |
| Particle Size Range (mm) | Aggregate Crushing Value (%) | Bulk Relative Density | Apparent Relative Density | Water Absorption (%) | Flat and Elongated Particles (%) |
|---|---|---|---|---|---|
| 10–15 | 8.7 | 2.790 | 2.774 | 0.55 | 9.6 |
| 5–10 | 8.3 | 2.712 | 2.723 | 0.82 | 8.1 |
| Particle Size Range (mm) | Apparent Relative Density | Sand Equivalent (%) | Clay Content (%) |
|---|---|---|---|
| 0–3 | 2.693 | 64.3 | 3.0 |
| Apparent Density (g/cm3) | Moisture Content (%) | Apparent Condition | Percent Passing (%) | |||
|---|---|---|---|---|---|---|
| 0.6 mm | 0.3 mm | 0.15 mm | 0.075 mm | |||
| 2.726 | 0.3 | Free from clay lumps | 100 | 100 | 96.9 | 84.1 |
| Length (mm) | Density (g/cm3) | Water Content (%) | PH |
|---|---|---|---|
| 6 | 0.6 | 1.0 | 8 |
| Contact Types | Parameters | Test Methods | Reference Standards |
|---|---|---|---|
| Aggregate–aggregate | E*, σc | Compression test | T0316-2005 [54] |
| c, φ | Direct shear test | T0143-1993 [54] | |
| Aggregate–mortar | E*, σc | Tensile test | T0713-2000 [51] |
| c, φ | Direct shear test | T0143-1993 [54] | |
| Mortar–mortar | E*, σc | Splitting test | T0716-2011 [51] |
| c, φ | Triaxial compression test | T0718-2011 [51] |
| Contact Type | Temperature | Effective Modulus E* (GPa) | Tensile Strength σc (MPa) | Cohesion c (MPa) | Friction Angle φ (°) | Bond Normal-to-Shear Stiffness Ratio k* | Friction Coefficient μ |
|---|---|---|---|---|---|---|---|
| Aggregate–aggregate | −10 °C | 24 | 35 | 35 | 20 | 1.5 | 0.7 |
| 0 °C | |||||||
| 10 °C | |||||||
| 20 °C | |||||||
| Aggregate–mortar | −10 °C | 9.5 | 14 | 14 | 20 | 1.5 | 0.3 |
| 0 °C | 7.3 | 12.5 | 12.5 | ||||
| 10 °C | 4.5 | 9 | 9 | ||||
| 20 °C | 3 | 4 | 4 | ||||
| Mortar–mortar | −10 °C | 2.3 | 21 | 21 | 0 | 1 | 0.5 |
| 0 °C | 2 | 18 | 18 | ||||
| 10 °C | 1 | 14.5 | 14.5 | ||||
| 20 °C | 0.5 | 8 | 8 |
| Temperature (°C) | Peak Load | Displacement | ||||
|---|---|---|---|---|---|---|
| Experimental (kN) | Simulation (kN) | Relative Error (%) | Experimental (mm) | Simulation (mm) | Relative Error (%) | |
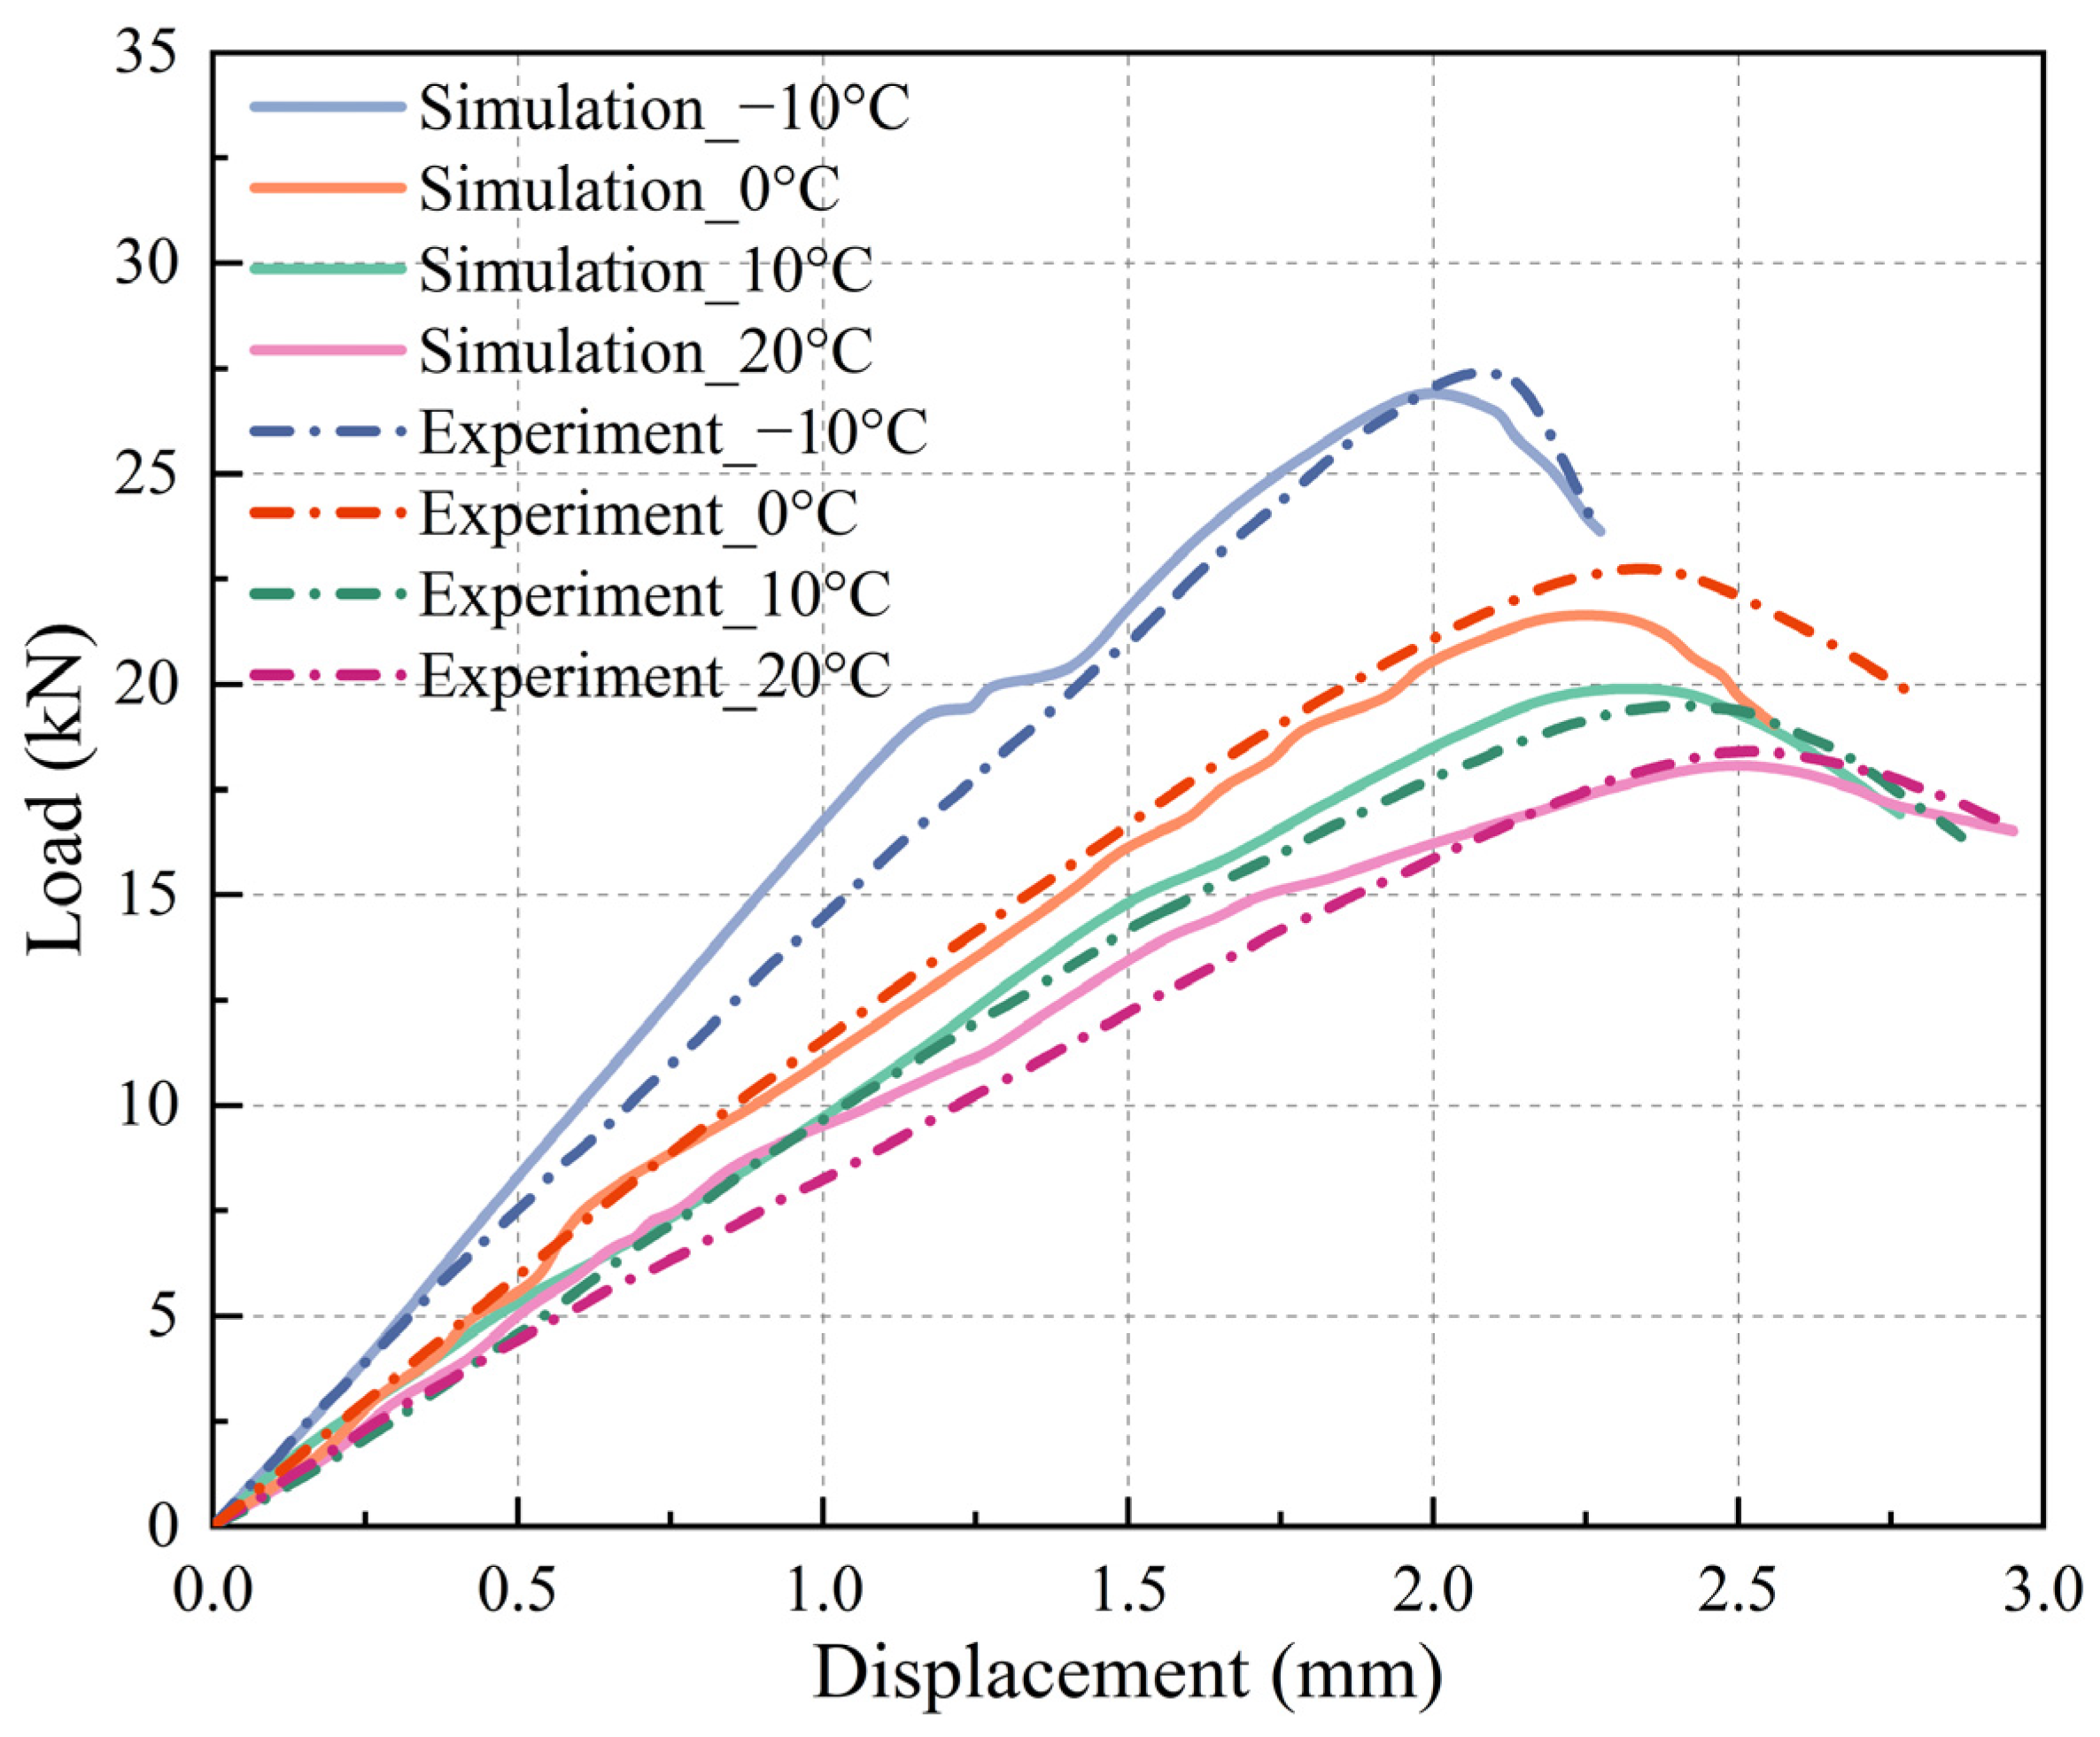
| −10 | 27.5 | 26.84 | 2.40 | 2.05 | 1.96 | 4.39 |
| 0 | 22.7 | 21.58 | 4.93 | 2.14 | 2.30 | 7.48 |
| 10 | 18.9 | 19.84 | 4.97 | 2.40 | 2.39 | 0.42 |
| 20 | 17.9 | 18.03 | 0.07 | 2.48 | 2.45 | 1.21 |
Disclaimer/Publisher’s Note: The statements, opinions and data contained in all publications are solely those of the individual author(s) and contributor(s) and not of MDPI and/or the editor(s). MDPI and/or the editor(s) disclaim responsibility for any injury to people or property resulting from any ideas, methods, instructions or products referred to in the content. |
© 2025 by the authors. Licensee MDPI, Basel, Switzerland. This article is an open access article distributed under the terms and conditions of the Creative Commons Attribution (CC BY) license (https://creativecommons.org/licenses/by/4.0/).
Share and Cite
Li, Y.; Wang, Q.; Liu, B.; Tan, Y. Meso-Structural Modeling of Asphalt Mixtures Using Computed Tomography and Discrete Element Method with Indirect Tensile Testing. Materials 2025, 18, 2566. https://doi.org/10.3390/ma18112566
Li Y, Wang Q, Liu B, Tan Y. Meso-Structural Modeling of Asphalt Mixtures Using Computed Tomography and Discrete Element Method with Indirect Tensile Testing. Materials. 2025; 18(11):2566. https://doi.org/10.3390/ma18112566
Chicago/Turabian StyleLi, Yunliang, Qichen Wang, Baocheng Liu, and Yiqiu Tan. 2025. "Meso-Structural Modeling of Asphalt Mixtures Using Computed Tomography and Discrete Element Method with Indirect Tensile Testing" Materials 18, no. 11: 2566. https://doi.org/10.3390/ma18112566
APA StyleLi, Y., Wang, Q., Liu, B., & Tan, Y. (2025). Meso-Structural Modeling of Asphalt Mixtures Using Computed Tomography and Discrete Element Method with Indirect Tensile Testing. Materials, 18(11), 2566. https://doi.org/10.3390/ma18112566