
Evolution Mechanism of Filtration Characteristics of Cement Grouting Materials in Sandy Medium

 ,
,
Abstract
1. Introduction
2. Establishment of the Mathematical Model
3. Grouting Model Experiment
3.1. Purpose of the Experiment
3.2. Test Materials
3.2.1. Sandy Medium
3.2.2. Cement Slurry
3.3. Test Scheme
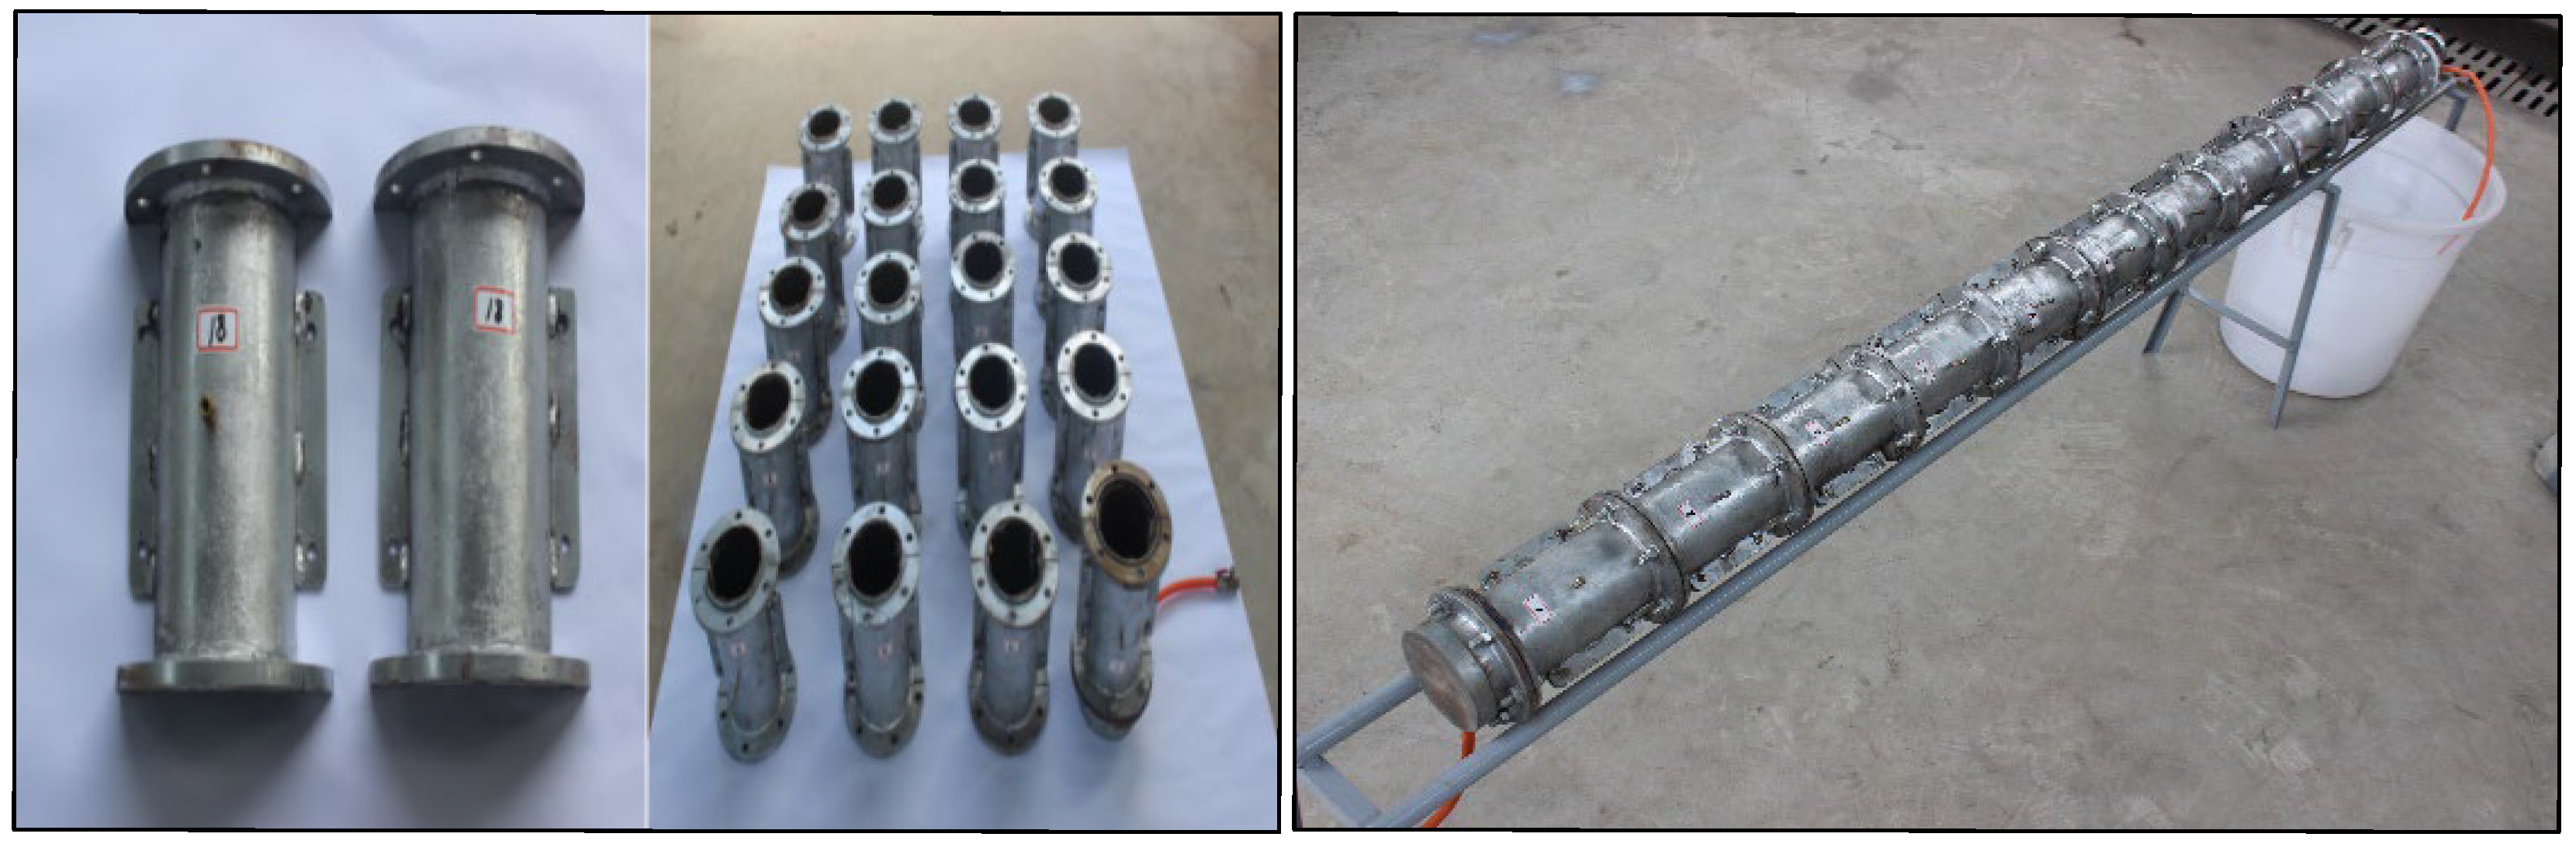
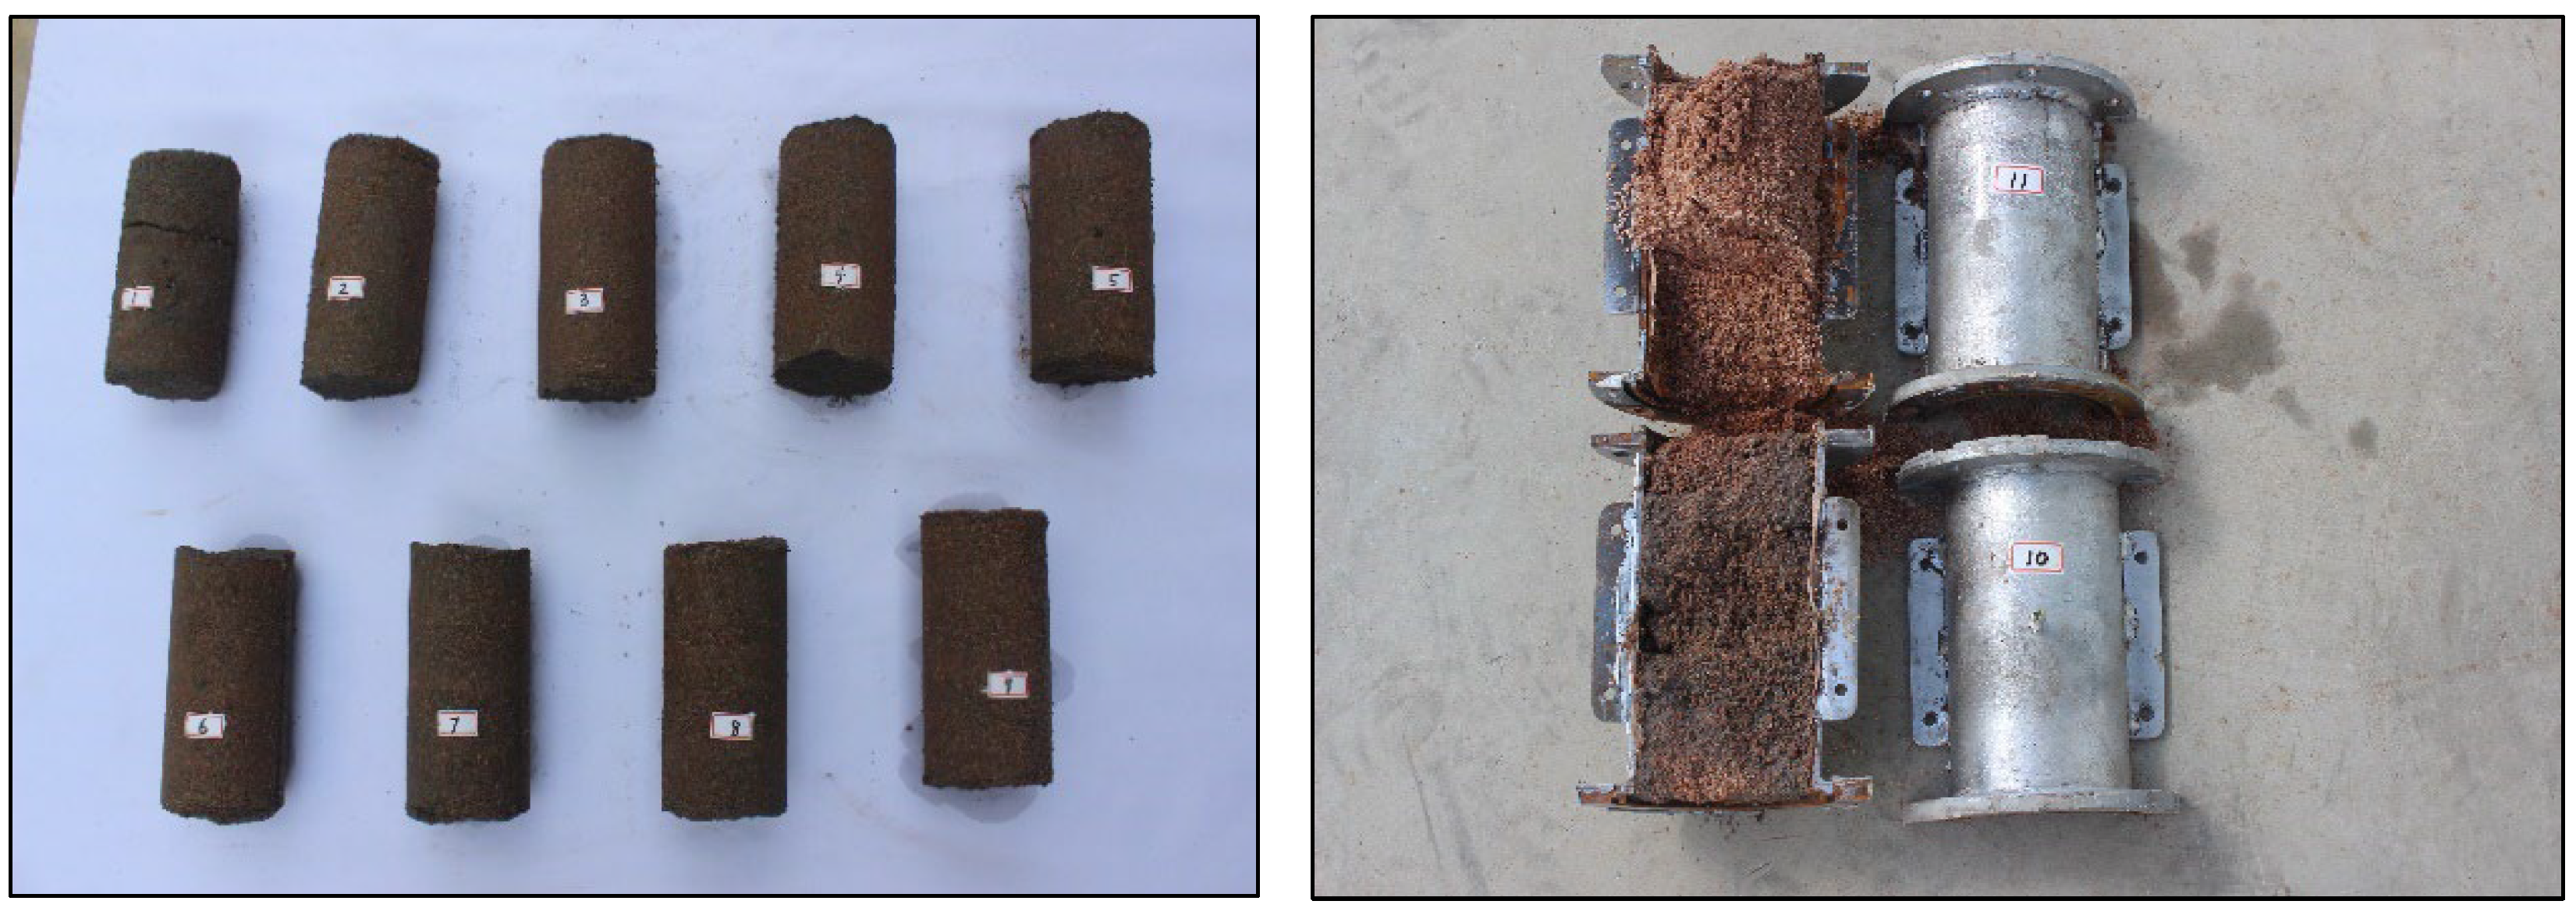
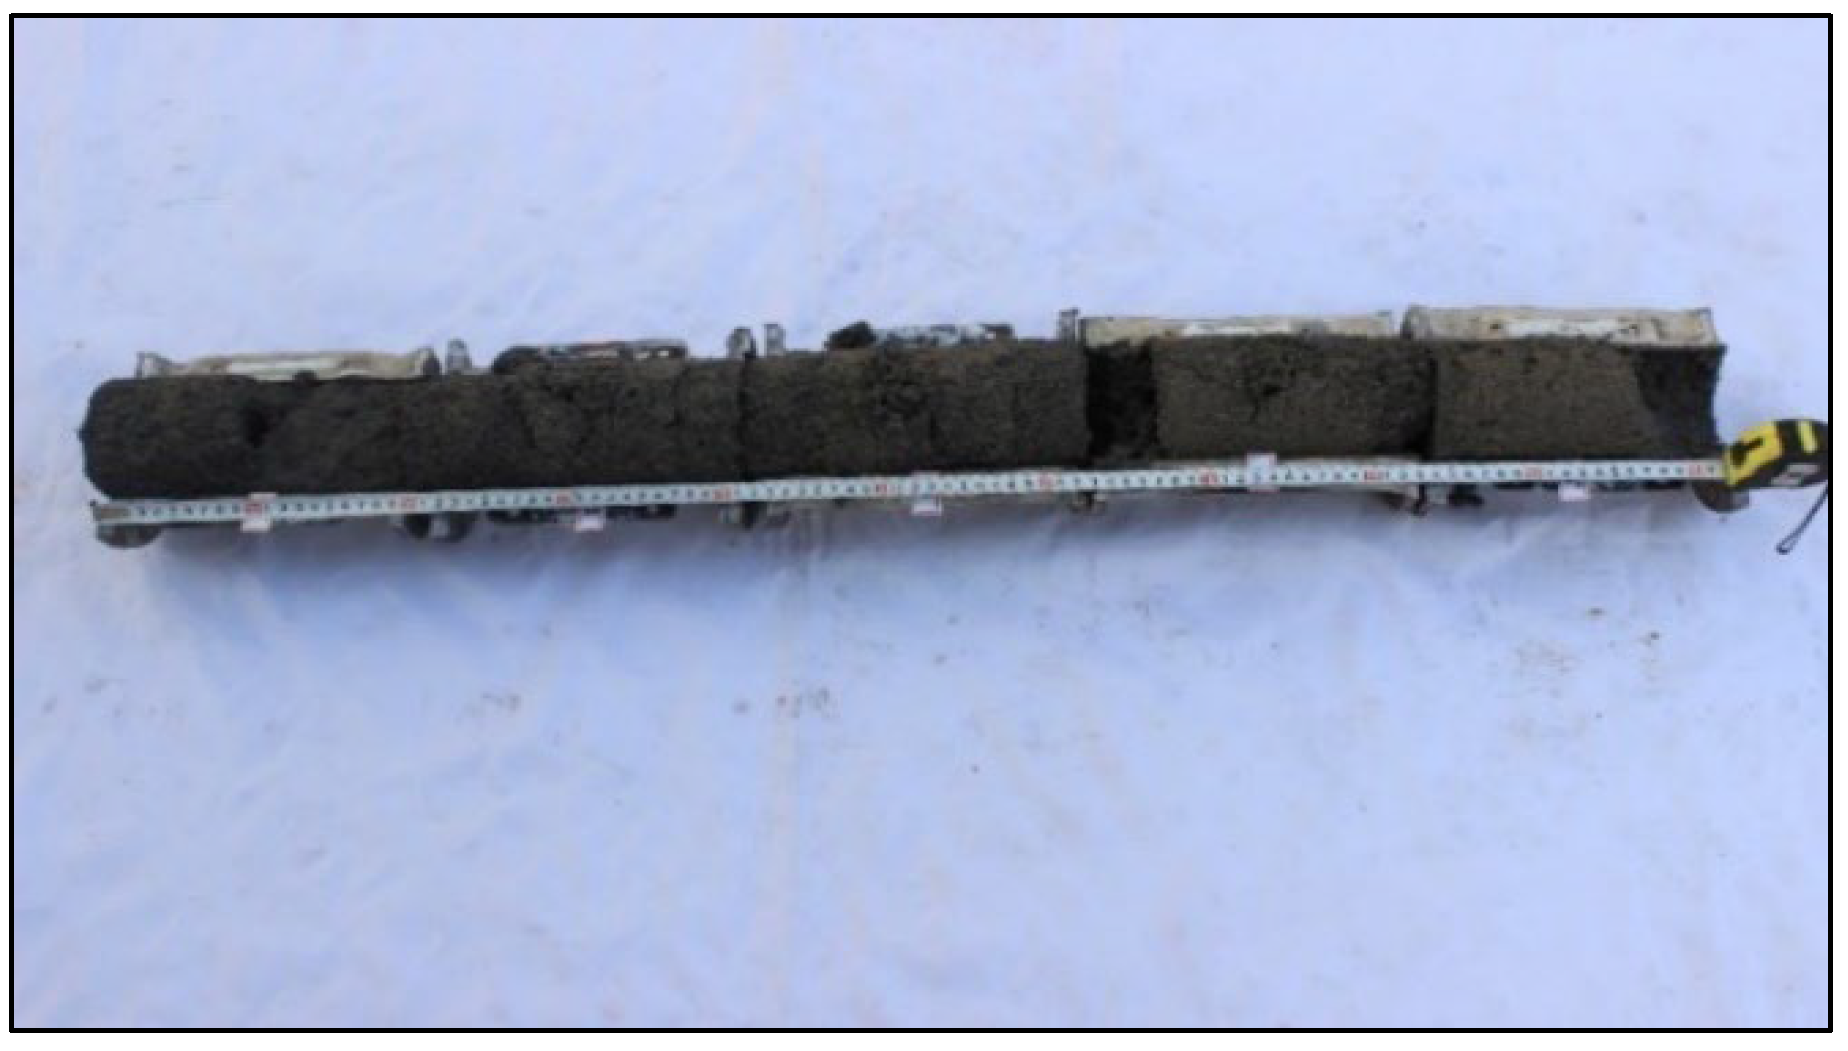
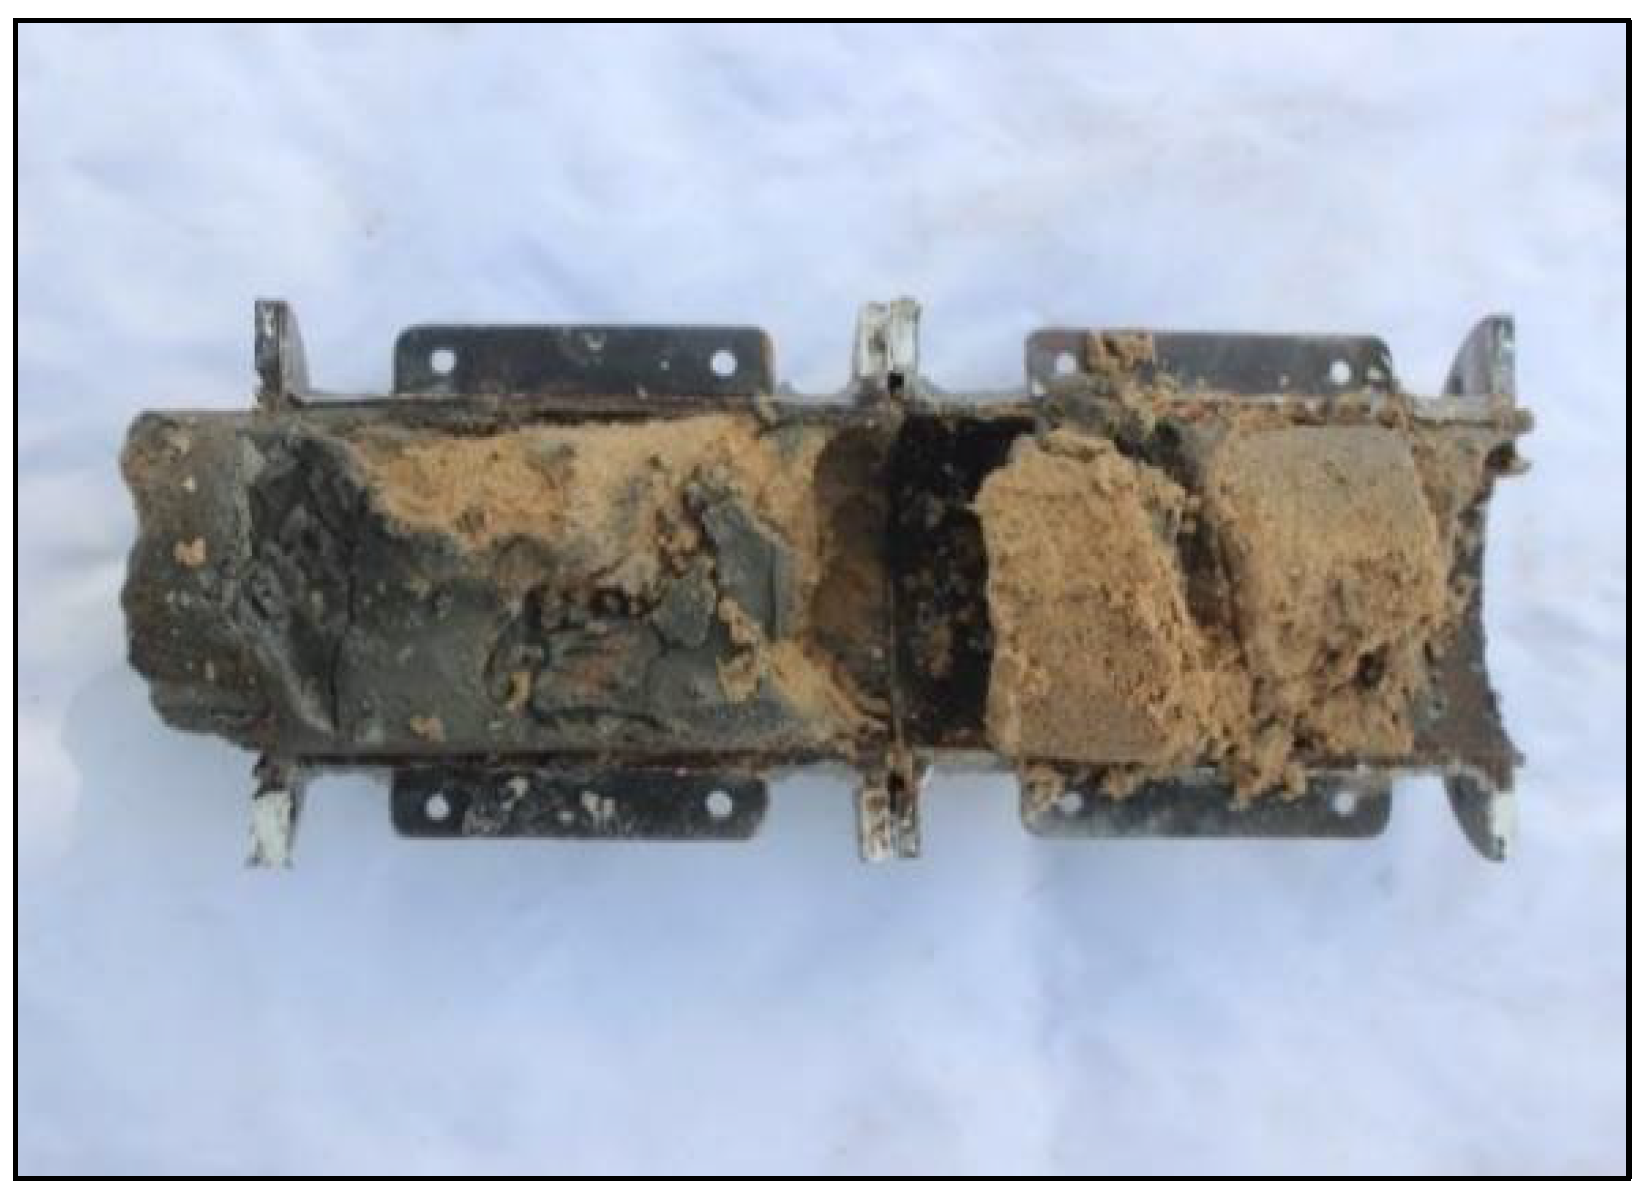
3.4. Test Process
3.5. Experimental Results
4. Test Data Analysis
4.1. Variation of Filtration Coefficient Along Slurry Diffusion Distance
4.2. Variation Law of Surface Filtration
4.3. The Influence of the Ratio of Pore Diameter to Cement Particle Size on Filtration Performance
4.4. Influence of Slurry Density
5. Discussion
- 1.
- This study establishes a time-dependent filtration–diffusion coupling model to characterize grout performance degradation in sandy media quantitatively. The feedback effect between particle filtration and slurry diffusion reveals the mechanism of nonlinear attenuation of slurry density along the diffusion distance, which cannot be realized by the static λ model [35,36,37,38].
- 2.
- We experimentally verified the grout density attenuation law under filtration through grouting experiments. The results demonstrate that the filtration coefficient dynamically varies with cement slurry diffusion distance rather than remaining constant.
- 3.
- The emergence of flow instabilities—characterized by the amplification rather than the attenuation of minor disturbances over time—significantly governs filtration efficiency. In our experiments, these instabilities manifest as localized preferential flow channels and intermittent channel clogging. This phenomenon primarily stems from particle retention during filtration, which reduces slurry viscosity through shear-thinning behavior, consequently lowering the Reynolds number and delaying turbulence onset. Furthermore, the heterogeneous pore structure of natural sand amplifies disturbances, while narrow pore throats alter the slurry’s velocity gradient.
- 4.
- This study has limitations in both theoretical modeling and experimental design. Firstly, the theoretical framework relies on Darcy’s laminar flow assumption and excludes complex scenarios involving non-Newtonian fluid behavior or unsaturated sand layers. Secondly, experiments were conducted under constant flow rate conditions, which deviate from the dynamic groundwater environments encountered in real-world engineering applications. Future work will investigate slurry diffusion mechanisms under multifactor coupling effects and validate the model’s applicability using field-collected data.
6. Conclusions
- 1.
- Along the diffusion distance of the cement slurry, the filtration coefficient in the S1 sand sample decreased from 18.17 × 10⁻³s−1 to 1.24 × 10⁻³s−1; in the S2 sand sample, it declined from 8.86 × 10⁻³s−1 to 3.29 × 10⁻³s−1; and, in the S3 sand sample, it reduced from 7.15 × 10⁻³s−1 to 1.86 × 10⁻³s−1. This illustrates that the filtration coefficient varies dynamically along the diffusion distance of the cement slurry rather than remaining constant. Based on the time-dependent filtration–diffusion coupling model and the maximum filtration coefficient, the time when the pores on the surface of the sand layer are completely blocked can be inverted to control the grouting process in the sand layer reinforcement project.
- 2.
- When the pore channel of the S1 sand sample is fully obstructed, the filtration coefficient is 6.3 × 10⁻³s−1, corresponding to a surface filtration range of 0–30 cm; for the S2 sand sample, with its pore channel fully obstructed, the filtration coefficient is 15.27 × 10³s−1, and the surface filtration range is 0–10 cm; similarly, for the S3 sand sample, where its pore channel entirely blocked, the filtration coefficient measures 12.29 × 10⁻³s−1 alongside a corresponding surface filtration range of 0–10 cm.
- 3.
- Under a water–cement ratio of 1:1, the diffusion distance of the Grade 42.5 Portland Cement slurry in the S1 sand sample is measured at 190 cm. In contrast, the diffusion distances for the 800 mesh superfine cement slurry in the S2 sand sample and the 1250 mesh superfine cement slurry in the S3 sand sample are recorded as 69 cm and 87 cm, respectively. The longer the range of surface filtration in the sand sample, the farther the final diffusion distance of the slurry. At the same time, the spacing of boreholes in the sand layer reinforcement project can be optimized based on the surface filtration range and the final diffusion distance.
- 4.
- As the ratio of sand pore diameter to cement particle size increases, the adsorption and obstruction effects of the medium skeleton on cement particles diminish, leading to a reduced amount of retained particles and a smaller filtration coefficient. Under a constant water–cement ratio, smaller cement particle sizes result in a higher density of the prepared cement slurry but lower fluidity. These factors significantly affect the diffusion of cement slurry within the sandy medium.
Author Contributions
Funding
Institutional Review Board Statement
Informed Consent Statement
Data Availability Statement
Acknowledgments
Conflicts of Interest
References
- Li, W.; Yu, L.; Zhang, T. Quantitative analysis of grain size effect on tensile mechanical behavior of granite based on multi-level force chain networks. Comp. Part. Mech. 2024, 11, 2245–2266. [Google Scholar] [CrossRef]
- Liu, P.; Wang, H.; Liu, Q.; Li, X.; Dong, Y.; Xie, X. FDEM numerical study on the large deformation mechanism of layered rock mass tunnel under excavation-unloading disturbance. Tunn. Undergr. Space Technol. 2025, 159, 106497. [Google Scholar] [CrossRef]
- Li, W.; Zhang, Q.; Wang, X.; Yu, L.; Li, Z. Synergistic effect of particle size, carboxymethyl starch and Na2CO3 on rheological and filtration property of bentonite-based material. Case Stud. Constr. Mat. 2024, 21, e03537. [Google Scholar] [CrossRef]
- Peng, Y.; Yu, L.; Qian, J.; Li, W.; Zhang, T.; Zhou, L. Dynamic tensile behavior and crack propagation in coral aggregate seawater shotcrete: Experimental investigation and numerical simulation. Cement Concrete Comp. 2025, 159, 106010. [Google Scholar] [CrossRef]
- Li, W.; Yu, L.; Tan, Y.; Wu, L.; Qian, J. Mechanical properties and impact behavior of frozen clay: Insights from static mechanical tests, fly-plate tests, and split-Hopkinson pressure bar analysis. Phys. Fluids 2024, 36, 057138. [Google Scholar] [CrossRef]
- Yu, Y.; Tao, Y.; Ma, Z.; He, Y. Experimental study and optimization on filtration and fluid flow performance of a granular bed filter. Powder Tech. 2018, 333, 449–457. [Google Scholar] [CrossRef]
- Chen, M.; Salama, A.; Sun, S. The transport of nanoparticles in subsurface with fractured, anisotropic porous media: Numerical simulations and parallelization. J. Comput. Appl. Math. 2019, 350, 1–18. [Google Scholar] [CrossRef]
- Zhou, Z.; Cai, X.; Du, X.; Wang, S.; Ma, D.; Zang, H. Strength and filtration stability of cement grouts in porous media. Tunn. Undergr. Space Technol. 2019, 89, 1–9. [Google Scholar] [CrossRef]
- Ding, B.; Li, C.; Wang, Y.; Xu, J. Effects of pore size distribution and coordination number on filtration coefficients for straining-dominant deep bed filtration from percolation theory with 3D networks. Chem. Eng. Sci. 2018, 175, 1–11. [Google Scholar] [CrossRef]
- Carraro, T.; Eduard, M.P.; Andro, M. Effective pressure boundary condition for the filtration through porous medium via homogenization. Nonlinear Anal. Real World Appl. 2018, 44, 149–172. [Google Scholar] [CrossRef]
- Qiao, J.; Zeng, J.; Jiang, S.; Ma, Y.; Feng, S.; Xie, H.; Wang, Y.; Hu, H. Role of pore structure in the percolation and storage capacities of deeply buried sandstone reservoirs: A case study of the Junggar Basin, China. Mar. Petrol. Geol. 2020, 113, 104129. [Google Scholar] [CrossRef]
- Ye, F.; Yang, T.; Mao, J.; Qin, X.; Zhao, R. Half-spherical surface diffusion model of shield tunnel back-fill grouting based on infiltration effect. Tunn. Undergr. Space Technol. 2019, 83, 274–281. [Google Scholar] [CrossRef]
- Fan, J.; Liu, W.; Liu, C.; Huang, C.; Tan, Y.; Guo, J. Evaluating permeability and efficiency of substrates by using permeation grouting sand column test. KSCE J. Civ. Eng. 2018, 22, 2843–2855. [Google Scholar] [CrossRef]
- Bayesteh, H.; Sabermahani, M. Field study on performance of jet grouting in low water content clay. Eng. Geol. 2020, 264, 105314. [Google Scholar] [CrossRef]
- Liu, X.; Wang, F.; Huang, J.; Wang, S.; Zhang, Z.; Nawnit, K. Grout diffusion in silty fine sand stratum with high groundwater level for tunnel construction. Tunn. Undergr. Space Technol. 2019, 93, 103051. [Google Scholar] [CrossRef]
- Draganovic, A.; Stille, H. Filtration of cement-based grouts measured using a long slot. Tunn. Undergr. Space Technol. 2014, 43, 101–112. [Google Scholar] [CrossRef]
- Min, F.; Song, H.; Zhang, N. Experimental study on fluid properties of slurry and its influence on slurry in filtration in sand stratum. Appl. Clay Sci. 2018, 161, 64–69. [Google Scholar] [CrossRef]
- Shousha, M.; Basha, A.; Elenany, M.; Hoghazy, H. Effect of using grouted vertical barrier on seepage characteristics under small hydraulic structures. Alex. Eng. J. 2020, 59, 441–455. [Google Scholar] [CrossRef]
- Fang, H.; Liu, K.; Du, X.; Wang, F. Experimental and numerical simulation study on water plugging law of permeable polymer in water-rich sand layer. Sci. China Technol. Sci. 2023, 53, 457–472. [Google Scholar]
- Deng, F.; Wang, Y.; Li, X.; Li, G.; Wang, Y.; Huang, B. A model-based study of the evolution of gravel layer permeability under the synergistic blockage effect of sand particle transport and secondary hydrate formation. Appl. Energy 2024, 355, 122209. [Google Scholar] [CrossRef]
- Cui, Y.; Tan, Z.; Han, D.; Song, J. Investigation and application of a high performance grouting material in water-rich silty fine sand stratum. Construct. Build. Mater. 2022, 329, 127100. [Google Scholar] [CrossRef]
- Sun, X.; Li, J.; Huang, S.; Gao, Y. Study on filtration characteristics of bentonite-superfine cement grout in completely weathered granite stratum. Sci. Technol. Eng. 2022, 22, 8812–8820. [Google Scholar]
- Xiao, T.; Yu, Z.; Liu, F.; Dai, X.; Sun, J. Study on Slurry Flow Characteristics and Diffusion Law of Superfine Cement-Based Composite Grouting Material. Processes 2023, 11, 1906. [Google Scholar] [CrossRef]
- Zhang, D.; Ma, Z.; Zou, Y.; Xie, H.; Guan, R. Study on the Strength and Micro Characteristics of Grouted Specimens with Different Superfine Cement Contents. Materials 2021, 14, 6709. [Google Scholar] [CrossRef]
- Sakai, Y. Evaluation of the diffusion coefficient of cement paste from pore size distribution using three-dimensional simulation. Mater. Today Commun. 2024, 411, 134451. [Google Scholar] [CrossRef]
- Huang, L.; Wang, K.; Huang, J.; Xing, Z. Study on slurry properties of double (super) fine cement under pressure filtration. J. Water Resour. Archit. Eng. 2021, 19, 155–171. [Google Scholar]
- Abou-Chakra, A.; Blanc, G.; Turatsinze, A.; Escadeillas, G. Prediction of Diffusion Properties of Cement-Based Materials Incorporating Recycled Rubber Aggregates: Effect of Microstructure on Macro Diffusion Properties. Constr. Build. Mater. 2023, 35, 105750. [Google Scholar] [CrossRef]
- Juang, C.-U.; Kuo, W.-T. Engineering Properties of Green and Ecofriendly Grouting Materials with Different Sand Filling Ratios. Materials 2023, 16, 837. [Google Scholar] [CrossRef]
- Li, Z.; Zhang, L.; Sun, D.; Zhang, Q.; Wang, D.; Wang, L. Quantitative Design Method for Grouting in Sand Layers: Practice in Qingdao Metro Line 2. Processes 2022, 10, 840. [Google Scholar] [CrossRef]
- Feng, X.; Cao, X.; Li, L.; Li, Z.; Zhang, Q.; Sun, W.; Hou, B.; Liu, C.; Shi, Z. Study on Performance and Engineering Application of Novel Expansive Superfine Cement Slurry. Materials 2024, 17, 5597. [Google Scholar] [CrossRef]
- Kim, J.; Lee, I.; Jang, J.; Choi, H. Grouting of cement-based grout with consideration of viscosity and filtration phenomenon. Int. J. Numer. Anal. Methods Geomech. 2009, 33, 1771–1797. [Google Scholar] [CrossRef]
- Herzig, J.; Leclerc, D.; Legoff, P. Flow of suspensions through porous media-new differential equation for clogged beds is derived. Ind. Eng. Chem. Res. 1970, 62, 8–35. [Google Scholar] [CrossRef]
- Geotechnical Grouting Theory and Engineering Practice Group. Theory and Engineering Example of Rock-Soil Grouting; Science Press: Beijing, China, 2001. [Google Scholar]
- Ives, K. Deep filters. Filtr. Sep. 1967, 3, 25–135. [Google Scholar]
- Sakthivadivel, R.; Rushton, K. Numerical analysis of large diameter wells with a seepage face. J. Hydrol. 1989, 107, 43–55. [Google Scholar] [CrossRef]
- Maroudas, A.; Eisenklam, P. Clarification of suspension: A study of particle deposition in granular filter media: Part I—Some observation on particle deposition. Univ. Lond. 1961, 20, 867–873. [Google Scholar]
- Iwasaki, T. Molecular dynamics study of adhesion strength and diffusion at interfaces between interconnect materials and underlay materials. Comp. Mech. 2000, 25, 78–86. [Google Scholar] [CrossRef]
- Fox, D.; Bryan, R.; Price, A. The role of soil surface crusting in desertification and strategies to reduce crusting. Environ. Monit. Assess. 2004, 99, 149–159. [Google Scholar] [CrossRef]


| Sand Sample | Mass of Particles with Different Graded Particle Sizes (g) | Fineness Modulus | Type | |||||
|---|---|---|---|---|---|---|---|---|
| 4.75–2.36 mm | 2.36–1.18 mm | 1.18–0.6 mm | 0.6–0.3 mm | 0.3–0.15 mm | <0.15 mm | |||
| S1 | 0 | 251.8 | 181.8 | 61.2 | 3.0 | 2.2 | 3.4 | Coarse sand |
| S2 | 0 | 151.7 | 167.8 | 171.5 | 4.8 | 4.2 | 2.9 | Medium sand |
| S3 | 0 | 102.6 | 131.8 | 246.2 | 9.4 | 10.0 | 2.6 | Medium sand |
| Sand Sample | n0 | D0/mm | d01/mm | d02/mm | d03/mm |
|---|---|---|---|---|---|
| S1 | 0.388 | 1.27 | 0.70 | 0.62 | 0.54 |
| S2 | 0.338 | 0.99 | 0.48 | 0.42 | 0.41 |
| S3 | 0.329 | 0.83 | 0.38 | 0.34 | 0.36 |
| Material Type | Water–Cement Ratio | ρg (g/cm3) | Viscosity μ1 (mPa·s) | Initial Setting Time (min) | φ | Bleeding Rate (%) |
|---|---|---|---|---|---|---|
| P. O. 42.5 | 1:1 | 1.45 | 4.53 | 896 | 0.275 | 26.0 |
| 800 mesh superfine cement | 1.46 | 5.87 | 763 | 0.270 | 9.0 | |
| 1250 mesh superfine cement | 1.48 | 6.96 | 630 | 0.260 | 2.0 |
| Number | Sand Sample | Cement Type | Water–Cement Ratio of Slurry |
|---|---|---|---|
| 1 | S1 | P. O. 42.5 | 1:1 |
| 2 | S2 | 800 mesh superfine cement | |
| 3 | S3 | 1250 mesh superfine cement |
| Position /cm | mTTL /g | vTTL /cm3 | ρg g/cm3 | w:c | mw /g | mc /g | vc /cm3 | φ | λ 10−3·s−1 |
|---|---|---|---|---|---|---|---|---|---|
| 10 | 102.9 | 76.2 | 1.35 | 1.18:1.00 | 55.7 | 47.2 | 20.5 | 0.269 | 18.17 |
| 30 | 102.1 | 76.2 | 1.34 | 1.21:1.00 | 55.9 | 46.2 | 20.3 | 0.266 | 6.27 |
| 50 | 101.5 | 76.4 | 1.33 | 1.25:1.00 | 56.4 | 45.1 | 20.0 | 0.262 | 3.86 |
| 70 | 98.0 | 76.2 | 1.29 | 1.43:1.00 | 57.6 | 40.4 | 18.6 | 0.244 | 3.03 |
| 90 | 94.7 | 76.1 | 1.24 | 1.74:1.00 | 60.2 | 34.5 | 15.9 | 0.209 | 2.42 |
| 110 | 94.5 | 76.2 | 1.24 | 1.74:1.00 | 60.0 | 34.5 | 16.2 | 0.213 | 2.06 |
| 130 | 94.0 | 76.2 | 1.23 | 1.88:1.00 | 61.4 | 32.6 | 14.8 | 0.194 | 1.56 |
| 150 | 93.0 | 76.8 | 1.21 | 2.03:1.00 | 62.3 | 30.7 | 14.5 | 0.189 | 1.51 |
| 170 | 92.3 | 76.2 | 1.21 | 2.03:1.00 | 61.8 | 30.5 | 14.4 | 0.189 | 1.24 |
| Position /cm | mTTL /g | vTTL /cm3 | ρg g/cm3 | w:c | mw /g | mc /g | vc /cm3 | φ | λ 10−3·s−1 |
|---|---|---|---|---|---|---|---|---|---|
| 10 | 91.6 | 66.4 | 1.38 | 1.22:1.00 | 50.3 | 41.3 | 16.1 | 0.242 | 8.86 |
| 30 | 84.1 | 66.2 | 1.27 | 1.87:1.00 | 54.8 | 29.3 | 11.4 | 0.172 | 2.74 |
| 50 | 39.5 | 33.2 | 1.19 | 2.43:1.00 | 28.0 | 11.5 | 5.2 | 0.157 | 3.29 |
| Position /cm | mTTL /g | vTTL /cm3 | ρg g/cm3 | w:c | mw /g | mc /g | vc /cm3 | φ | λ 10−3·s−1 |
|---|---|---|---|---|---|---|---|---|---|
| 10 | 87.5 | 64.6 | 1.35 | 1.38:1.00 | 50.7 | 36.8 | 13.9 | 0.215 | 7.15 |
| 30 | 84.4 | 64.4 | 1.31 | 1.57:1.00 | 51.6 | 32.8 | 12.8 | 0.20 | 2.89 |
| 50 | 79.0 | 64.6 | 1.22 | 2.19:1.00 | 54.2 | 24.8 | 10.4 | 0.161 | 2.46 |
| 70 | 76 | 64.6 | 1.18 | 2.76:1.00 | 55.8 | 20.2 | 8.8 | 0.136 | 1.86 |
| Literature | Suspended Particles | Porous Media | Particle Size Ratio | Filtration Coefficient λ 10−3·s−1 | ||
|---|---|---|---|---|---|---|
| Type | Particle Size /μm | Type | Particle Size /μm | |||
| [34] | Polyvinyl chloride | 1.3 | Glass microspheres | 460 | 353.8 | 2.90 |
| 425 | 326.9 | 6.60 | ||||
| Sand | 600 | 461.5 | 6.16 | |||
| [35] | Polystyrene | 900 | Plastic balls | 12500 | 13.9 | 0.99 |
| 1060 | 11.8 | 1.48 | ||||
| [36] | Corner quartz | <20 | Glass microspheres | 2000 | <100 | 3.70 |
| Polystyrene | 65 | 2000 | 30.8 | 17.20 | ||
| 90 | 22.2 | 35.00 | ||||
| 125 | 16 | 47.88 | ||||
| [37] | Colibacillus | 1 | Sand | 104 | 104 | 2.74 |
| 227 | 227 | 0.52 | ||||
| Seaweed | 15 | 829 | 55.3 | 3.10 | ||
| [38] | Iron hydroxide | 4–25 | Sand | 700 | 28–175 | 0.84 |
| Sand Sample | d01/Cement Particle Size | d02/Cement Particle Size | d03/Cement Particle Size | Filtration Coefficient λ (10−3s−1) | ||
|---|---|---|---|---|---|---|
| 10 cm | 30 cm | 50 cm | ||||
| S1 | 41 | 36 | 32 | 18.17 | 6.27 | 3.86 |
| S2 | 69 | 60 | 59 | 8.86 | 2.74 | 3.29 |
| S3 | 95 | 85 | 90 | 7.15 | 2.89 | 2.46 |
Disclaimer/Publisher’s Note: The statements, opinions and data contained in all publications are solely those of the individual author(s) and contributor(s) and not of MDPI and/or the editor(s). MDPI and/or the editor(s) disclaim responsibility for any injury to people or property resulting from any ideas, methods, instructions or products referred to in the content. |
© 2025 by the authors. Licensee MDPI, Basel, Switzerland. This article is an open access article distributed under the terms and conditions of the Creative Commons Attribution (CC BY) license (https://creativecommons.org/licenses/by/4.0/).
Share and Cite
Feng, X.; Zhang, S.; Shi, Z.; Zhang, Q.; Li, M.; Yang, W.; Sun, W.; Hou, B. Evolution Mechanism of Filtration Characteristics of Cement Grouting Materials in Sandy Medium. Materials 2025, 18, 2385. https://doi.org/10.3390/ma18102385
Feng X, Zhang S, Shi Z, Zhang Q, Li M, Yang W, Sun W, Hou B. Evolution Mechanism of Filtration Characteristics of Cement Grouting Materials in Sandy Medium. Materials. 2025; 18(10):2385. https://doi.org/10.3390/ma18102385
Chicago/Turabian StyleFeng, Xiao, Shilei Zhang, Zhenzhong Shi, Qingsong Zhang, Meiling Li, Wenda Yang, Wen Sun, and Benao Hou. 2025. "Evolution Mechanism of Filtration Characteristics of Cement Grouting Materials in Sandy Medium" Materials 18, no. 10: 2385. https://doi.org/10.3390/ma18102385
APA StyleFeng, X., Zhang, S., Shi, Z., Zhang, Q., Li, M., Yang, W., Sun, W., & Hou, B. (2025). Evolution Mechanism of Filtration Characteristics of Cement Grouting Materials in Sandy Medium. Materials, 18(10), 2385. https://doi.org/10.3390/ma18102385