
Liquid-State Interfacial Reactions of Lead-Free Solders with FeCoNiCr and FeCoNiMn Medium-Entropy Alloys at 250 °C


Highlights
- The interfacial microstructures in soldering with FeCoNiCr and FeCoNiMn medium-entropy alloys were systematically investigated and compared to those of FeCoNiCrMn.
- The Sn/FeCoNiCr reaction showed severe spalling of large (Fe,Cr,Co)Sn2 phases, which occurred due to repulsive Cr-Sn interactions.
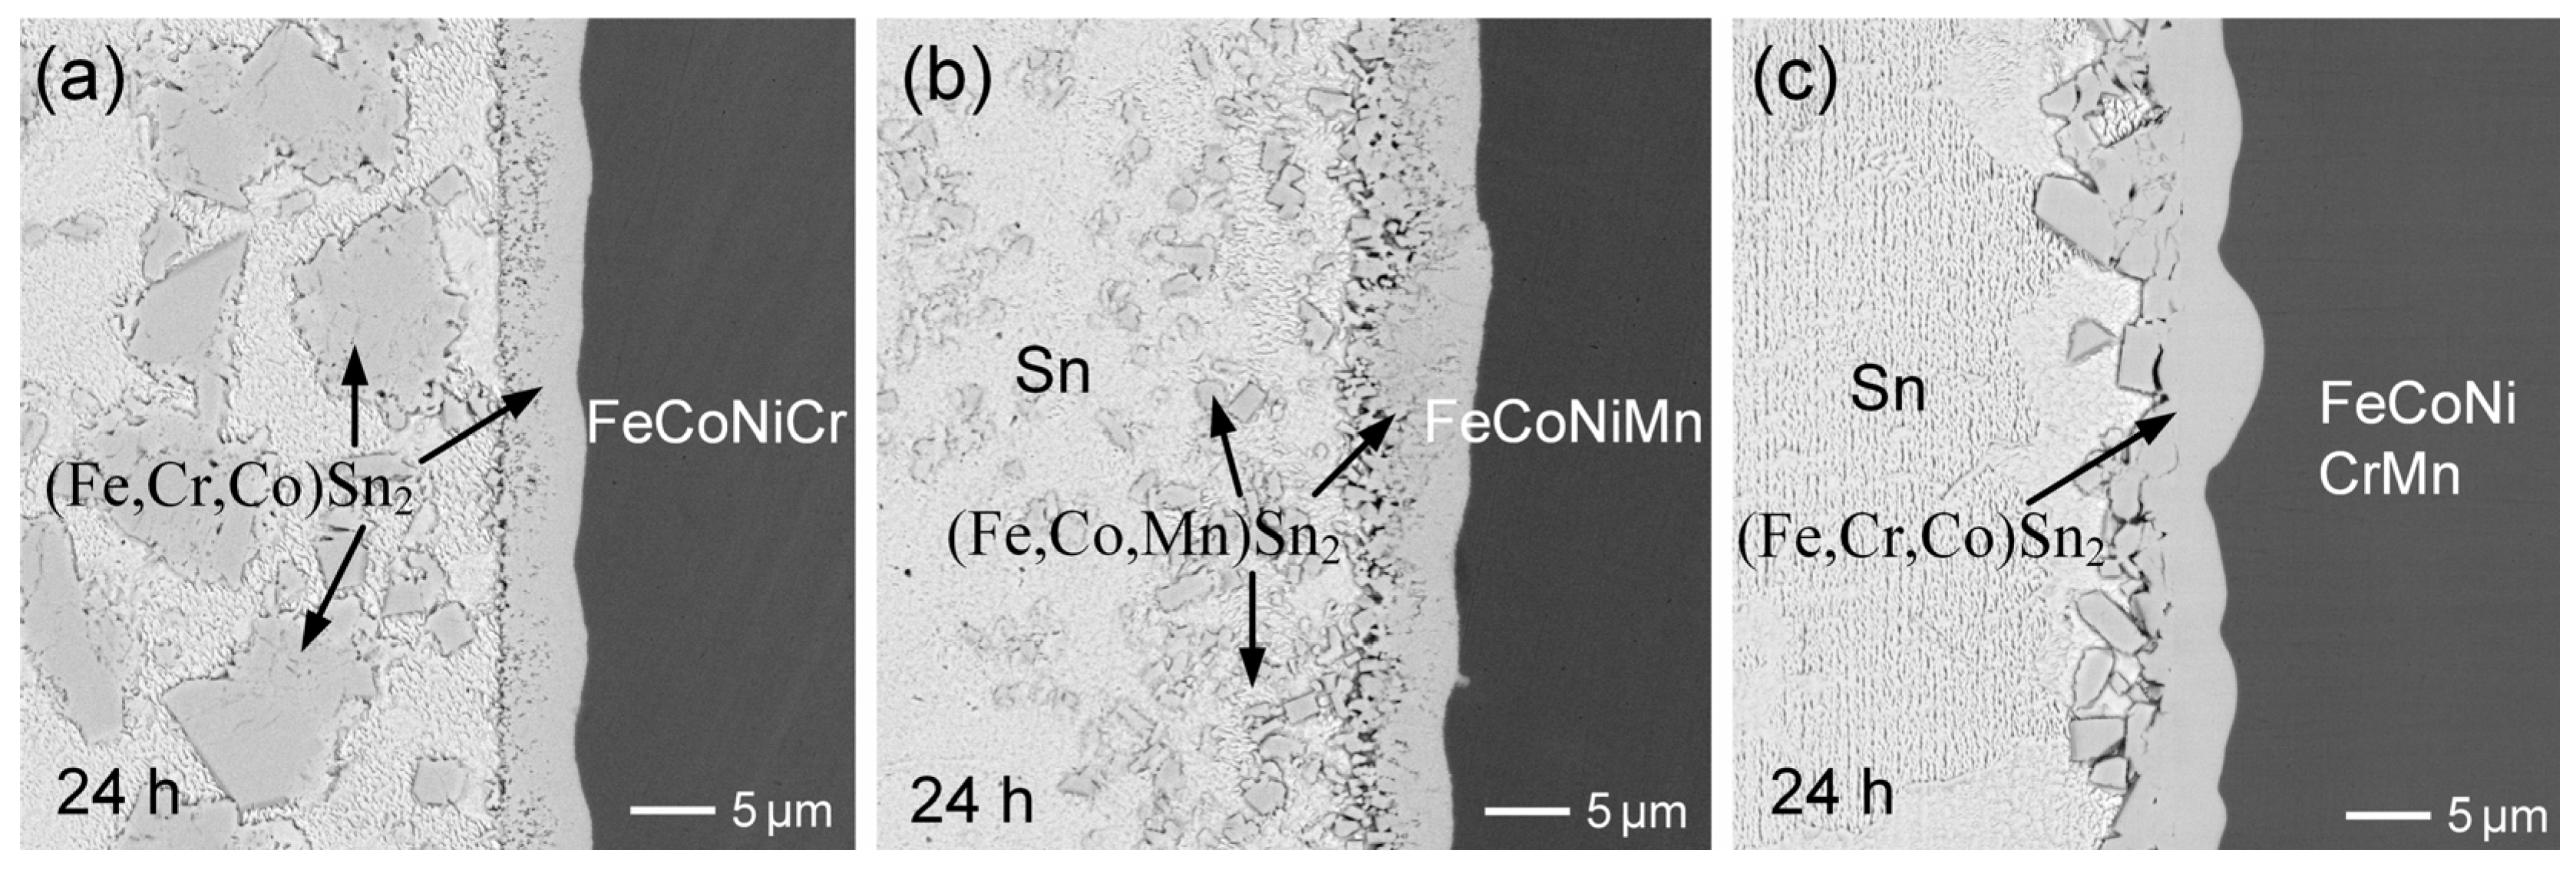
- Mn addition led to finer (Fe,Co,Mn)Sn2 phase, uniformly dispersed within the solder.
- The interfacial behavior was mainly influenced by element dissolution and alloy composition.
- Sn-Ag-Cu solder enhanced nucleation and stabilized IMC phases, favoring the formation of finer particles.
Abstract
1. Introduction
2. Materials and Methods
3. Results and Discussion
3.1. Sn/FeCoNiCr Reactions
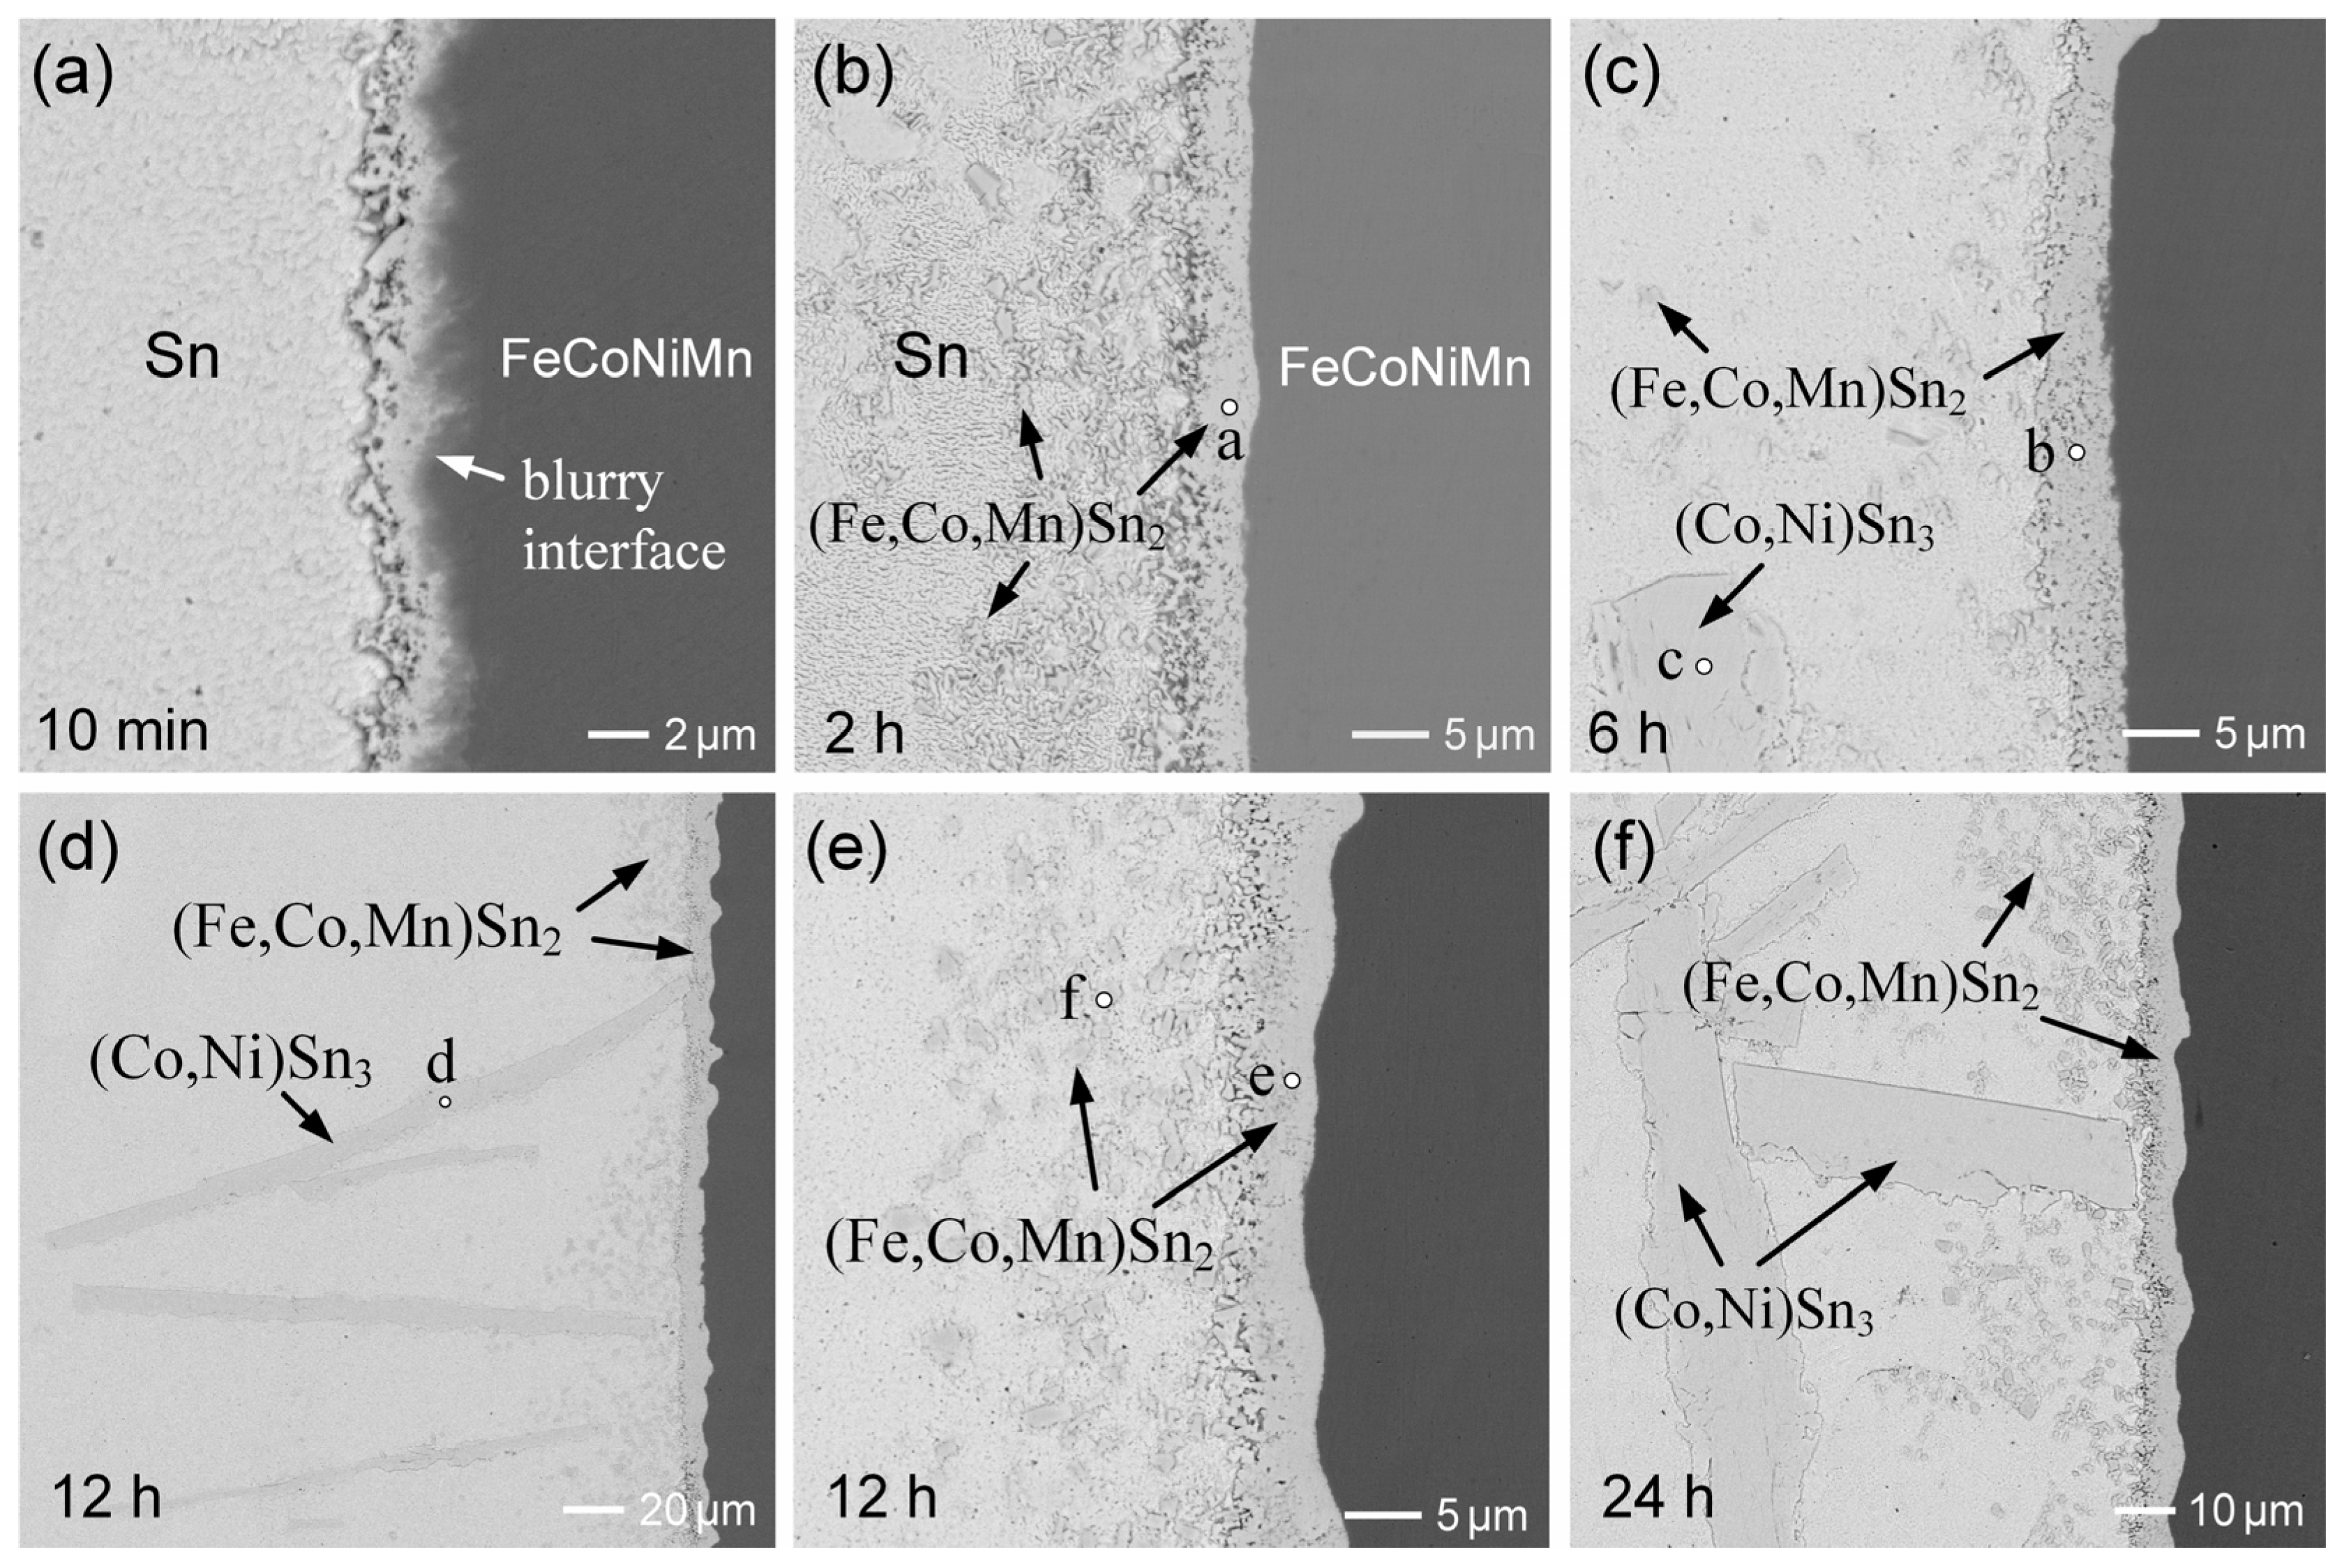
3.2. Sn/FeCoNiMn Reactions
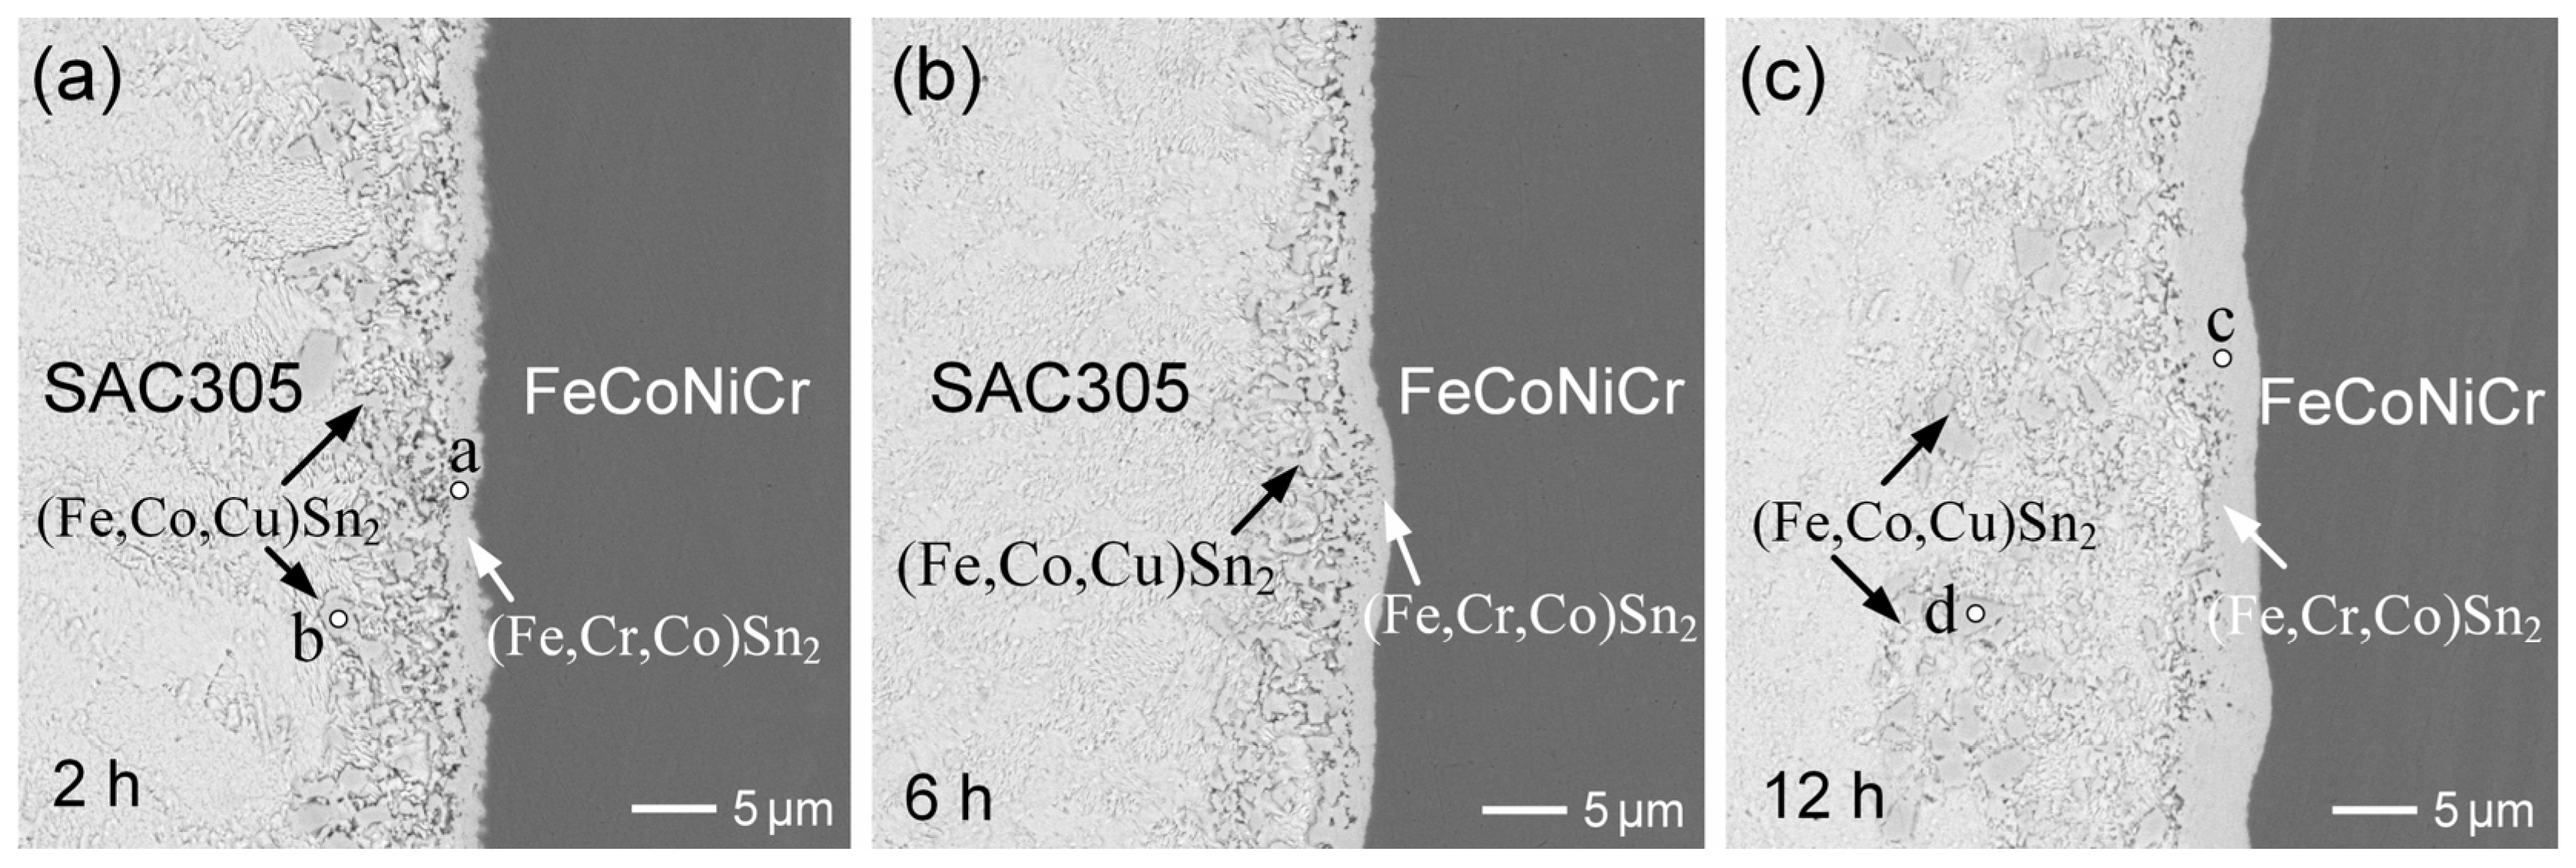
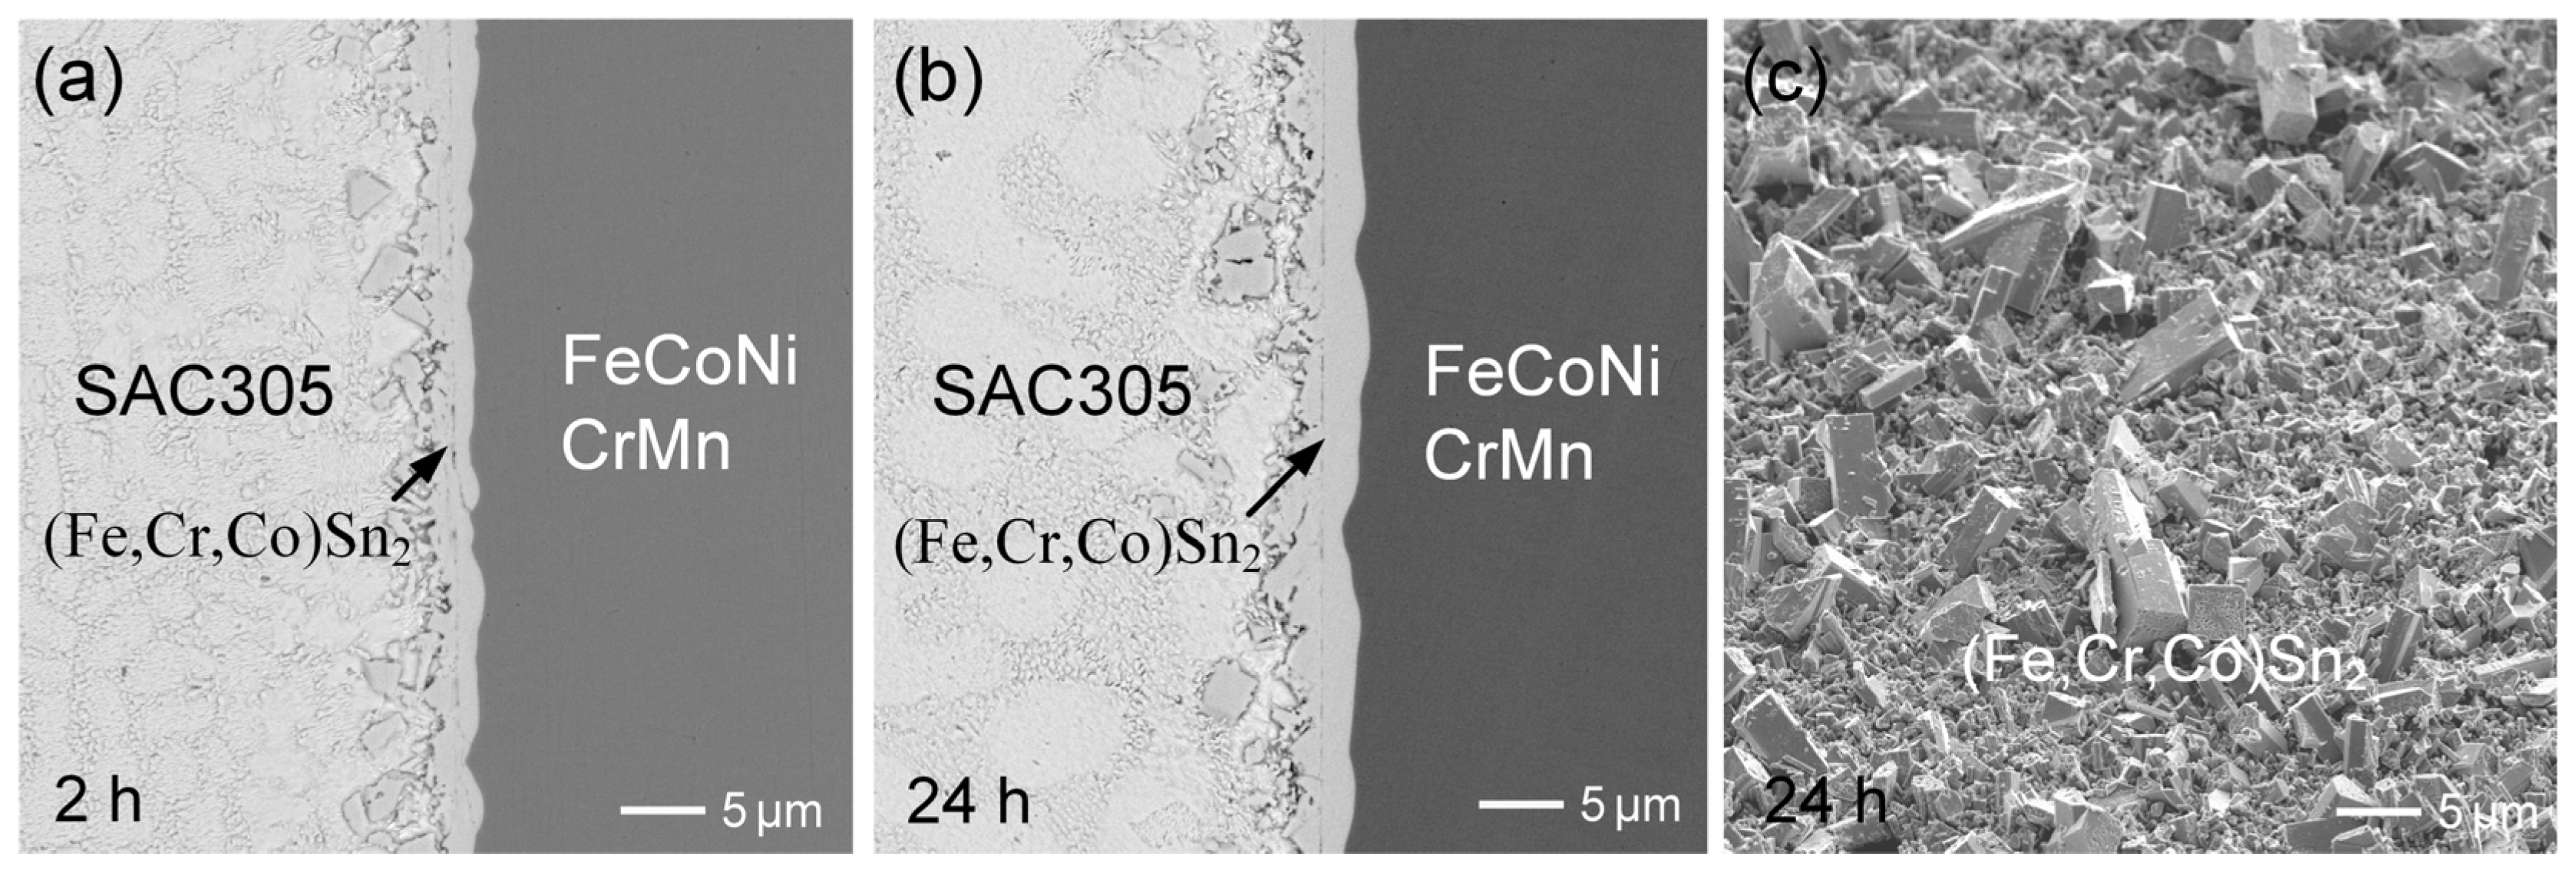
3.3. SAC305/FeCoNiCr Reactions
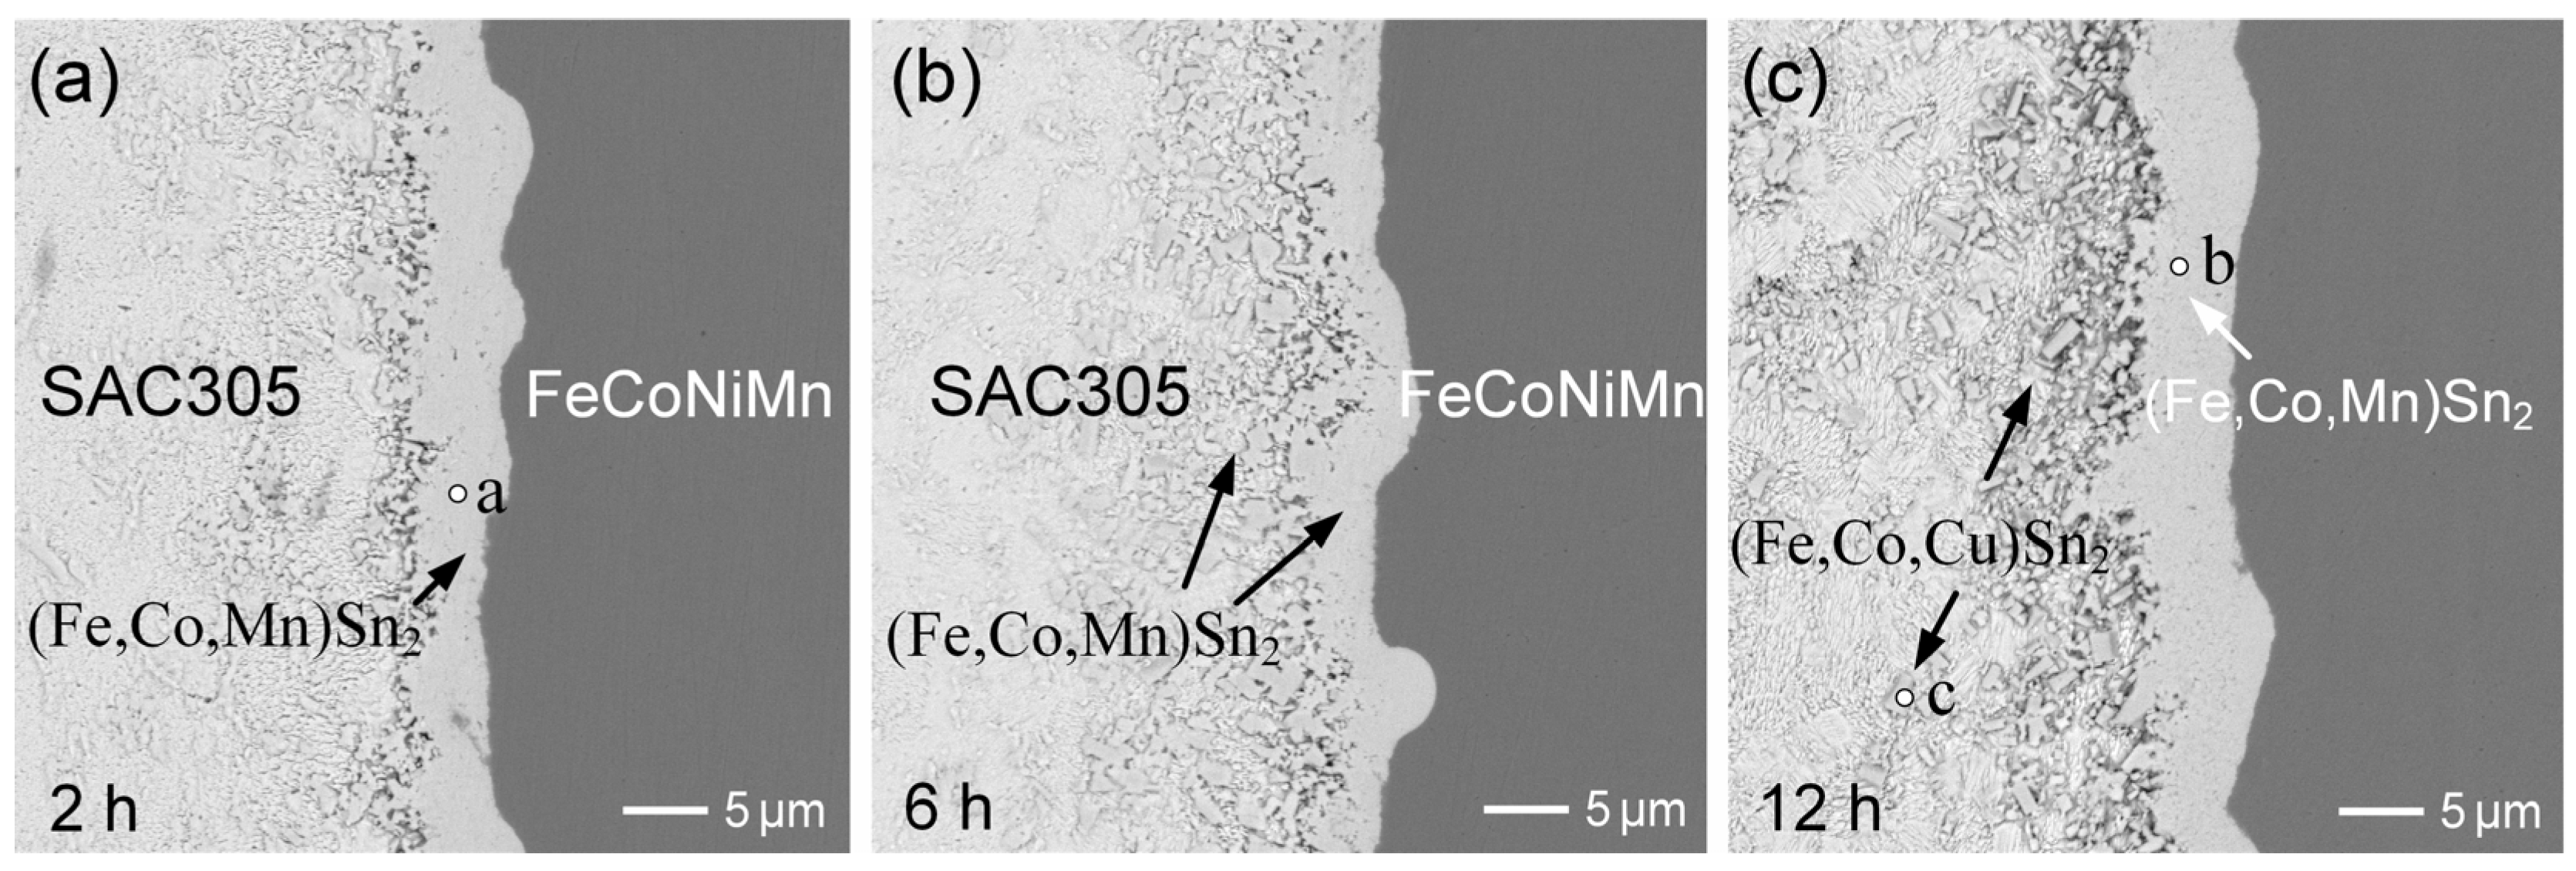
3.4. SAC305/FeCoNiMn Reactions
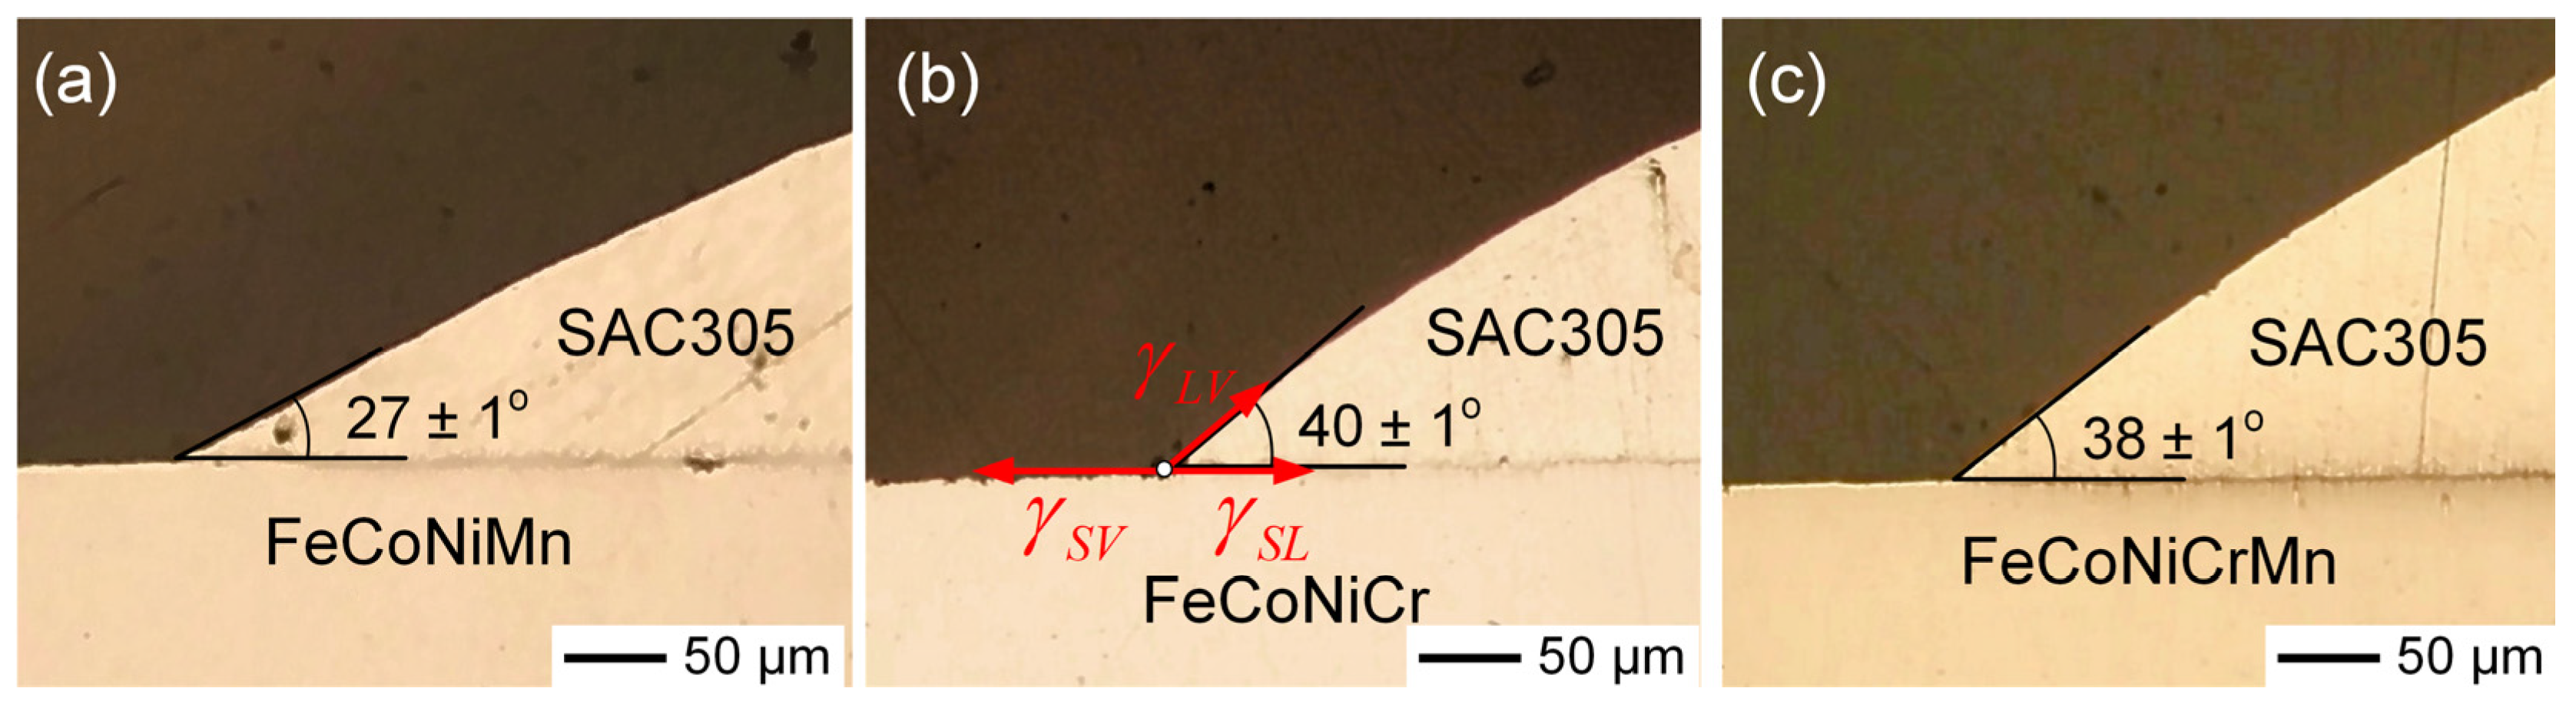
3.5. Contact Angle Analysis of SAC305 Solder on MEA/HEA Substrates
4. Conclusions
Supplementary Materials
Author Contributions
Funding
Institutional Review Board Statement
Informed Consent Statement
Data Availability Statement
Conflicts of Interest
References
- Tsai, M.H.; Yeh, J.W. High-entropy alloys: A critical review. Mater. Res. Lett. 2014, 2, 107–123. [Google Scholar] [CrossRef]
- Yeh, J.W.; Chen, S.K.; Lin, S.J.; Gan, J.Y.; Chin, T.S.; Shun, T.T.; Tsau, C.H.; Chang, S.Y. Nanostructured high-entropy alloys with multiple principal elements: Novel alloy design concepts and outcomes. Adv. Eng. Mater. 2004, 6, 299–303. [Google Scholar] [CrossRef]
- George, E.P.; Raabe, D.; Ritchie, R.O. High-entropy alloys. Nat. Rev. Mater. 2019, 4, 515–534. [Google Scholar] [CrossRef]
- Miracle, D.B.; Senkov, O.N. A critical review of high entropy alloys and related concepts. Acta Mater. 2017, 122, 448–511. [Google Scholar] [CrossRef]
- Krishna, S.A.; Noble, N.; Radhika, N.; Saleh, B. A comprehensive review on advances in high entropy alloys: Fabrication and surface modification methods, properties, applications, and future prospects. J. Manuf. Process. 2024, 109, 583–606. [Google Scholar] [CrossRef]
- Xiao, J.K.; Tan, H.; Wu, Y.Q.; Chen, J.; Zhang, C. Microstructure and wear behavior of FeCoNiCrMn high entropy alloy coating deposited by plasma spraying. Surf. Coat. Technol. 2020, 385, 125430. [Google Scholar] [CrossRef]
- Zhuo, L.; Xie, Y.; Chen, B. A review on recent progress of refractory high entropy alloys: From fundamental research to engineering applications. J. Mater. Res. Technol. 2024, 33, 1097–1129. [Google Scholar] [CrossRef]
- Deng, J.; Yang, J.; Lv, L.; Zhang, W.; Chen, Q.; Zhou, M.; Zhu, C.; Liu, N.; Yang, J. Corrosion behavior of refractory TiNbZrMoV high-entropy alloy coating in static lead-bismuth eutectic alloy: A novel design strategy of LBE corrosion-resistant coating? Surf. Coat. Technol. 2022, 448, 128884. [Google Scholar] [CrossRef]
- He, H.; Wang, Y.; Qi, Y.; Xu, Z.; Li, Y. Review on the preparation methods and strengthening mechanisms of medium-entropy alloys with CoCrNi as the main focus. J. Mater. Res. Technol. 2023, 27, 6275–6307. [Google Scholar] [CrossRef]
- Wang, L.; Jiao, Y.; Liu, R.; Wang, D.; Yu, Z.; Xi, Y.; Zhang, K.; Xu, S.; Liu, H.; Wen, L.; et al. A review of mechanical properties and improvement methods of medium entropy alloys at high temperature. JOM 2024, 76, 353–361. [Google Scholar] [CrossRef]
- Xu, D.; Wang, M.; Li, T.; Wei, X.; Lu, Y. A critical review of the mechanical properties of CoCrNi-based medium-entropy alloys. Microstructures 2022, 2, 2022001. [Google Scholar] [CrossRef]
- Ren, M.; Han, F.; Zhu, X.; Peng, Y.; Zu, Y.; Liu, P.; Feng, A. Nanoscale indentation-induced crystal plasticity in CrCoNi medium-entropy alloys containing short-range order. Materials 2024, 17, 5932. [Google Scholar] [CrossRef] [PubMed]
- Zhang, Z.; Yang, B.; Wang, Y.; Ma, J.; Zhang, Q.; Jiao, J. Effect of high temperature on the mechanical performance of additively manufactured CoCrNi medium-entropy alloy octet-truss lattice materials. Metals 2025, 15, 341. [Google Scholar] [CrossRef]
- Wang, C.-H.; Chen, H.-H.; Li, P.-Y.; Chu, P.-Y. Kinetic analysis of Ni5Zn21 growth at the interface between Sn-Zn solders and Ni. Intermetallics 2012, 22, 166–175. [Google Scholar] [CrossRef]
- Li, S.; Zhu, J.; Zhou, H.; Liao, M.; Wang, F.; Chen, J. Effects of minor Zn dopants in Sn-10Bi solder on interfacial reaction and shear properties of solder on Ni/Au surface finish. Materials 2024, 17, 4364. [Google Scholar] [CrossRef]
- Tsai, K.Y.; Tsai, M.H.; Yeh, J.W. Sluggish diffusion in Co–Cr–Fe–Mn–Ni high-entropy alloys. Acta Mater. 2013, 61, 4887–4897. [Google Scholar] [CrossRef]
- Gruber, G.C.; Kirchmair, M.; Wurster, S.; Cordill, M.J.; Franz, R. A new design rule for high entropy alloy diffusion barriers in Cu metallization. J. Alloys Compd. 2023, 953, 170166. [Google Scholar] [CrossRef]
- Li, R.; Chen, T.; Jiang, C.; Zhang, J.; Zhang, Y.; Liaw, P.K. Applications of high diffusion resistance multi-component AlCrTaTiZrRu/(AlCrTaTiZrRu)N0.7 film in Cu interconnects. Adv. Eng. Mater. 2020, 22, 2000557. [Google Scholar] [CrossRef]
- Jadhav, M.; Singh, S.; Srivastava, M.; Vinod Kumar, G.S. An investigation on high entropy alloy for bond coat application in thermal barrier coating system. J. Alloys Compd. 2019, 783, 662–673. [Google Scholar] [CrossRef]
- Peng, X.; Chen, L. Effect of high entropy alloys TiVCrZrHf barrier layer on microstructure and texture of Cu thin films. Mater. Lett. 2018, 230, 5–8. [Google Scholar] [CrossRef]
- Wang, R.; Chen, W.; Zhong, J.; Zhang, L. Experimental and numerical studies on the sluggish diffusion in face centered cubic Co-Cr-Cu-Fe-Ni high-entropy alloys. J. Mater. Sci. Technol. 2018, 34, 1791–1798. [Google Scholar] [CrossRef]
- Chiang, T.Y.; Chang, Y.C.; Wang, C.H.; Laksono, A.D.; Yen, Y.W. Investigation of the interfacial reactions between the CoCuFeNi high entropy alloy and Sn solder. Metals 2023, 13, 710. [Google Scholar] [CrossRef]
- Shen, Y.A.; Lin, C.M.; Li, J.; Gao, R.; Nishikawa, H. Suppressed growth of (Fe, Cr, Co, Ni, Cu)Sn2 intermetallic compound at interface between Sn-3.0Ag-0.5Cu solder and FeCoNiCrCu0.5 substrate during solid-state aging. Sci. Rep. 2019, 9, 10210. [Google Scholar] [CrossRef] [PubMed]
- Ma, G.F.; Ye, H.; Zhang, H.L.; He, C.L.; Zhang, H.F. Wettability of molten Sn on AlCoCrCuxFeNi high-entropy alloy. Mater. Chem. Phys. 2017, 199, 1–6. [Google Scholar] [CrossRef]
- Shen, Y.A.; Yang, X.M.; Tsai, C.Y.; Ouyang, Y.H.; Tsai, M.H.; Shun, T.T. Effect of Cu on the interfacial reaction between Sn-based solders and FeCoNiCu alloys. Intermetallics 2022, 144, 107530. [Google Scholar] [CrossRef]
- Ma, G.F.; Li, Z.K.; Ye, H.; He, C.L.; Zhang, H.F.; Hu, Z.Q. Wetting and interface phenomena in the molten Sn/CuFeNiCoCr high-entropy alloy system. Appl. Surf. Sci. 2015, 356, 460–466. [Google Scholar] [CrossRef]
- Guo, J.; Tang, C.; Rothwell, G.; Li, L.; Wang, Y.-C.; Yang, Q.; Ren, X. Welding of high entropy alloys—A review. Entropy 2019, 21, 431. [Google Scholar] [CrossRef]
- Dong, H.; Huang, Z.; Li, P.; Tang, S.; Chen, B.; Ma, Y.; Liu, W. Growth of intermetallic compounds and their reinforcement on CrCoNi/Au80Sn20 soldering interfaces. Intermetallics 2024, 164, 108113. [Google Scholar] [CrossRef]
- John, M.; Diaz, O.; Esparza, A.; Fliegler, A.; Ocenosak, D.; Van Dorn, C.; Bhat, K.U.; Menezes, P.L. Welding techniques for high entropy alloys: Processes, properties, characterization, and challenges. Materials 2022, 15, 2273. [Google Scholar] [CrossRef]
- Wang, C.H.; Li, Y.H. Microstructural investigation of Sn-based solder reactions with FeCoNiCrMn high-entropy alloy at various temperatures. JOM 2025, 77, 4161–4172. [Google Scholar] [CrossRef]
- Shen, Y.A.; Chen, S.W.; Chen, H.Z.; Chang, C.M.; Ouyang, Y.H. Extremely thin interlayer of multi-element intermetallic compound between Sn-based solders and FeCoNiMn high-entropy alloy. Appl. Surf. Sci. 2021, 558, 149945. [Google Scholar] [CrossRef]
- De Boer, F.R.; Boom, R.; Mattens, W.C.; Miedema, A.R.; Niessen, A.K. Cohesion in Metals: Transition Metal Alloys; North-Holland: Amsterdam, The Netherlands, 1988. [Google Scholar]
- Hari Kumar, K.C.; Wollants, P.; Delaey, L. Thermodynamic evaluation of Fe-Sn phase diagram. Calphad 1996, 20, 139–149. [Google Scholar] [CrossRef]
- Jerlerud Pérez, B.; Sundman, B. Thermodynamic assessment of the Cr-Sn binary system. Calphad 2001, 25, 59–66. [Google Scholar] [CrossRef]
- Okamoto, H. Ni-Sn (Nickel-Tin). J. Phase Equilib. Diff. 2008, 29, 297–298. [Google Scholar] [CrossRef]
- Okamoto, H. Mn-Sn (Manganese-Tin). J. Phase Equilib. 1999, 20, 542. [Google Scholar] [CrossRef]


Disclaimer/Publisher’s Note: The statements, opinions and data contained in all publications are solely those of the individual author(s) and contributor(s) and not of MDPI and/or the editor(s). MDPI and/or the editor(s) disclaim responsibility for any injury to people or property resulting from any ideas, methods, instructions or products referred to in the content. |
© 2025 by the authors. Licensee MDPI, Basel, Switzerland. This article is an open access article distributed under the terms and conditions of the Creative Commons Attribution (CC BY) license (https://creativecommons.org/licenses/by/4.0/).
Share and Cite
Wang, C.-H.; Li, Y.-H. Liquid-State Interfacial Reactions of Lead-Free Solders with FeCoNiCr and FeCoNiMn Medium-Entropy Alloys at 250 °C. Materials 2025, 18, 2379. https://doi.org/10.3390/ma18102379
Wang C-H, Li Y-H. Liquid-State Interfacial Reactions of Lead-Free Solders with FeCoNiCr and FeCoNiMn Medium-Entropy Alloys at 250 °C. Materials. 2025; 18(10):2379. https://doi.org/10.3390/ma18102379
Chicago/Turabian StyleWang, Chao-Hong, and Yue-Han Li. 2025. "Liquid-State Interfacial Reactions of Lead-Free Solders with FeCoNiCr and FeCoNiMn Medium-Entropy Alloys at 250 °C" Materials 18, no. 10: 2379. https://doi.org/10.3390/ma18102379
APA StyleWang, C.-H., & Li, Y.-H. (2025). Liquid-State Interfacial Reactions of Lead-Free Solders with FeCoNiCr and FeCoNiMn Medium-Entropy Alloys at 250 °C. Materials, 18(10), 2379. https://doi.org/10.3390/ma18102379