3.1. Calculation Results of REAL Program
In this study, the specific volume, gas production, and combustion temperature of eight metal oxides as additives for gas generators were calculated. The catalytic reaction ability of eight metal oxides was theoretically evaluated. The results of the calculations for the different formulations are listed in
Table 3.
The combustion performance parameters of eight gas generators based on 5AT/NaIO
4 were calculated by the REAL program (above table).
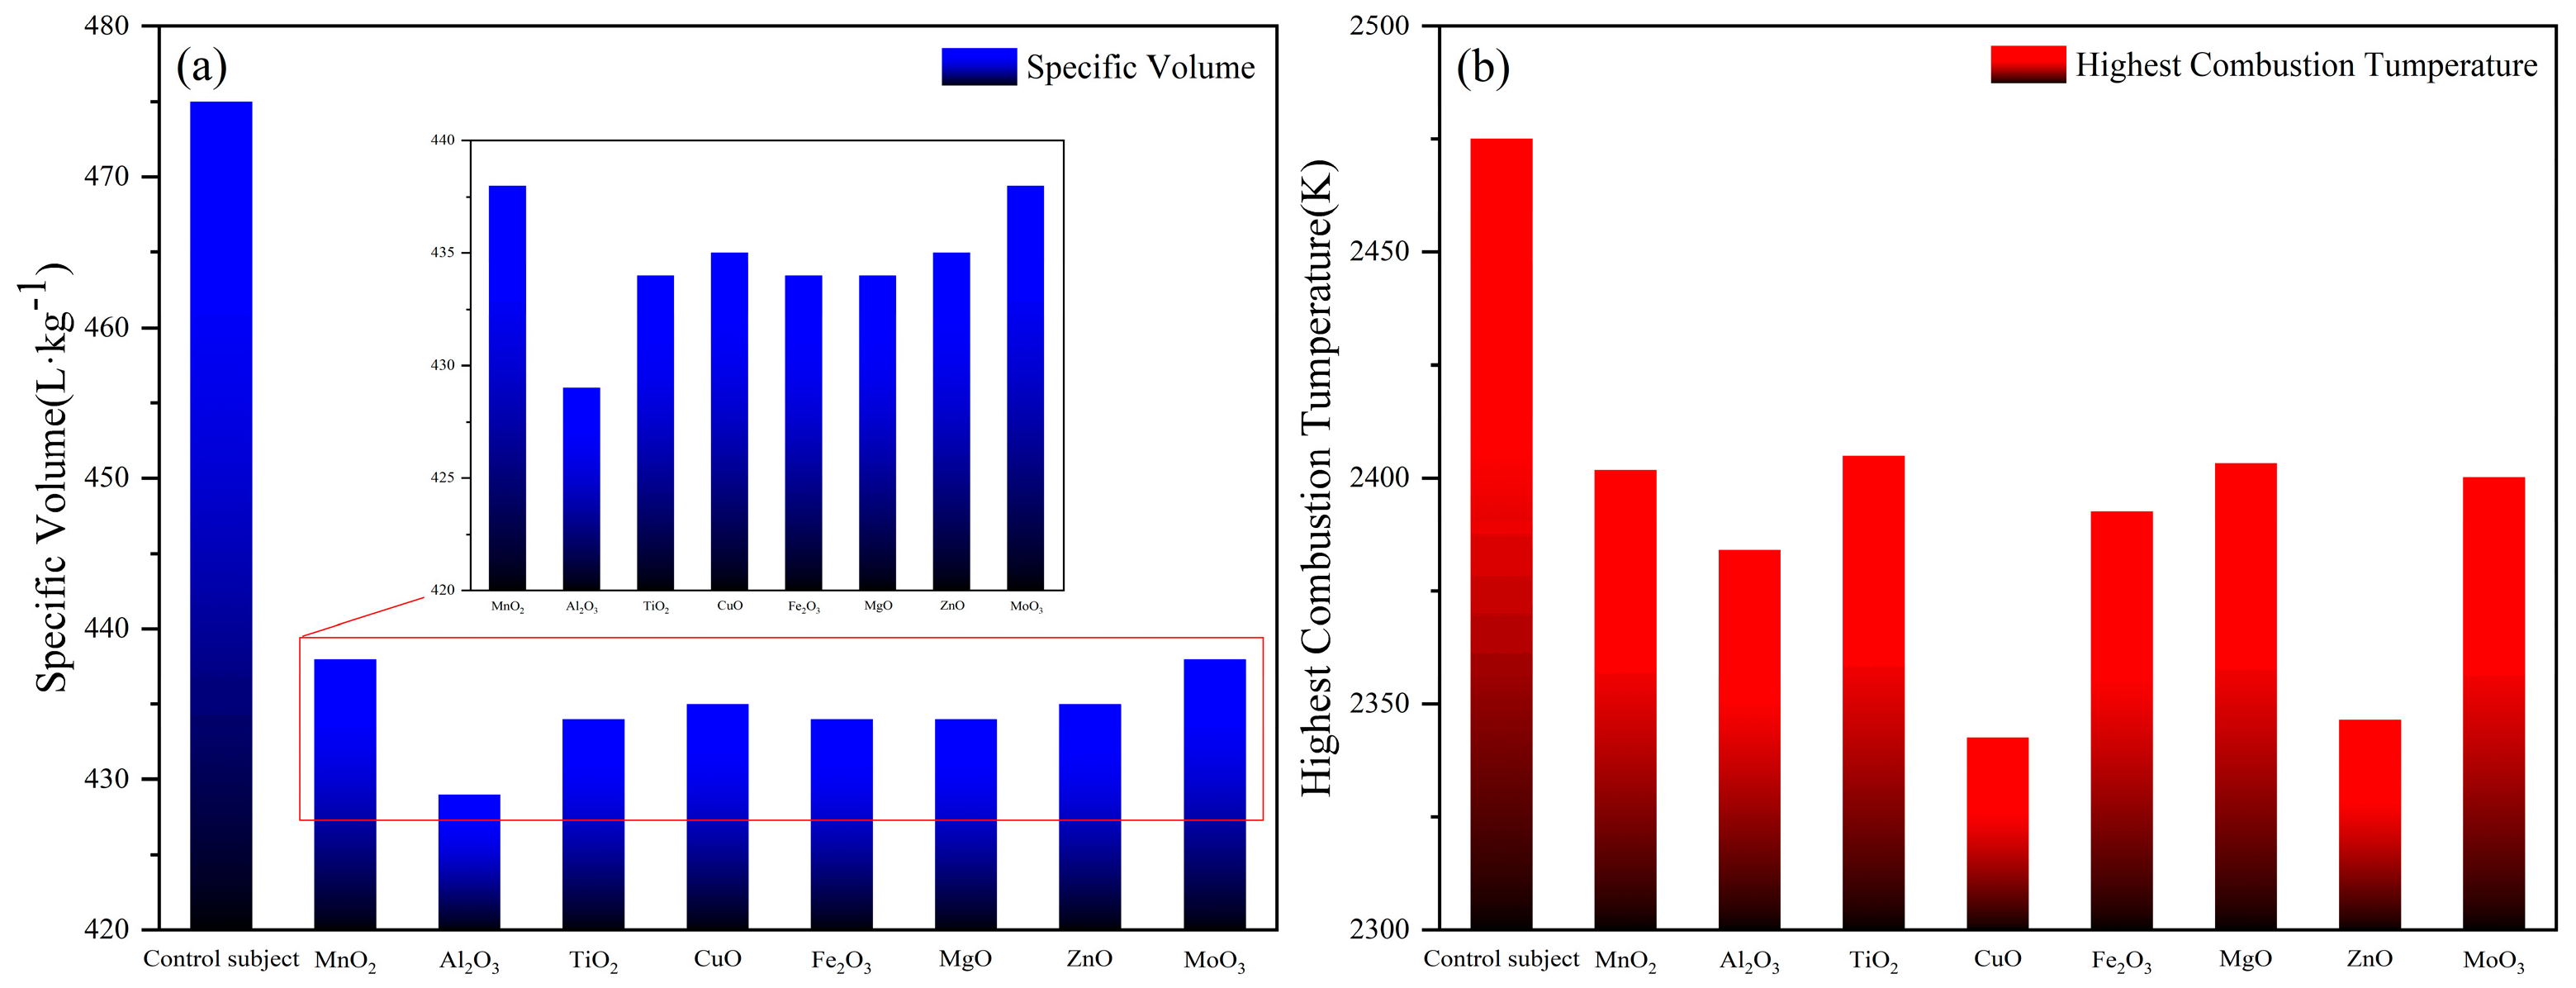
Figure 3a is the distribution of gas production of 1#-8# formula. The order of gas production for formulations 1#-8# is 8#/1# > 4#/7# > 3#/5#/6# > 2#. Since the base system is the same, the difference in gas production is not significant. However, the addition of metal oxides decreased the specific volume of the formulations by about 0.4 m
3/kg, from 4.75 m
3/kg to 4.35 m
3/kg. A higher specific volume typically implies greater gas yield, which is desirable for applications requiring rapid pressure buildup (e.g., airbag deployment, solid rocket motors). Reduced specific volume can have a complex impact on the efficiency of gas generators. A lower specific volume may reduce gas production, but formulations with low specific volume typically have a higher energy density and more complete combustion, resulting in improved thermal efficiency despite the smaller volume of the gas. If the specific volume decreases, but the pressure increases, the system can achieve a higher work output per unit mass, thus offsetting the effect of lower gas production. Therefore, the actual inflation capacity of different formulations is to be evaluated in the closed bomb device test. The high gas output indicates that the reaction products can release more gas during the reaction. In practical application, whether the gas-producing agent has sufficient aeration capacity is actually considered in the comprehensive relationship between gas production volume and gas production rate. Therefore, we designed a closed bomb device experiment in the follow-up study.
Figure 3b shows the distribution of combustion temperatures of the formulations 1#-8#. The combustion temperature order of the 1#-8# formulas is 3# > 6# > 1# > 8# > 5# > 2# > 7# > 4#. The calculated adiabatic combustion temperature is the maximum value of the theoretical combustion temperature, and the temperature will be relatively low in the actual combustion process. It is worth noting that in the 1#-8# formula with metal oxides, the maximum temperature of adiabatic combustion is 75–130 K lower than that of the control group at 2475 K. In all formulations, their high standard molar enthalpy of formation results in a calculated theoretical heat of combustion that is greater than that of the base formulation due to the addition of metal oxides as catalysts. The heat of combustion in descending order is 2# > 6# > 3# > 1# > 8# > 5# > 7# > 4#.
The main combustion products of the 5AT gas generator are N
2, H
2O, and CO
2. The requirements for gas generators are that there are few solid particles in the gas, the gas is clean, and the gas temperature is low. The gas should be less ablative, corrosive, and toxic, and the combustion is less affected by the ambient temperature [
15,
16]. In the results of the REAL program calculations, it can be found that the gas products are almost all harmless, with negligibly low percentages of NO and CO. It is noted that a very small amount (<0.3%) of NO is contained, which is in accordance with the requirements for the gas products. In addition, in order to make the combustion of the gas generator more effective, a certain degree of negative oxygen system design is adopted, which will lead to the formation of CO. The control group had the highest CO content (2.16%) in the theoretical calculation, while the CO content of the sample with metal oxides decreased slightly (<1.65%), indicating that the metal oxides had a certain oxidation property and slightly weaker oxidizing ability. In fact, the theoretical calculation did not take into account the effect of oxygen in the atmospheric environment on combustion during the combustion process, and the actual combustion process would have relatively less CO, which is in line with the requirement of the product of the gas generator.
3.2. Thermal Decomposition and Reaction Mechanism of Gas Generators
Thermal analysis can be used to study the reaction and exothermic process between the components of the agent [
17]. It is possible to determine when the decomposition process occurs and how it changes. In order to clarify the effect of metal oxides as catalytic additives on the reaction process of substances, the thermal decomposition process of 5AT-MOx was first analyzed by adding metal oxides with 5% mass content to the pure substance 5AT, respectively.
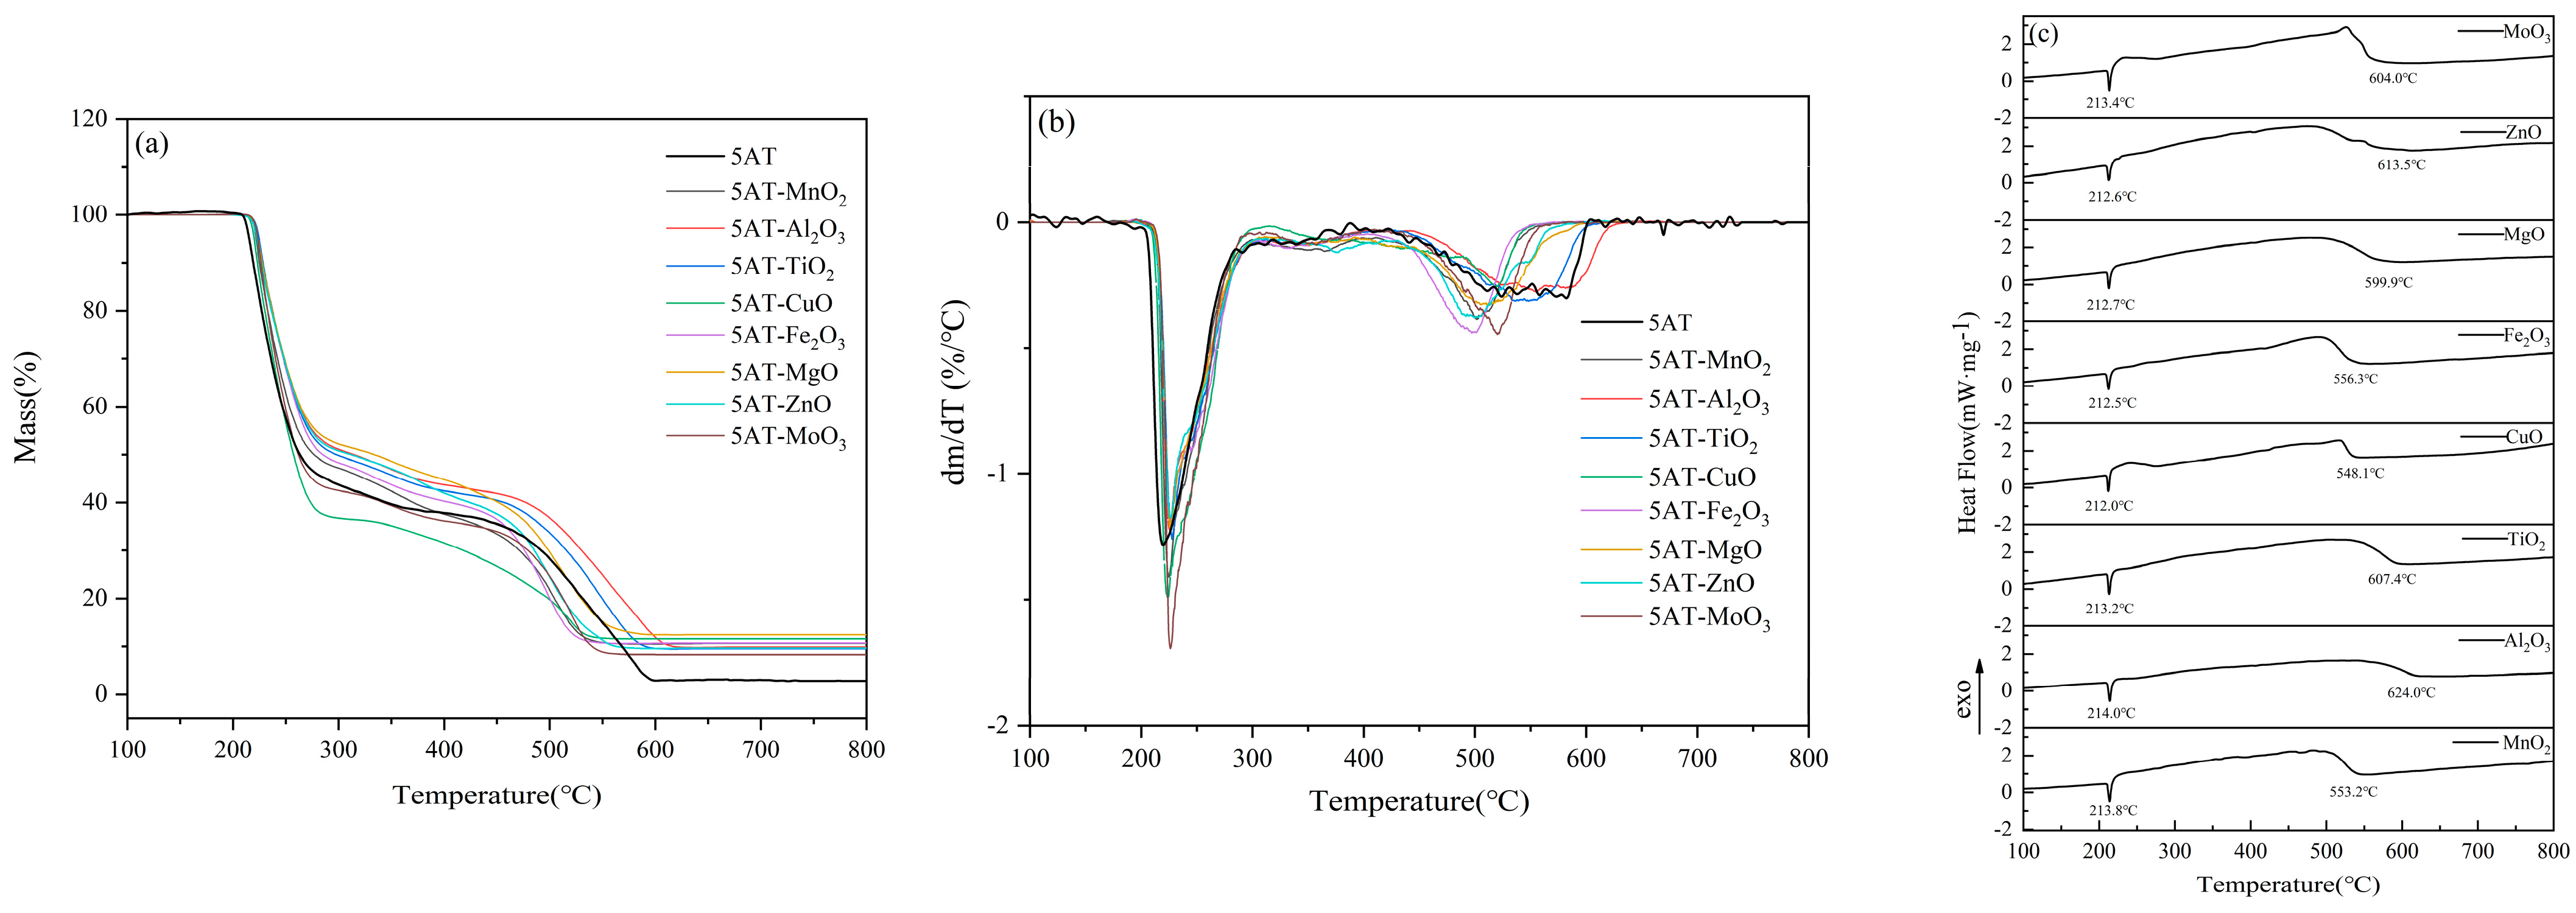
The DTG curves of the pure substance 5AT and eight 5AT-MOx samples with 5% metal oxides at 100–800 °C are shown in
Figure 4a. The DTG curve shows that the mass decomposition of the sample is mainly composed of two parts. In the first pyrolytic weight loss stage, all thermal decomposition reactions start at 200 °C and end before 310 °C with a weight loss of about 58%. The second main pyrolytic weight loss stage starts at 400 °C and ends before 630 °C. Between 310–400 °C, there is a slow process of weight loss in thermal decomposition, with a mass loss of about 10%. For the 5AT-MOx sample with eight different metal oxides added, respectively, the temperature at the beginning and end of the DTG curve was nearly the same at the first major decomposition stage. The addition of eight metal oxides made the initial reaction temperature of the samples and the peak temperature of DTG curves slightly lag behind that of the pure 5AT but did not affect the overall trend of the first weight loss stage, indicating that the temperature range of the first major thermal decomposition was not significantly affected by the additives. In the second major decomposition stage, the catalytic effect of metal oxides is significantly reflected. Compared with the wide temperature range of the gradual decomposition of the pure substance 5AT between 400–630 °C, the temperature of the 5AT-MOx samples with the addition of Fe
2O
3, ZnO, MnO
2, MgO, MoO
3 and CuO to complete this decomposition stage is about 50 °C earlier, and the peak temperature of the DTG curve is 50–100 °C earlier, while Al
2O
3 and TiO have no significant effect on the third step of 5AT decomposition. Above 400 °C, the decomposition products of 5AT gradually polymerize on the surface of the liquid phase to form melamine, and continue to polymerize to form melon, etc., which gradually decompose with the increase of temperature to form DTG decomposition peaks over a wide temperature range [
6]. Combined with the change of DTG curve, it can be inferred that the addition of metal oxides, as catalysts, attenuates the process of melamine polymerization, promotes the decomposition of melamine, makes the decomposition reaction more rapid and complete, and leads to the advance of the peak temperature and the termination temperature of the reaction.
In addition, on the DTG curve, only one obvious thermal decomposition peak appeared in each major decomposition stage of the 8 5AT-MOx samples, and the DSC curve showed the same thermal trend in
Figure 4b. The temperature of the peak reached in each stage was slightly different due to the addition of metal oxides, indicating that the addition of catalyst did not significantly change the decomposition mechanism of the pyrolysis stage in the range of 200–310 °C and 400–630 °C. As can be seen from the DTG curves, all eight 5AT-MOx samples exhibit a similar thermogravimetric trend, which may be due to the similarity of the chemical bonds and molecular structures of the 5AT samples, and the fact that their chemical properties do not change with the addition of catalysts [
10].
Unlike the multi-step decomposition process of pure 5AT and 5AT-MOx samples, the 5AT/NaIO4-MOx mixtures designed in this experiment are almost completely decomposed in a single-step reaction. The DTG curves of the eight mixture samples are shown in
Figure 5a. The thermal decomposition of gas generators can be divided into two weightless stages. The first weight loss phase occurs before 200 °C, and the mass loss is about 65%. This phase is accompanied by exothermic effect, with the exothermic peak reaching a maximum between 181–189 °C. The second stage, which occurs between 300 and 500 °C, is a slow and continuous decomposition process that results in a weight loss of about 20%. Subsequently, melting of NaI occurs above 650 °C with a gradual decrease in mass. Over the course of the reaction, the total weight loss is approximately 90%, and the residual mass is approximately 10%.
The DSC curves of the eight mixture samples are shown in
Figure 5b. It can be seen that there is a prominent exothermic peak in all the decomposition processes, indicating that the samples can release heat rapidly during the initial decomposition stage. It is noted that the DSC curve has a non-obvious recovery stage of exothermic peak, showing a step form of exothermic peak, which originated from the transformation of the 5AT decomposition product from the gas phase to the liquid phase. The liquid phase interface provides the medium for the reaction, and a series of decomposition, polymerization, and redox reactions take place on the surface of the liquid film, realizing the decomposition and reaction process of the substance from the solid phase to the gas phase and releasing heat [
18].
The DSC curve showed that the peak temperature of the 5AT/NaIO4 sample was 187.2 °C with an exothermic quantity of 159.4 J/g. After the addition of different metal oxides, the exothermic quantities of the first stage reaction were 62.5 J/g (MnO2), 67.7 J/g (Al2O3), 72.1 J/g (TiO2), 59.6 J/g (CuO), 59.9 J/g (Fe2O3), 60.8 J/g (MgO), 63.8 J/g (ZnO), and 49.6 J/g (MoO3). The heat release from large to small is TiO2, Al2O3, ZnO, MnO2, MgO, Fe2O3, CuO, and MoO3.
Observing the decomposition process curves of the mixtures, the thermogravimetric loss of the mixtures mainly occurred in the temperature range of 160–200 °C. The initial transformation temperature Te, the peak temperature Tp of the DTG curve, and the peak temperature Tm of the DSC curve were counted in the first stage of the reaction, and the results are shown in
Table 4. It is reasonable for the peak temperature of the exothermic peak to lag slightly behind the peak temperature of the DTG curve. The sample releases a large amount of heat and then reaches the peak of the DSC curve through the data acquisition of thermocouples, which makes the temperature of DSC have a certain lag. The three groups of data showed the same change trend and were sorted according to the order of initial transformation temperature, peak temperature of DTG curve, and peak temperature of DSC curve, which were Al
2O
3, MoO
3, CuO, TiO
2, MgO, Fe
2O
3, MnO
2, and ZnO. The three sets of data have the same change trend, which also reflects the consistency of the test results. This can illustrate the strength of the catalytic effect of metal oxides on the 5AT/NaIO
4 system.
The addition of metal oxides, for 5AT individuals, acted as a catalytic in the second major weight loss stage that promotes decomposition, promoting the cleavage of the polymer melamine, and making the reaction termination temperature advanced. The addition of metal oxides also has a considerable effect on gas generators. Although most of the mass is lost in one-step decomposition, the addition of metal oxides advances the peak temperature of this decomposition process by about 10 °C. The addition of metal oxides improved the heat transfer efficiency of the base system samples, leading to the advance of the reaction temperature. Due to the same decomposition trend, it can be inferred that metal oxides as catalysts improve the decomposition efficiency of gas generators without changing the decomposition process and decomposition mechanism.
The three sets of data showed the same trend, indicating that the addition of metal oxides did not change the original decomposition process of the system but only played a catalytic role in the local reaction process, resulting in the change in transformation temperature. It is worth noting that although the initial transformation temperature of all samples was earlier than that of the control group, the peak temperature of the DTG curves and the DSC curves were different. Among them, the peak temperature Tp of the DTG curves of the samples with the addition of MnO2, Fe2O3, MgO, and ZnO were lagging behind that of the control group, which indicated that the conversion rate of the reaction of the system was reduced after the addition of these four metal oxides. The peak temperature Tm of the DSC curves of the samples with the addition of MnO2 and ZnO lagged behind that of the control group, indicating that the catalytic effect of these metal oxides on the samples in the reaction process was not satisfactory. Comparatively speaking, the metal oxides with better catalytic effect are Al2O3, MoO3, and CuO.
3.3. Combustion Performance of Gas Generators
The combustion behavior was recorded by the thermal imaging camera to get the combustion state of the samples during combustion.
Figure 6 shows the screenshot of the thermal image of the sample when it reached a stable combustion state. The combustion flame height and flame area of the control group without metal oxide were 20.27 cm and 28.53 cm
2, respectively. The flame area and flame height during the combustion process of the samples can reflect the intensity of the reaction to a certain extent [
17]. The addition of metal oxides as catalysts can change the combustion state of the samples under the same conditions of the base formulation. From the thermal image screenshot of the combustion state, it can be found that the addition of metal oxides has weakened the flame height and area of the agent during combustion to a certain extent. Among them, the combustion state of the sample with the addition of MoO
3 showed the best performance.
The combustion temperature and combustion rate can evaluate the performance of the gas generators. In general, it is required that the temperature of the gas generator is as low as possible and that it reacts rapidly and produces a large amount of gas [
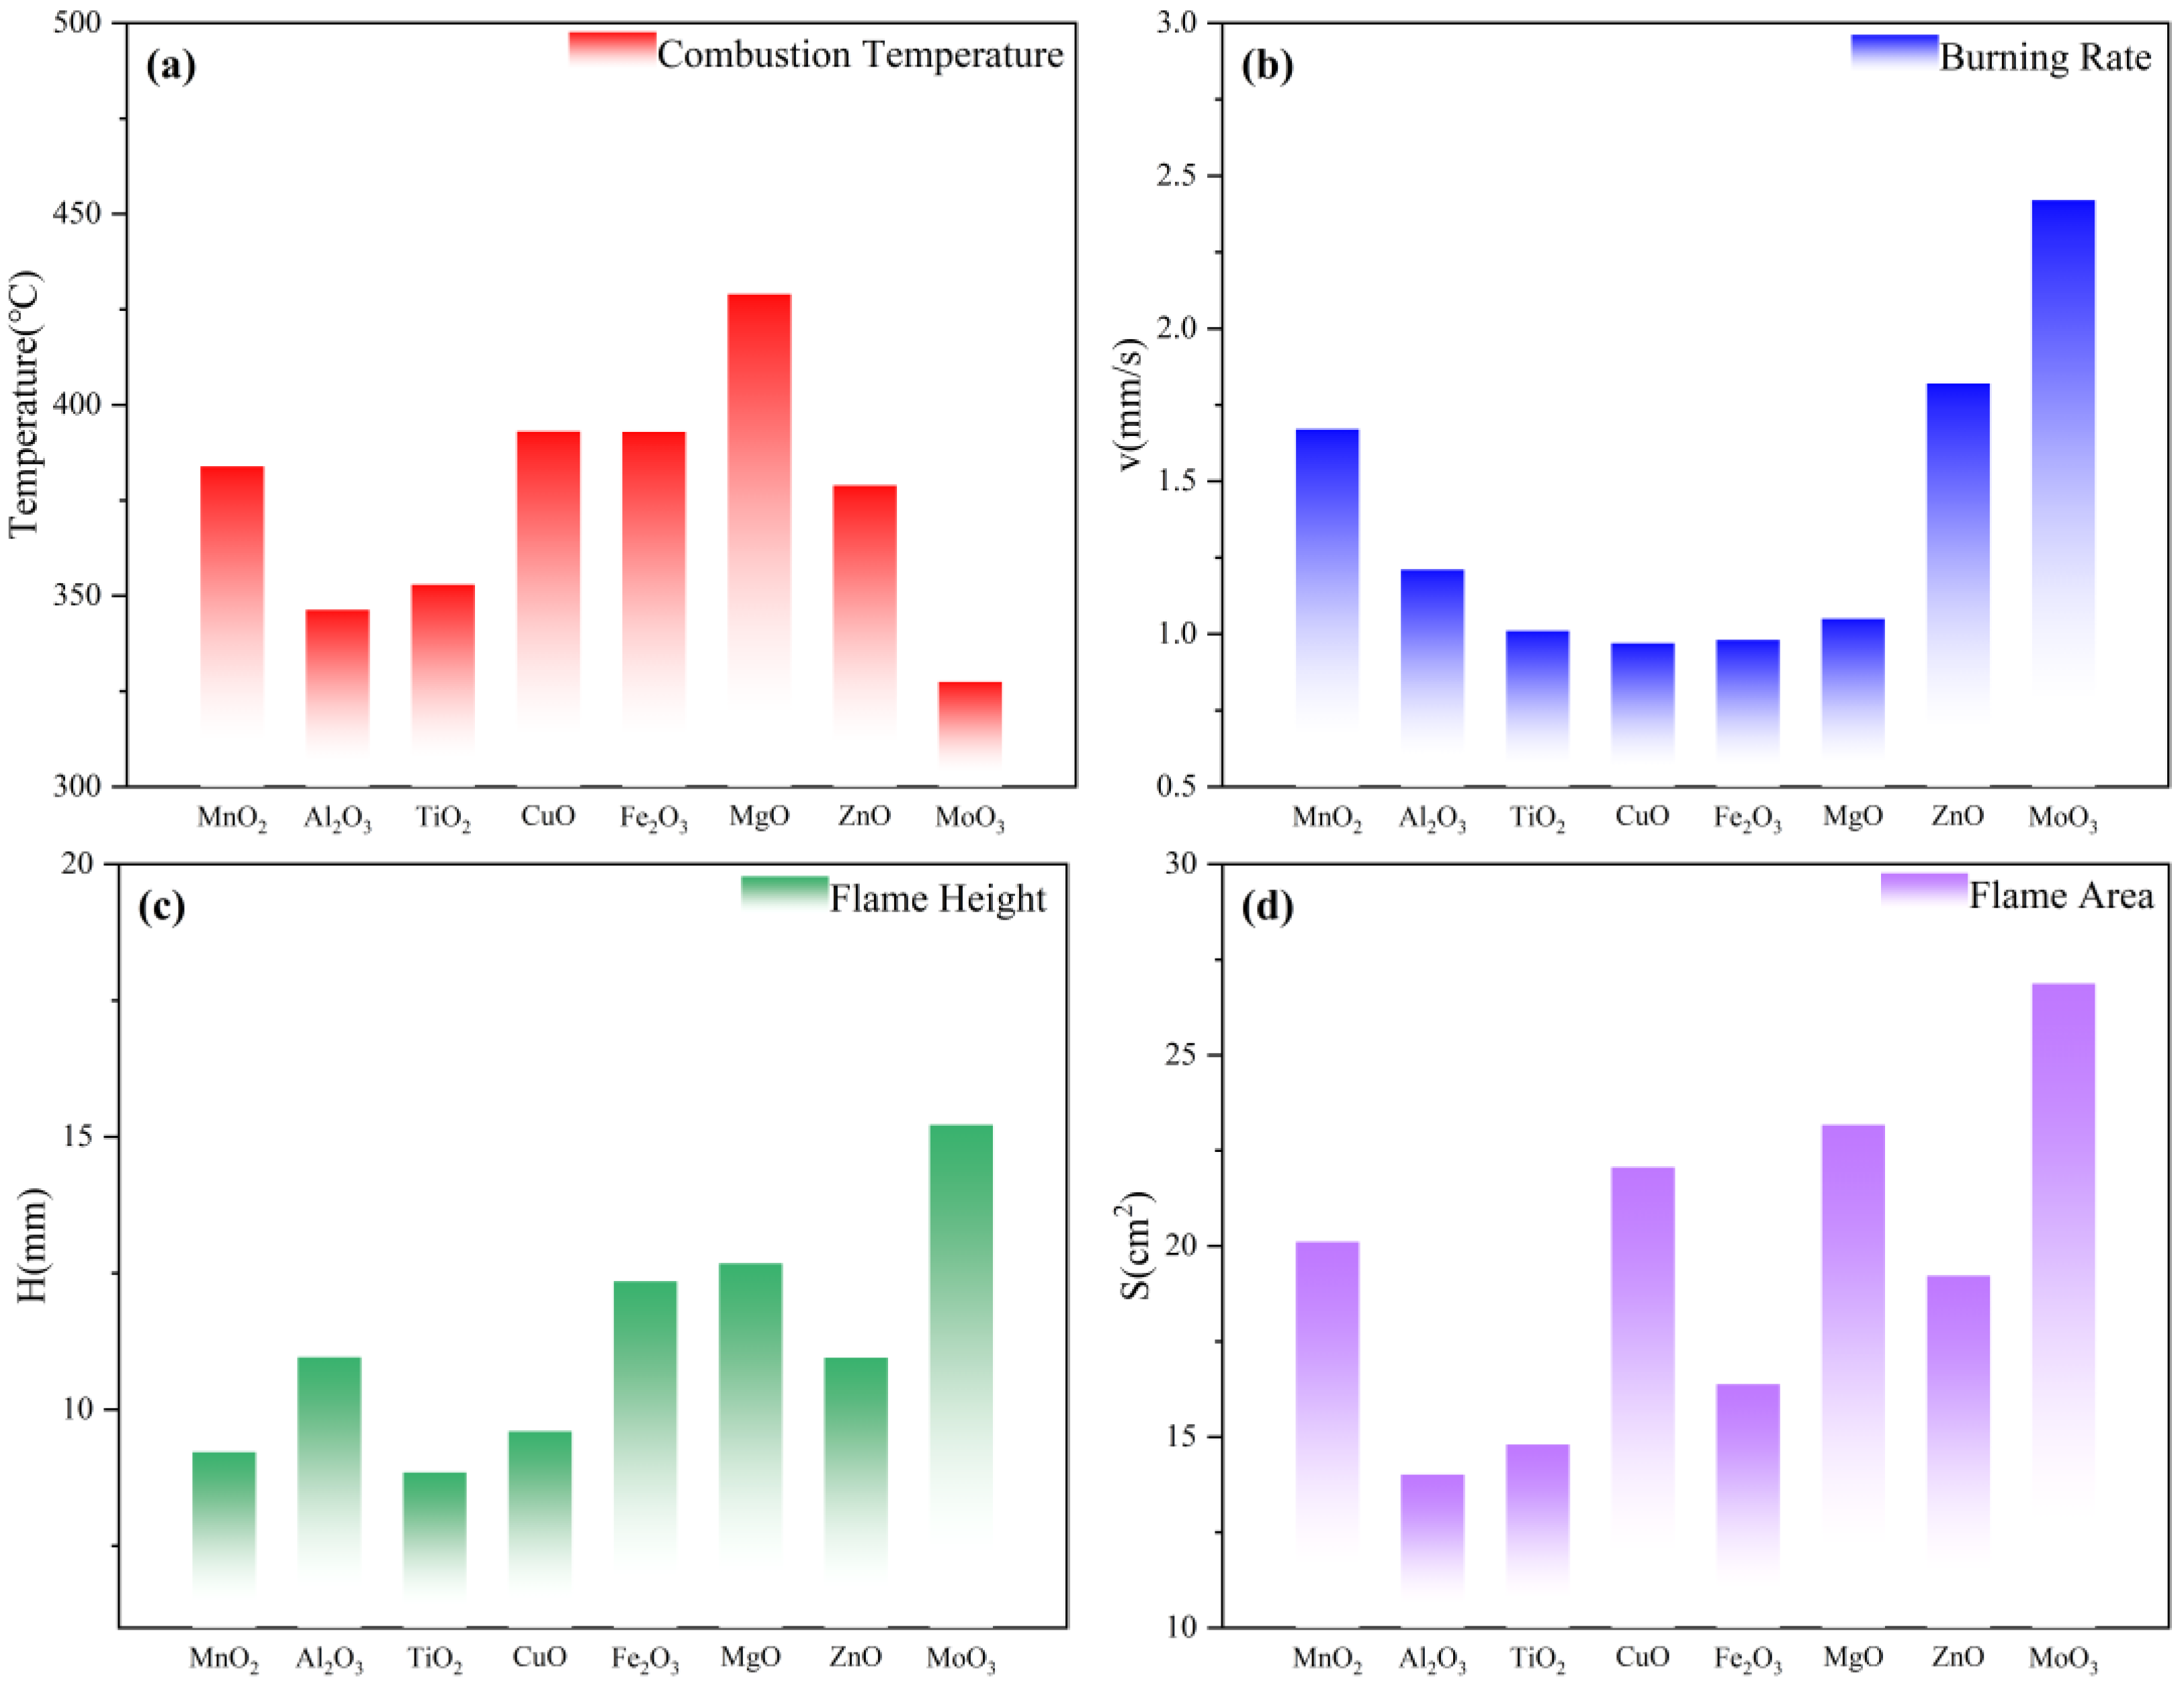
15]. The temperature and combustion velocity of the gas generator samples with different metal oxides as additives in the stable combustion state are shown in
Figure 7a,b. The combustion temperature of the control group was 381.5 °C, and the combustion velocity was 4.1 mm/s. The combustion velocities of the gas generators with the addition of metal oxides somewhat showed the opposite of the combustion temperature. Among them, the combustion temperature of the formula with MnO
2, CuO, Fe
2O
3, and MgO increased, while the combustion temperature of the formula with Al
2O
3, TiO
2, ZnO, and MoO
3 decreased. All the formulations showed a tendency to decrease the combustion rate, indicating that the addition of metal oxides inhibits the combustion rate of gas generators. CuO has the most obvious inhibitory effect on the combustion rate. MoO
3 performs the best among the selected metal oxides due to its lower combustion temperature and relatively higher combustion rate, which is fully in line with the formulation design requirements of gas generators. MoO
3 has better combustion performance as an additive, which is evidenced by the highest flame height and the largest flame area in
Figure 7c,d. From the perspective of combustion performance, the combustion temperature from high to low is 6# > 4# > 5# > 1# > 7# > 3# > 2# > 8#. The burning speed from high to low is 8# > 7# > 1# > 2# > 6# > 3# > 5# > 4#. Evaluating the addition of eight metal oxides in terms of combustion performance, MoO
3 was the most effective.
Although the trace addition of metal oxides can achieve the catalytic effect on the decomposition of gas generators on the microscopic scale, in the actual combustion process, because it cannot form a macroscopic heating surface of the thermal diffusion rate, it will absorb a part of the heat of the reaction of the agent during the heat transfer process, resulting in the reduction of the burning rate [
11]. However, once the metal oxide additive is involved in the reaction, it will increase the combustion temperature of the reaction to a certain extent, which is reflected in the actual testing process. The addition of metal oxides caused the reaction region of 5AT/NaIO
4/MOx to concentrate on the surface of the agent rather than the meteorological combustion area after decomposition, leading to the reduction in the combustion flame height and the decrease in the flame area. Different metal oxides have different properties of their own, which also leads to differences in combustion phenomena. It was noted that the diffusion of hot solid particles from the solid phase to the meteorological zone was clearly observed during the combustion process for the formulation with the addition of MoO
3. This behavior directly leads to the alleviation of the metal oxides on the combustion temperature accumulation effect in the solid phase region. At the same time, the high-temperature diffusion particles provide an environment for the combustion of decomposition products, resulting in a better combustion performance of the formulation 5AT/NaIO
4/MoO
3, which is manifested in the higher flame height and larger flame area. It can be speculated that on the combustion surface, MoO
3 is embedded in the form of particles. When 5AT decomposes, these particles are expelled into the gas phase region by the gas products, accelerating the backward movement of the combustion surface. The burning state of the agents can also be confirmed in the thermal image, and the more particles in the combustion flame, the faster the sample burns. During the combustion of 5AT/NaIO
4/MoO
3, there is a certain amount of glowing solid particles released from the solid phase into the gaseous region. While metal oxides inhibit flame propagation, MoO₃ strikes the best balance—lowering temperature without severely compromising combustion efficiency. Its ability to enhance gas-phase reactions makes it ideal for clean, high-output gas generators, though particle emissions demand careful engineering. Other oxides (e.g., CuO) are better suited for high-temperature niches.
3.4. Closed Bomb Device Test of Gas Generators
The pressure inside a closed bomb device is an important indicator of gas production [
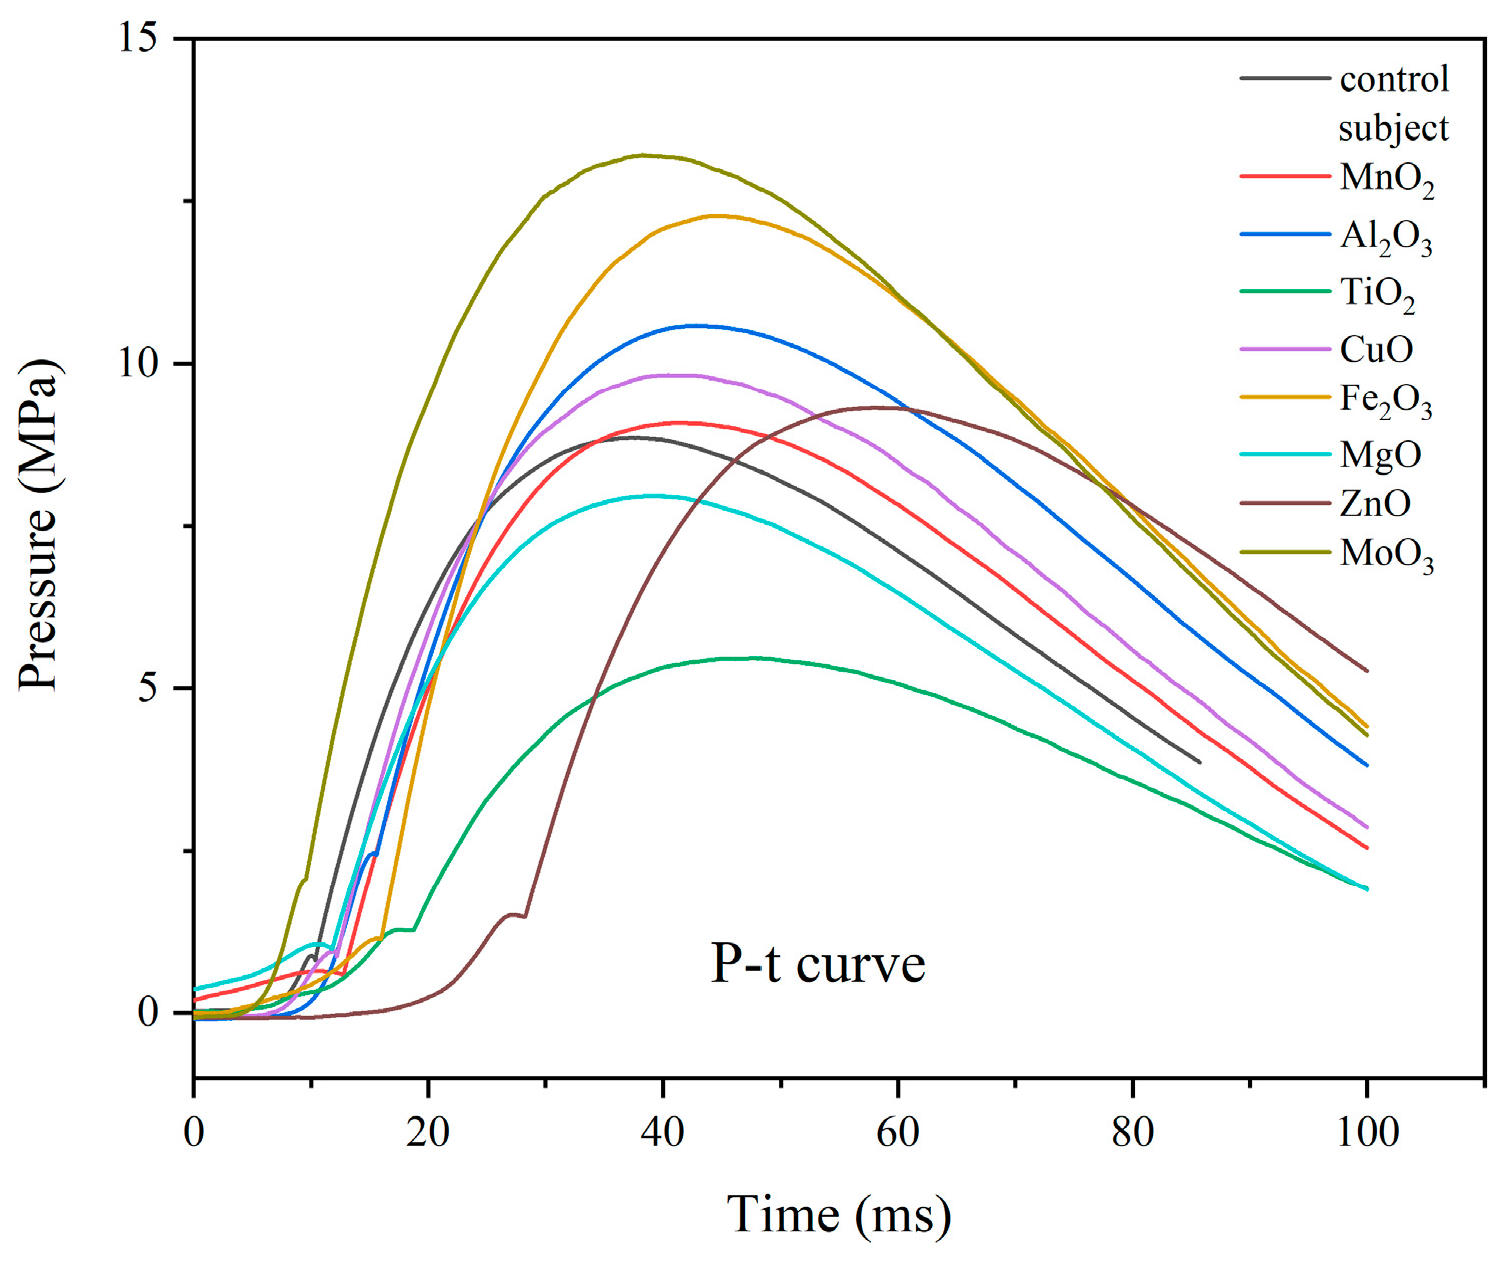
15]. The pressure-time curves obtained by the closed bomb device test during the combustion of eight 5AT/NaIO
4/MOx mixtures are shown in
Figure 8. The maximum pressure (P
max) and the time taken to reach the maximum pressure (t
max) were obtained from the P-t curves and recorded in
Table 5. The average rate of pressure rise from the start of combustion to the maximum pressure is ΔP
max/Δt
max, which reflects the rate of chemical reaction. As can be seen from
Figure 8, the time of the samples with added metal oxides to reach the peak pressure was slightly longer than that of the control group. The peak pressure of 3# and 6# samples with TiO
2 and MgO added, respectively, is smaller than that of the control group. The peak pressure of 3# formula with TiO
2 added has the most obvious change in the peak pressure, with a maximum pressure of 5.60MPa. The addition of the rest of the metal oxides makes the pressure peak increase, among which the best performance is the 8# sample with MoO
3 added, which not only has the highest peak pressure but also has the shortest time to reach the peak pressure. Compared with the ΔP
max/Δt
max data (ΔP
max/Δt
max = 0.241 MPa/ms in the control group), the gas production performance of the 8# formula is better. The ΔP
max/Δt
max value of the 8# sample is the highest, indicating that the formula 5AT/NaIO
4/MoO
3 has the best gas production performance. The value of the 5# formula is lower than the 8# formula but better than other formulas. The ΔP
max/Δt
max values of the 2# and 4# samples were slightly higher than that of the control group. The ΔP
max/Δt
max values of the 1#, 3#, 6#, and 7# samples were all smaller than that of the control group, and although the peak pressures of the 1# and 7# samples were higher than that of the control group, the ratios of the 1# and 7# samples were smaller than that of the control group due to the longer time taken to reach the peak pressure. In addition, the 7# formula has the longest time to reach the peak pressure. In terms of combustion temperature, the gas producer used in the airbag should have a low combustion temperature to ensure that the output gas can be quickly cooled down to meet the needs of the application. The 8# sample with MoO
3 added still had the highest combustion pressure despite the lowest combustion temperature, indicating its maximum gas production capacity. The addition of MoO
3 to the 5AT/NaIO
4 gas producing agent system can increase the gas production rate and gas production while maintaining the lowest combustion temperature, which is conducive to the practical application of the system as an airbag. At the same time, it is necessary to pay attention to the calculation of gas production and design a reasonable gas producing agent content to ensure safe and reliable inflation behavior.
3.5. Studies of Thermodynamic Parameters and Thermal Safety
The objective of studying kinetics is to obtain a kinetic model and to calculate the kinetic triple factors
A,
Eα, and
f(α), where
f(α) is the differential form of the kinetic reaction mechanism function, which represents the functional relationship between reaction rate and reaction conversion. The integral form of the reaction mechanism function is usually denoted as
g(α) [
19].
According to the Arrhenius equation [
20], the kinetic equation under non-isothermal conditions can be expressed as Equation (5):
where
A is the pre-exponential factor,
Eα is the activation energy,
R is the molar gas constant (8.314 Jmol
−1K
−1),
T is the thermodynamic temperature,
α is the reaction conversion rate, and
β is the linear heating rate. In this study, the pyrolysis kinetics of samples will be analyzed using model-free methods. The conversion rate α can be defined as Equation (6) [
21], and the mass values are derived by the TG curves:
where
m0 is the initial mass;
mt is the mass at a given temperature; and
mf is the final mass.
The advantage of the model-free method (Flynn-Wall-Ozawa method) is that it can bypass the choice of the reaction mechanism function and directly find the reaction activation energy Eα, avoiding the possible errors due to the assumption of the reaction mechanism function.
The Flynn-Wall-Ozawa (FWO) method is an integral method with an algebraic expression as shown in Equation (7), which can be used to make a plot of lg
β versus 1/
T from the peak temperature data or temperature data obtained at a certain conversion and fit it linearly. Based on a slope of 0.4567
E/
RT, the activation energy,
Eα, is calculated [
22,
23].
As can be seen from the previous discussion, the 8# sample with MoO
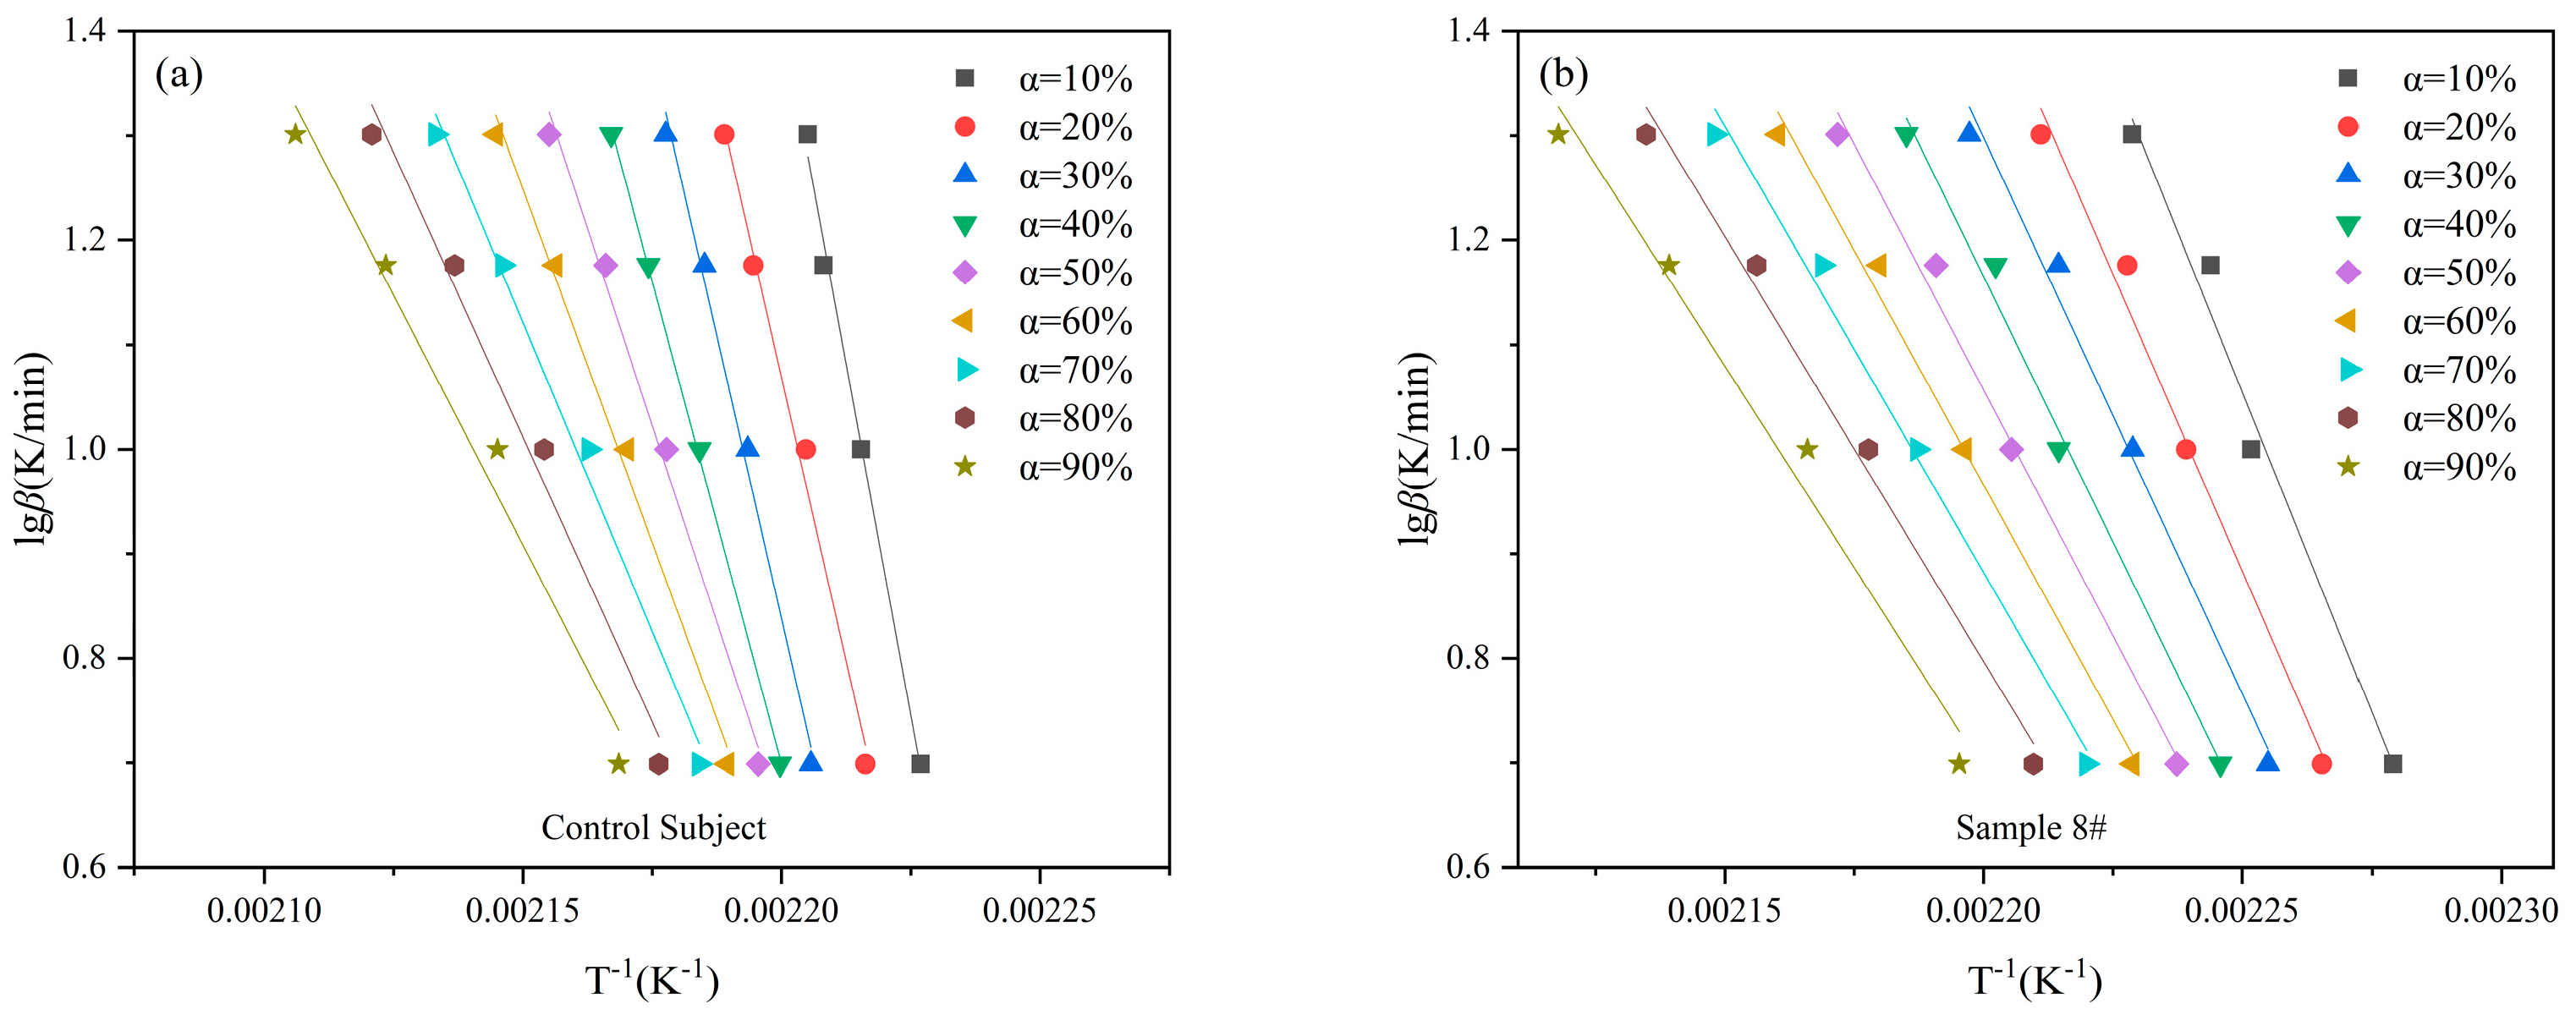
3 has a lower decomposition temperature and better combustion performance, which indicates that the 8# sample is a more potential gas producing agent. In this study, the activation energy (
Eα) and pre-exponential factor (
A) of the control subject and 8# sample were calculated using the Flynn-Wall-Ozawa (FWO) method. The data were plotted with 1/
Tp as the x-axis and lg
β as the y-axis, and linear regression was performed to obtain the straight lines as shown in
Figure 9a,b. The calculated kinetic parameters are presented in
Table 6. The activation energy values obtained from both methods are nearly identical, and the correlation coefficients of the fitted curves are close to 0.99, indicating a good fit. The activation energy of the control subject is significantly higher than that of the 8# sample, suggesting that after the addition of MoO
3, the decomposition reaction of the substance is more likely to occur. We noticed that the activation energy values calculated by the FWO method varied greatly with the change of conversion rate. Therefore, the Vyazovkin method was used for calculations at the same time.
For the Vyazovkin method [
24], the Eα value at different conversions can be obtained by minimizing the following function:
where
i,
j are the different heating rates, and
n is the total number of heating rates.
Andrzej Mianowski [
25] proposed a simple calculation of the Vyazovkin method. The activation energy Eα for a constant conversion degree is possible to directly determine from Equation (9).
For N heating rate, the activation energy is calculated as the geometric mean according to Equation (10).
The activation energy at each conversion rate calculated using this method and the average activation energy are recorded in
Table 6. The average values calculated by the two methods are similar.
A low activation energy barrier means that the material requires less external energy to initiate decomposition or combustion. Mechanical stresses (e.g., friction, impact) are more likely to form “hot spots”, increasing the risk of accidental ignition. MoO₃ may act as a catalyst, reducing the thermal stability of 5AT and promoting rapid energy release upon impact. In the case of continuous vibration, the friction between the chemical particles may accumulate heat, which may cause thermal disasters. It is necessary to use encapsulation technology and thermal insulation layer coating technology to prevent accidental damage. At the same time, the storage environment is strictly monitored to avoid heat accumulation at ambient temperature and possible mechanical vibrations. The box is designed to protect against the impact of accidental drops.
Thermal safety and thermal kinetic parameters are crucial for high-nitrogen energy-containing materials. The activation energy and correlation coefficient of control subject and sample 8# obtained by the FWO method are listed in
Table 6. Compared to the activation energy of the control subject, which is 302 kJ/mol, there is a roughly 130 kJ/mol decrease in the activation energy of sample 8#, indicating that the system is more reactive with the addition of metal oxide MoO
3. Thermal kinetic data obtained by the FWO method are used as input parameters here. As the heating rate approaches zero (β → 0), the values of
T00,
Te0, and
Tp0 correspond to the values of
T0,
Te, and
Tp [
26], which are obtained by linear regression as follows:
where
b,
c,
d, and
e are coefficients.
Te0 equals self-accelerating decomposition temperature,
TSADT, referring to the lowest ambient temperature at which temperature increase of a chemical substance is at least 6 °C in a specified commercial package during a period of seven days or less. During storage and handling process,
TSADT is crucial for accessing safety management of self-reactive propellants, pyrotechnics, and explosives.
Critical ignition temperature (
TTIT) and thermal explosion temperature (
Tb) are both vitally pivotal parameters for energetic materials [
26]. Therein,
Tb is defined as the lowest temperature to which a specific charge might be heated without undergoing thermal runaway.
TTIT corresponds to the substitution of
Ee0 and
Te0, while
Tb is obtained by substituting
Ep0 and
Tp0.
As listed in
Table 7, high values of
TTIT and
Tb represent that the occurrence of transition from thermal degradation to thermal explosion is not easy to happen. However, this temperature is still low compared to 5AT.
Gibbs free energy(Δ
G≠), enthalpy(Δ
H≠), and entropy of activation (Δ
S≠) are critical thermodynamic parameters of activation, which could be obtained by Equations (14)–(16) when the values determined at
T =
Tp0,
Eα =
Ek, and
A =
Ak [
27,
28].
where
kB is the Boltzmann constant, and
h is the Plank constant. Computed values of Δ
G≠ and Δ
H≠ are all positive, indicating that the sample endothermic decomposition reaction could not proceed without heating, which belongs to the non-spontaneous reaction. It is noted that the temperature range here is less than 200 °C. Therefore, attention should be paid to the design of the thermal insulation layer during the application process to prevent possible safety hazards due to a temperature increase caused by the external environment.
The reaction rate (
k) of thermal decomposition can be calculated by Formula (17).
The activation energy Eα and pre-exponential factor A calculated by the FWO method were substituted into this formula, and the ambient temperature was set to 25 °C (298.15 K). In contrast, it can be seen that the reaction rate of 5AT/NaIO4 pyrolysis is accelerated after the addition of metal oxide MoO3.


