
Experimental Study on Uniaxial Compression Stress-Strain Relationship of Hybrid Fiber-Reinforced Coral Sand Ultra-High Performance Concrete

Abstract
1. Introduction
2. Materials and Methods
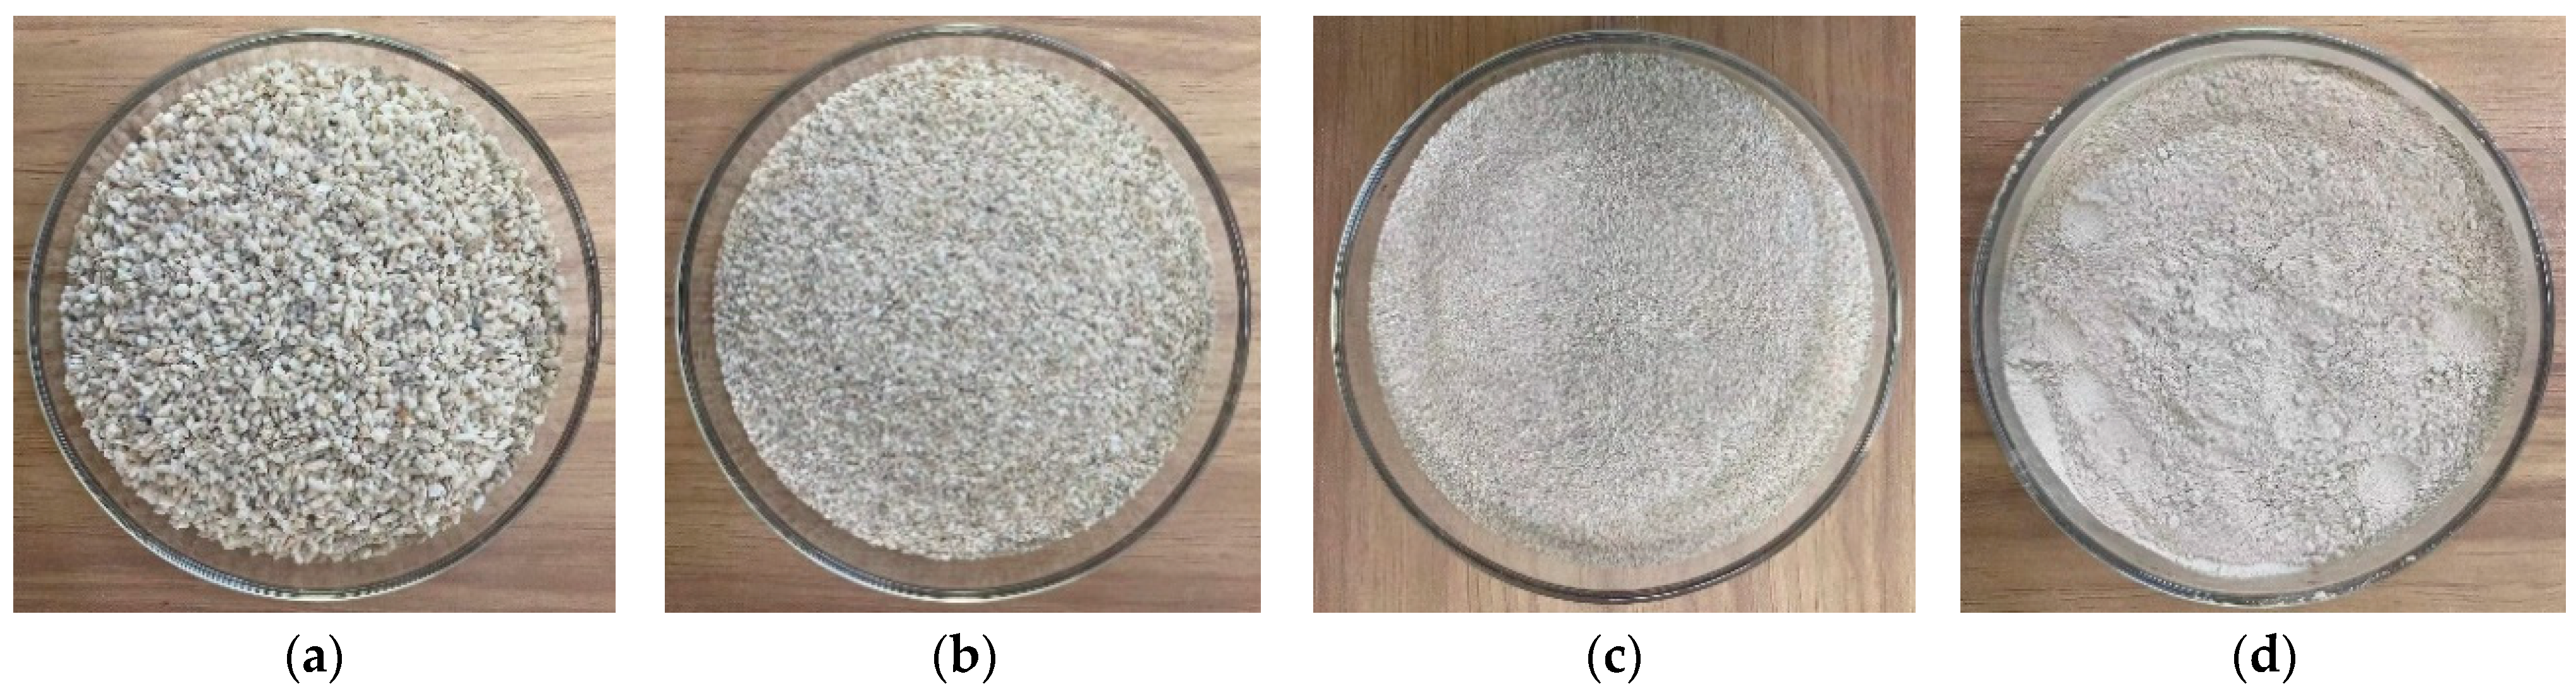
2.1. Raw Materials and Mix Proportions
2.2. Preparation of CSUHPC
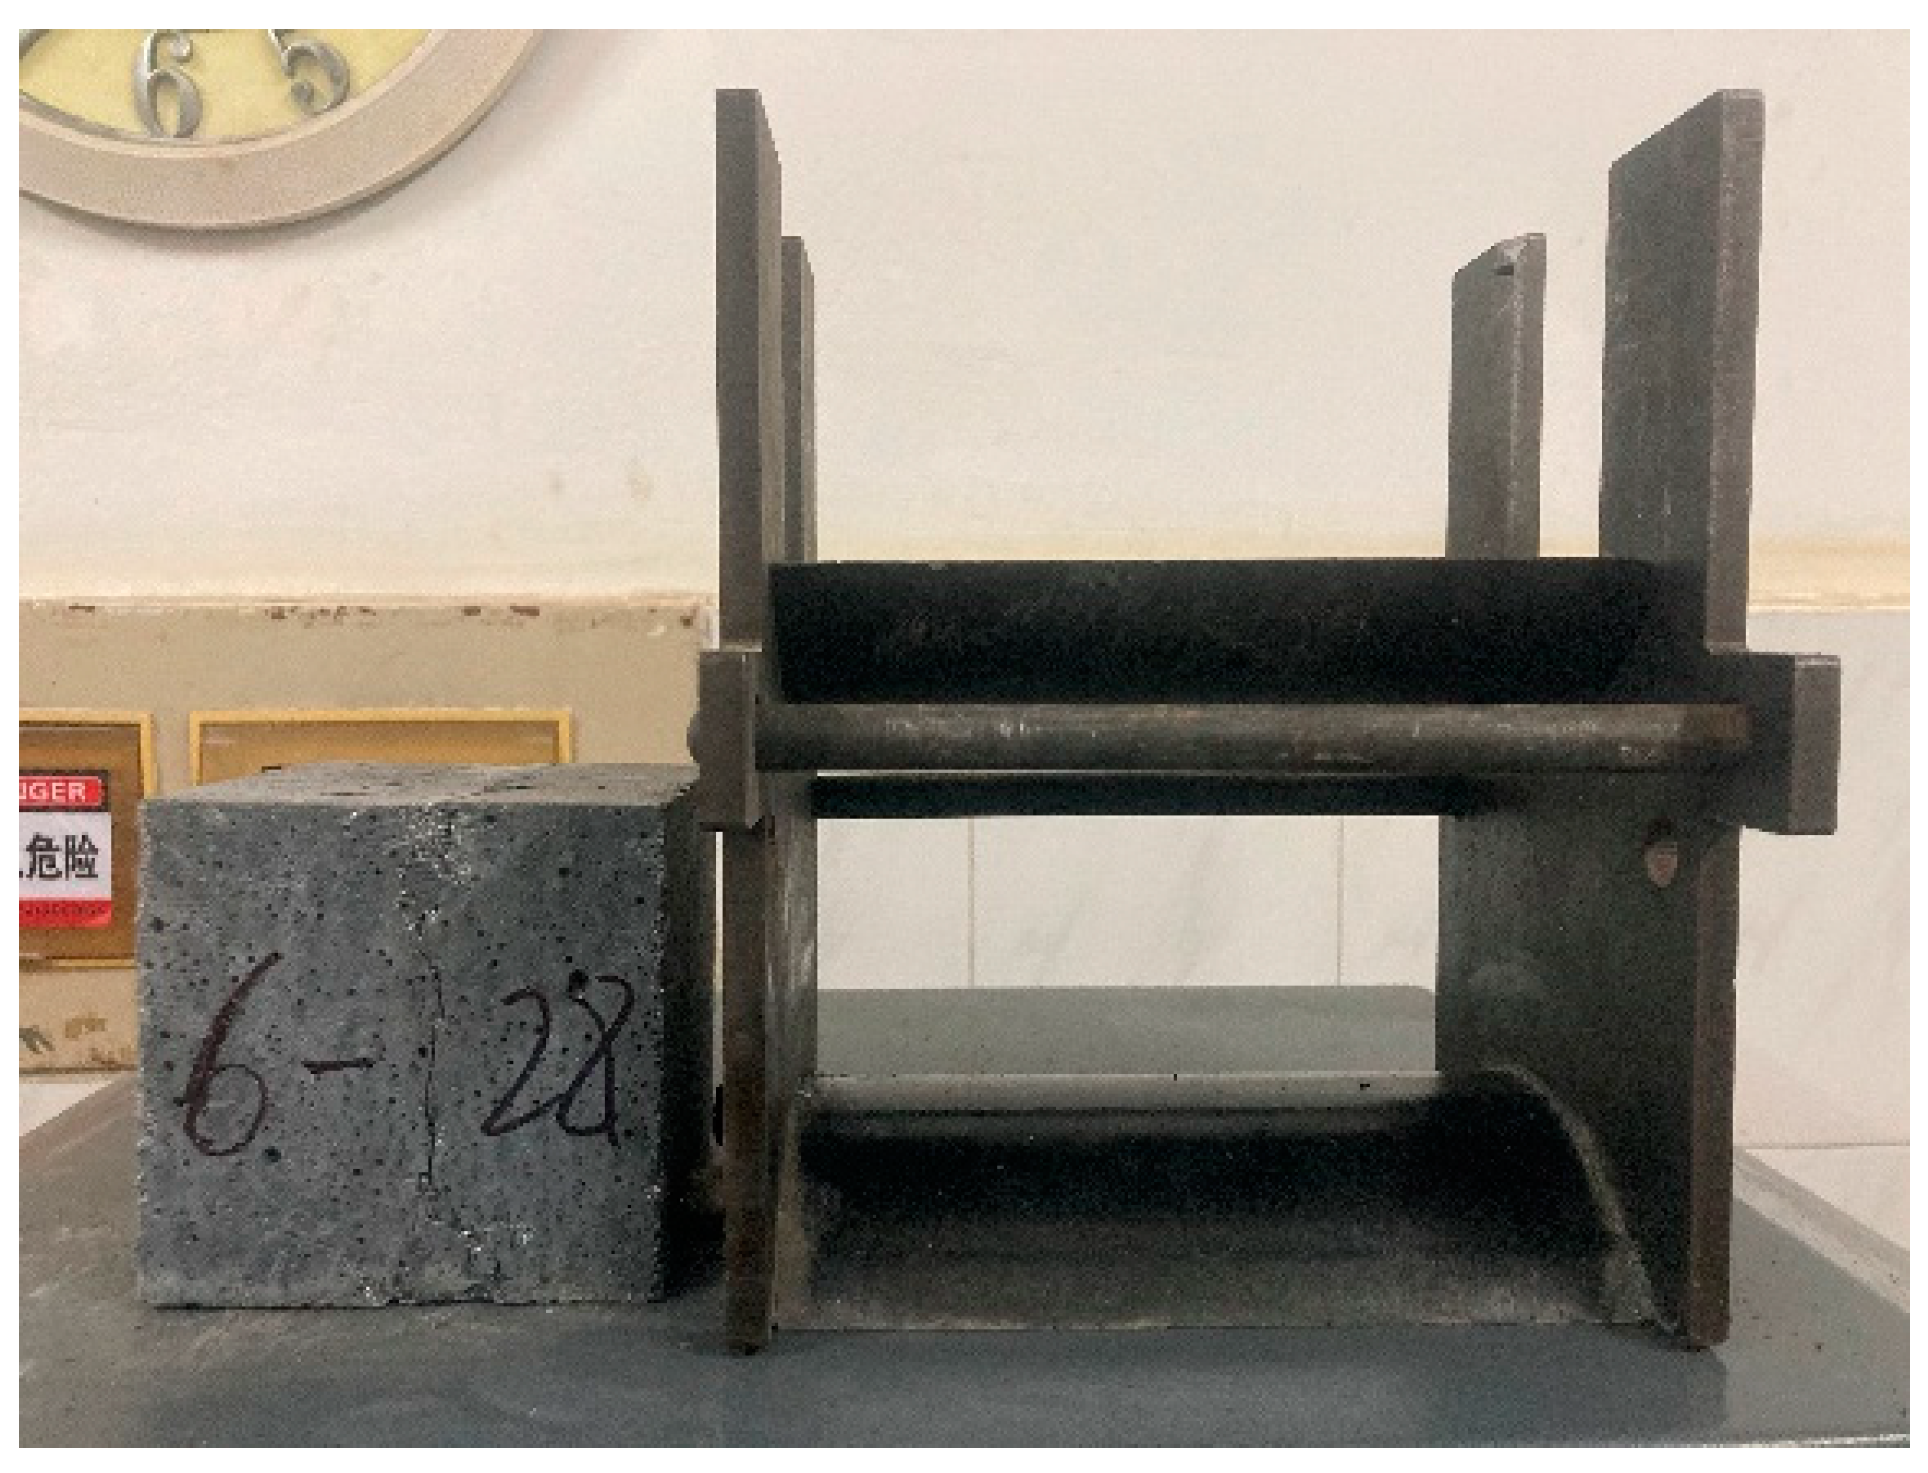
2.3. Compressive Strength and Splitting Tensile Strength Tests of CSUHPC Cubes
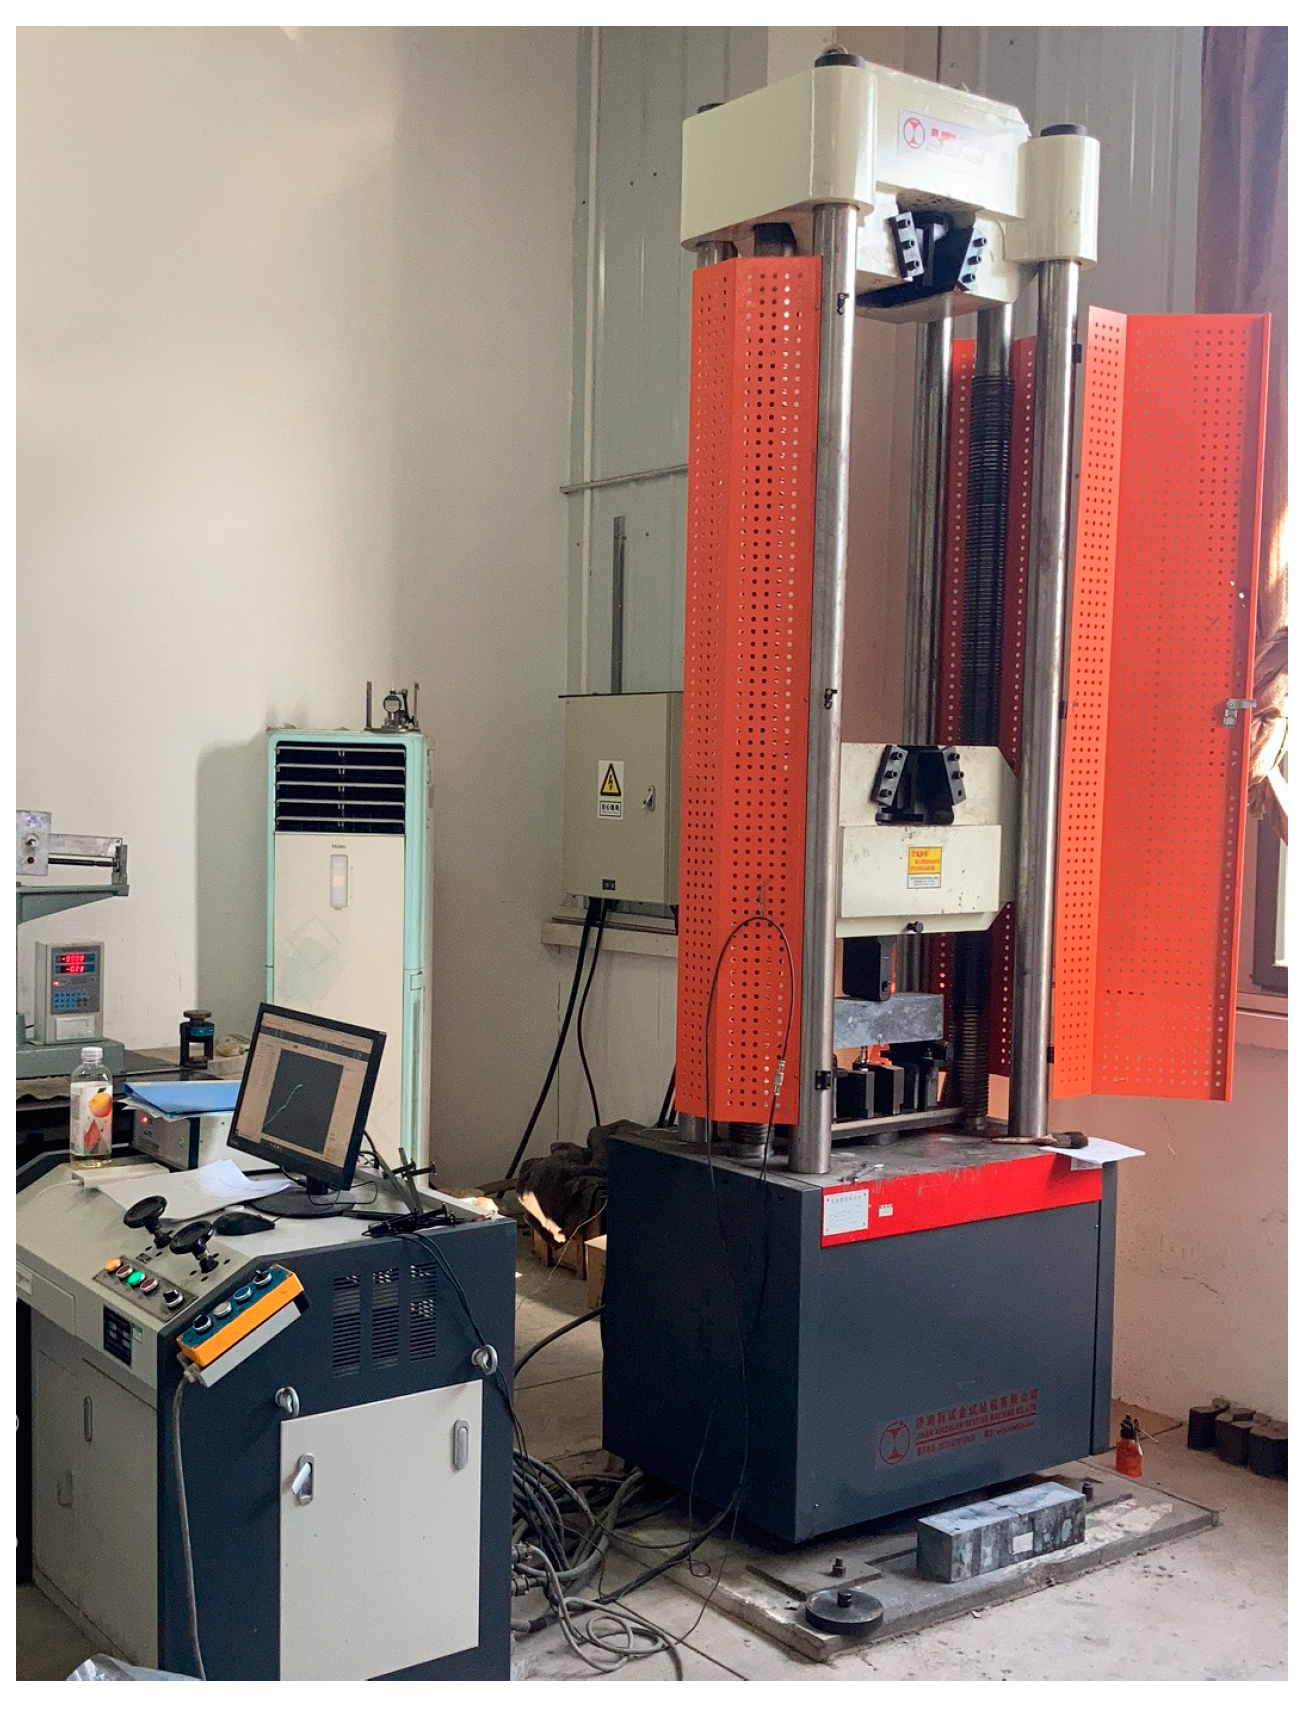
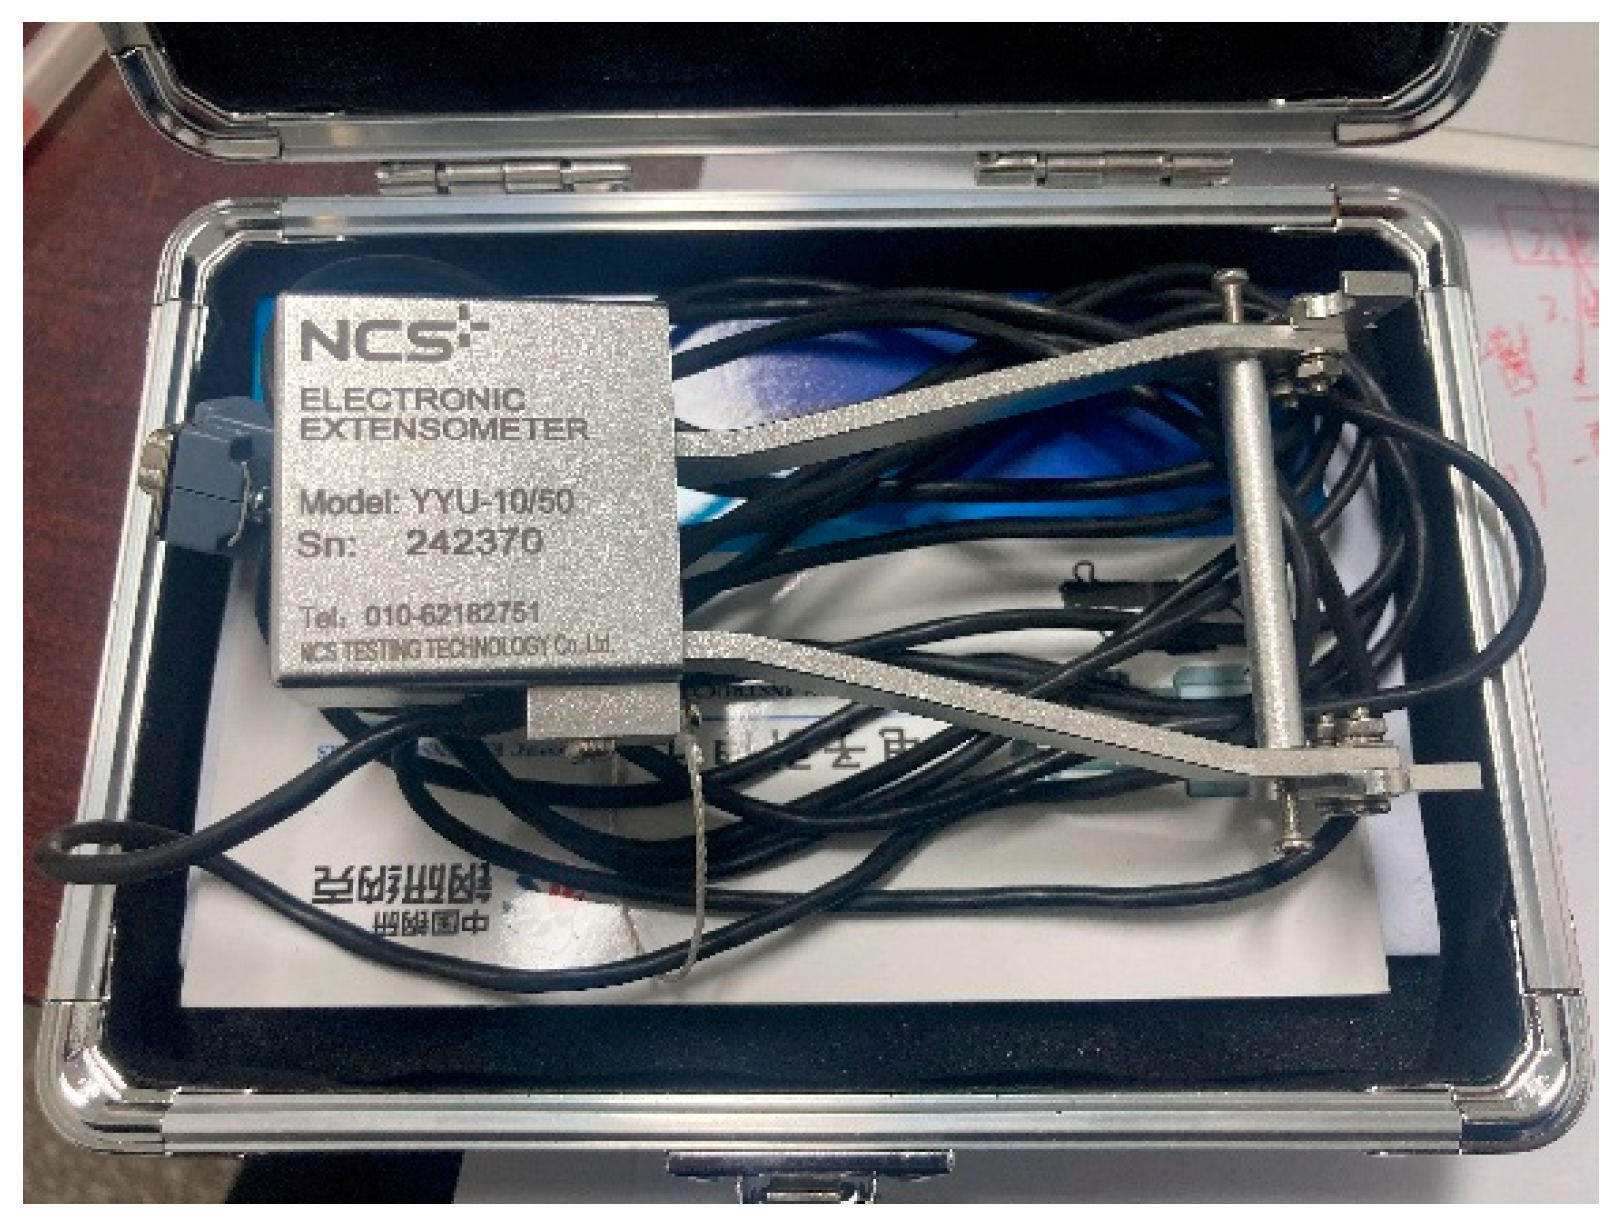
2.4. Compressive Stress–Strain Curve Test of CSUHPC Cylinders
2.5. Performance Assessment
3. Results and Discussion
3.1. Strength Tests of CSUHPC Cubes
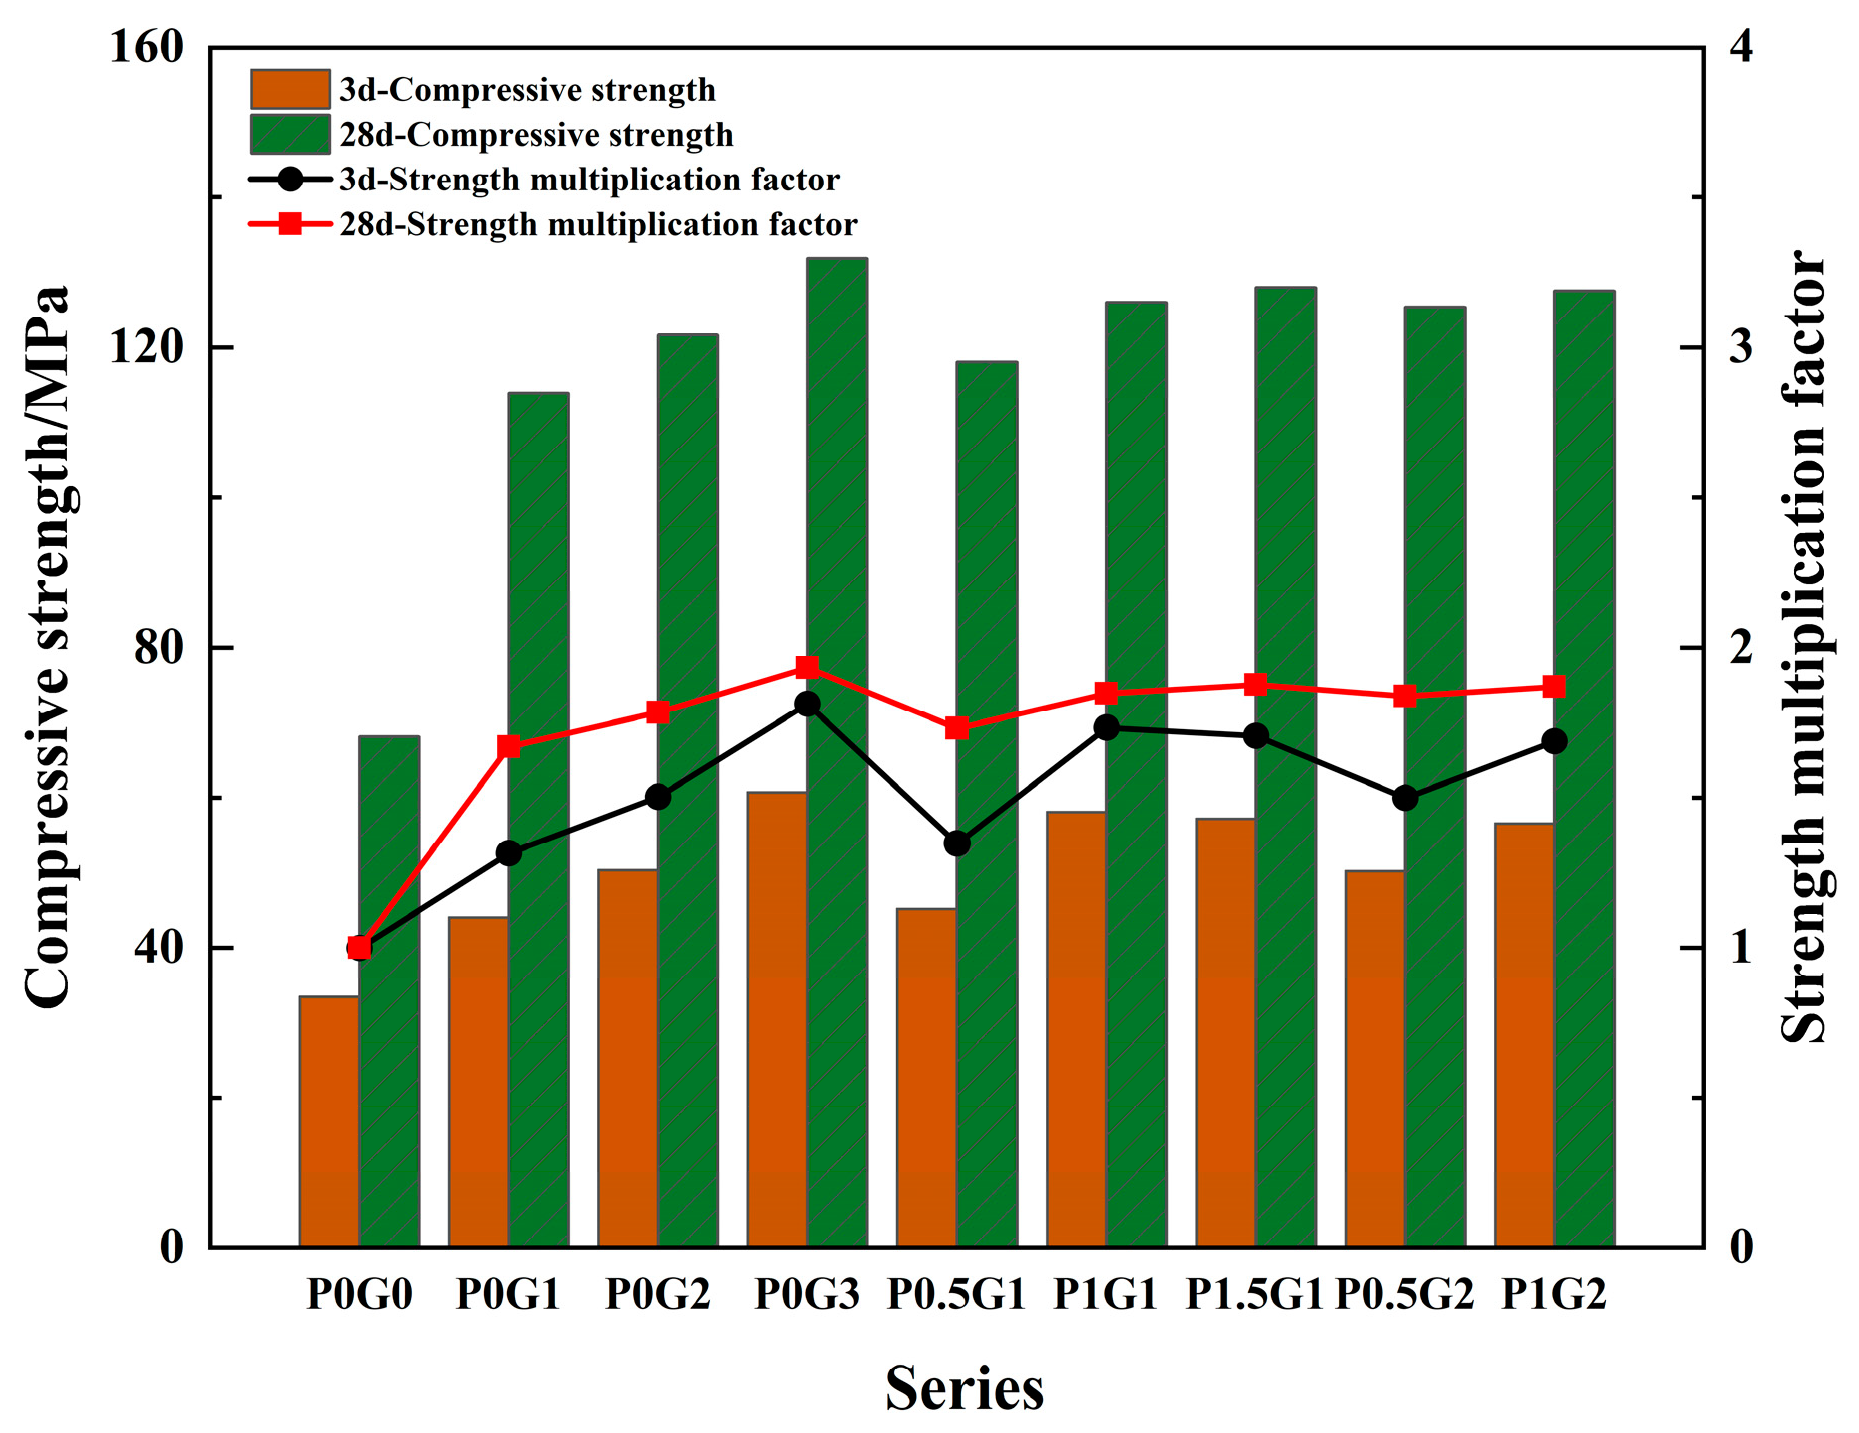
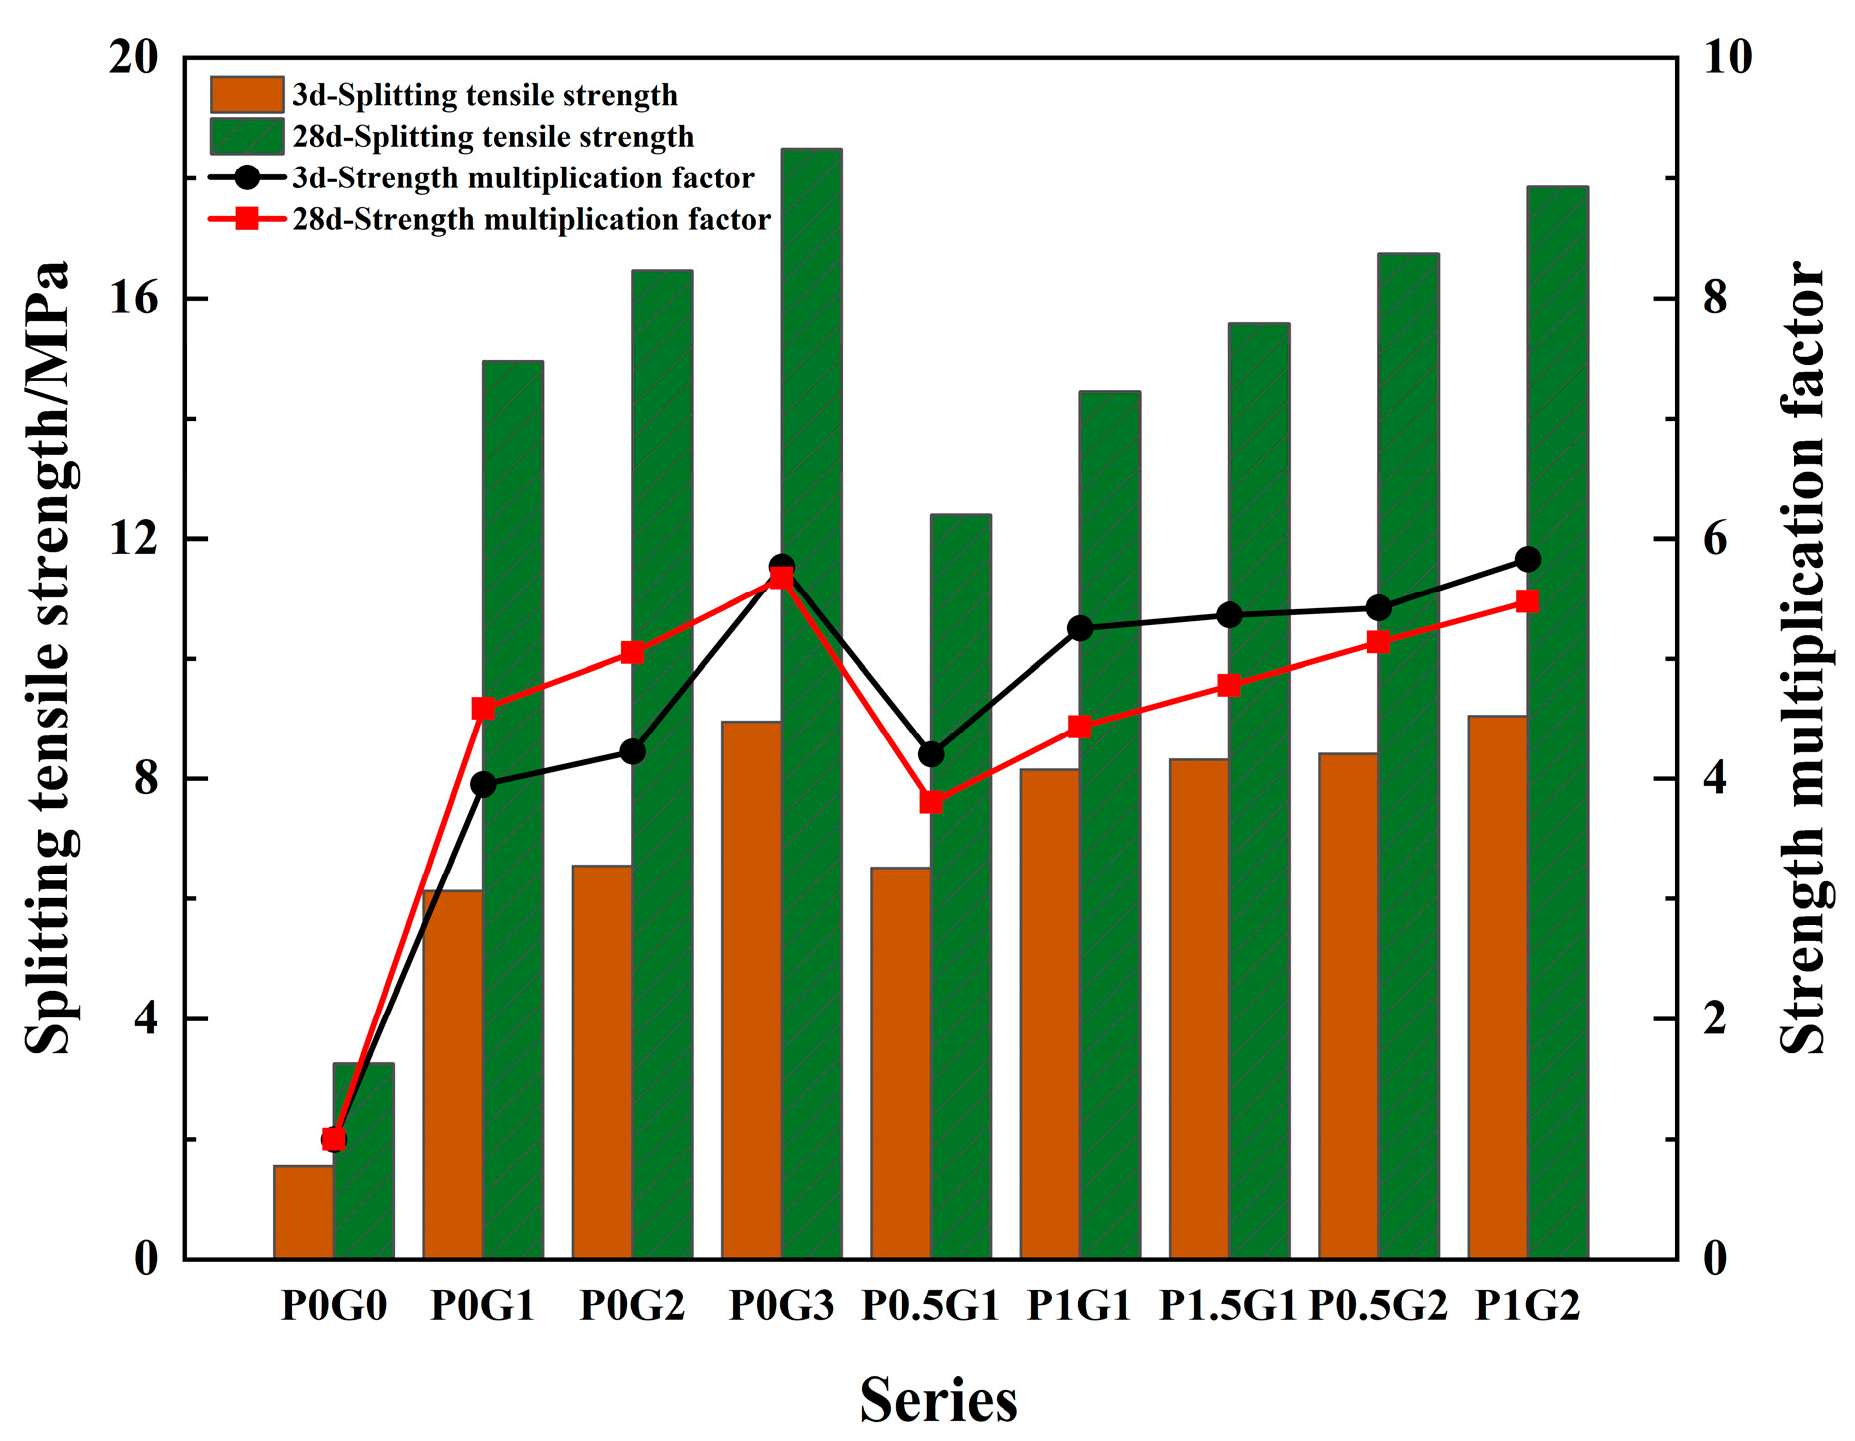
3.1.1. Strength of CSUHPC Cubes
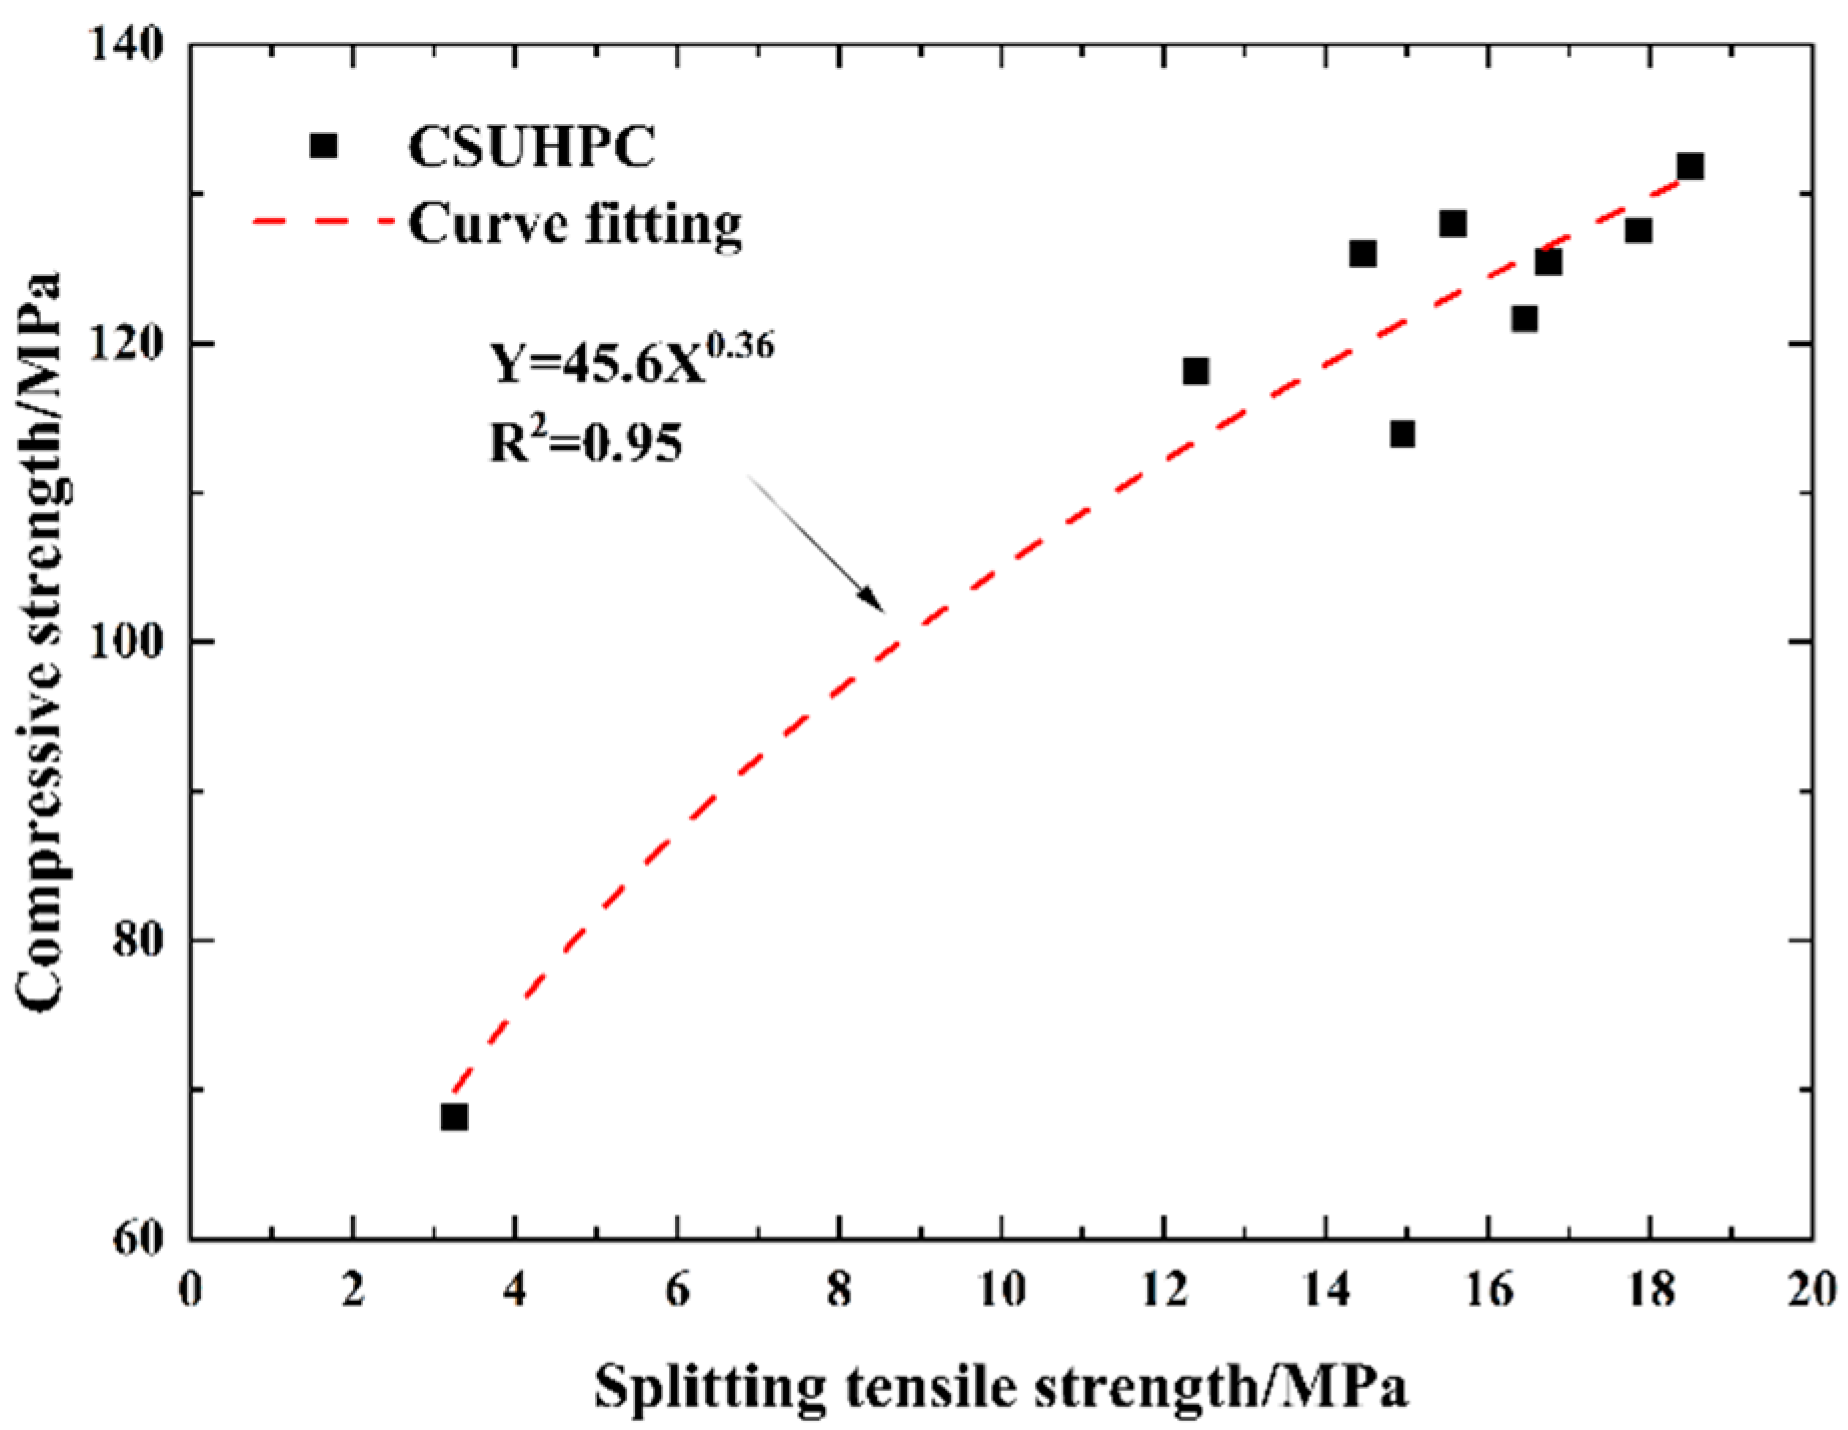
3.1.2. Tension–Compression Ratio and Strength Fitting
3.2. Stress–Strain Relationship of Cylindrical Specimens
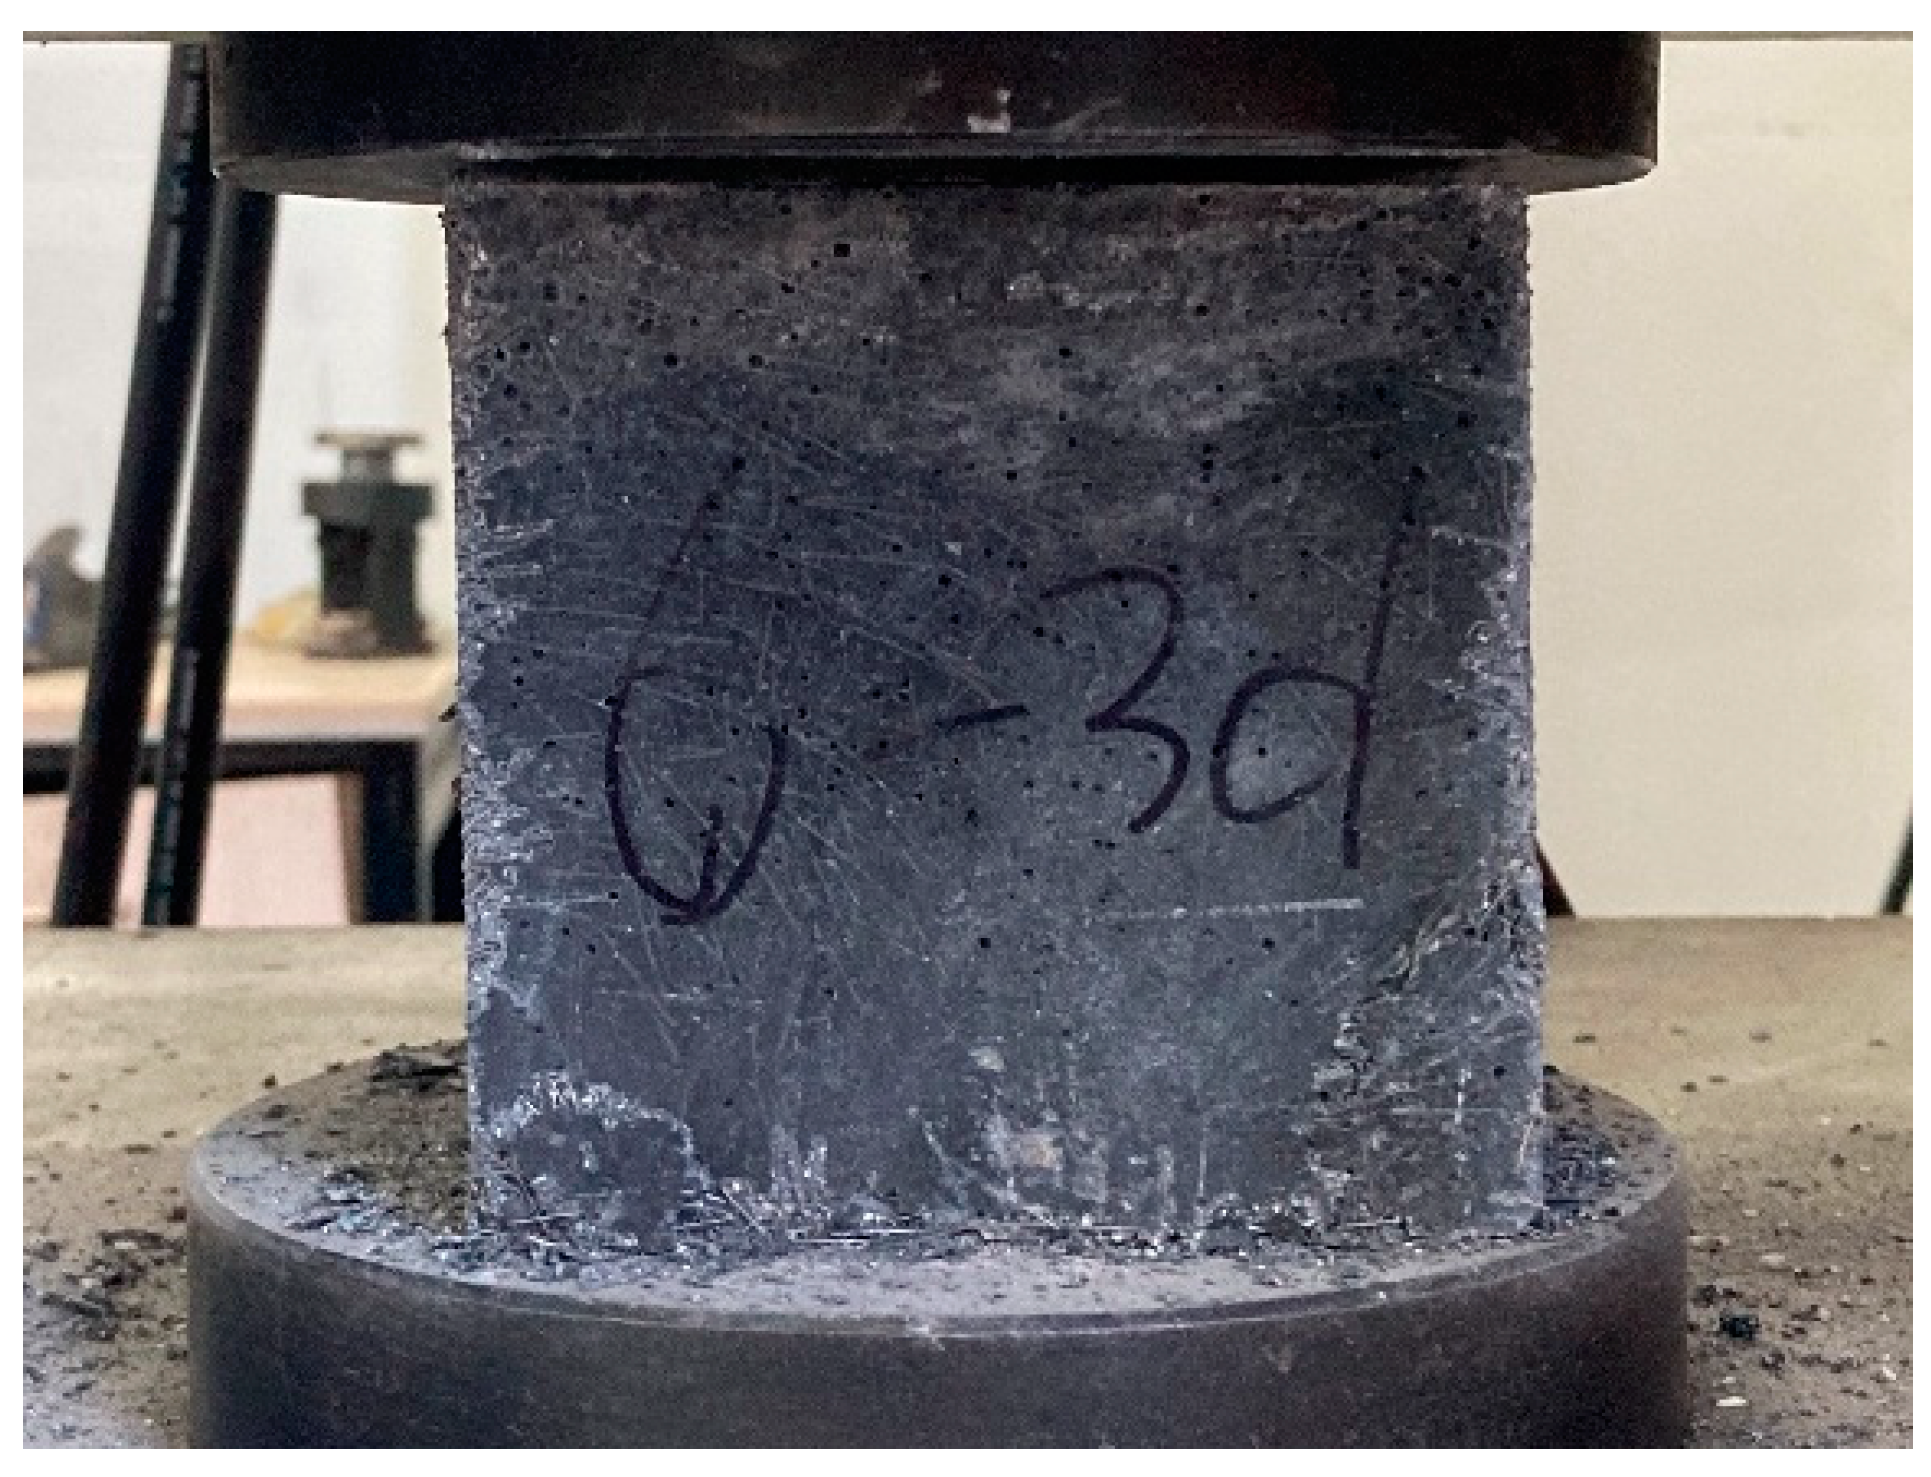
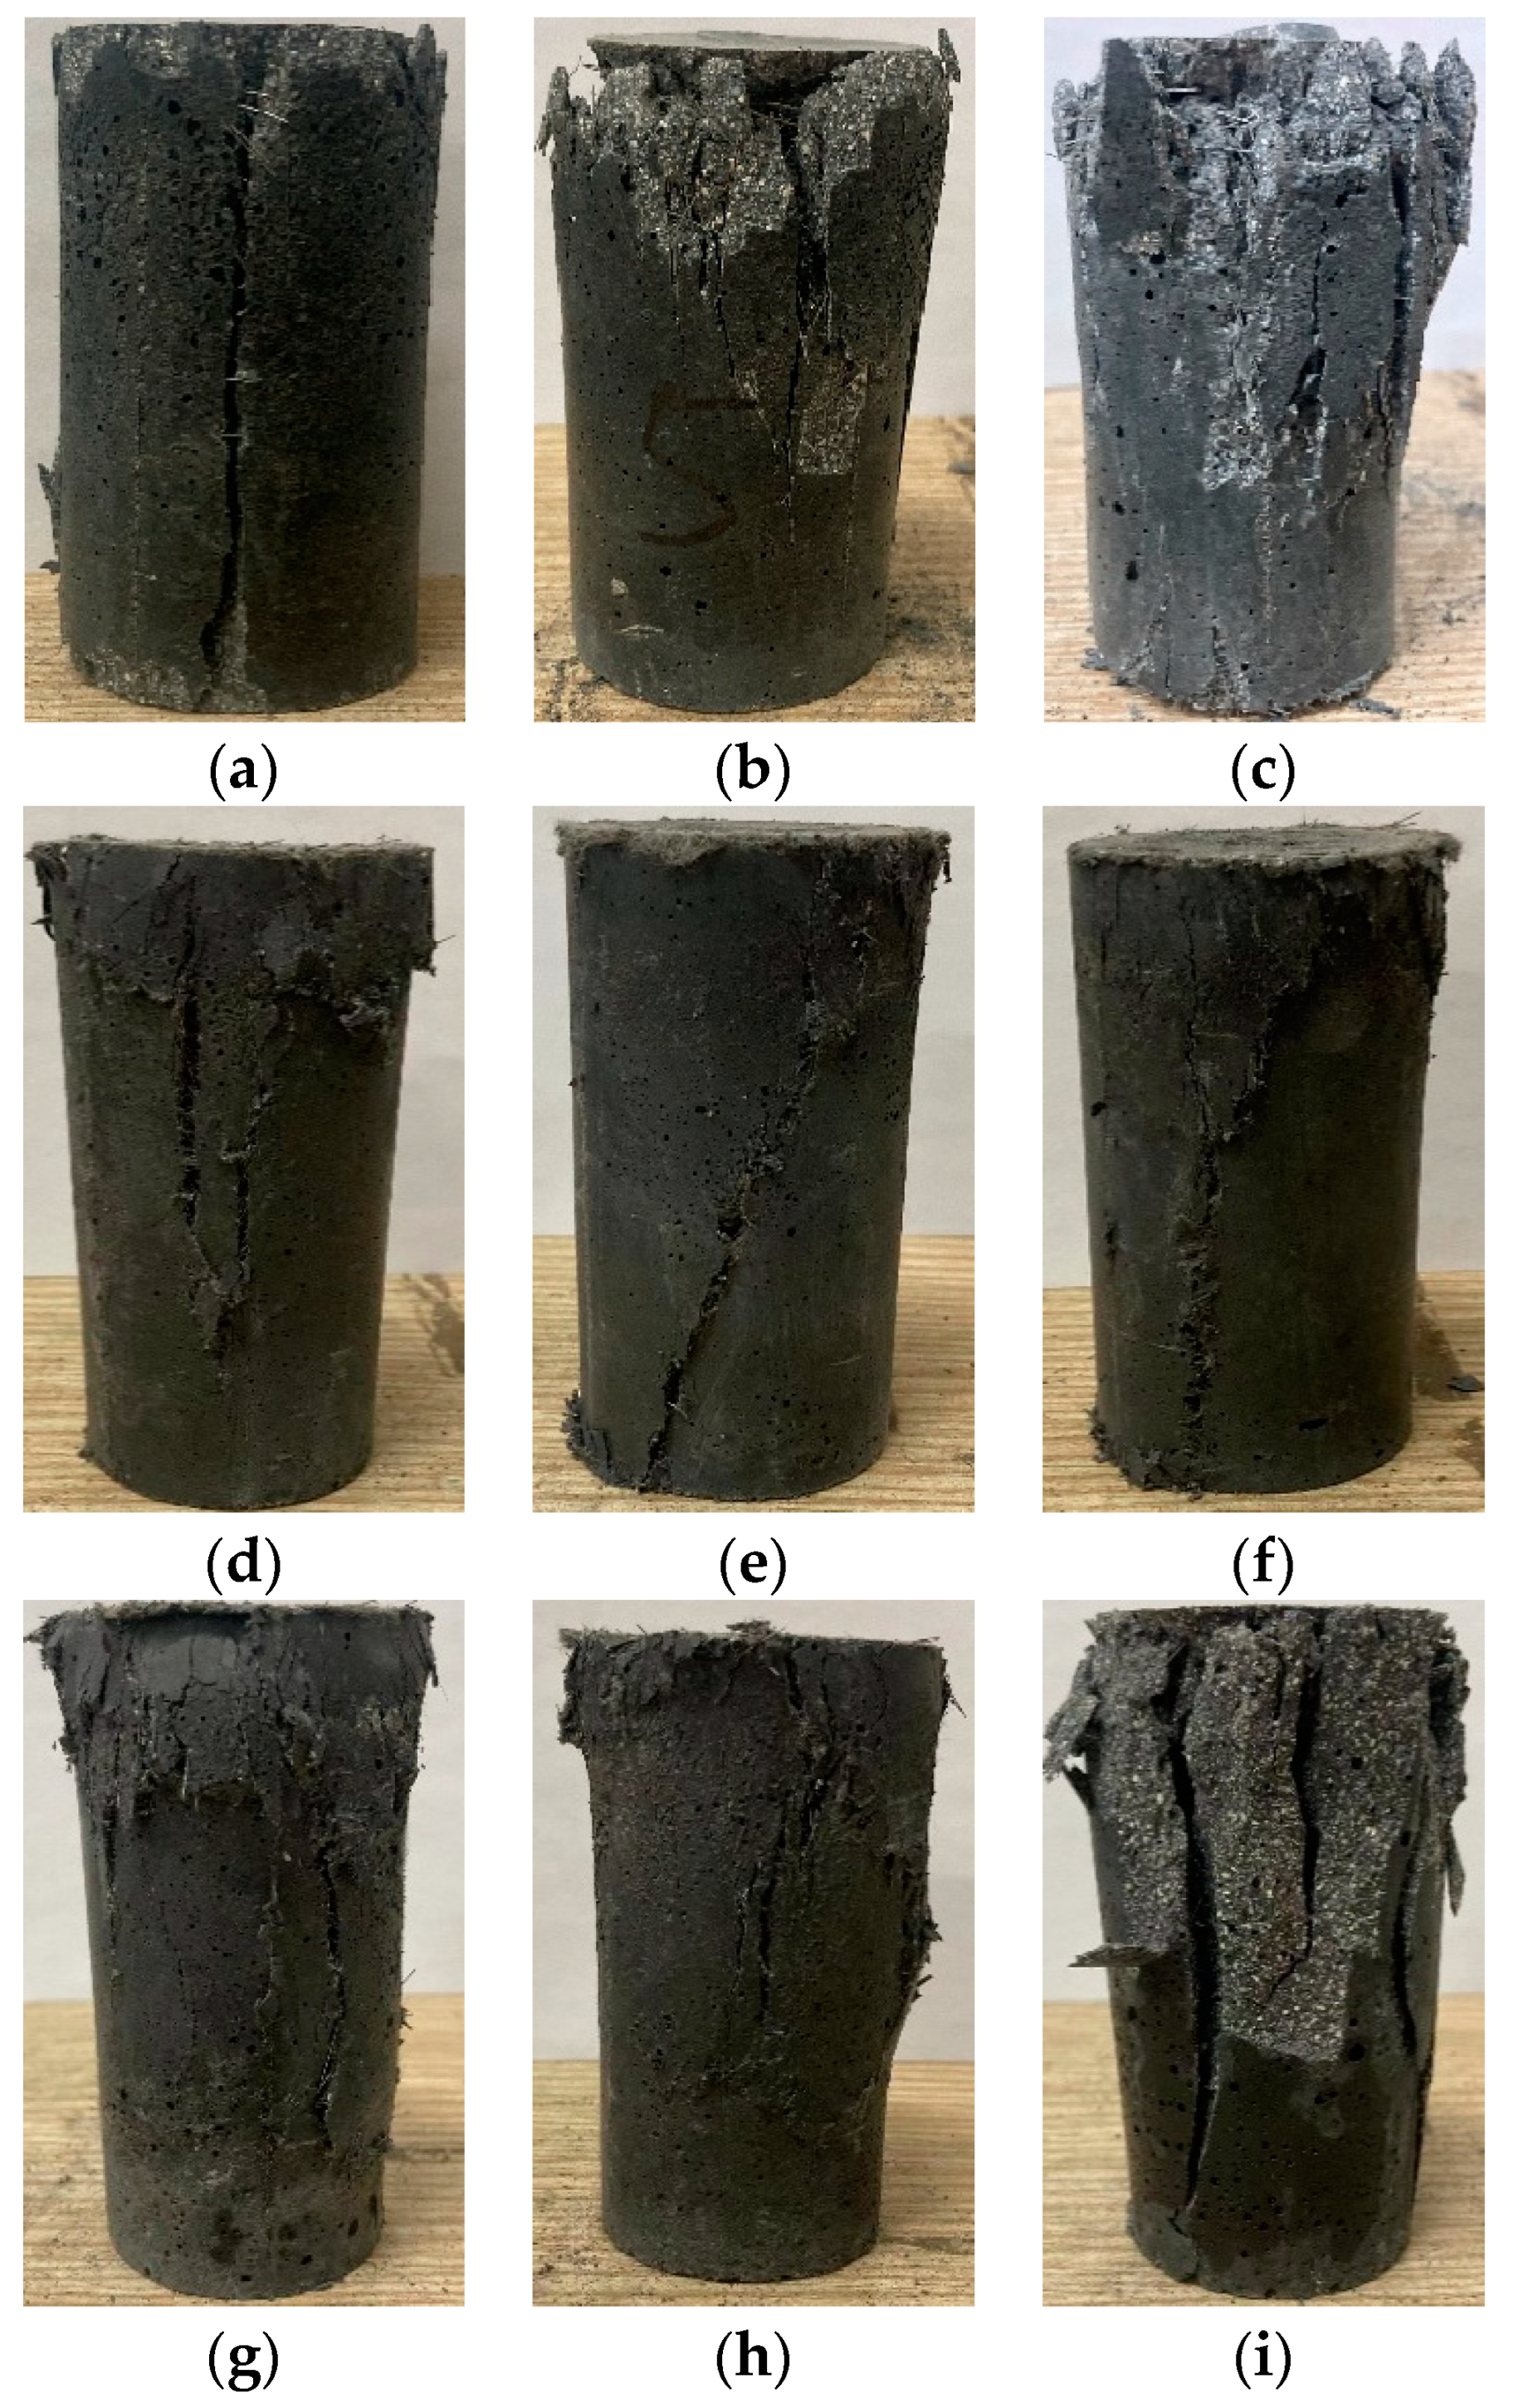
3.2.1. Failure Modes of Cylindrical CSUHPC Specimens
3.2.2. Complete Stress–Strain Curve
3.2.3. Effect of Fibers on the Mechanical Properties of Cylindrical CSUHPC Specimens
- (1)
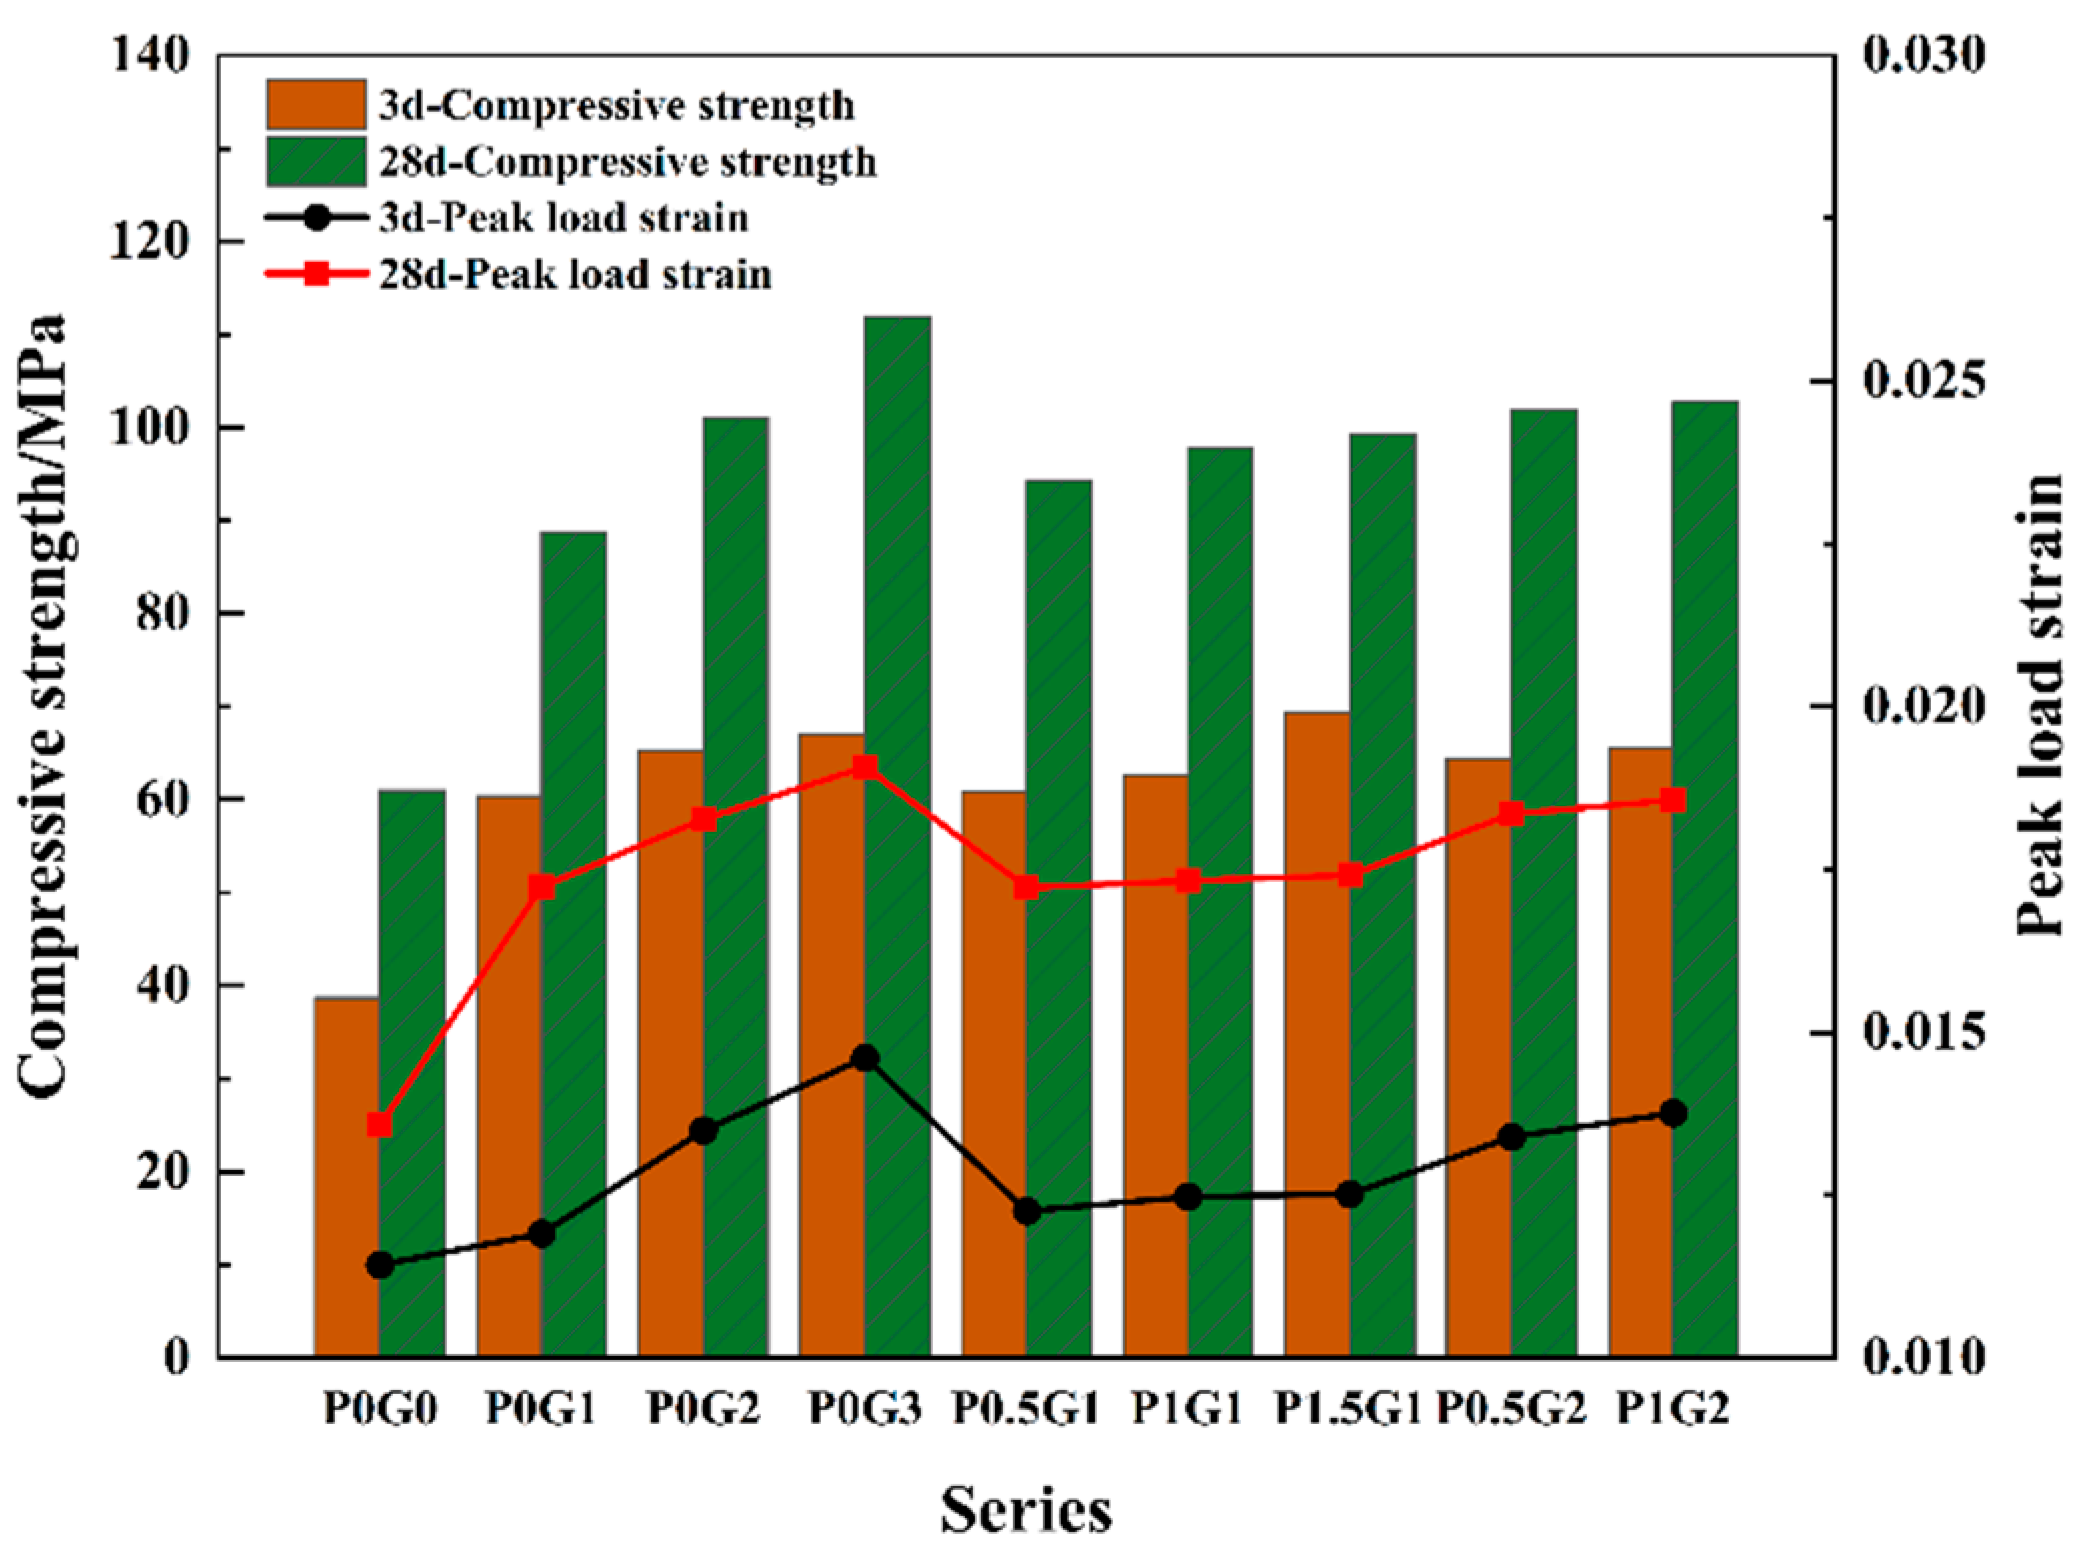
- Cylindrical specimen compressive strength and peak strain
- (2)
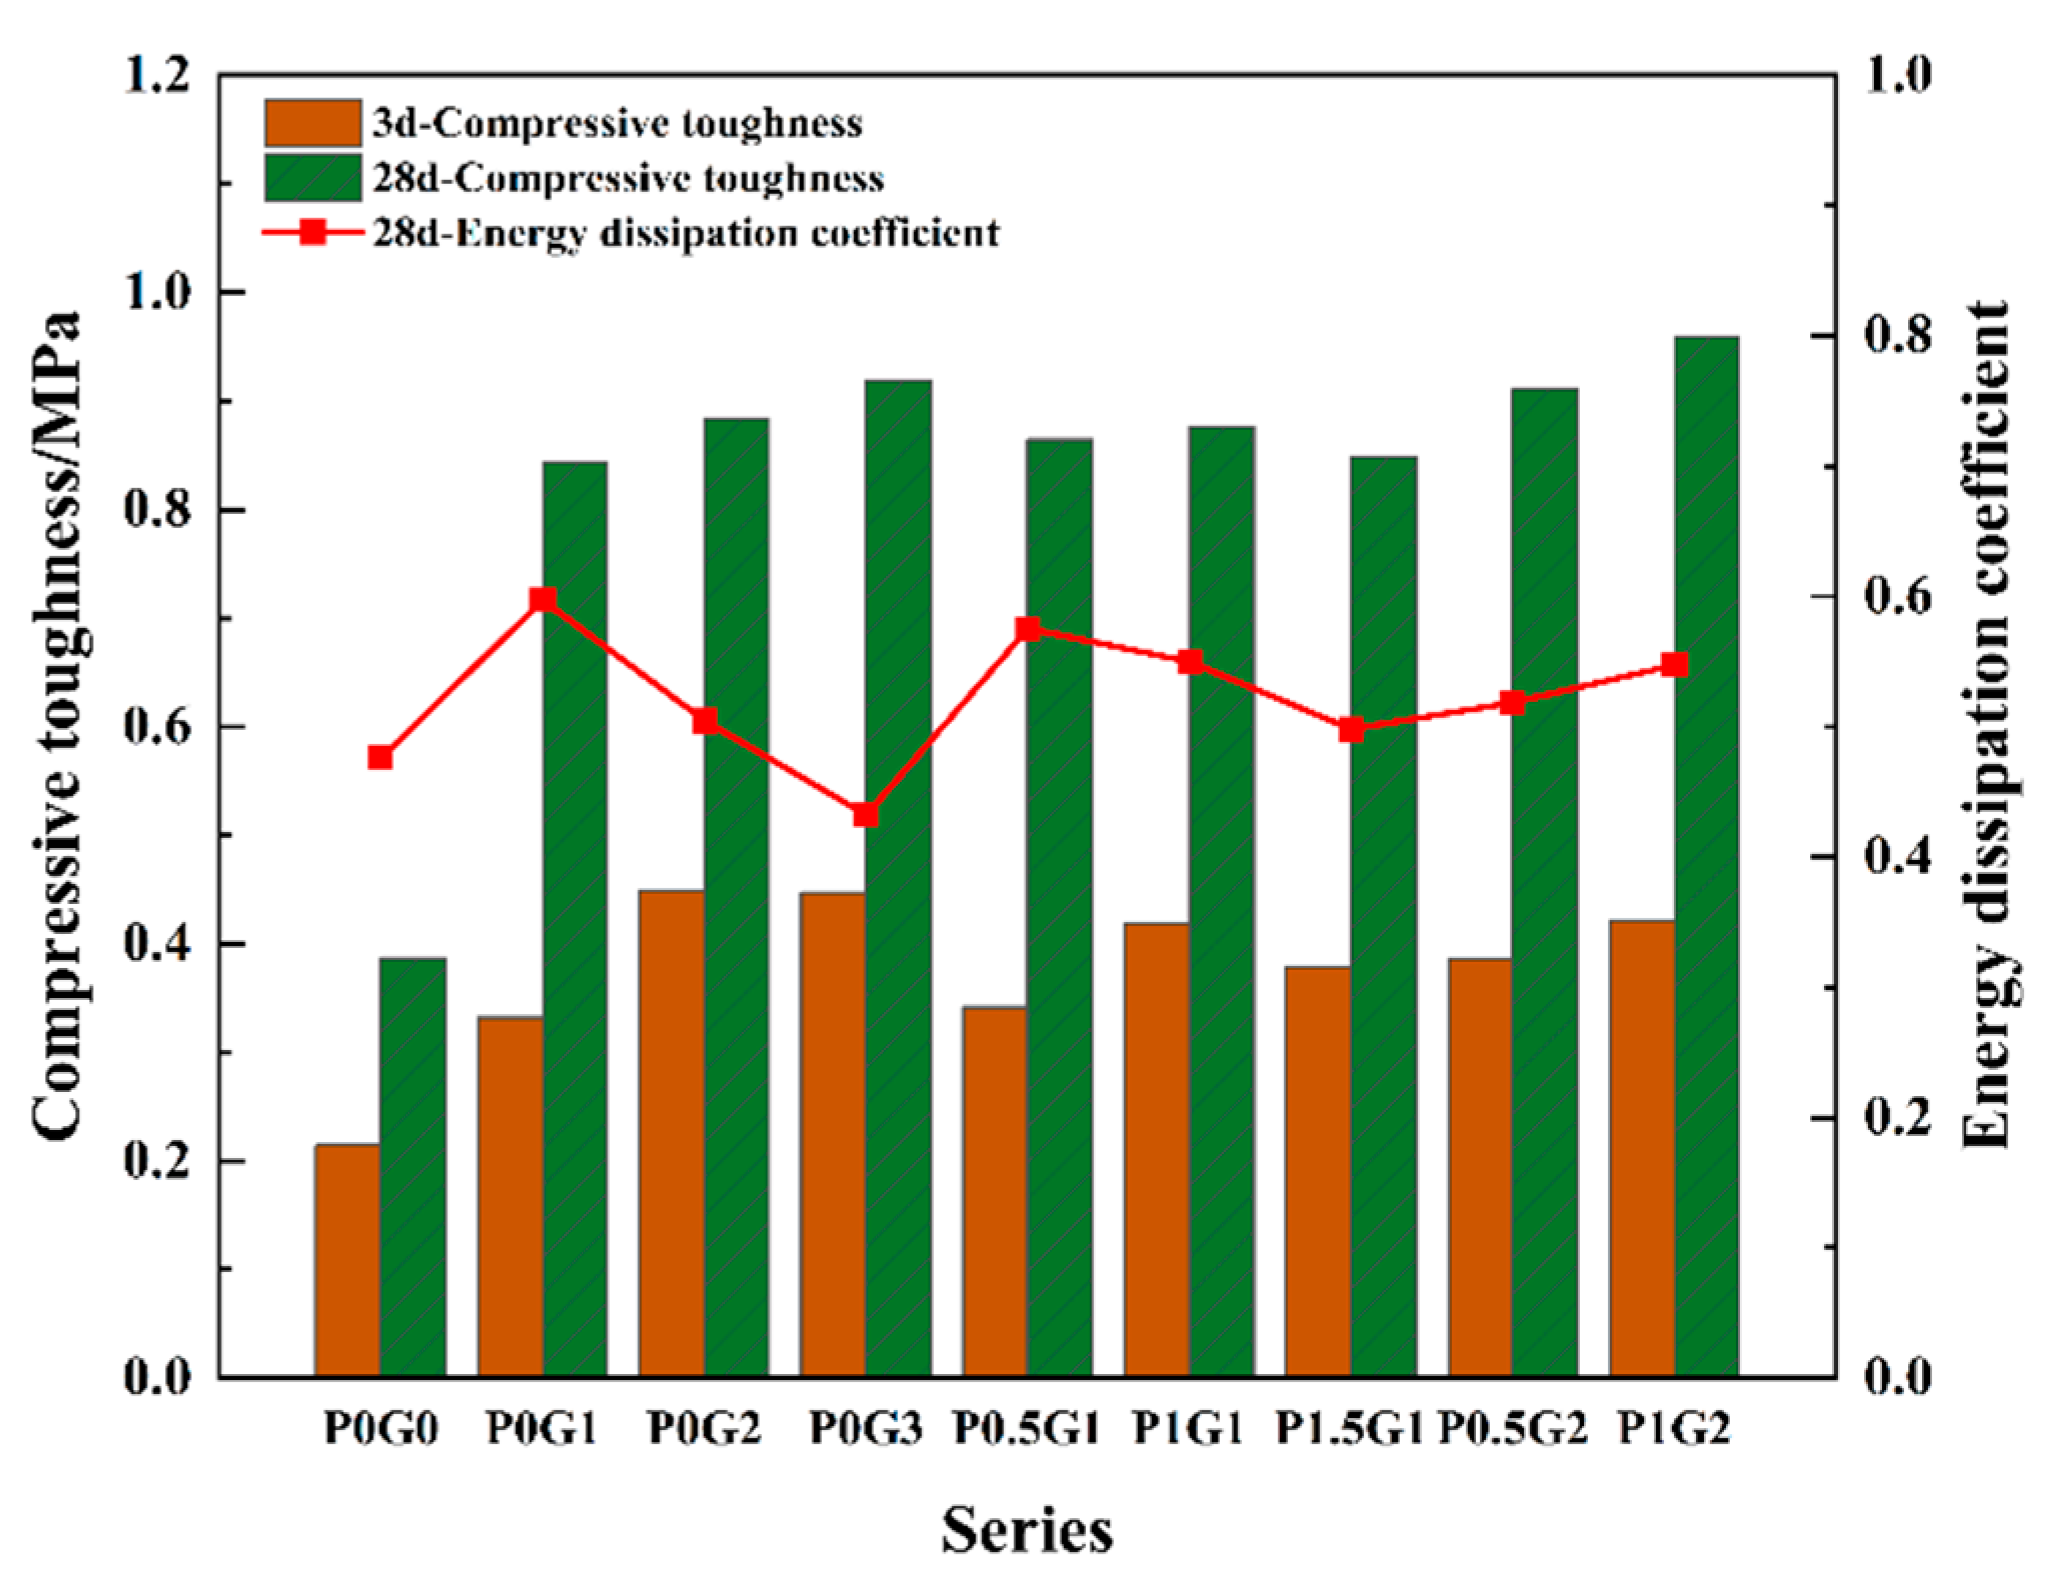
- Compressive toughness and energy dissipation coefficient
3.3. Compressive Constitutive Relationship of CSUHPC Specimens
3.4. Comprehensive Performance Assessment of CSUHPC Specimens
4. Conclusions
- (1)
- Experimental results from cubic compressive and splitting tensile tests demonstrated that fiber significantly enhances the mechanical strength of CSUHPC. Specifically, at a steel fiber content of 3%, the CSUHPC specimens achieved peak compressive strength and splitting tensile strength of 131.9 MPa and 18.5 MPa, respectively. Furthermore, the 3% steel fiber-reinforced CSUHPC exhibits the highest toughness, with its tension–compression ratio showing a 1.9-fold increase compared to the P0G0.
- (2)
- Compressive stress–strain tests demonstrated that fiber incorporation induces a transition in CSUHPC specimen failure modes from brittle to ductile. At a 3% steel fiber volume fraction, CSUHPC achieved a peak stress of 111.9 MPa and a peak strain of 0.019, showing increases of 83.4% and 40.6%, respectively, compared to P0G0. The hybrid fiber system of 2% steel fibers and 1% PE fibers exhibits optimal compressive toughness, exhibiting a 1.48-fold enhancement relative to P0G0. Additionally, CSUHPC specimens with 100 mm cubes exhibit higher compressive strength than Φ50 mm × 100 mm cylindrical specimens.
- (3)
- Comparative analysis of compressive constitutive equations revealed that piecewise models demonstrated superior fitting accuracy for CSUHPC over unified constitutive models, with the Deju Zhu model exhibiting the optimal performance.
- (4)
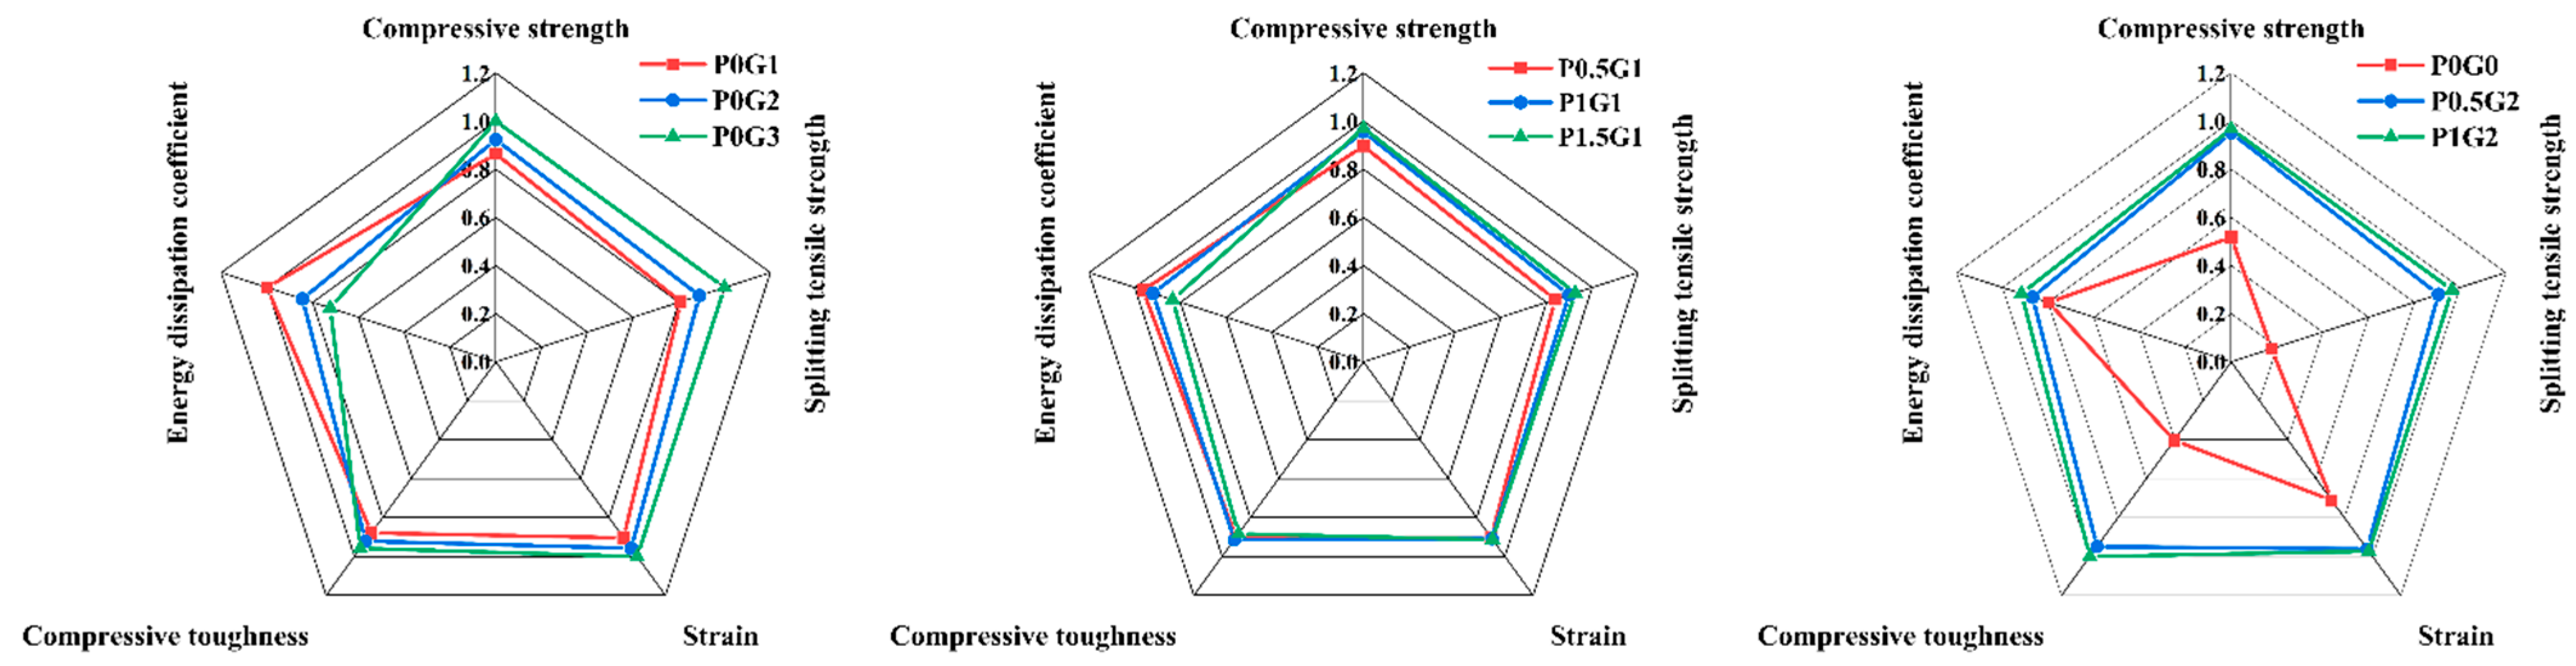
- A multivariate evaluation system was established, and radar charts were used for the comprehensive evaluation of CSUHPC specimens. The analysis concluded that the comprehensive performance of the CSUHPC specimens was optimal when the PE fiber content was 1% and the steel fiber content was 2%.
- (1)
- The tropical island and reef regions are characterized by a combined extreme environment of high temperature, high salinity, intense radiation, and high humidity. Future research must simulate prioritizing these realistic service conditions to explore the performance of CSUHPC under varied exposure scenarios.
- (2)
- Additionally, given the service life of structures in these regions is significantly shortened due to environmental degradation, durability enhancement strategies for CSUHPC must be prioritized in subsequent studies.
Author Contributions
Funding
Institutional Review Board Statement
Informed Consent Statement
Data Availability Statement
Conflicts of Interest
References
- Zhang, J.; Wang, L.; Yi, J.; Qin, Q. Experimental study on stress-strain relationship of high strength coral concrete (HSCC). J. Build. Eng. 2024, 87, 109090. [Google Scholar] [CrossRef]
- Xiao, J.; Qiang, C.; Nanni, A.; Zhang, K. Use of sea-sand and seawater in concrete construction: Current status and future opportunities. Constr. Build. Mater. 2017, 155, 1101–1111. [Google Scholar] [CrossRef]
- Lyu, B.; Wang, A.; Zhang, Z.; Liu, K.; Xu, H.; Shi, L.; Sun, D. Coral aggregate concrete: Numerical description of physical, chemical and morphological properties of coral aggregate. Cem. Concr. Compos. 2019, 100, 25–34. [Google Scholar] [CrossRef]
- Wu, Z.; Zhang, J.; Yu, H.; Fang, Q.; Ma, H.; Chen, L. Three-dimensional mesoscopic investigation on the impact of specimen geometry and bearing strip size on the splitting-tensile properties of coral aggregate concrete. Engineering 2022, 17, 110–122. [Google Scholar] [CrossRef]
- Su, W.; Liu, J.; Liu, L.; Chen, Z.; Shi, C. Progresses of high-performance coral aggregate concrete (HPCAC): A review. Cem. Concr. Compos. 2023, 140, 105059. [Google Scholar] [CrossRef]
- Wang, Z.; Li, P.; Han, Y.; Hao, R.; Liu, W. Dynamic vompressive properties of seawater coral aggregate concrete (SCAC) reinforced with mono or hybrid yibers. Constr. Build. Mater. 2022, 340, 127801. [Google Scholar] [CrossRef]
- Huang, Y.; He, X.; Sun, H.; Sun, Y.; Wang, Q. Effects of coral, recycled and natural coarse aggregates on the mechanical properties of concrete. Constr. Build. Mater. 2018, 192, 330–347. [Google Scholar] [CrossRef]
- Wang, J.; Feng, P.; Hao, T.; Yue, Q. Axial compressive behavior of seawater coral aggregate concrete-filled FRP tubes. Constr. Build. Mater. 2017, 147, 272–285. [Google Scholar] [CrossRef]
- Wang, L.; Zhang, Q.; Yi, J.; Zhang, J. Effects of coral aggregate properties on the ultrasonic pulse velocity of concrete. J. Build. Eng. 2023, 80, 107935. [Google Scholar] [CrossRef]
- Guo, J.; Zhang, J.; Yu, H.; Ma, H.; Wu, Z. Experimental and 3D mesoscopic investigation of uniaxial compression performance on basic magnesium sulfate cement-coral aggregate concrete (BMSC-CAC). Compos. B. Eng. 2022, 236, 109760. [Google Scholar] [CrossRef]
- Da, B.; Yu, H.; Ma, H.; Tan, Y.; Mi, R.; Dou, X. Experimental investigation of whole stress-strain curves of coral concrete. Constr. Build. Mater. 2016, 122, 81–89. [Google Scholar] [CrossRef]
- Felix, E.F.; Carrazedo, R.; Possan, E. Carbonation model for fly ash concrete based on artificial neural network: Development and parametric analysis. Constr. Build. Mater. 2021, 266, 121050. [Google Scholar] [CrossRef]
- Kumar, V. Protection of steel reinforcement for concrete—A review. Corros. Rev. 1998, 16, 317–358. [Google Scholar] [CrossRef]
- Moreno, M.; Morris, W.; Alvarez, M.G.; Duffó, G.S. Corrosion of reinforcing steel in simulated concrete pore solutions: Effect of carbonation and chloride content. Corros. Sci. 2004, 46, 2681–2699. [Google Scholar] [CrossRef]
- Zhou, L.; Zhu, D.; Zillur Rahman, M.; Guo, S.; Ma, W.; Feng, G.; Yi, Y.; Shi, C. Durability of BFRP bars embedded in seawater sea sand coral aggregate concrete in simulated seawater environment: Effects of coral coarse aggregate and cement contents. Constr. Build. Mater. 2023, 362, 129694. [Google Scholar] [CrossRef]
- Fan, D.; Zhu, J.; Fan, M.; Lu, J.; Chu, S.; Dong, E.; Yu, R. Intelligent design and manufacturing of ultra-high performance concrete (UHPC)—A review. Constr. Build. Mater. 2023, 385, 131495. [Google Scholar] [CrossRef]
- Shi, C.; Wu, Z.; Xiao, J.; Wang, D.; Huang, Z.; Fang, Z. A review on ultra high performance concrete: Part I. Raw materials and mixture design. Constr. Build. Mater. 2015, 101, 741–751. [Google Scholar] [CrossRef]
- Sun, G.; Du, M.; Shan, B.; Shi, J.; Qu, Y. Ultra-high performance concrete design method based on machine learning model and steel slag powder. Case Stud. Constr. Mater. 2022, 17, e01682. [Google Scholar] [CrossRef]
- Amini Pishro, A.; Zhang, Z.; Amini Pishro, M.; Xiong, F.; Zhang, L.; Yang, Q.; Jahara Matlan, S. UHPC-PINN-parallel micro element system for the local bond stress-slip model subjected to monotonic loading. Structures 2022, 46, 570–597. [Google Scholar] [CrossRef]
- Du, J.; Meng, W.; Khayat, K.H.; Bao, Y.; Guo, P.; Lyu, Z.; Abu-obeidah, A.; Nassif, H.; Wang, H. New development of ultra-high-performance concrete (UHPC). Compos. B. Eng. 2021, 224, 109220. [Google Scholar] [CrossRef]
- Zhao, C.; Wang, Z.; Zhu, Z.; Guo, Q.; Wu, X.; Zhao, R. Research on different types of fiber reinforced concrete in recent years: An overview. Constr. Build. Mater. 2023, 365, 130075. [Google Scholar] [CrossRef]
- Liu, B.; Guo, J.; Zhou, J.; Wen, X.; Deng, Z.; Wang, H.; Zhang, X. The mechanical properties and microstructure of carbon fibers reinforced coral concrete. Constr. Build. Mater. 2020, 249, 118771. [Google Scholar] [CrossRef]
- Fu, Q.; Xu, W.; He, J.; Su, L.; Song, H.; Niu, D. Dynamic strength criteria for basalt fibre-reinforced coral aggregate concrete. Compos. Commun. 2021, 28, 100983. [Google Scholar] [CrossRef]
- Han, H.; Gao, G.; Li, Y.; Hou, D.; Han, Y. Effect of PVA fiber on the mechanical properties of seawater coral sand engineered cementitious composites. Materials 2024, 17, 1446. [Google Scholar] [CrossRef]
- Fu, Q.; Xu, W.; Bu, M.; Su, L.; He, J.; Kou, H. A simplified dynamic constitutive model for BFRCAC under confining pressure considering the coupling rffect of fibre reinforcement and mechanical damage. Compos. Struct. 2021, 268, 113944. [Google Scholar] [CrossRef]
- Liu, B.; Wang, F.; Zou, C.; Ming, Y.; Qin, J.; Qian, K. Comparison of the mechanical properties and constitutive models of carbon fiber-reinforced coral concrete cubes and prisms under uniaxial compression. J. Build. Eng. 2024, 98, 111247. [Google Scholar] [CrossRef]
- Dai, J.; Yin, S.; Wang, F.; Ge, M. Analysis of microstructure and compressive properties of full coral concrete under fiber reinforcement. J. Build. Eng. 2024, 93, 109826. [Google Scholar] [CrossRef]
- Yue, C.; Yu, H.; Ma, H.; Mei, Q.; Zhang, J.; Zhang, Y. Uniaxial compression of sisal fiber-reinforced coral concrete. ACI Mater. J. 2020, 117, 251–262. [Google Scholar] [CrossRef]
- Li, R.; Mu, C.; Zhang, Y.; Ma, L.; Zhou, H.; Wang, F.; Li, B.; Xie, Q. Dynamic mechanical performance of SCAC with various CCRL coarse aggregate: Experimental and numerical investigation. Constr. Build. Mater. 2025, 461, 139784. [Google Scholar] [CrossRef]
- Sun, Z.; Li, Y.; Su, L.; Niu, D.; Luo, D.; He, W.; Xie, S. Investigation of electrical resistivity for fiber-reinforced coral aggregate concrete. Constr. Build. Mater. 2024, 414, 135011. [Google Scholar] [CrossRef]
- Li, L.; Xiao, B.; Fang, Z.; Xiong, Z.; Chu, S.; Kwan, A.K.H. Feasibility of glass/basalt fiber reinforced seawater coral sand mortar for 3D printing. Addit. Manuf. 2021, 37, 101684. [Google Scholar] [CrossRef]
- Feng, J.; Yin, G.; Tuo, H.; Wen, C.; Liu, Z.; Liang, J.; Zhang, Y. Uniaxial compressive behavior of hook-end steel and macro-polypropylene hybrid fibers reinforced recycled aggregate concrete. Constr. Build. Mater. 2021, 304, 124559. [Google Scholar] [CrossRef]
- Zhang, L.; He, M.; Li, X.; Li, C.; Zhao, J.; Wang, H. Experimental and model calculation research on shrinkage of hybrid fiber-reinforced recycled aggregate concrete. Materials 2025, 18, 1183. [Google Scholar] [CrossRef] [PubMed]
- Wang, Z.; Liu, W.; Zuo, J.; Han, Y.; Li, P.; Hao, R. Strength and fracture properties of coral concrete under impact of coral aggregate type and fiber hybridization. J. Cent. South Univ. 2024, 31, 1592–1607. [Google Scholar] [CrossRef]
- Liu, B.; Zhang, X.; Ye, J.; Liu, X.; Deng, Z. Mechanical properties of hybrid fiber reinforced coral concrete. Case Stud. Constr. Mater. 2022, 16, e00865. [Google Scholar] [CrossRef]
- GB/T 31387-2025; Ultra High Performance Concrete. National Standardization Administration: Beijing, China, 2025.
- JTG 3420-2020; Testing Methods of Cement and Concrete for Highway Engineering. Ministry of Transport of the People’s Republic of China: Beijing, China, 2020.
- Si, W.; Cao, M.; Li, L. Establishment of fiber factor for rheological and mechanical performance of polyvinyl alcohol (PVA) fiber reinforced mortar. Constr. Build. Mater. 2020, 265, 120347. [Google Scholar] [CrossRef]
- Krahl, P.A.; Gidrão, G.d.M.S.; Carrazedo, R. Cyclic behavior of UHPFRC under compression. Cem. Concr. Compos. 2019, 104, 103363. [Google Scholar] [CrossRef]
- Krahl, P.A.; Carrazedo, R.; El Debs, M.K. Mechanical damage evolution in UHPFRC: Experimental and numerical investigation. Eng. Struct. 2018, 170, 63–77. [Google Scholar] [CrossRef]
- Li, Y.; Bao, X.; Chen, X.; Wu, X.; Cui, H. Investigation of dynamic performance of hybrid fiber-reinforced concrete with low-fiber-content. Constr. Build. Mater. 2025, 476, 141144. [Google Scholar] [CrossRef]
- Chen, Z.; Zhang, Y.; Yao, R.; Chen, Y. Experimental study on complete stress-strain curve of sea sand concrete behavior under uniaxial loading. Bull. Chin. Ceram. Soc. 2019, 38, 3934–3940+3945. Available online: https://link.cnki.net/doi/10.16552/j.cnki.issn1001-1625.2019.12.034 (accessed on 30 March 2025). (In Chinese).
- Belén, G.-F.; Fernando, M.-A.; Diego, C.L.; Sindy, S.-P. Stress-strain relationship in axial compression for concrete using recycled saturated coarse aggregate. Constr. Build. Mater. 2011, 25, 2335–2342. [Google Scholar] [CrossRef]
- Dong, W.; Zeli, L.; Yin, Y.; Xue, G. Experimental study on uniaxial compressive stress-strain of basalt fiber aeolian sand concrete. J. Southwest Jiaotong Univ. 2024, 1–9, (Online premiere). Available online: https://link.cnki.net/urlid/51.1277.U.20240704.1446.006 (accessed on 30 March 2025). (In Chinese).
- Zhu, D.; Wang, P. Uniaxial compression stress-strain relationship of ultra-high performance seawater sea-sand concrete. J. Hunan Univ. Nat. Sci. 2024, 51, 12–21. Available online: https://link.cnki.net/doi/10.16339/j.cnki.hdxbzkb.2024043 (accessed on 30 March 2025). (In Chinese).
- Wang, Z.; Zuo, J.; Zhang, J.; Feng, L.; Jiang, G. Mechanical properties of hybrid fiber reinforced engineered cementitious composites under uniaxial compression. J. Build. Mater. 2018, 31, 1592–1607. Available online: https://link.cnki.net/urlid/31.1764.TU.20180117.1151.030 (accessed on 30 March 2025). (In Chinese).


| Ingredient | CaO | SiO2 | Al2O3 | Fe2O3 | SrO | MgO | Na2O | SO3 | K2O | TiO2 |
|---|---|---|---|---|---|---|---|---|---|---|
| Content | 85.25 | 6.06 | 2.43 | 2.07 | 1.91 | 0.50 | 0.46 | 0.43 | 0.35 | 0.29 |
| Fiber Type | Diameter/mm | Length/mm | Tensile Strength/MPa | Density/g·cm−3 |
|---|---|---|---|---|
| Steel Fiber | 0.22 | 12 | 3000 | 7.85 |
| PE Fiber | 0.0156 | 12 | 3980 | 0.97 |
| Series | Mass Ratio | PE Fiber (Vf) | Steel Fiber (Vf) | ||||||
|---|---|---|---|---|---|---|---|---|---|
| Water | Cement | Silica Fume | Glass Microspheres | Coral Sand | Water Reducer | Defoamer | |||
| P0G0 | 0.23 | 0.7 | 0.15 | 0.15 | 1 | 0.015 | 0.0015 | 0 | 0 |
| P0G1 | 0.23 | 0.7 | 0.15 | 0.15 | 1 | 0.015 | 0.0015 | 0 | 1 |
| P0G2 | 0.23 | 0.7 | 0.15 | 0.15 | 1 | 0.015 | 0.0015 | 0 | 2 |
| P0G3 | 0.23 | 0.7 | 0.15 | 0.15 | 1 | 0.015 | 0.0015 | 0 | 3 |
| P0.5G1 | 0.23 | 0.7 | 0.15 | 0.15 | 1 | 0.015 | 0.0015 | 0.5 | 1 |
| P1G1 | 0.23 | 0.7 | 0.15 | 0.15 | 1 | 0.015 | 0.0015 | 1 | 1 |
| P1.5G1 | 0.23 | 0.7 | 0.15 | 0.15 | 1 | 0.015 | 0.0015 | 1.5 | 1 |
| P0.5G2 | 0.23 | 0.7 | 0.15 | 0.15 | 1 | 0.015 | 0.0015 | 0.5 | 2 |
| P1G2 | 0.23 | 0.7 | 0.15 | 0.15 | 1 | 0.015 | 0.0015 | 1 | 2 |
| Series | Model-1 | Model-2 | Model-3 | Model-4 | |||
|---|---|---|---|---|---|---|---|
| n | a | b | a | b | a | b | |
| P0G0 | 69.18 | −0.63 | 84.62 | 0.48 | 84.62 | 0.48 | 21.06 |
| P0G1 | 8.69 | 0.65 | 10.72 | 1.07 | 10.72 | 1.07 | 5.77 |
| P0G2 | 16.76 | −0.03 | 28.35 | 0.76 | 28.35 | 0.76 | 10.23 |
| P0G3 | 9.95 | −0.53 | 8.52 | 0.50 | 8.52 | 0.50 | 5.64 |
| P0.5G1 | 25.03 | 0.55 | 55.07 | 1.03 | 55.07 | 1.03 | 18.55 |
| P1G1 | 6.14 | 0.30 | 4.26 | 0.92 | 4.26 | 0.92 | 3.95 |
| P1.5G1 | 116.26 | −0.03 | 734.42 | 0.77 | 734.42 | 0.77 | 107.96 |
| P0.5G2 | 7.59 | 0.12 | 8.57 | 0.82 | 8.57 | 0.82 | 4.87 |
| P1G2 | 25.56 | 0.19 | 33.13 | 0.88 | 33.13 | 0.88 | 9.22 |
| Series | Si | Ci | Ai | Bi | Fi |
|---|---|---|---|---|---|
| P0G0 | 0.5883 | 3.4502 | 0.2660 | 0.6207 | 0.4064 |
| P0G1 | 1.8865 | 5.2516 | 0.8530 | 0.8591 | 0.8561 |
| P0G2 | 1.9566 | 5.3393 | 0.8847 | 0.8621 | 0.8733 |
| P0G3 | 2.0807 | 5.5466 | 0.9408 | 0.8495 | 0.8940 |
| P0.5G1 | 1.9266 | 5.2959 | 0.8711 | 0.8628 | 0.8669 |
| P1G1 | 2.0097 | 5.4055 | 0.9087 | 0.8639 | 0.8860 |
| P1.5G1 | 1.9490 | 5.3301 | 0.8812 | 0.8616 | 0.8714 |
| P0.5G2 | 2.0424 | 5.4554 | 0.9235 | 0.8620 | 0.8922 |
| P1G2 | 2.2116 | 5.6728 | 1.0000 | 0.8632 | 0.9291 |
Disclaimer/Publisher’s Note: The statements, opinions and data contained in all publications are solely those of the individual author(s) and contributor(s) and not of MDPI and/or the editor(s). MDPI and/or the editor(s) disclaim responsibility for any injury to people or property resulting from any ideas, methods, instructions or products referred to in the content. |
© 2025 by the authors. Licensee MDPI, Basel, Switzerland. This article is an open access article distributed under the terms and conditions of the Creative Commons Attribution (CC BY) license (https://creativecommons.org/licenses/by/4.0/).
Share and Cite
Xue, X.; Li, W.; Hou, D.; Han, H.; Han, Y. Experimental Study on Uniaxial Compression Stress-Strain Relationship of Hybrid Fiber-Reinforced Coral Sand Ultra-High Performance Concrete. Materials 2025, 18, 2233. https://doi.org/10.3390/ma18102233
Xue X, Li W, Hou D, Han H, Han Y. Experimental Study on Uniaxial Compression Stress-Strain Relationship of Hybrid Fiber-Reinforced Coral Sand Ultra-High Performance Concrete. Materials. 2025; 18(10):2233. https://doi.org/10.3390/ma18102233
Chicago/Turabian StyleXue, Xiao, Wei Li, Dongxu Hou, Hongwei Han, and Yudong Han. 2025. "Experimental Study on Uniaxial Compression Stress-Strain Relationship of Hybrid Fiber-Reinforced Coral Sand Ultra-High Performance Concrete" Materials 18, no. 10: 2233. https://doi.org/10.3390/ma18102233
APA StyleXue, X., Li, W., Hou, D., Han, H., & Han, Y. (2025). Experimental Study on Uniaxial Compression Stress-Strain Relationship of Hybrid Fiber-Reinforced Coral Sand Ultra-High Performance Concrete. Materials, 18(10), 2233. https://doi.org/10.3390/ma18102233