
Study on the Quasi-Ductile Fracture Behavior of Glubam: The Role of Fiber Distribution


Abstract
1. Introduction
2. Materials and Methods
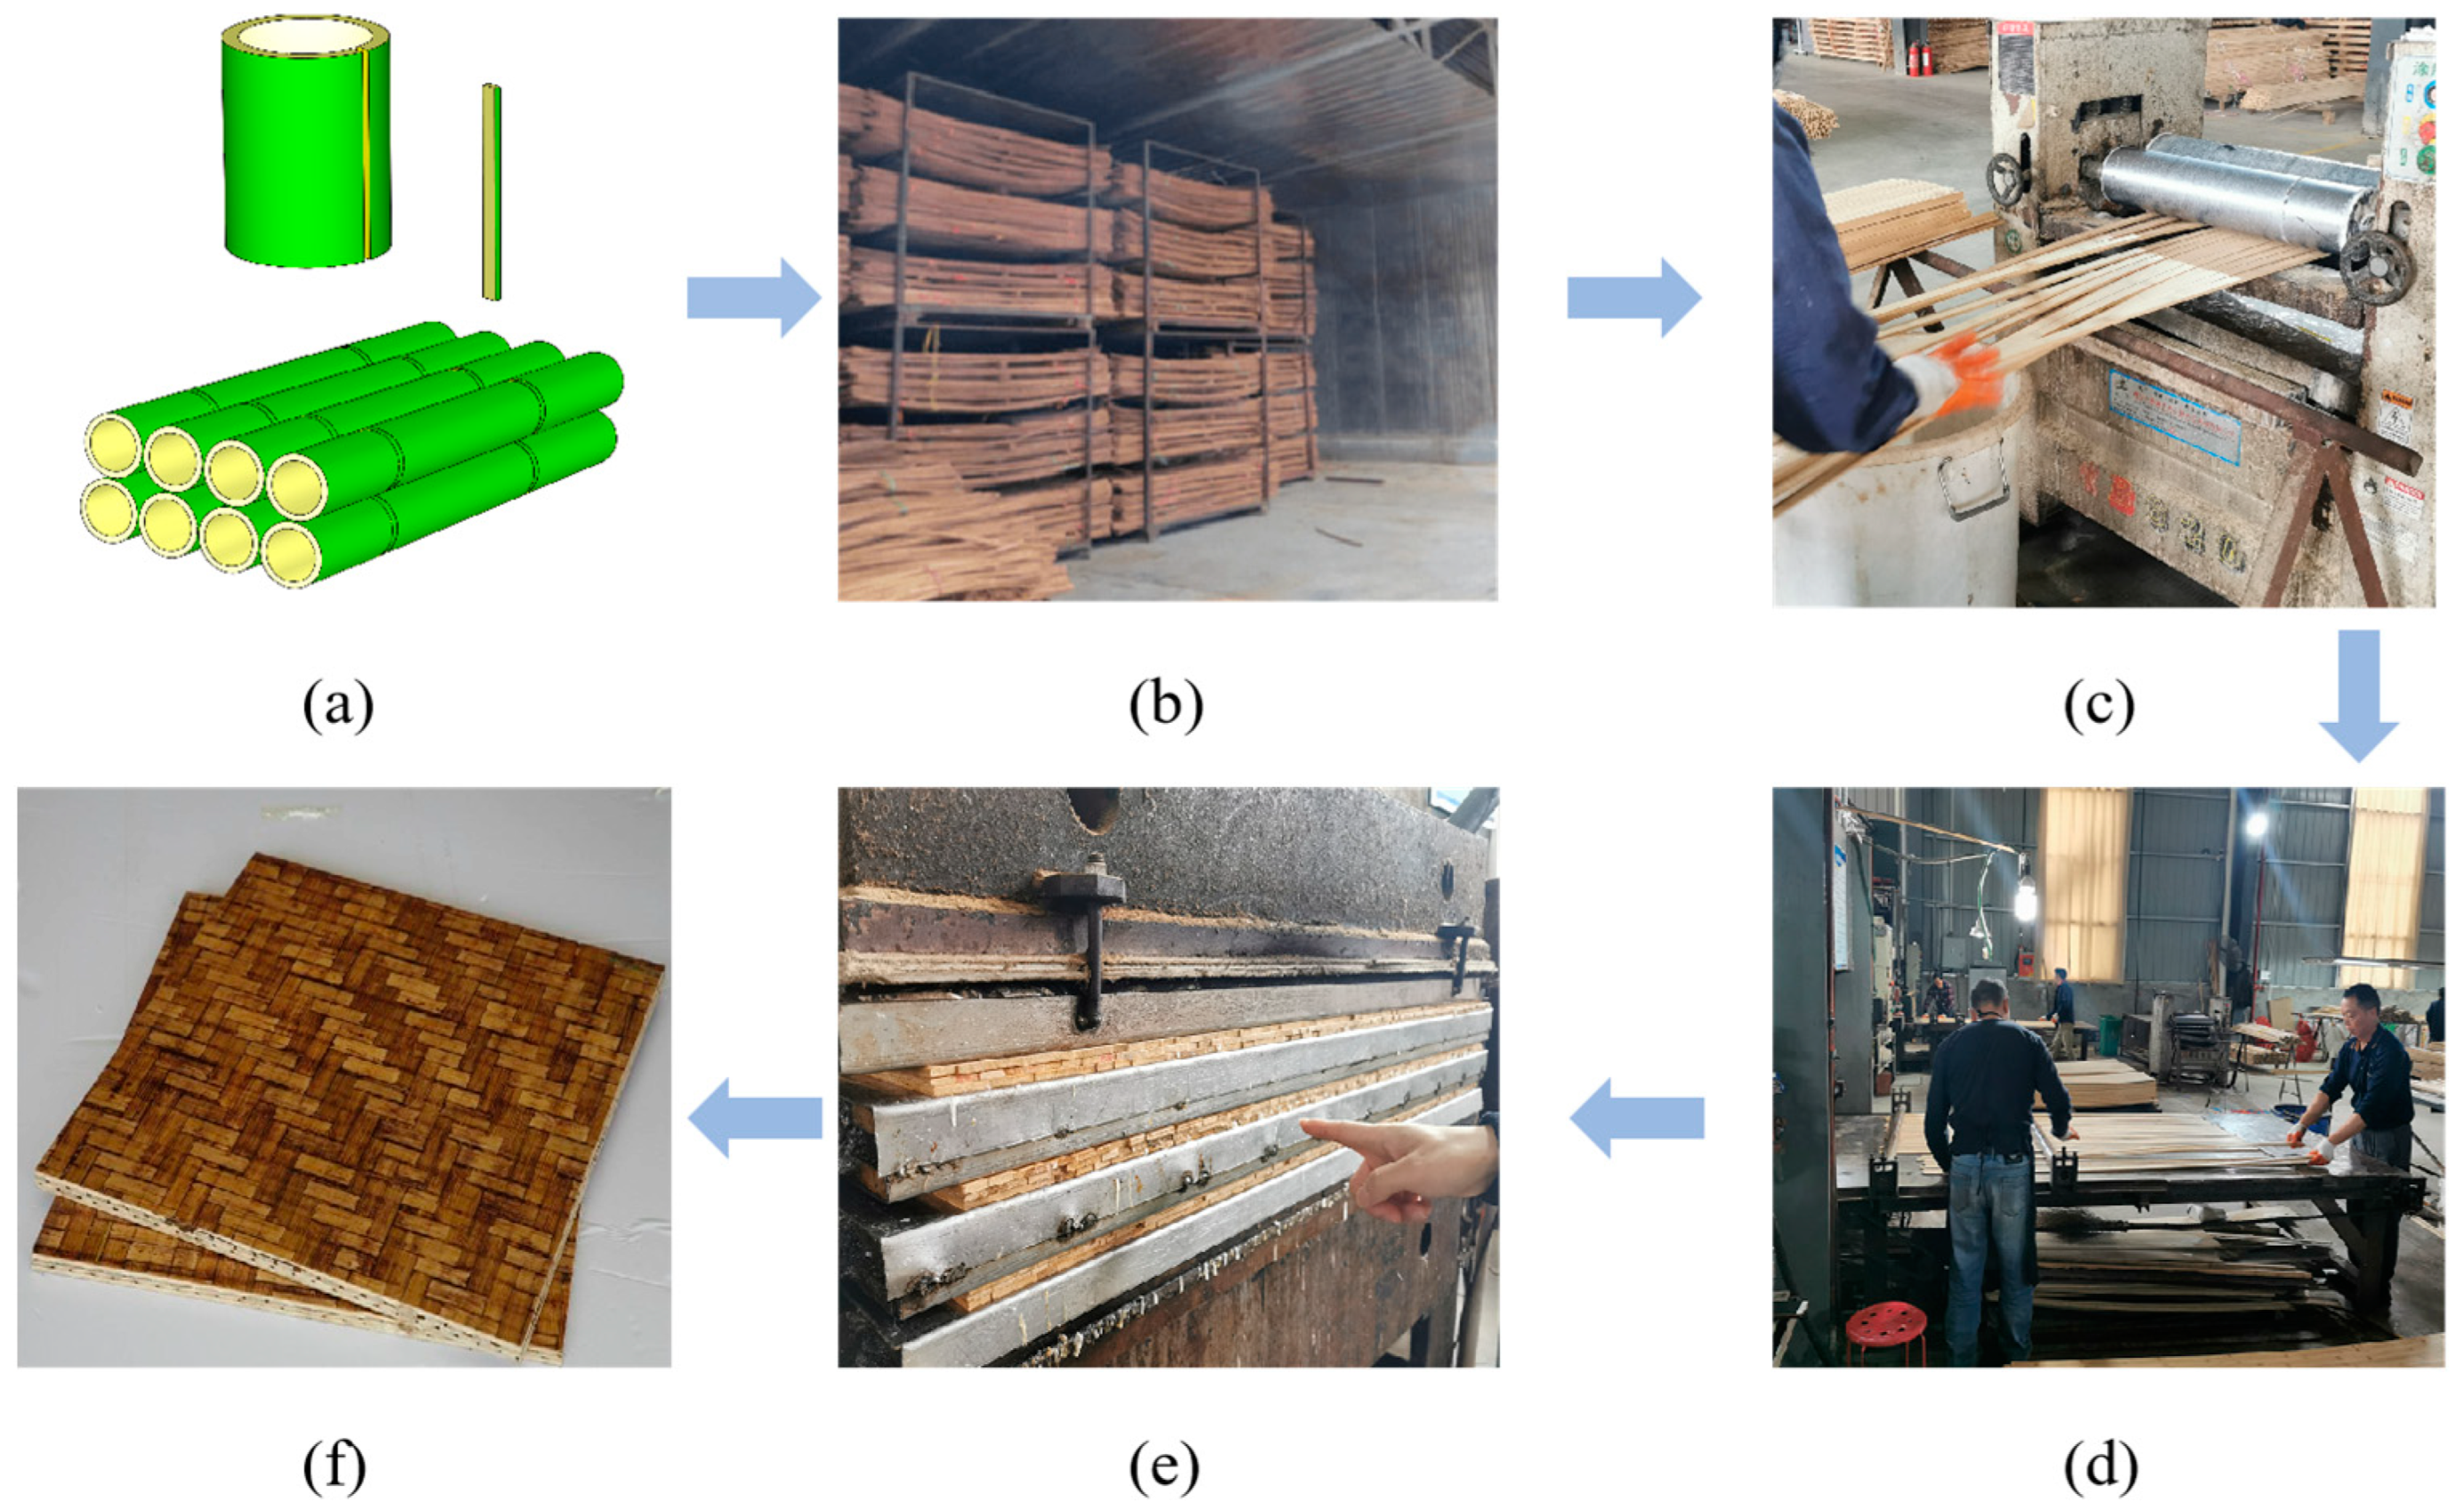
2.1. Test Material
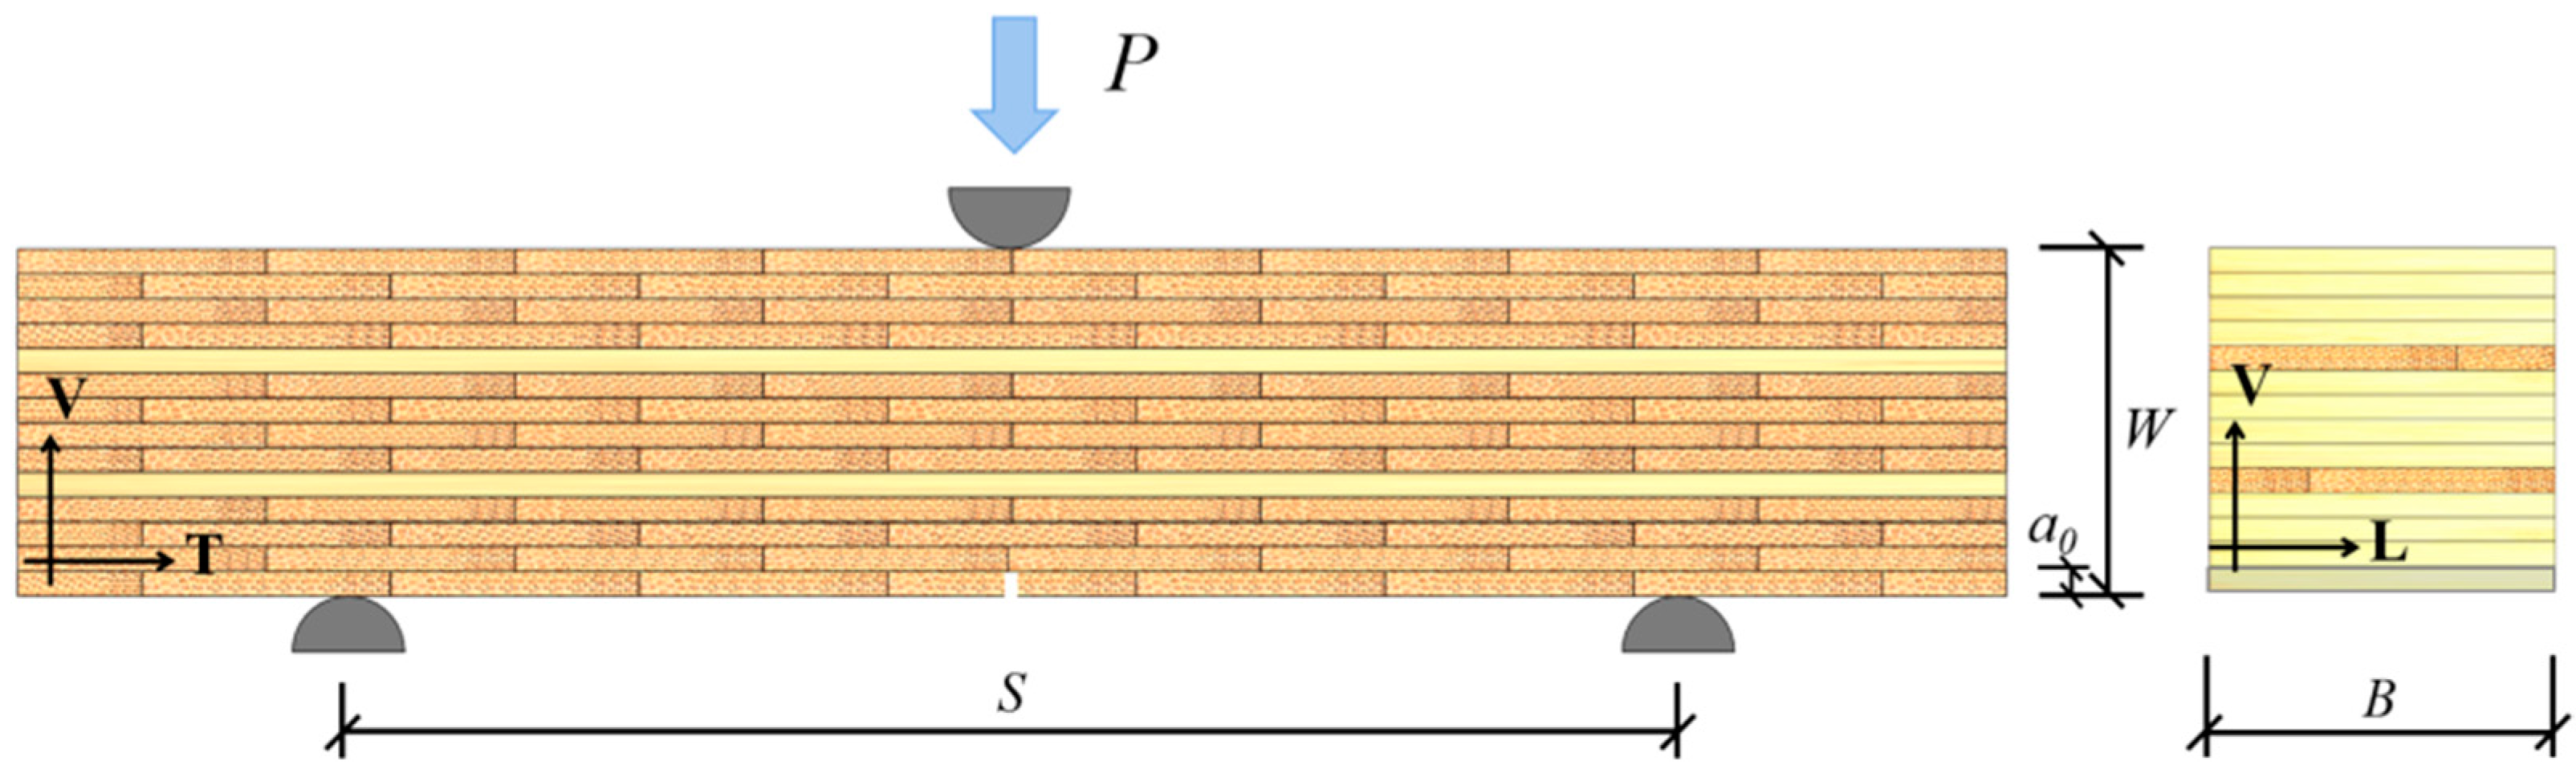
2.2. Test Method
3. Test Results
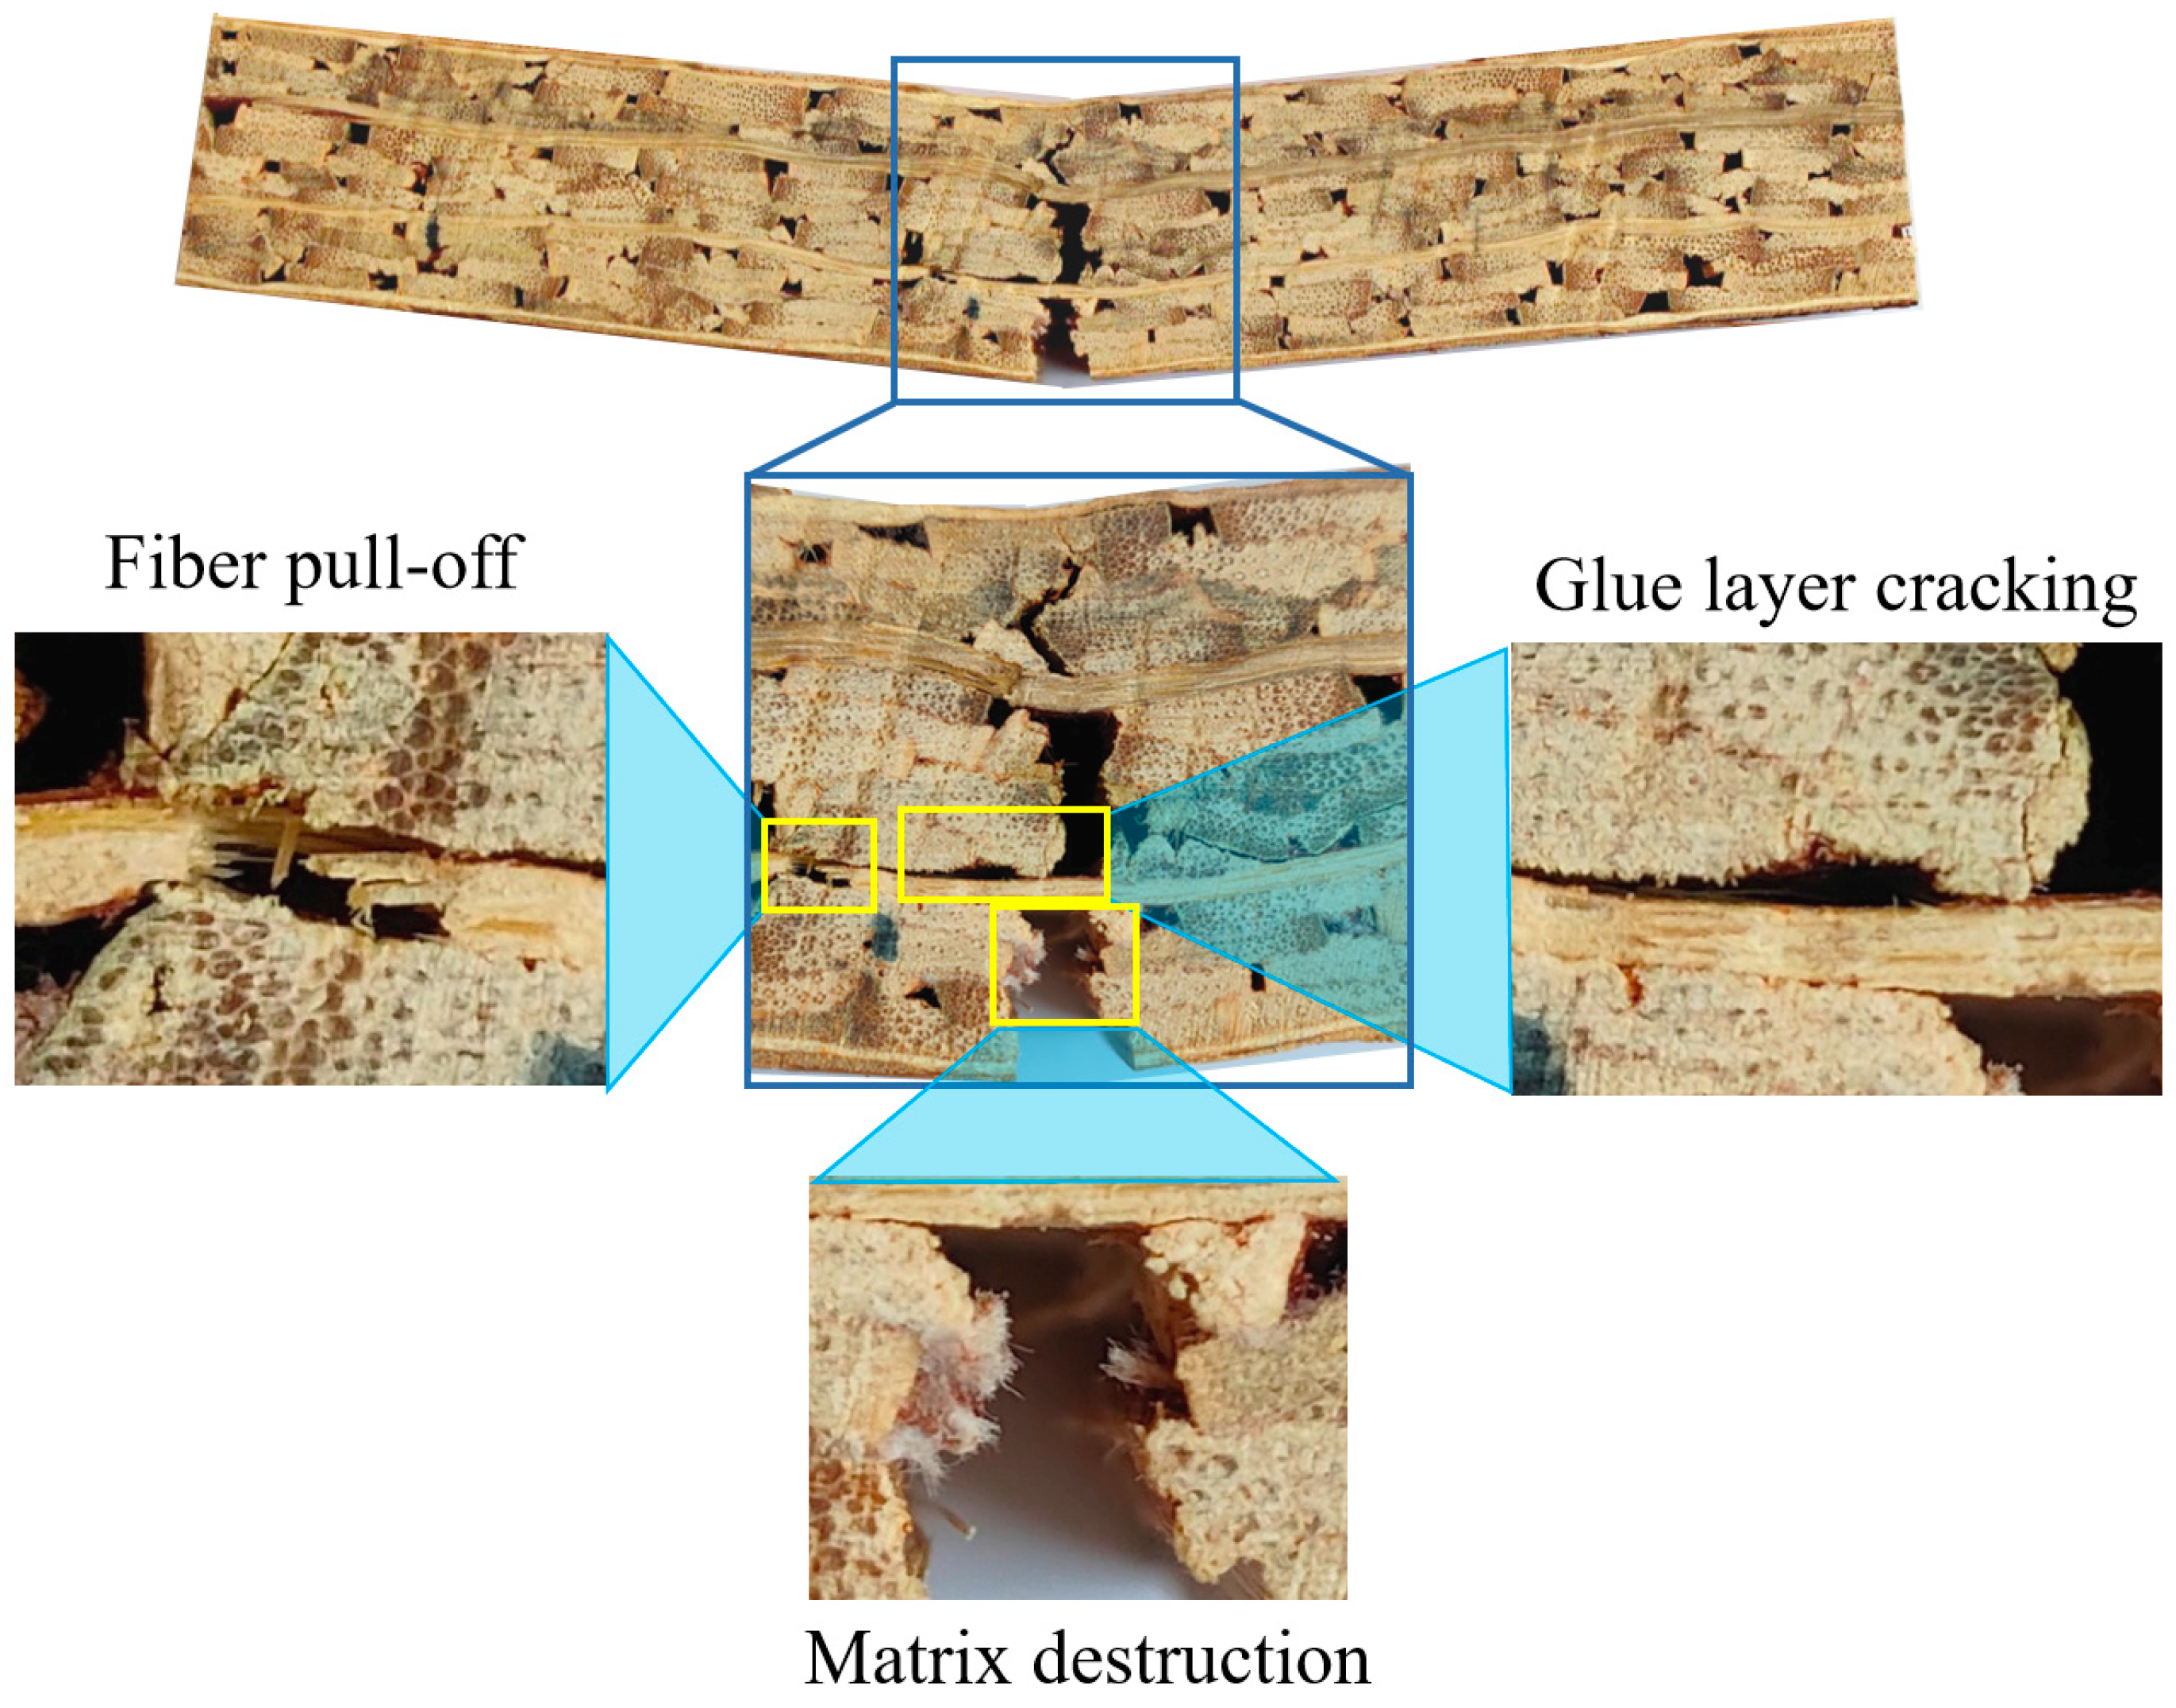
3.1. Fracture Crack Modes
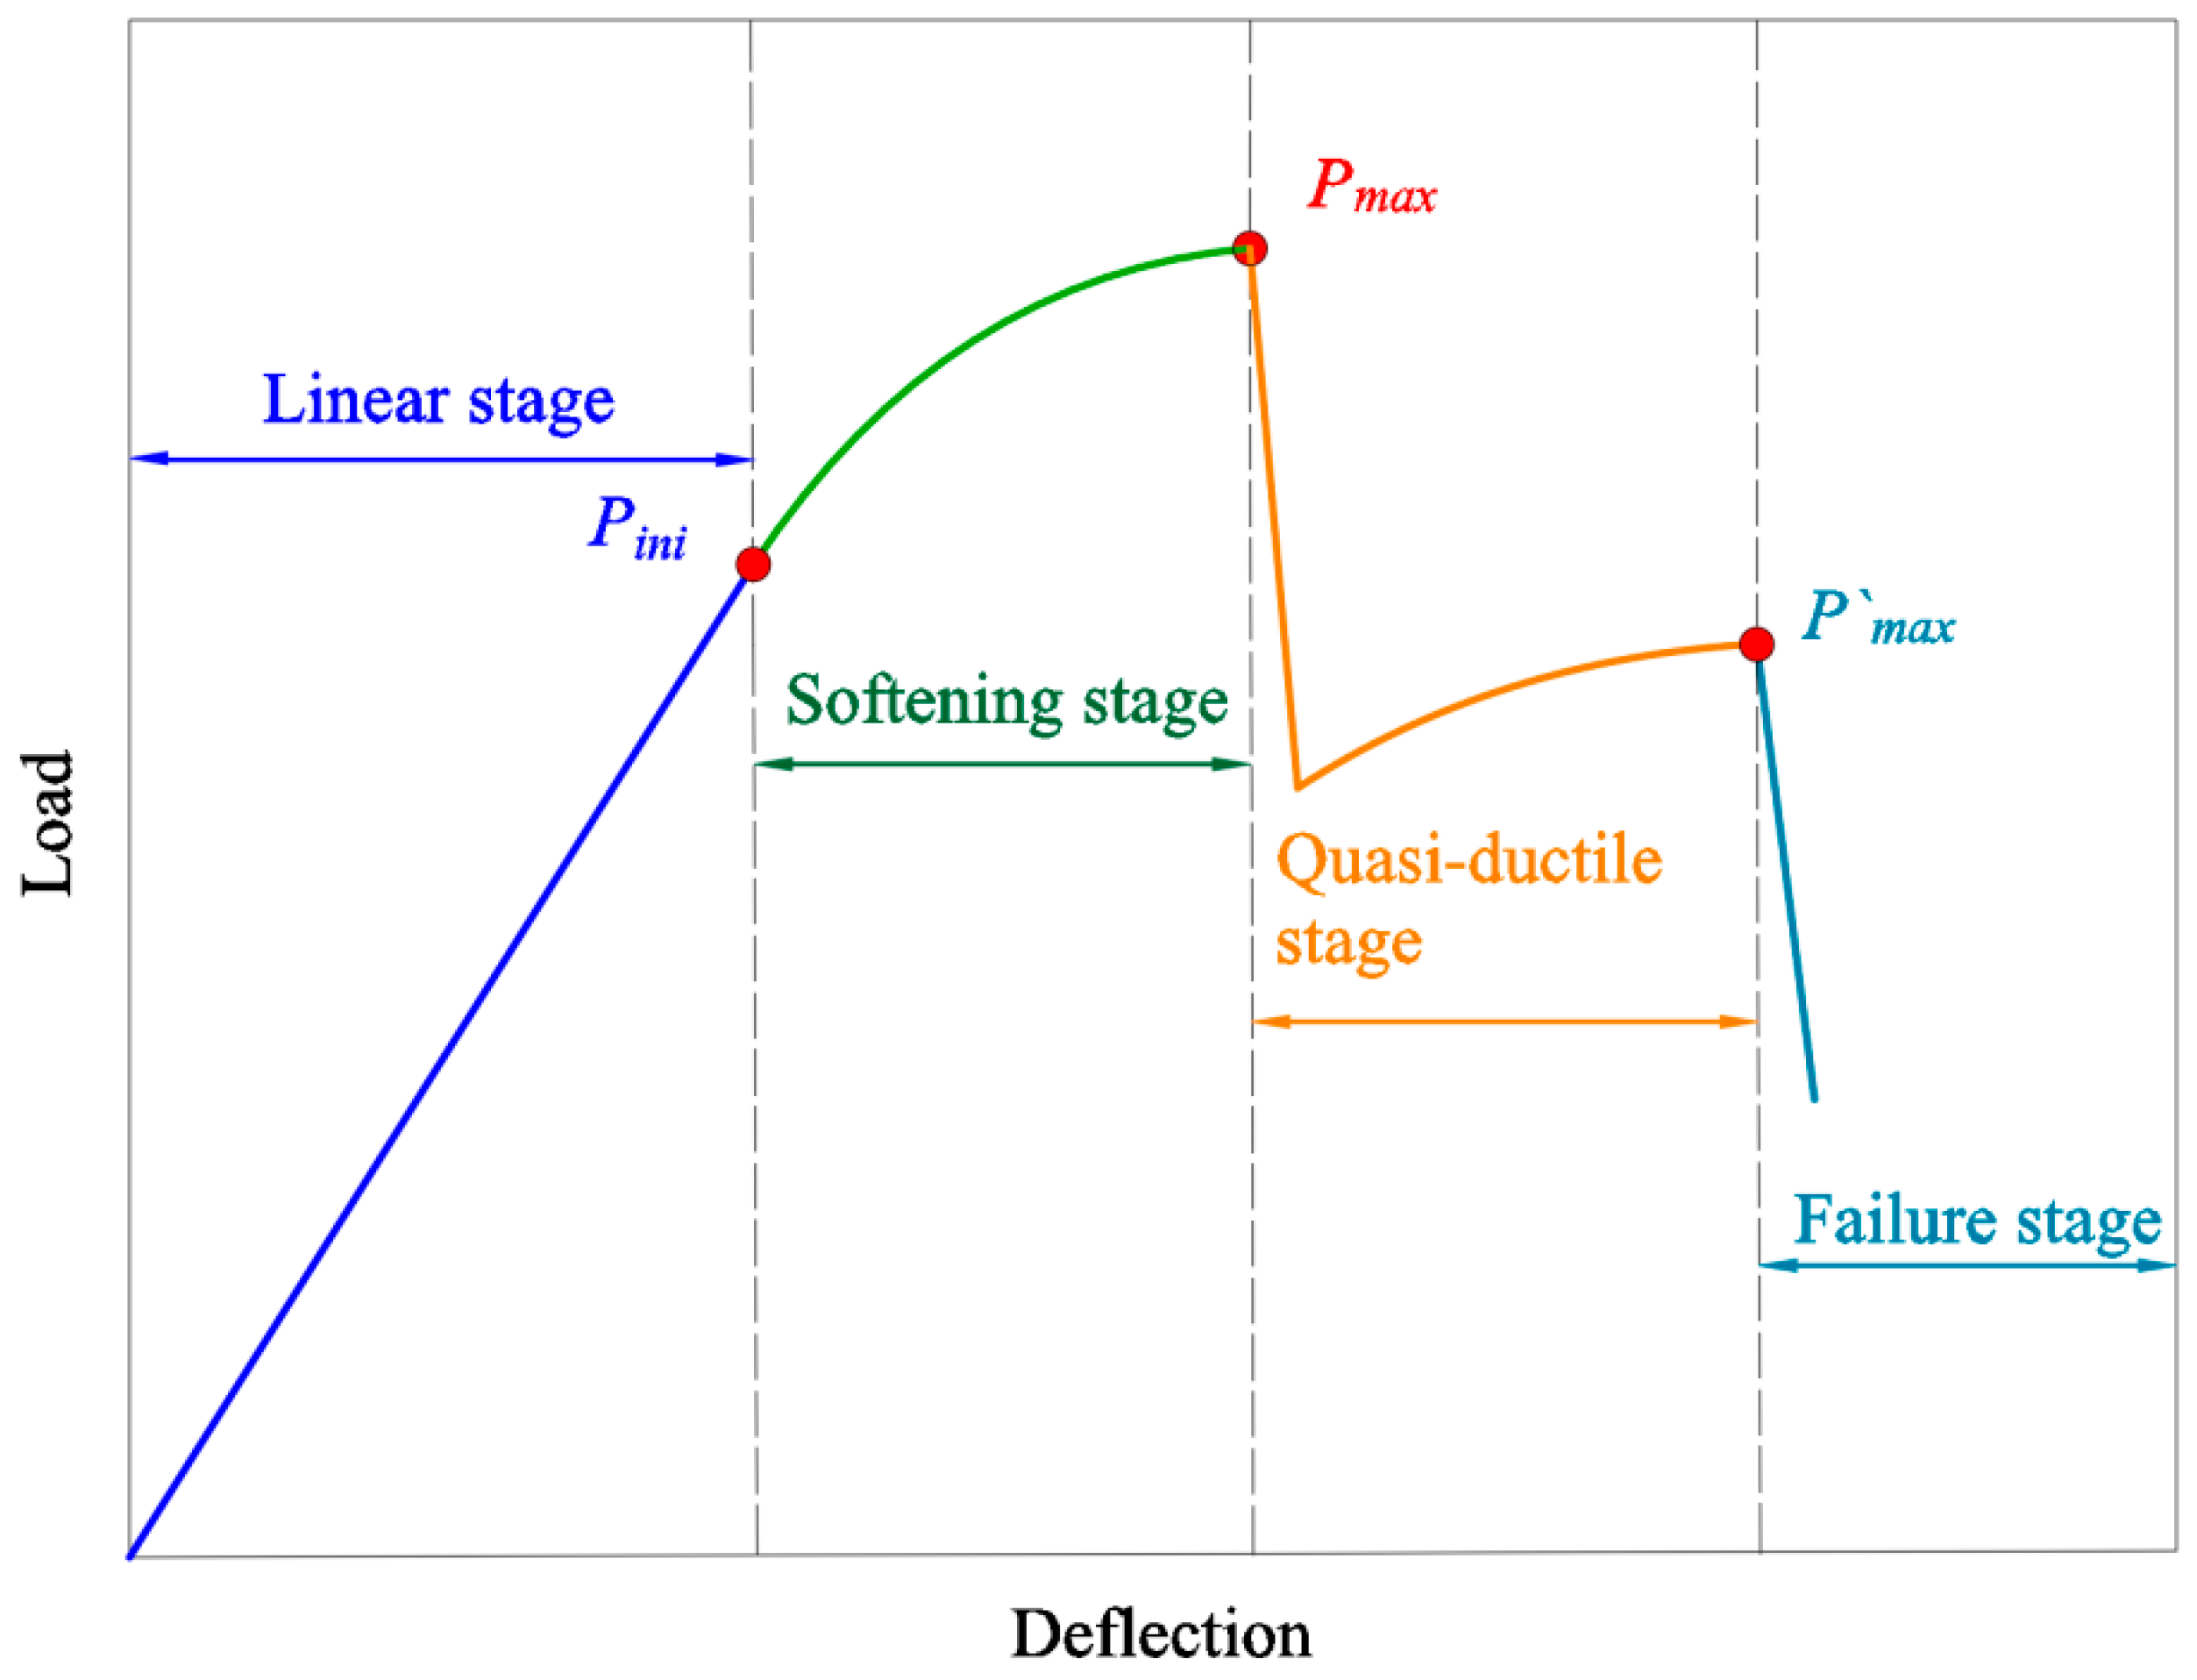
3.2. Quasi-Ductile Fracture Process
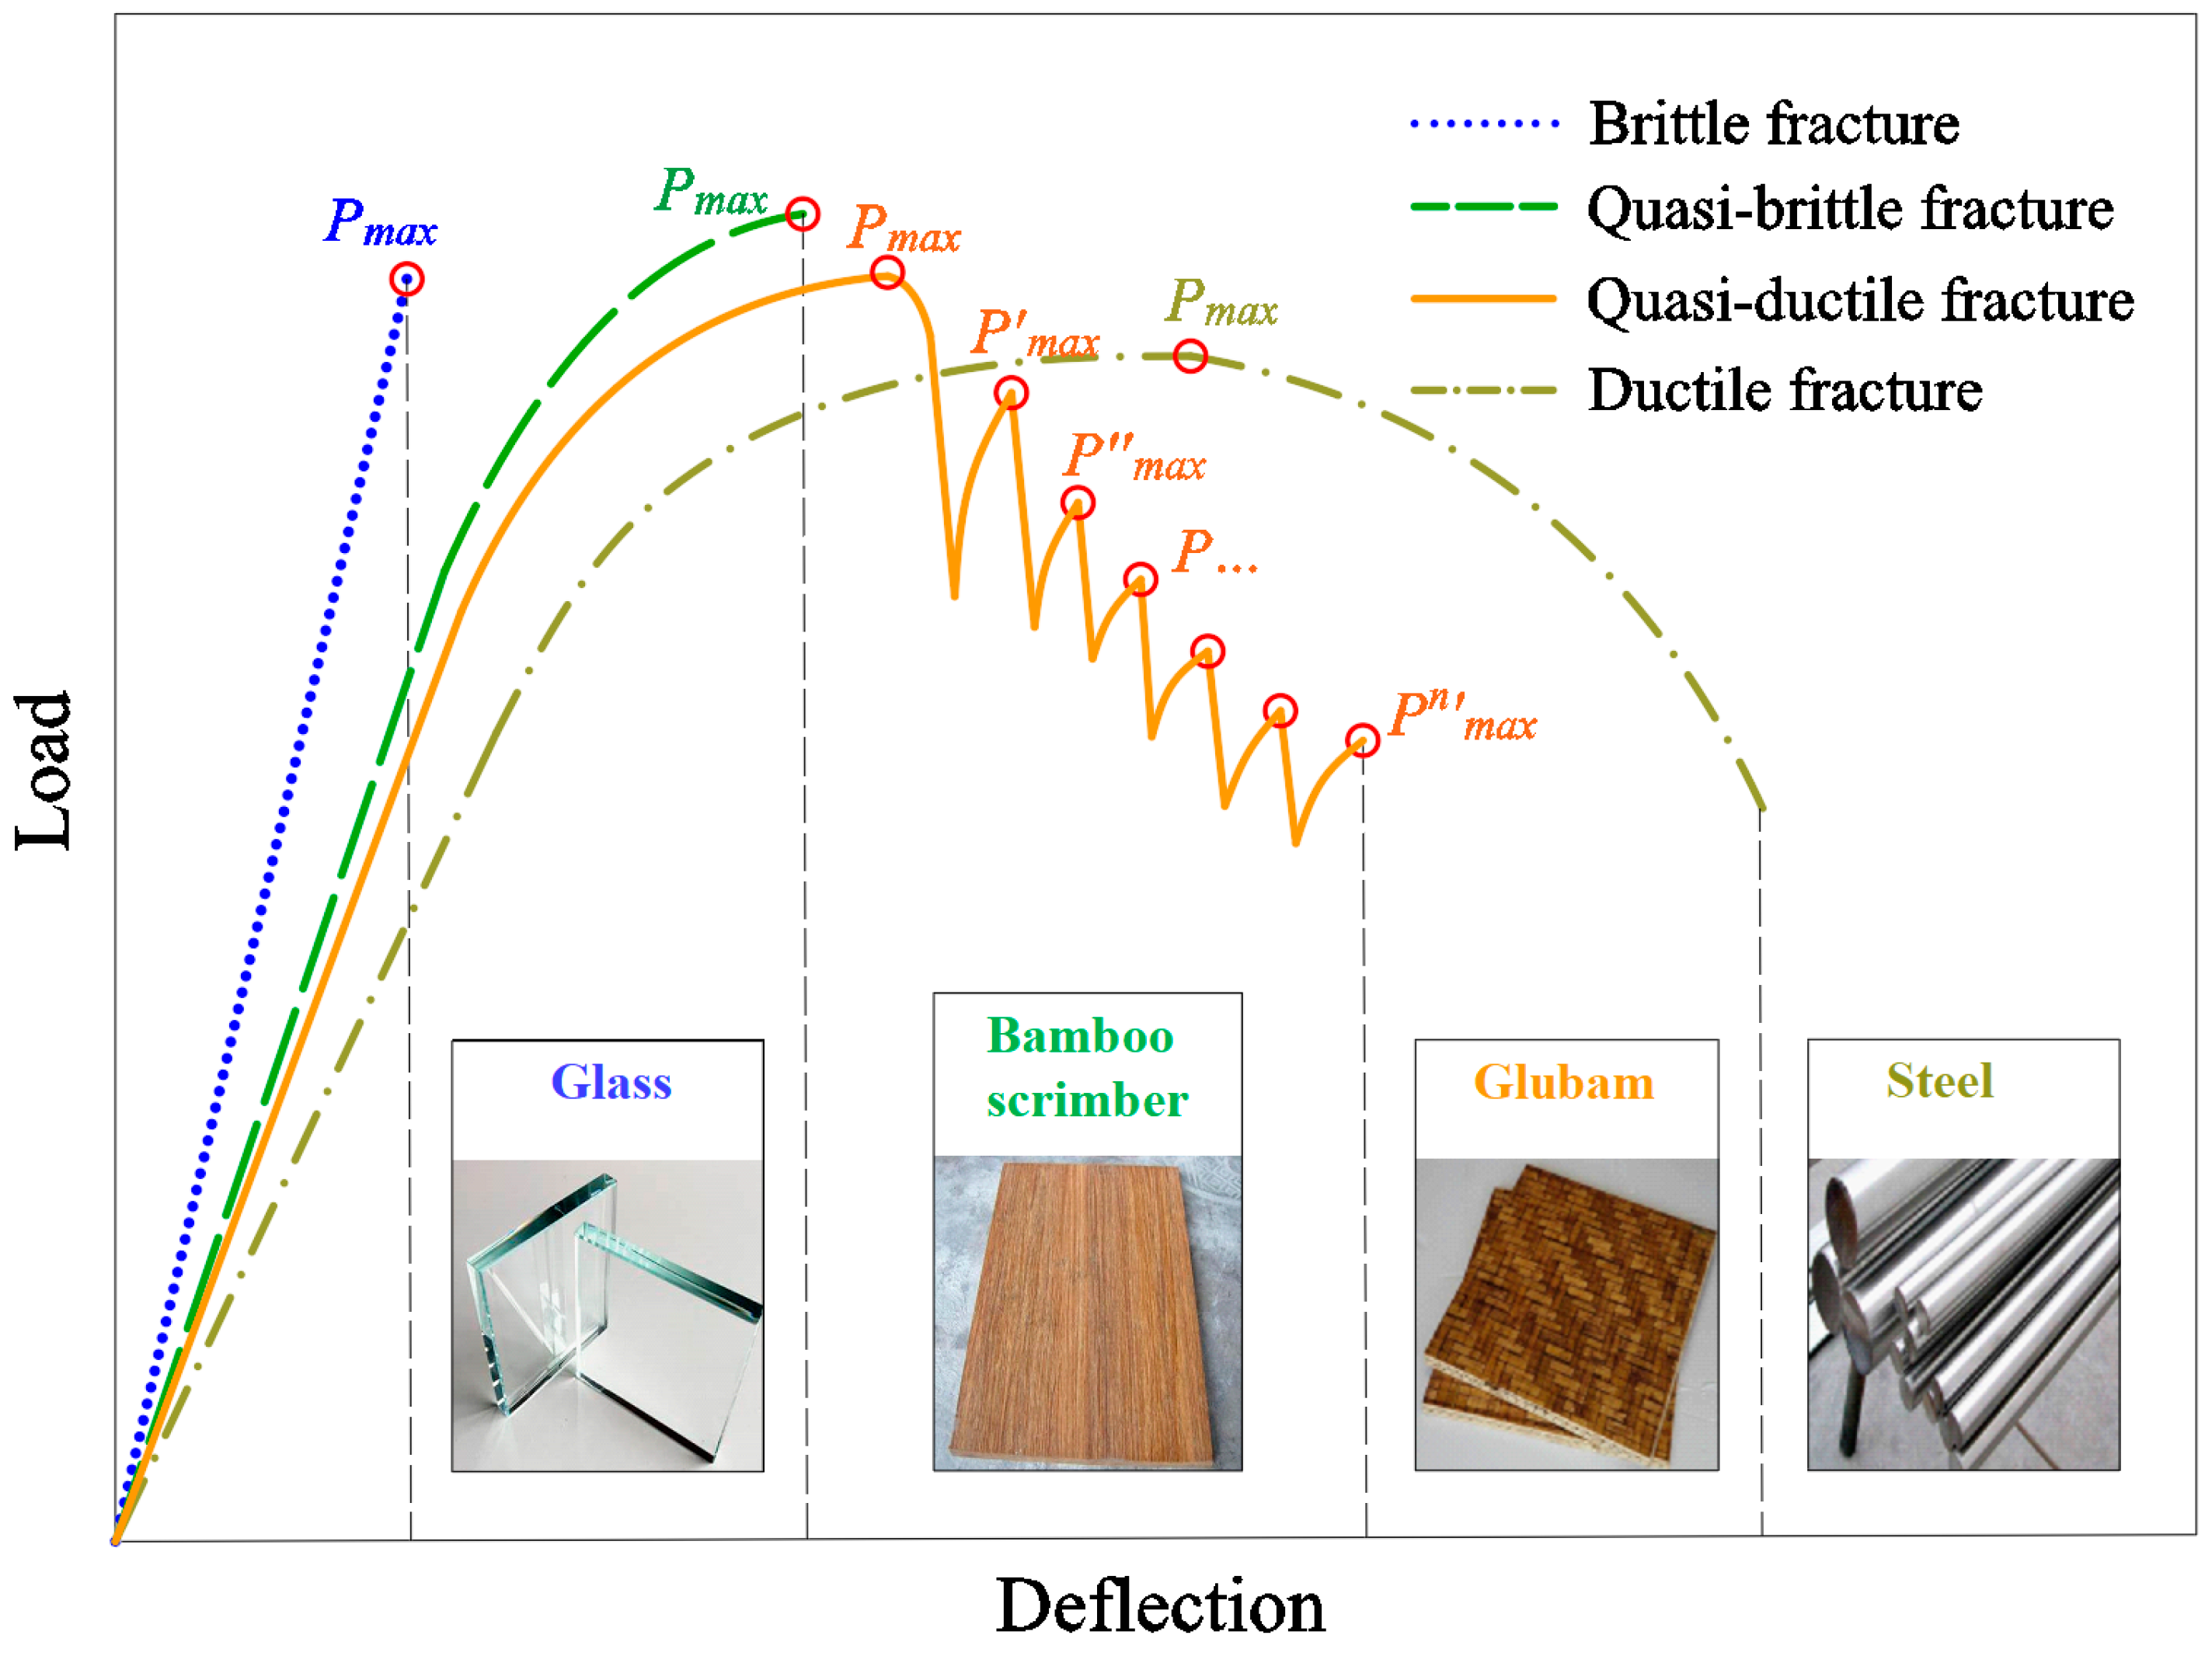
3.3. Comparison between Different Four Fracture Modes
4. Fracture Parameters at Pmax in Softening Stage
4.1. Fracture Parameters Calculation
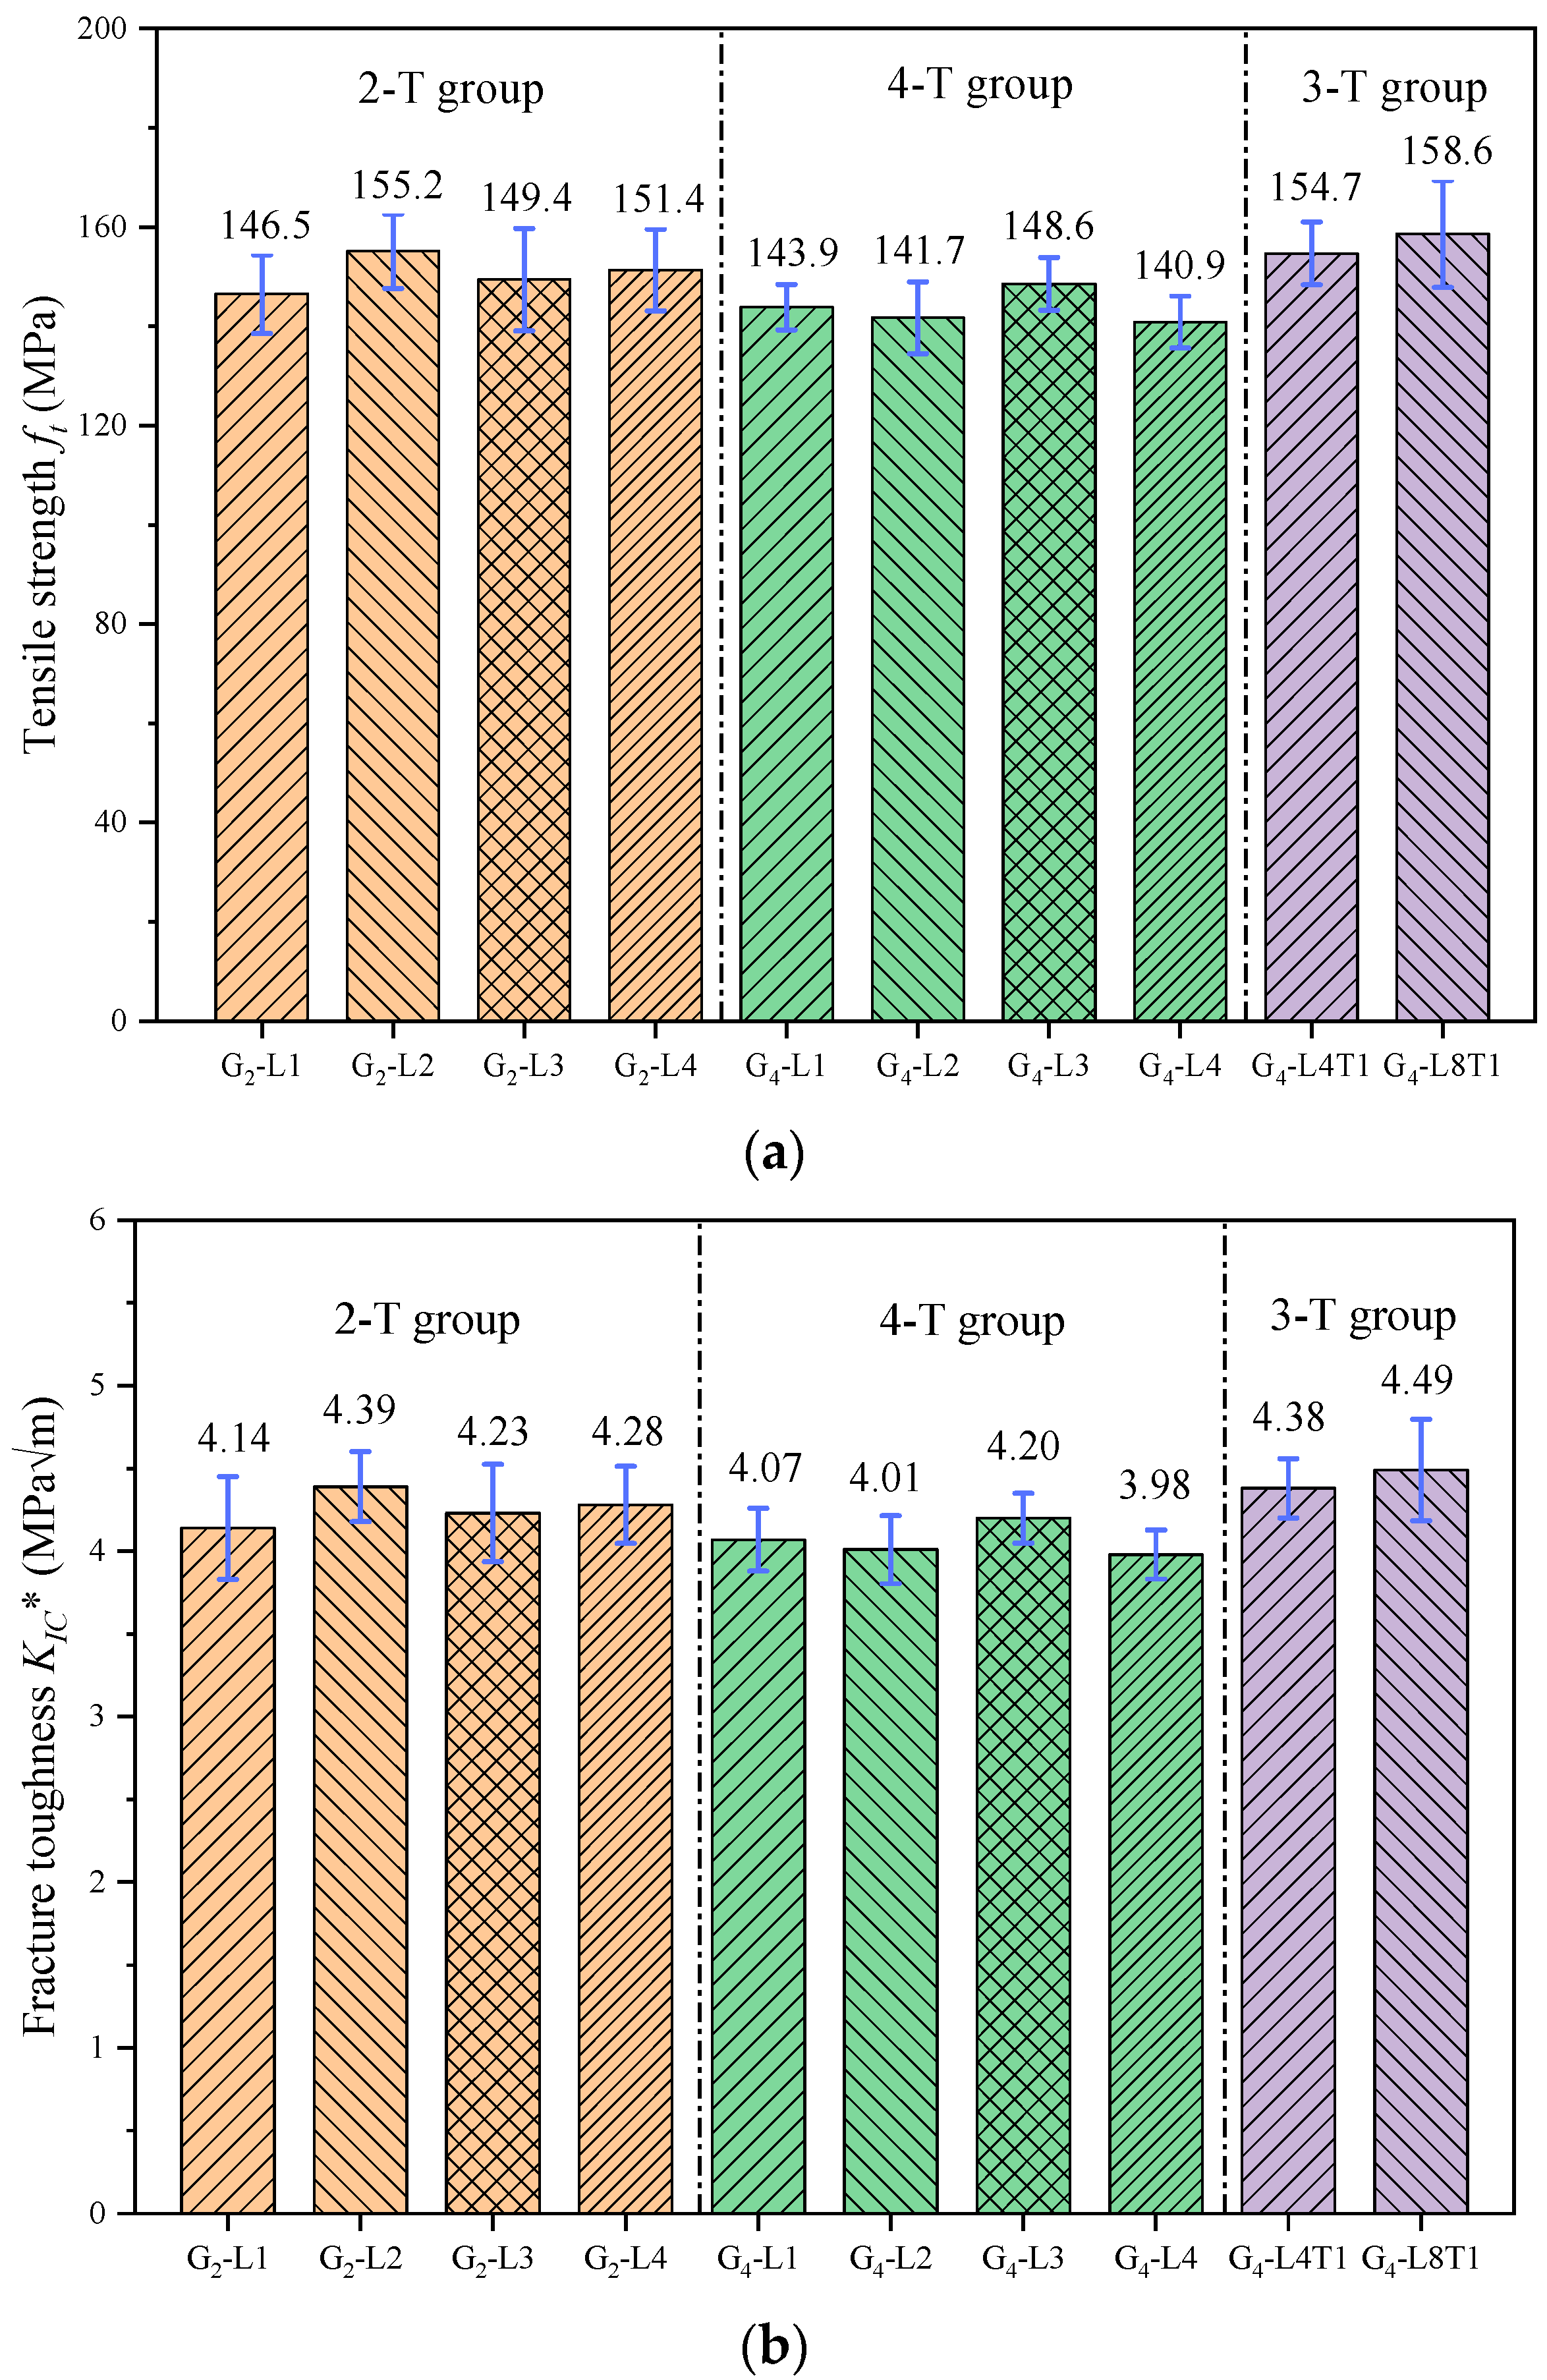
4.2. Statistical Analysis of Fracture Parameters
5. Fracture Parameters at P′max in the Quasi-Ductile Stage
5.1. Fracture Parameters in the Quasi-Ductile Stage
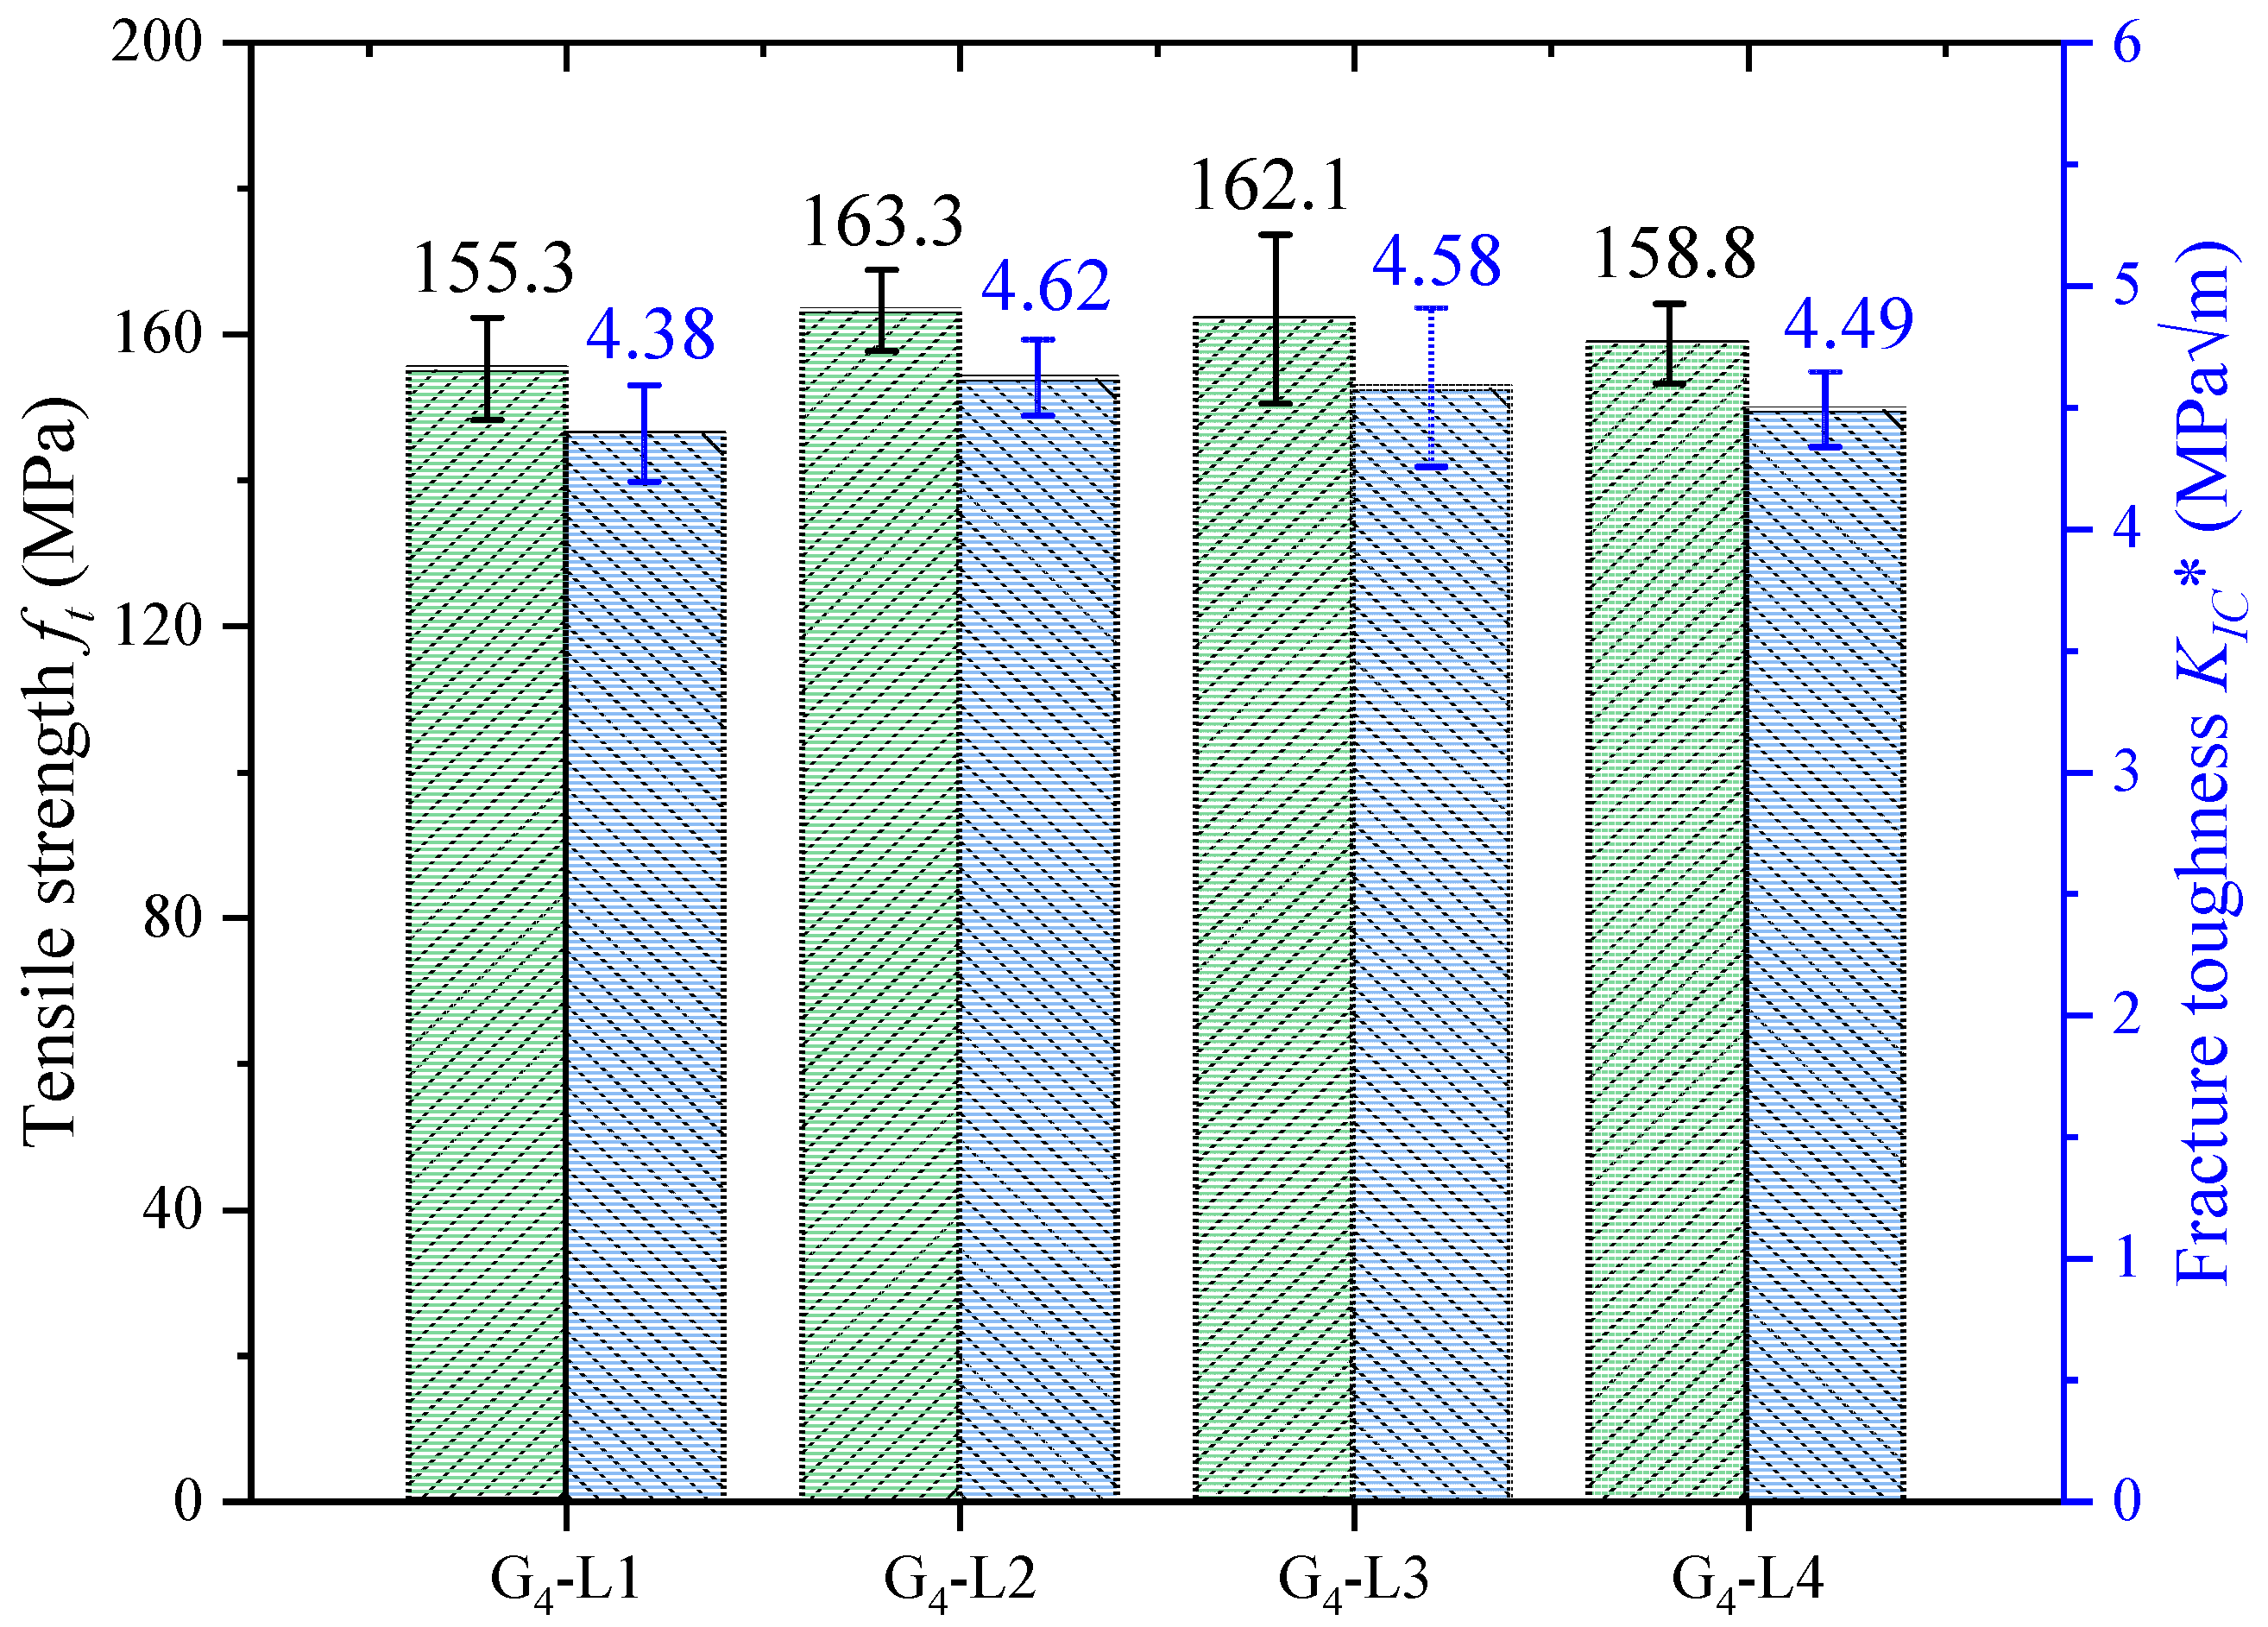
5.2. Statistical Analysis of Fracture Parameters in the Quasi-Ductile Stage
5.3. Relation of Two-Stage Fracture Parameters
6. Discussion on Quasi-Ductile Fracture Behavior
6.1. Quasi-Ductile Fracture Behavior in Bamboo Fibrous Composites
6.2. Quasi-Ductile Fracture Behavior in Ceramic Materials
6.3. Quasi-Ductile Fracture Behavior in Masonry Structures
7. Conclusions
- (1)
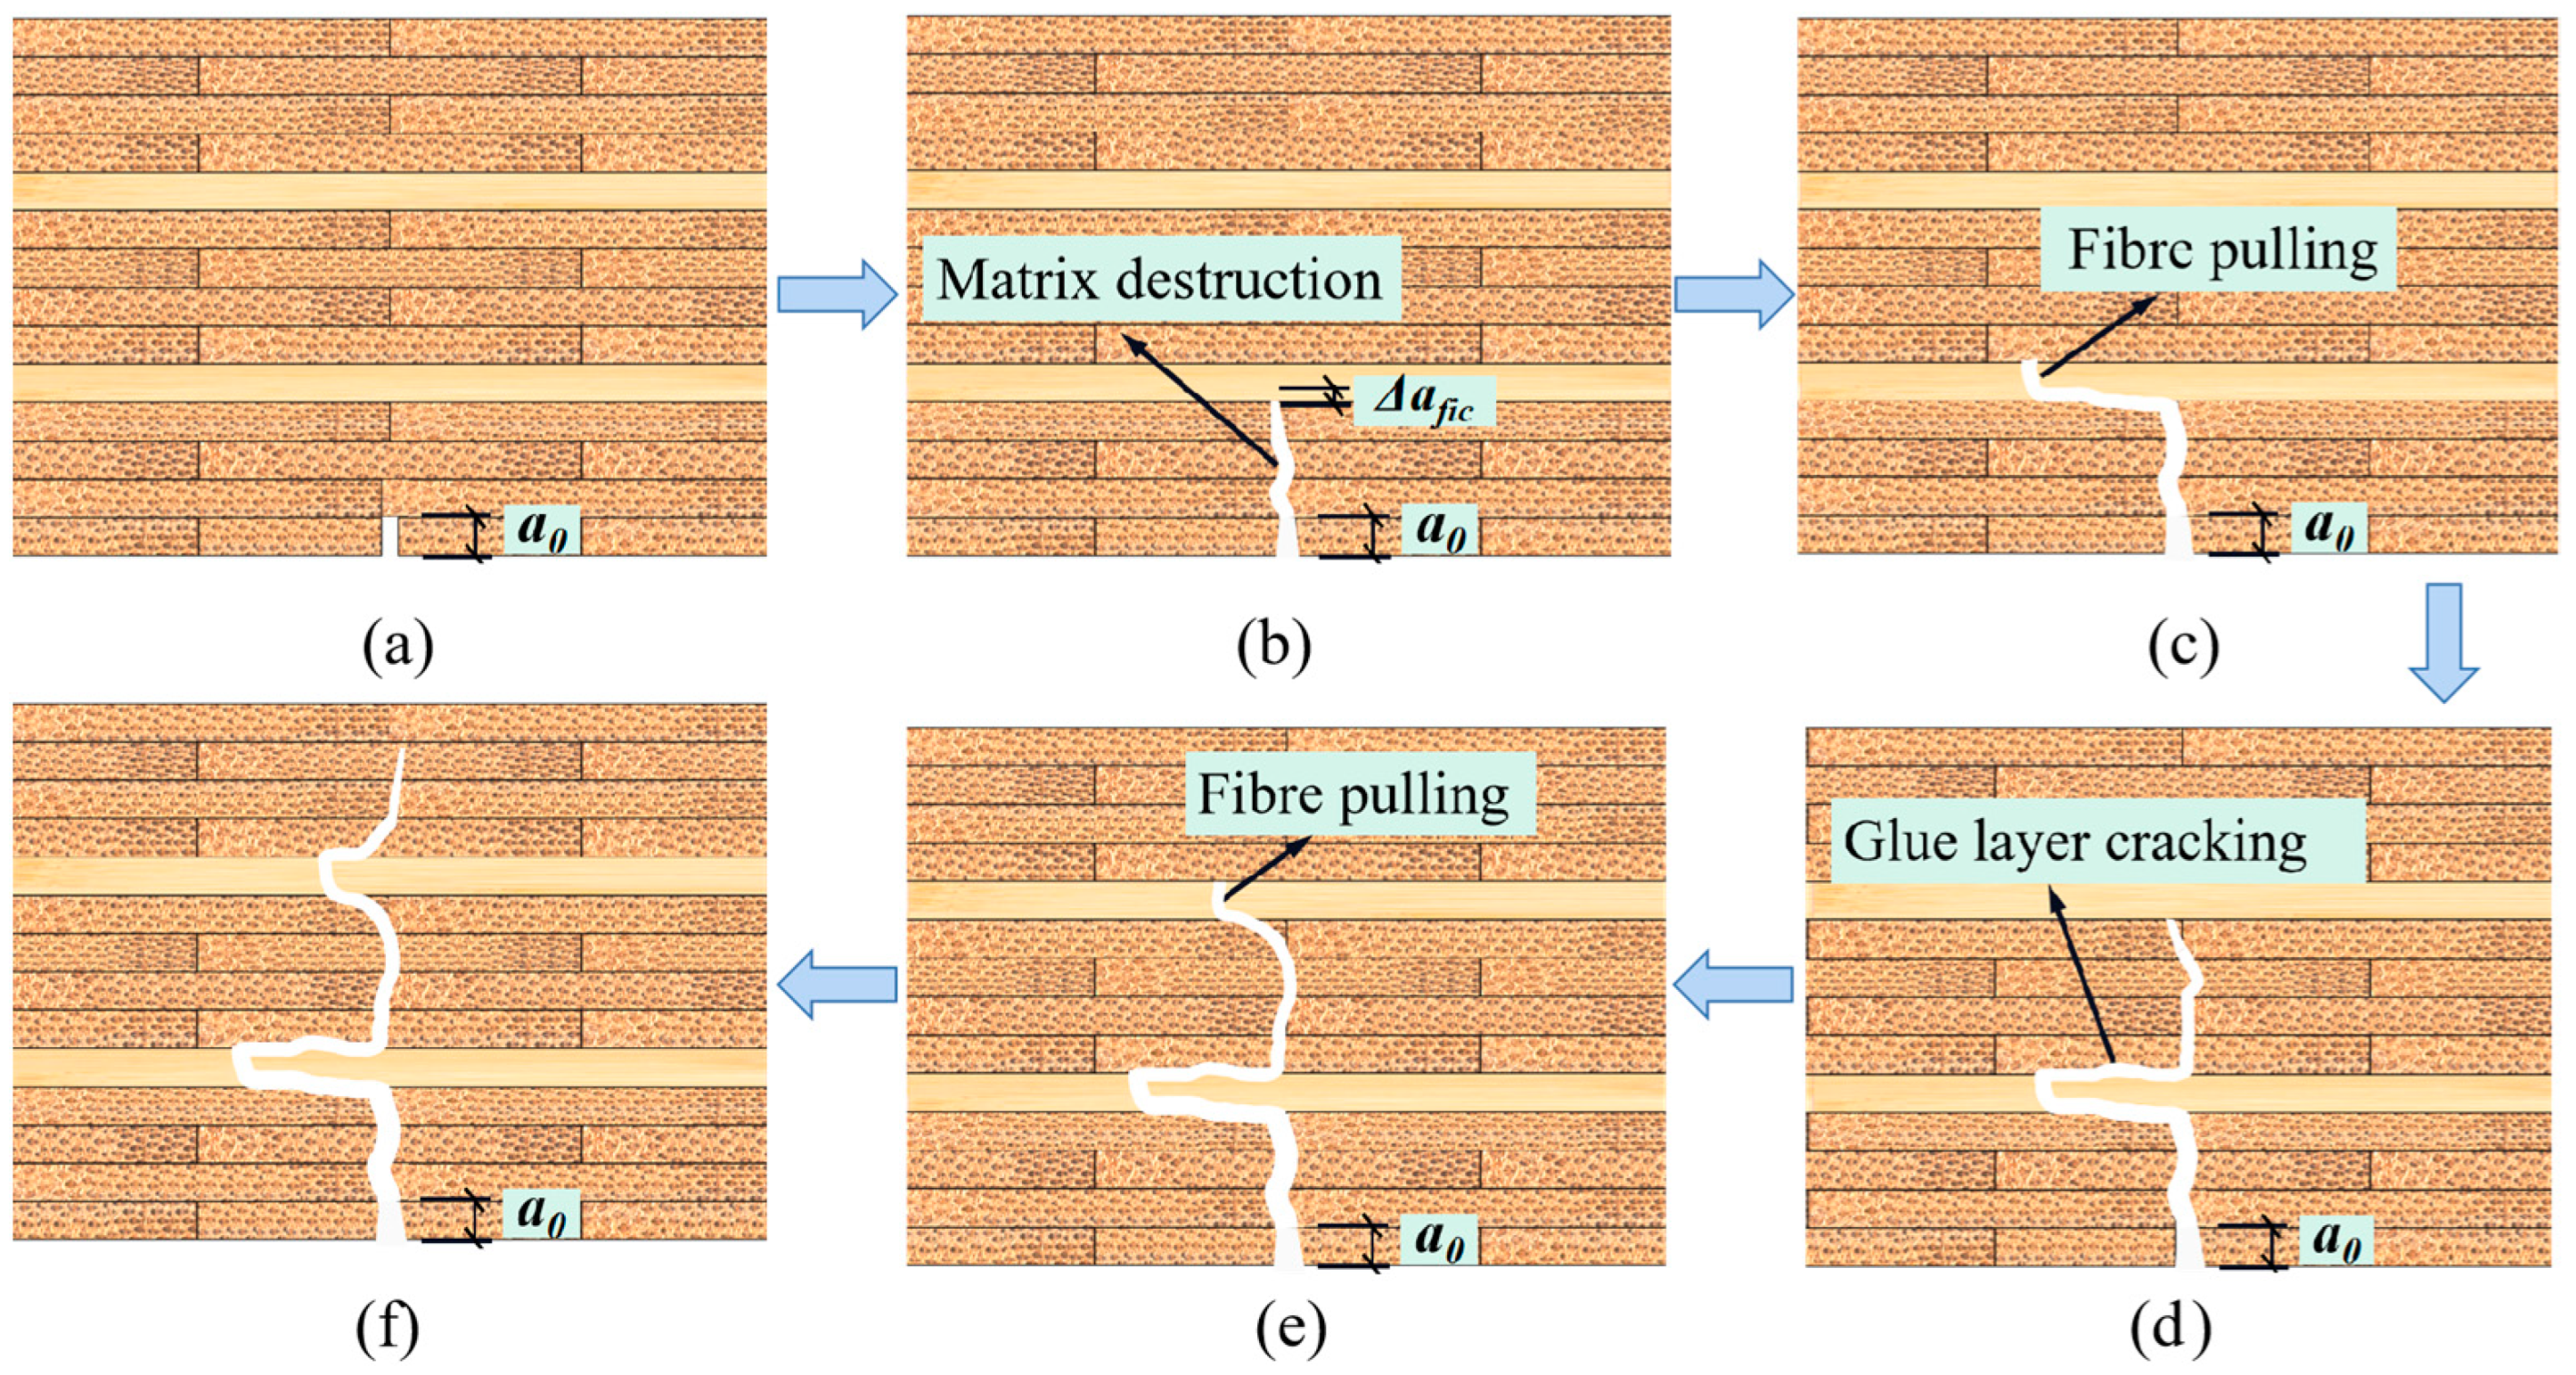
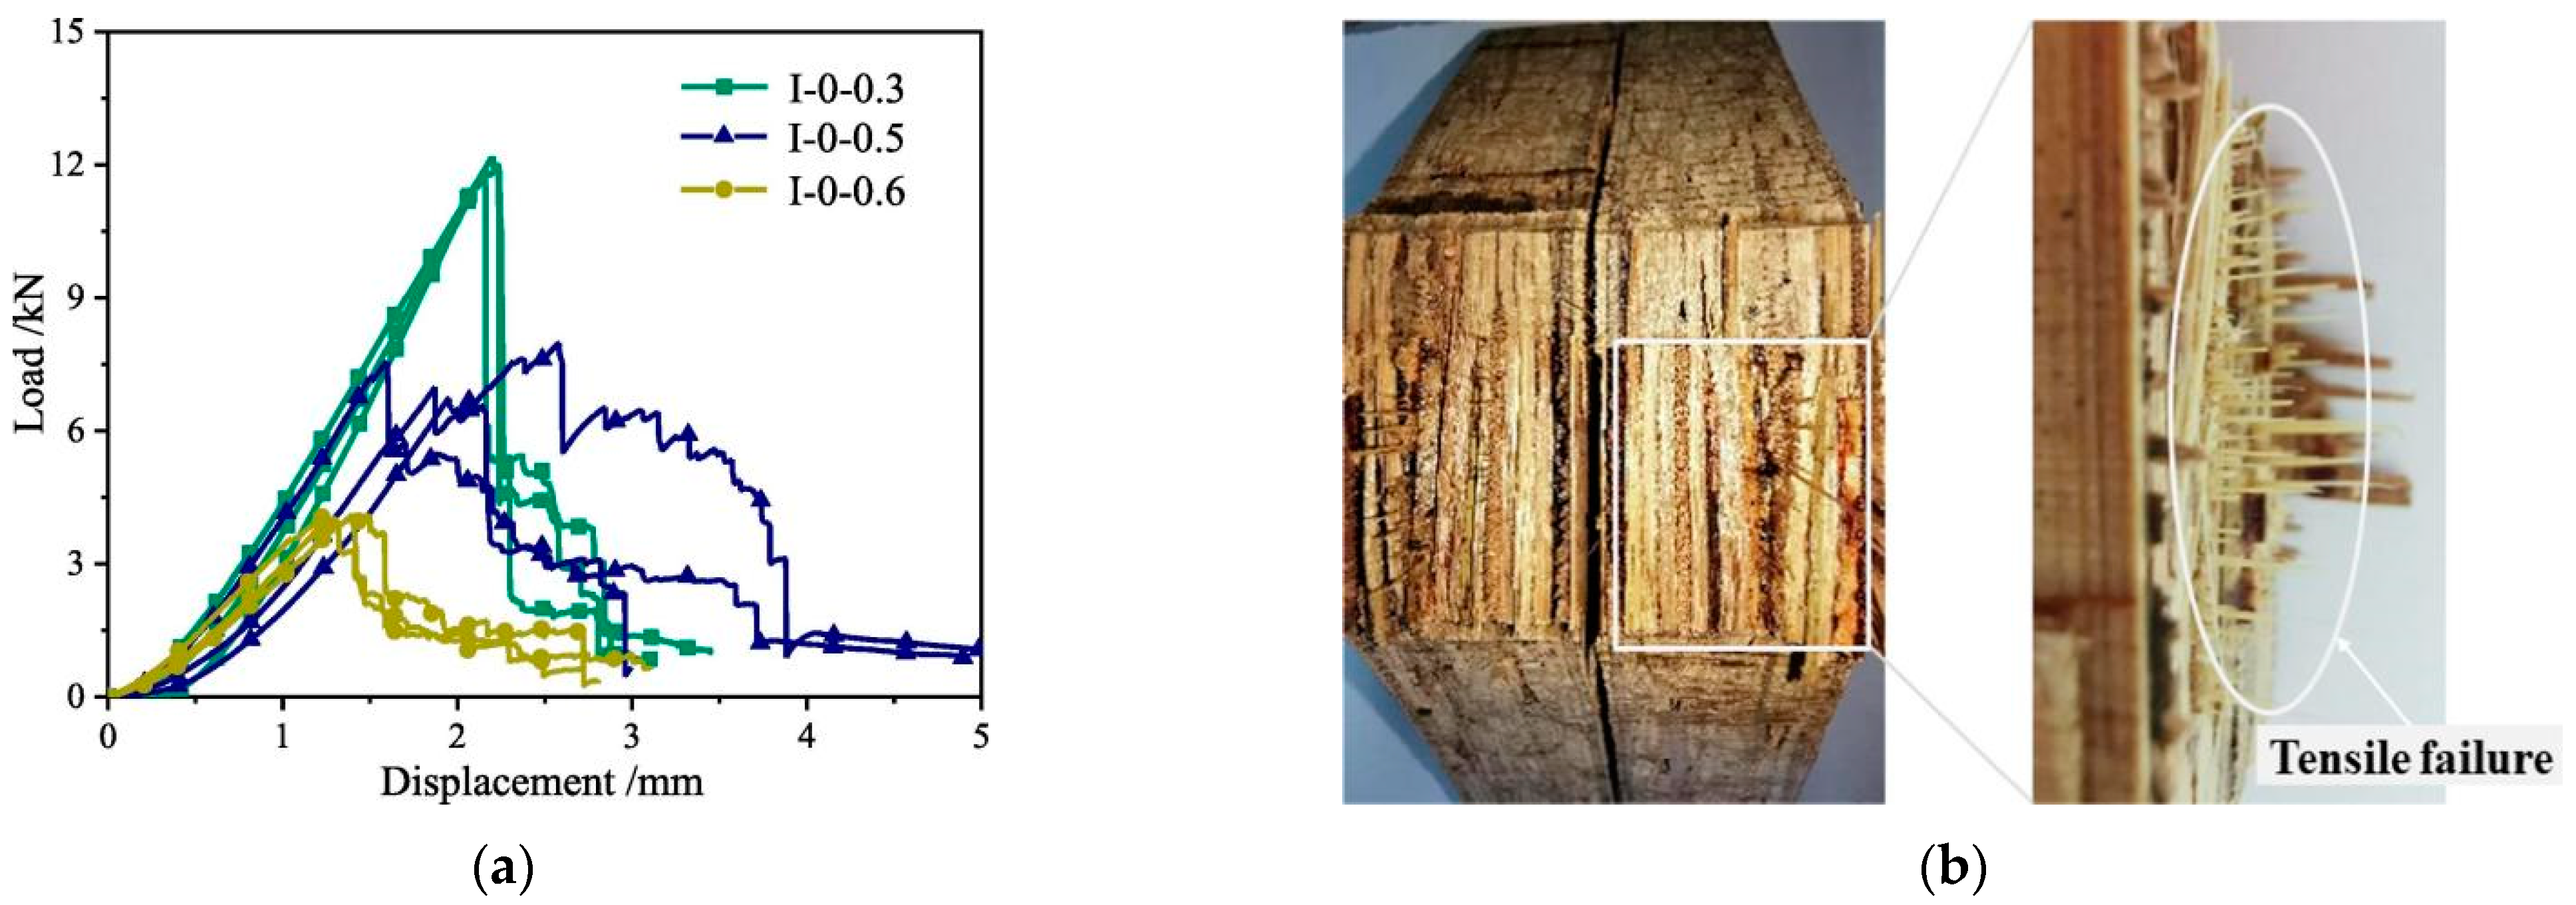
- The fracture process of glubam can be divided into four stages, including the linear stage, softening stage, quasi-ductile stage, and failure stage. In the linear stage, the load is small and does not exceed the elastic limit of the glubam, so the load–deflection curve is linear. During the softening stage, the load–deflection curve shows non-linearity. When the fictitious crack in the T-layer reaches Δafic, the load reaches Pmax. During the quasi-ductile stage, as the T-layer is pulled apart, the load drops sharply. However, the remaining part can continue to bear the load and reach the second maximum load. Notably, this phenomenon repeats itself as the number of T-layers increases. During the failure stage, all T-layers are completely fractured, and the specimen loses its load-bearing capacity completely.
- (2)
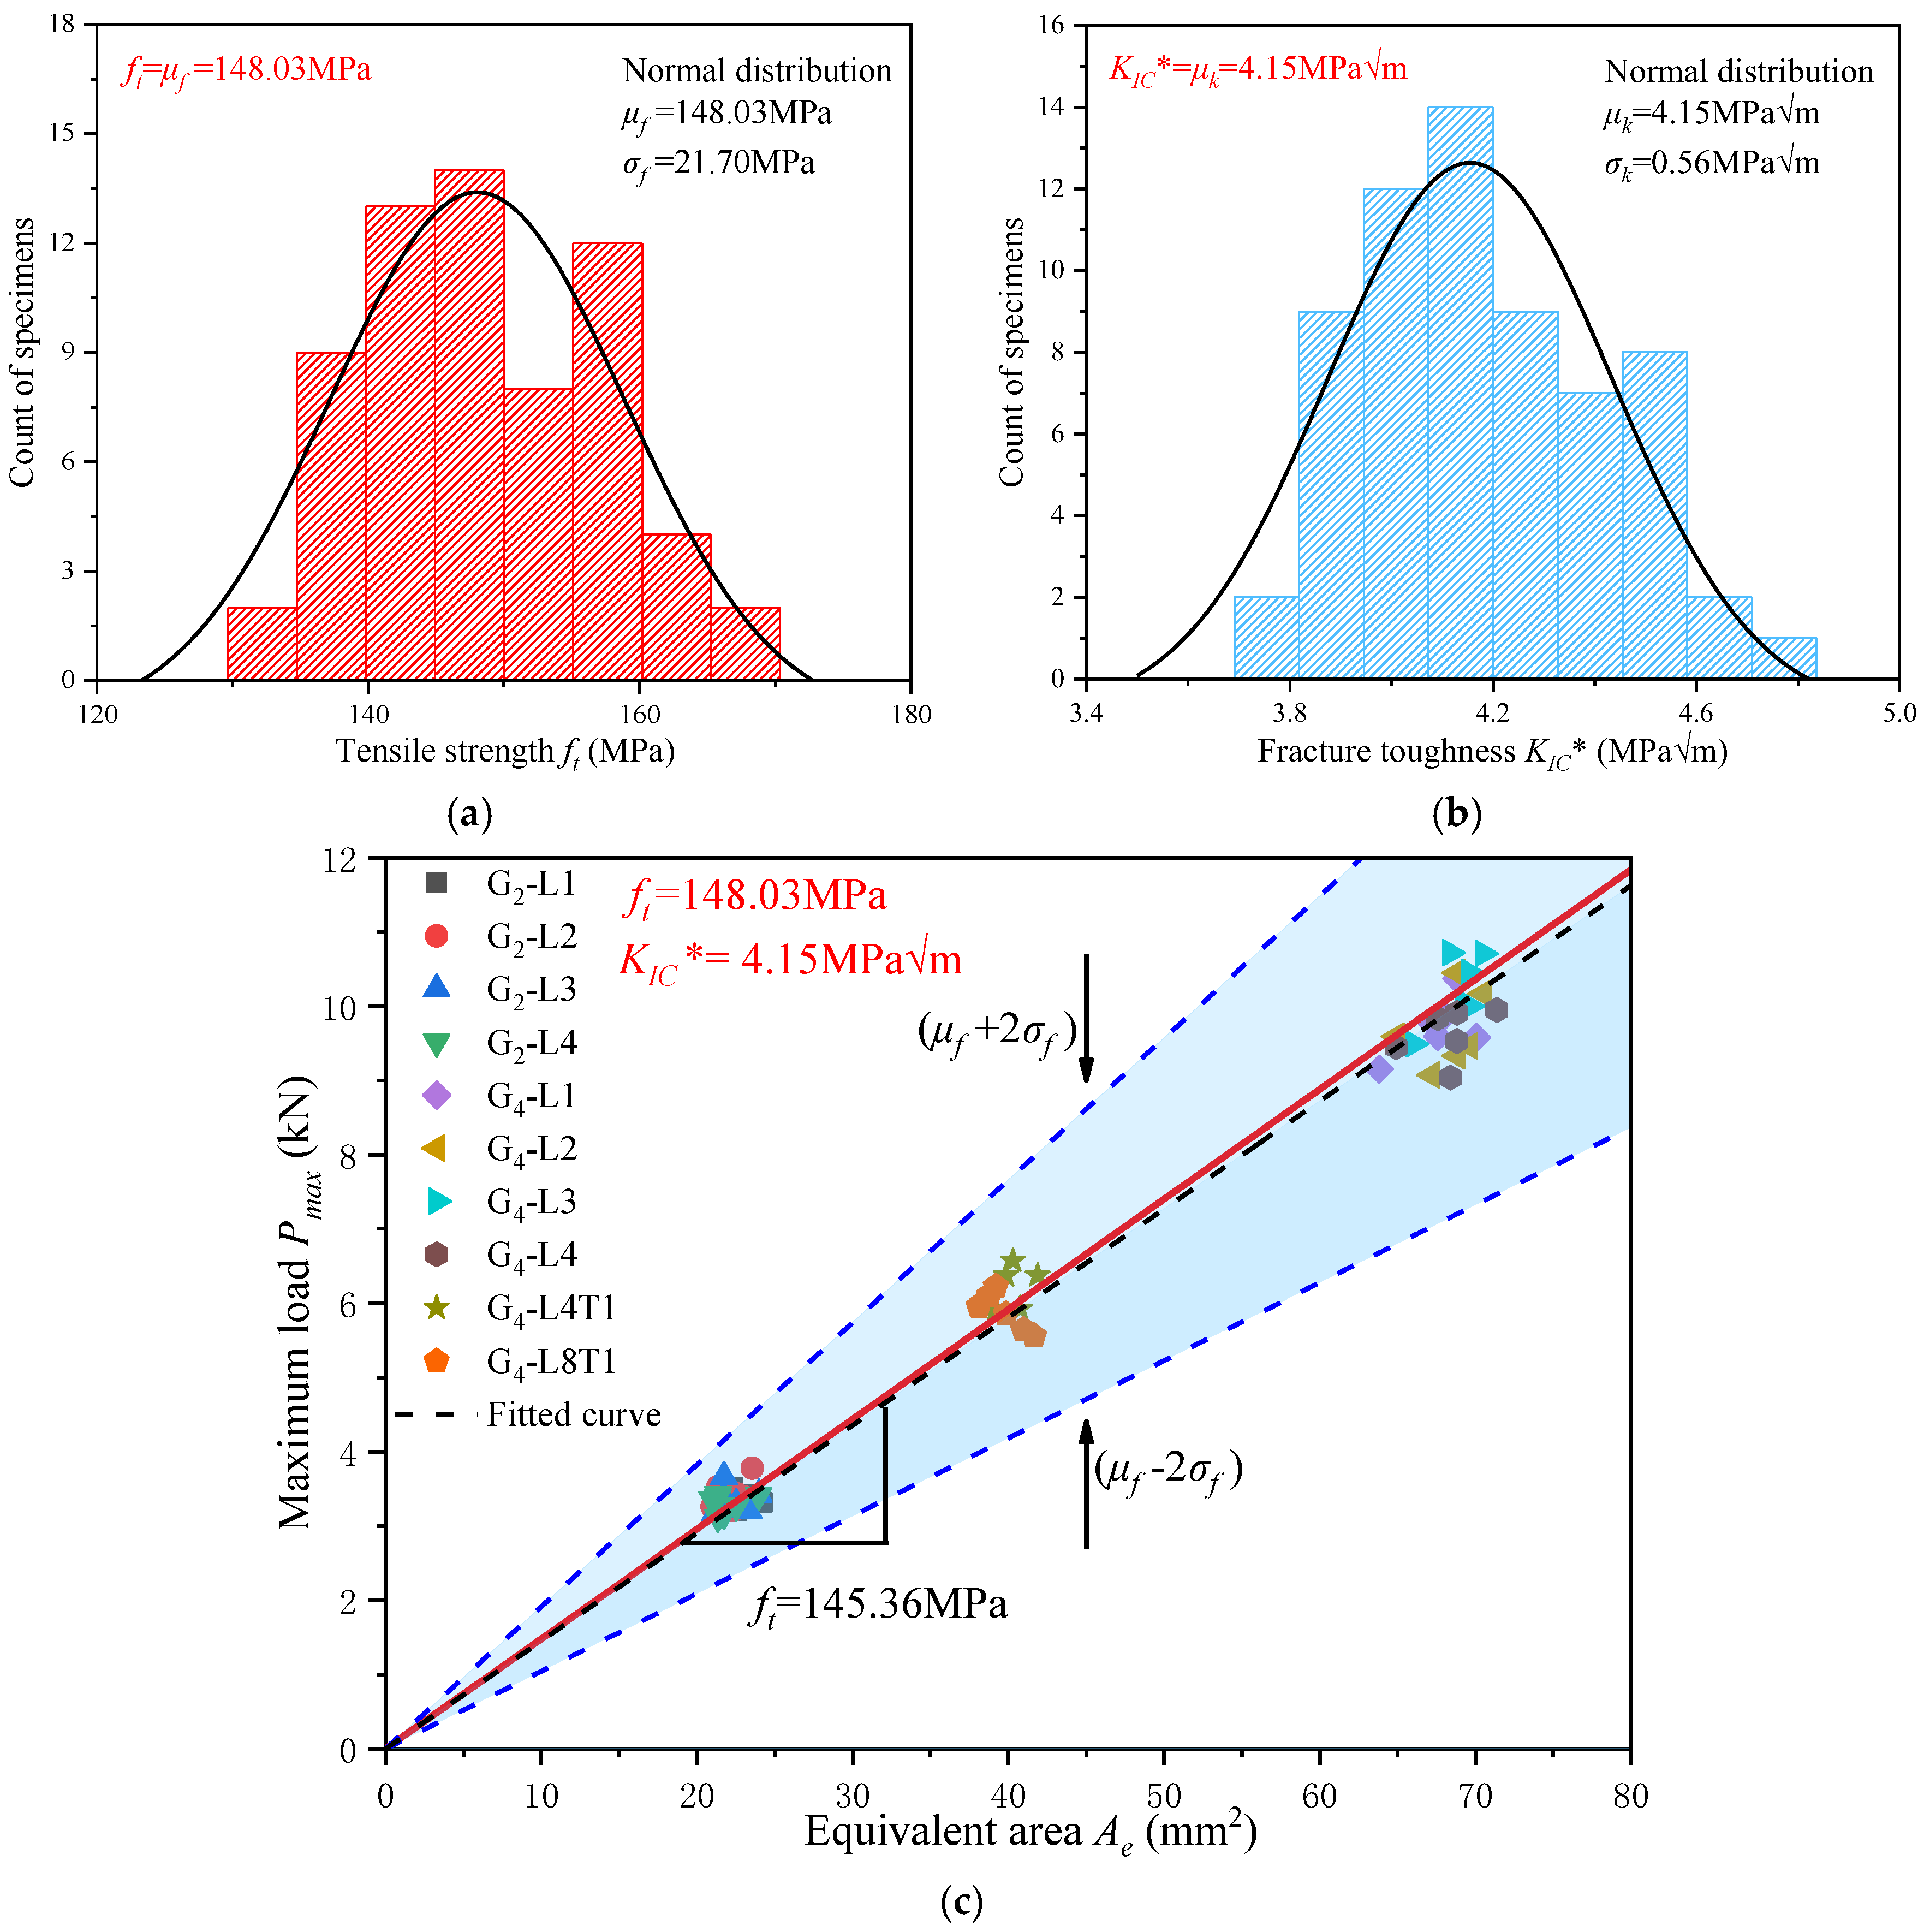
- In this study, the fiber tensile strength ft and fracture toughness KIC* of all specimens were obtained using a non-LEFM method, and a normal distribution analysis method was employed for fitting. The fracture parameters of glubam obtained during the softening stage Pmax are fiber tensile strength ft = μf = 148.03 MPa and fracture toughness KIC* = μk = 4.15 MPa. At a 96% reliability level, all the data points of the entire experiment are covered, indicating that the predicted values based on the normal distribution are reliable.
- (3)
- The fracture parameters of glubam obtained during the quasi-ductile stage P′max are fiber tensile strength ft = μf = 159.83 MPa and fracture toughness KIC* = μk = 4.54 MPa. Through observation of the fracture parameters at Pmax and P′max, it can be seen that the fracture parameters deviate within 10% for both. Analysis of the fracture parameters, fiber distribution, and modified a0 indicates that the quasi-ductile fracture behavior of glubam results from the staggered structure formed by the L-layers and T-layers.
Author Contributions
Funding
Institutional Review Board Statement
Informed Consent Statement
Data Availability Statement
Conflicts of Interest
References
- Jakovljević, S.; Lisjak, D. Investigation into the effects of humidity on the mechanical and physical properties of bamboo. Constr. Build. Mater. 2019, 194, 386–396. [Google Scholar] [CrossRef]
- Do Amaral, L.M.; Rodrigues, C.S.; Poggiali, F.S.J. Assessment of physical, mechanical, and chemical properties of Dendrocalamus asper bamboo after application of wetting and drying cycles. Adv. Bamboo Sci. 2022, 2, 100014. [Google Scholar] [CrossRef]
- Escamilla, E.Z.; Habert, G.; Daza, J.F.C.; Archilla, H.F.; Fernandez, J.S.E.; Trujillo, D. Industrial or Traditional Bamboo Construction? Comparative Life Cycle Assessment (LCA) of Bamboo-Based Buildings. Sustainability 2018, 10, 3096. [Google Scholar] [CrossRef]
- Fabiani, M.; Greco, S.; Mentrasti, L.; Molari, L.; Vldrè, G. Thermal treatment of bamboo with flame: Influence on the mechanical characteristics. Adv. Bamboo Sci. 2023, 2, 100015. [Google Scholar] [CrossRef]
- Dixon, P.; Gibson, L. The structure and mechanics of Moso bamboo material. J. R. Soc. Interface 2014, 11, 20140321. [Google Scholar] [CrossRef] [PubMed]
- Oka, G.; Triwiyono, A.; Awaludin, A.; Siswosukarto, S. Effects of Node, Internode and Height Position on the Mechanical Properties of Gigantochloa Atroviolacea Bamboo. Procedia Eng. 2014, 95, 31–37. [Google Scholar] [CrossRef]
- Askarinejad, S.; Kotowski, P.; Shalchy, F.; Rahbar, N. Effects of humidity on shear behavior of bamboo. Theor. App. Mech. Lett. 2015, 5, 236–243. [Google Scholar] [CrossRef]
- Bhonde, D.; Nagarnaik, P.B.; Parbat, D.K.; Waghe, U.P. Physical and Mechanical Properties of Bamboo (Dendrocalmus strictus). Int. J. Sci. Eng. Res. 2014, 5, 455–459. [Google Scholar]
- Ghavami, K. Bamboo as reinforcement in structural concrete elements. Case Stud. Constr. Mater. 2005, 27, 637–649. [Google Scholar] [CrossRef]
- Kumar, P.; Gautam, P.; Kaur, S.; Chaudhary, M.; Afreen, A.; Mehta, T. Bamboo as reinforcement in structural concrete. Mater. Today Proc. 2021, 46, 6793–6799. [Google Scholar] [CrossRef]
- Li, H.T.; Zhang, Q.S.; Huang, D.S.; Deeks, A.J. Compressive performance of laminated bamboo. Compos. Part. B Eng. 2013, 54, 319–328. [Google Scholar] [CrossRef]
- Li, Z.; He, X.Z.; Cai, Z.M.; Wang, R.; Xiao, Y. Mechanical Properties of Engineered Bamboo Boards for Glubam Structures. J. Mater. Civ. Eng. 2021, 33, 04021058. [Google Scholar] [CrossRef]
- Sharma, B.; Gatóo, A.; Bock, M.; Ramage, M. Engineered bamboo for structural applications. Constr. Build. Mater. 2015, 81, 66–73. [Google Scholar] [CrossRef]
- Xiao, Y.; Yang, R.Z.; Shan, B. Production, environmental impact and mechanical properties of glubam. Constr. Build. Mater. 2013, 44, 765–773. [Google Scholar] [CrossRef]
- Xiao, Y.; Shan, B.; Yang, R.Z.; Li, Z.; Chen, J. Glue Laminated Bamboo (GluBam) for Structural Applications. Mater. Jt. Timber Struct. 2014, 9, 589–601. [Google Scholar] [CrossRef]
- Xiao, Y.; Wu, Y.; Li, J.; Yang, R.Z. An experimental study on shear strength of glubam. Constr. Build. Mater. 2017, 150, 490–500. [Google Scholar] [CrossRef]
- Yang, R.Z. Research on Material Properties of Glubam and Its Application. Master’s Thesis, Hunan University, Changsha, China, 2013. (In Chinese). [Google Scholar]
- Chen, G.; Yu, Y.F.; Li, X.; He, B. Mechanical behavior of laminated bamboo lumber for structural application: An experimental investigation. Eur. J. Wood Wood Prod. 2020, 78, 53–63. [Google Scholar] [CrossRef]
- Li, H.T.; Deeks, A.J.; Zhang, Q.S.; Wu, G. Flexural Performance of Laminated Bamboo Lumber Beams. BioResources 2016, 11, 929–943. [Google Scholar] [CrossRef]
- Mahdavi, M.; Clouston, P.L.; Arwade, S.R. Development of laminated bamboo lumber: Review of processing, performance, and economical considerations. J. Mater. Civil. Eng. 2011, 23, 1036–1042. [Google Scholar] [CrossRef]
- Chen, D.; Zhang, W.; Wu, Y.S.; Jin, Z.; Zhang, Q.W. Investigation on the mechanical properties of open-hole spruce and douglas fir. Wood Res. 2019, 64, 155–164. [Google Scholar]
- Hugot, F.; Cazaurang, G. Mechanical properties of an extruded wood plastic composite. Mec. Ind. 2009, 10, 519–524. [Google Scholar] [CrossRef]
- Xiao, Y.; She, L.Y.; Shan, B.; Zhou, Q.; Yang, R.Z.; Chen, G. Research and design of prefabricated bamboo house. Ind. Constr. 2009, 39, 56–59. (In Chinese) [Google Scholar]
- Xie, Q.J.; Xiao, Y. Experimental study on large-span glubam roof trusses. J. Build. Struct. 2016, 37, 47–53. (In Chinese) [Google Scholar] [CrossRef]
- Xiao, Y.; Chen, G.; Feng, L. Experimental studies on roof trusses made of glubam. Mater. Struct. 2014, 47, 1879–1890. [Google Scholar] [CrossRef]
- Xiao, Y.; Li, L.; Yang, R.Z.; Shan, B.; She, L.Y. Experimental study on creep and loading property of laminated bamboo bridge. Build. Struct. 2013, 43, 86–91. (In Chinese) [Google Scholar] [CrossRef]
- Xiao, Y.; Zhou, Q.; Shan, B. Design and construction of modern bamboo bridges. J. Bridge Eng. 2010, 15, 533–541. [Google Scholar] [CrossRef]
- Rao, K.; Rao, K. Extraction and Tensile Properties of Natural Fibers: Vakka, Date and Bamboo. Compos. Struct. 2007, 77, 288–295. [Google Scholar] [CrossRef]
- Babu, K.M.; Chandrasekhara, S.M. Chapter five-Properties of bamboo fibres: Physical, performance, comfort, thermal, and low stress mechanical properties. In Bamboo Fibres; Woodhead Publishing: Shaston, UK, 2023; pp. 101–135. [Google Scholar] [CrossRef]
- Hindman, D.; Satir, E.; Rara, A.; Okutan, R.; Dean, C.; Strong, K.; Pomponi, J.; Hauptman, J. Evaluation of Tre Gai bamboo (Bambusa spinosa) bending strength perpendicular-to-fibre along the culm length. Adv. Bamboo Sci. 2024, 7, 100066. [Google Scholar] [CrossRef]
- Sánchez, M.L.; Morales, L.Y.; Caicedo, J.D. Physical and mechanical properties of agglomerated panels made from bamboo fiber and vegetable resin. Constr. Build. Mater. 2017, 156, 330–339. [Google Scholar] [CrossRef]
- Hasan, K.M.F.; Hasan, K.N.A.; Ahmed, T.; György, S.T.; Pervez, M.N.; Bejo, L.; Sándor, B.; Alpar, T. Sustainable bamboo fiber reinforced polymeric composites for structural applications: A mini review of recent advances and future prospects. Case Stud. Therm. Eng. 2023, 8, 100362. [Google Scholar] [CrossRef]
- Kumar, R.; Ganguly, A.; Purohit, R. Properties and applications of bamboo and bamboo fibre composites. Mater. Today Proc. 2023; in press. [Google Scholar] [CrossRef]
- Kaima, J.; Preechawuttipong, I.; Jongchansitto, P.; Charoenloe, N. Effect of Chemical Solution on Tensile Strength of Bamboo Fiber. IOP Conf. Ser. Mater. Sci. Eng. 2020, 886, 012061. [Google Scholar] [CrossRef]
- Lo, T. The effect of fiber density on strength capacity of bamboo. Mater. Lett. 2004, 58, 2595–2598. [Google Scholar] [CrossRef]
- Wu, G.F.; Gong, Y.C.; Zhong, Y.; Ren, H.Q. Determination and simulation of the mode I fracture toughness of bamboo scrimber. BioResources 2019, 14, 6811–6821. [Google Scholar] [CrossRef]
- Liu, Y.Y.; Sheng, B.L.; Huang, D.S.; Zhou, A.P. Mode-I interlaminar fracture behavior of laminated bamboo composites. Adv. Struct. Eng. 2020, 24, 136943322096527. [Google Scholar] [CrossRef]
- Shao, Z.P.; Fang, C.H.; Tian, G.L. Mode I interlaminar fracture property of moso bamboo (Phyllostachys pubescens). Wood Sci. Technol. 2009, 43, 527–536. [Google Scholar] [CrossRef]
- Chen, Y.; Li, H.T.; Gao, L.; Xu, W.; Lorenzo, R.; Gaff, M. A Review of Experimental Research on the Mode I Fracture Behavior of Bamboo. J. Renew. Mater. 2023, 11, 1–22. [Google Scholar] [CrossRef]
- Kelkar, B.U.; Shukla, S.R.; Yadav, S.M. Interlaminar fracture energy and its dependence on microstructure in three bamboo species of commercial importance. Theor. Appl. Fract. Mech. 2023, 124, 103824. [Google Scholar] [CrossRef]
- Al-Rukaibawi, L.S.; Omairey, S.L.; Károlyi, G. A numerical anatomy-based modelling of bamboo microstructure. Const. Build. Mater. 2021, 308, 125036. [Google Scholar] [CrossRef]
- Liu, H.R.; Wang, X.Q.; Zhang, X.B.; Sun, Z.J.; Jiang, Z.H. In situ detection of the fracture behaviour of moso bamboo (Phyll ostachys pubescens) by scanning electron microscopy. Holzforschung 2016, 70, 1183–1190. [Google Scholar] [CrossRef]
- Liu, W.; Hu, X.Z.; Yuan, B.Y.; Xu, F.; Huang, J.K. Tensile strength model of bamboo srimber by 3-p-b fracture test on the basis of non-LEFM. Compos. Sci. Technol. 2020, 198, 108295. [Google Scholar] [CrossRef]
- Xie, P.; Liu, W.; Hu, Y.C.; Meng, X.M.; Huang, J.K. Size effect research of tensile strength of bamboo scrimber based on boundary effect model. Eng. Fract. Mech. 2020, 239, 107319. [Google Scholar] [CrossRef]
- Liu, W.; Li, Z.; Li, Z. Mixed-mode I/II fracture performances of glued laminated bamboo in the in-plane longitudinal direction. Eng. Fract. Mech. 2023, 281, 109080. [Google Scholar] [CrossRef]
- Bradt, R. The Fractography and Crack Patterns of Broken Glass. J. Fail. Anal. Prev. 2011, 11, 79–96. [Google Scholar] [CrossRef]
- Kojima, T.; Momokawa, R.; Matsuo, T.; Notomi, M. Effect of shatterproof polymer film application on the fracture types and strength of glass subject to bending load. Eng. Fail. Anal. 2023, 148, 107220. [Google Scholar] [CrossRef]
- Bradley, W.; Srinivasan, M. Fracture and fracture toughness of cast irons. Int. Mater. Rev. 1990, 35, 129–161. [Google Scholar] [CrossRef]
- Hoover, C.G.; Bažant, Z.Z. Comprehensive concrete fracture tests: Size effects of Types 1 & 2, crack length effect and postpeak. Eng. Fract. Mech. 2013, 110, 281–289. [Google Scholar] [CrossRef]
- Mukhtar, F.; El-Tohfa, A.R. A review on fracture propagation in concrete: Models, methods, and benchmark tests. Eng. Fract. Mech. 2023, 281, 109100. [Google Scholar] [CrossRef]
- Zhu, Q.Z.; Shao, J.F. Micromechanics of rock damage: Advances in the quasi-brittle field. J. Rock. Mech. Geotech. Eng. 2016, 9, 29–40. [Google Scholar] [CrossRef]
- Okocha, S.I.; Yu, F.; Jar, P.Y.; Hendry, M.T. Use of a modified critical fracture strain model for fracture toughness estimation of high strength rail steels. Theor. Appl. Fract. Mech. 2023, 127, 104069. [Google Scholar] [CrossRef]
- Bordone, M.; Monsalve, A.; Ipiña, P.J. Fracture toughness of High-Manganese steels with TWIP/TRIP effects. Eng. Fract. Mech. 2022, 275, 108837. [Google Scholar] [CrossRef]
- Houari, T.; Benguediab, M.; Belaziz, A.; Belhamiani, M.; Aid, A. Fracture Toughness Characterization of High-Density Polyethylene Using Essential Work of Fracture Concept. J. Fail. Anal. Prev. 2020, 20, 315–322. [Google Scholar] [CrossRef]
- Liu, W.; Yu, L.; Hu, X.Z.; Han, X.Y.; Xie, P. Quasi-brittle fracture criterion of bamboo-based fiber composites in transverse direction based on boundary effect model. Compos. Struct. 2019, 220, 347–354. [Google Scholar] [CrossRef]
- Yang, X.; Zhang, F.D.; Huang, Y.H.; Fei, B.H. Tensile and bending properties of radial slivers of Moso bamboo. J. Beijing For. Univ. 2022, 44, 140–147. (In Chinese) [Google Scholar]
- Sha, J.J.; Li, J.; Lv, Z.Z.; Wang, S.H.; Zhang, Z.F.; Zu, Y.F.; Flauder, S.; Krenkel, W. ZrB2-based composites toughened by as-received and heat-treated short carbon fibers. J. Eur. Ceram. Soc. 2017, 37, 549–558. [Google Scholar] [CrossRef]
- Zhang, Z.F. Fabrication and Toughening Mechanism of ZrB2-SiC Based Ultra High Temperature Ceramic Matrix Composites Toughened by Micro and Nano-Phases. Ph.D. Thesis, Dalian University of Technology, Dalian, China, 2019. (In Chinese). [Google Scholar]
- Bai, Y.L.; He, X.D.; Wang, R.G.; Sun, Y.; Zhu, C.C.; Wang, S.; Chen, G.Q. High temperature physical and mechanical properties of large-scale Ti2AlC bulk synthesized by self-propagating high temperature combustion synthesis with pseudo hot isostatic pressing. J. Eur. Ceram. Soc. 2013, 33, 2435–2445. [Google Scholar] [CrossRef]
- Wang, B.H.; Hu, X.Z.; Lu, P.M. Modelling and testing of large-scale masonry elements under three-point bending-Tough and strong nacre-like structure enlarged by a factor of 20,000. Eng. Fract. Mech. 2020, 229, 106961. [Google Scholar] [CrossRef]


| Material | Glubam [12,14,15,16,17] | LBL [18,19,20] | Douglas Fir [13,21] | WPC [22] |
|---|---|---|---|---|
| Tensile strength (MPa) | 80.5 (17.3) | 107.7 (11.5) | 49 (10.5) | 11.6 (1.0) |
| Compressive strength (MPa) | 39.5 (7.0) | 56.3 (4.1) | 57 (5.2) | 28.1 (0.7) |
| Bending strength (MPa) | 99 (11.9) | 111.5 (8.8) | 48.06 (3.3) | 26.1 (1.0) |
| Shear strength (MPa) | 15.7 (2.0) | 17.5 (1.2) | 11 (0.9) | 8.1 (0.4) |
| Elastic modulus (MPa) | 10,508 (1025) | 11,143 (924.9) | 13,000 (1872) | 3000 (340) |
| Group No. | S (mm) | B (mm) | W (mm) | a0 (mm) |
|---|---|---|---|---|
| G2-L1 | 112 | 28 | 28 | 2 |
| G2-L2 | 112 | 28 | 28 | 4 |
| G2-L3 | 112 | 28 | 28 | 6 |
| G2-L4 | 112 | 28 | 28 | 8 |
| G4-L1 | 192 | 48 | 48 | 2 |
| G4-L2 | 192 | 48 | 48 | 4 |
| G4-L3 | 192 | 48 | 48 | 6 |
| G4-L4 | 192 | 48 | 48 | 8 |
| G4-L4T1 | 192 | 48 | 48 | 10 |
| G4-L8T1 | 192 | 48 | 48 | 18 |
Disclaimer/Publisher’s Note: The statements, opinions and data contained in all publications are solely those of the individual author(s) and contributor(s) and not of MDPI and/or the editor(s). MDPI and/or the editor(s) disclaim responsibility for any injury to people or property resulting from any ideas, methods, instructions or products referred to in the content. |
© 2024 by the authors. Licensee MDPI, Basel, Switzerland. This article is an open access article distributed under the terms and conditions of the Creative Commons Attribution (CC BY) license (https://creativecommons.org/licenses/by/4.0/).
Share and Cite
Jiang, H.; Liu, W. Study on the Quasi-Ductile Fracture Behavior of Glubam: The Role of Fiber Distribution. Materials 2024, 17, 1611. https://doi.org/10.3390/ma17071611
Jiang H, Liu W. Study on the Quasi-Ductile Fracture Behavior of Glubam: The Role of Fiber Distribution. Materials. 2024; 17(7):1611. https://doi.org/10.3390/ma17071611
Chicago/Turabian StyleJiang, Haolei, and Wen Liu. 2024. "Study on the Quasi-Ductile Fracture Behavior of Glubam: The Role of Fiber Distribution" Materials 17, no. 7: 1611. https://doi.org/10.3390/ma17071611
APA StyleJiang, H., & Liu, W. (2024). Study on the Quasi-Ductile Fracture Behavior of Glubam: The Role of Fiber Distribution. Materials, 17(7), 1611. https://doi.org/10.3390/ma17071611