


The Beneficial Effect of a TPMS-Based Fillet Shape on the Mechanical Strength of Metal Cubic Lattice Structures

 ,
,  ,
,  and
and 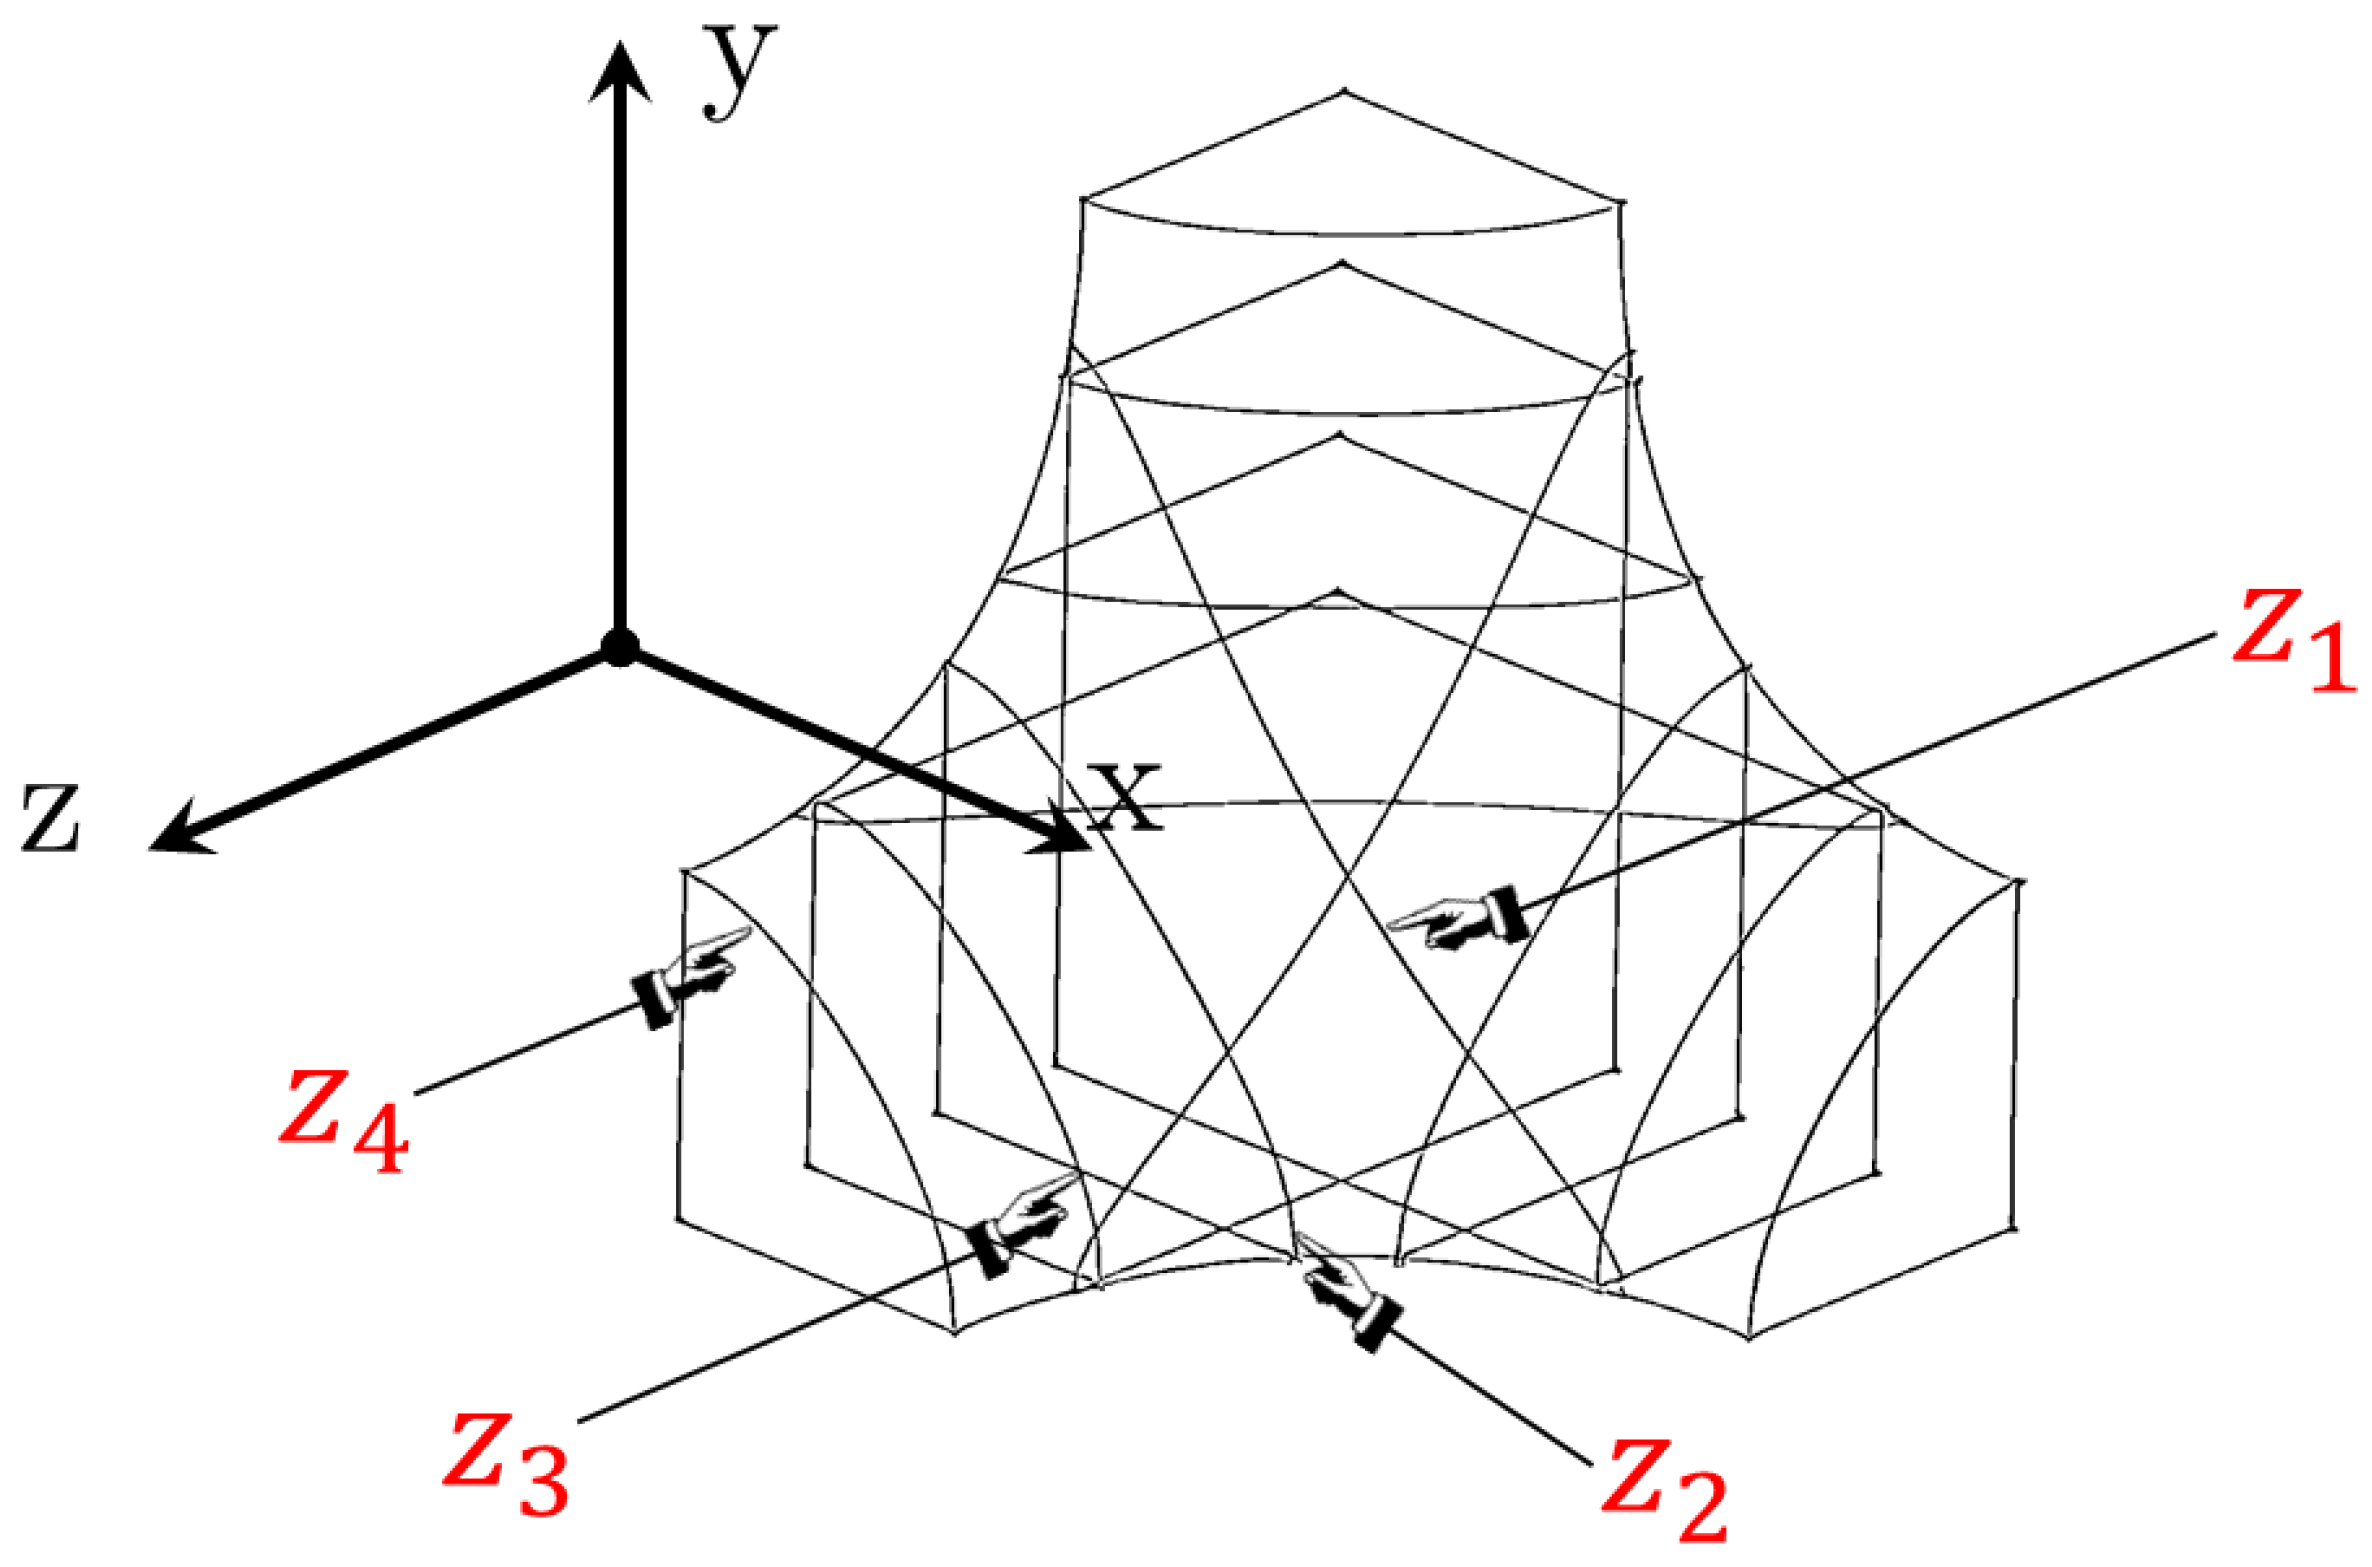
Abstract
1. Introduction
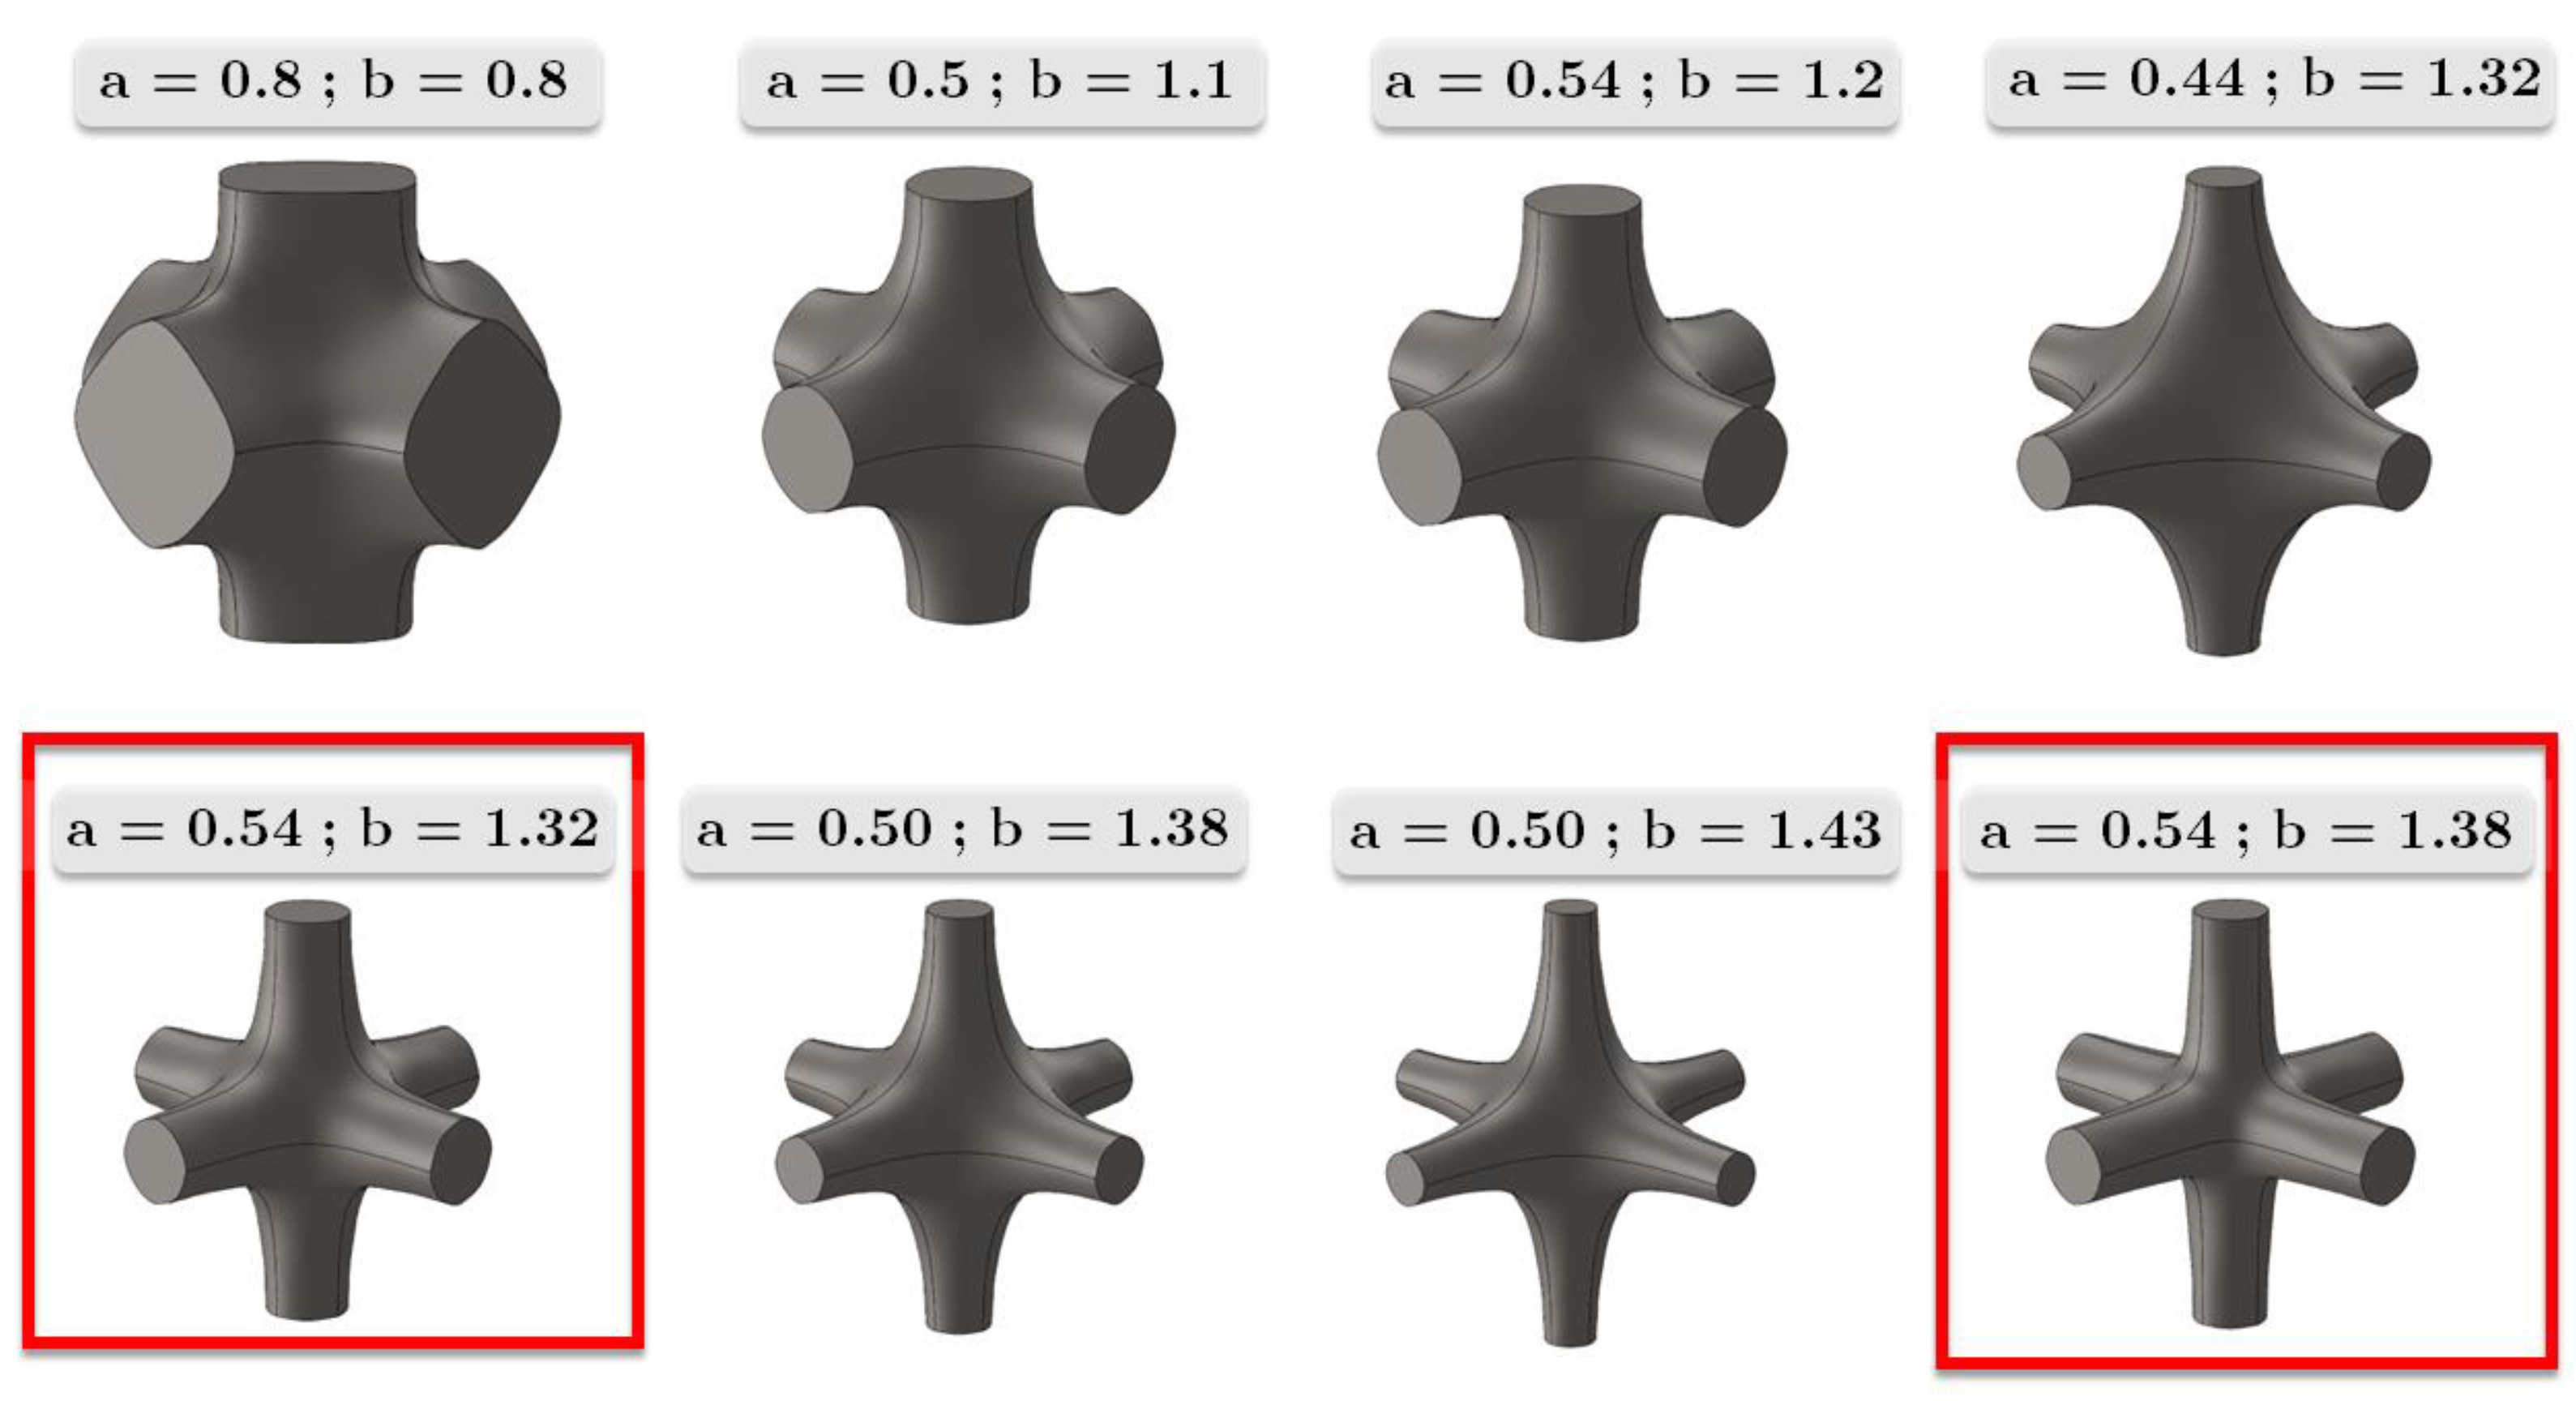
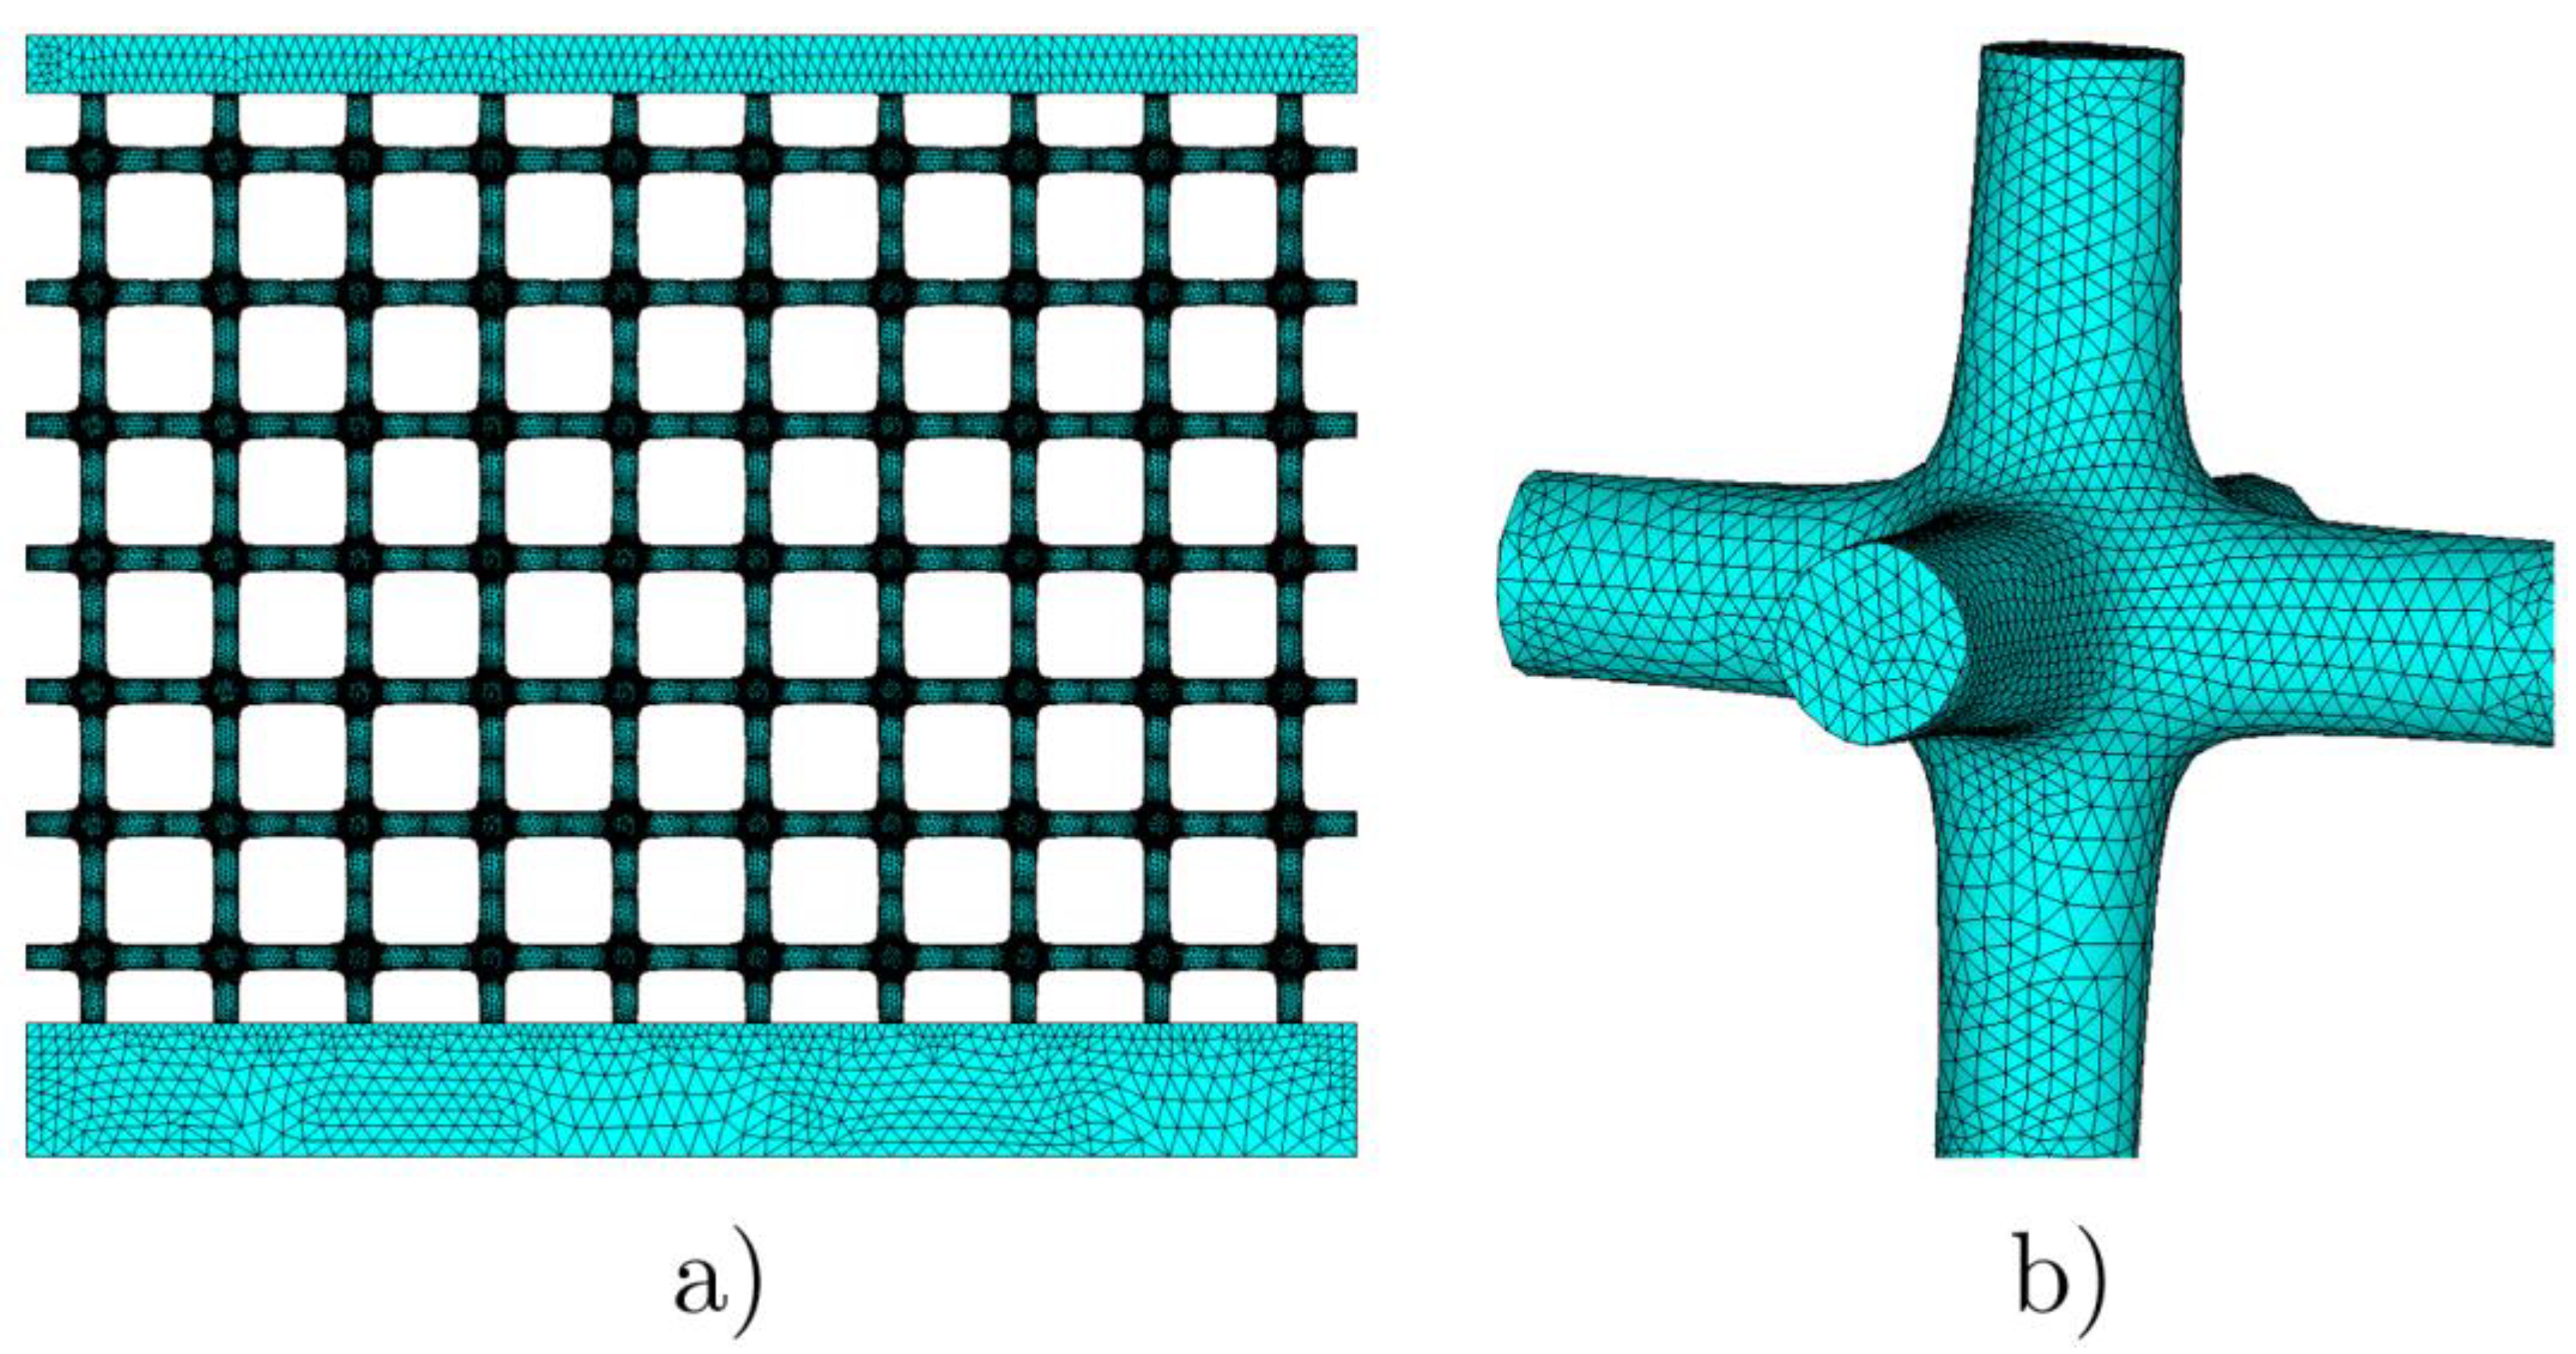
2. Design of the TPMS Fillet Shape
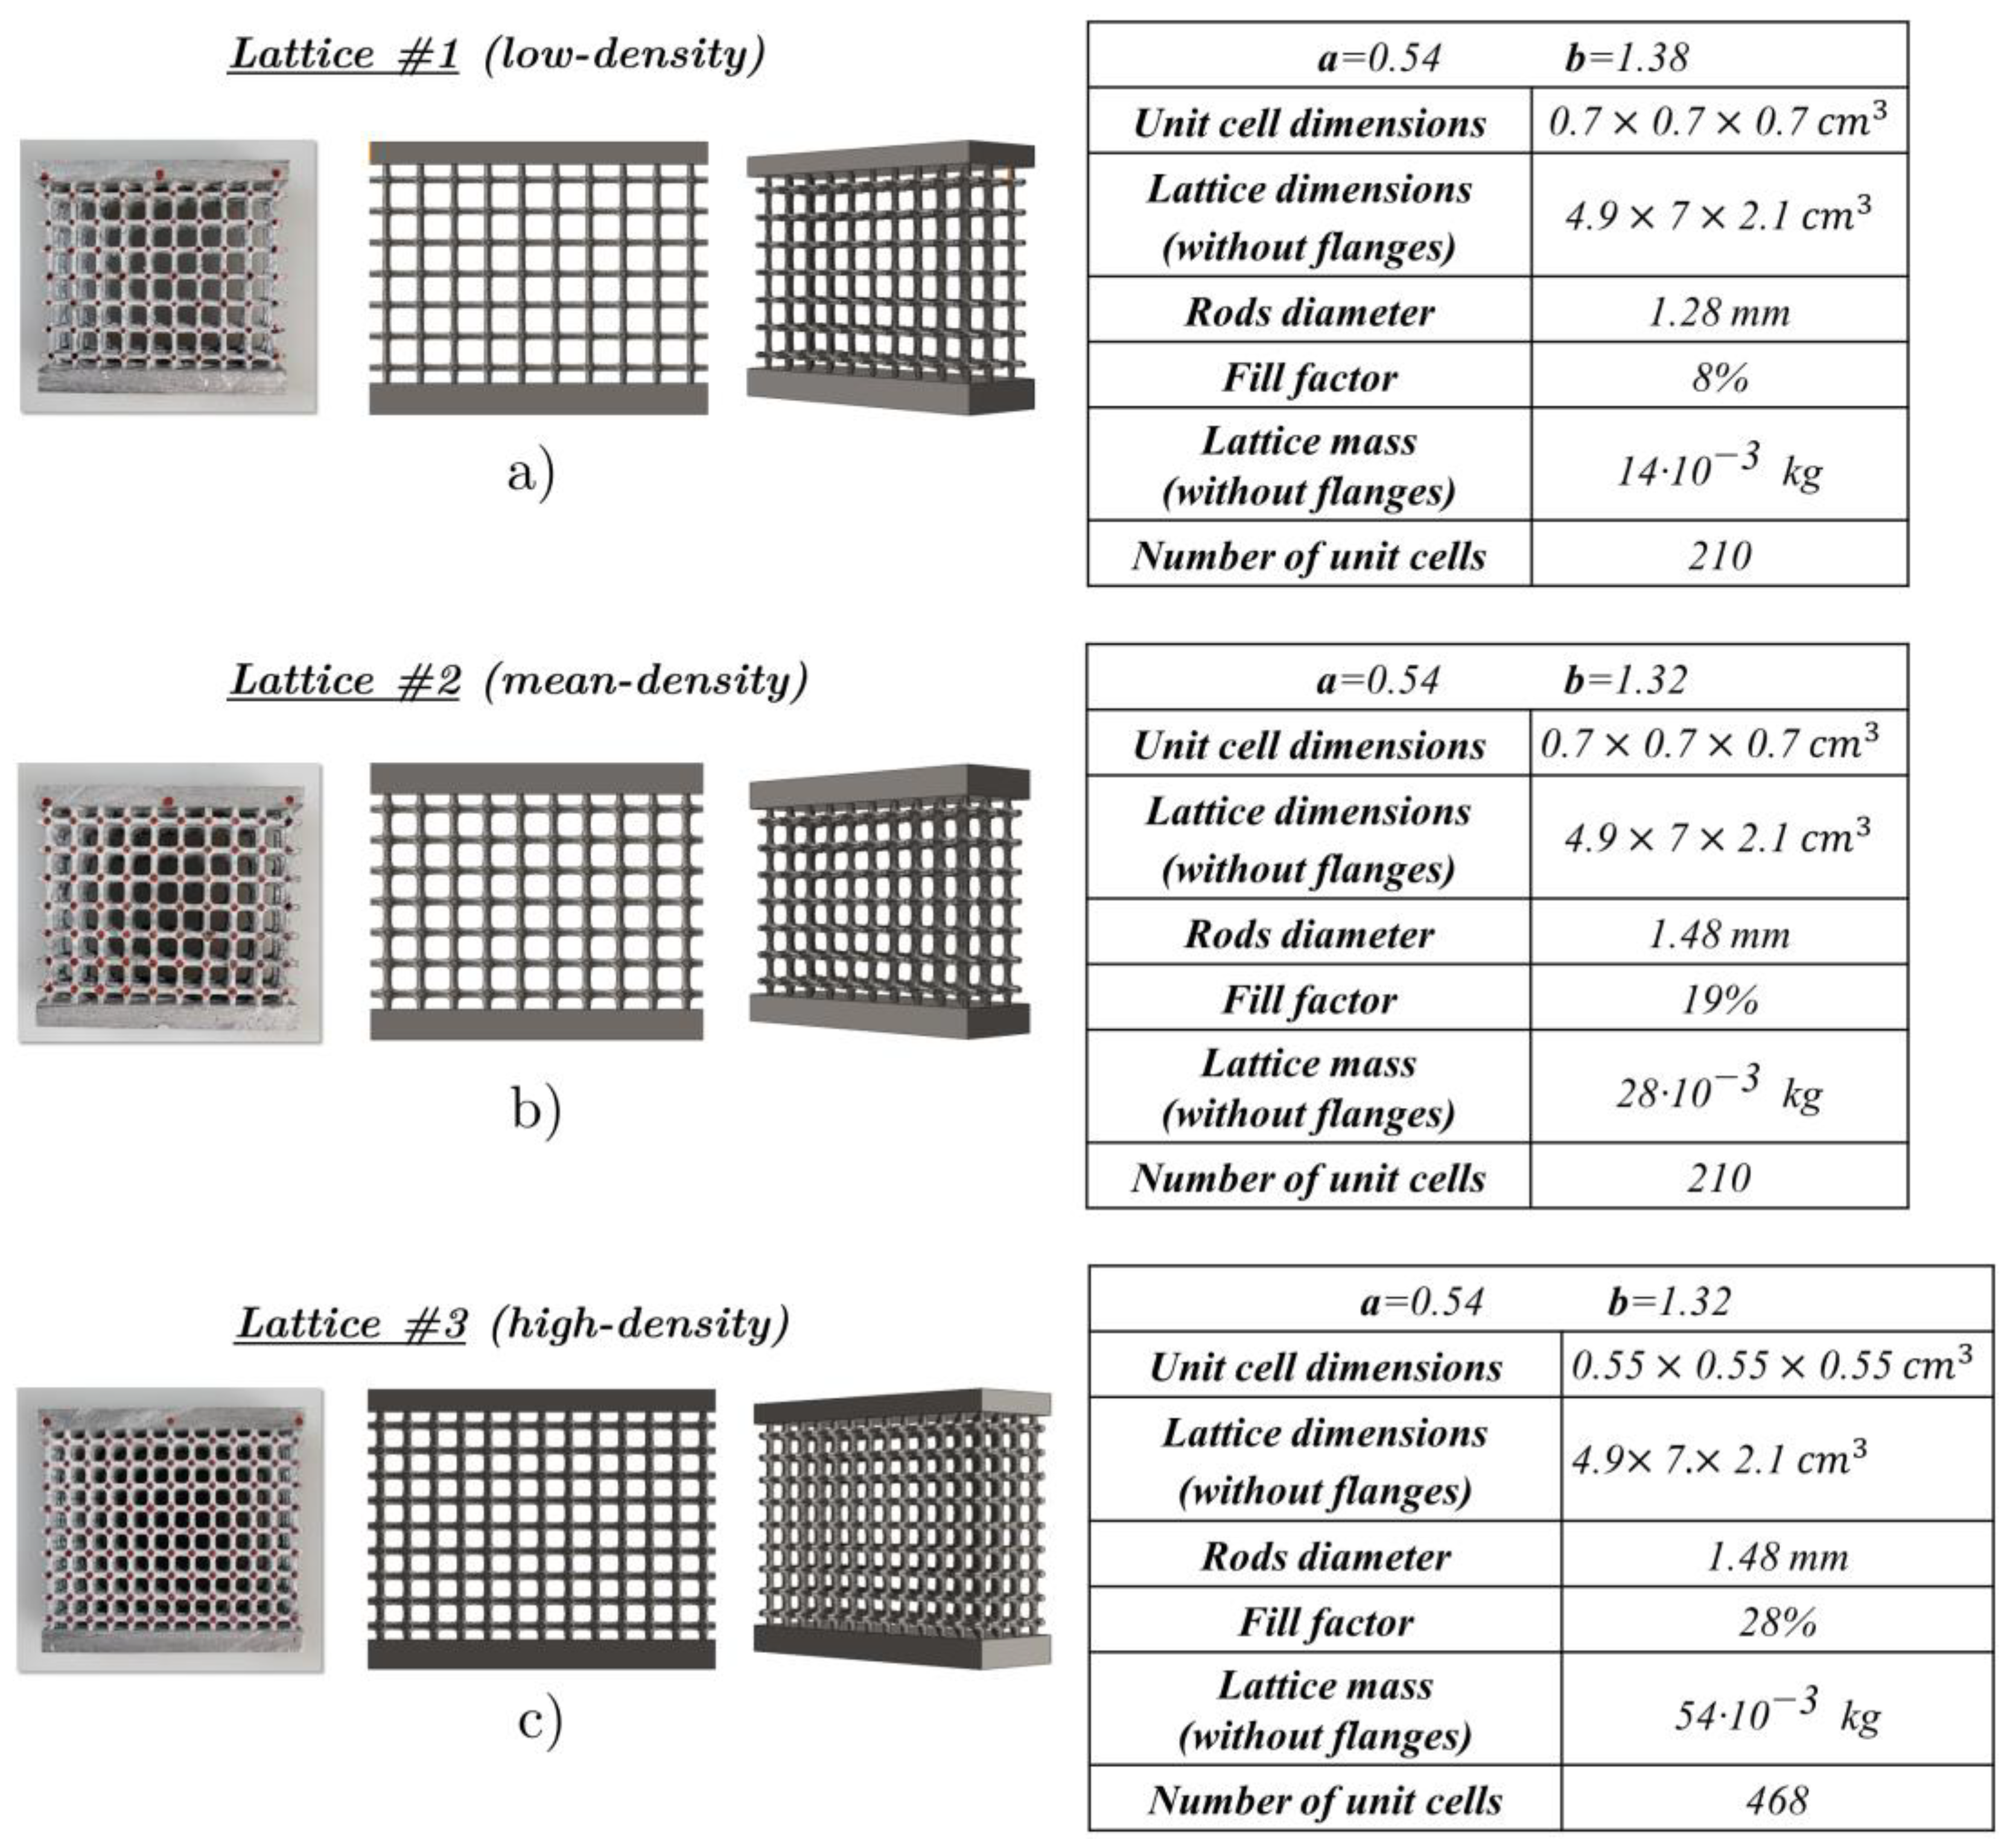
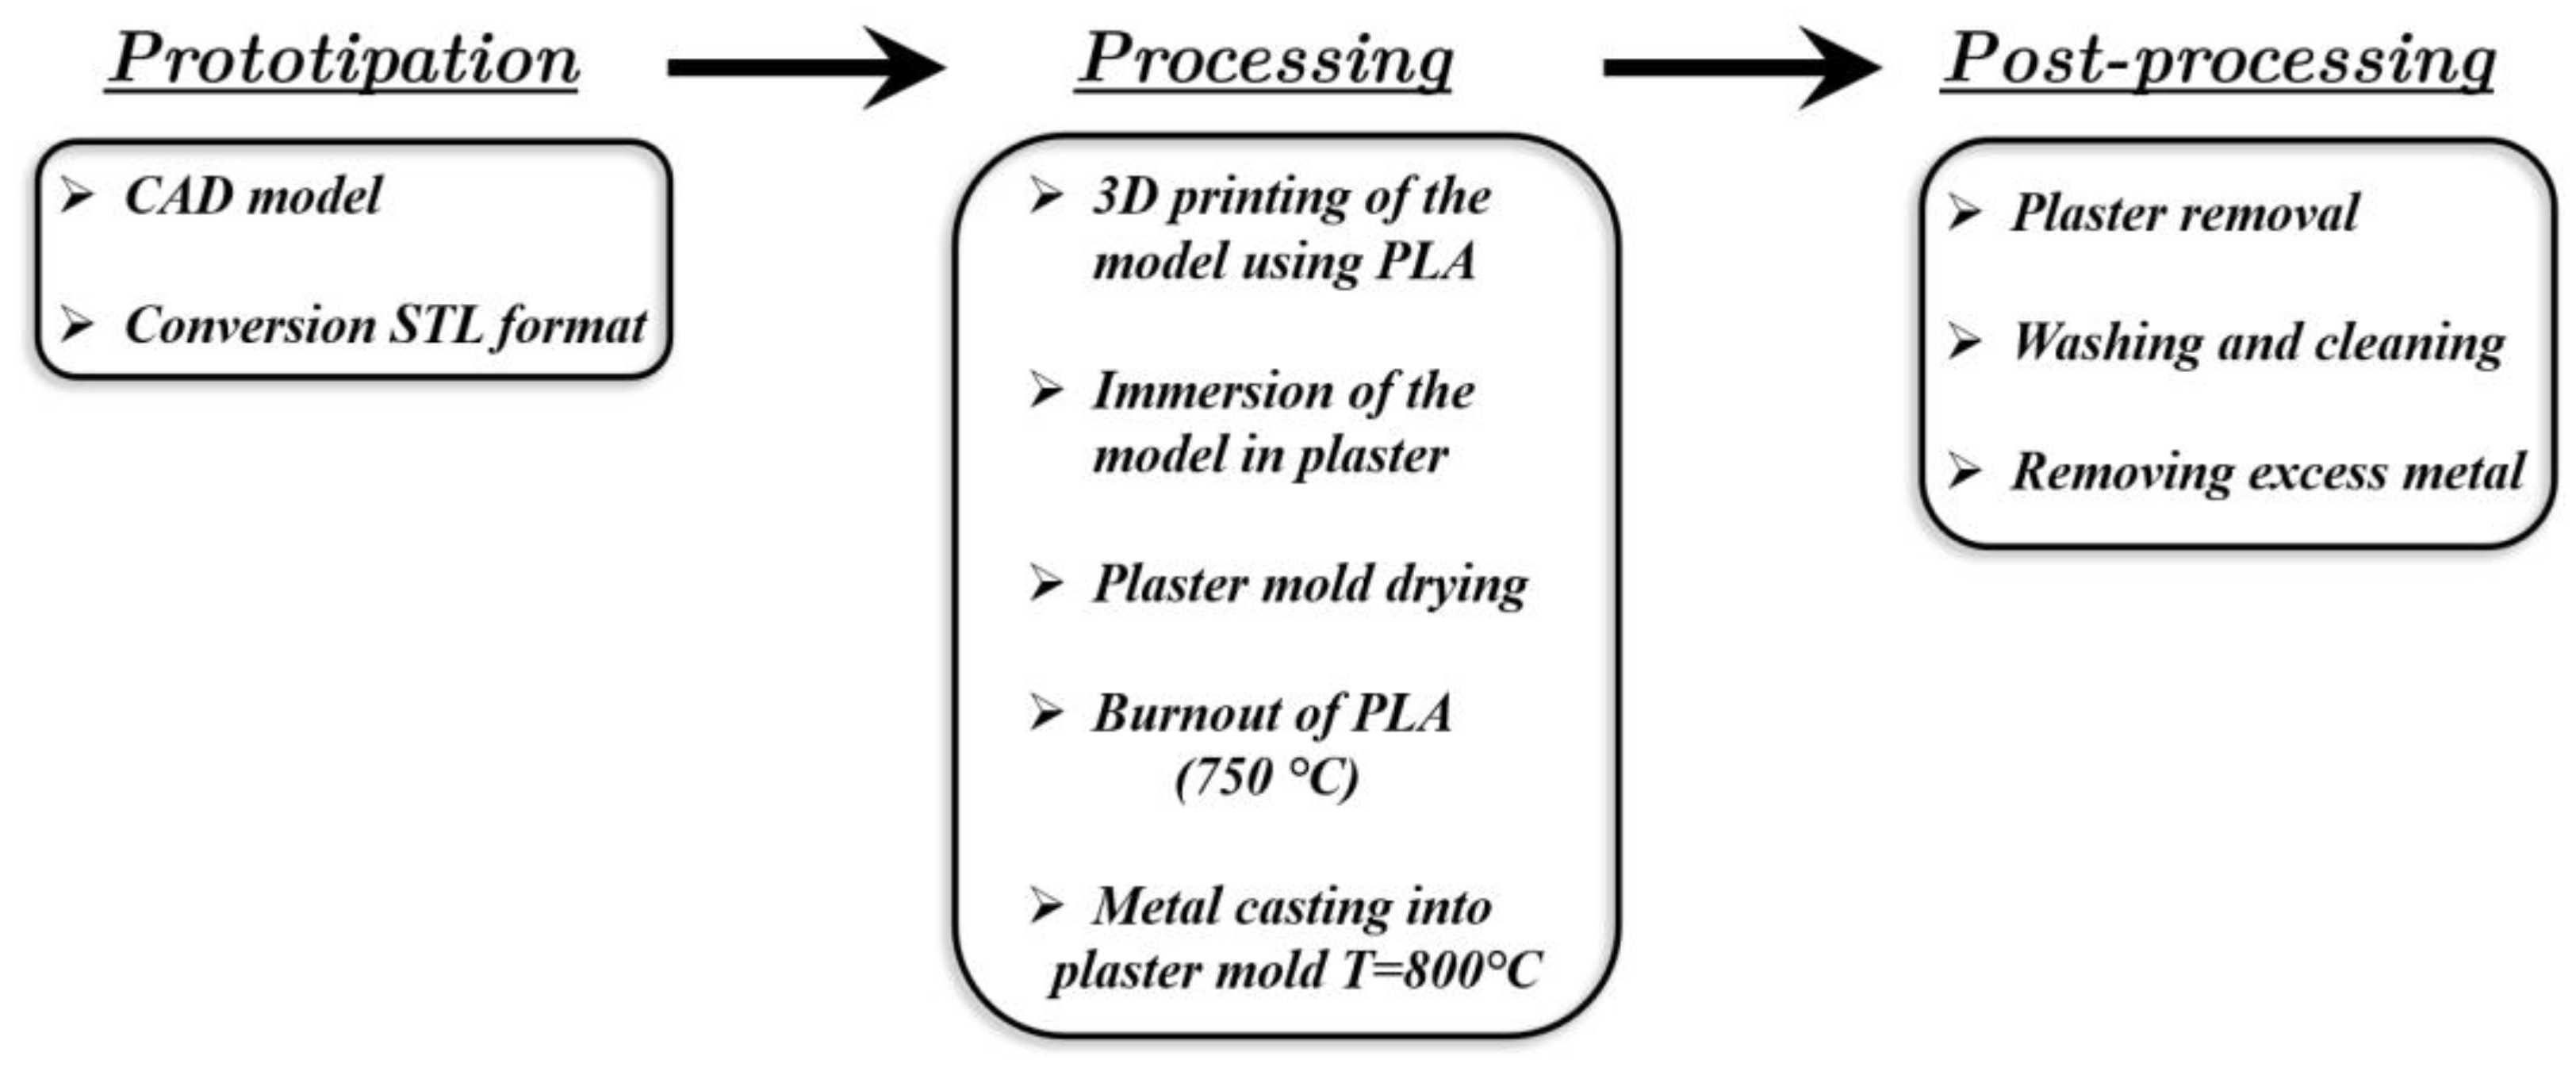
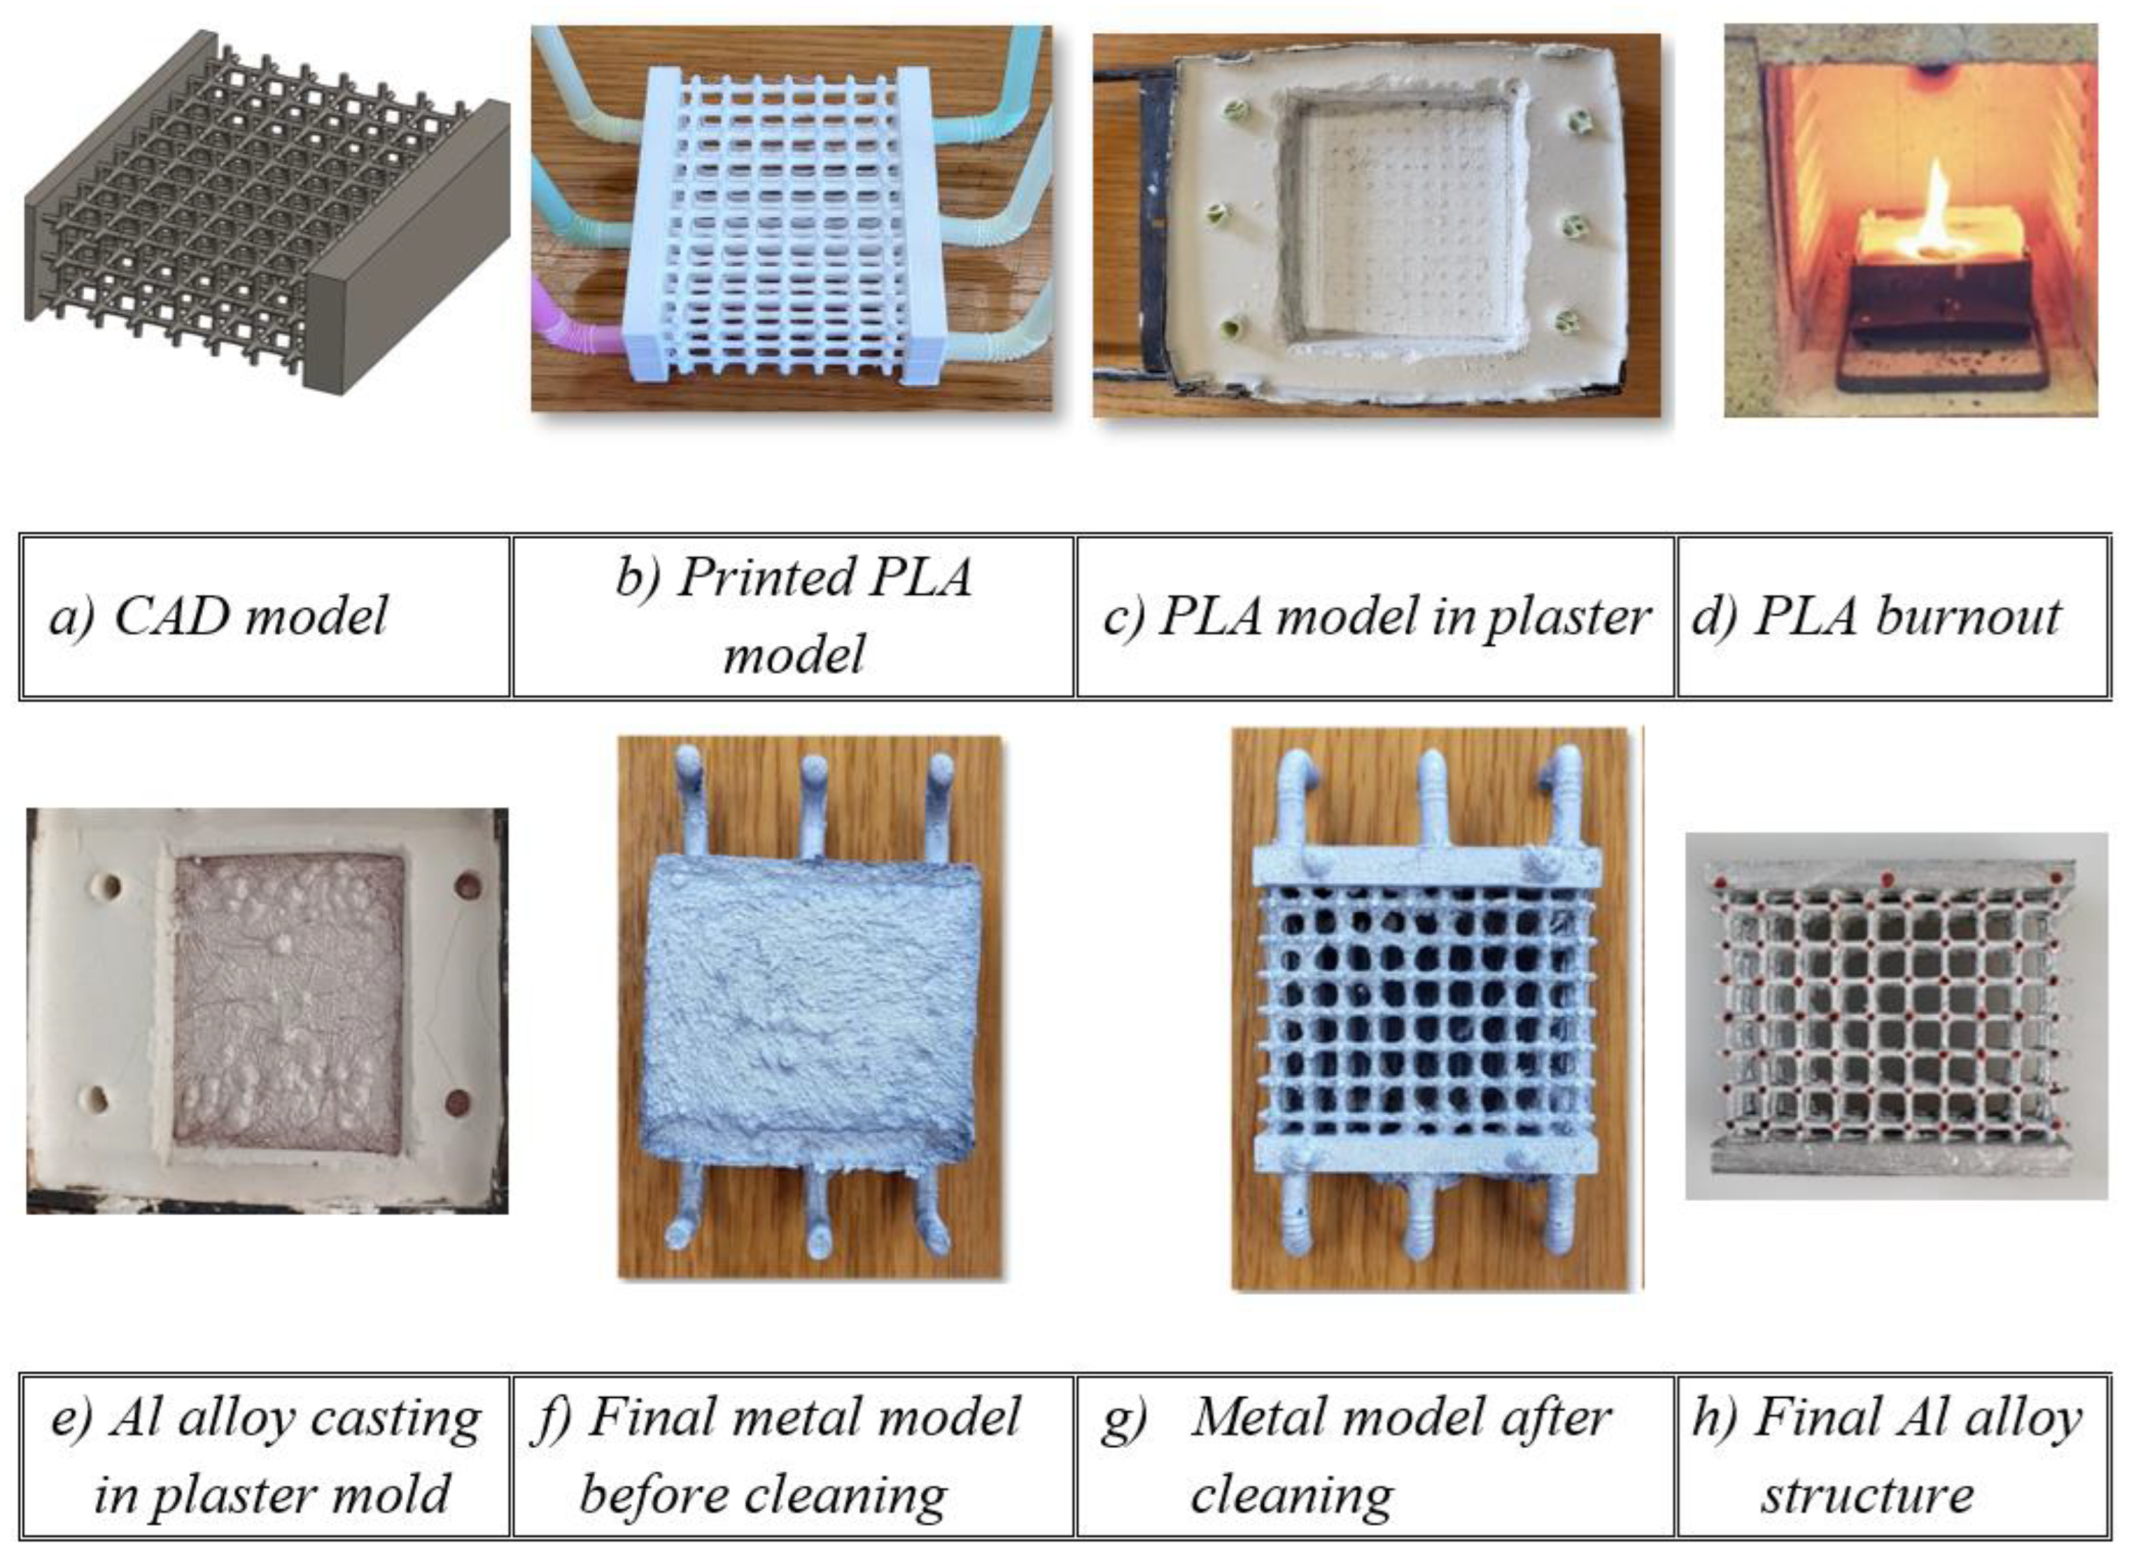
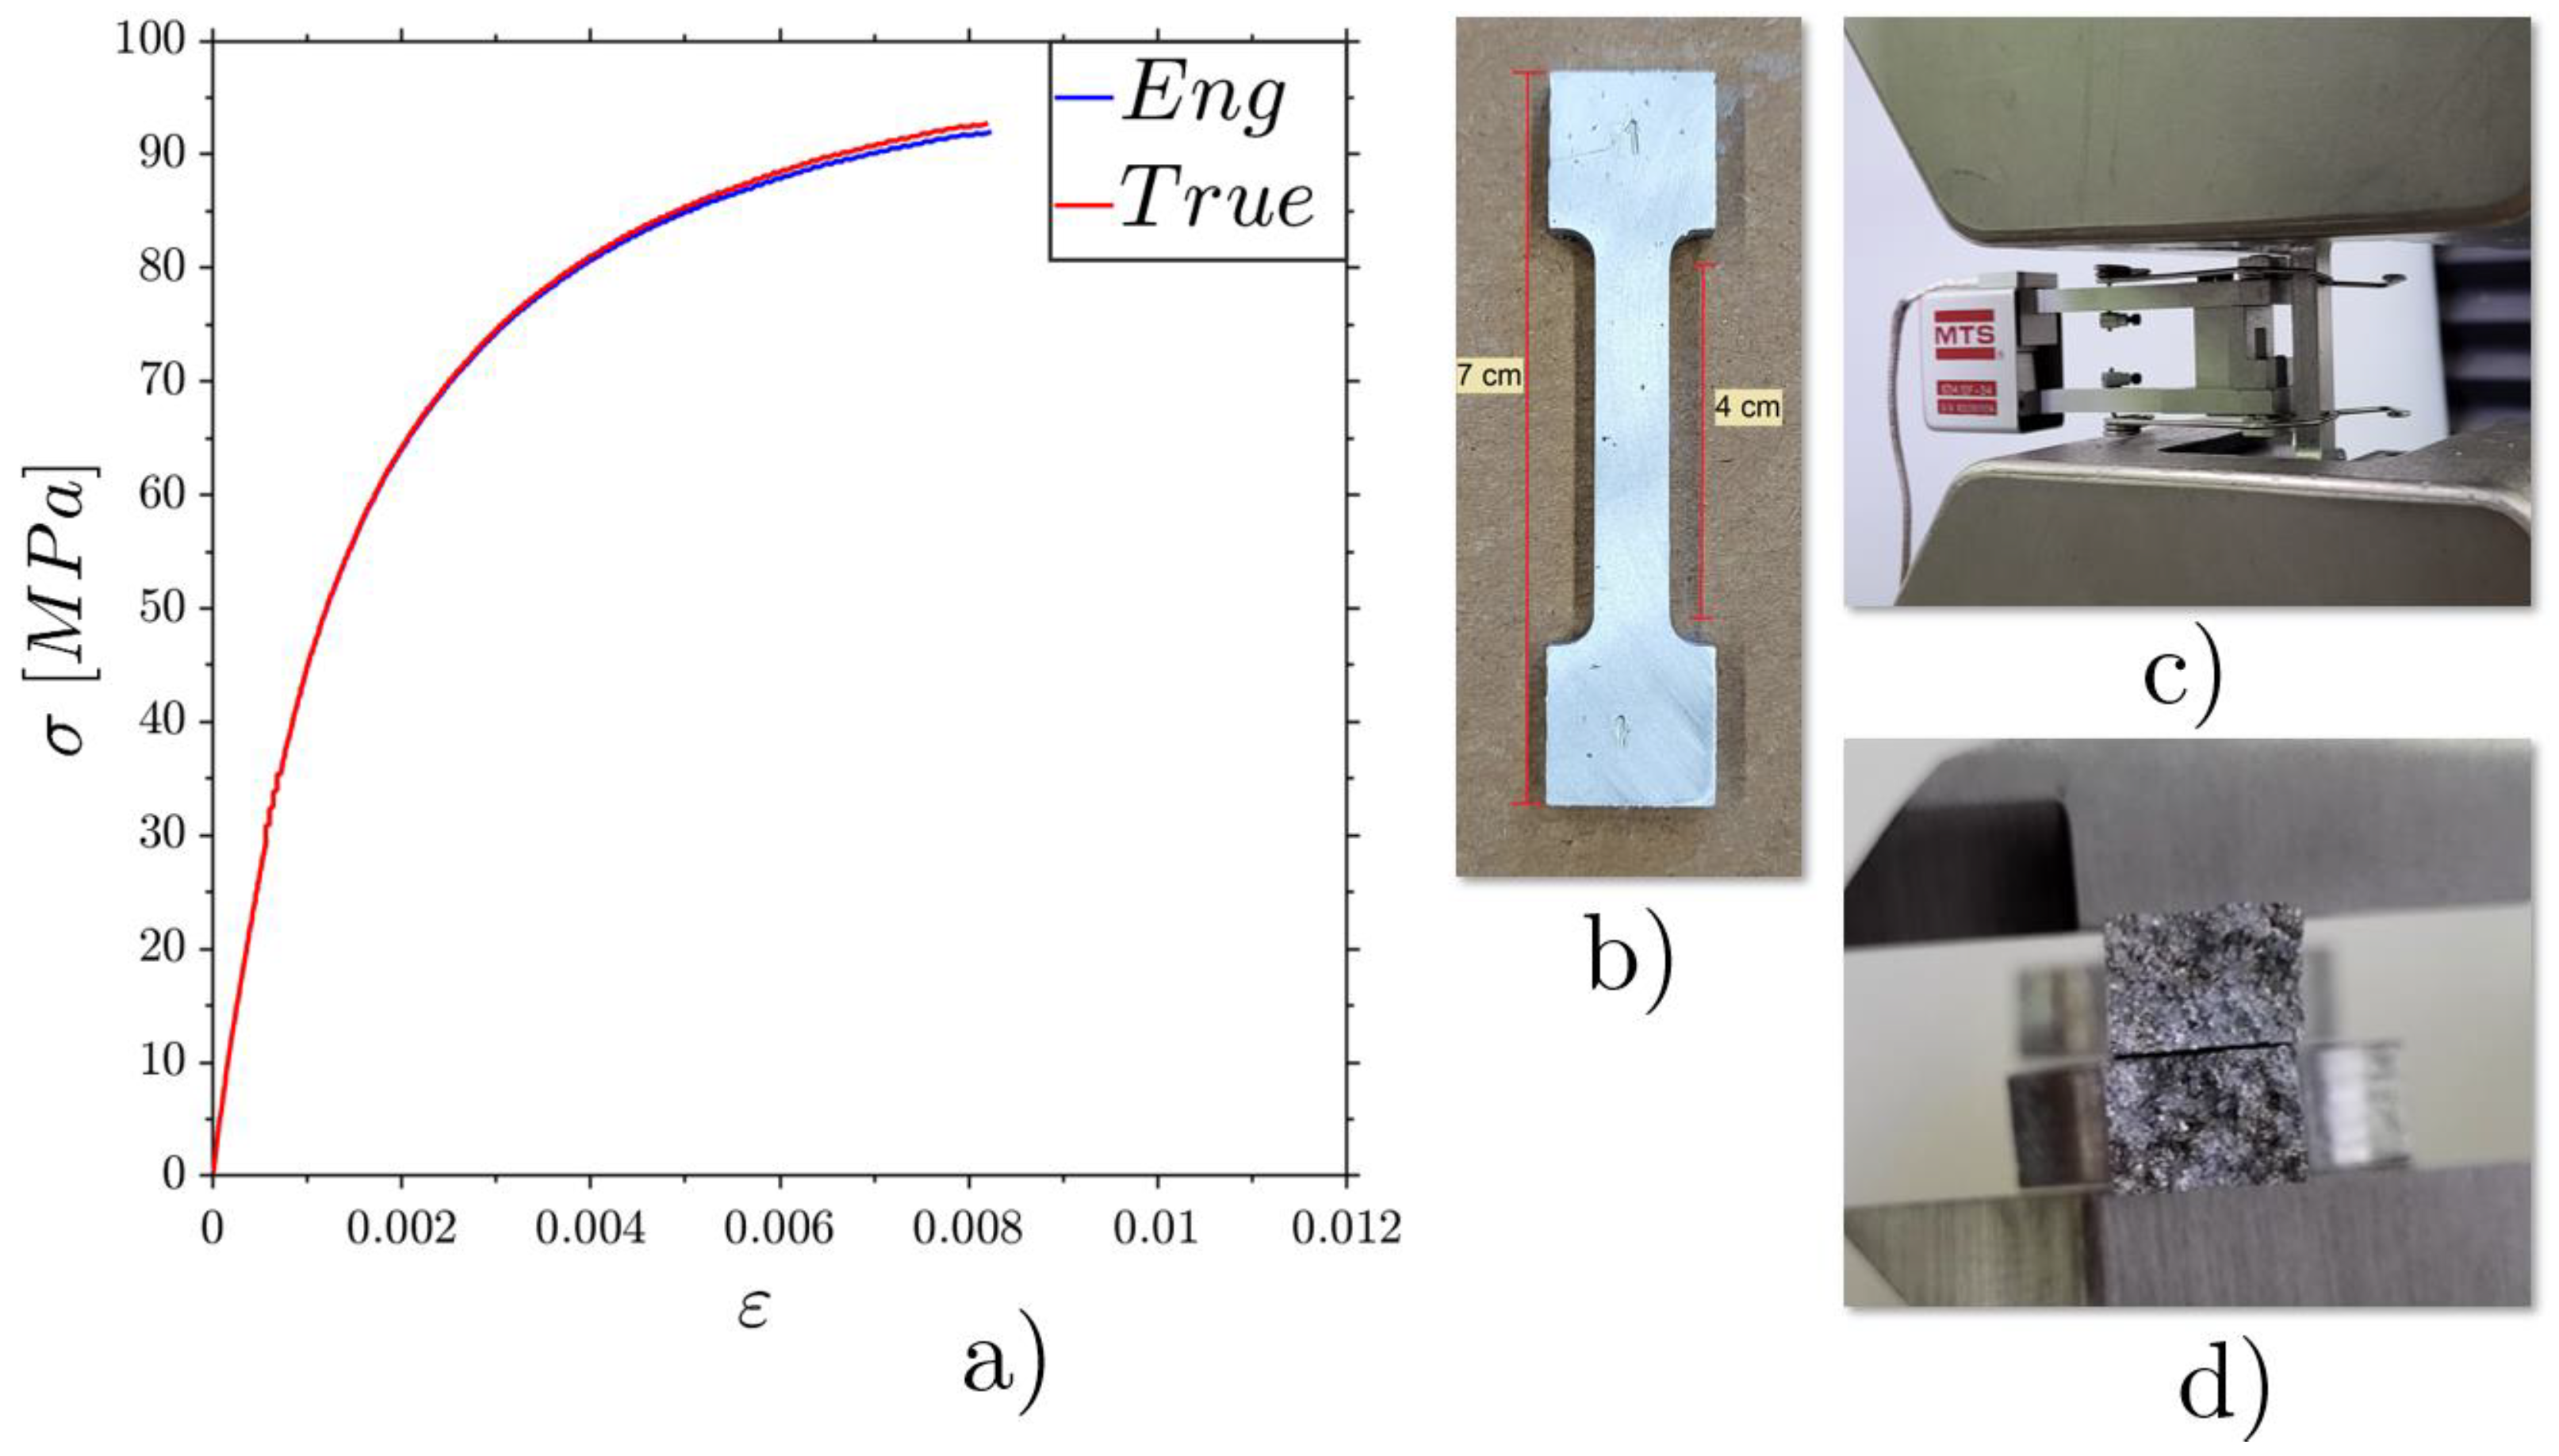
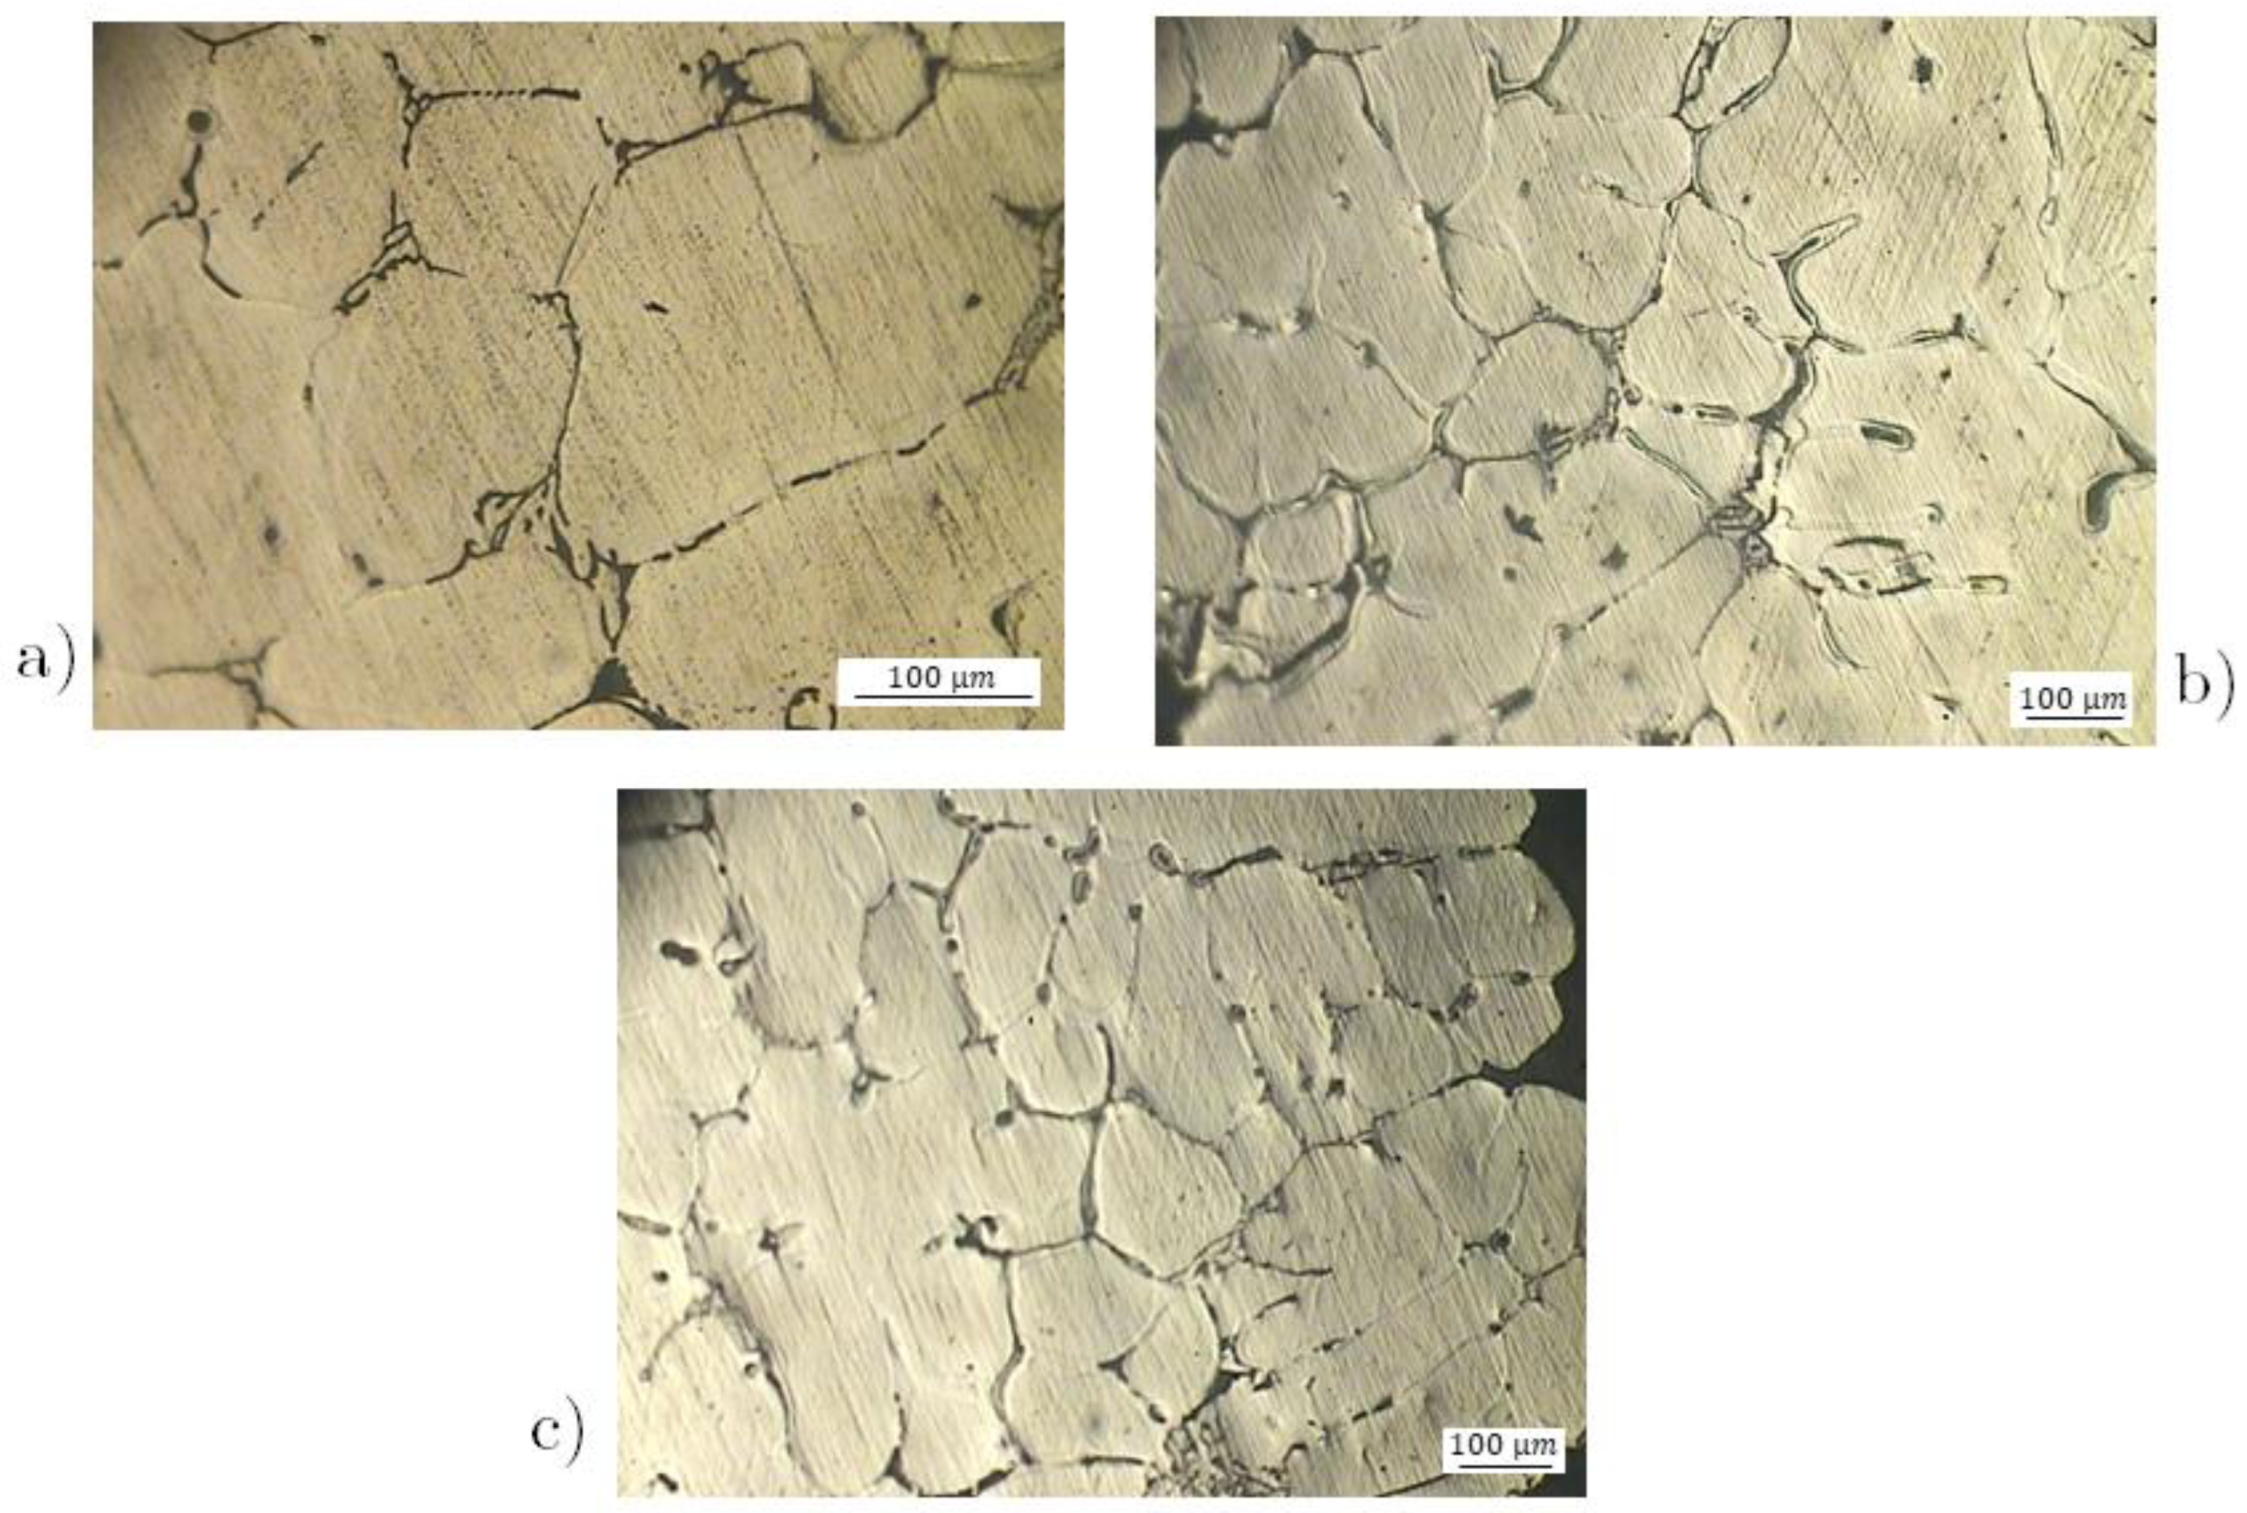
3. Lattice Manufacturing by Lost-PLA Production and Mechanical Properties of AA 6082 Alloy after Casting
4. Experimental Tests and Finite Element Analysis
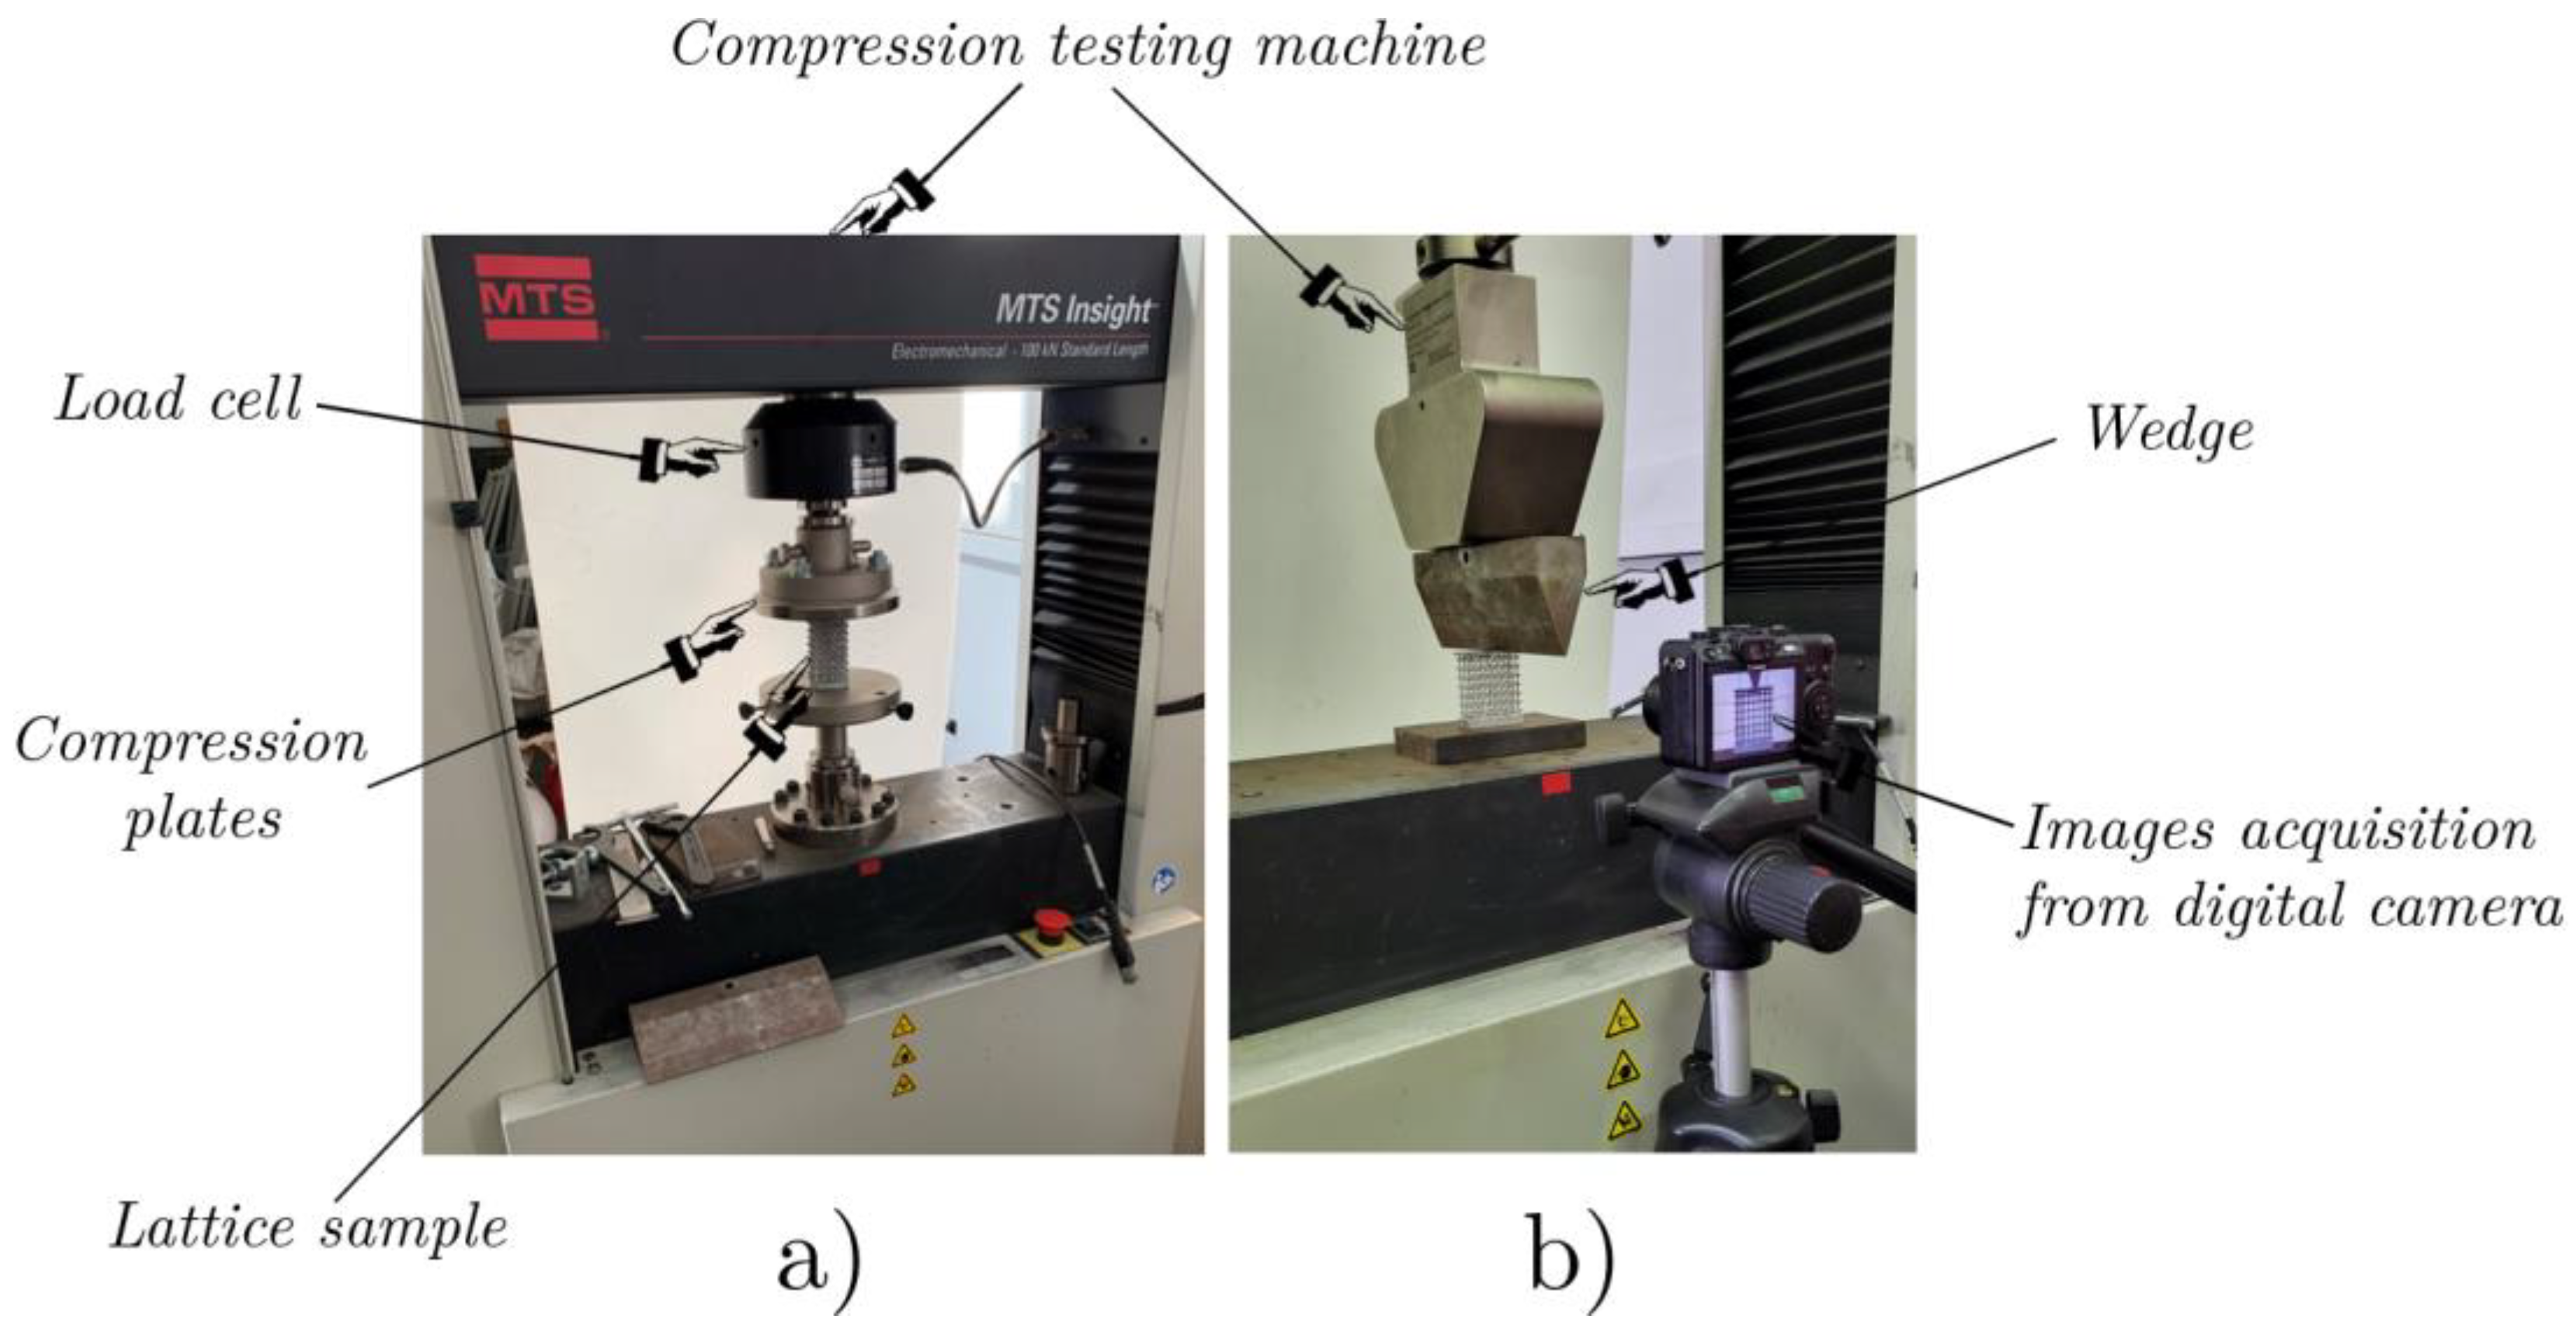
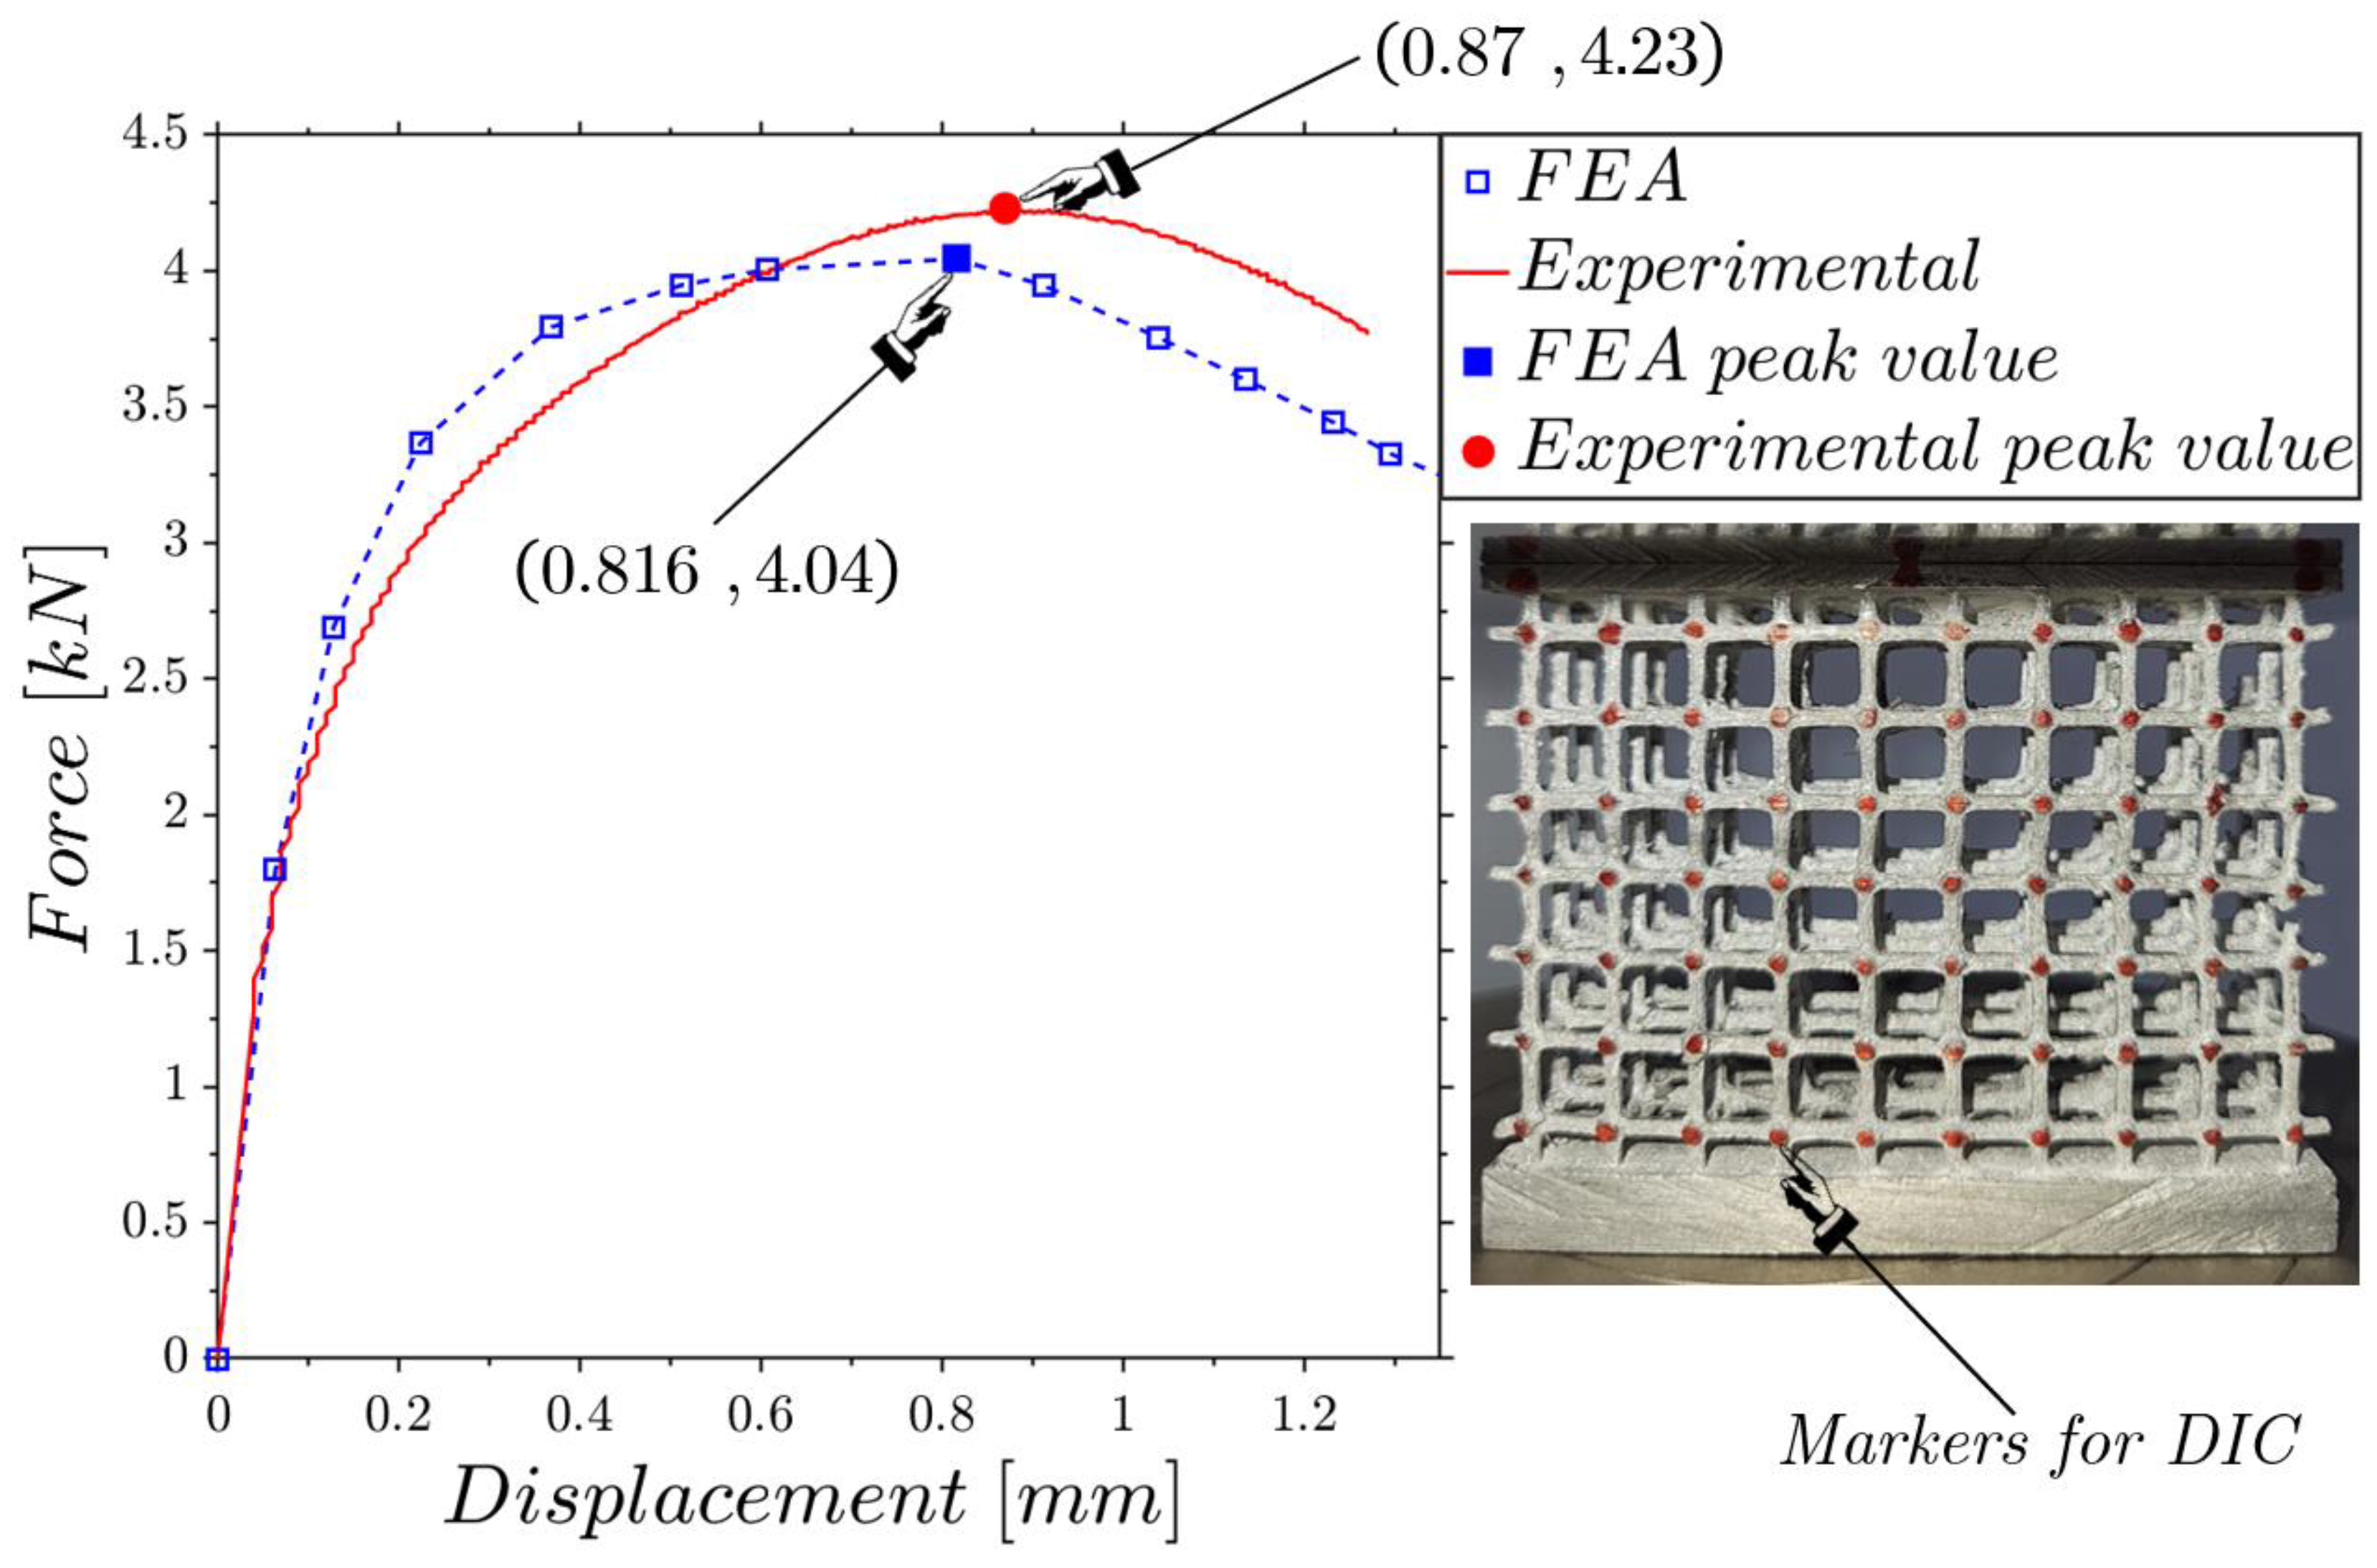
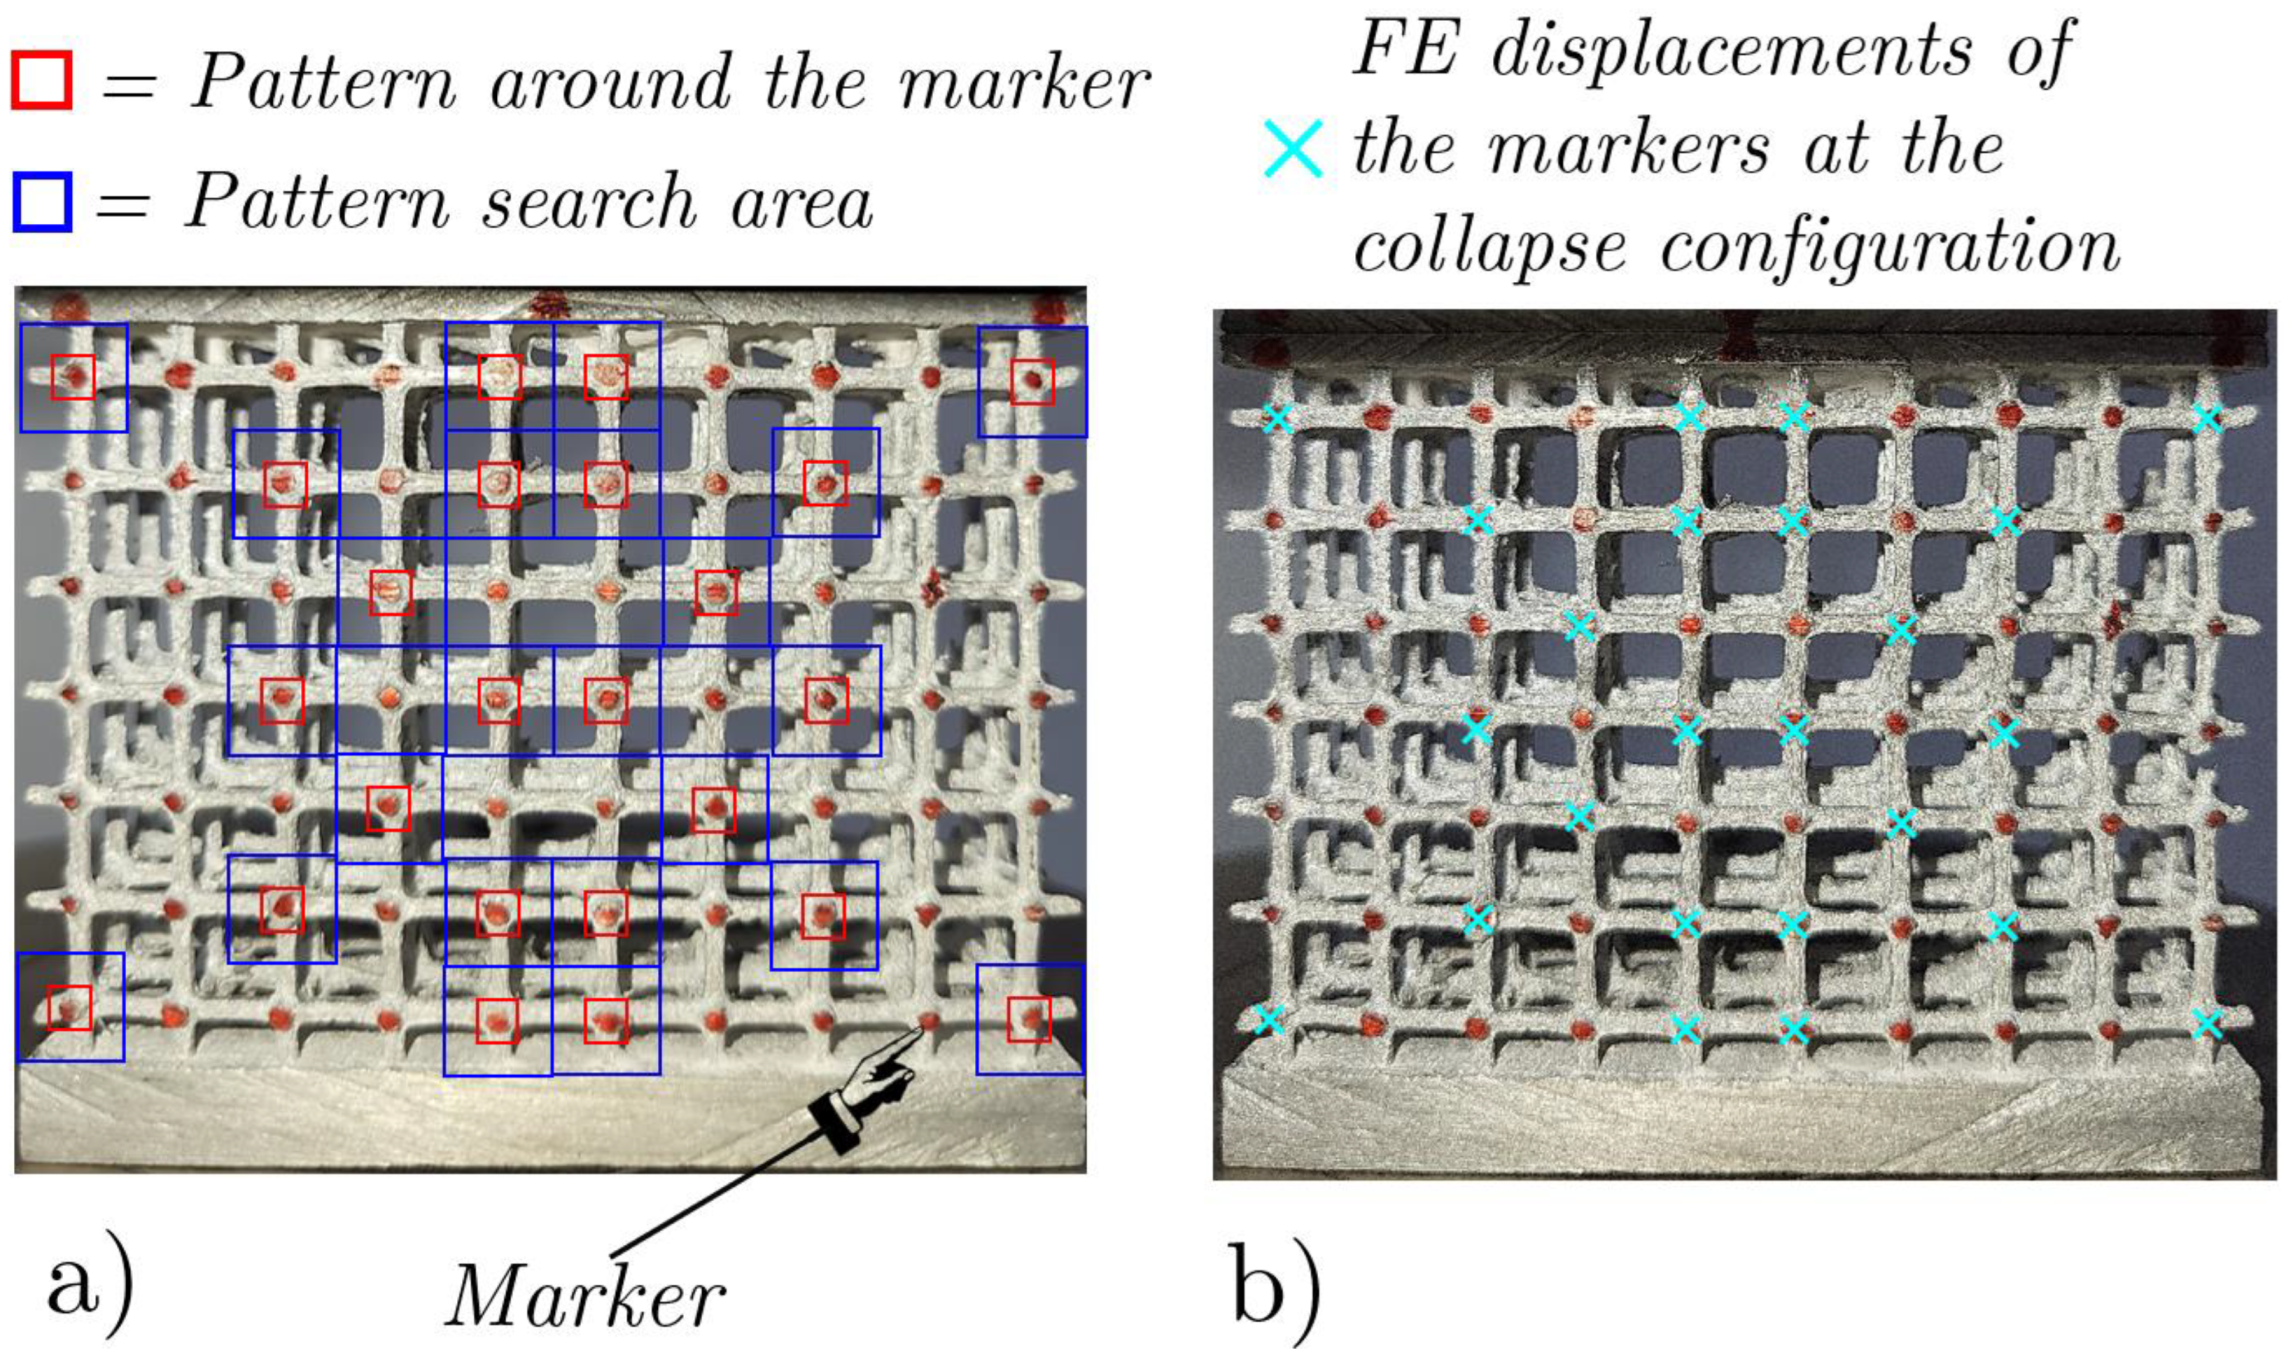
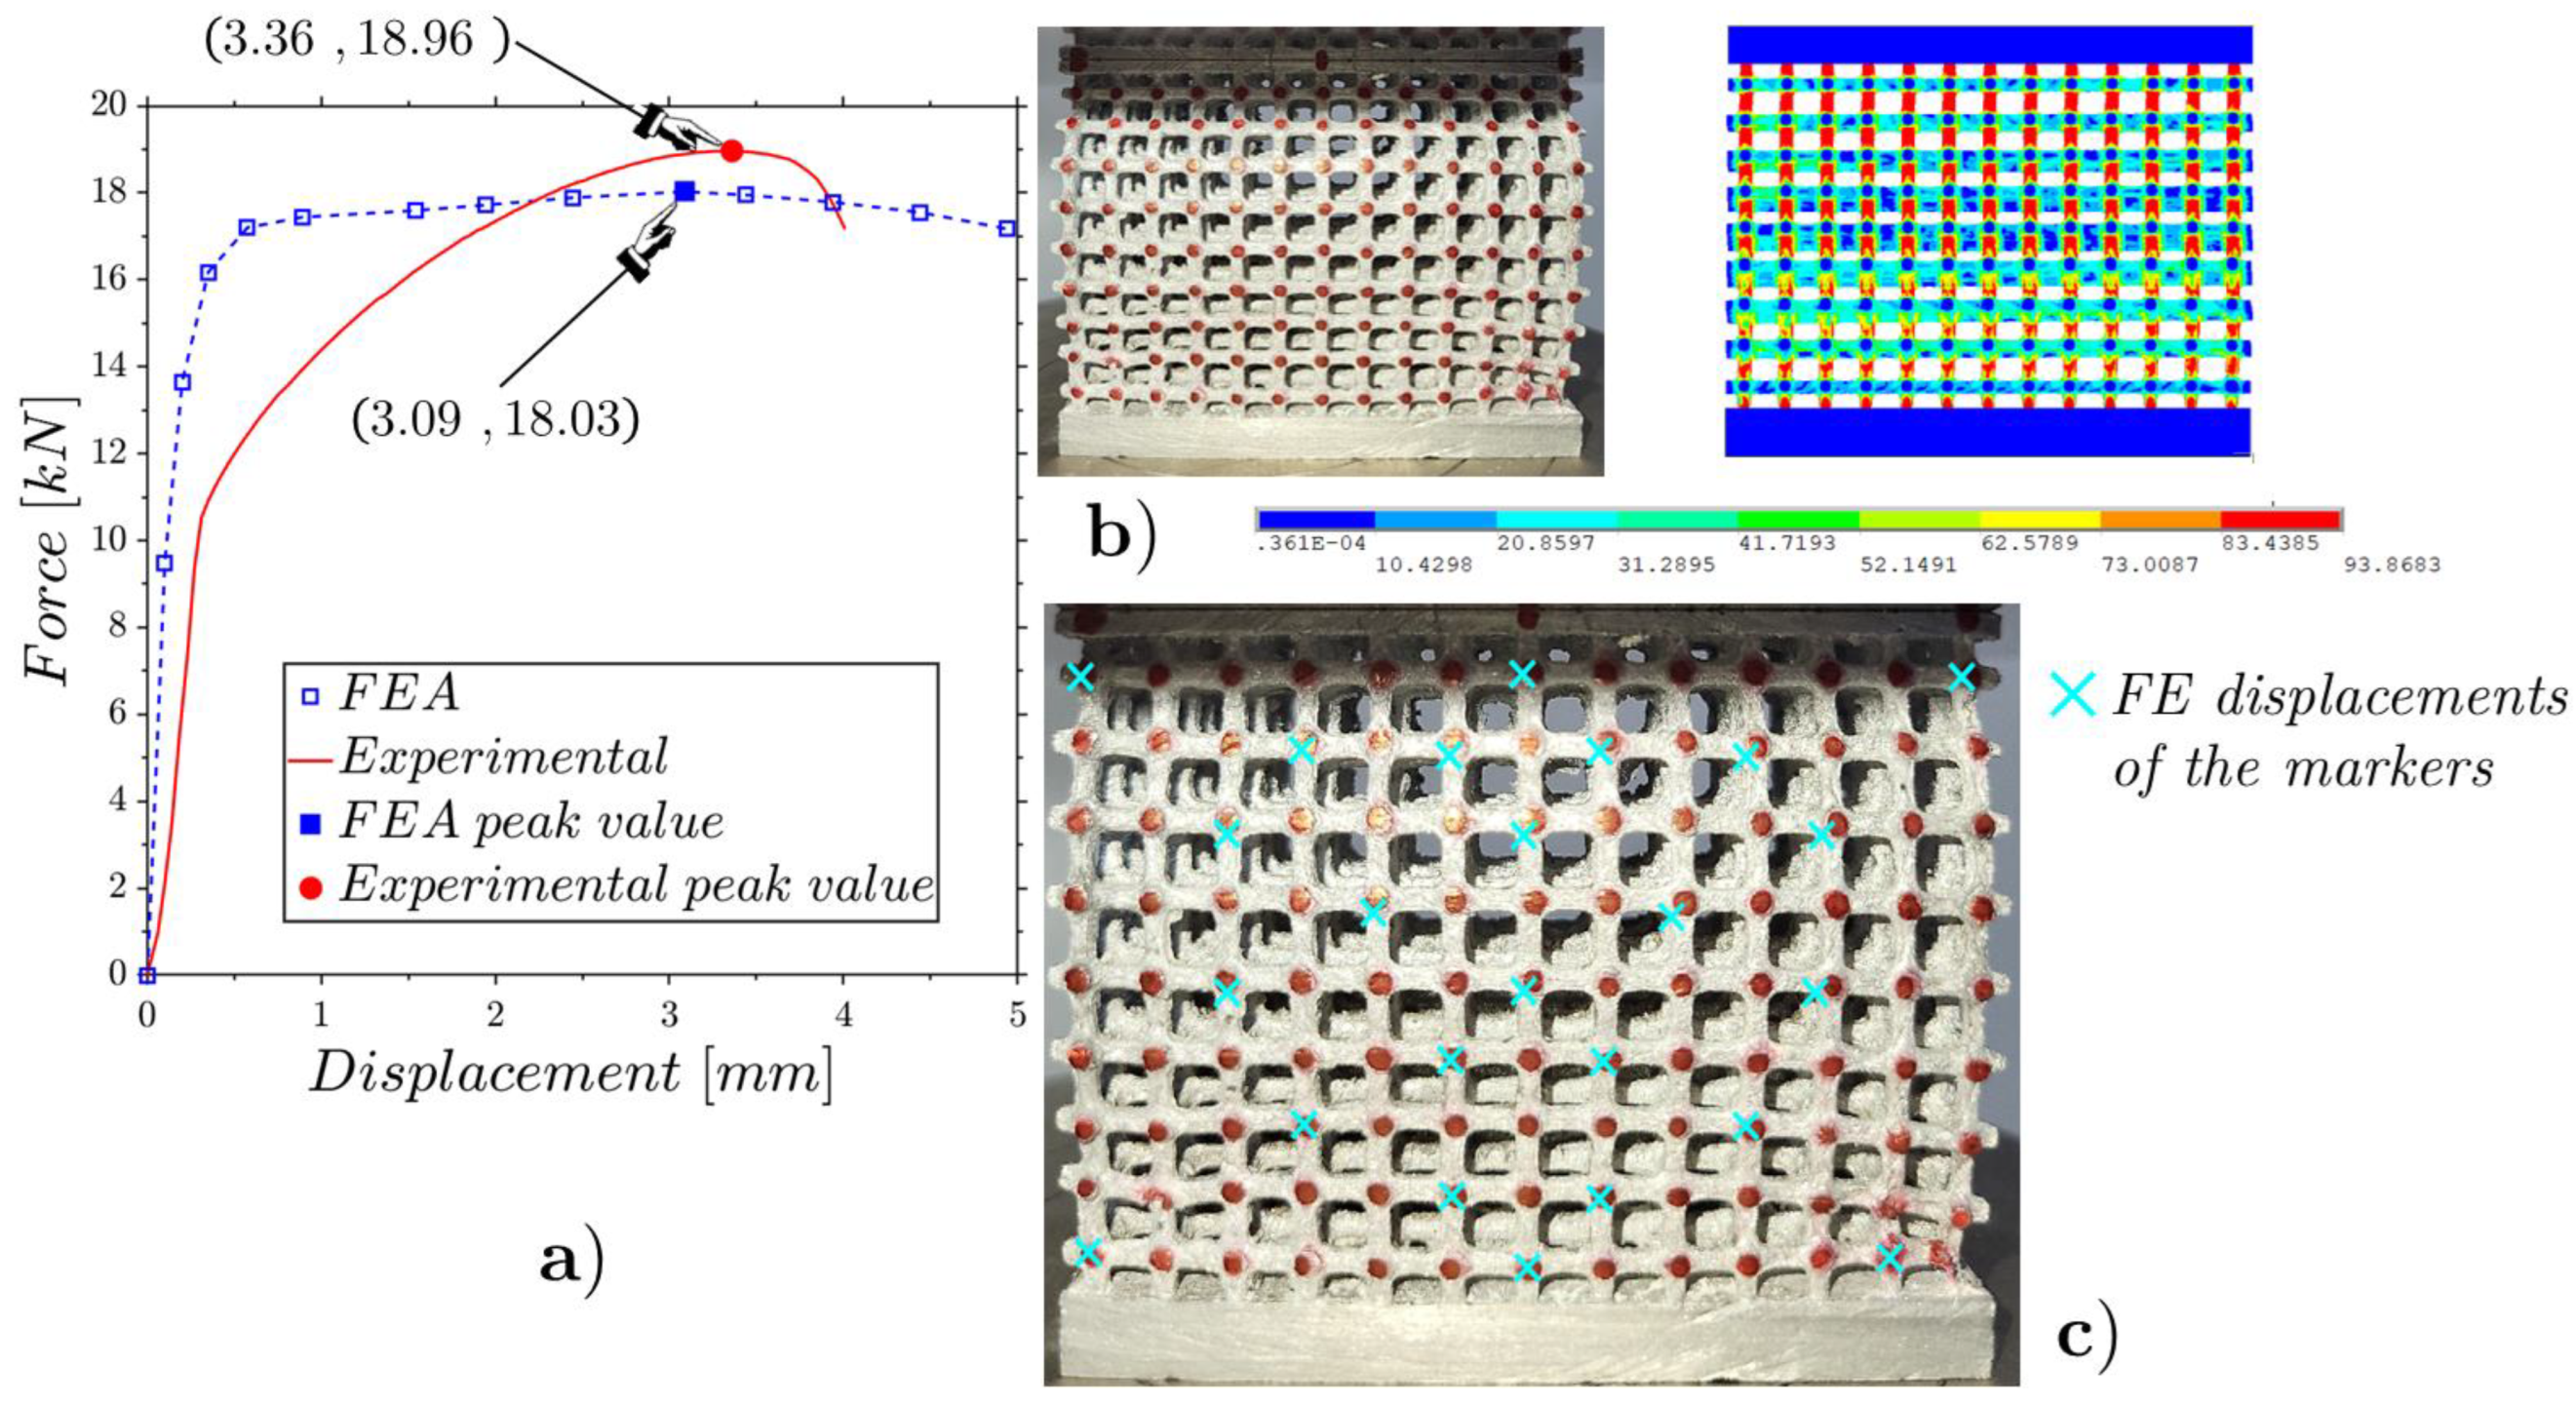
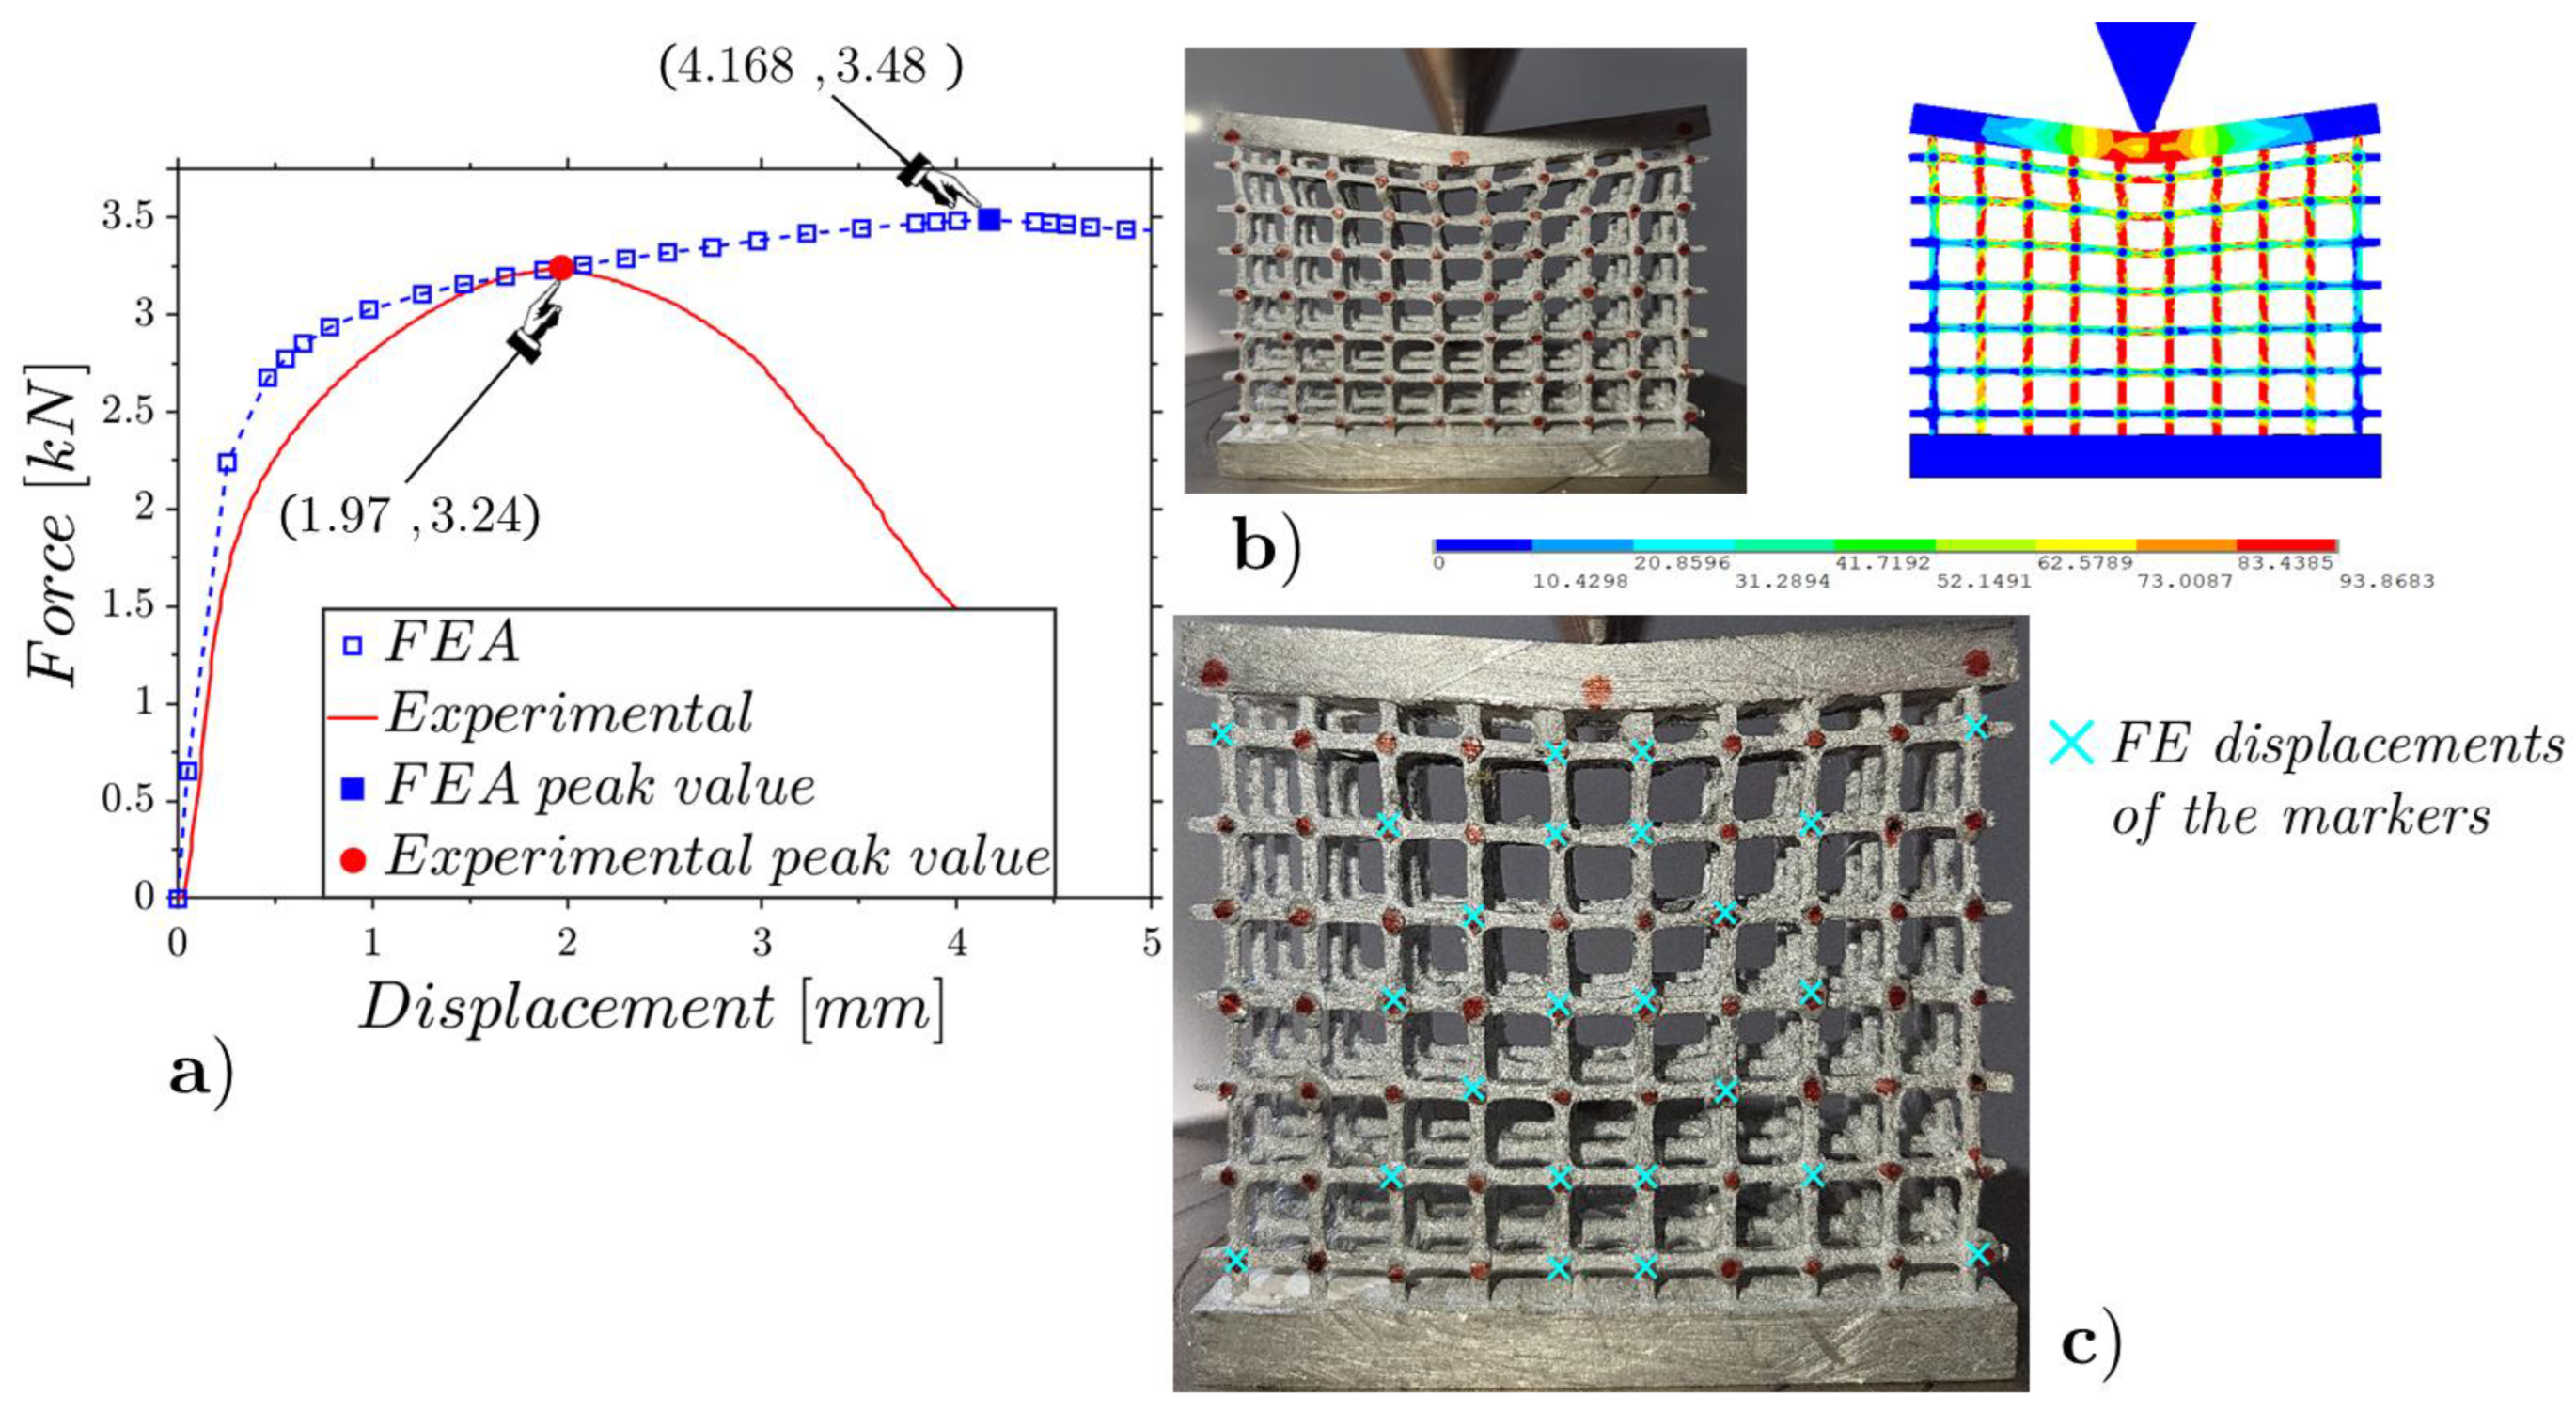
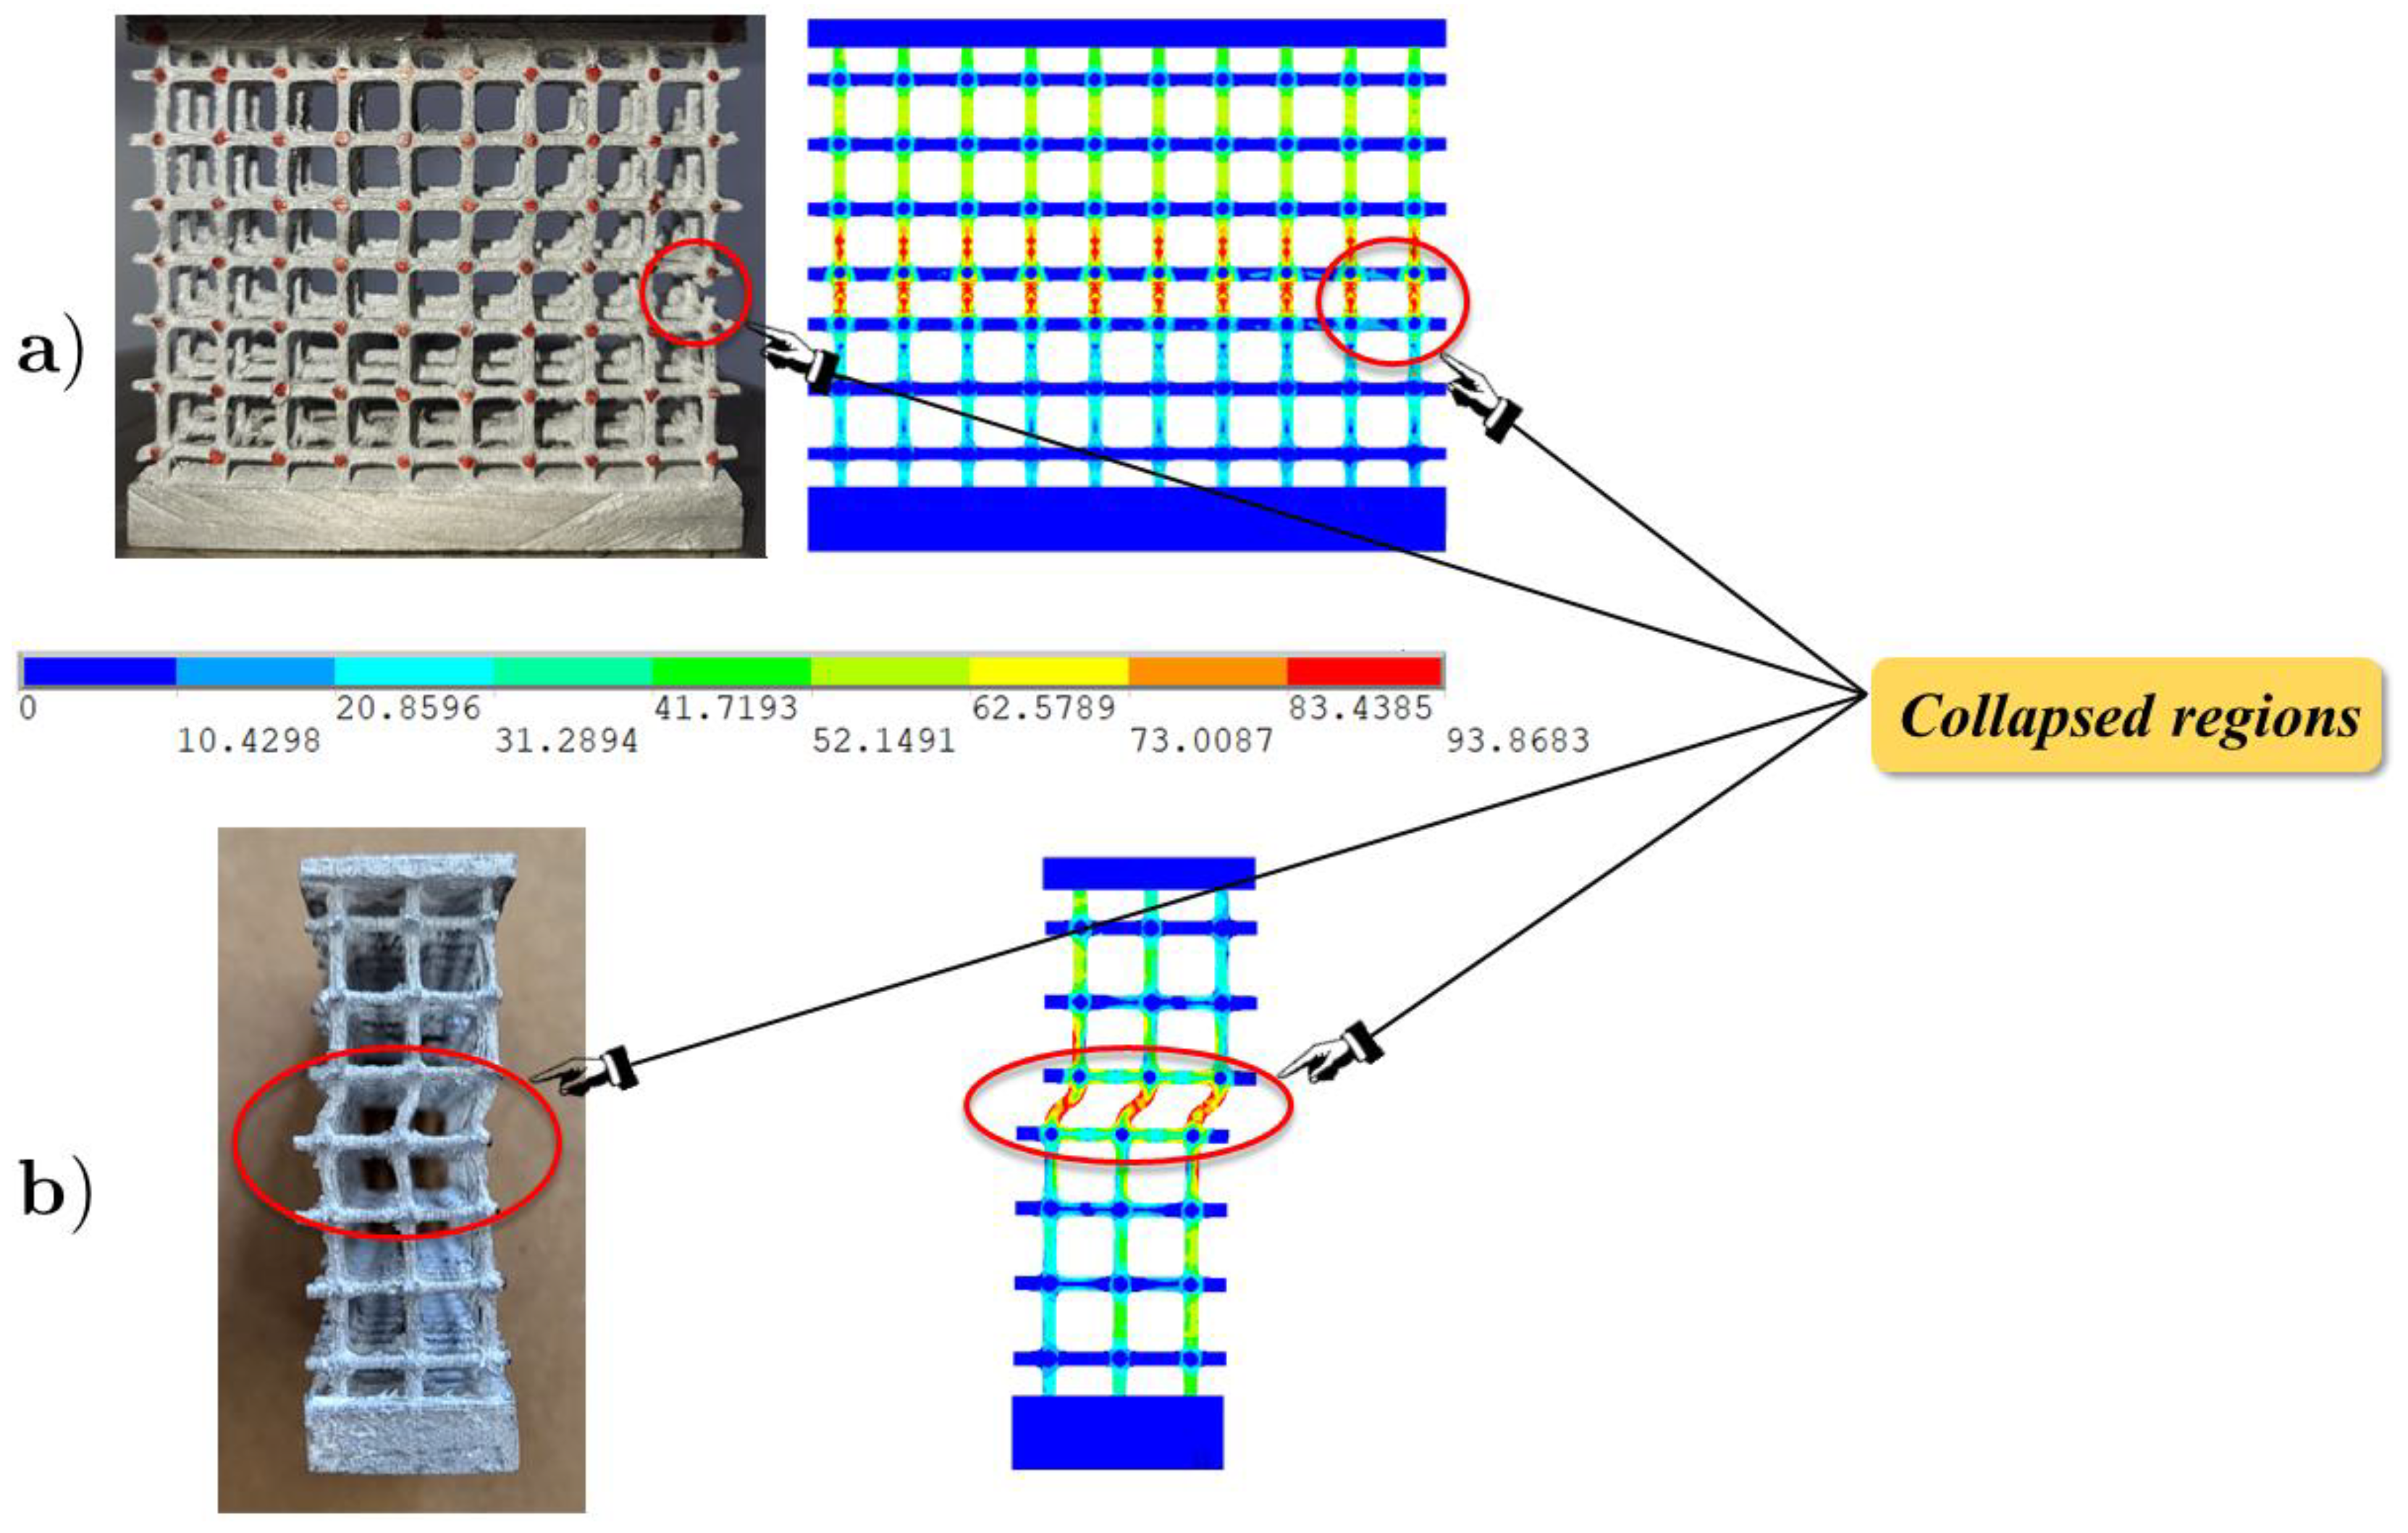
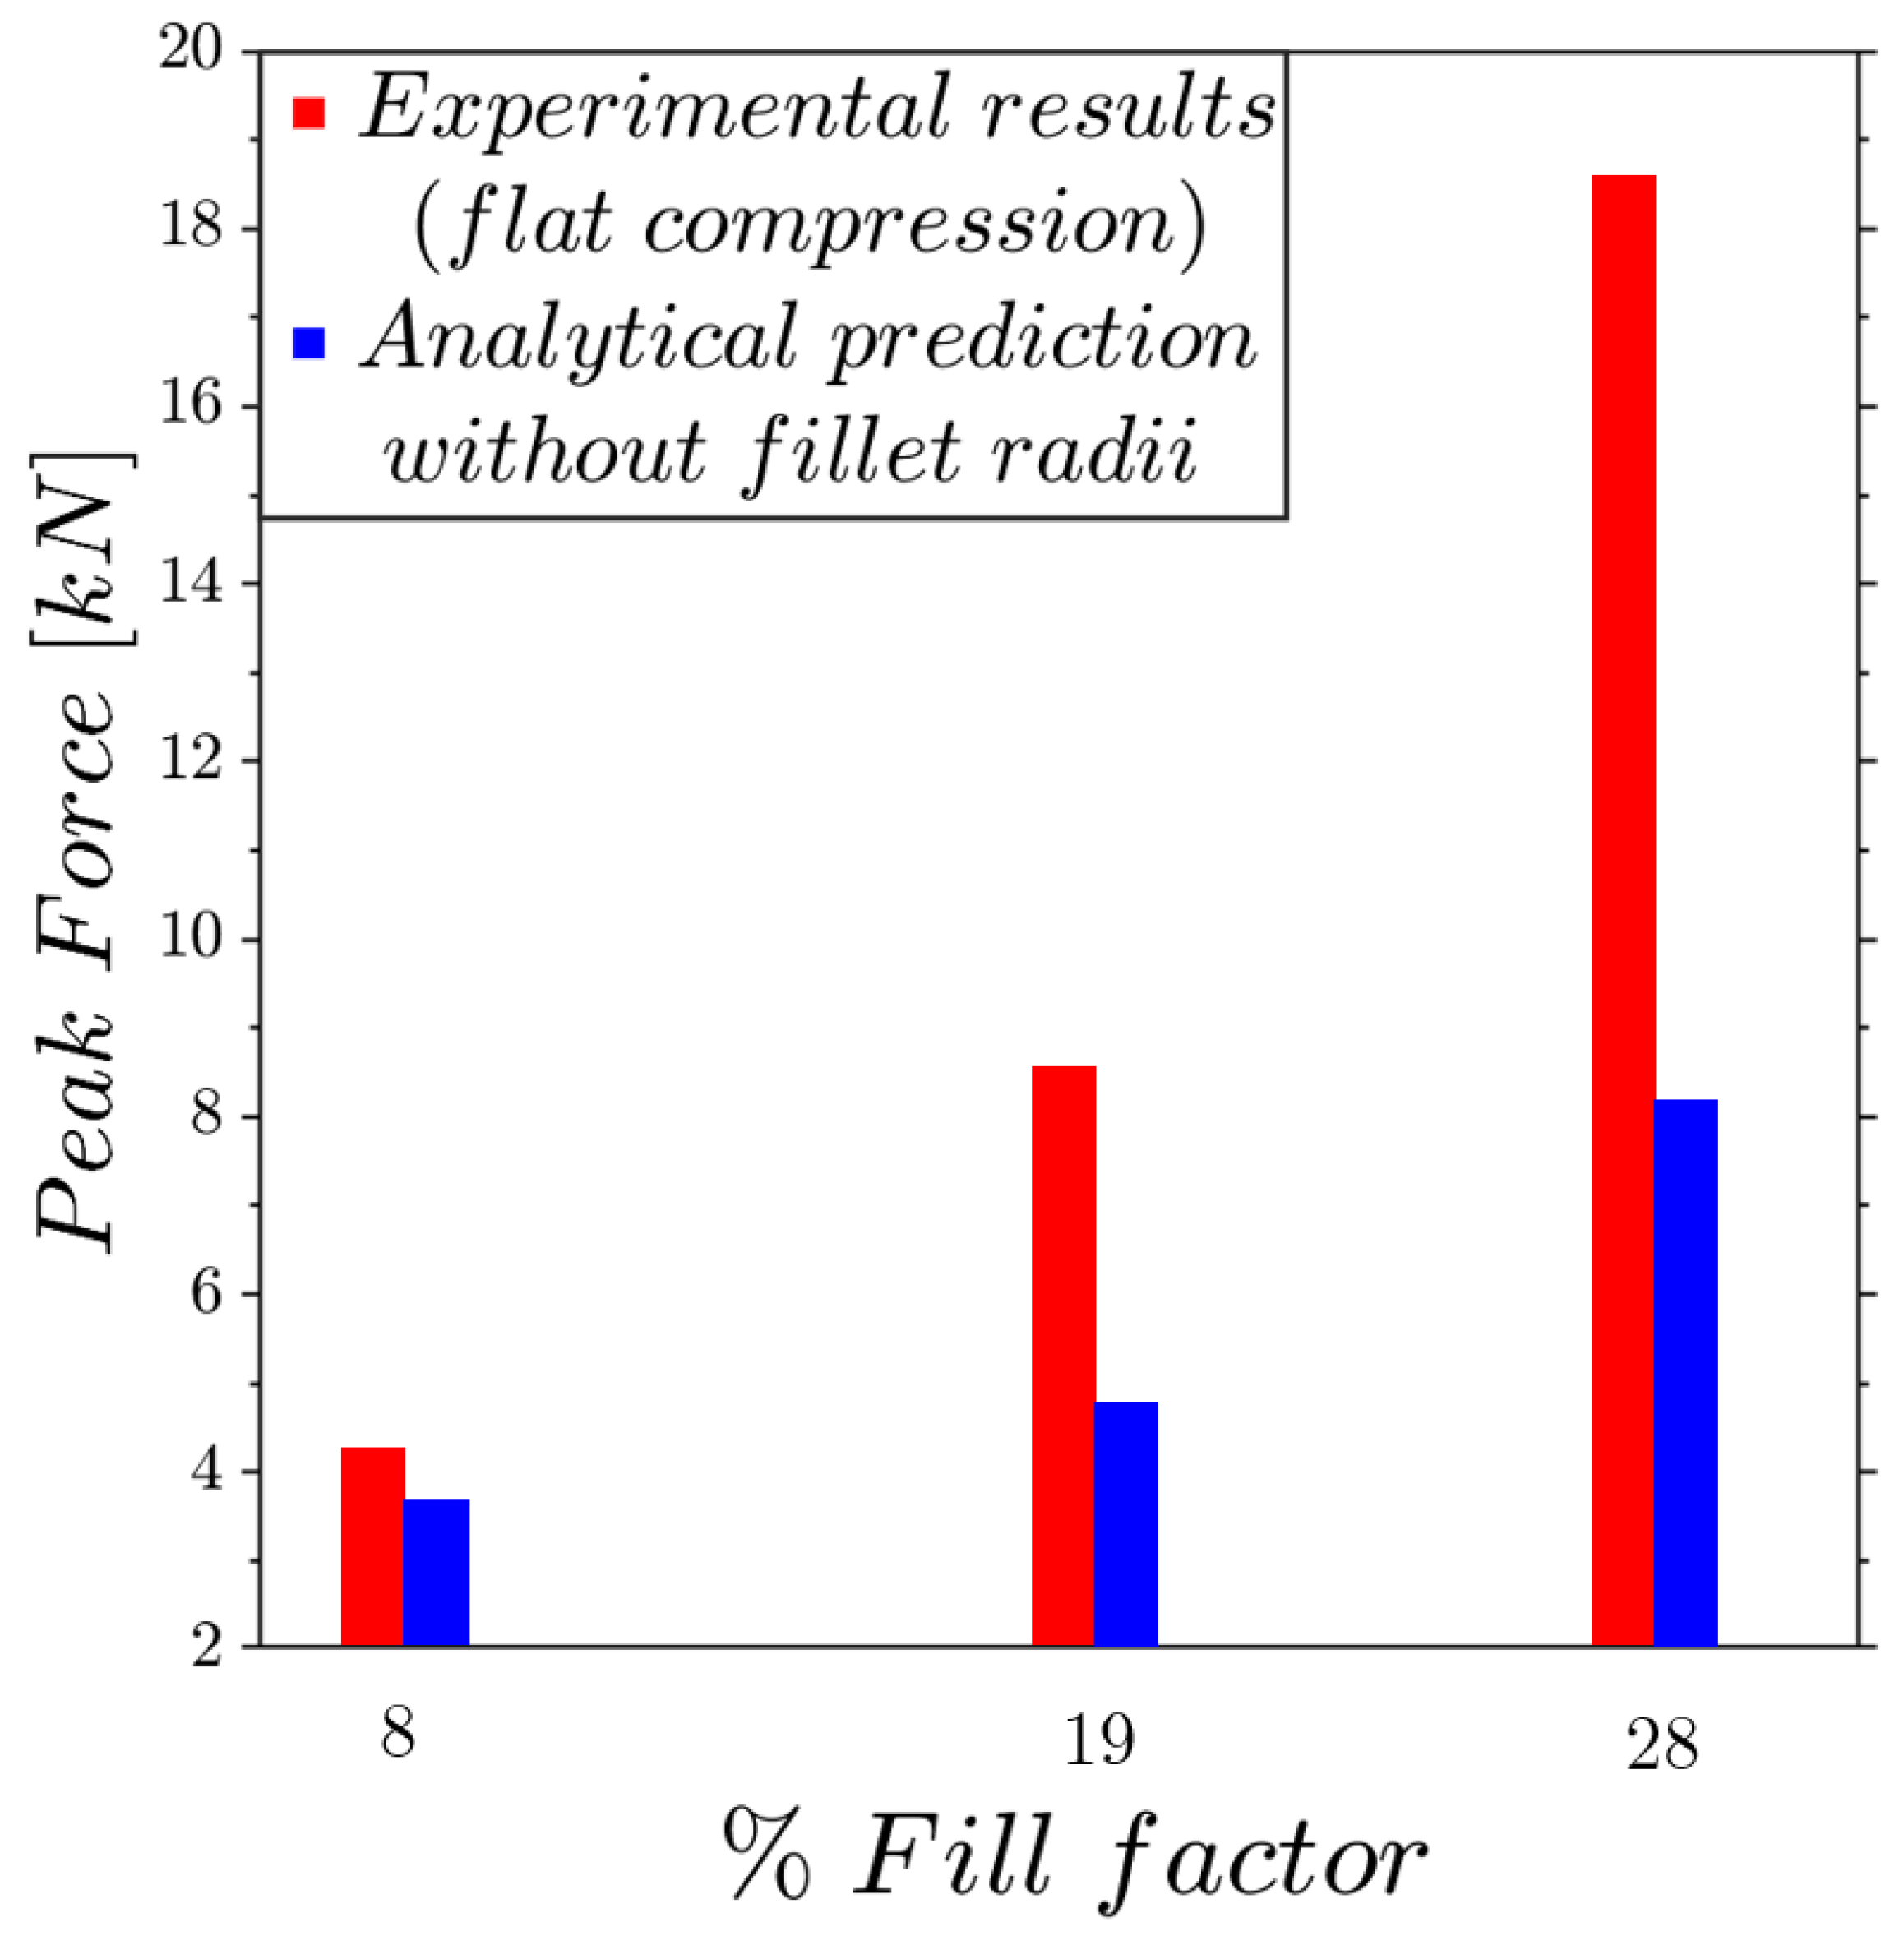
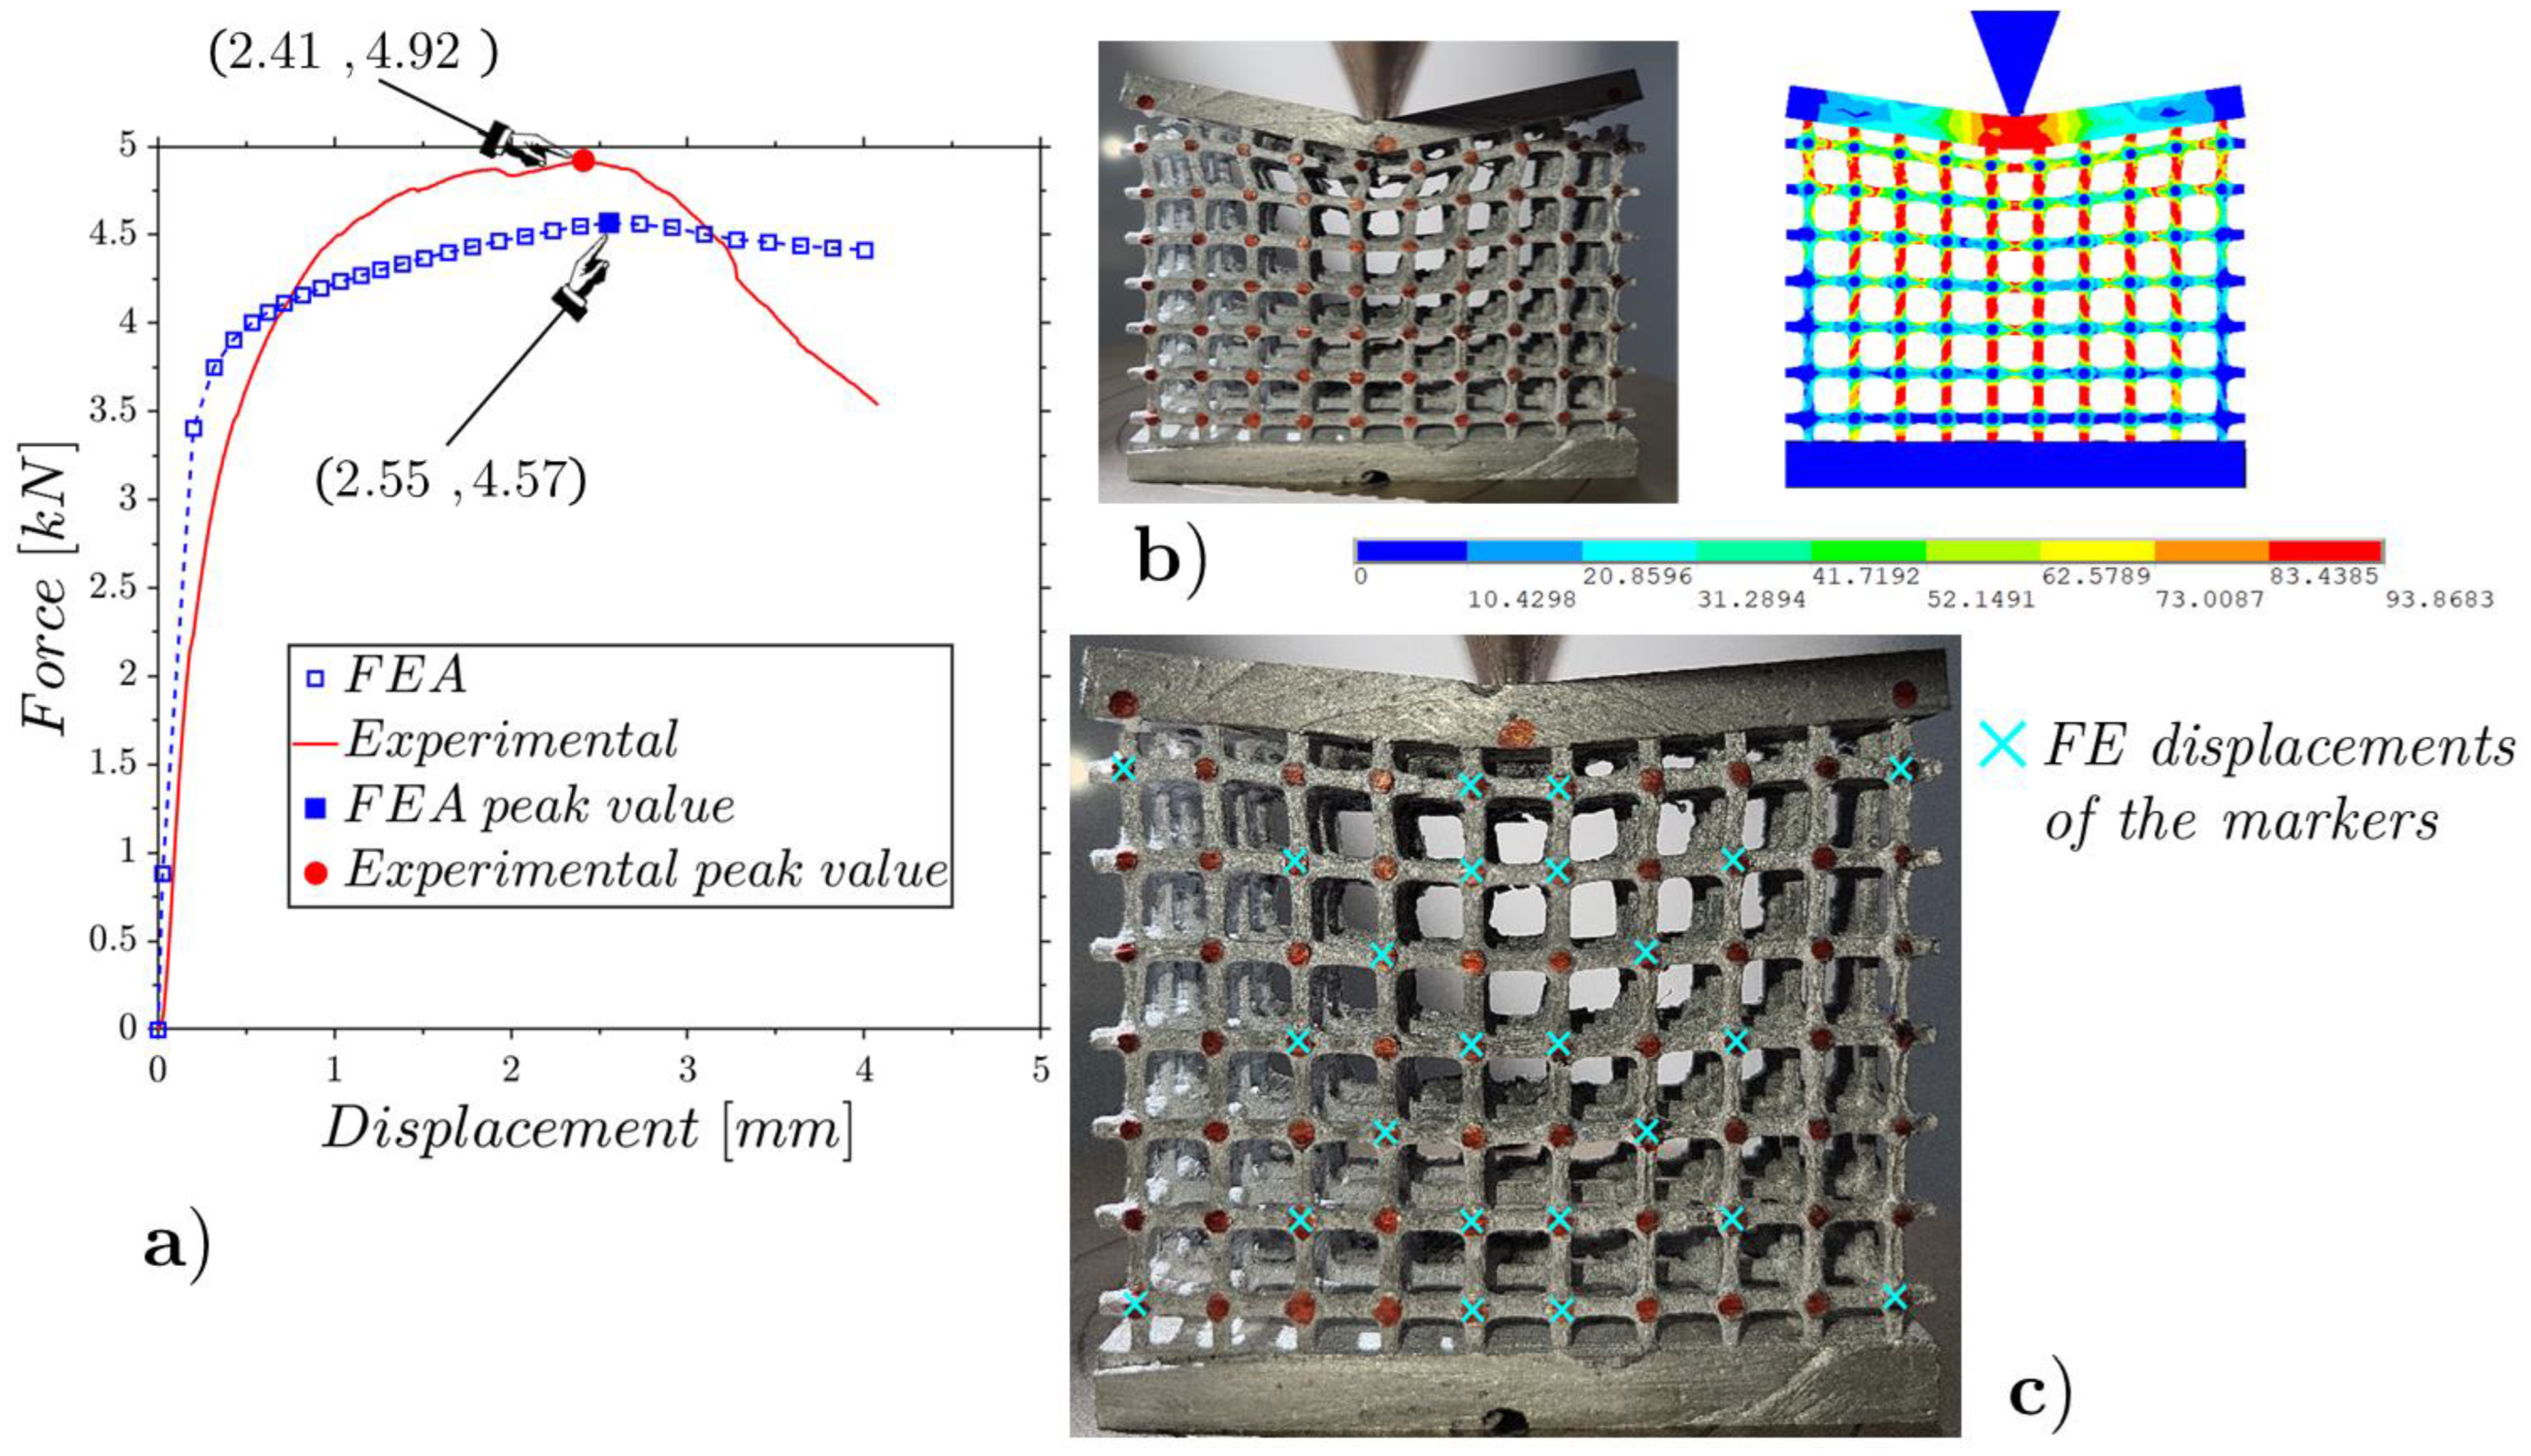
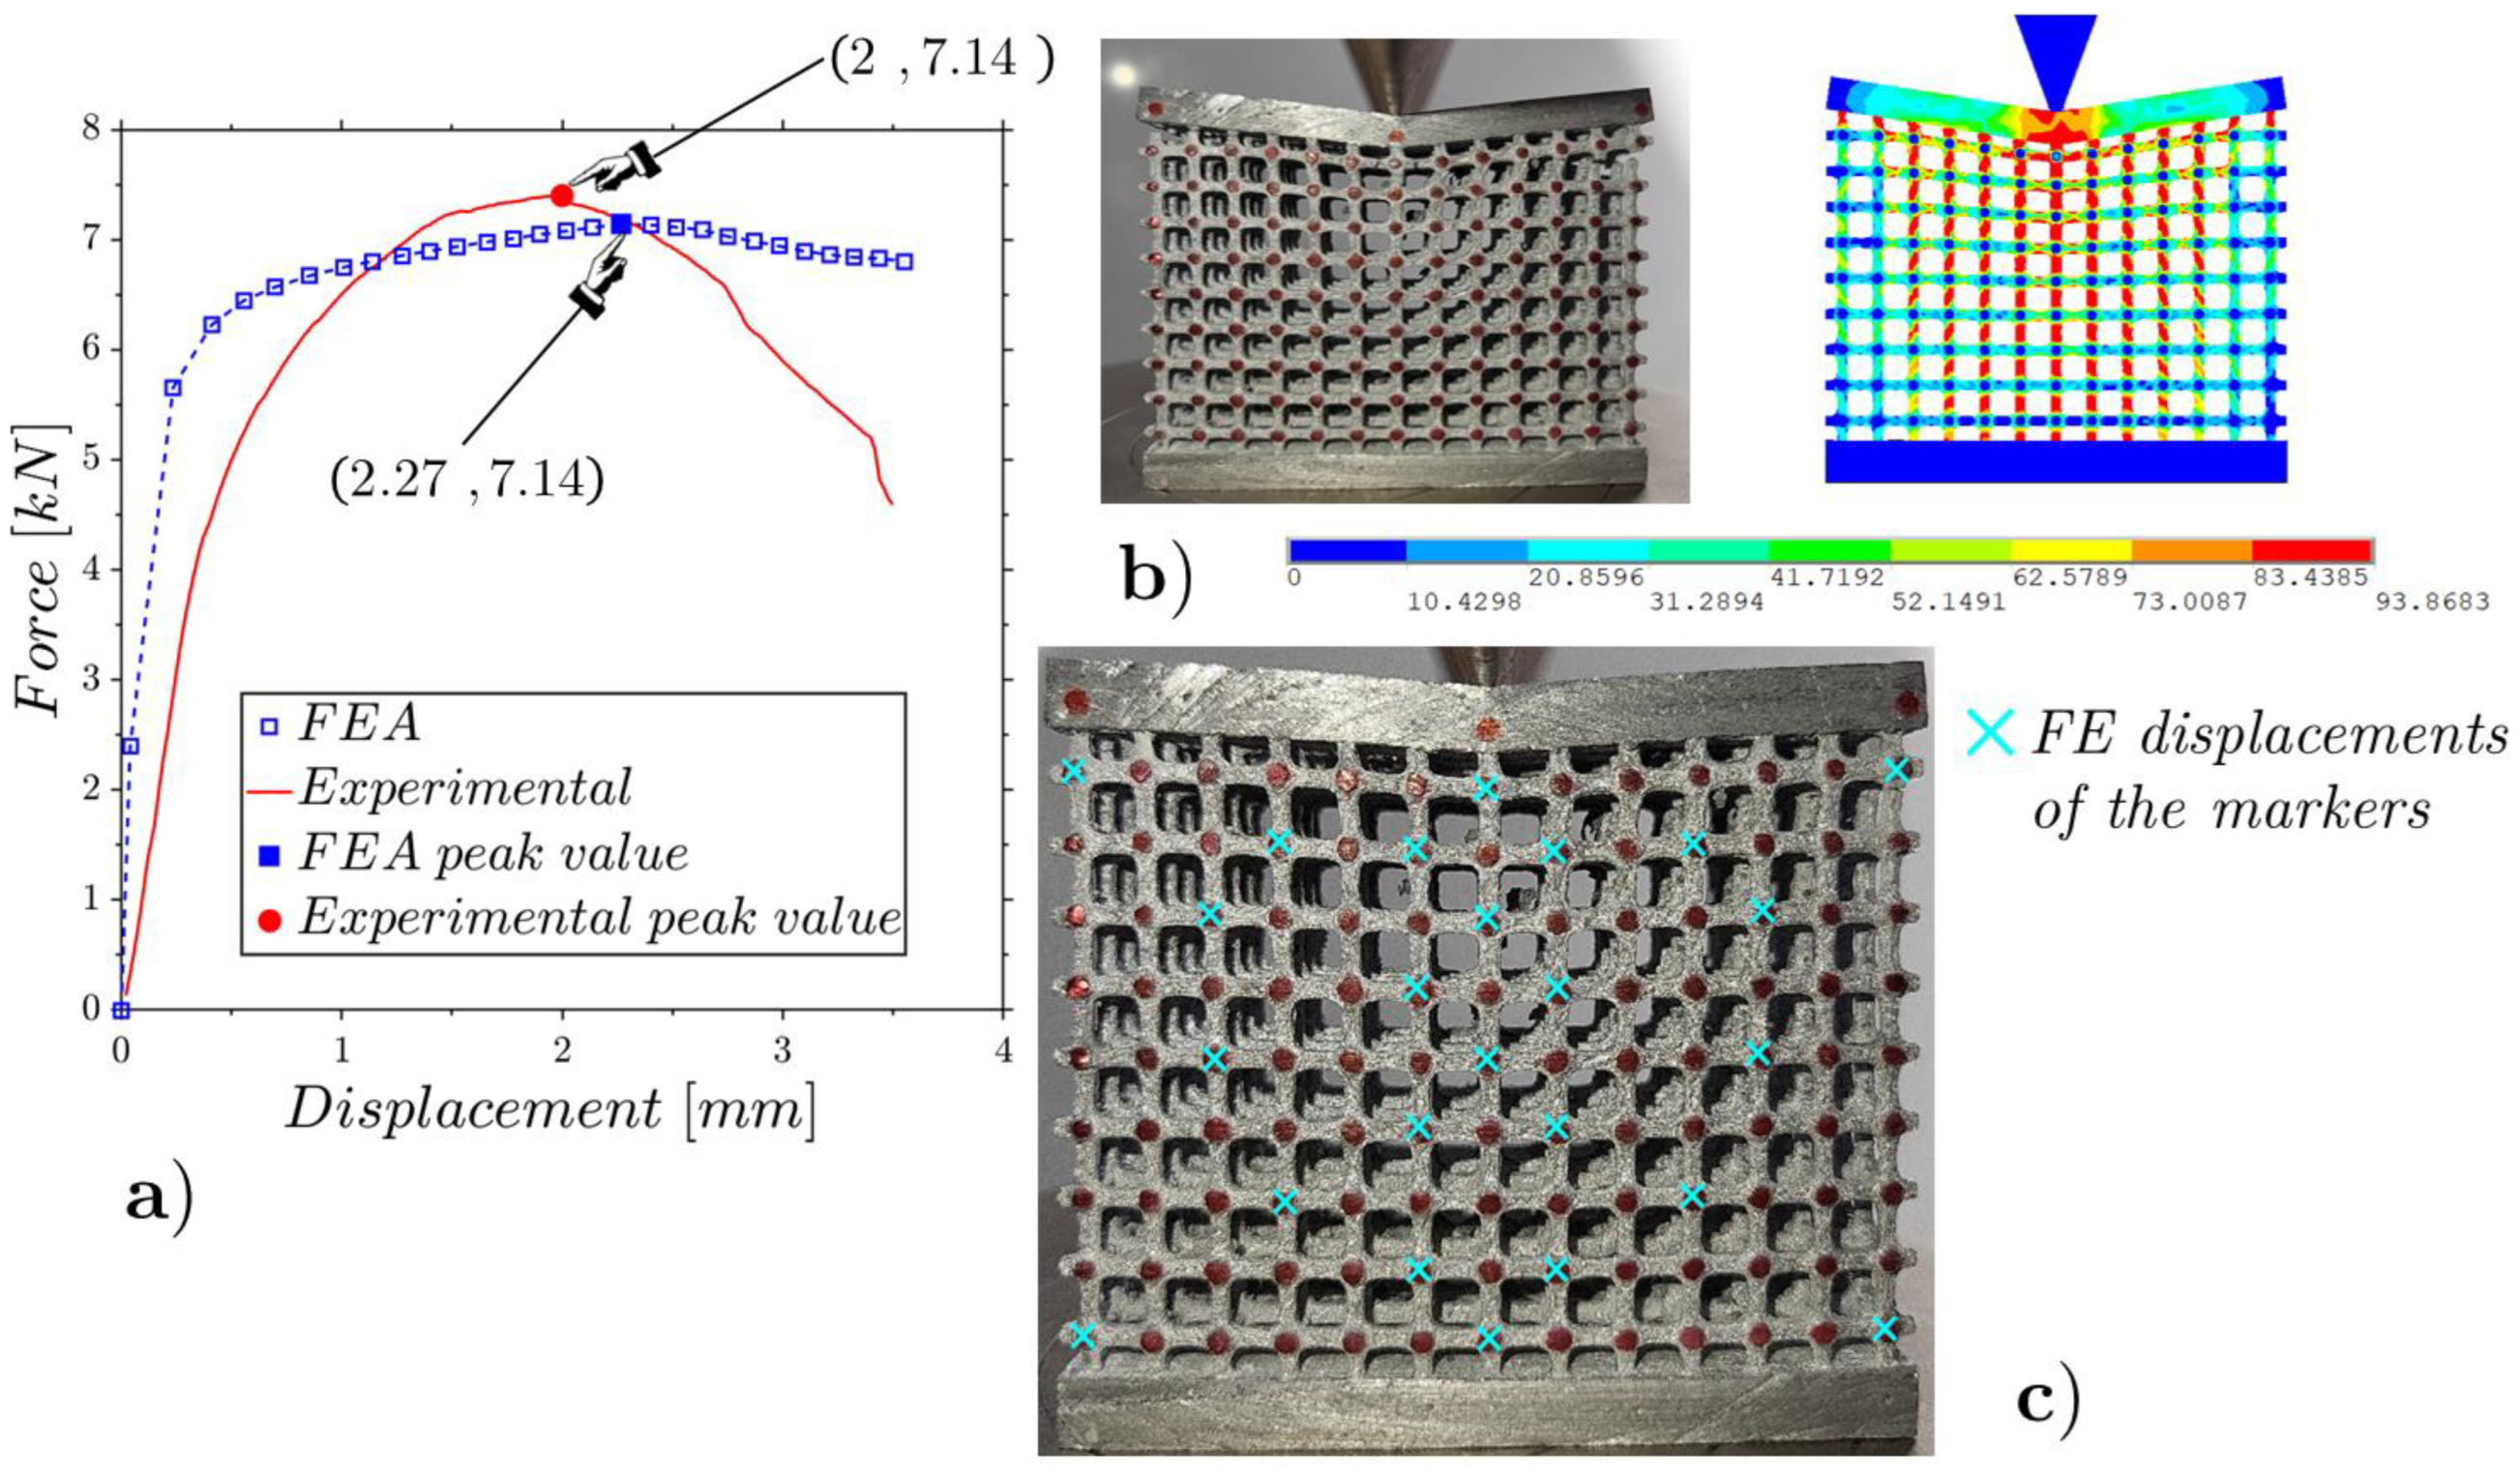
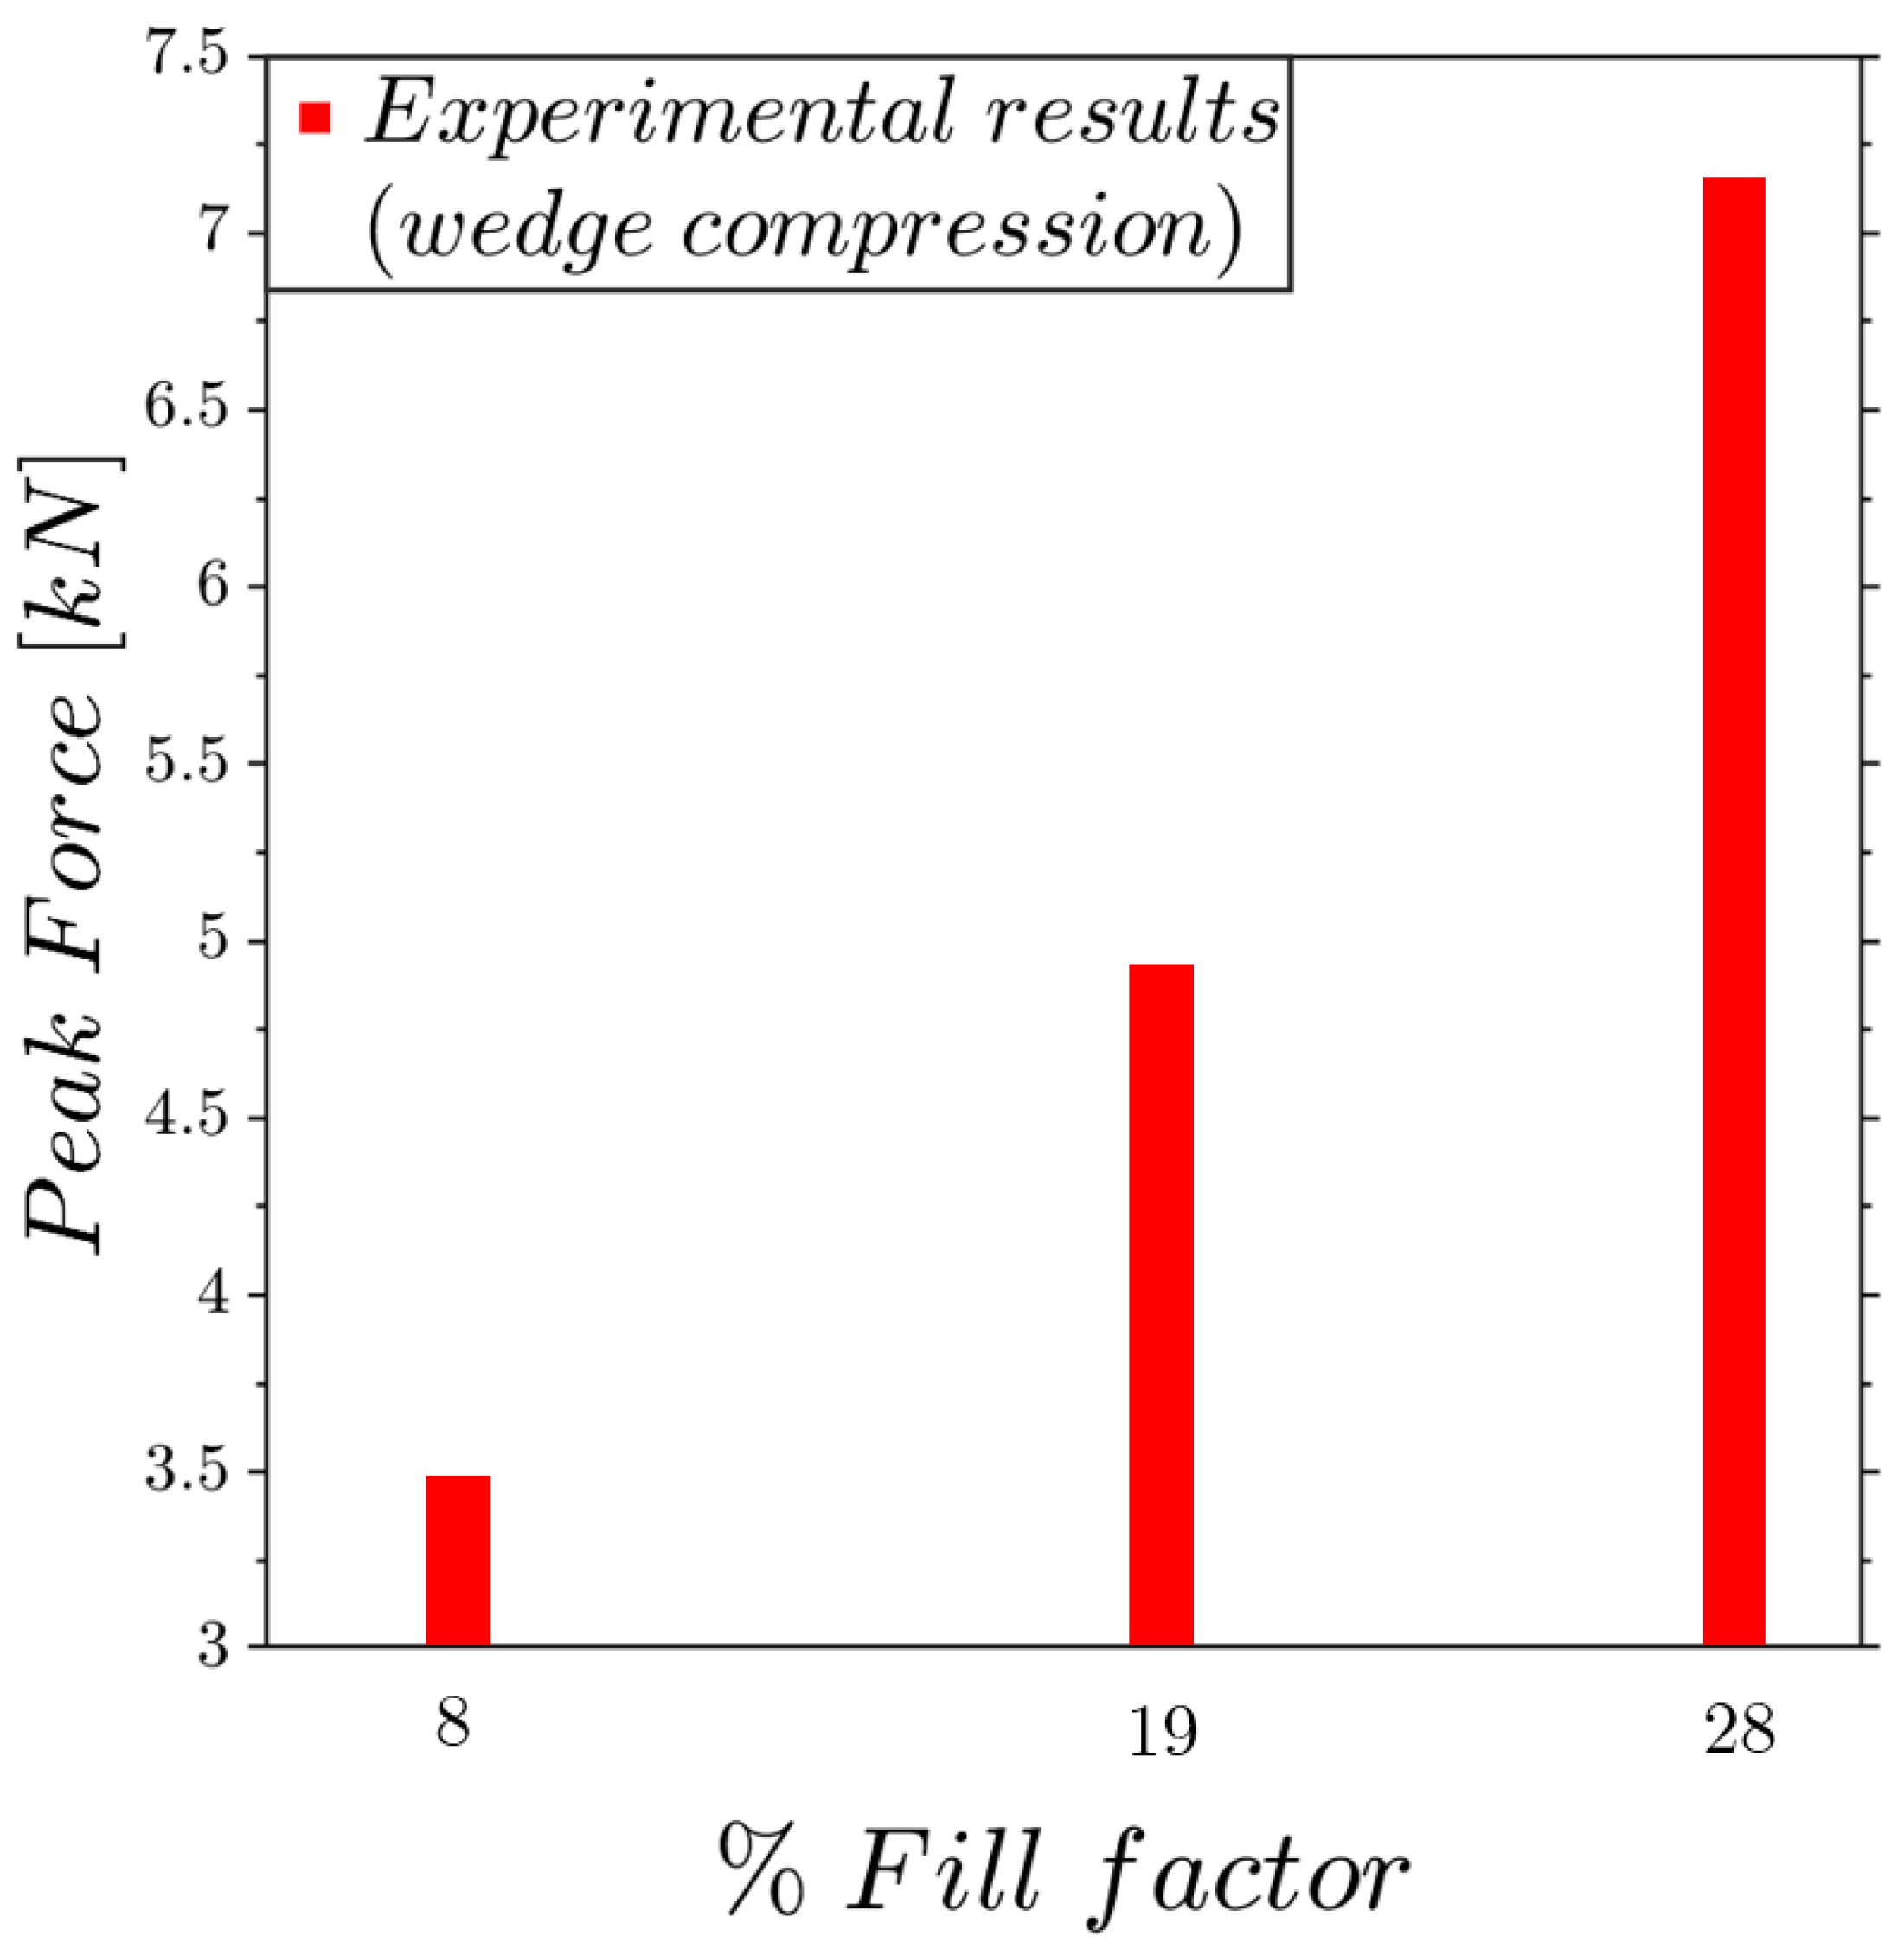
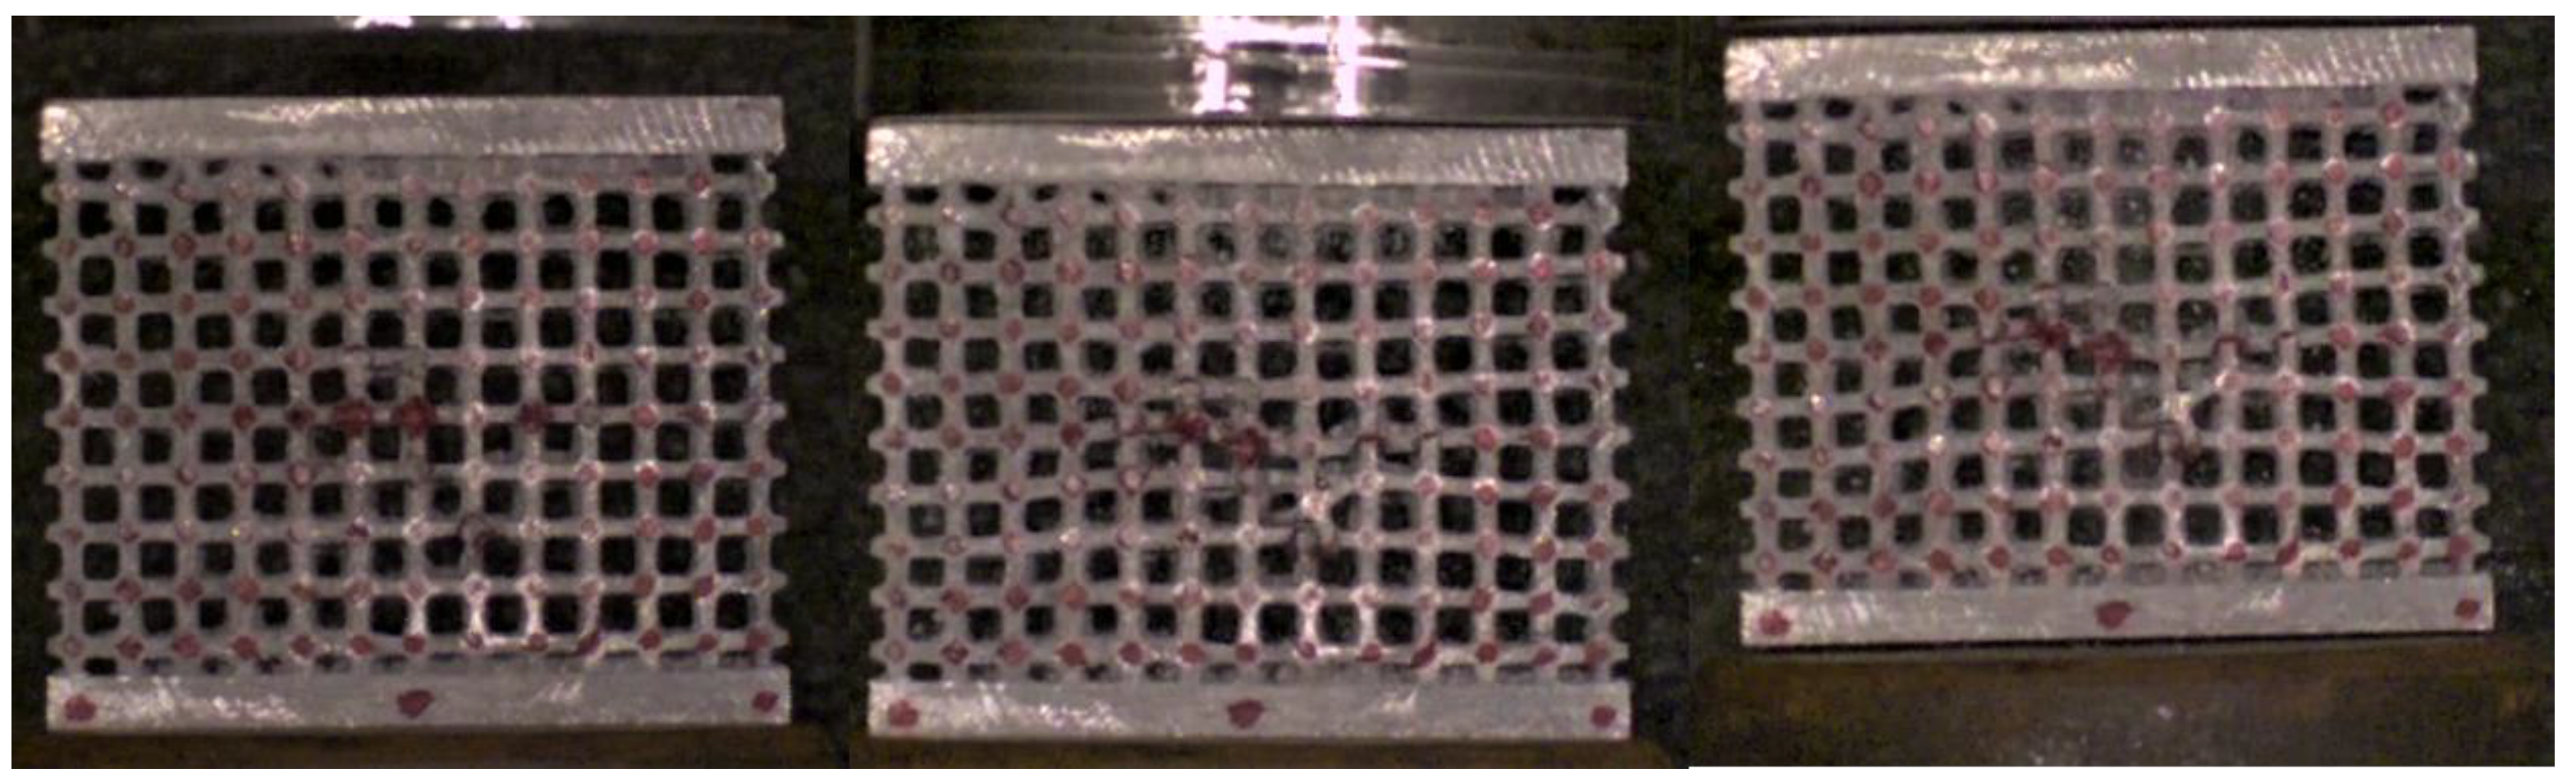
4.1. Flat and Wedge Static Compression Tests
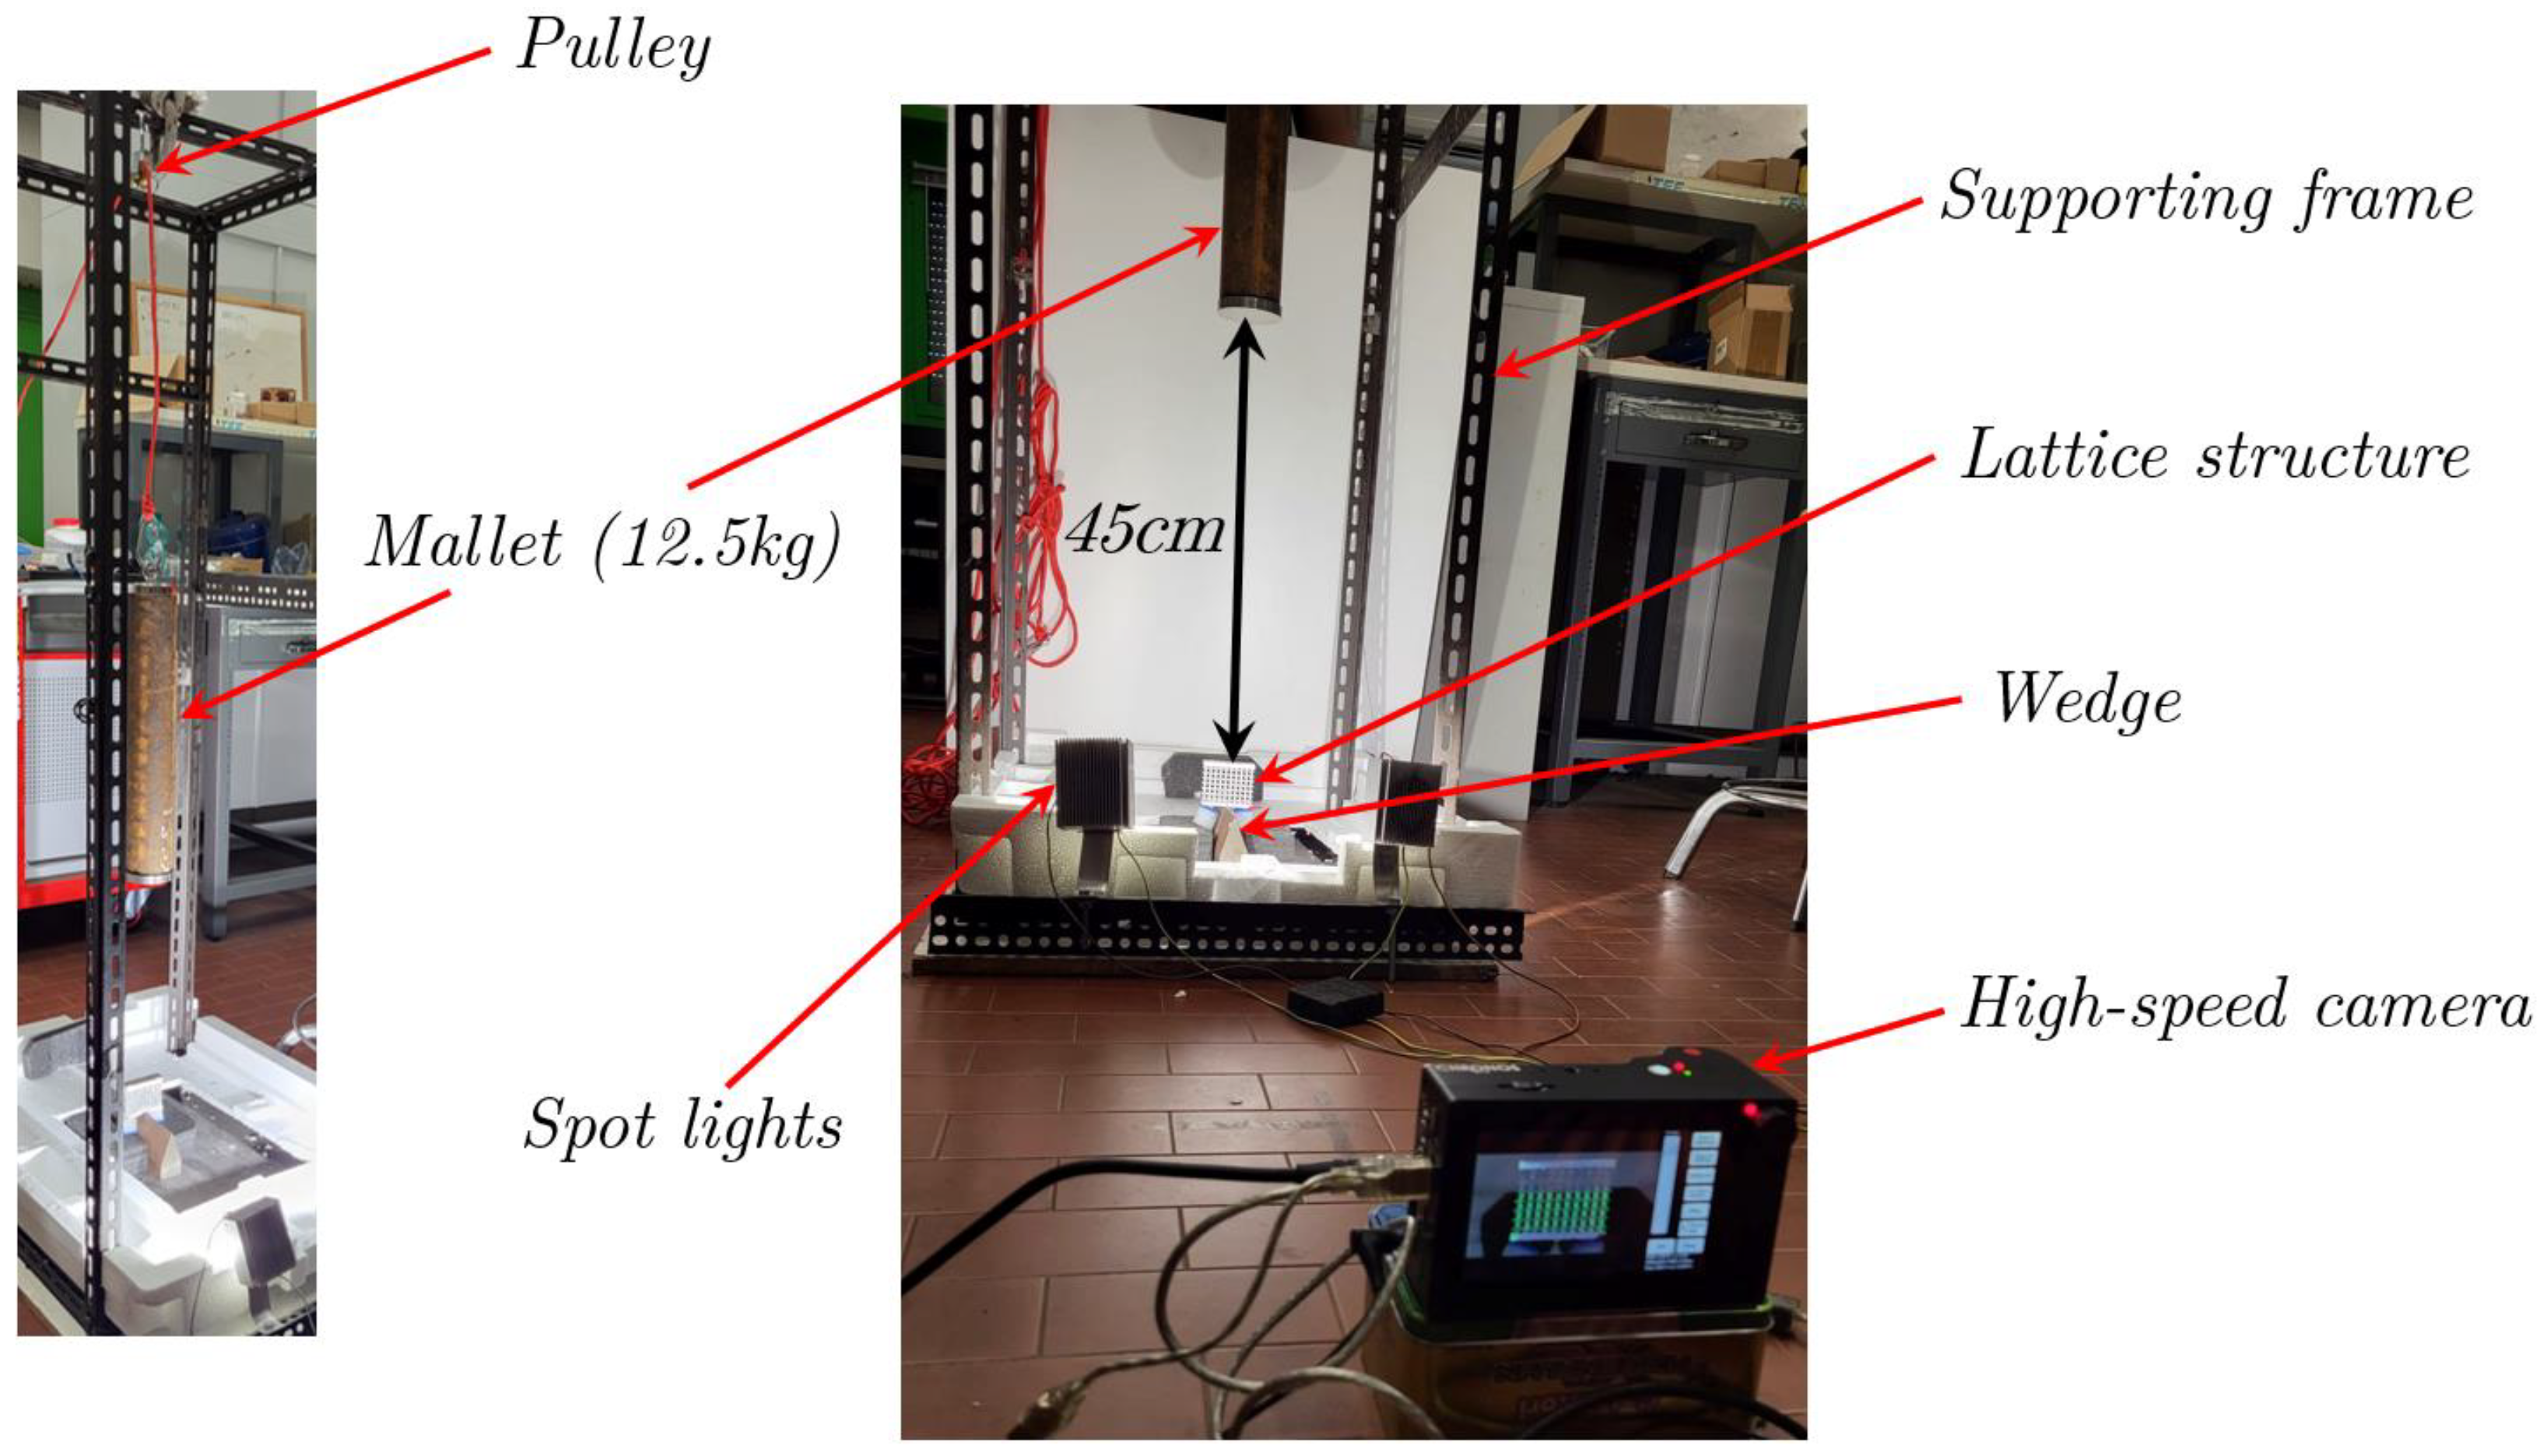
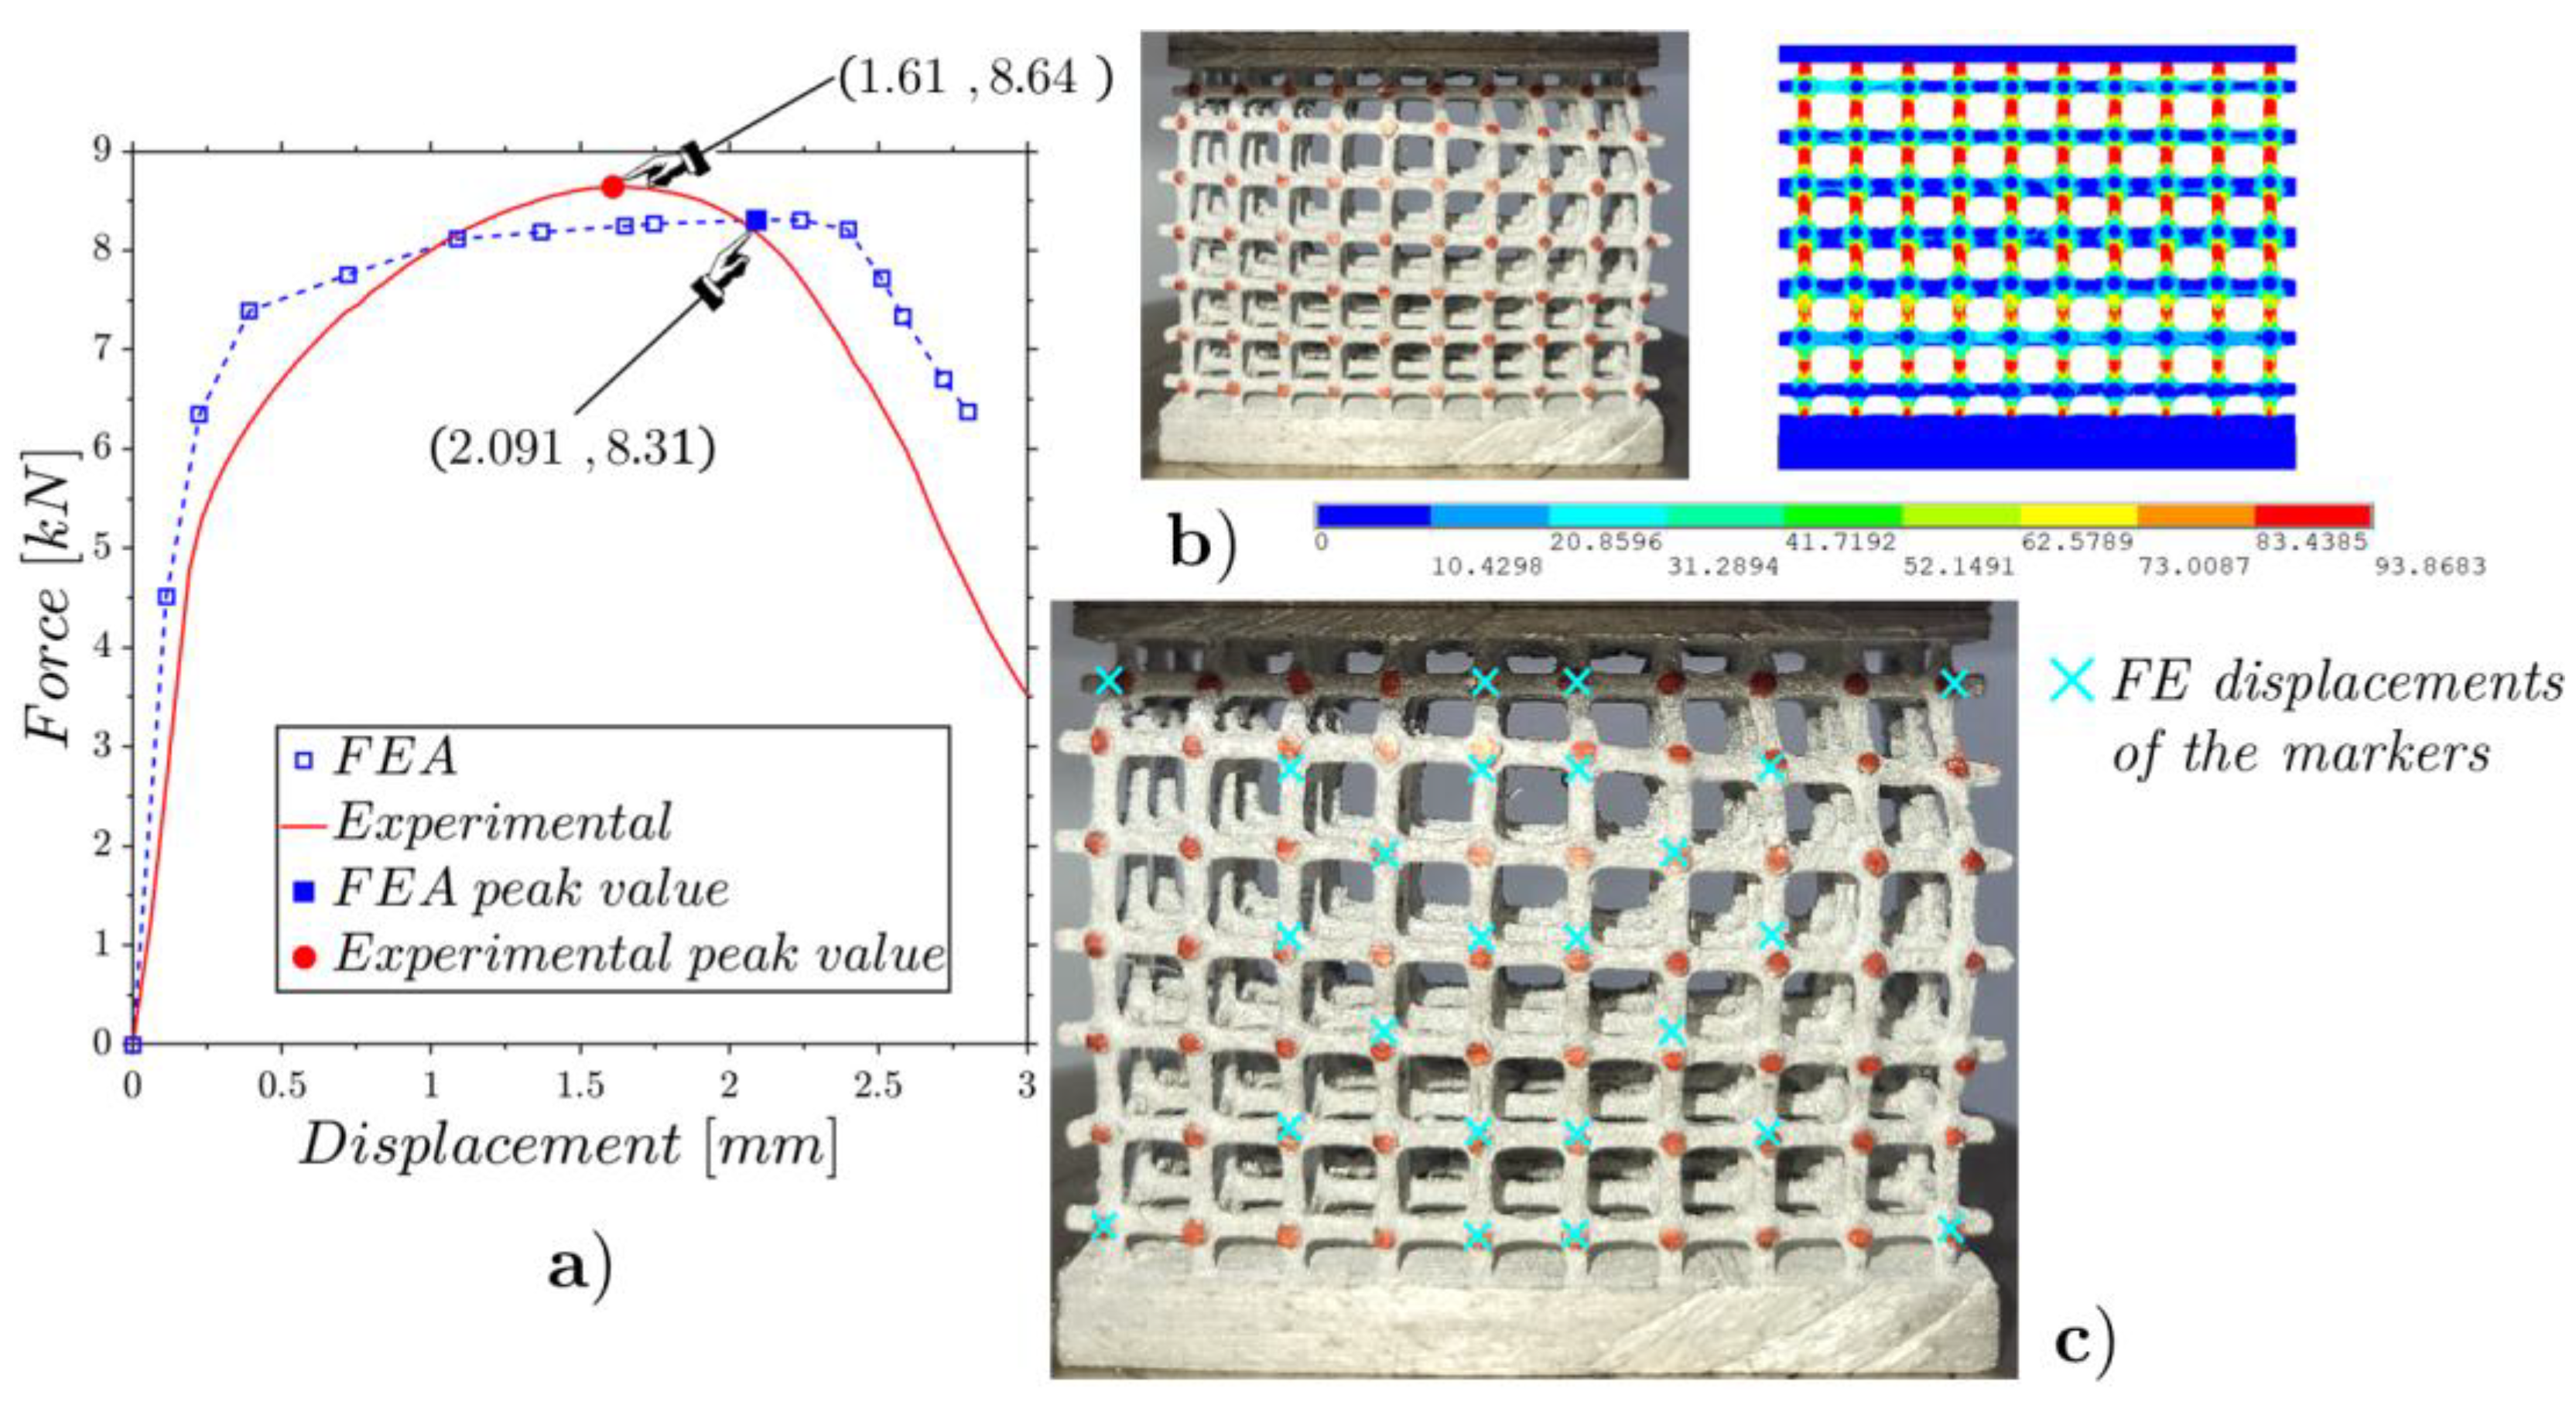
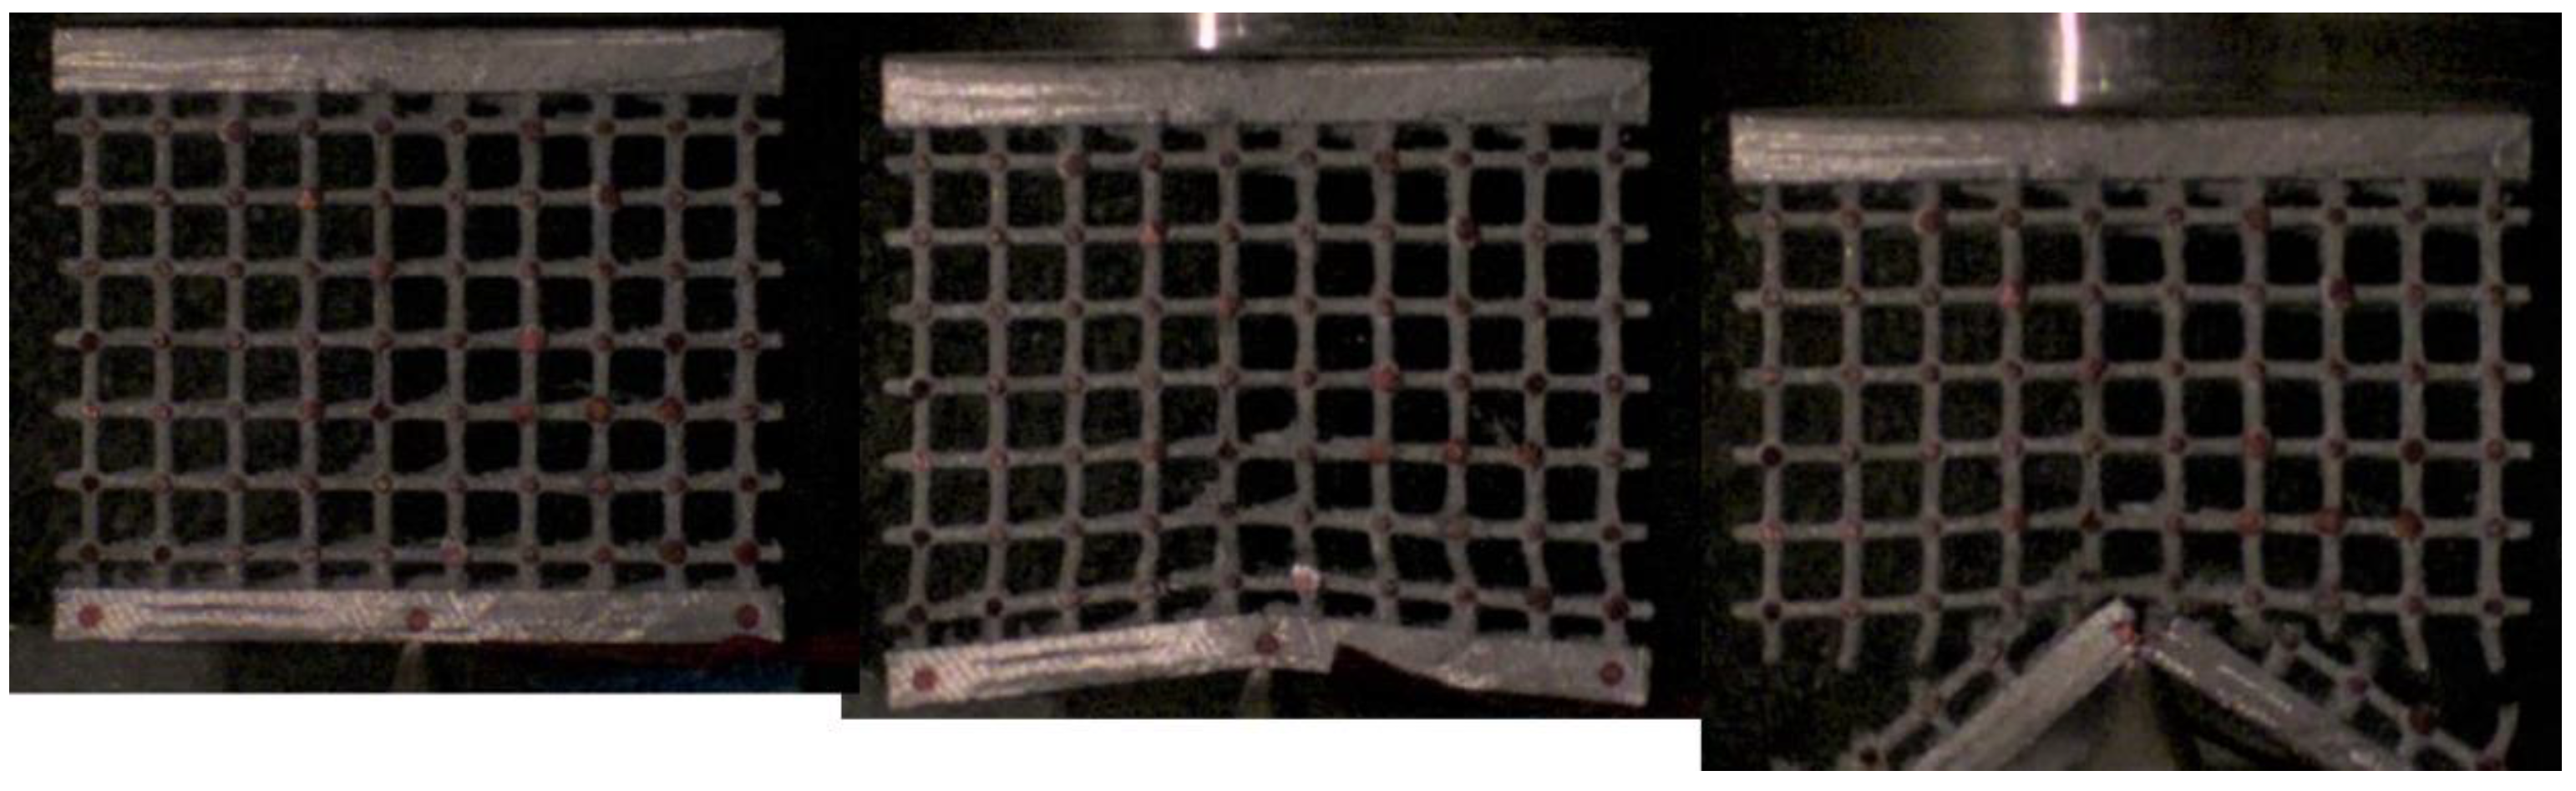
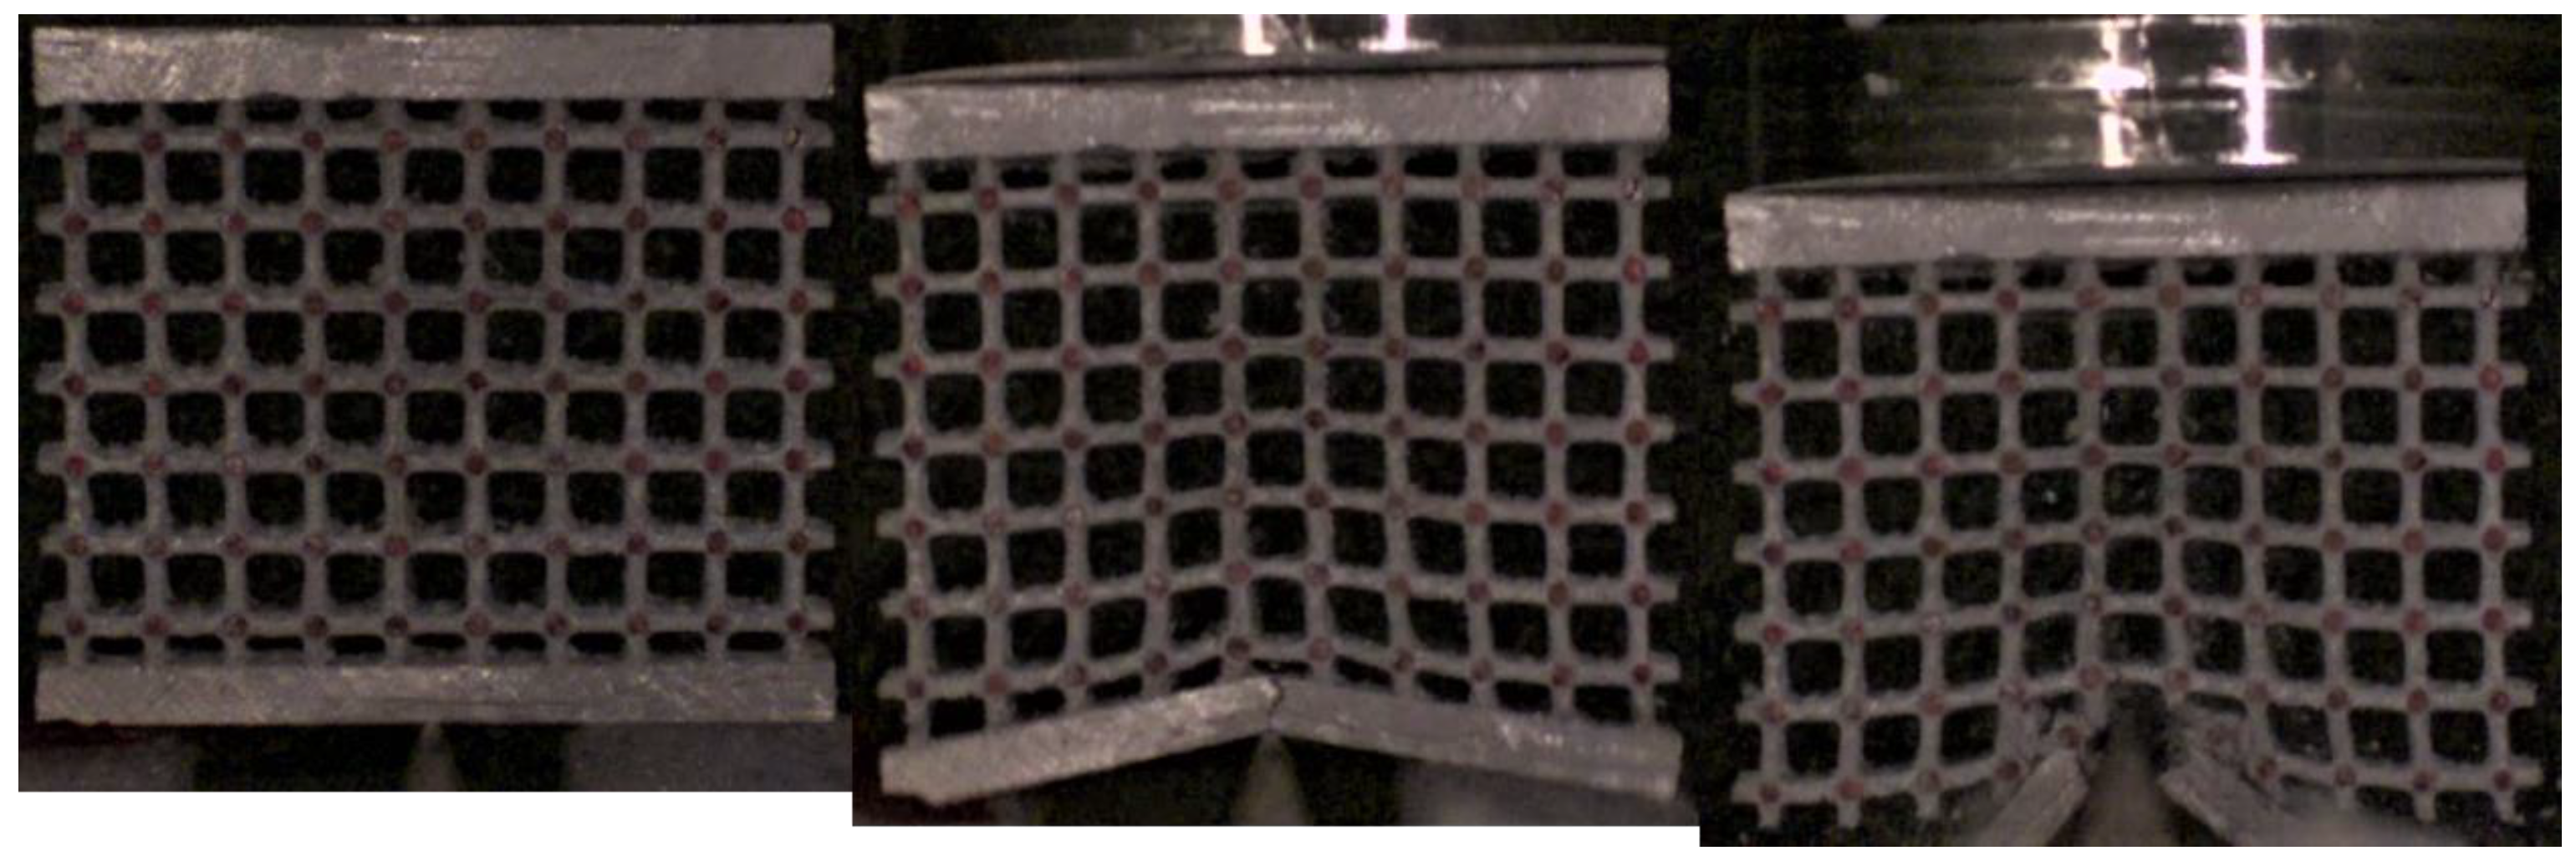
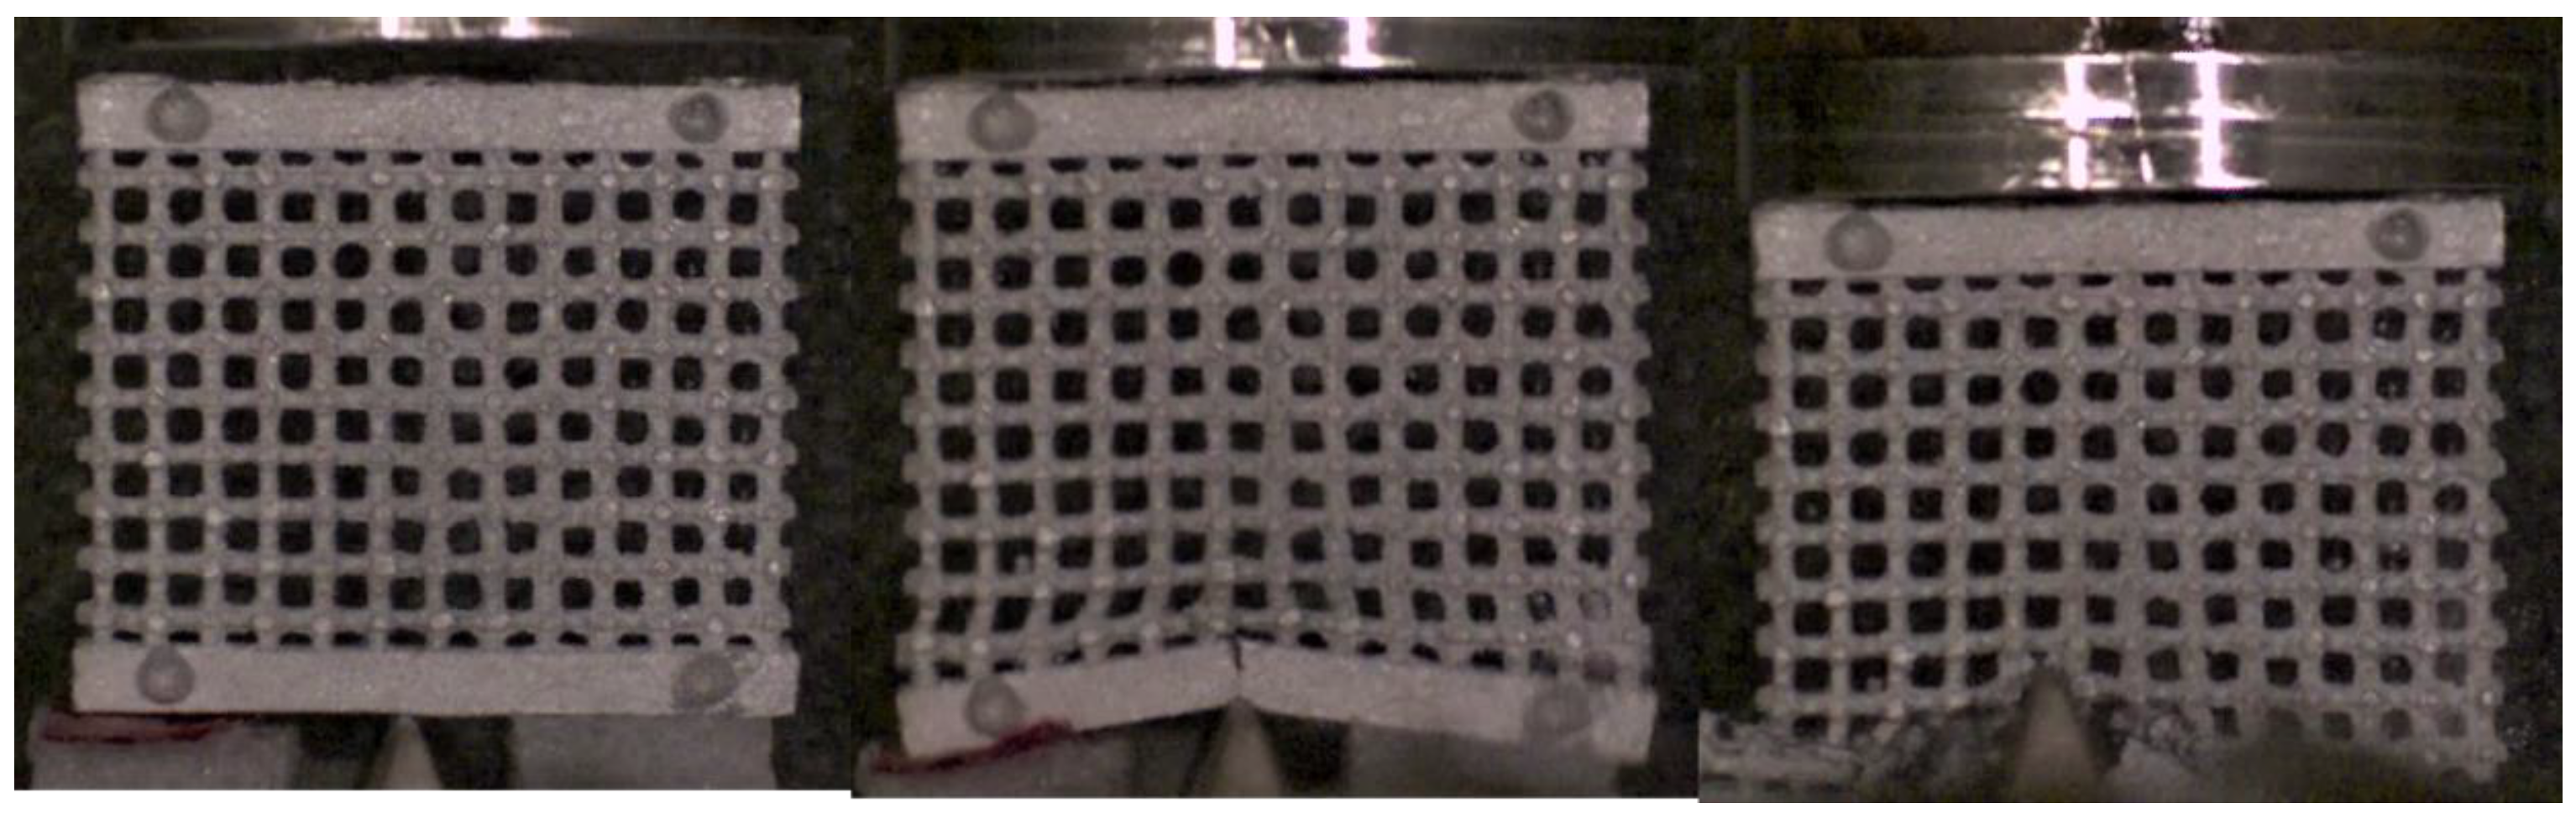
4.2. Flat and Wedge Dynamic Compression Tests
5. Conclusions
Author Contributions
Funding
Institutional Review Board Statement
Informed Consent Statement
Data Availability Statement
Conflicts of Interest
References
- Rashed, M.G.; Ashraf, M.; Mines, R.A.W.; Hazell, P.J. Microlattice metallic materials: A current state of the art on production, mechanical properties and applications. Mater. Des. 2016, 95, 518–533. [Google Scholar] [CrossRef]
- Gibson, L.J. Mechanical behavior of metallic foams. Ann. Rev. Mater. Soc. 2020, 30, 191–227. [Google Scholar] [CrossRef]
- Rui, D.; Wang, M.; Wang, D.; Zengrong, H.; Green, M.D.; Nian, Q. Understanding mechanical behavior of metallic foam with hollow struts using the hollow pentagonal dodecahedron model. Scr. Mater. 2020, 182, 114–119. [Google Scholar] [CrossRef]
- Deshpande, V.S.; Ashby, M.F.; Fleck, N.A. Foam topology, bending versus stretching dominated architectures. Acta Mater. 2001, 49, 1035–1040. [Google Scholar] [CrossRef]
- Li, W.; Atsushi, D.; Oh, Y.H.; Jirathearanat, S.; Wu, Z.A.; Chua, B.W. Influences of skin thickness, core topology, depth and direction on flexural deformation and ductile failure of Al honeycomb-based sandwich structures. Compos. Part B 2022, 239, 109957. [Google Scholar] [CrossRef]
- Wadley, H.N.G.; Fleck, N.A.; Evans, A.G. Fabrication and structural performance of periodic cellular metal sandwich structures. Compos. Sci. Technol. 2003, 63, 2331–2343. [Google Scholar] [CrossRef]
- Du Plessis, A.; Razavi, N.; Benedetti, M.; Murchio, S.; Leary, M.; Watson, M.; Bhate, D.; Berto, F. Properties and applications of additively manufactured metallic cellular materials: A review. Prog. Mater. Sci. 2022, 125, 100918. [Google Scholar] [CrossRef]
- Iyer, S.; Alkhader, M.; Venkatesh, T. On the relationships between cellular structure, deformation modes and electromechanical properties of piezoelectric cellular solids. Int. J. Solids Struct. 2016, 80, 73–83. [Google Scholar] [CrossRef]
- Papetti, V.; Dimopoulos Eggenschwiler, P.; Della Torre, A.; Montenegro, G.; Onorati, A.; Ortona, A.; Koltsakis, G. Instationary heat and mass transfer phenomena in additive manufactured open cell polyhedral structures for automotive catalysis. Chem. Eng. Sci. 2021, 234, 116448. [Google Scholar] [CrossRef]
- Zhao, N.; Parthasarathy, M.; Patil, S.; Coates, D.; Myers, K.; Zhu, H.; Li, W. Direct additive manufacturing of metal parts for automotive applications. J. Manuf. Syst. 2023, 68, 368–375. [Google Scholar] [CrossRef]
- Vasco, J.C. Additive manufacturing for the automotive industry. In Additive Manufacturing; Elsevier: Amsterdam, The Netherlands, 2021; pp. 505–530. [Google Scholar] [CrossRef]
- Thelen, S.; Barthelat, F.; Brinson, L.C. Mechanics considerations for microporous titanium as an orthopaedic implant material. J. Biomed. Mater. Res. Part A 2004, 69, 601–610. [Google Scholar] [CrossRef] [PubMed]
- Challis, V.J.; Roberts, A.P.; Grotowski, J.F.; Zhang, L.C.; Sercombe, T.B. Prototypes for Bone Implant Scaffolds Designed via Topology Optimization and Manufactured by Solid Freeform Fabrication. Adv. Eng. Mater. 2010, 12–11, 1106–1110. [Google Scholar] [CrossRef]
- Tao, W.; Leu, M.C. Design of lattice structure for additive manufacturing. In Proceedings of the 2016 International Symposium on Flexible Automation, Cleveland, OH, USA, 1–3 August 2016. [Google Scholar] [CrossRef]
- Der, A.; Gabrisch, C.; Kaluza, A.; Cerdas, F.; Thiede, S.; Herrmann, C. Integrating environmental impact targets in early phases of production planning for lightweight structures. Procedia CIRP 2019, 80, 168–173. [Google Scholar] [CrossRef]
- Zhu, F.; Lu, G.; Whang, Z. Plastic Deformation, Failure and Energy Absorption of Sandwich Structures with Metallic Cellular Cores. Int. J. Prot. Struct. 2010, 1, 507–541. [Google Scholar] [CrossRef]
- Chen, C.; Lu, T.J.; Fleck, N.A. Effect of imperfections on the yielding of two-dimensional foams. J. Mech. Phys. Solids 1999, 47, 2235–2272. [Google Scholar] [CrossRef]
- Shanmugam, V.; Das, O.; Babu, K.; Marimuthu, U.; Veerasimman, A.; Joel Johnson, D.; Esmaeely Neisiany, R.; Hedenqvist, M.S.; Ramakrishna, S.; Berto, F. Fatigue behaviour of FDM-3D printed polymers, polymeric composites and architected cellular materials. Int. J. Fatigue 2021, 143, 106007. [Google Scholar] [CrossRef]
- Xie, C.; Wang, D.; Zong, L.; Kong, D. Crashworthiness analysis and multi-objective optimization of spatial lattice structure under dynamic compression. Int. J. Impact Eng. 2023, 180, 104713. [Google Scholar] [CrossRef]
- Evans, A.G. Lightweight Materials and Structures. MRS Bull. 2001, 26, 790–797. [Google Scholar] [CrossRef]
- Xu, F.; Yu, K.; Hua, L. In-plane dynamic response and multi-objective optimization of negative Poisson’s ratio (NPR) honeycomb structures with sinusoidal curve. Compos. Struct. 2021, 269, 114018. [Google Scholar] [CrossRef]
- Mori, L.F.; Lee, S.; Xue, Z.Y.; Vaziri, A.; Queheillalt, D.T.; Dharmasena, K.P.; Wadley, H.N.G.; Hutchinson, J.W.; Espinosa, H.D. Deformation and fracture modes of sandwich structures subjected to underwater impulsive loads. J. Mech. Mater. Struct. 2007, 2, 1981–2006. [Google Scholar] [CrossRef]
- Tancogne-Dejean, T.; Spierings, A.B.; Mohr, D. Additively-manufactured metallic micro-lattice materials for high specific energy absorption under static and dynamic loading. Acta Mater. 2016, 116, 14–28. [Google Scholar] [CrossRef]
- Saadlaoui, Y.; Milan, J.L.; Rossi, J.M.; Chabrand, P. Topology optimization and additive manufacturing: Comparison of conception methods using industrial codes. J. Manuf. Syst. 2017, 43, 178–186. [Google Scholar] [CrossRef]
- Lian, Y.; Chen, J.; Li, M.J.; Gao, R. A multi-physics material point method for thermo-fluid-solid coupling problems in metal additive manufacturing processes. Comput. Methods Appl. Mech. Eng. 2023, 416, 116297. [Google Scholar] [CrossRef]
- Wang, X.; Ji, Z.; Ritchie, R.O.; Okulov, I.; Eckert, J.; Qiu, C. Solving the problem of solidification cracking during additive manufacturing of CrMnFeCoNi high-entropy alloys through addition of Cr3C2 particles to enhance microstructure and properties. Mater. Today Adv. 2023, 18, 100371. [Google Scholar] [CrossRef]
- Liu, B.; Feng, J.; Lin, Z.; Wu, S.; He, Y.; Fu, J. Spherical path planning for multi axis support free additive manufacturing of truss structures. J. Manuf. Process. 2024, 109, 198–212. [Google Scholar] [CrossRef]
- Pan, C.; Han, Y.; Lu, J. Design and Optimization of Lattice Structures: A Review. Appl. Sci. 2020, 10, 6374. [Google Scholar] [CrossRef]
- Pei, E.; Kabir, I.; Breški, T.; Godec, D.; Nordin, A. A review of geometric dimensioning and tolerancing (GD&T) of additive manufacturing and powder bed fusion lattices. Prog. Addit. Manuf. 2022, 7, 1297–1305. [Google Scholar] [CrossRef]
- Deshpande, V.S.; Fleck, N.A.; Ashby, M.F. Effective properties of the octet-truss lattice material. J. Mech. Phys. Solids 2001, 49, 1747–1769. [Google Scholar] [CrossRef]
- Wu, Y.; Fang, J.; Wu, C.; Li, C.; Sun, G.; Li, Q. Additively manufactured materials and structures: A state-of-the-art review on their mechanical characteristics and energy absorption. Int. J. Mech. Sci. 2023, 246, 108102. [Google Scholar] [CrossRef]
- Zhao, M.; Li, X.; Zhang, D.Z.; Zhai, W. Design, mechanical properties and optimization of lattice structures with hollow prismatic struts. Int. J. Mech. Sci. 2023, 238, 107842. [Google Scholar] [CrossRef]
- Karthic, R.D.; Joy, J.; Sakthivel, G.; Nadimpalli, R. Mechanical characterization of 3D-printed Kelvin cell with varying infill densities. Mater. Today Proc. 2023, 84, 41–46. [Google Scholar] [CrossRef]
- Seetoh, I.; Markandan, K.; Lai, C.Q. Effect of reinforcement bending on the elastic properties of interpenetrating phase composites. Mech. Mater. 2019, 136, 103071. [Google Scholar] [CrossRef]
- Dallago, M.; Raghavendra, S.; Luchin, V.; Zappini, G.; Pasini, D.; Benedetti, M. The role of node fillet, unit-cell size and strut orientation on the fatigue strength of Ti-6Al-4V lattice materials additively manufactured via laser powder bed fusion. Int. J. Fatigue 2021, 142, 105946. [Google Scholar] [CrossRef]
- Nazir, A.; Arshad, A.B.; Hsu, C.P.; Jeng, J.Y. Effect of Fillets on Mechanical Properties of Lattice Structures Fabricated Using Multi-Jet Fusion Technology. Materials 2021, 14, 2194. [Google Scholar] [CrossRef] [PubMed]
- Latture, R.M.; Rodriguez, R.X.; Holmes, L.R.; Zok, F.W. Effects of nodal fillets and external boundaries on compressive response of an octet truss. Acta Mater. 2018, 149, 78–87. [Google Scholar] [CrossRef]
- Schoen, H. Infinite Periodic Minimal Surfaces without Self-Intersections; NASA Technical Report No. D-55411970; National Aeronautics and Space Administration: Washington, DC, USA, 1970. [Google Scholar]
- Kapfer, S.C.; Hyde, S.T.; Mecke, K.; Arns, C.H.; Schröder-Turk, G.E. Minimal surface scaffold designs for tissue engineering. Biomaterials 2011, 32, 6875–6882. [Google Scholar] [CrossRef] [PubMed]
- Maskery, I.; Aremu, A.O.; Parry, L.; Wildman, R.D.; Tuck, C.J.; Ashcroft, I.A. Effective design and simulation of surface-based lattice structures featuring volume fraction and cell type grading. Mater. Des. 2018, 155, 220–232. [Google Scholar] [CrossRef]
- Yan, C.; Hao, L.; Hussein, A.; Bubb, S.L.; Young, P.; Raymont, D. Evaluation of light-weight AlSi10Mg periodic cellular lattice structures fabricated via direct metal laser sintering. J. Am. Acad. Dermatol. 2014, 214, 856–864. [Google Scholar] [CrossRef]
- Abueidda, D.W.; Abu Al-Rub, R.; Dalaq, A.S.; Lee, D.W.; Khan, K.A.; Jasiuk, I. Effective conductivities and elastic moduli of novel foams with triply periodic minimal surfaces. Mech. Mater. 2016, 95, 102. [Google Scholar] [CrossRef]
- Al-Ketan, O.; Rowshan, R.; Abu Al-Rub, R.K. Topology-mechanical property relationship of 3D printed strut, skeletal, and sheet based periodic metallic cellular materials. Addit. Manuf. 2018, 19, 167–183. [Google Scholar] [CrossRef]
- Feng, J.; Fu, J.; Yao, X.; He, Y. Triply periodic minimal surface (TPMS) porous structures: From multi-scale design, precise additive manufacturing to multidisciplinary applications. Int. J. Extreme Manuf. 2022, 4, 022001. [Google Scholar] [CrossRef]
- Lu, C.; Hsieh, M.; Huang, Z.; Zhang, C.; Lin, Y.; Shen, Q.; Chen, F.; Zhang, L. Architectural Design and Additive Manufacturing of Mechanical Metamaterials: A Review. Engineering 2022, 17, 44–63. [Google Scholar] [CrossRef]
- Pini, V.; Ruz, J.J.; Kosaka, P.M.; Malvar, O.; Calleja, M.; Tamayo, J. How two-dimensional bending can extraordinarily stiffen thin sheets. Sci. Rep. 2016, 6, 29627. [Google Scholar] [CrossRef]
- Gandy, P.J.F.; Bardhan, S.; Mackay, A.L.; Klinowski, J. Nodal surface approximations to the and I-WP triply periodic minimal surfaces. Chem. Phys. Lett. 2001, 336, 187–195. [Google Scholar] [CrossRef]
- Lord, E.A.; Mackay, A.L. Periodic minimal surfaces of cubic symmetry. Curr. Sci. 2003, 85, 346–362. [Google Scholar]
- Al-Ketan, O.; Abu Al-Rub, R.K. Multifunctional Mechanical Metamaterials Based on Triply Periodic Minimal Surface Lattices. Adv. Eng. Mater. 2019, 21, 1900524. [Google Scholar] [CrossRef]
- Panesar, A.; Abdi, M.; Hickman, D.; Ashcroft, I. Strategies for functionally graded lattice structures derived using topology optimisation for Additive Manufacturing. Addit. Manuf. 2018, 19, 81–94. [Google Scholar] [CrossRef]
- Costanza, G.; Tata, M.E.; Trillicoso, G. Al foams manufactured by PLA replication and sacrifice. Int. J. Light. Mater. Manuf. 2021, 4, 62–66. [Google Scholar] [CrossRef]
- Nowotnik, G.M.; Sieniawski, J. Influence of heat treatment on the microstructure and mechanical properties of 6005 and 6082 aluminium alloys. J. Mater. Process. Technol. 2005, 162–163, 367–372. [Google Scholar] [CrossRef]
- Salvini, P.; Lux, V.; Marotta, E. Modal Pursuit to Detect Large Displacements and Strain Fields by Digital Image Correlation. Strain 2015, 51, 30–42. [Google Scholar] [CrossRef]


Disclaimer/Publisher’s Note: The statements, opinions and data contained in all publications are solely those of the individual author(s) and contributor(s) and not of MDPI and/or the editor(s). MDPI and/or the editor(s) disclaim responsibility for any injury to people or property resulting from any ideas, methods, instructions or products referred to in the content. |
© 2024 by the authors. Licensee MDPI, Basel, Switzerland. This article is an open access article distributed under the terms and conditions of the Creative Commons Attribution (CC BY) license (https://creativecommons.org/licenses/by/4.0/).
Share and Cite
Iandiorio, C.; Mattei, G.; Marotta, E.; Costanza, G.; Tata, M.E.; Salvini, P. The Beneficial Effect of a TPMS-Based Fillet Shape on the Mechanical Strength of Metal Cubic Lattice Structures. Materials 2024, 17, 1553. https://doi.org/10.3390/ma17071553
Iandiorio C, Mattei G, Marotta E, Costanza G, Tata ME, Salvini P. The Beneficial Effect of a TPMS-Based Fillet Shape on the Mechanical Strength of Metal Cubic Lattice Structures. Materials. 2024; 17(7):1553. https://doi.org/10.3390/ma17071553
Chicago/Turabian StyleIandiorio, Christian, Gianmarco Mattei, Emanuele Marotta, Girolamo Costanza, Maria Elisa Tata, and Pietro Salvini. 2024. "The Beneficial Effect of a TPMS-Based Fillet Shape on the Mechanical Strength of Metal Cubic Lattice Structures" Materials 17, no. 7: 1553. https://doi.org/10.3390/ma17071553
APA StyleIandiorio, C., Mattei, G., Marotta, E., Costanza, G., Tata, M. E., & Salvini, P. (2024). The Beneficial Effect of a TPMS-Based Fillet Shape on the Mechanical Strength of Metal Cubic Lattice Structures. Materials, 17(7), 1553. https://doi.org/10.3390/ma17071553