
Operating Properties of Deep Hole Boring Tools with Modified Design


Abstract
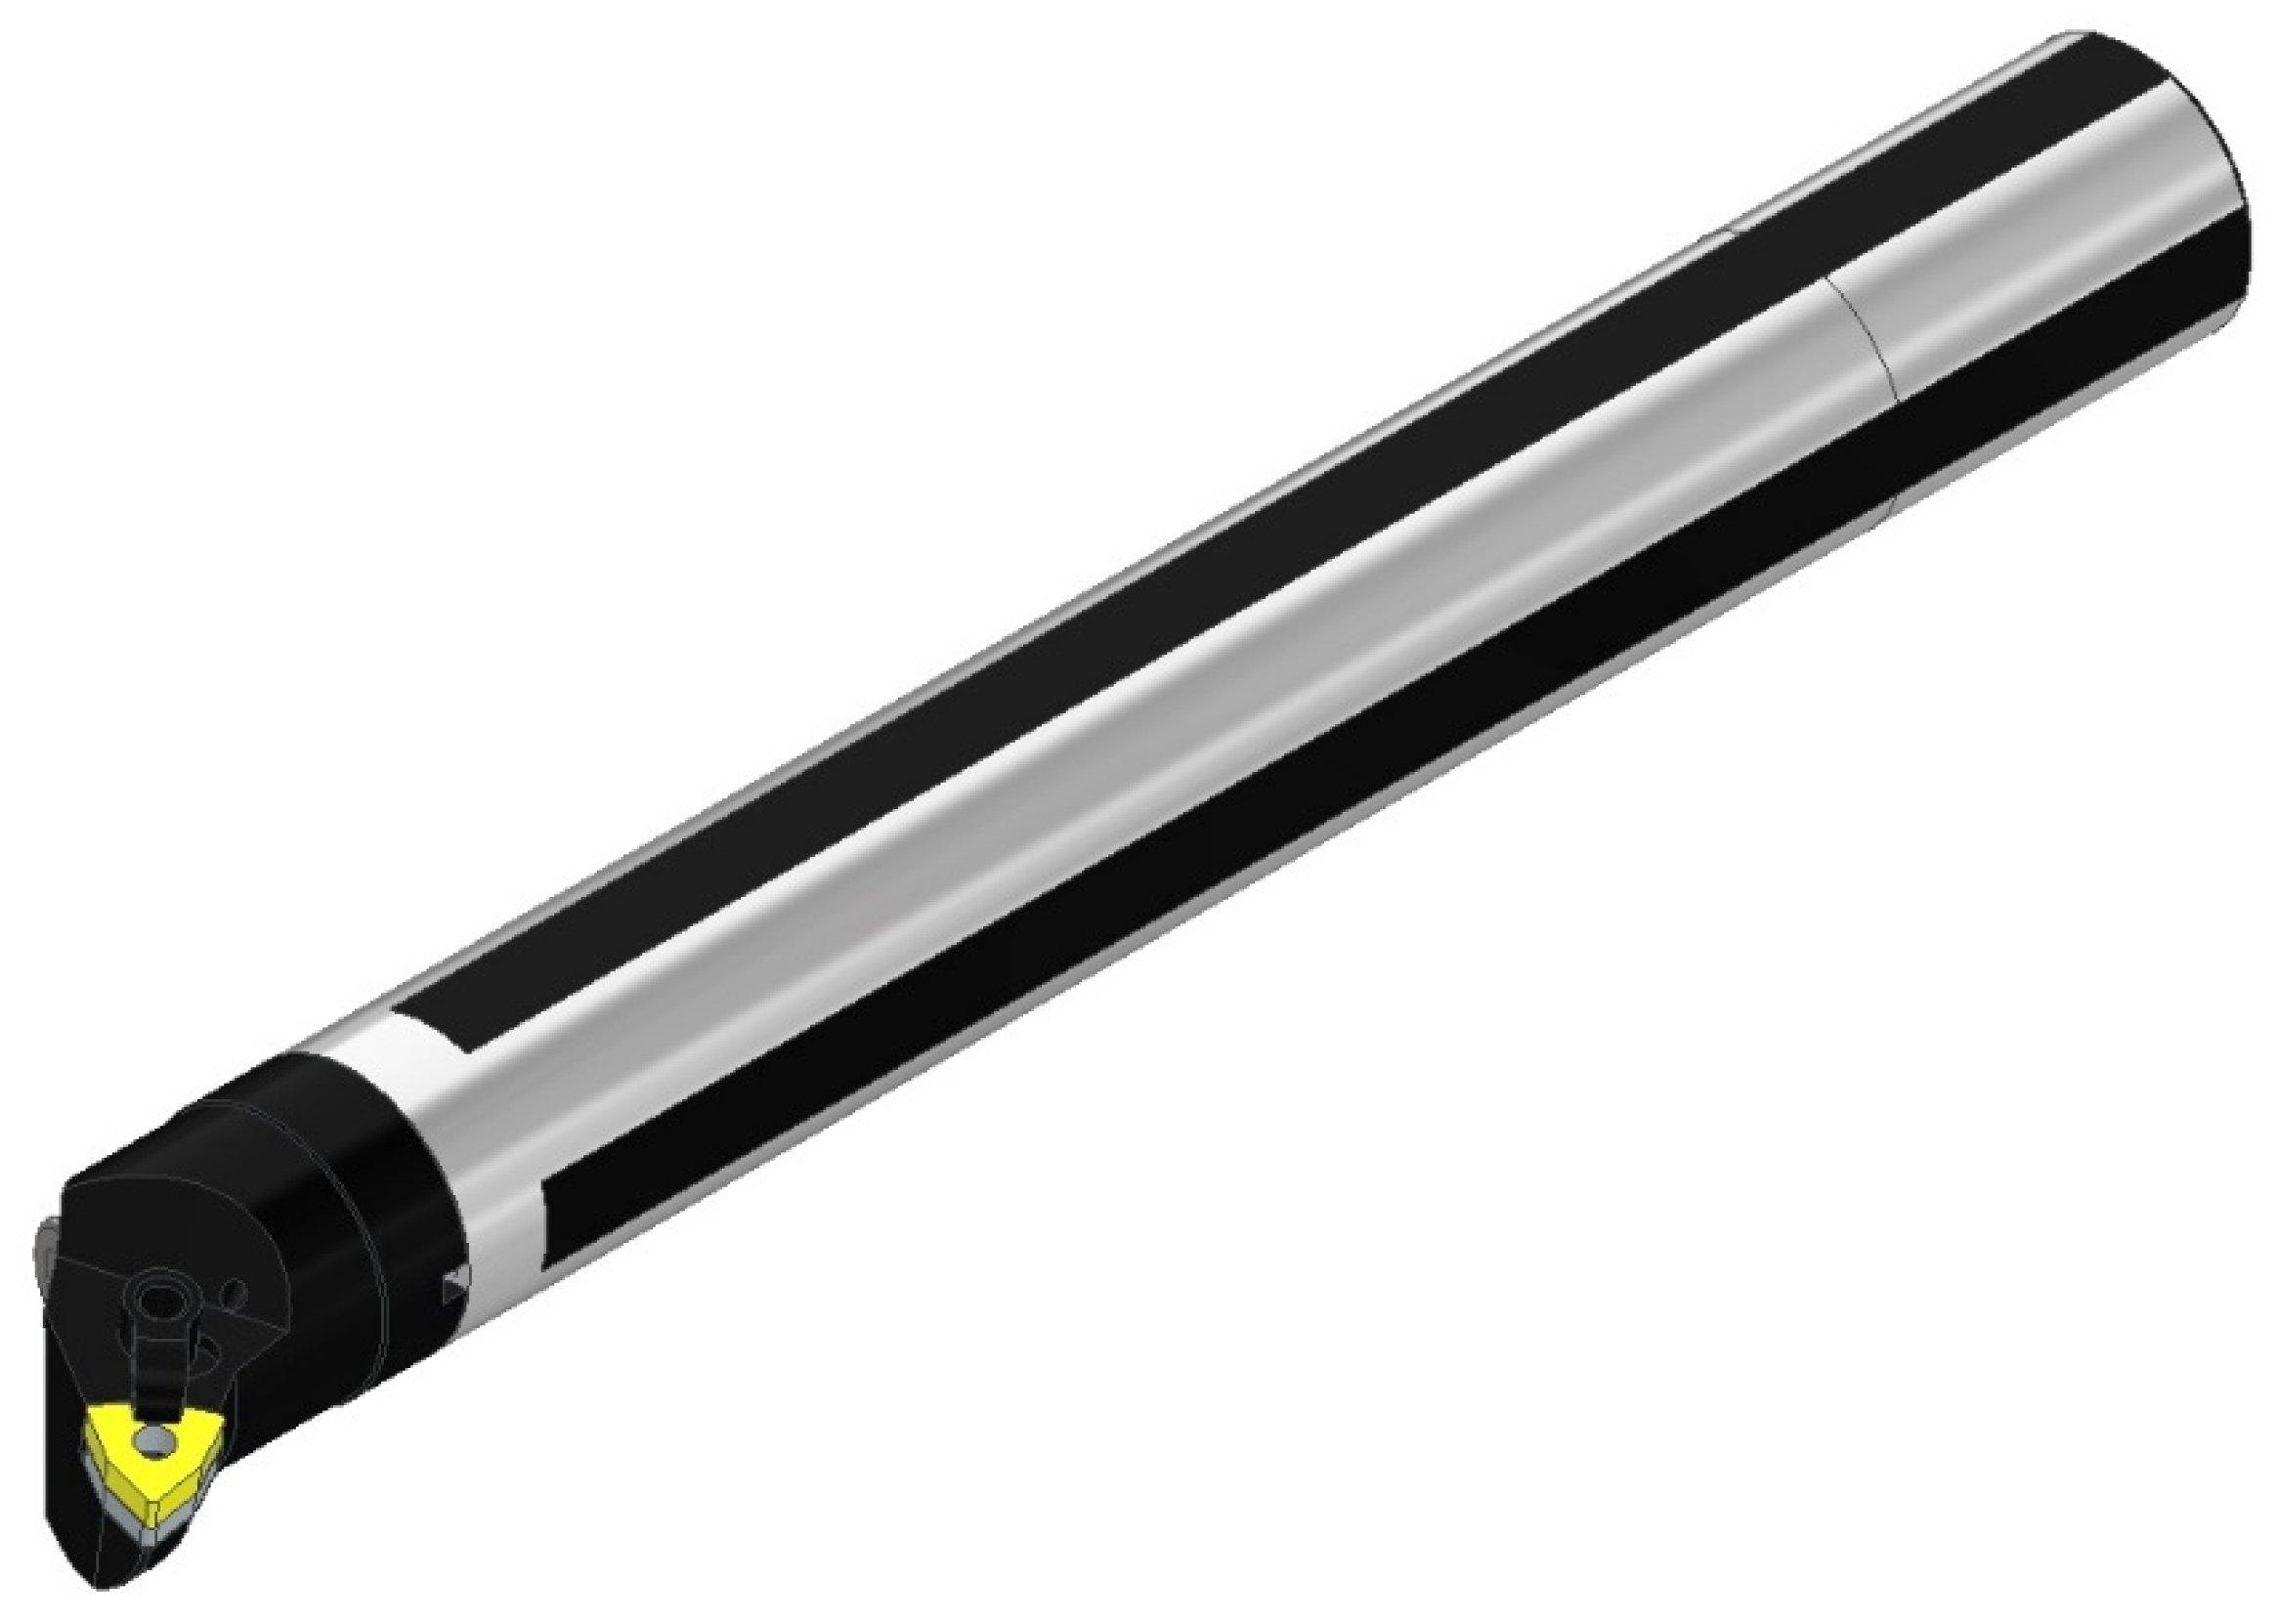
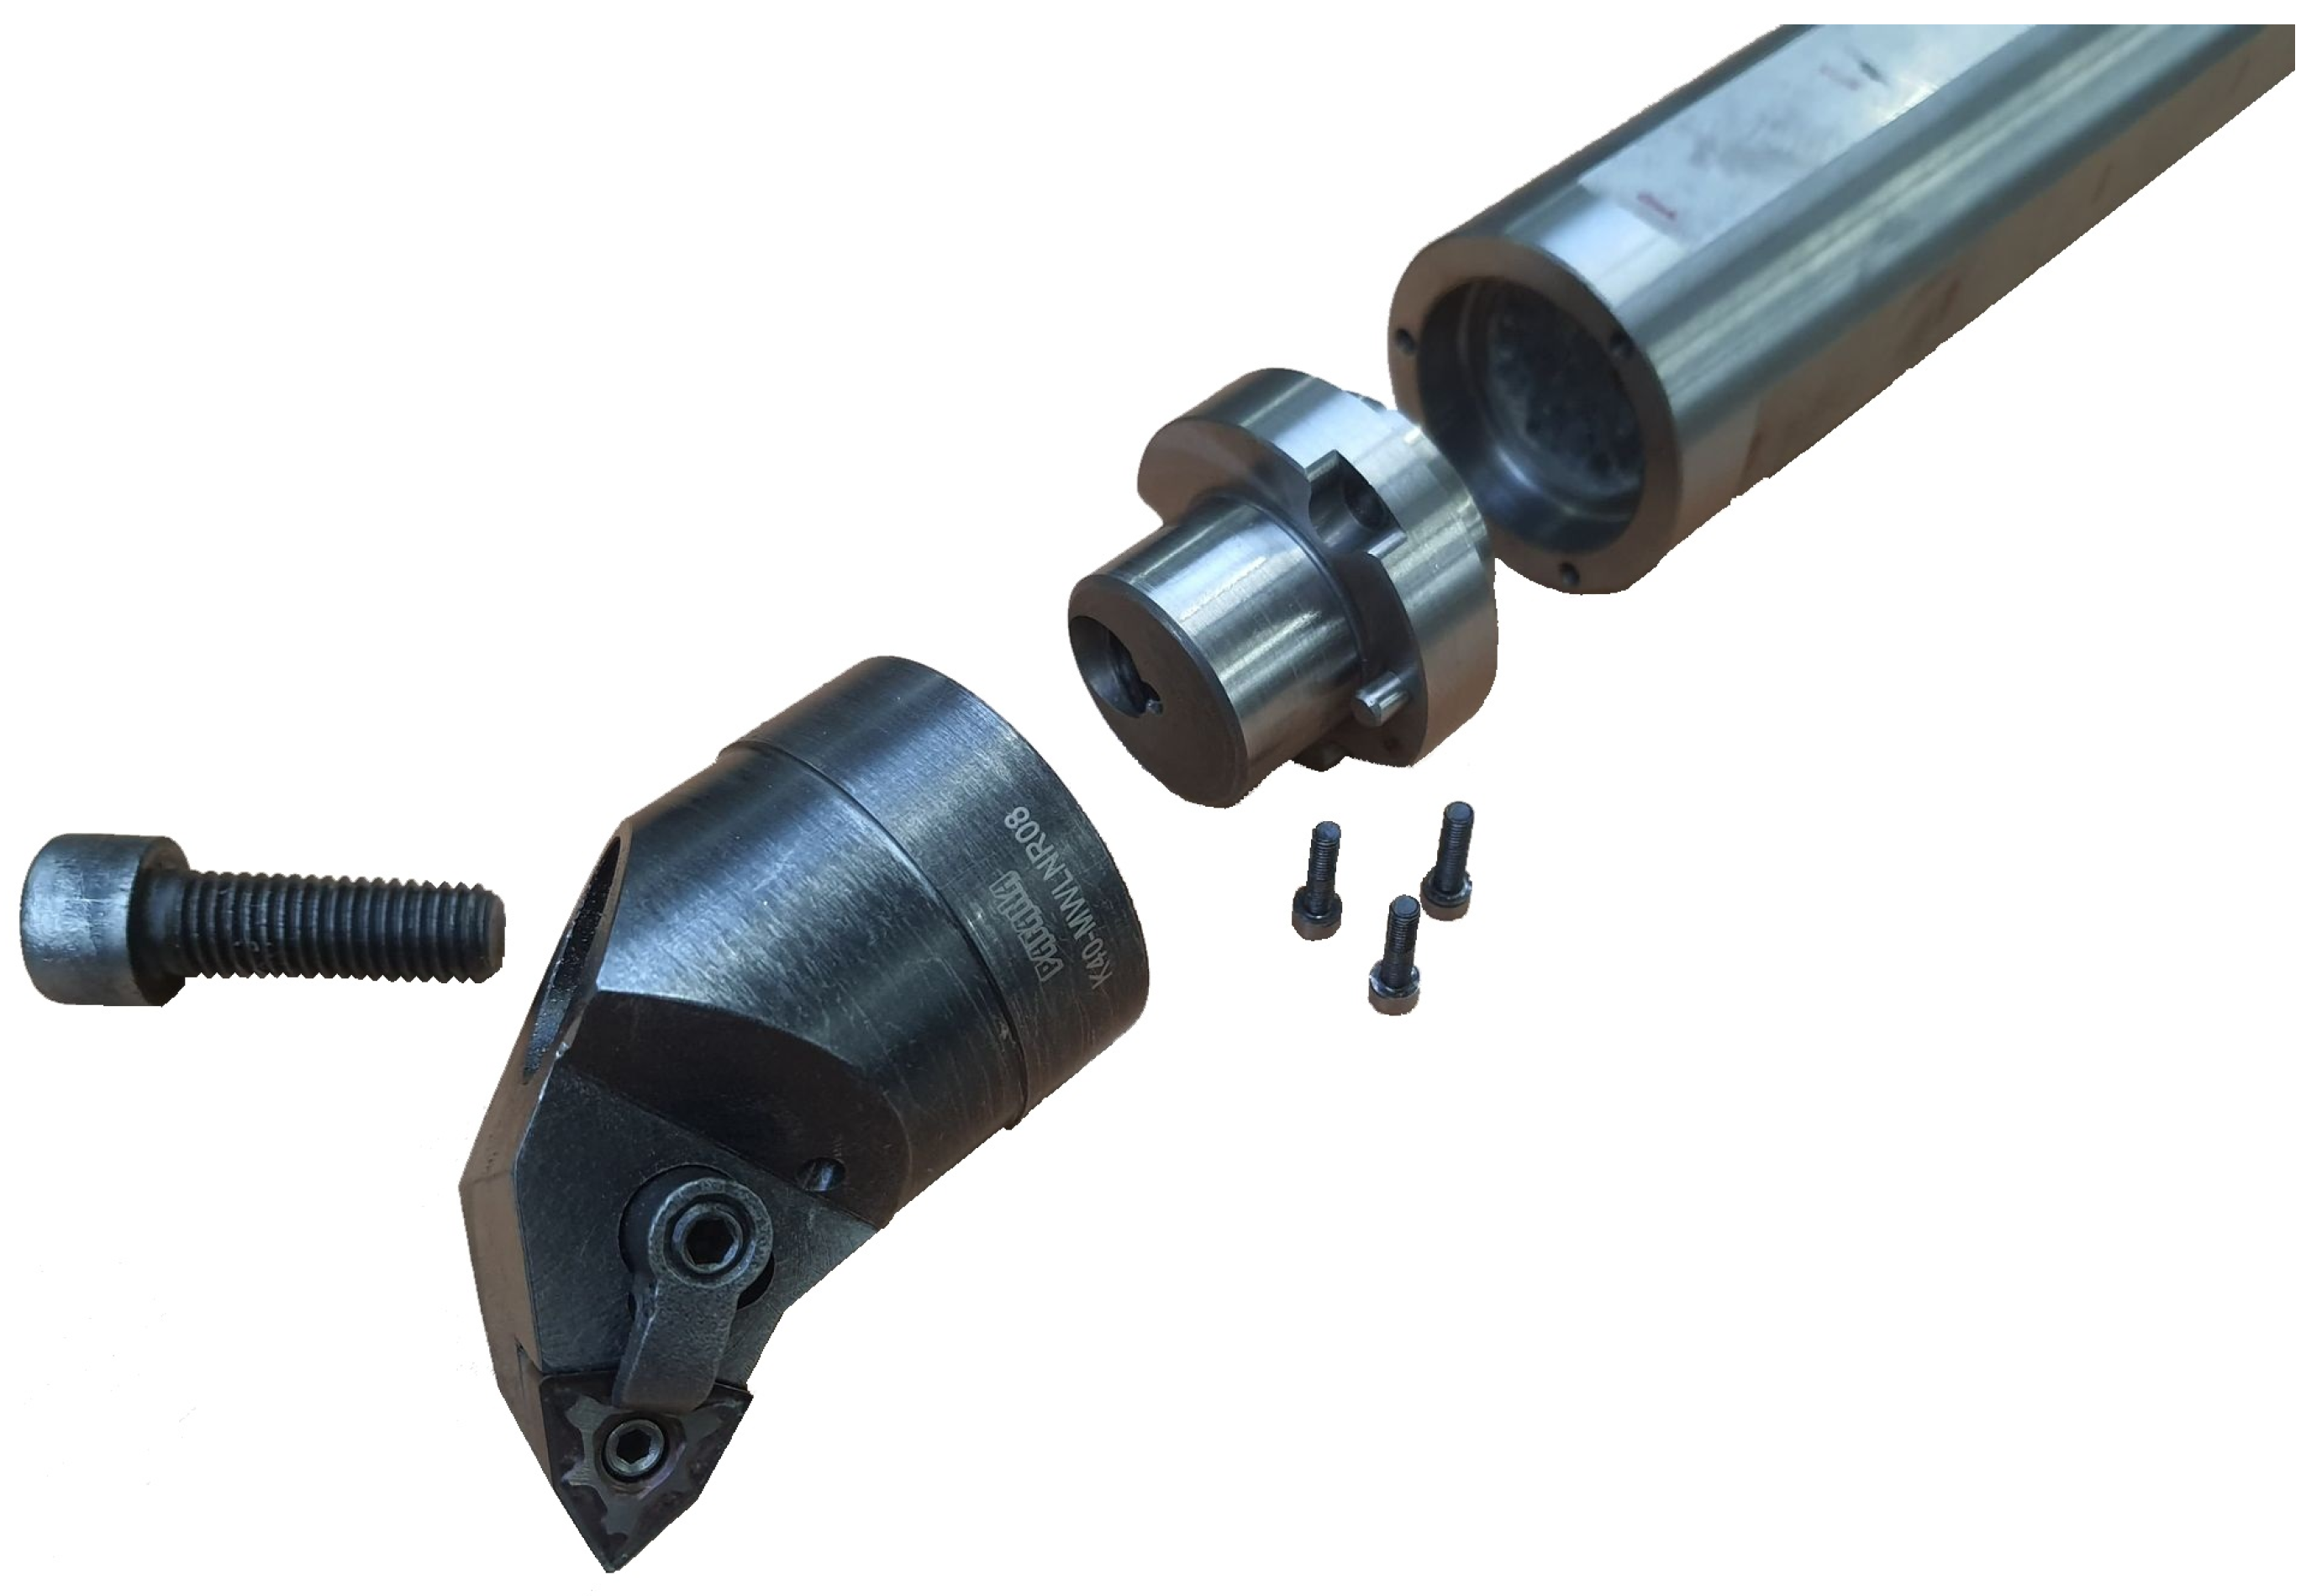
1. Introduction
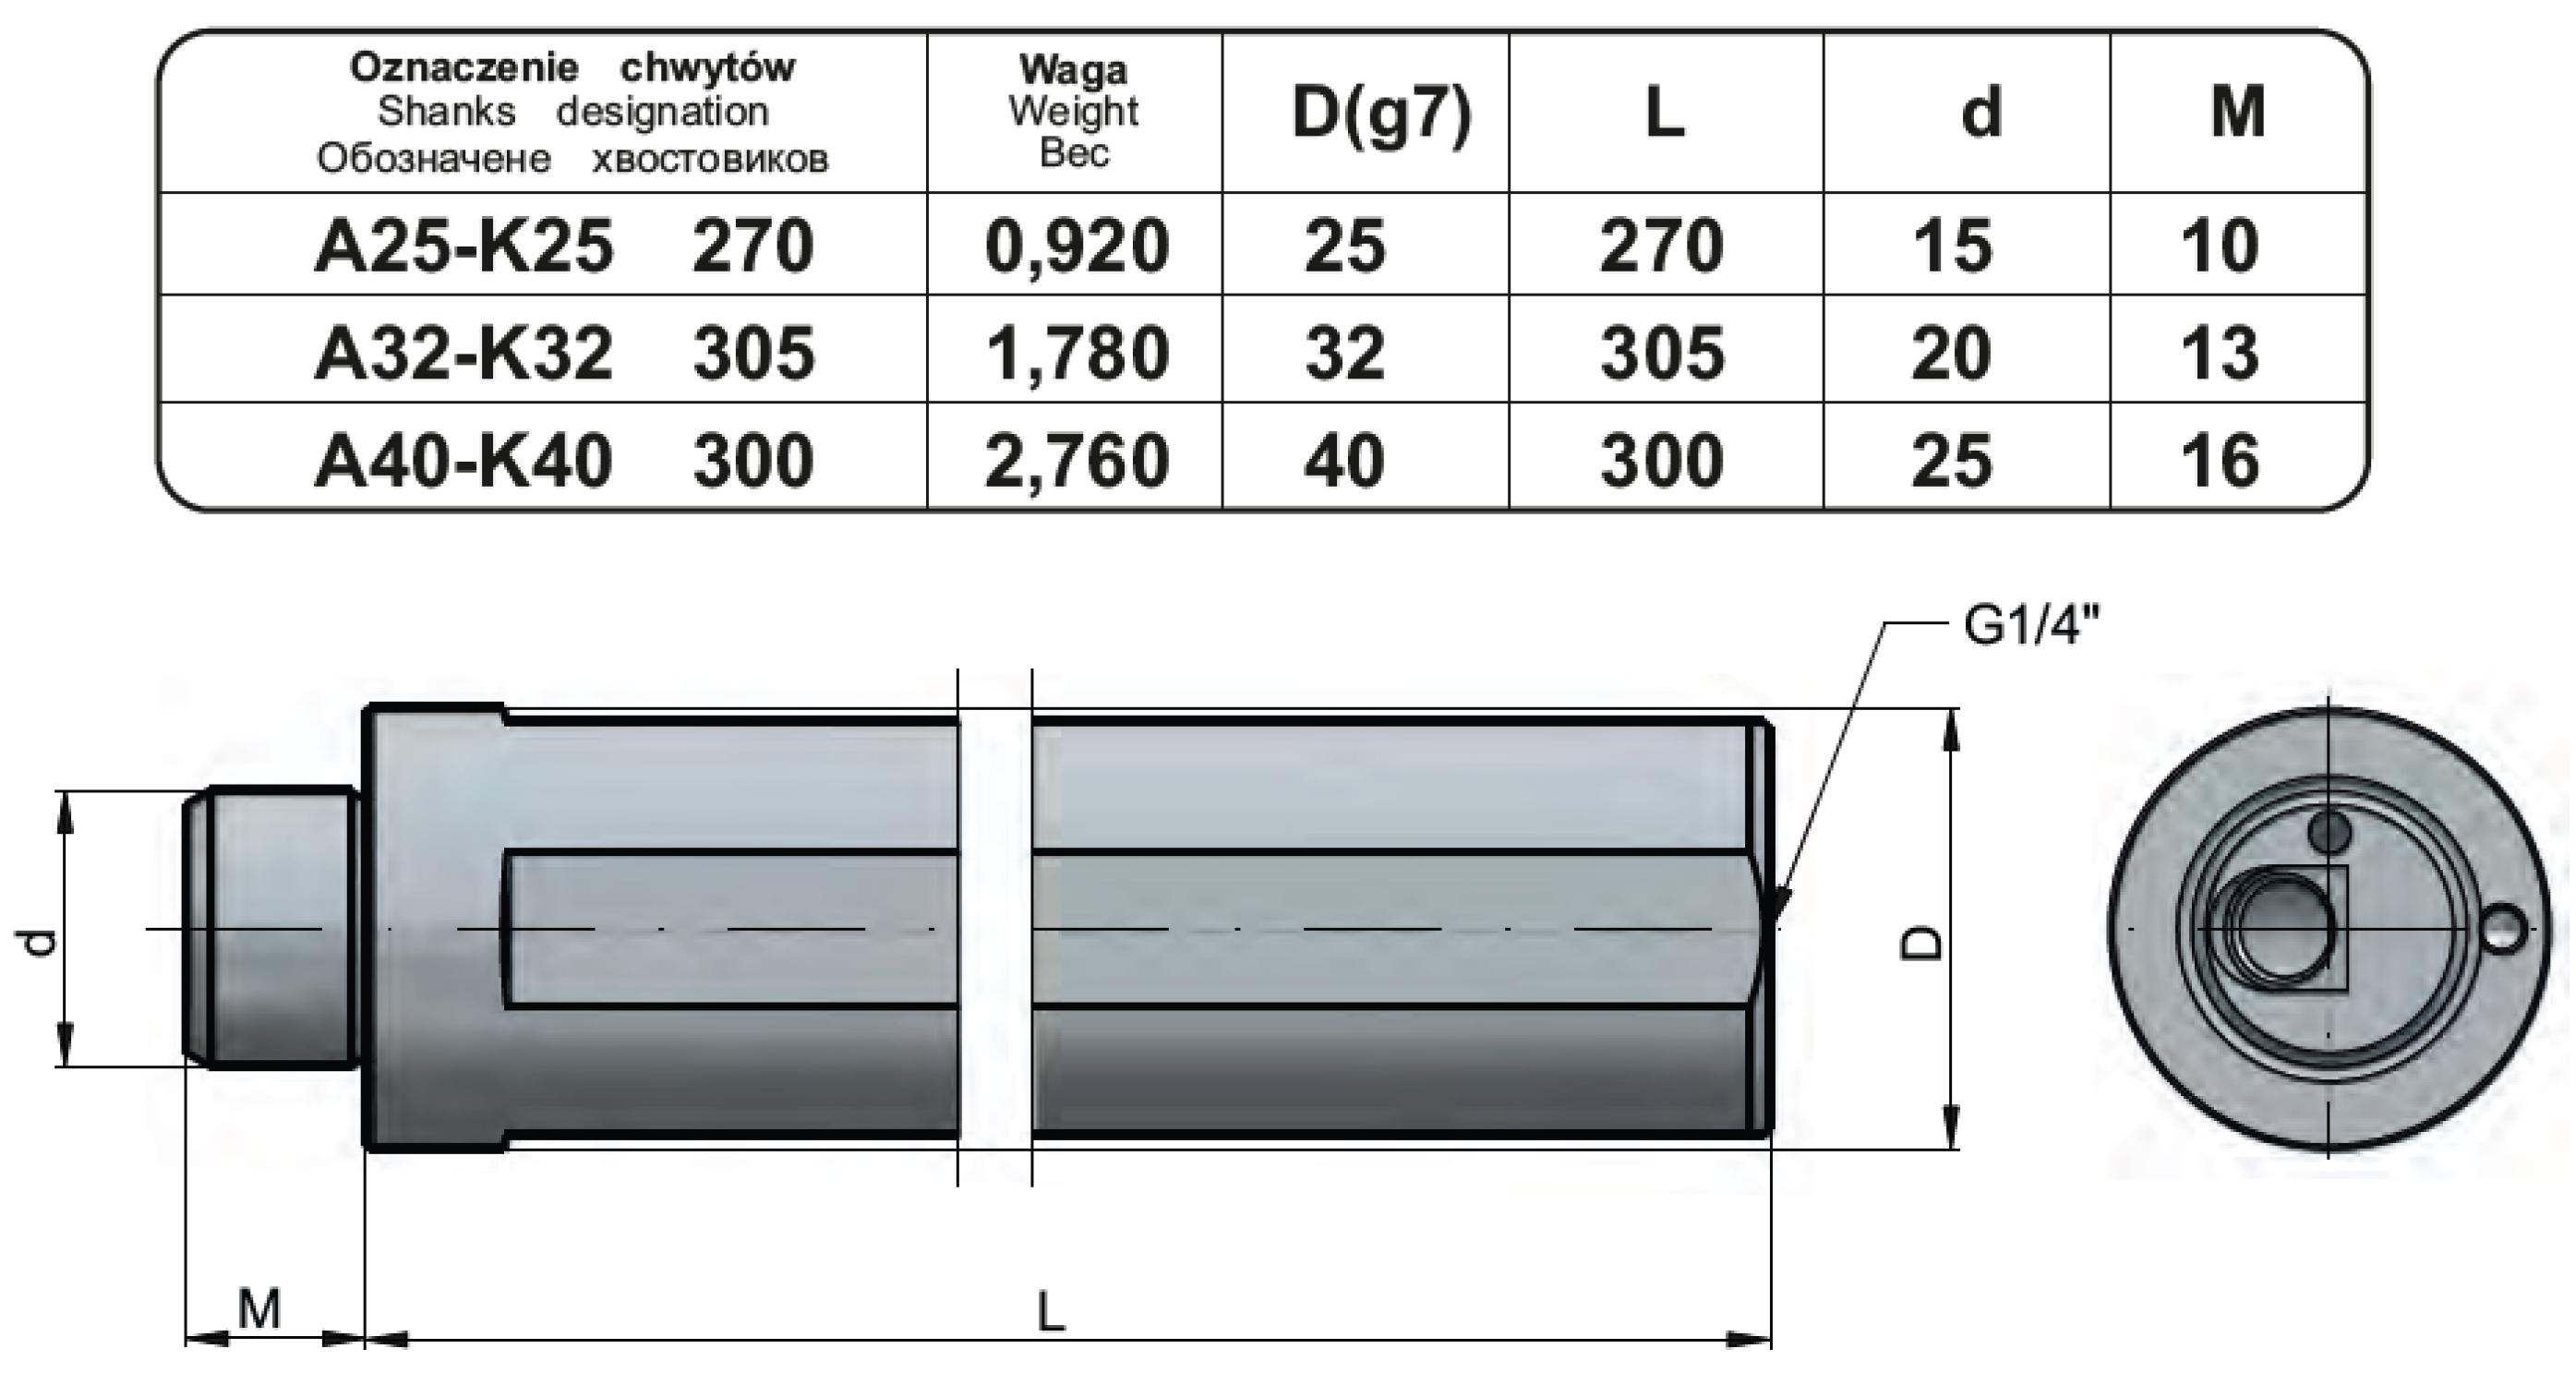
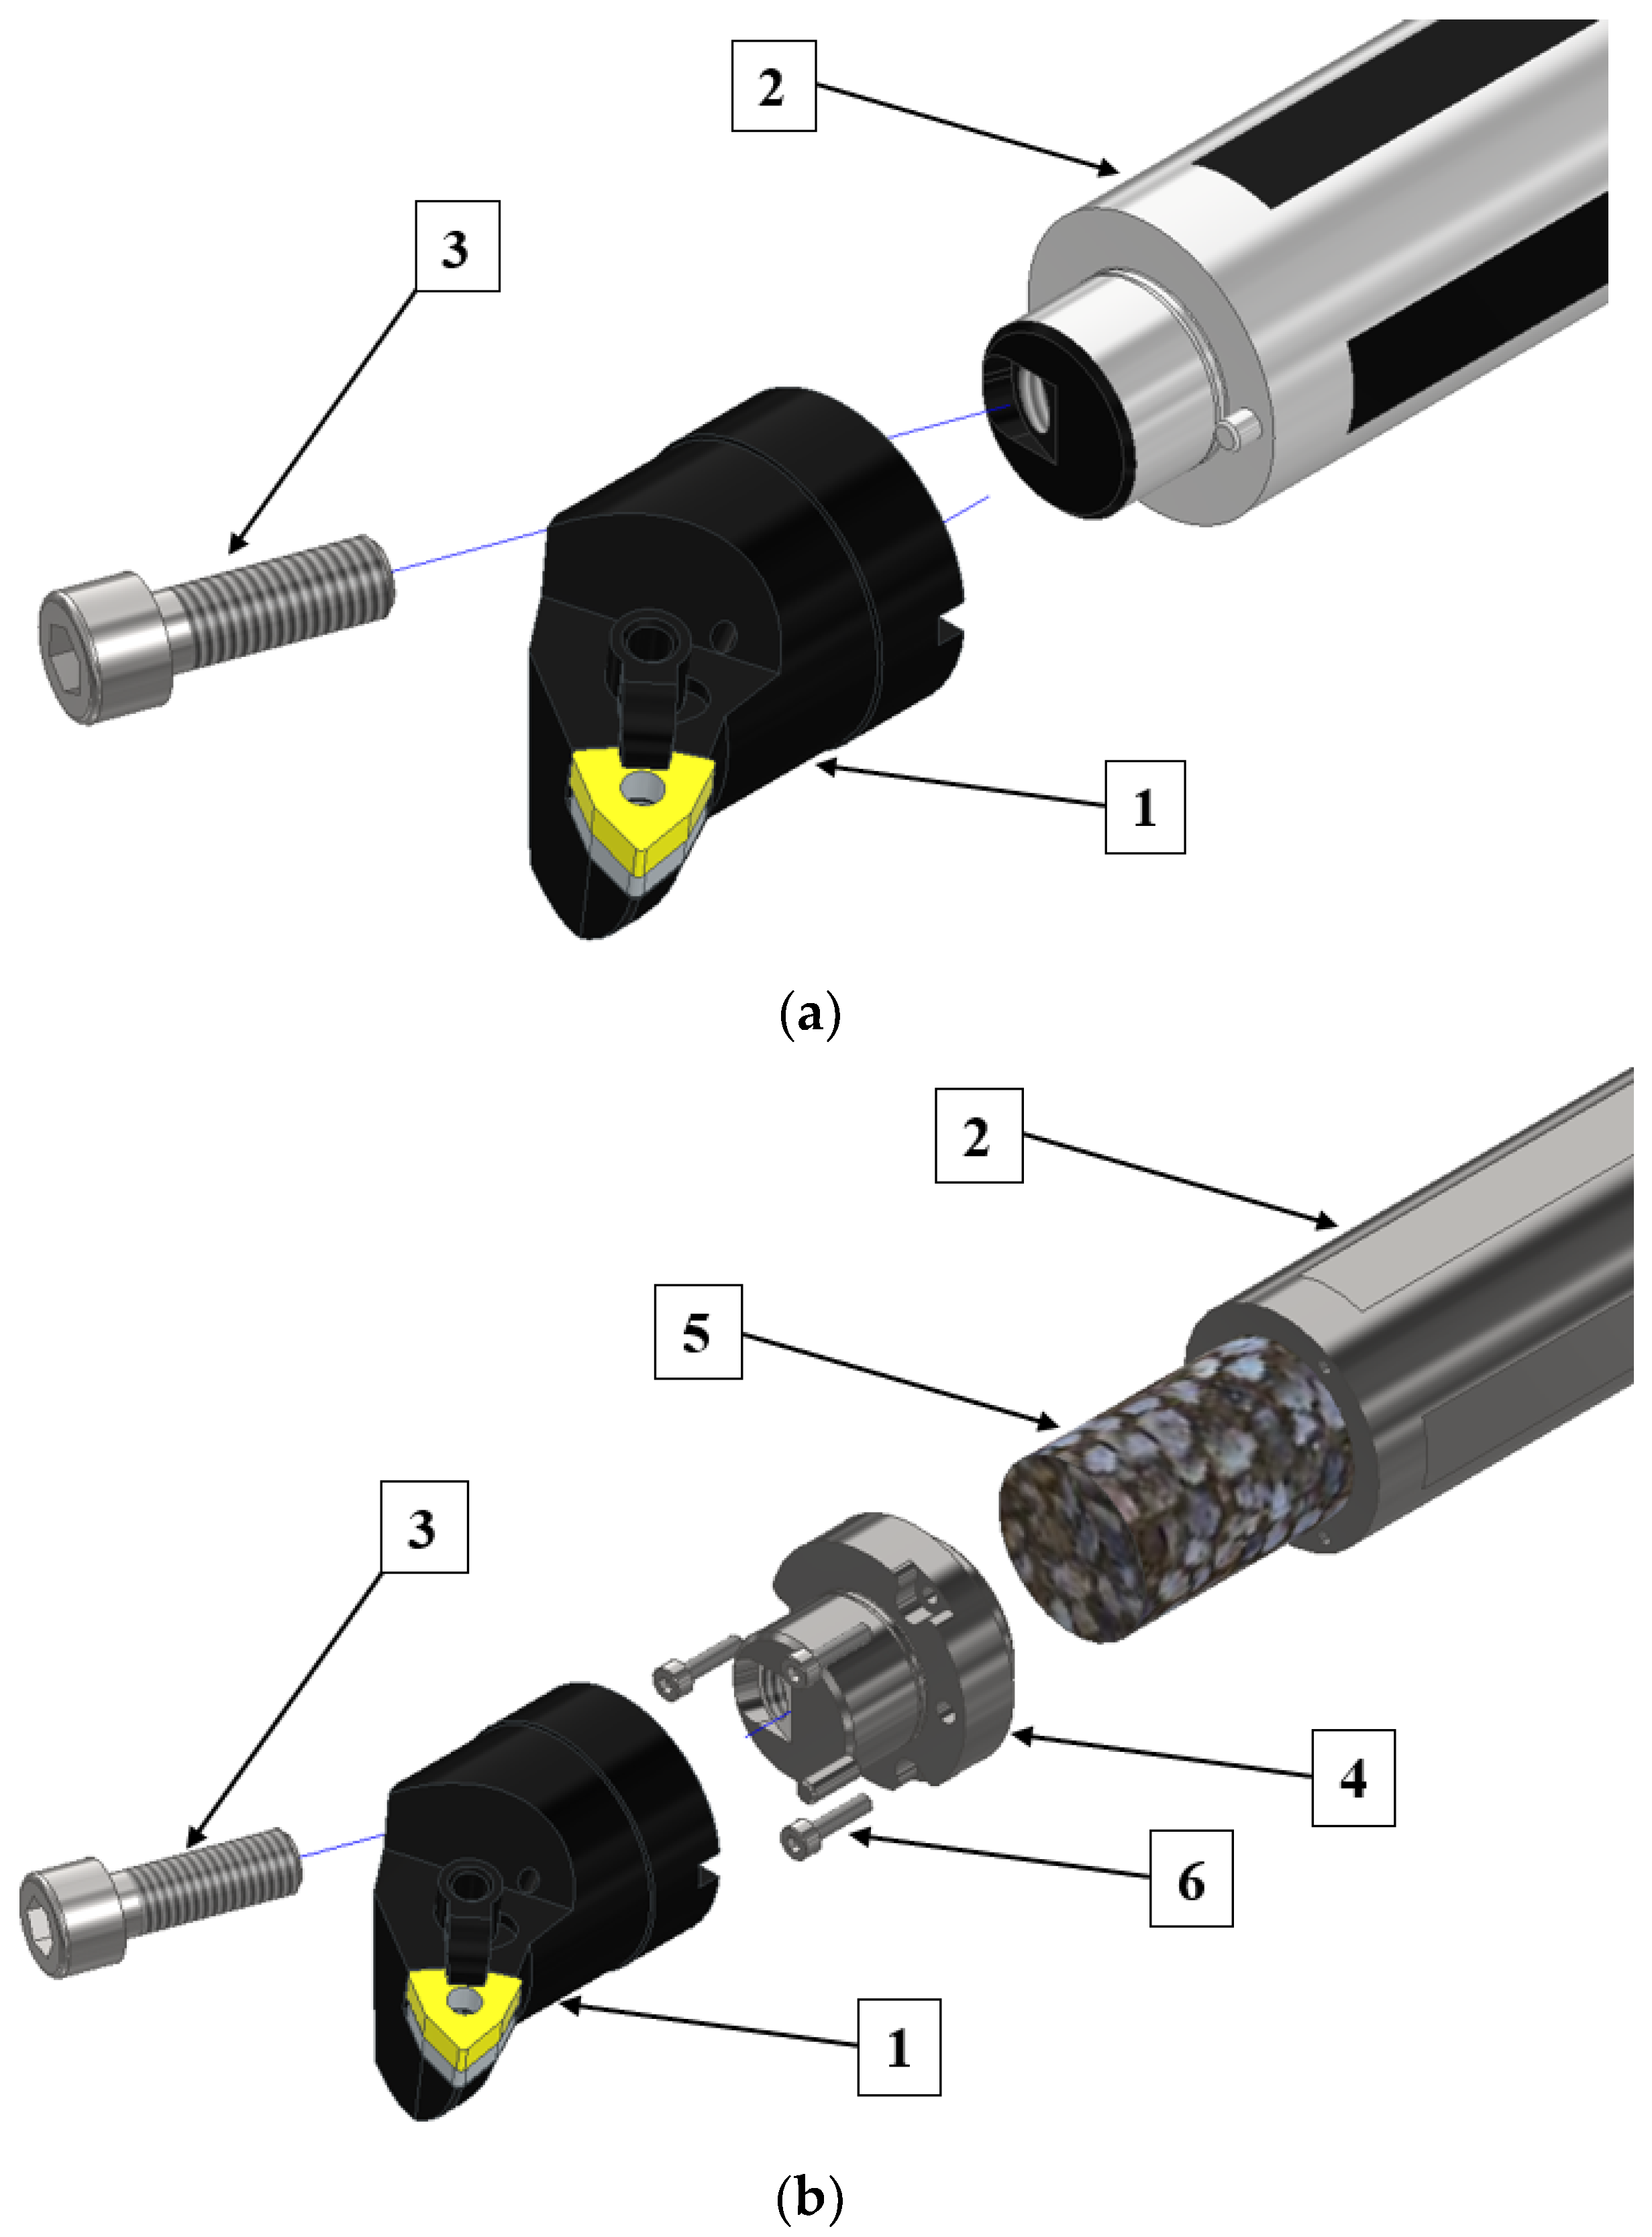
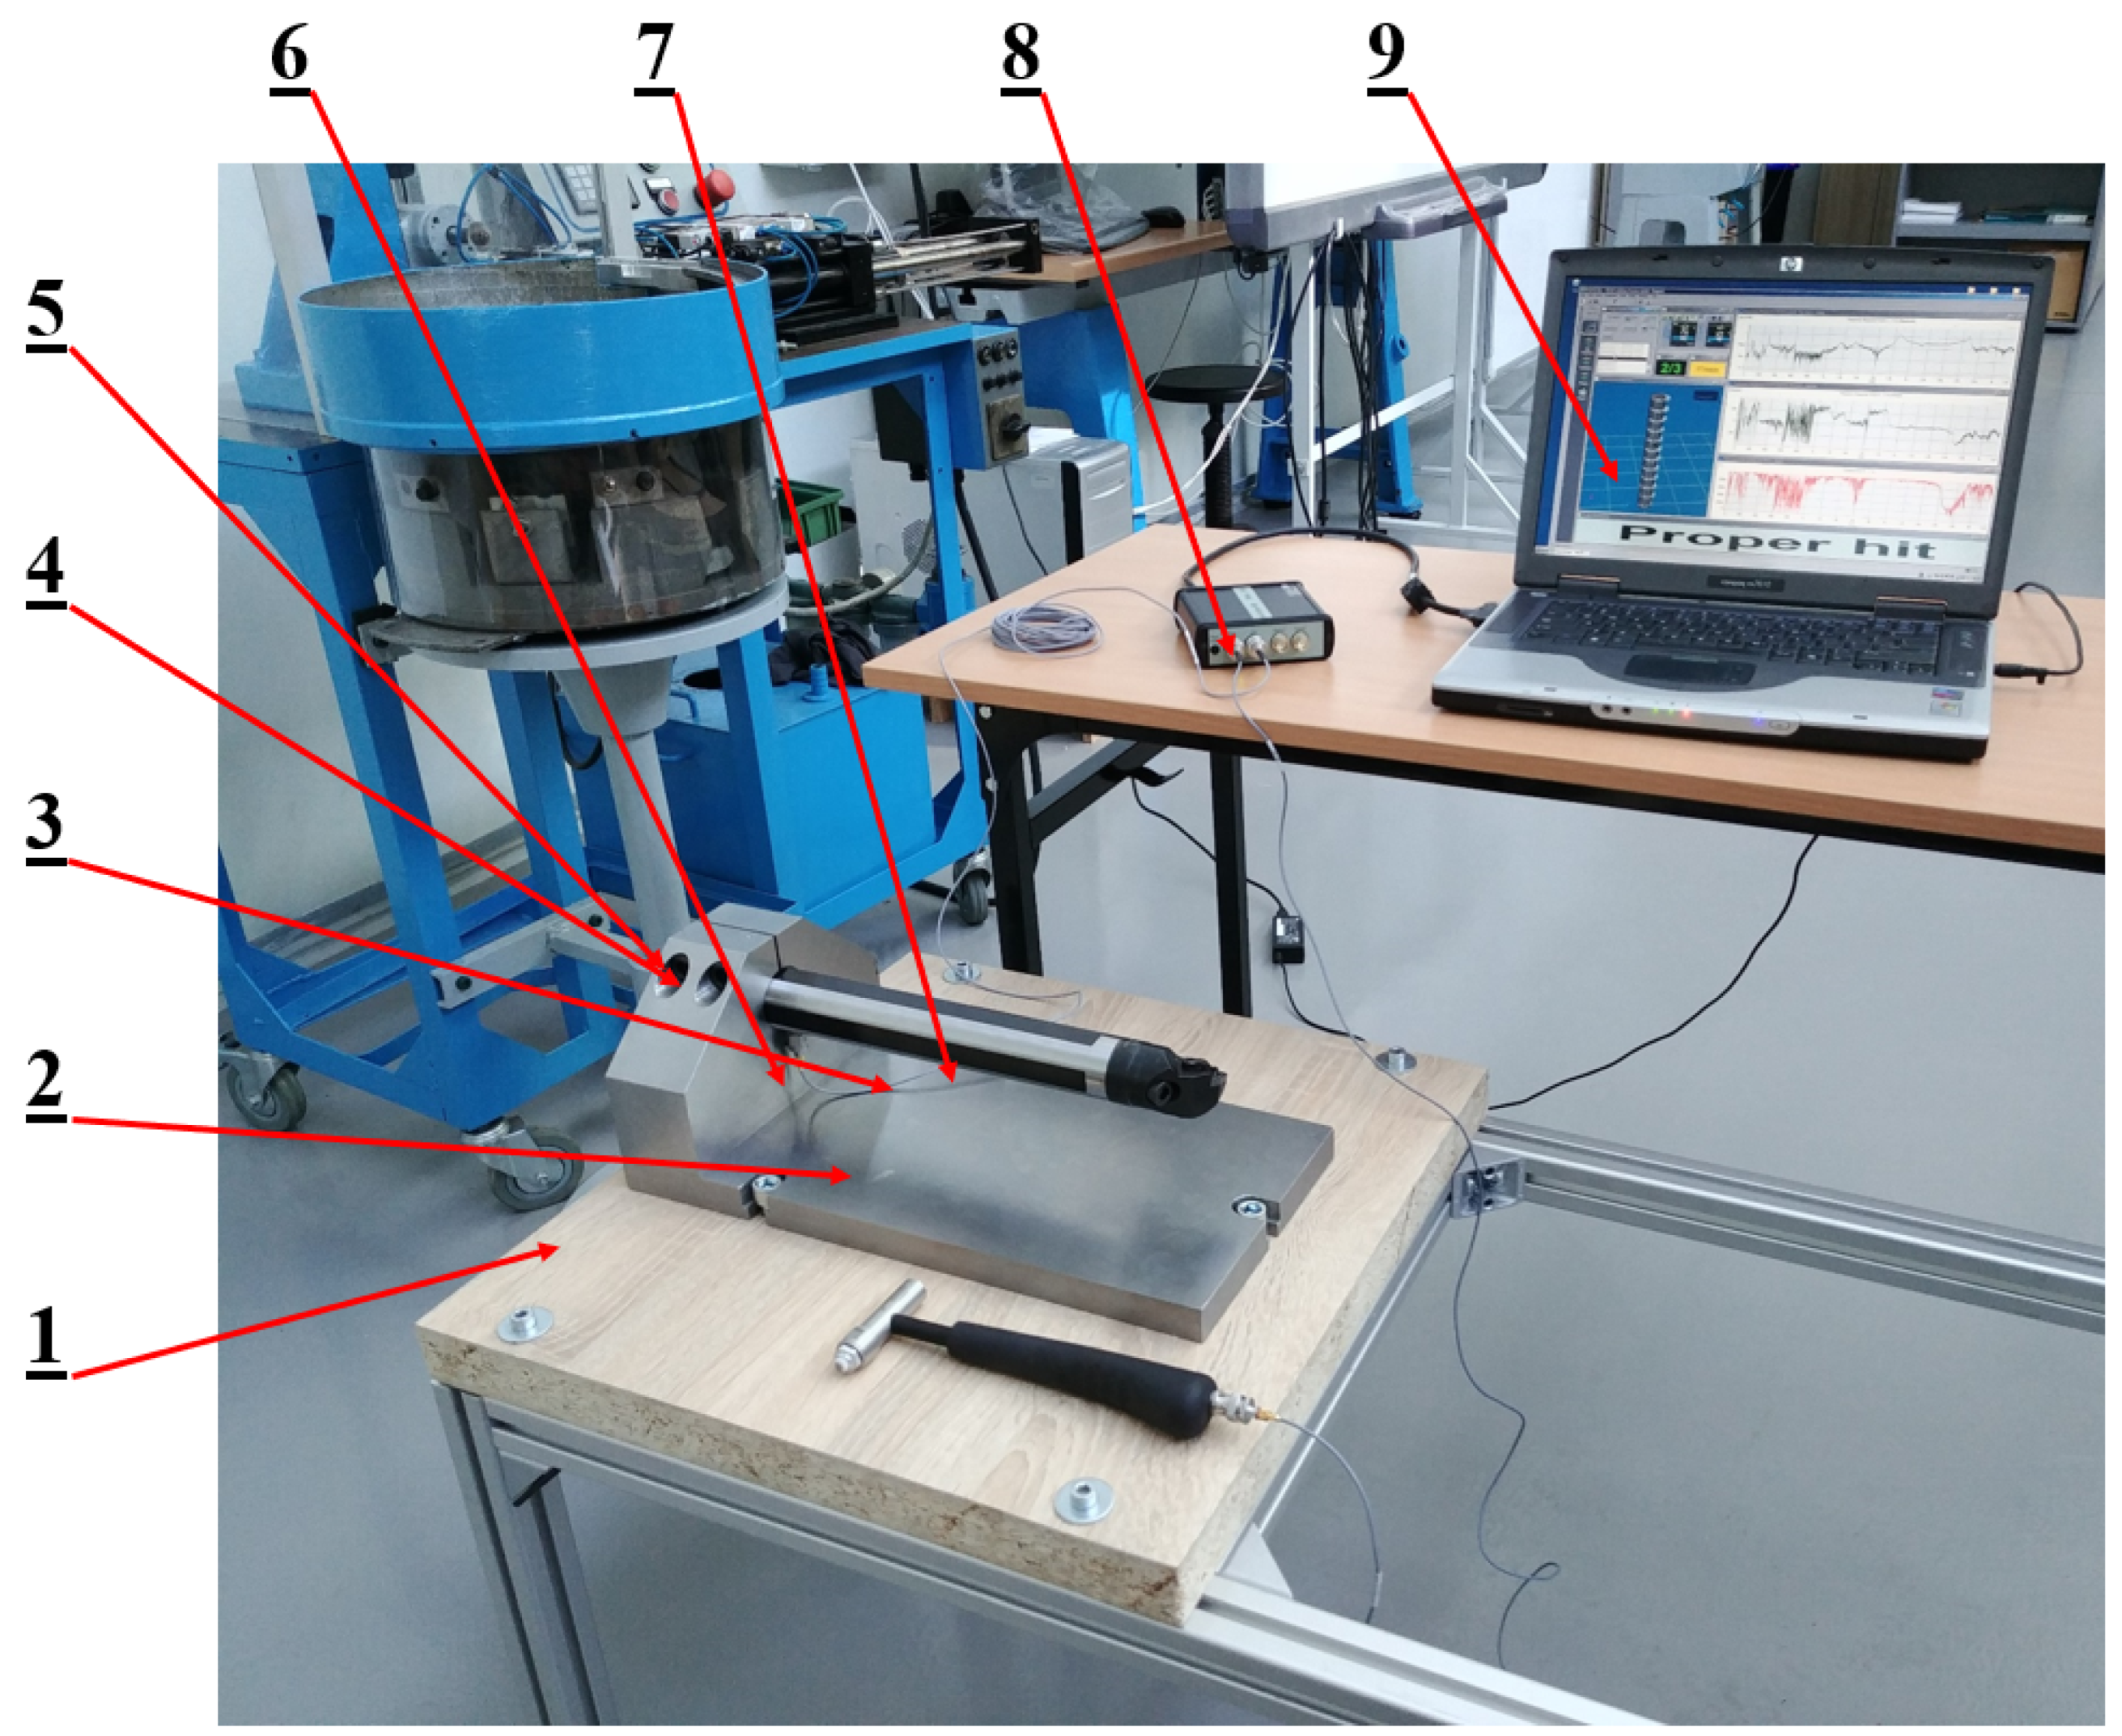
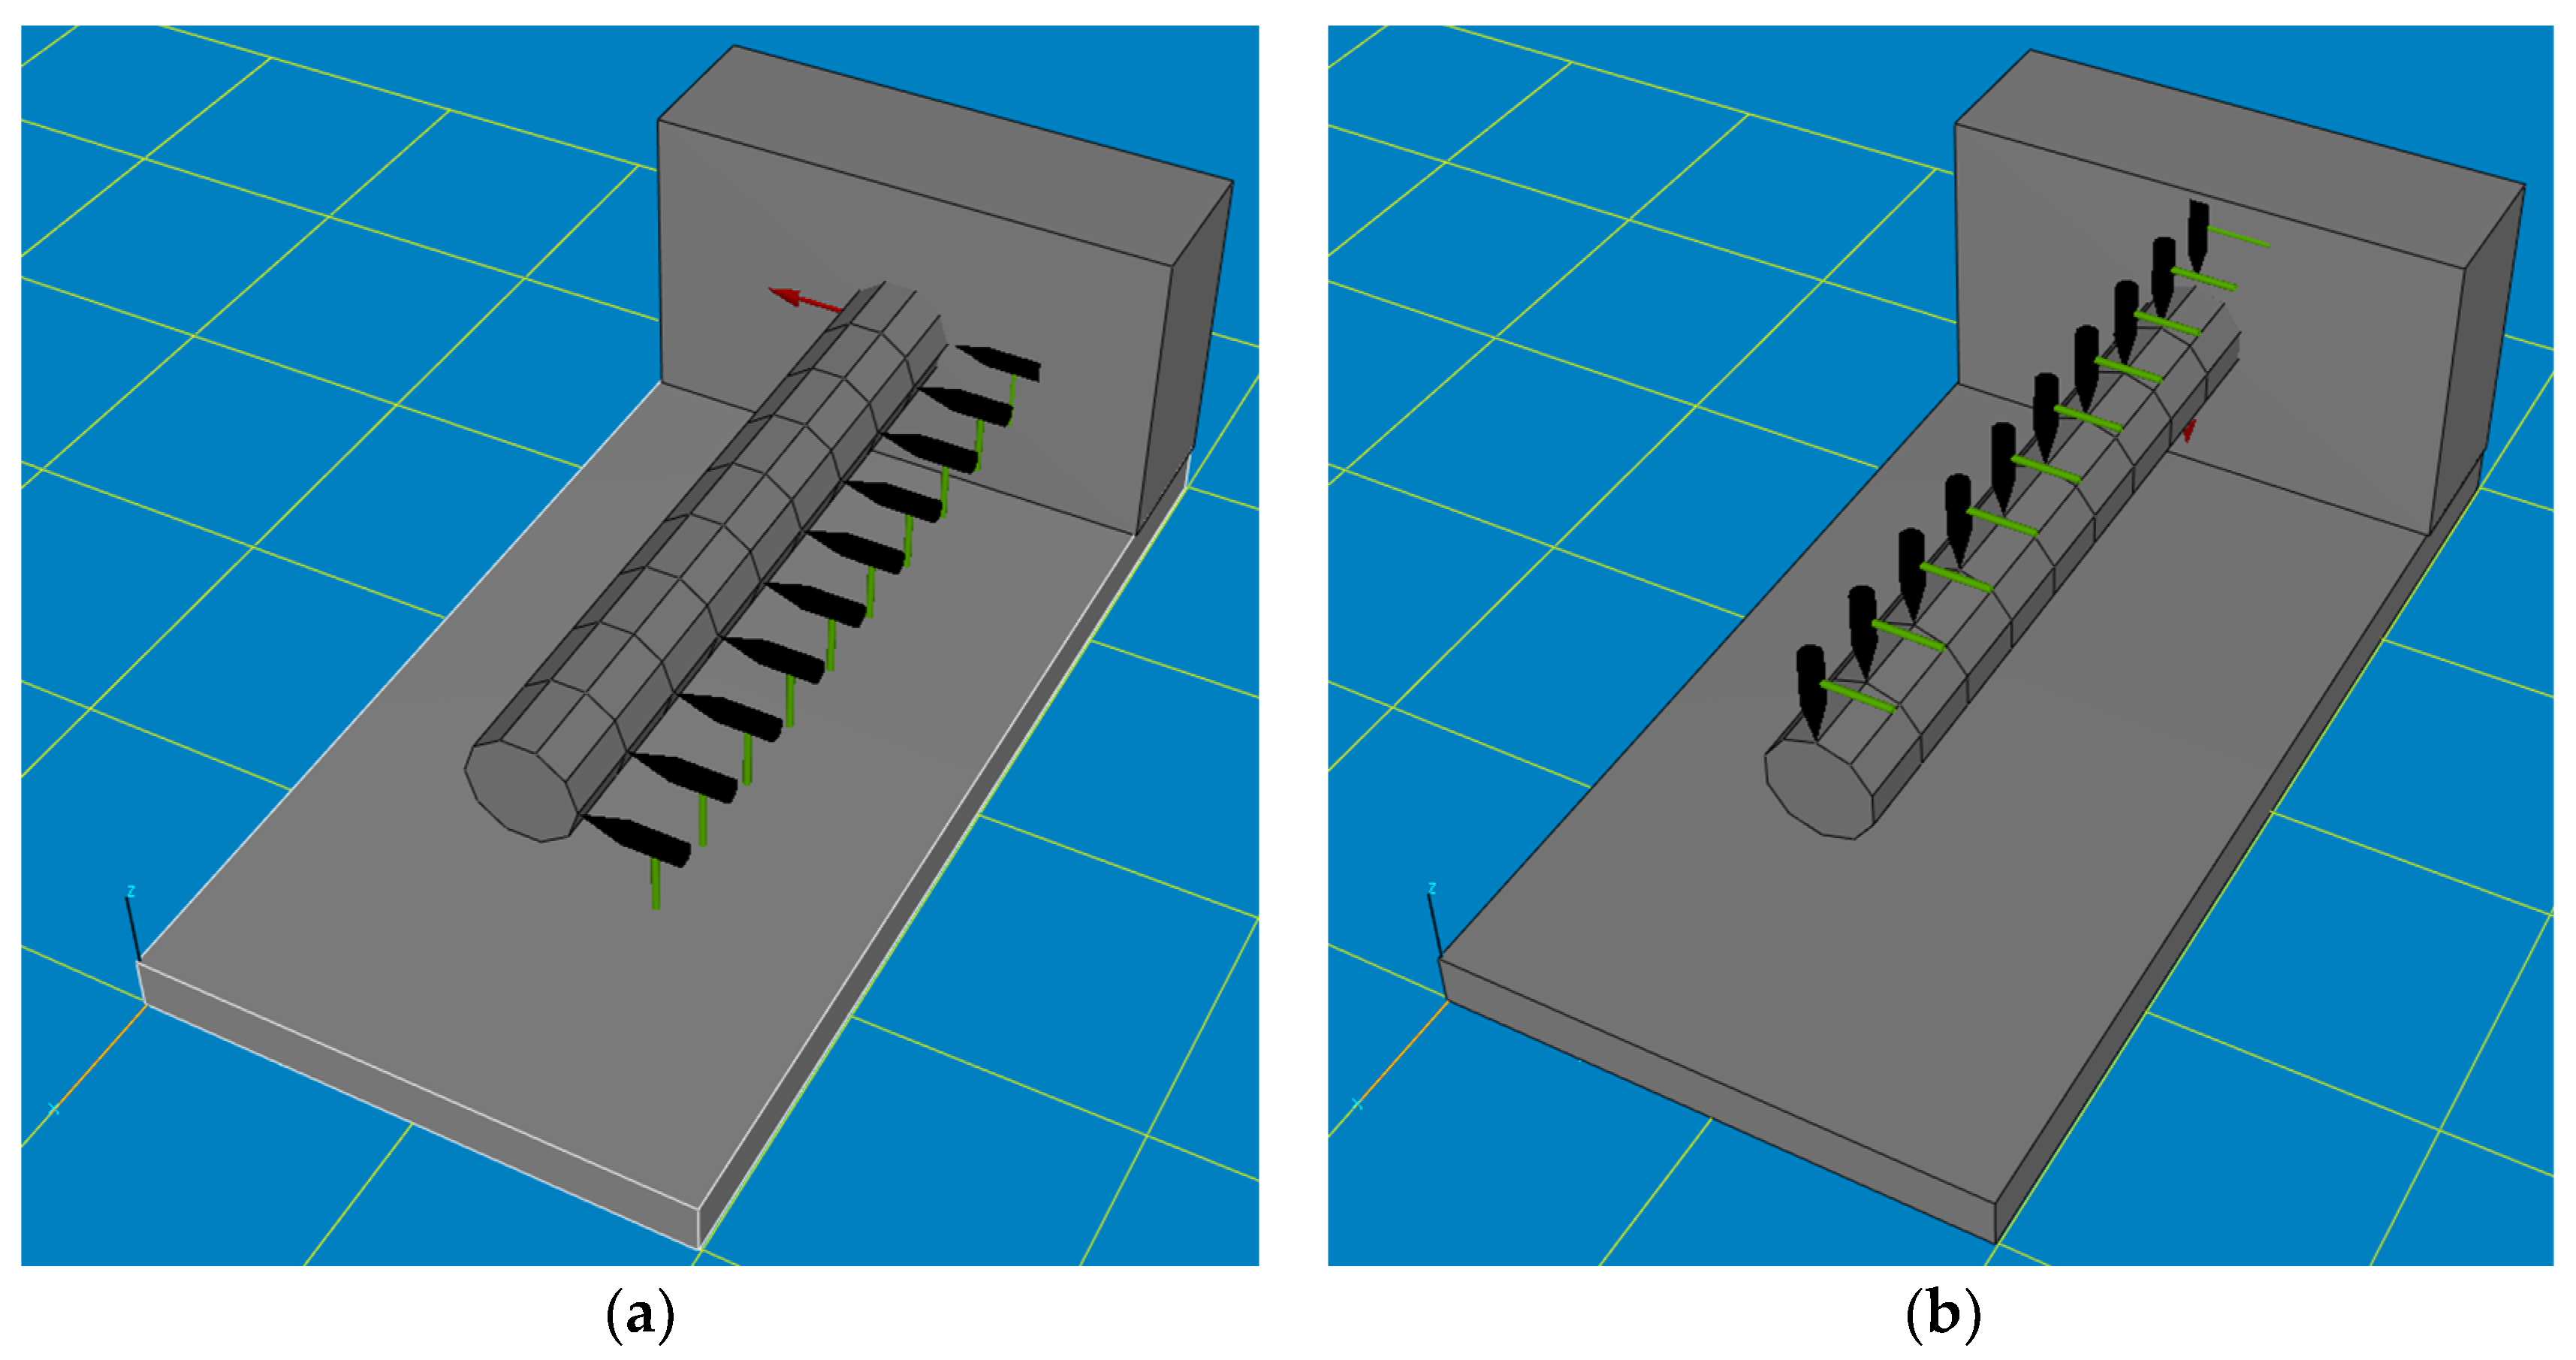
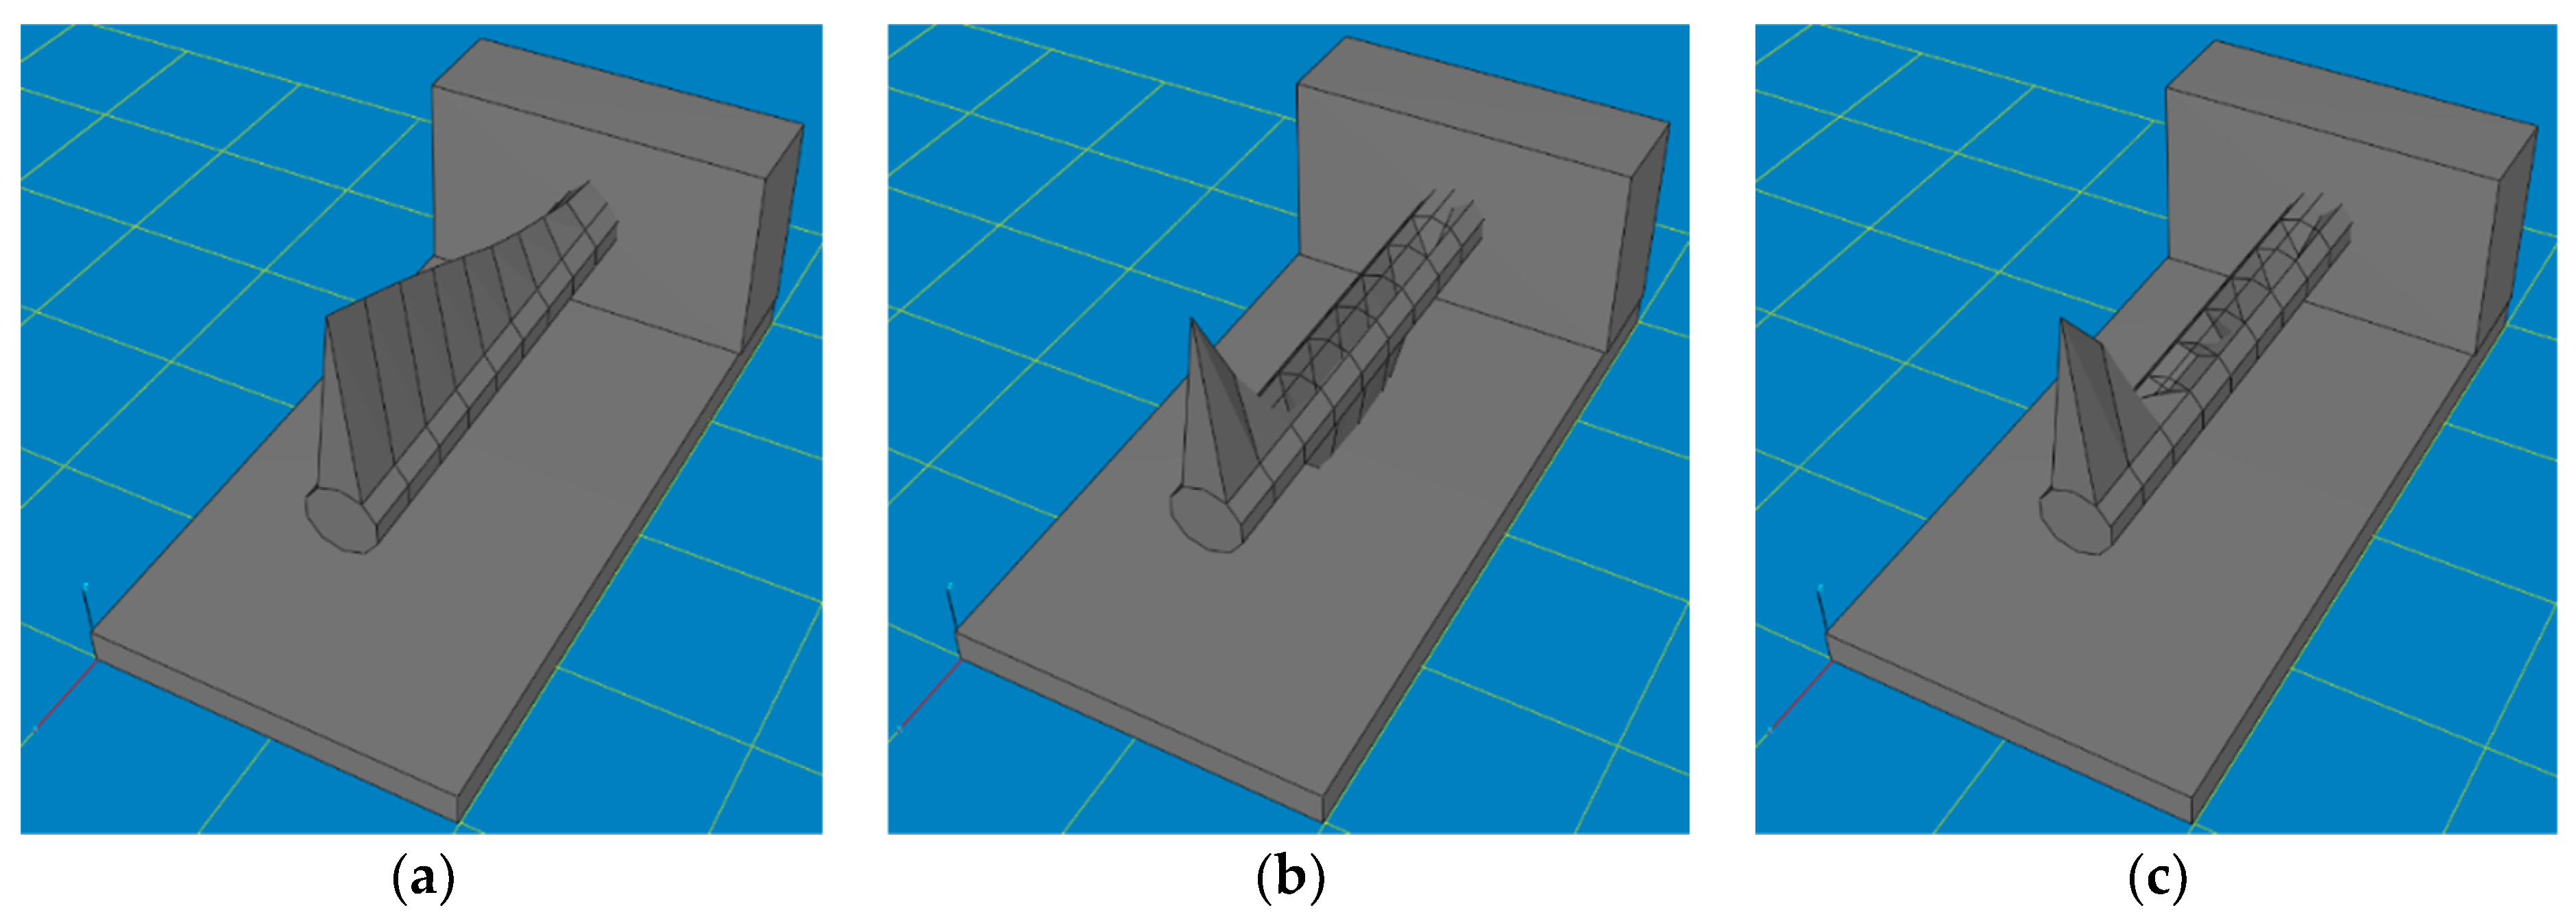
2. Methods
- Cutting speed vc = 19 ÷ 271 m/min;
- Feed rate f = 0.1 ÷ 1 mm/rev;
- Depth of cut ap = 0.5 ÷ 2 mm.
3. Results and Discussion
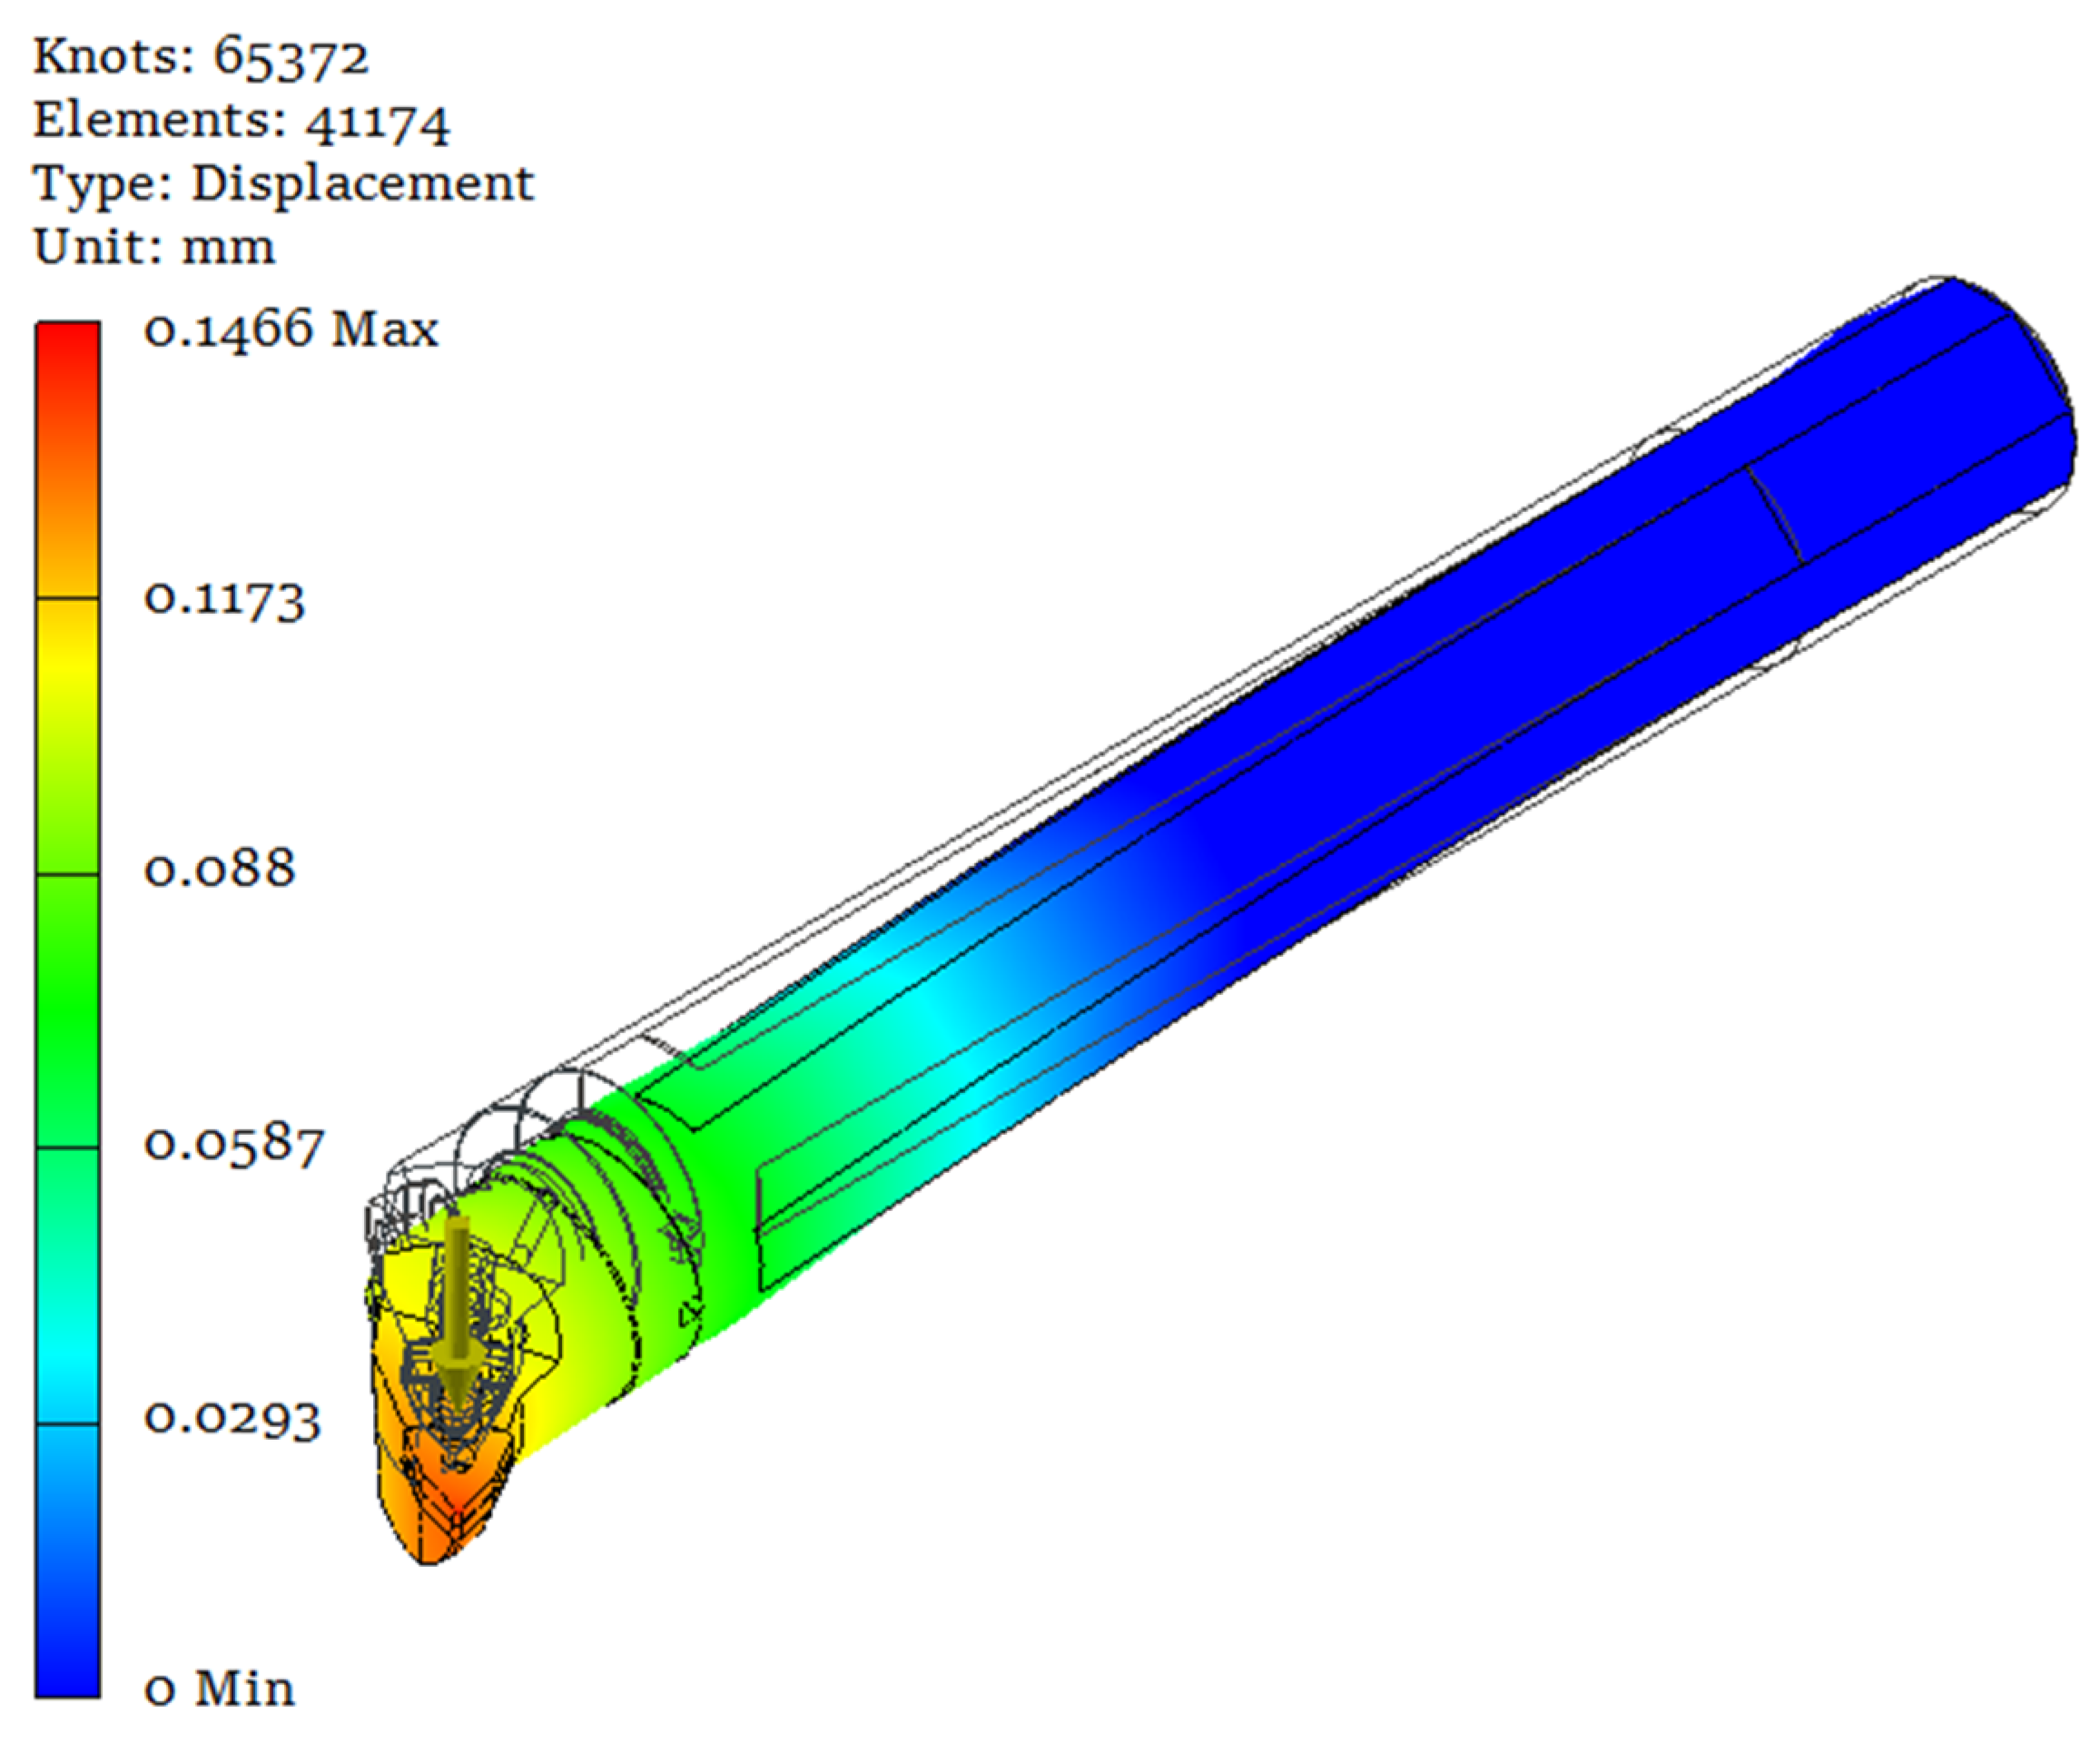
3.1. Theoretical Study
3.2. Experimental Study
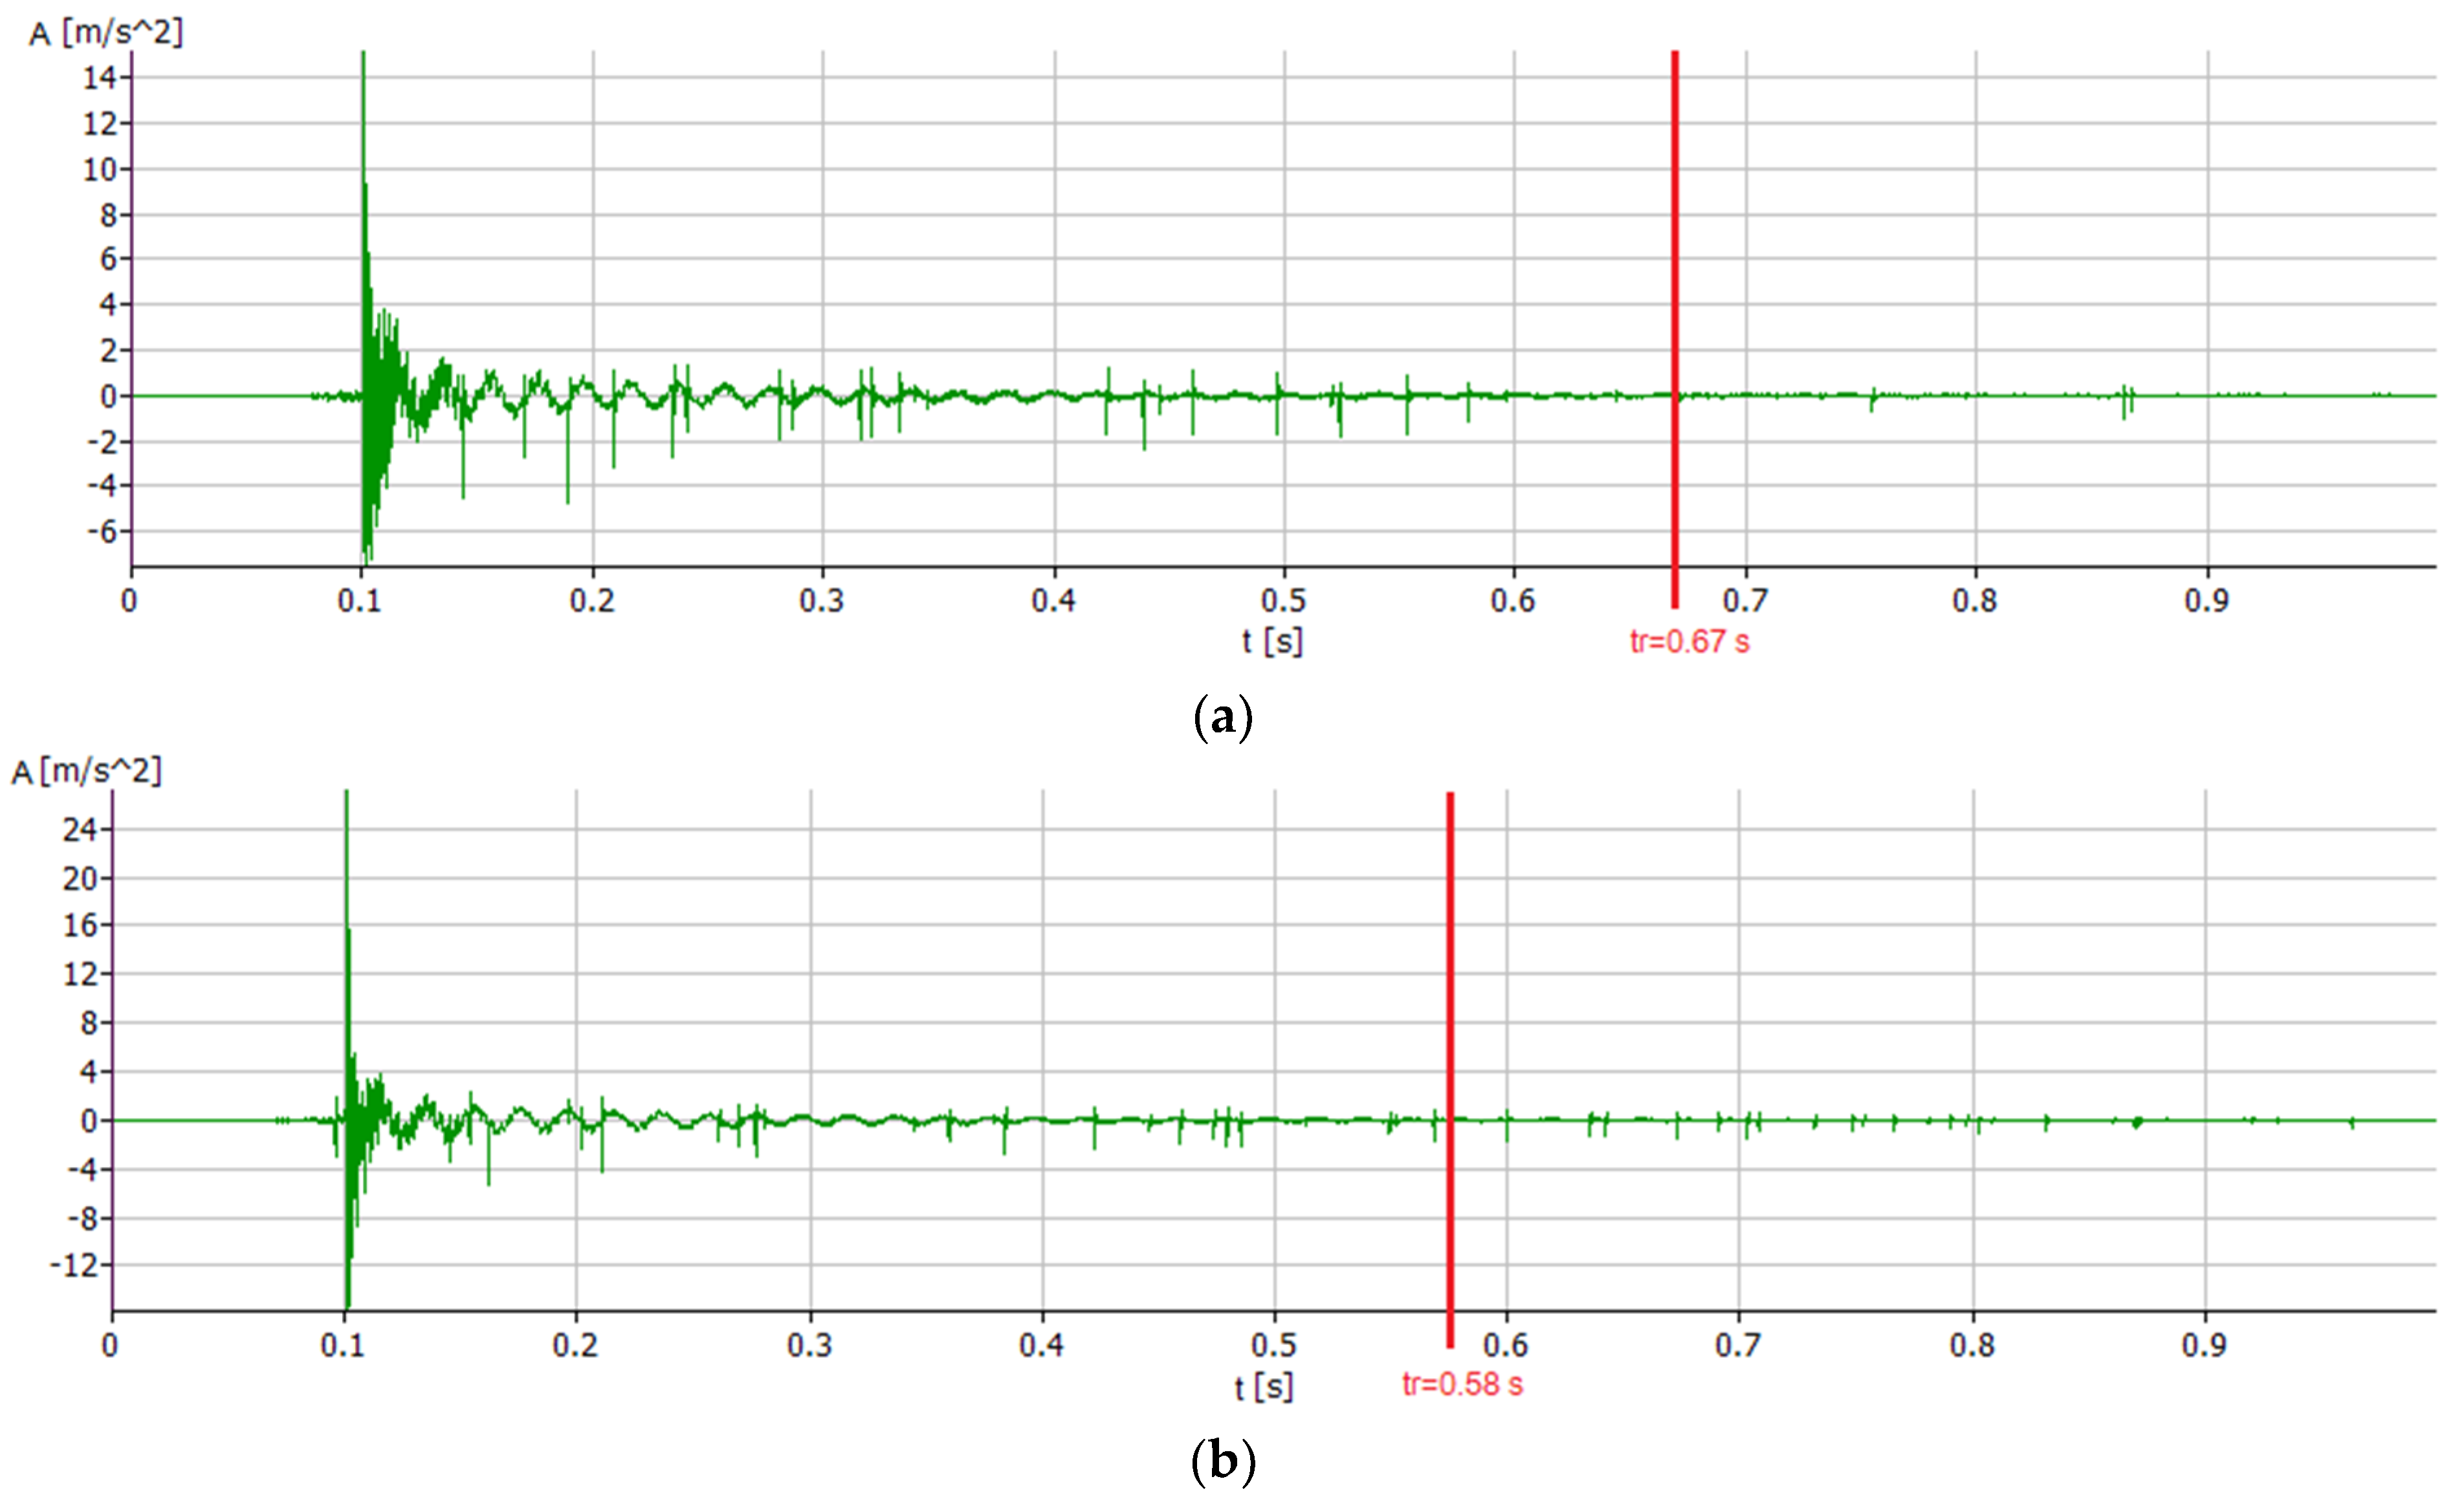
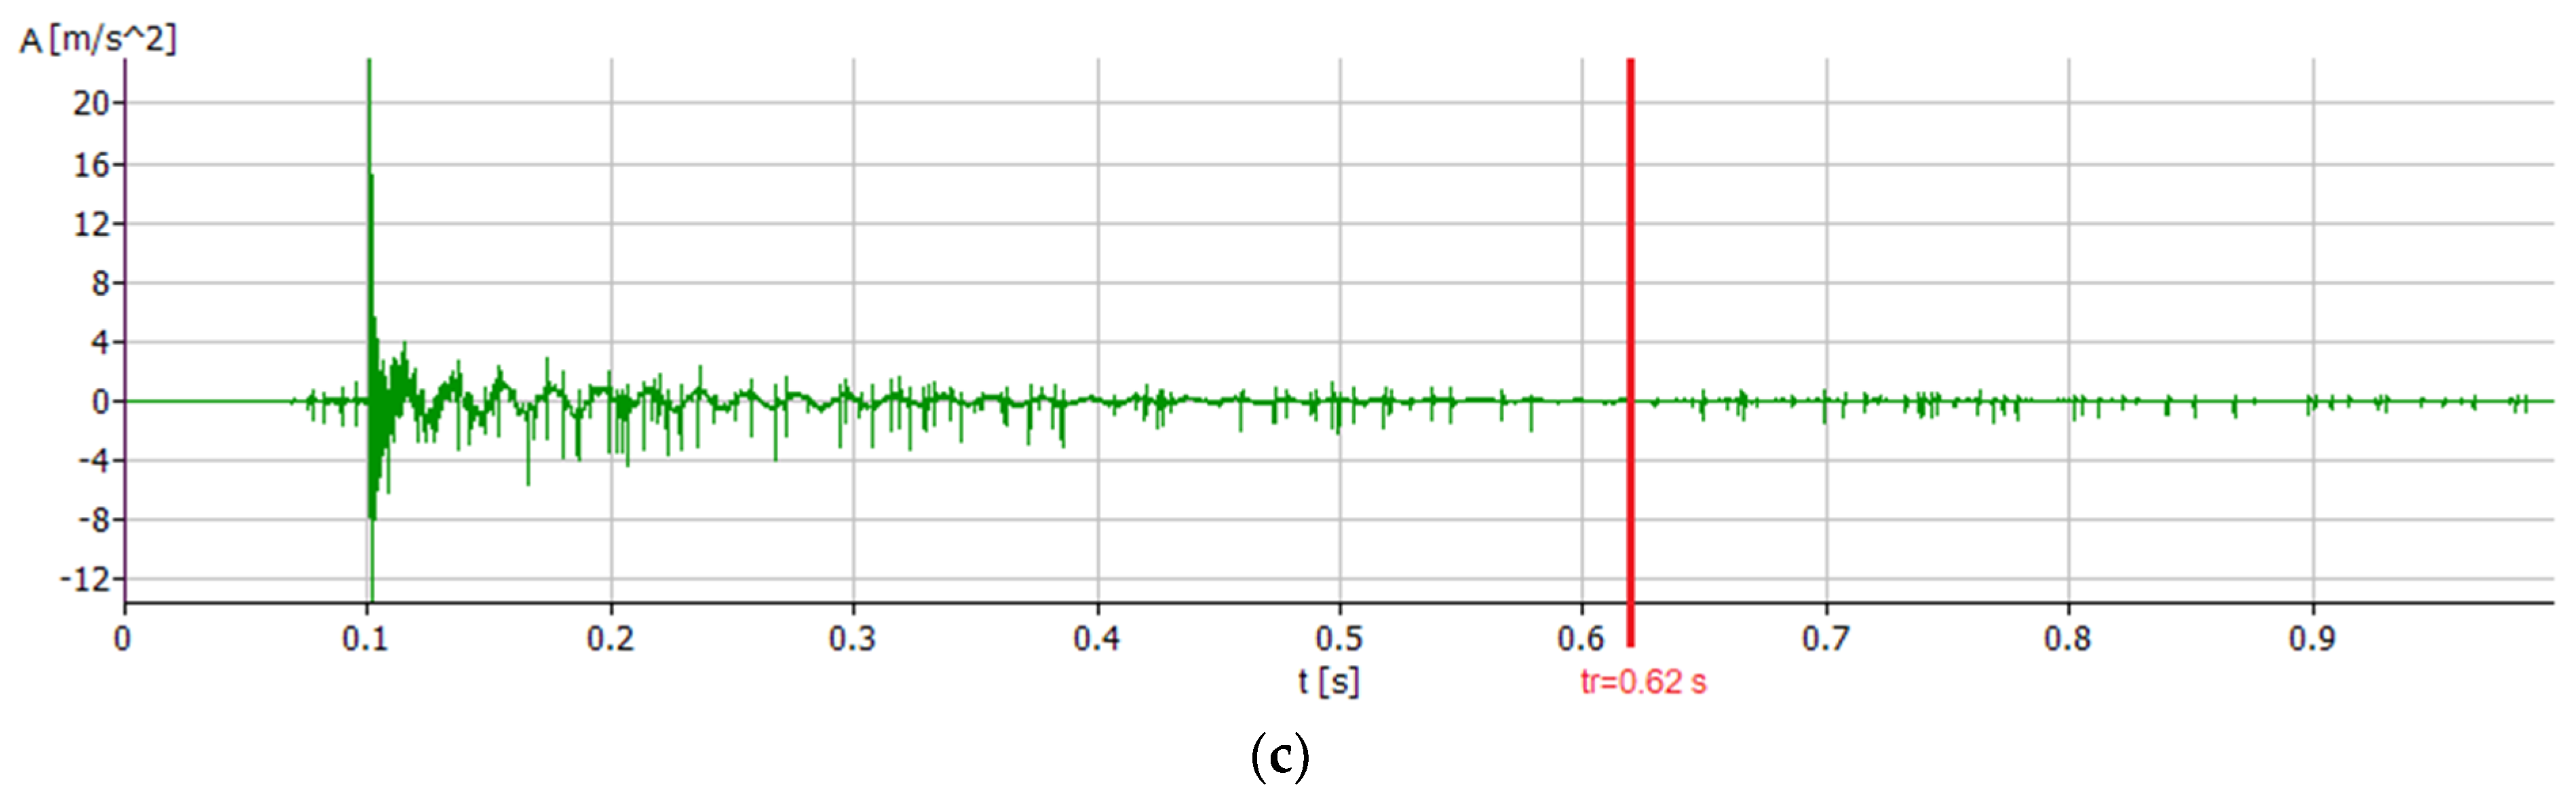
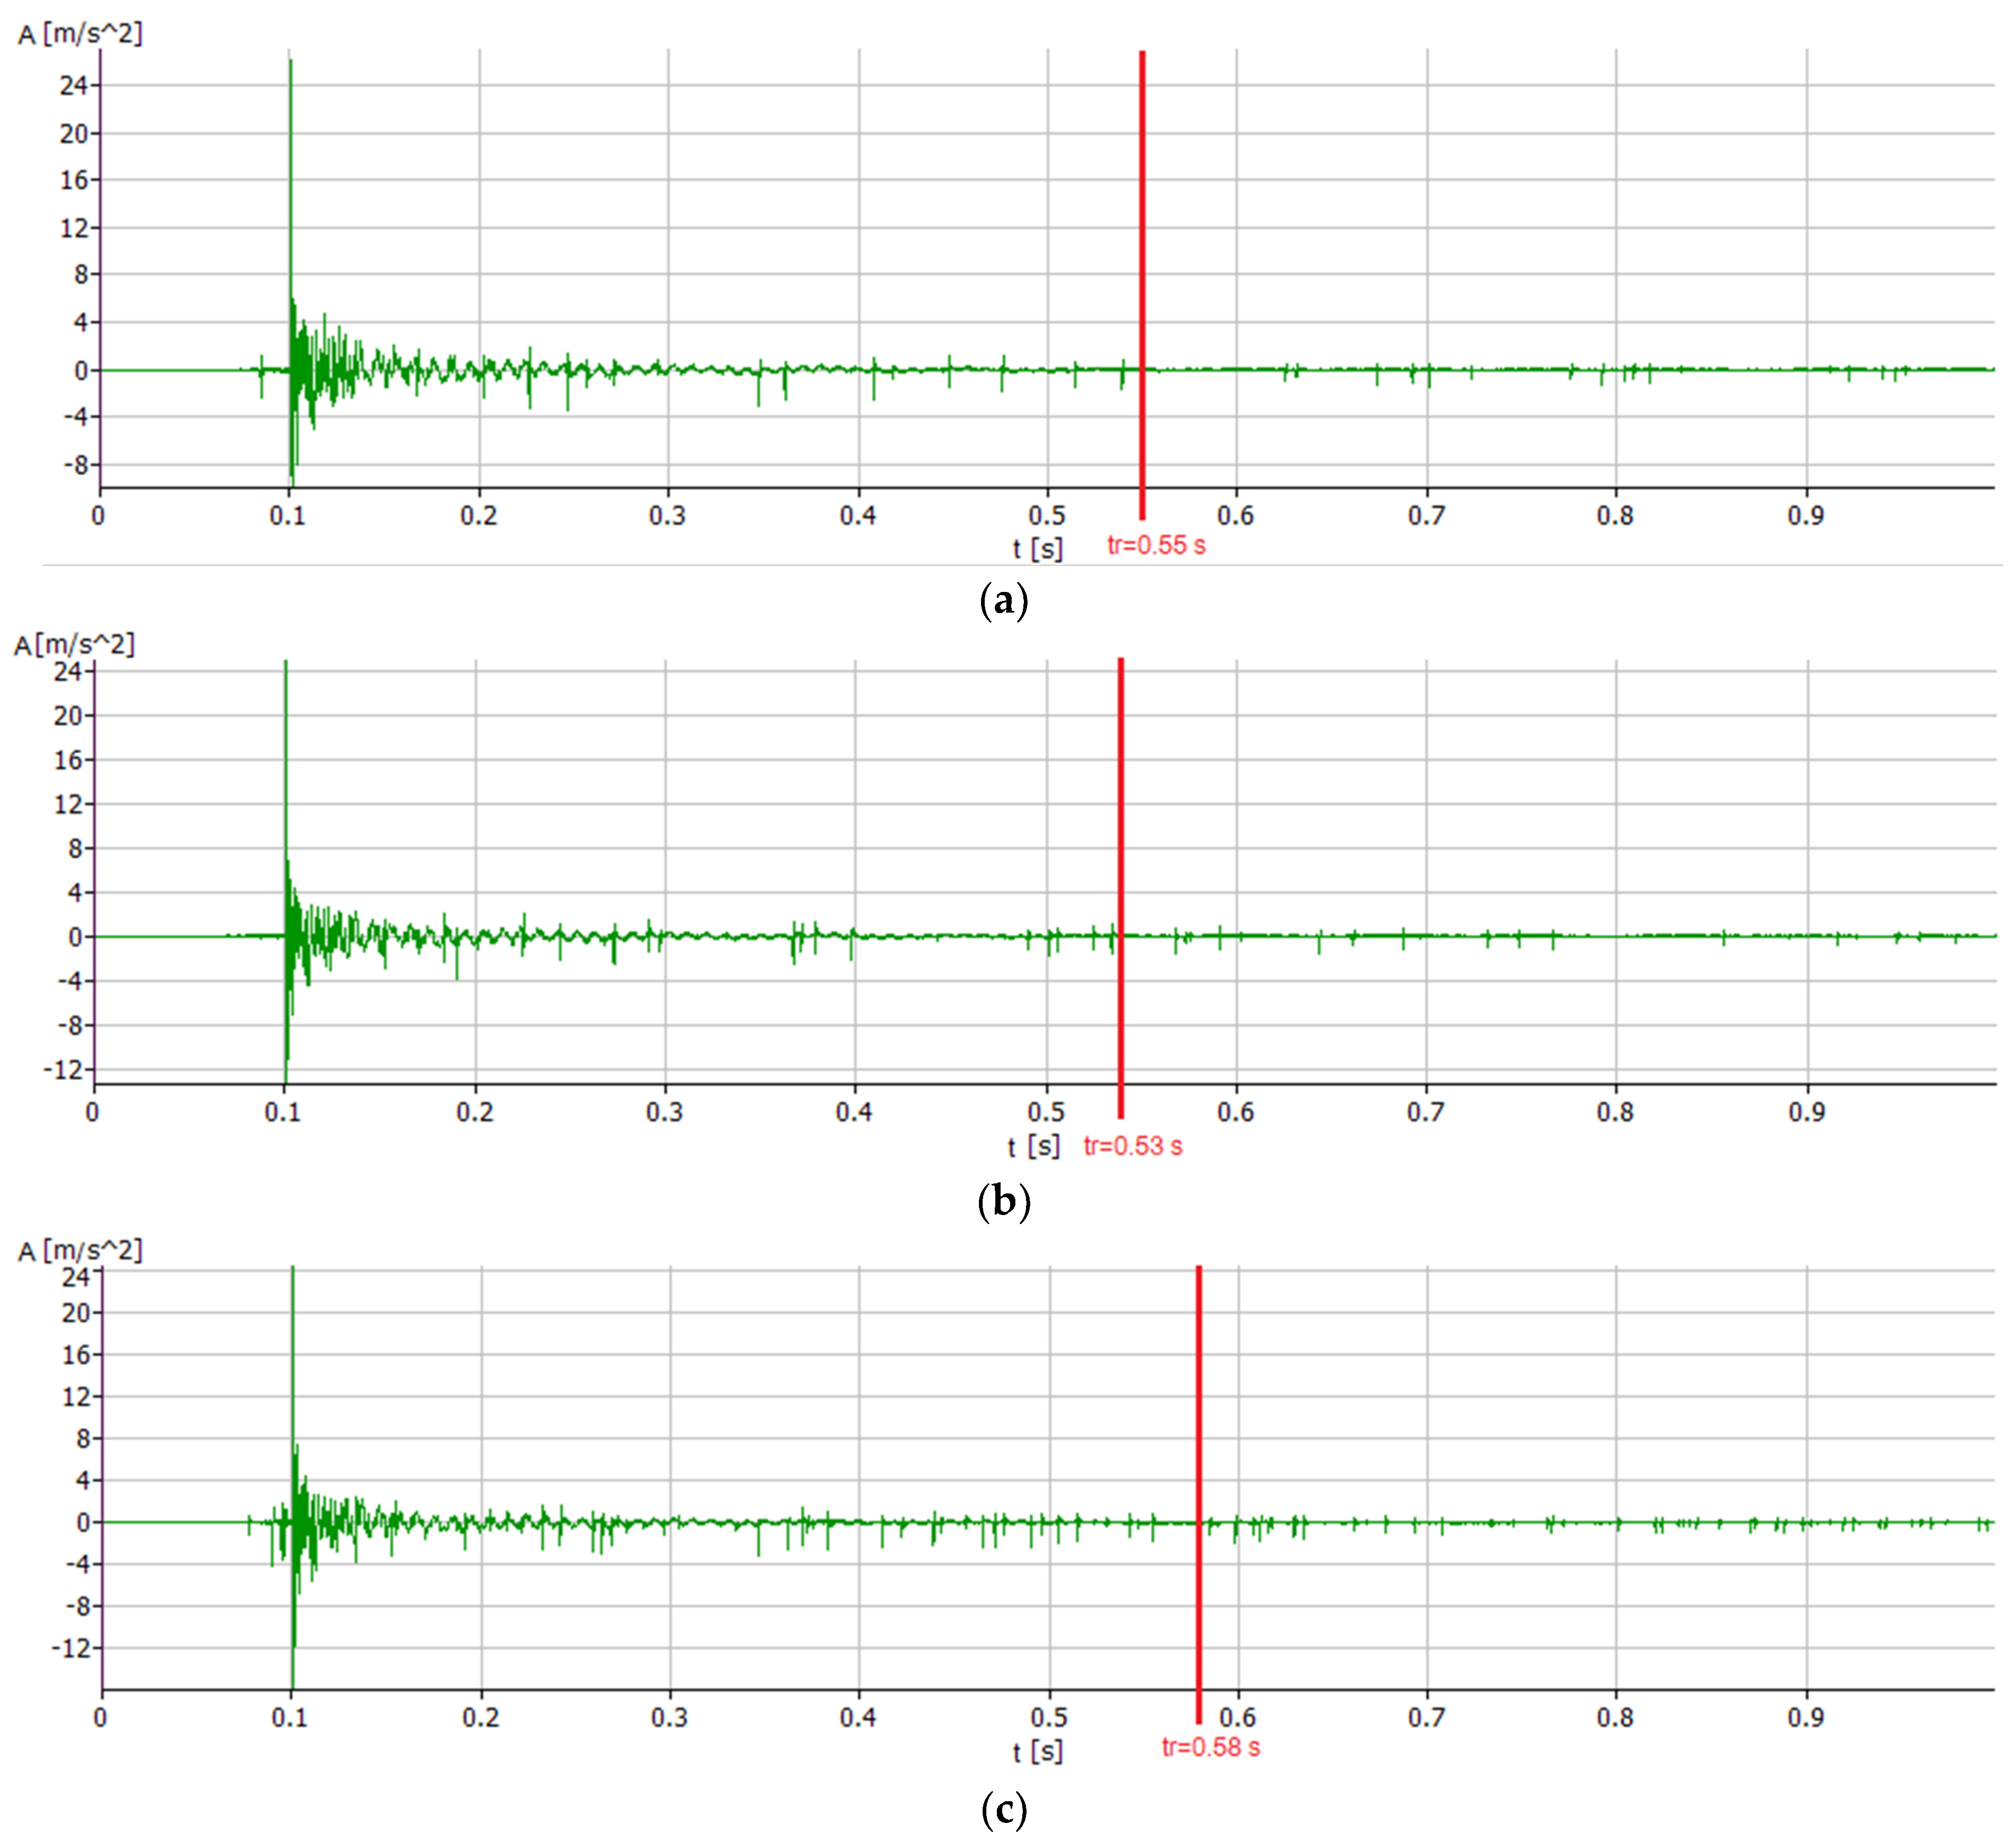
3.2.1. Dynamic Properties
3.2.2. Static Properties
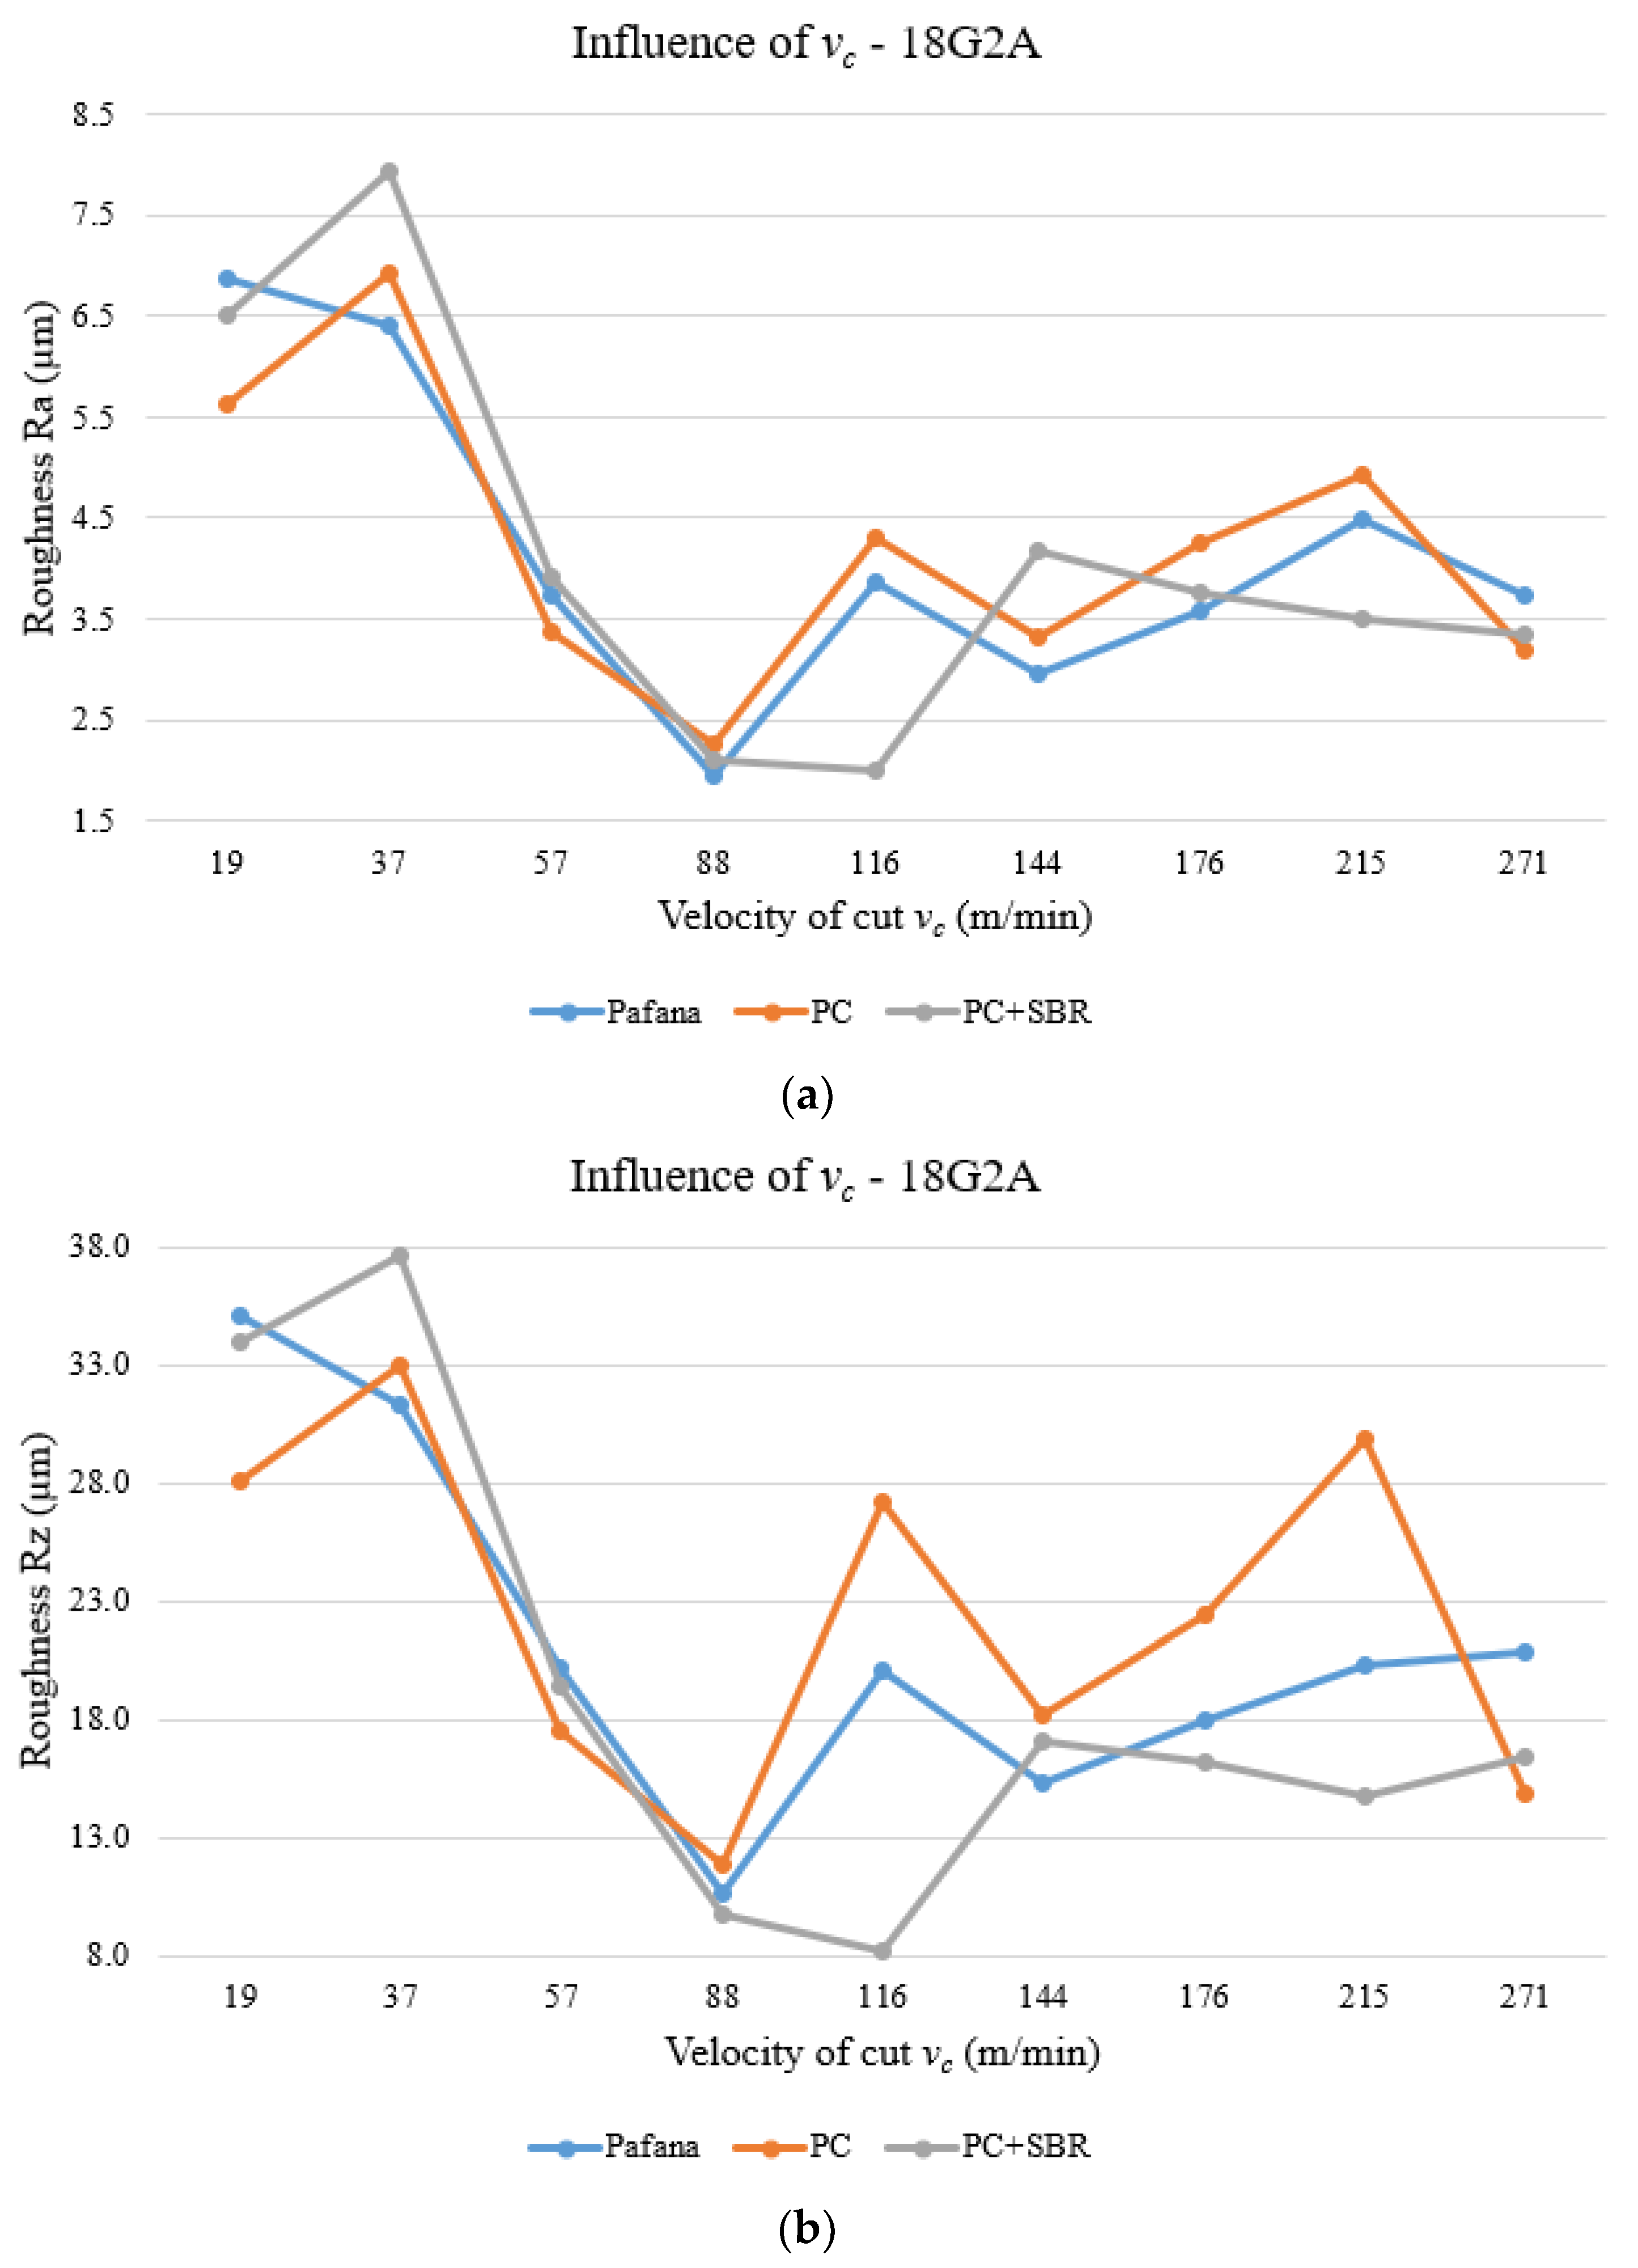
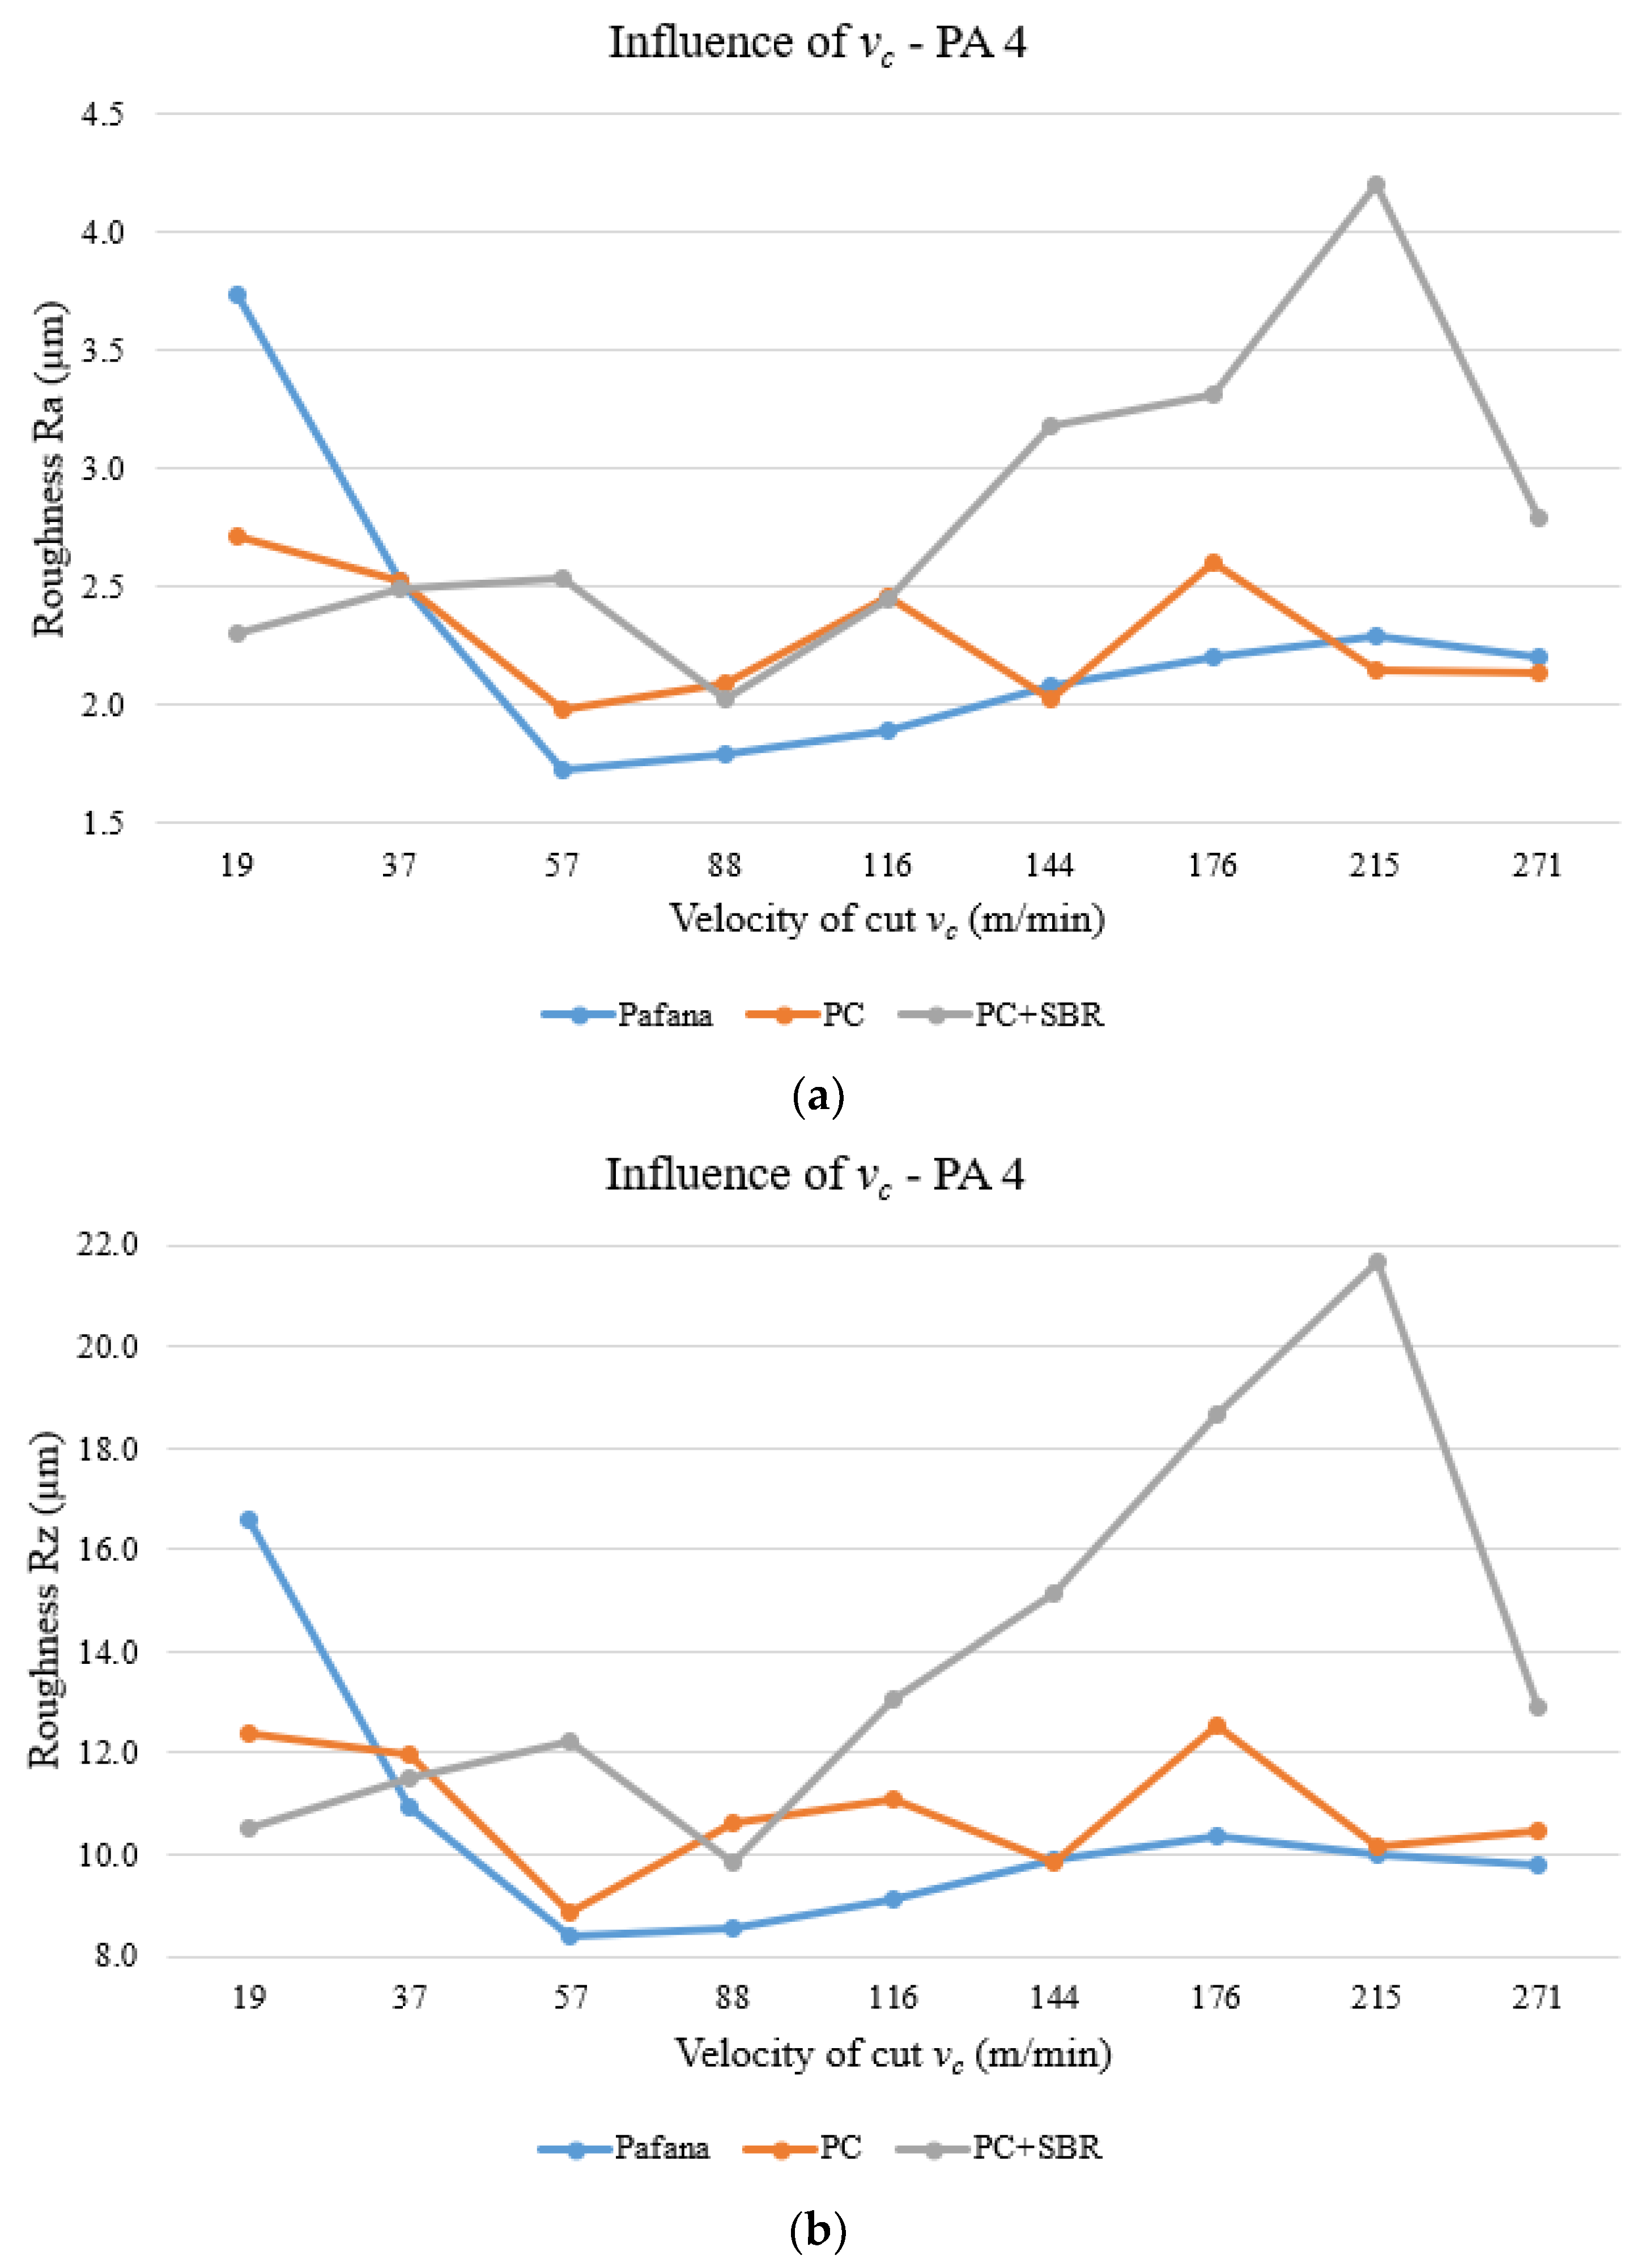
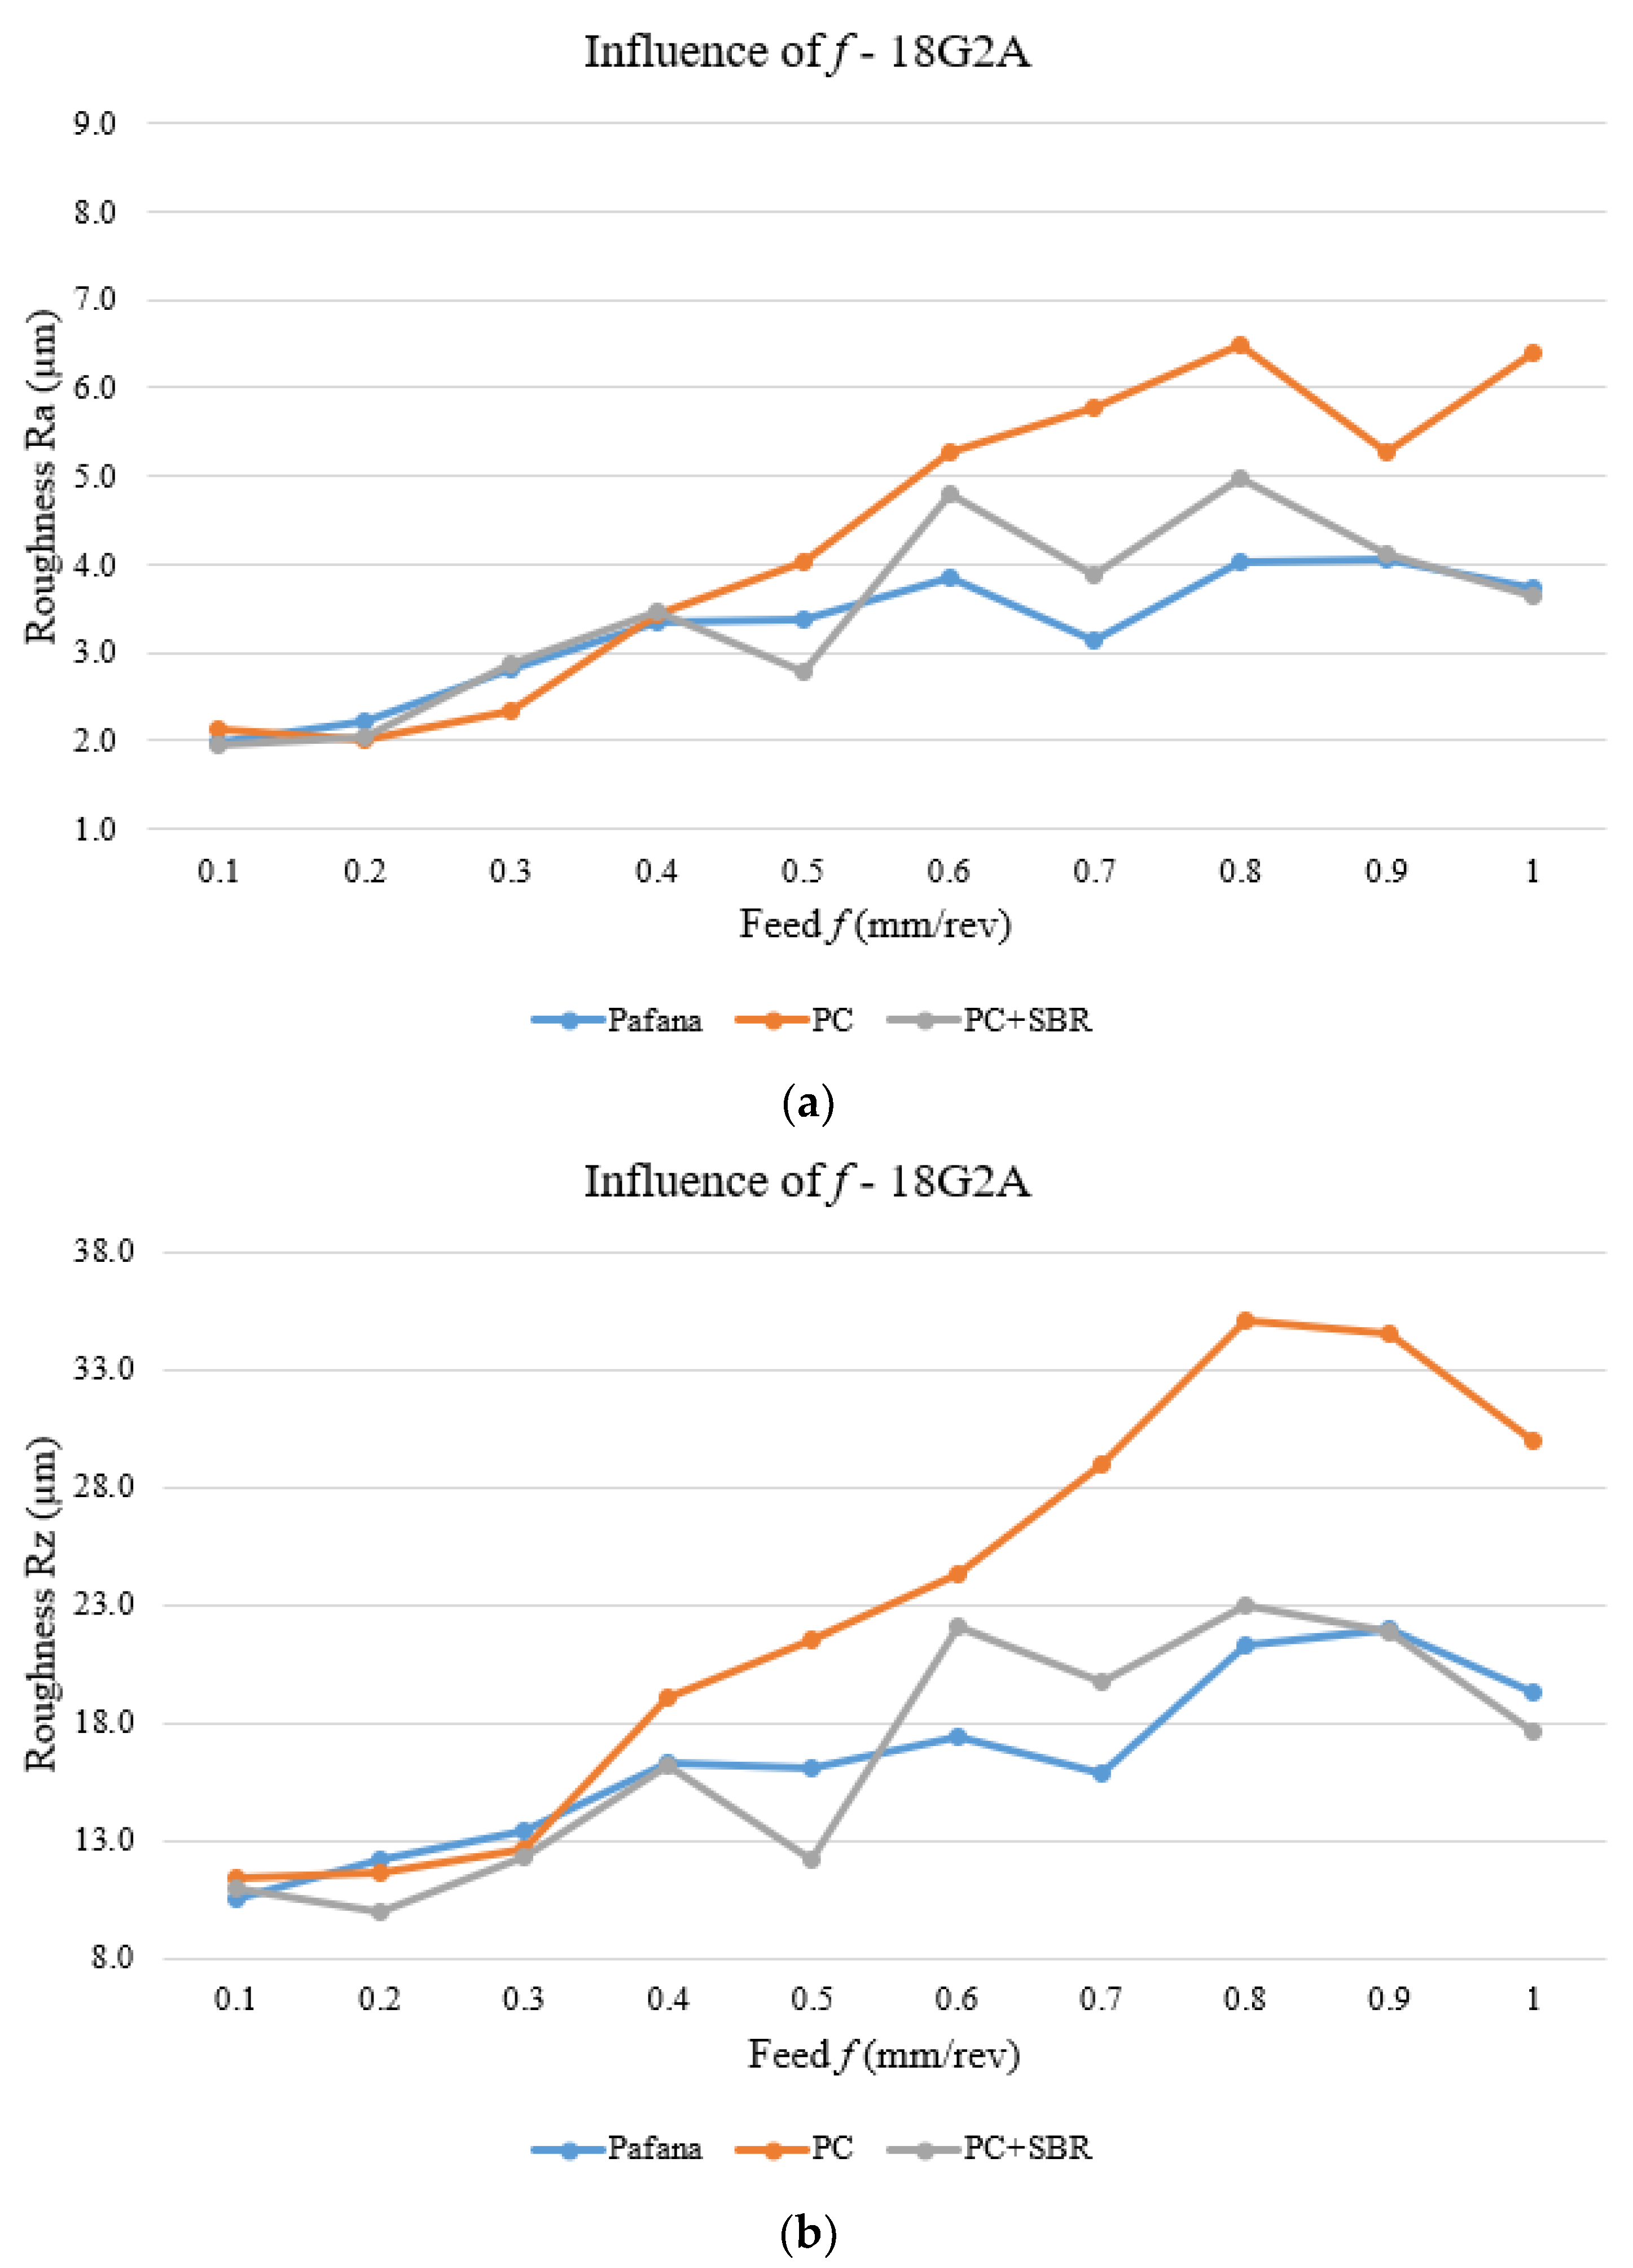
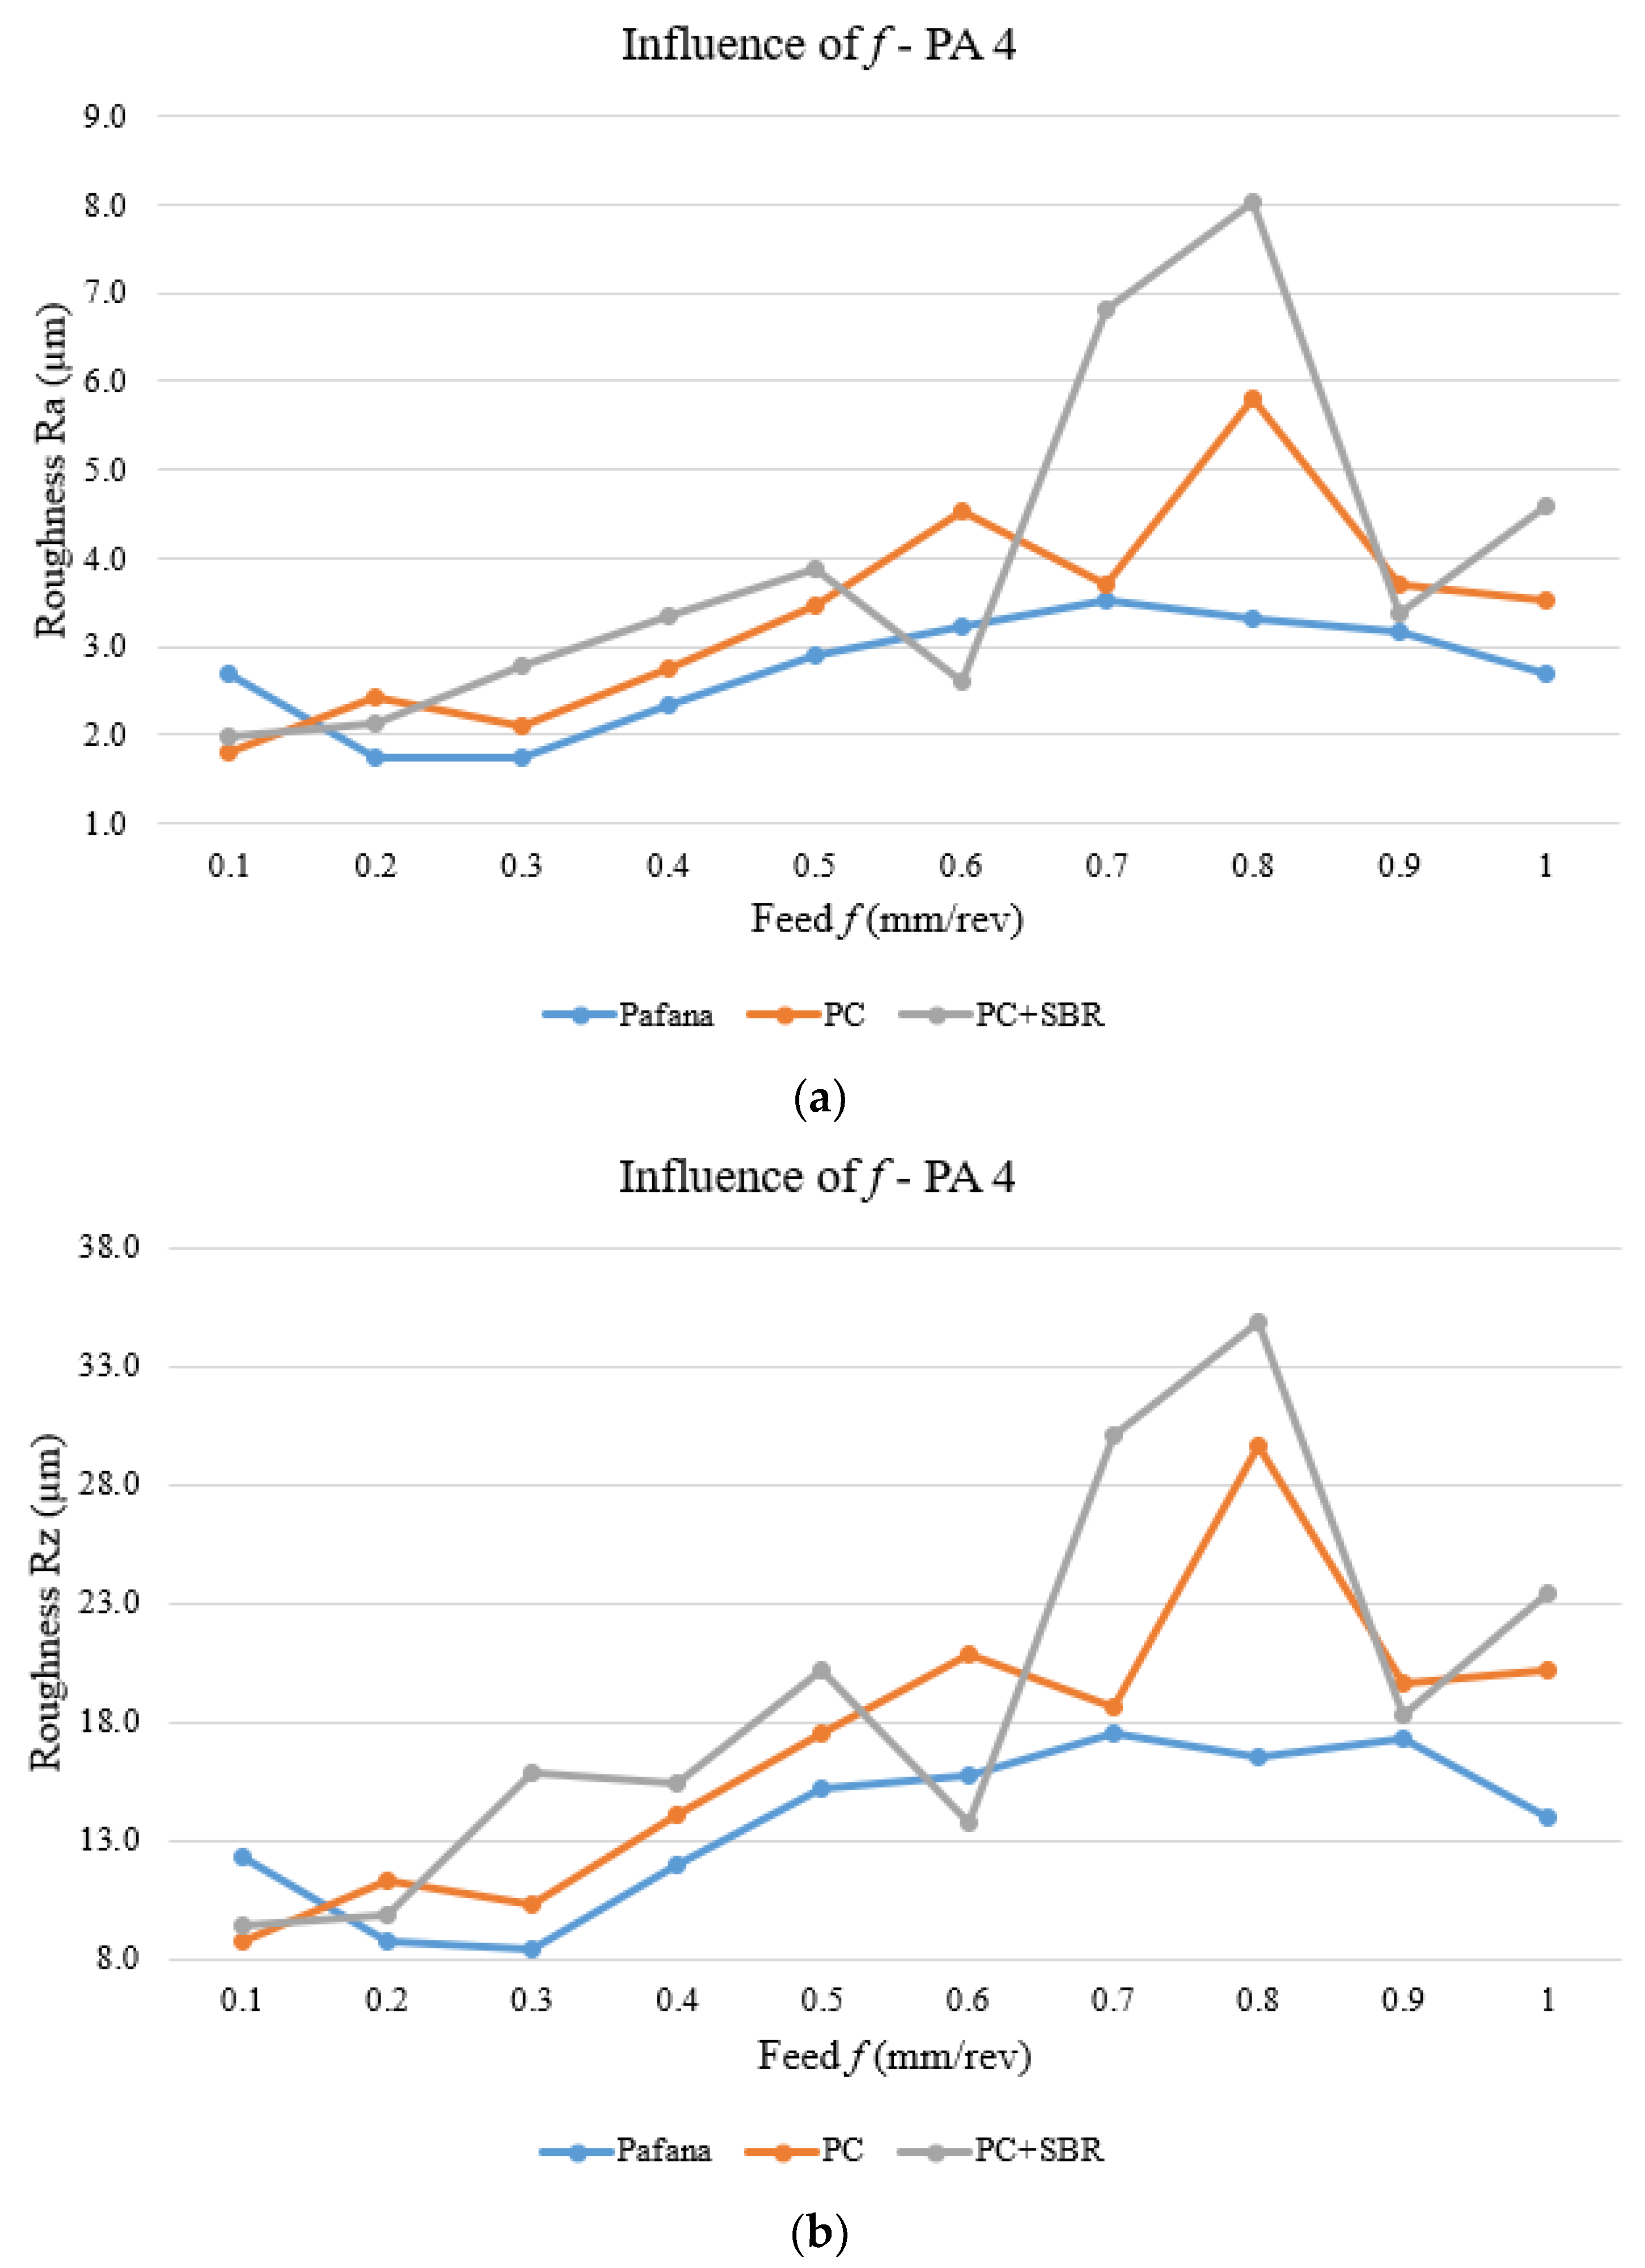
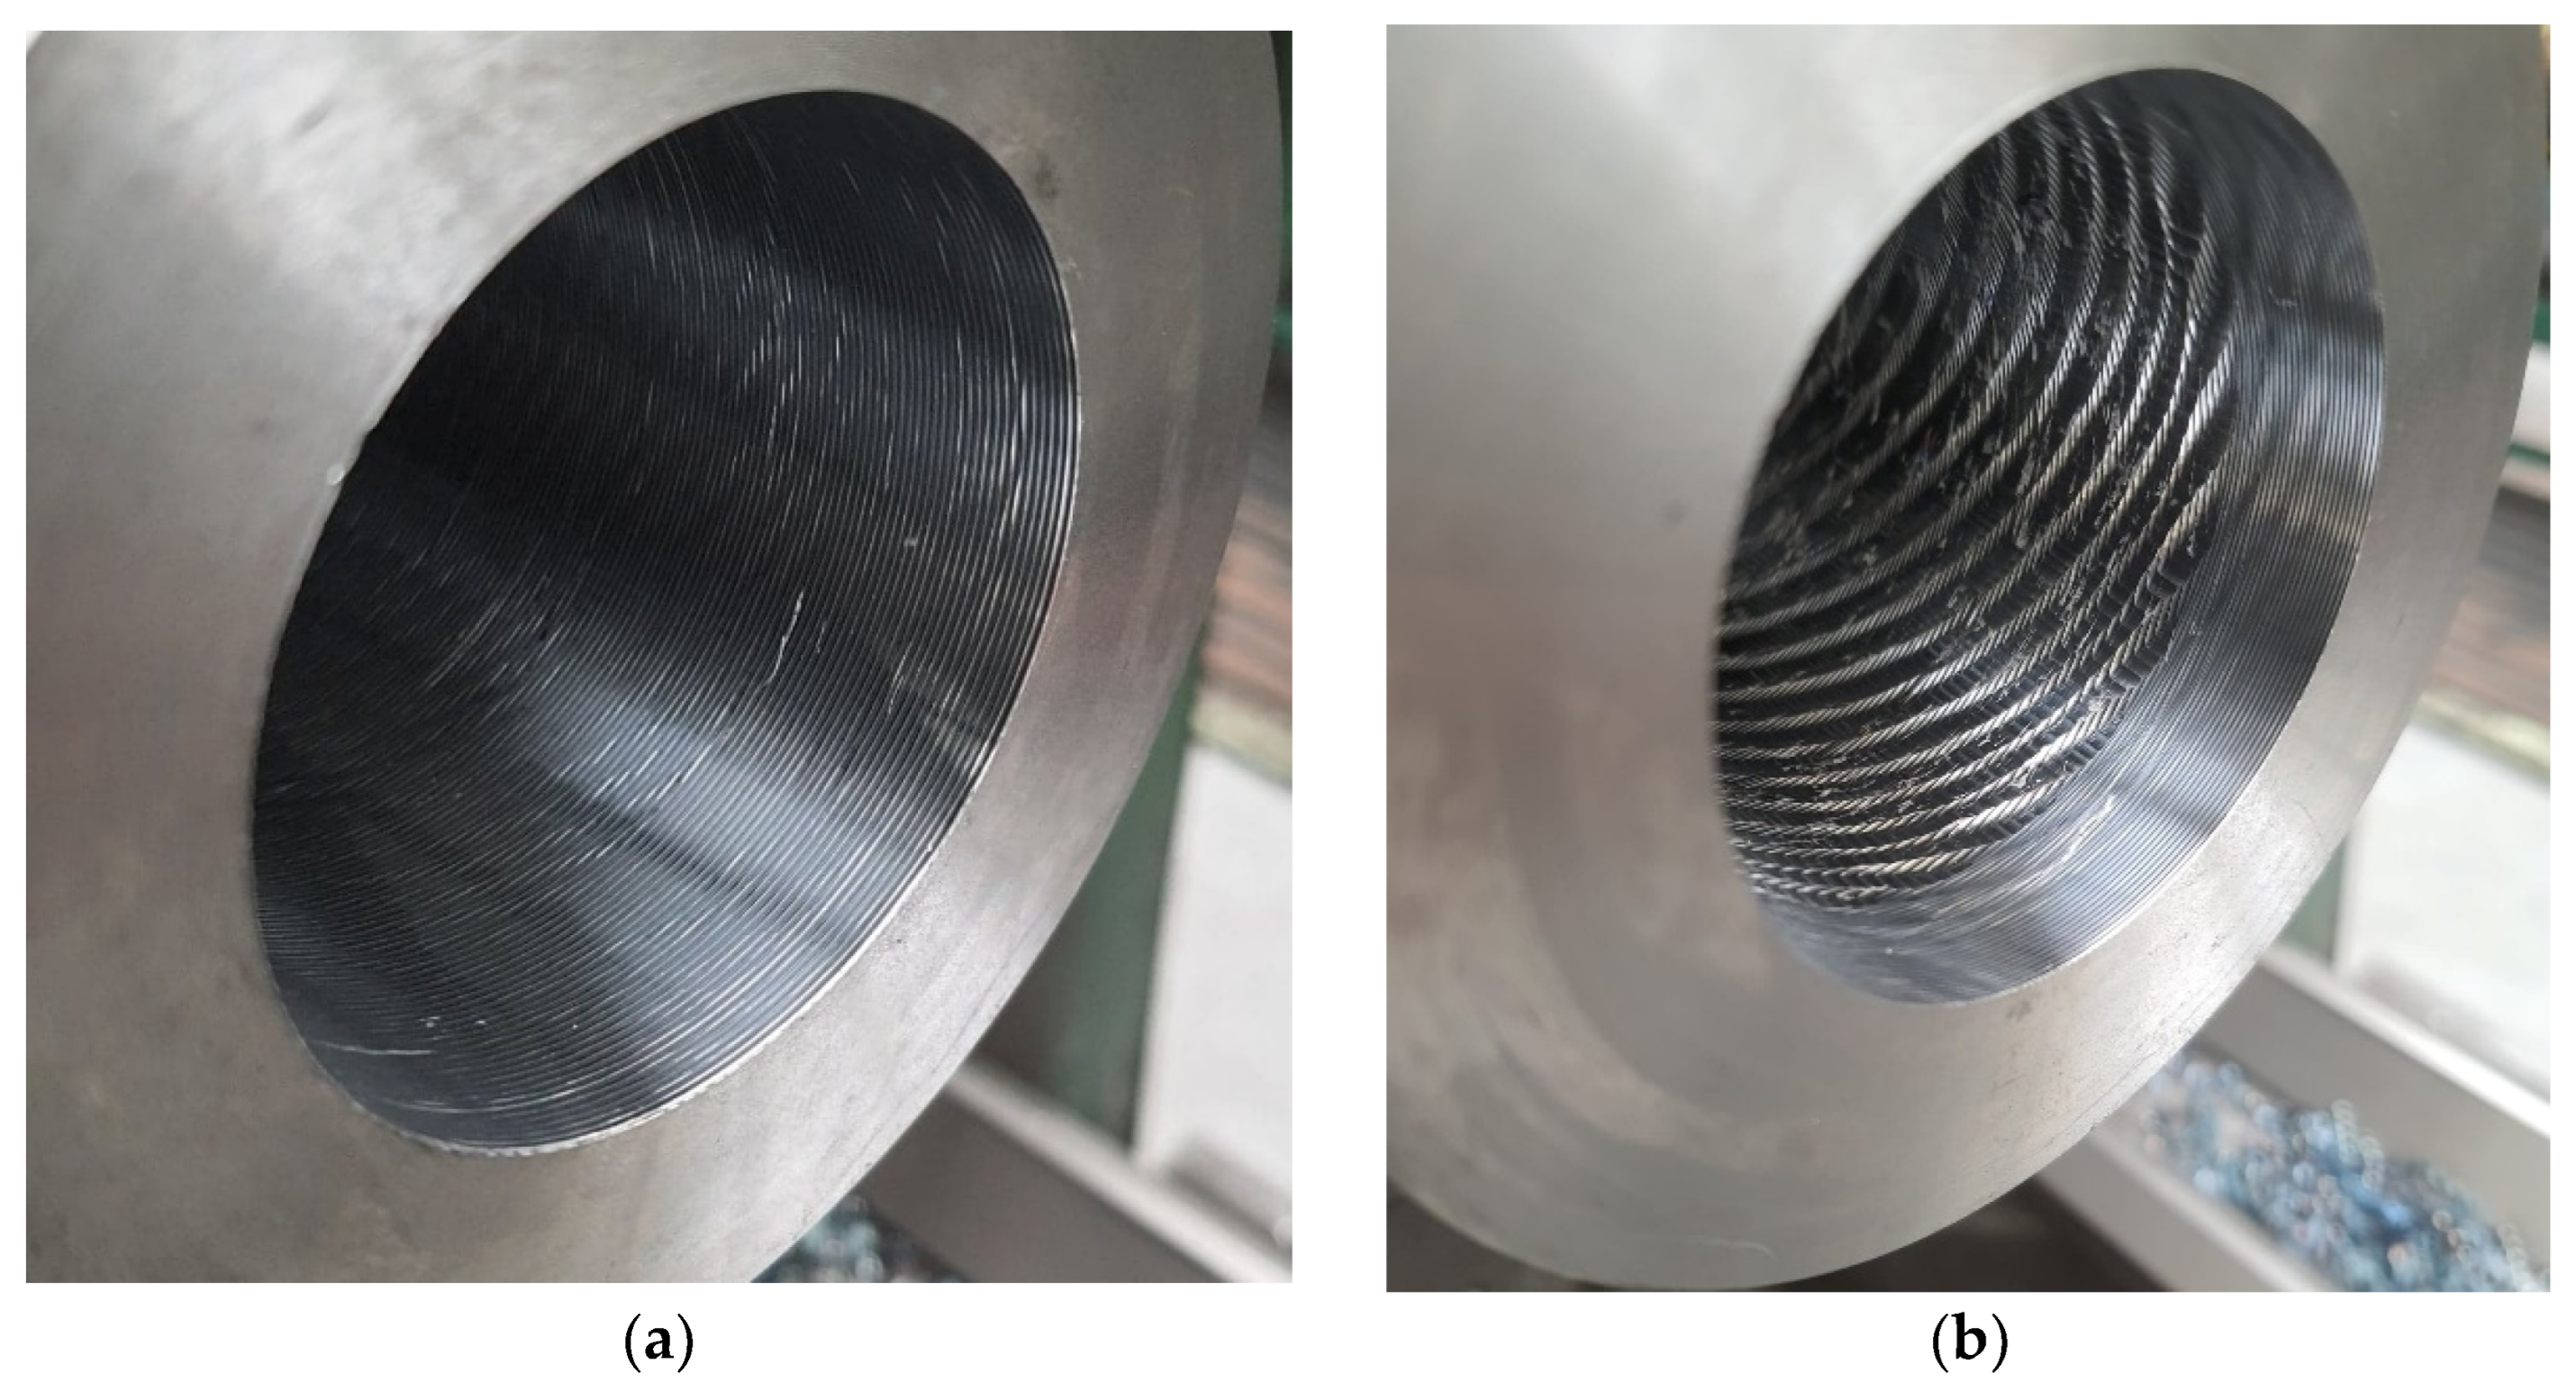
3.2.3. Operational Properties
- Cutting speed vc = 19 ÷ 271 m/min;
- Feed rate f = 0.1 ÷ 1 mm/rev;
- Depth of cut ap = 0.5 ÷ 2 mm.
4. Summary and Conclusions
- The numerical study showed that a suitable material for the core in the prototype boring bar is polymer concrete (PC) or polymer concrete combined with rubber (PC + SBR);
- The numerical study showed that a suitable design of the prototype tool would be a tool with a core size of d = 25 mm and l = 200 mm;
- The experimental study showed that for almost all characterized modes of vibration there was an increase in dynamic properties understood as a decrease in the amplitude of the transition function estimate and an increase in the free vibration damping coefficient for the prototype boring bar compared to the original boring bar;
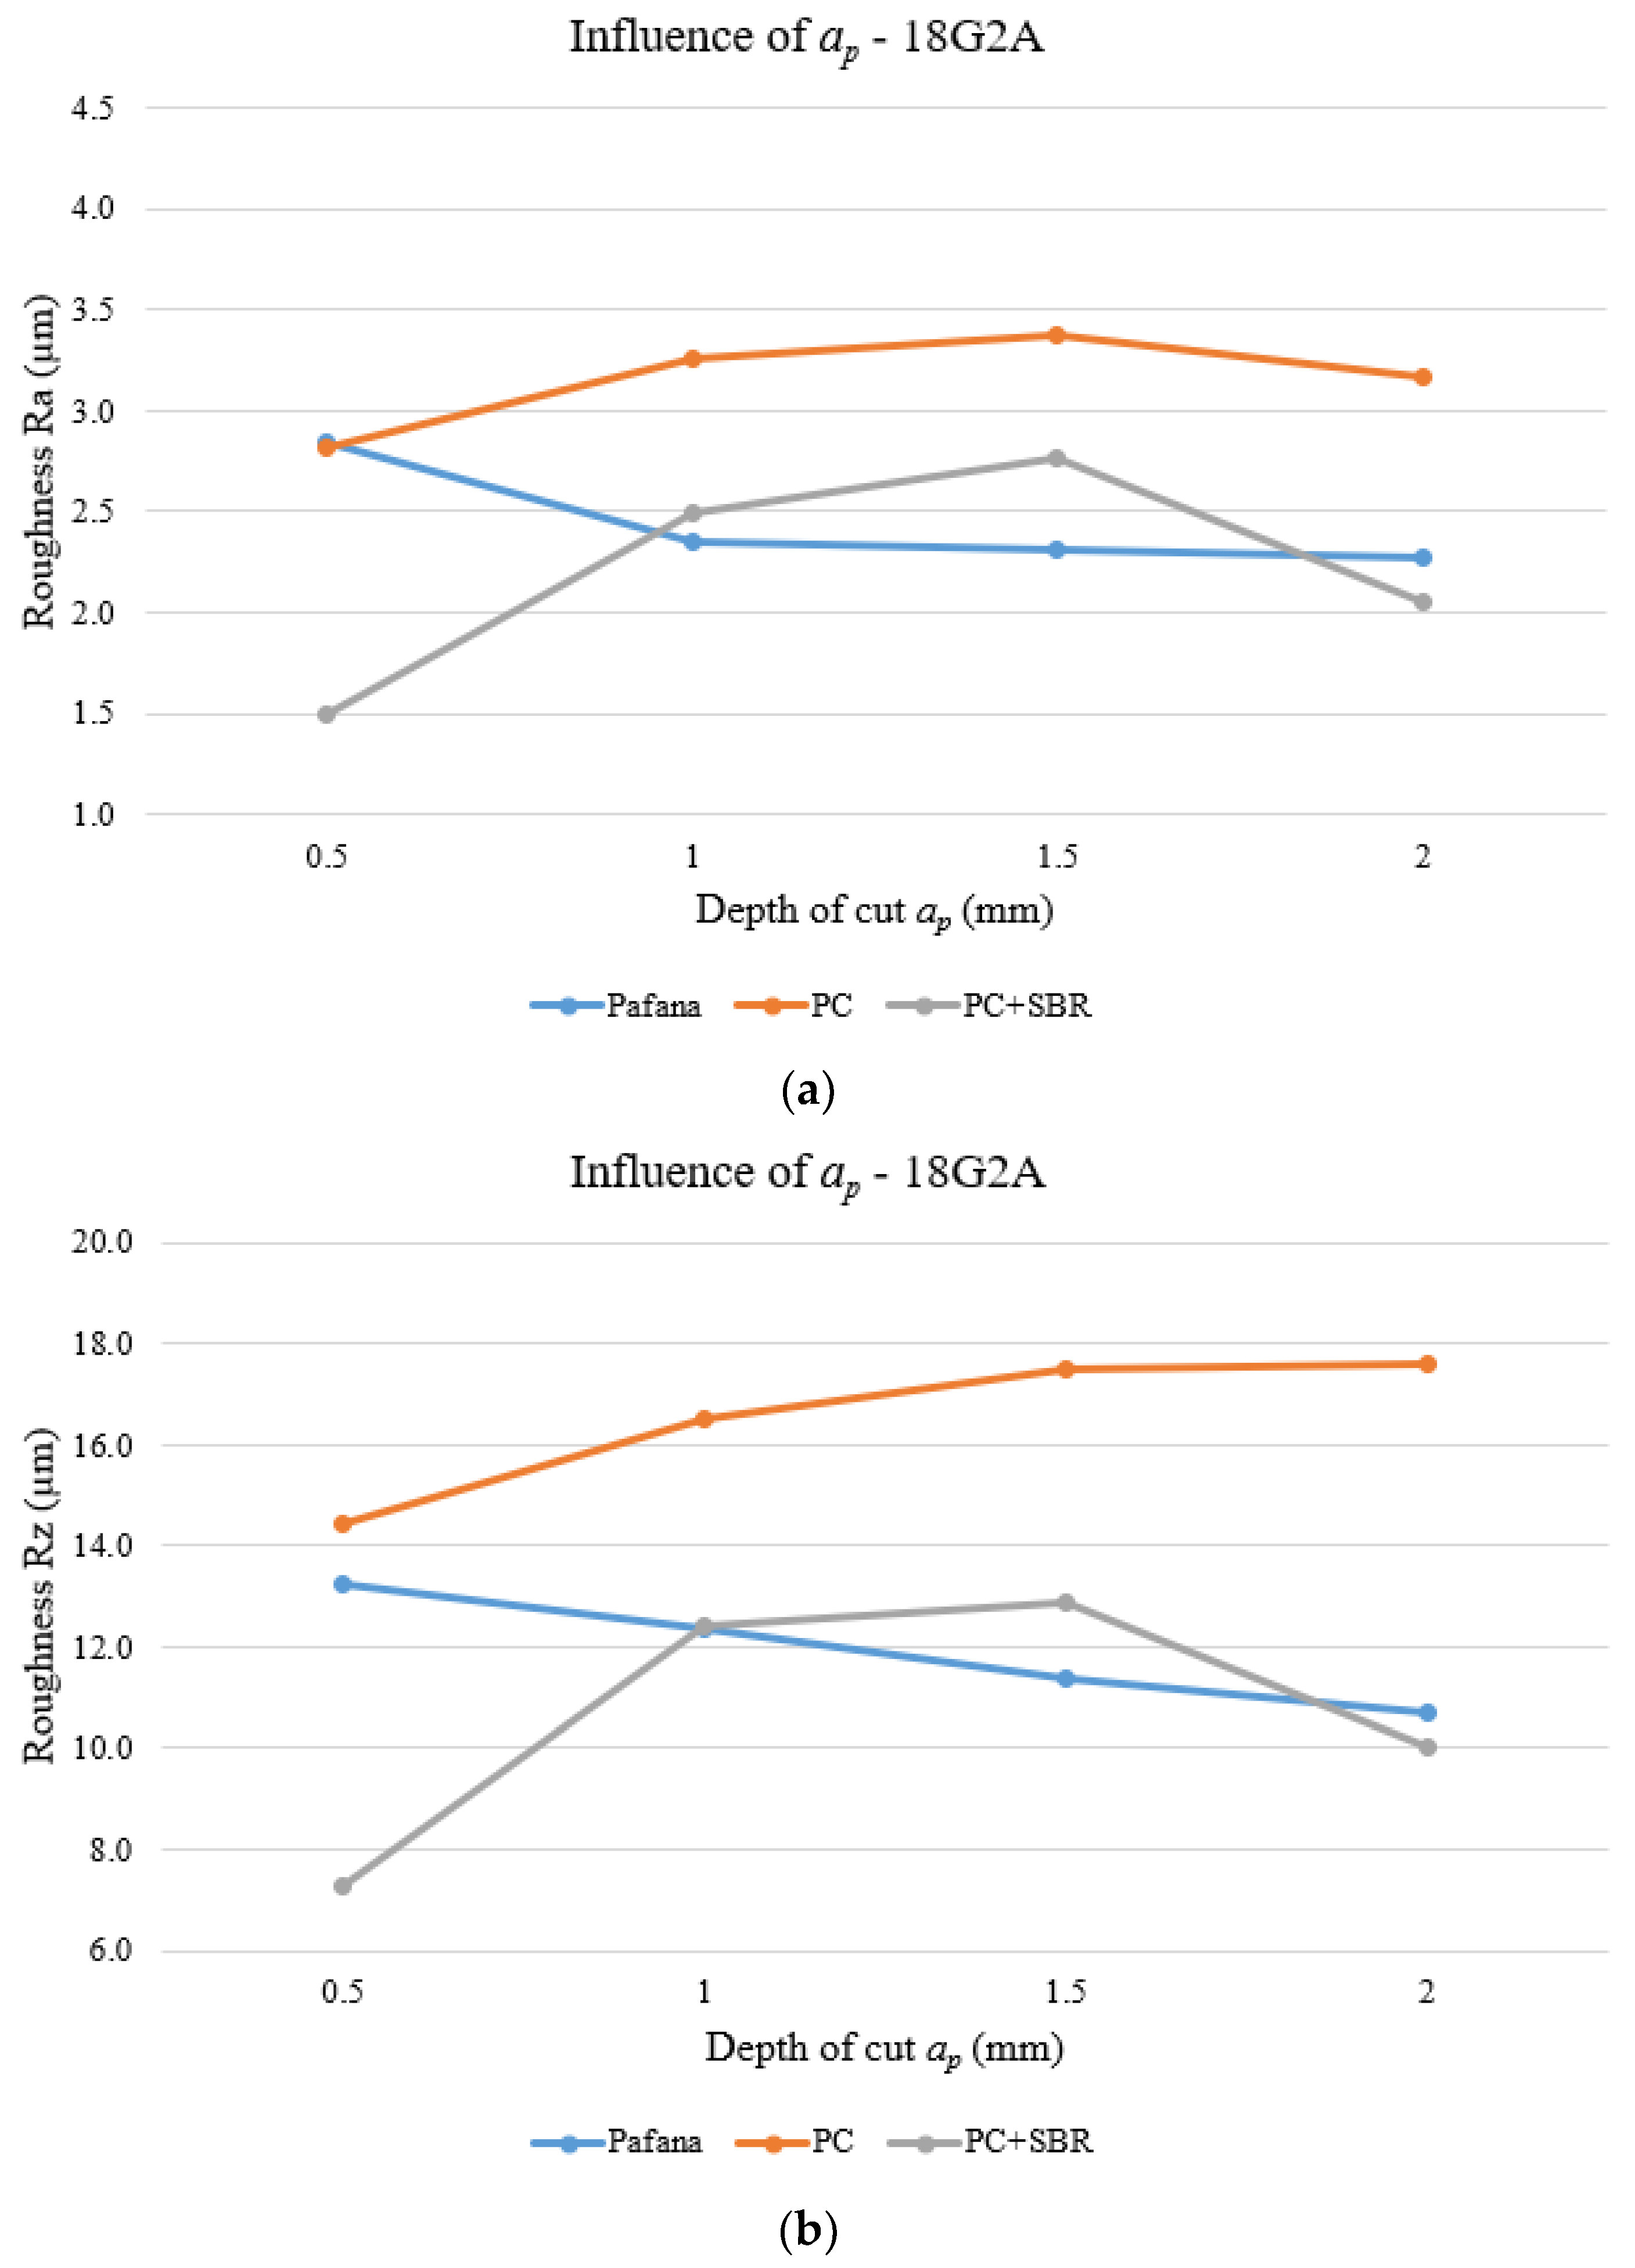
- The operational tests showed that, in practically the whole tested range of cutting speed vc, the value of roughness of the machined surface Ra and Rz was lower for the original boring bar compared to the prototype boring bar;
- The operational tests showed that, in practically the whole examined range of feed rate f, the value of roughness of the machined surface Ra and Rz was lower for the original boring bar compared to the prototype boring bar;
- The operational tests showed that, in practically the whole studied range of depth of cut ap, the value of roughness of the machined surface Ra and Rz was lower for the original boring bar compared to the prototype boring bar.
Author Contributions
Funding
Institutional Review Board Statement
Informed Consent Statement
Data Availability Statement
Conflicts of Interest
References
- Weck, M.; Brecher, C. Werkzeugmaschinen 5. Messtechnische Untersuchung und Beurteilung, Dynamische Stabilität, 7th ed.; Springer: Berlin/Heidelberg, Germany; New York, NY, USA, 2006; Volume 201, pp. 356–366. [Google Scholar]
- Schmitz, T.L.; Smith, K.S. Machining Dynamics. Frequency Response to Improved Productivity; Springer: Boston, MA, USA, 2009; pp. 8–13. [Google Scholar]
- Thorenz, B.; Friedrich, M.; Westermann, H.H.; Dopper, F. Evaluation of the influence of different inner cores on the dynamic behavior of boring bars. Procedia CIRP 2019, 81, 1171–1176. [Google Scholar] [CrossRef]
- Bechcinski, G.; Ewad, H.; Tsiakoumis, V.; Pawlowski, W.; Kepczak, N.; McMillan, A.; Batako, D.L.A. A Model and Application of Vibratory Surface Grinding. J. Manuf. Sci. Eng. 2018, 140, 101011. [Google Scholar] [CrossRef]
- Pawłowski, W. Dynamic Model of Oscillation-Assisted Cylindrical Plunge Grinding With Chatter. J. Manuf. Sci. Eng. 2013, 135, 051010. [Google Scholar] [CrossRef]
- Xiao, W.; Zi, Y.; Chen, B.; Li, B.; He, Z. A novel approach to machining condition monitoring of deep hole boring. Int. J. Mach. Tools Manuf. 2014, 77, 27–33. [Google Scholar] [CrossRef]
- Katsuki, A.; Onikura, H.; Sajima, T.; Mohri, A.; Moriyama, T.; Hamana, Y.; Murakami, H. Development of a practical high-performance laser-guided deep-hole boring tool: Improvement in guiding strategy. Precis. Eng. 2011, 35, 221–227. [Google Scholar] [CrossRef]
- Khoroshailo, V.; Kovalov, V.; Predrag, D. Improving of Vibration Resistance of Boring Tools by Big Diameter Holes Tooling on Lathe. Procedia Technol. 2016, 22, 153–160. [Google Scholar] [CrossRef][Green Version]
- Orgiyan, A.; Oborskyi, G.; Ivanov, V.; Tonkonogyi, V.; Balaniuk, A. Features of Flexural-Torsional Oscillations of Cantilever Boring Bars for Fine Boring of Deep Holes with Small Diameters. In Grabchenko’s International Conference on Advanced Manufacturing Processes; Lecture Notes in Mechanical Engineering; Springer: Cham, Switzerland, 2022; pp. 98–108. [Google Scholar]
- Product Catalogue PAFANA. Available online: https://pafana.pl/wp-content/uploads/2021/04/11-133_noze_tokarskie_skladane_96dpi_07_2020.pdf (accessed on 13 May 2022).
- Kępczak, N.; Bechciński, G.; Rosik, R. Experimental verification of the deep hole boring bar model. Eksploat. Niezawodn. Maint. Reliab. 2021, 23, 55–62. [Google Scholar] [CrossRef]
- Broschüre Mineralguss EPUMENT. Available online: https://www.rampf-group.com/fileadmin/rampf-gruppe.de/media/machine_systems/downloads/Mineral-casting-EPUMENT-EN.pdf (accessed on 18 May 2022).
- Ferdous, W.; Manalo, A.; Aravinthan, T. Bond behaviour of composite sandwich panel and epoxy polymer matrix: Taguchi design of experiments and theoretical predictions. Constr. Build. Mater. 2017, 145, 76–87. [Google Scholar] [CrossRef]
- Agavriloaie, L.; Oprea, S.; Barbuta, M.; Luca, F. Characterisation of polymer concrete with epoxy polyurethane acryl matrix. Constr. Build. Mater. 2012, 37, 190–196. [Google Scholar] [CrossRef]
- Ferdous, W.; Bai, Y.; Almutairi, A.; Satasivam, S.; Jeske, J. Modular assembly of water-retaining walls using GFRP hollow profiles: Components and connection performance. Compos. Struct. 2018, 194, 1–11. [Google Scholar] [CrossRef]
- Żółtowski, B. Badania Dynamiki Maszyn; Wydawnictwo MAKAR: Bydgoszcz, Poland, 2002. [Google Scholar]
- Pawłowski, W. Wibracyjne Szlifowanie Wgłębne Wałków; Zeszyty Naukowe Politechniki Łódzkiej, Nr 654; Rozprawy Naukowe; Wydawnictwo Politechniki Łódzkiej: Łódź, Polska, 2010. [Google Scholar]
- Pawłowski, W.; Kaczmarek, Ł.; Louda, P. Theoretical and experimental modal analysis of the cylinder unit filled with pur foam. Eksploat. Niezawodn. Maint. Reliab. 2016, 18, 428–435. [Google Scholar] [CrossRef]
- Krupanek, K.; Staszczyk, A.; Sawicki, J.; Byczkowska, P. The impact of nozzle configuration on the heat transfer coefficient. Arch. Mater. Sci. Eng. 2018, 3, 16–24. [Google Scholar] [CrossRef]
- Kilikevičius, A.; Rimša, V.; Rucki, M. Investigation of influence of aircraft propeller modal parameters on small airplane performance. Eksploat. Niezawodn. Maint. Reliab. 2020, 22, 1–5. [Google Scholar] [CrossRef]
- Chen, W.H.; Lu, Z.R.; Lin, W.; Chen, S.H.; Ni, Y.Q.; Xia, Y.; Liao, W.Y. Theoretical and experimental modal analysis of the Guangzhou New TV Tower. Eng. Struct. 2011, 33, 3628–3646. [Google Scholar] [CrossRef]
- Falkowicz, K.; Ferdynus, M.; Dębski, H. Numerical analysis of compressed plates with a cut-out operating in the geometrically nonlinear range. Eksploat. Niezawodn. Maint. Reliab. 2015, 17, 222–227. [Google Scholar] [CrossRef][Green Version]
- Ondra, V.; Titurus, B. Theoretical and experimental modal analysis of a beam-tendon system. Mech. Syst. Signal Process. 2019, 132, 55–71. [Google Scholar] [CrossRef]
- Product Data. DeltaTron® Accelerometers—Types 4514, 4514-001, 4514-002, 4514-004, 4514-B, 4514-B-001, 4514-B-002 and 4514-B-004, Brüel&Kjær. 2006. Available online: https://www.bksv.com/media/doc/bp2066.pdf (accessed on 7 June 2022).
- Product Data. Impact Hammers—Types 8206, 8206-001, 8206-002 and 8206-003, Brüel&Kjær. 2005. Available online: https://www.bksv.com/media/doc/bp2078.pdf (accessed on 7 June 2022).
- Altintas, Y. Manufacturing Automation: Metal Cutting Mechanics, Machine Tool Vibrations, and CNC Design; Cambridge University Press: Cambridge, UK, 2012. [Google Scholar]
- Ma, J.; Xu, J.; Li, L.; Liu, X.; Gao, M. Analysis of Cutting Stability of a Composite Variable-Section Boring Bar with a Large Length-to-Diameter Ratio Considering Internal Damping. Materials 2022, 15, 5465. [Google Scholar] [CrossRef] [PubMed]
- Alammari, Y.; Sanati, M.; Freiheit, T.; Park, S.S. Investigation of Boring Bar Dynamics for Chatter Suppression. Procedia Manuf. 2015, 1, 768–778. [Google Scholar] [CrossRef]
- Chen, F.; Lu, X.; Altintas, Y. A novel magnetic actuator design for active damping of machining tools. Int. J. Mach. Tools Manuf. 2014, 85, 58–69. [Google Scholar] [CrossRef]
- Li, W.; Zheng, H.; Feng, Y. Optimization of Cutting Parameters for Deep Hole Boring of Ti-6Al-4V Deep Bottle Hole. Materials 2023, 16, 5286. [Google Scholar] [CrossRef] [PubMed]


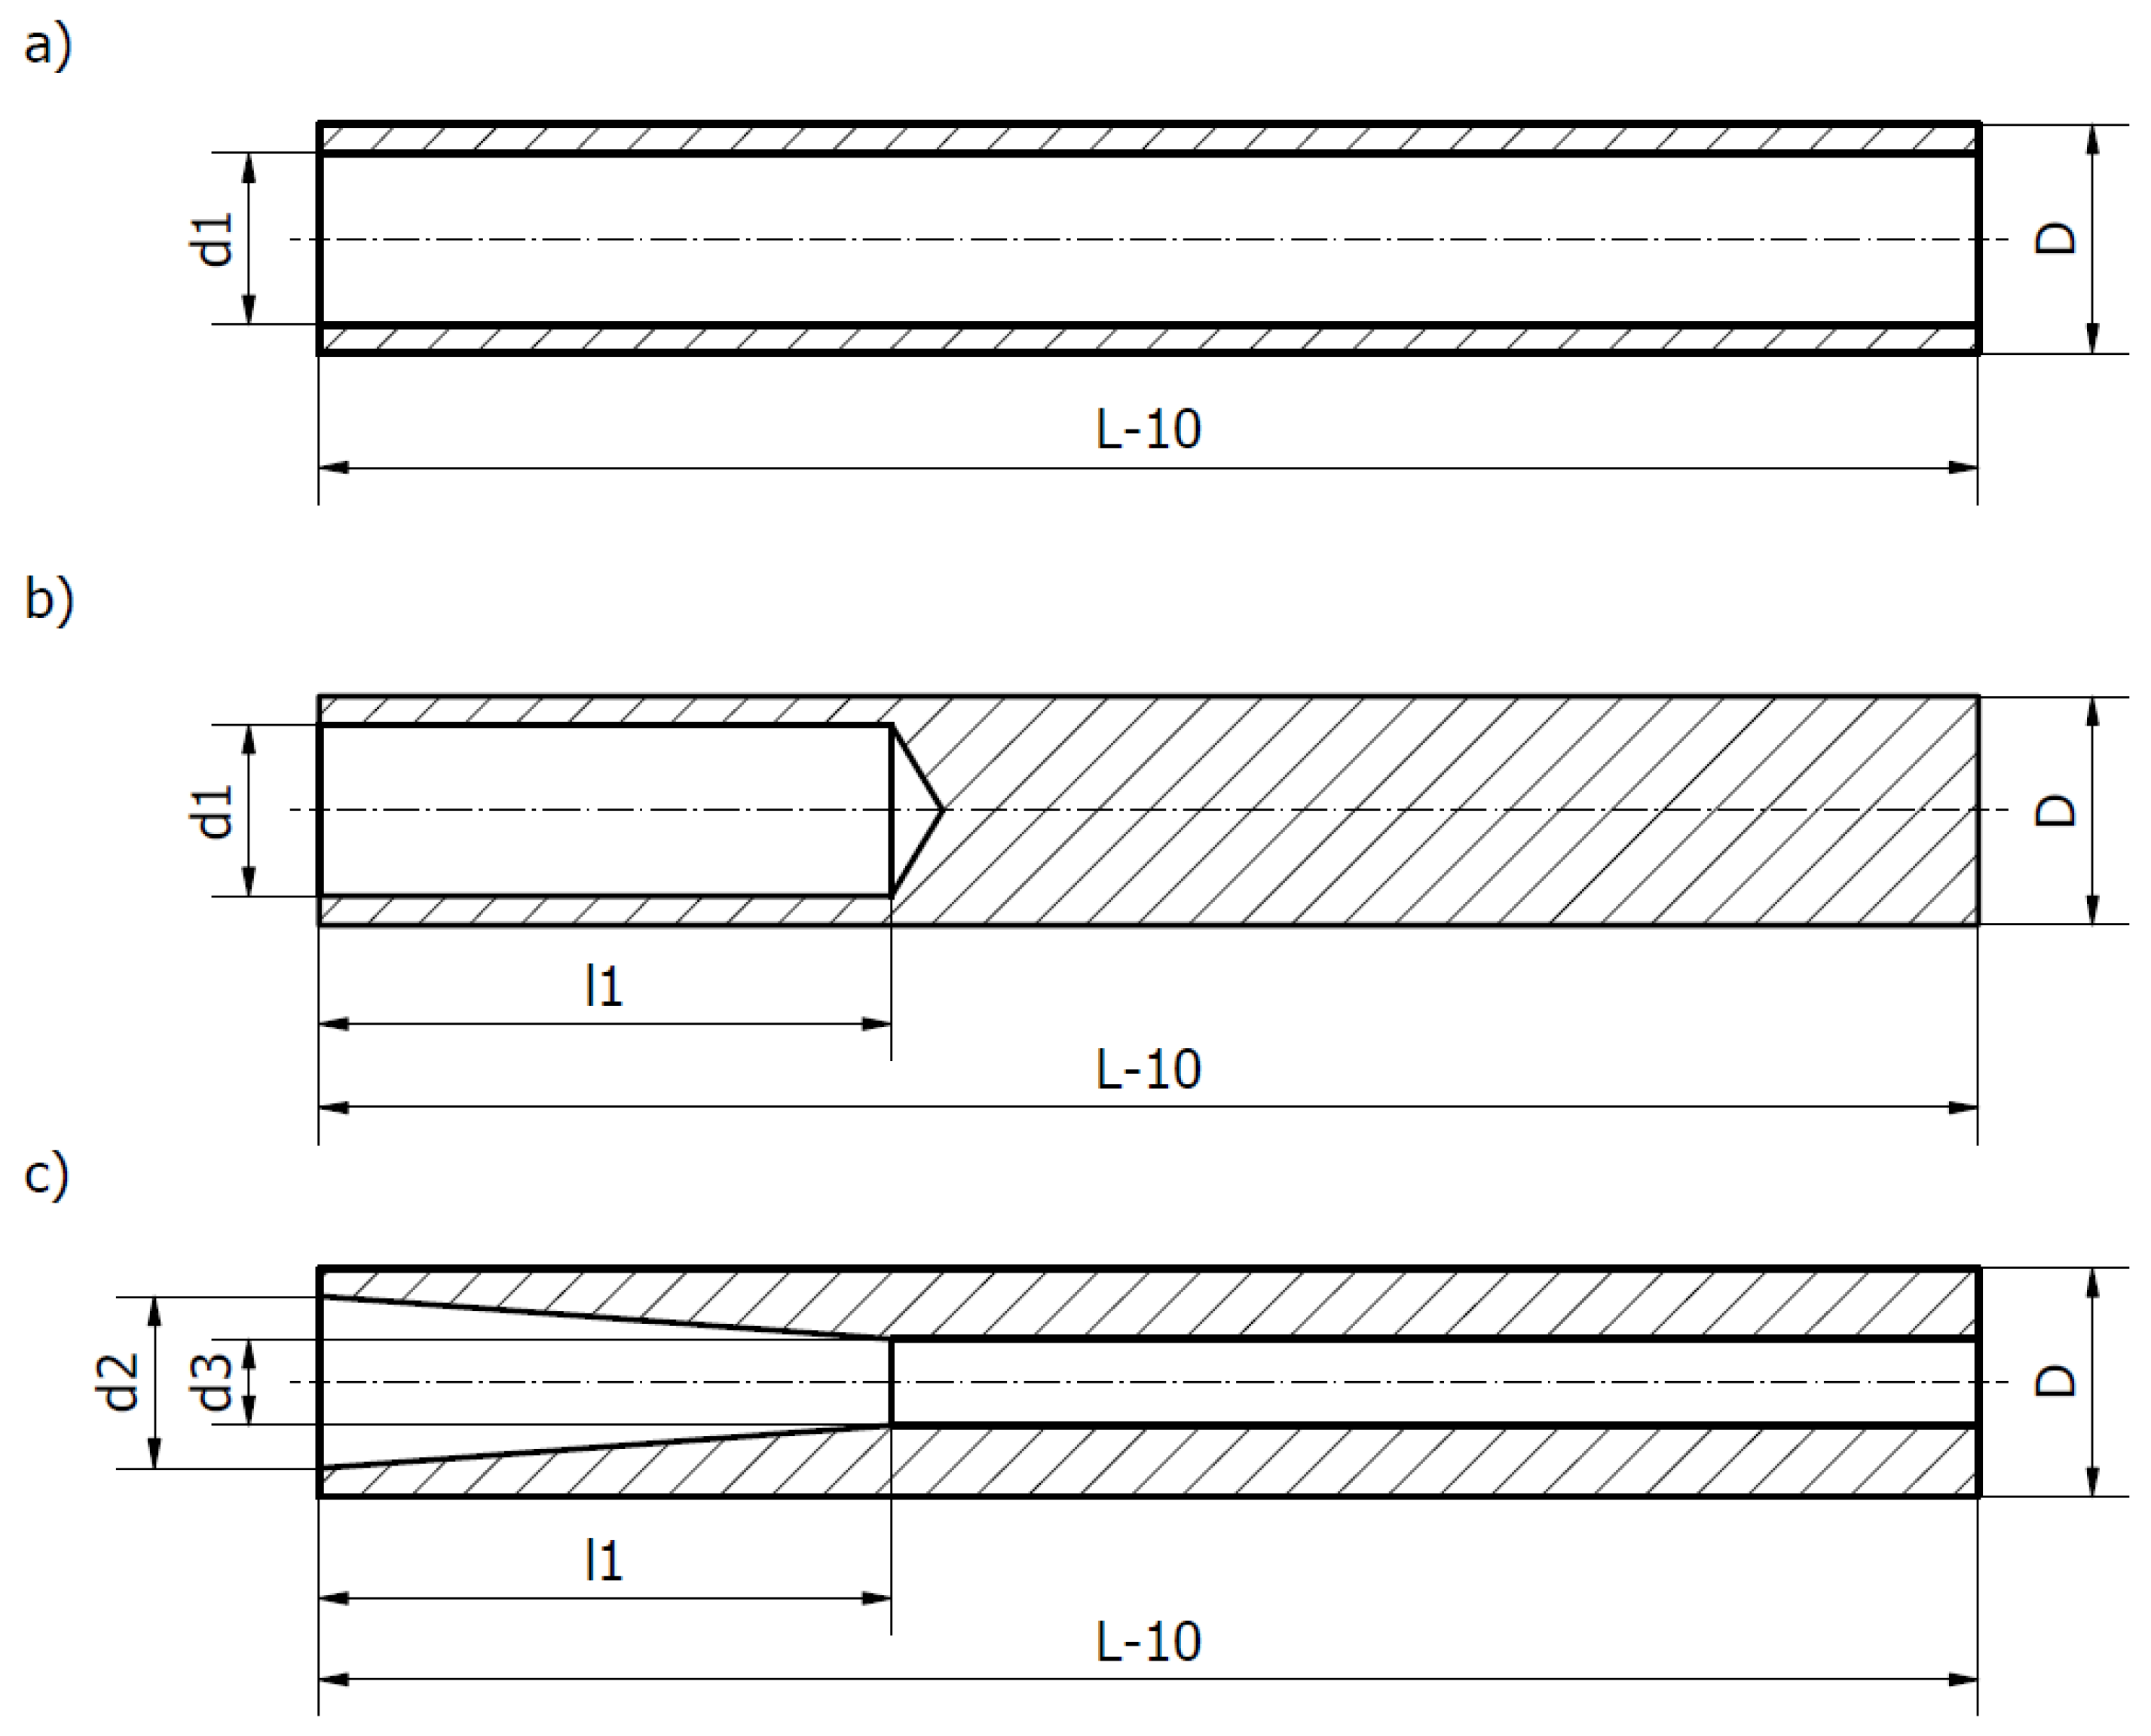
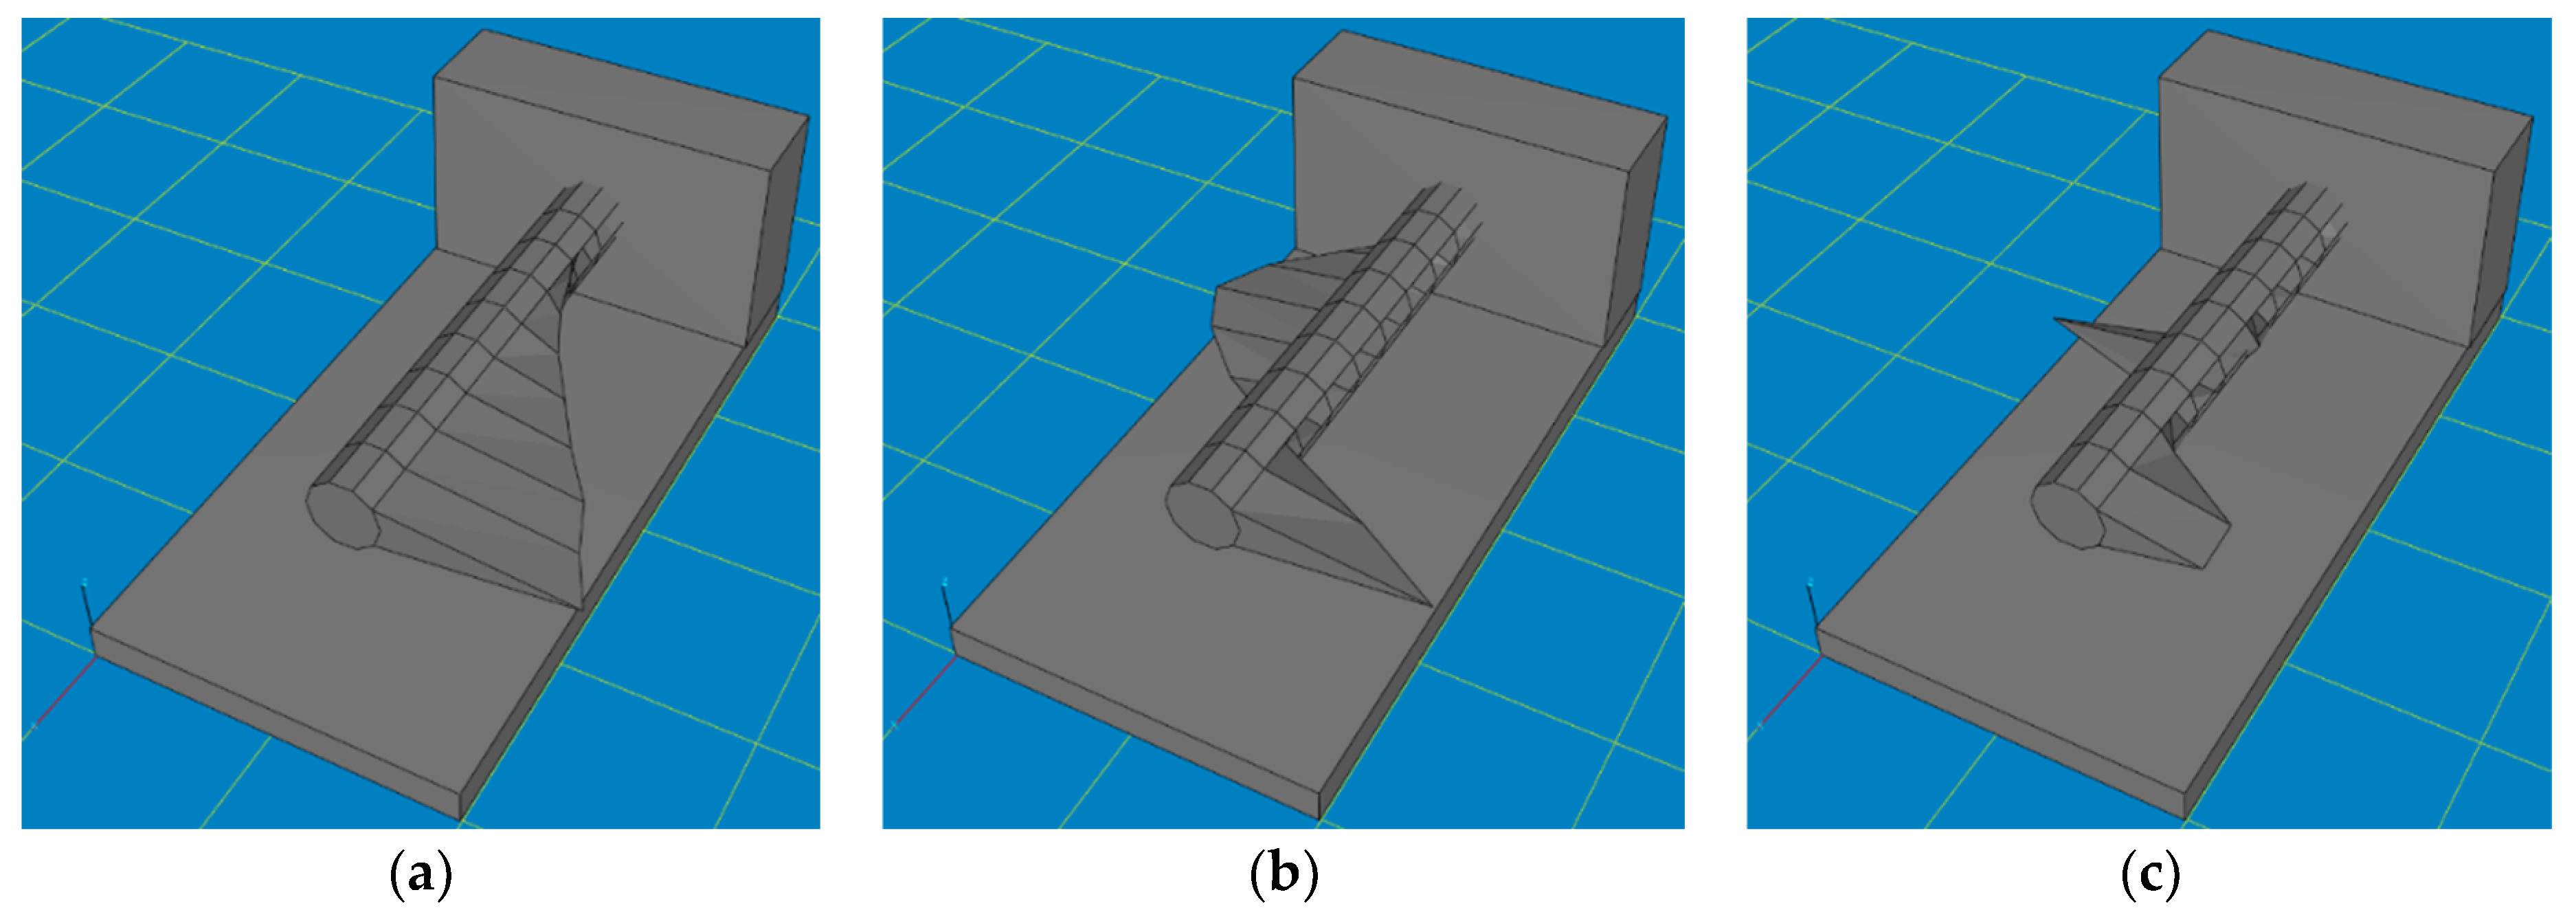
| Type of Hole | D (mm) | L (mm) | d1 (mm) | d2 (mm) | d3 (mm) | l1 (mm) |
|---|---|---|---|---|---|---|
| Through hole | 40 | 300 | 10, 20, 30 | - | - | - |
| Bind hole | 40 | 300 | 10, 20, 30 | - | - | 100, 200 |
| Tapered hole | 40 | 300 | - | 20, 30 | 10, 20 | 100, 200 |
| Core Material | Displacement (mm) |
|---|---|
| Steel (PAFANA) | 0.1466 |
| Lead | 0.1509 |
| SBR | 0.1628 |
| PC | 0.1252 |
| PC + SBR | 0.1395 |
| Epoxy resin | 0.1639 |
| PC displacement (mm) | |||||||
| Length l1 (mm) | |||||||
| 50 | 100 | 150 | 200 | 250 | 283 | ||
| Diameter d1 (mm) | 10 | 0.1423 | 0.1444 | 0.1404 | 0.1282 | 0.1299 | 0.1445 |
| 15 | 0.1370 | 0.1445 | 0.1292 | 0.1233 | 0.1254 | 0.1476 | |
| 20 | 0.1347 | 0.1437 | 0.1266 | 0.1219 | 0.1243 | 0.1514 | |
| 25 | 0.1296 | 0.1428 | 0.1313 | 0.1252 | 0.1281 | 0.1613 | |
| 30 | 0.1260 | 0.1481 | 0.1423 | 0.1378 | 0.1400 | 0.1932 | |
| PC mass (g) | |||||||
| Length l1 (mm) | |||||||
| 50 | 100 | 150 | 200 | 250 | 283 | ||
| Diameter d1 (mm) | 10 | 3262 | 3231 | 3200 | 3169 | 3138 | 3118 |
| 15 | 3247 | 3177 | 3108 | 3039 | 2969 | 2924 | |
| 20 | 3226 | 3103 | 2979 | 2856 | 2732 | 2651 | |
| 25 | 3199 | 3006 | 2813 | 2621 | 2428 | 2301 | |
| 30 | 3166 | 2889 | 2612 | 2335 | 2057 | 1874 | |
 The lowest value of displacement/mass of the boring bar.
  Most optimal combination indicated by Autodesk Inventor.
  Displacement greater than original boring bar.
| PC + SBR displacement (mm) | |||||||
| Length l1 (mm) | |||||||
| 50 | 100 | 150 | 200 | 250 | 283 | ||
| Diameter d1 (mm) | 10 | 0.1433 | 0.1456 | 0.1477 | 0.1485 | 0.1491 | 0.1496 |
| 15 | 0.1420 | 0.1435 | 0.1444 | 0.1473 | 0.1517 | 0.1506 | |
| 20 | 0.1417 | 0.1423 | 0.1431 | 0.1444 | 0.1552 | 0.1654 | |
| 25 | 0.1411 | 0.1418 | 0.1418 | 0.1421 | 0.1653 | 0.1744 | |
| 30 | 0.1405 | 0.1415 | 0.1453 |  | 0.1853 | 0.2132 | |
| PC + SBR mass (g) | |||||||
| Length l1 (mm) | |||||||
| 50 | 100 | 150 | 200 | 250 | 283 | ||
| Diameter d1 (mm) | 10 | 3053 | 3033 | 3014 | 2995 | 2976 | 2956 |
| 15 | 3032 | 2965 | 2905 | 2876 | 2752 | 2712 | |
| 20 | 3007 | 2891 | 2756 | 2674 | 2456 | 2321 | |
| 25 | 2981 | 2822 | 2680 | 2505 | 2251 | 2043 | |
| 30 | 2950 | 2751 | 2349 | 2225 | 1997 | 1733 | |
 The lowest value of displacement/mass of the boring bar.
  Most optimal combination indicated by Autodesk Inventor.
  Displacement greater than original boring bar.
| PAFANA | PC | +/− | PC + SBR | +/− | |
|---|---|---|---|---|---|
| Mode 1 | |||||
| Frequency (Hz) | 260.00 | 266.00 | +2.3% | 265.67 | +2.2% |
| Amplitude ((m/s2)/N) | 2.53 | 2.2 | −13.0% | 2.48 | −2.0% |
| Damping ratio (-) | 0.66 | 0.91 | +37.9% | 0.87 | +31.8% |
| Mode 2 | |||||
| Frequency (Hz) | 1827.67 | 1777.00 | −2.8% | - | - |
| Amplitude ((m/s2)/N) | 4.22 | 1.00 | −76.3% | - | - |
| Damping ratio (-) | 0.63 | 1.02 | +61.9% | - | - |
| Mode 3 | |||||
| Frequency (Hz) | 2652.67 | - | - | - | - |
| Amplitude ((m/s2)/N) | 1.62 | - | - | - | - |
| Damping ratio (-) | 0.27 | - | - | - | - |
| PAFANA | PC | +/− | PC + SBR | +/− | |
|---|---|---|---|---|---|
| Mode 1 | |||||
| Frequency (Hz) | 314.33 | 343.67 | −2.2% | 345.33 | +1.2% |
| Amplitude ((m/s2)/N) | 1.75 | 2.04 | +16.6% | 2.05 | +17.1% |
| Damping ratio (-) | 1.78 | 1.67 | −6.2% | 1.65 | −7.3% |
| Mode 2 | |||||
| Frequency (Hz) | 1761.00 | 1721.00 | −2.2% | - | - |
| Amplitude ((m/s2)/N) | 3.45 | 1.61 | −53.3% | - | - |
| Damping ratio (-) | 0.82 | 1.58 | +92.7% | - | - |
| Mode 3 | |||||
| Frequency (Hz) | 2654.00 | - | - | - | - |
| Amplitude ((m/s2)/N) | 1.24 | - | - | - | - |
| Damping ratio (-) | 0.28 | - | - | - | - |
| Top sensor | |||||||||
| Measurement | Mass 1 | Mass 2 | Mass 3 | ||||||
| Before (µm) | In the process (µm) | Difference (µm) | Before (µm) | In the process (µm) | Difference (µm) | Before (µm) | In the process (µm) | Difference (µm) | |
| 1 | 1294 | 1105 | 189 | 1307 | 901 | 406 | 1306 | 699 | 607 |
| 2 | 1298 | 1109 | 189 | 1293 | 899 | 394 | 1304 | 701 | 603 |
| 3 | 1298 | 1102 | 196 | 1294 | 902 | 392 | 1312 | 703 | 609 |
| Bottom sensor | |||||||||
| Measurement | Mass 1 | Mass 2 | Mass 3 | ||||||
| Before (µm) | In the process (µm) | Difference (µm) | Before (µm) | In the process (µm) | Difference (µm) | Before (µm) | In the process (µm) | Difference (µm) | |
| 1 | 5 | 79 | 74 | 2 | 178 | 176 | 9 | 269 | 260 |
| 2 | 3 | 78 | 75 | 14 | 178 | 165 | 18 | 272 | 254 |
| 3 | 1 | 80 | 79 | 14 | 181 | 167 | 20 | 273 | 253 |
| The average value of the differences in the top and bottom sensor readings (µm) | 115 | The average value of the differences in the top and bottom sensor readings (µm) | 228 | The average value of the differences in the top and bottom sensor readings (µm) | 351 | ||||
| Top sensor | |||||||||
| Measurement | Mass 1 | Mass 2 | Mass 3 | ||||||
| Before (µm) | In the process (µm) | Difference (µm) | Before (µm) | In the process (µm) | Difference (µm) | Before (µm) | In the process (µm) | Difference (µm) | |
| 1 | 1211 | 1017 | 194 | 1264 | 851 | 413 | 1205 | 587 | 618 |
| 2 | 1245 | 1045 | 200 | 1233 | 819 | 414 | 1211 | 590 | 621 |
| 3 | 1235 | 1032 | 203 | 1221 | 813 | 408 | 1204 | 589 | 615 |
| Bottom sensor | |||||||||
| Measurement | Mass 1 | Mass 2 | Mass 3 | ||||||
| Before (µm) | In the process (µm) | Difference (µm) | Before (µm) | In the process (µm) | Difference (µm) | Before (µm) | In the process (µm) | Difference (µm) | |
| 1 | 5 | 82 | 77 | 6 | 175 | 169 | 1 | 261 | 260 |
| 2 | 2 | 74 | 72 | 0 | 161 | 161 | 12 | 262 | 250 |
| 3 | 2 | 76 | 74 | 1 | 164 | 163 | 13 | 261 | 248 |
| The average value of the differences in the top and bottom sensor readings (µm) | 125 | The average value of the differences in the top and bottom sensor readings (µm) | 247 | The average value of the differences in the top and bottom sensor readings (µm) | 365 | ||||
| Top sensor | |||||||||
| Measurement | Mass 1 | Mass 2 | Mass 3 | ||||||
| Before (µm) | In the process (µm) | Difference (µm) | Before (µm) | In the process (µm) | Difference (µm) | Before (µm) | In the process (µm) | Difference (µm) | |
| 1 | 1320 | 1117 | 203 | 1321 | 914 | 407 | 1328 | 692 | 636 |
| 2 | 1315 | 1119 | 196 | 1311 | 913 | 398 | 1310 | 697 | 613 |
| 3 | 1311 | 1109 | 202 | 1310 | 905 | 405 | 1309 | 701 | 608 |
| Bottom sensor | |||||||||
| Measurement | Mass 1 | Mass 2 | Mass 3 | ||||||
| Before (µm) | In the process (µm) | Difference (µm) | Before (µm) | In the process (µm) | Difference (µm) | Before (µm) | In the process (µm) | Difference (µm) | |
| 1 | 10 | 87 | 77 | 10 | 173 | 163 | 4 | 261 | 257 |
| 2 | 14 | 87 | 73 | 15 | 171 | 156 | 16 | 262 | 246 |
| 3 | 15 | 88 | 73 | 16 | 177 | 161 | 16 | 261 | 245 |
| The average value of the differences in the top and bottom sensor readings (µm) | 126 | The average value of the differences in the top and bottom sensor readings (µm) | 243 | The average value of the differences in the top and bottom sensor readings (µm) | 370 | ||||
Disclaimer/Publisher’s Note: The statements, opinions and data contained in all publications are solely those of the individual author(s) and contributor(s) and not of MDPI and/or the editor(s). MDPI and/or the editor(s) disclaim responsibility for any injury to people or property resulting from any ideas, methods, instructions or products referred to in the content. |
© 2024 by the authors. Licensee MDPI, Basel, Switzerland. This article is an open access article distributed under the terms and conditions of the Creative Commons Attribution (CC BY) license (https://creativecommons.org/licenses/by/4.0/).
Share and Cite
Kępczak, N.; Bechciński, G.; Rosik, R. Operating Properties of Deep Hole Boring Tools with Modified Design. Materials 2024, 17, 1551. https://doi.org/10.3390/ma17071551
Kępczak N, Bechciński G, Rosik R. Operating Properties of Deep Hole Boring Tools with Modified Design. Materials. 2024; 17(7):1551. https://doi.org/10.3390/ma17071551
Chicago/Turabian StyleKępczak, Norbert, Grzegorz Bechciński, and Radosław Rosik. 2024. "Operating Properties of Deep Hole Boring Tools with Modified Design" Materials 17, no. 7: 1551. https://doi.org/10.3390/ma17071551
APA StyleKępczak, N., Bechciński, G., & Rosik, R. (2024). Operating Properties of Deep Hole Boring Tools with Modified Design. Materials, 17(7), 1551. https://doi.org/10.3390/ma17071551