
Analysis of Slag-Containing Steamed Concrete’s Composition Efficiency


1
Institute of Civil Engineering and Architecture, National University of Water and Environmental Engineering, 33028 Rivne, Ukraine
2
Department of Civil Engineering, Ariel University, Ariel 40700, Israel
*
Author to whom correspondence should be addressed.
Materials 2024, 17(6), 1300; https://doi.org/10.3390/ma17061300
Submission received: 2 February 2024
/
Revised: 1 March 2024
/
Accepted: 7 March 2024
/
Published: 11 March 2024
(This article belongs to the Special Issue Recycling and Sustainability of Industrial Solid Waste)
Abstract
:Thermal power plant slag is a waste that is presently obtained from many power stations all over the world. A possible method for its utilization is using it to produce concrete. This paper analyses the effect of thermal power plant slag on the technological properties of concrete mixtures and the mechanical properties of concrete subjected to heat–moisture processing. Quantitative estimates of the investigated factors’ influence on the concrete mixture’s water demand and the strength of steamed concrete were obtained. The influences of TPP slag content and its water demand on concrete composition features as well as concrete strength are shown. The novelty of the work lies in the use of an experimental–statistical model to optimize the composition of steamed concrete using slag from the viewpoint of maximum strength per kilogram of cement. It has been demonstrated that the optimal part of slag in aggregate, which provides maximum strength at 4 h and 28 days after steaming, is 0.5–0.55 and 0.45–0.55, respectively. A method for the design of concrete composition using slag from thermal power plants is proposed.
1. Introduction
When solid fuels are burned in the furnaces of thermal power plants (TPPs), ash in the form of dust-like residues, slag, and ash–slag mixtures are formed. They are products of high-temperature (1200–1700 °C) processing of the fuel mineral part [1]. Fly ash has been widely used as an active mineral additive to cement and concrete for many years [2]. Depending on the type of furnace, ash output is from 20 to 40% of the total amount of TPP waste. Other components include ash-slag mixtures and slags that accumulate in a form of dumps, polluting the environment near the power plants [3].
By grain composition, the TPP slag is usually a mechanical mixture of grains that have a size of 0.14 to 30 mm with separate inclusions of larger particles, so it can be considered as a mixture of fine and coarse concrete aggregates [4]. Therefore, TPP slag in lightweight and normal weight concrete is known as the main aggregate, used to partially replace crushed stone (20–50%) and improve the granulometric composition of sands [5].
It was found that crushed slag, unlike natural crushed stone, practically does not contain flat and needle-like grains, clay, and other harmful impurities; therefore, it provides concrete strength up to 30 MPa [4]. There is an intensive interaction between TPP slag and cement during concrete heat-processing. Therefore, immediately after steaming, the strength of slag-containing concrete is about 80% of the set value; after 28 days, it exceeds the strength of normally hardened concrete by 10–15% [6]. Replacing natural aggregates with fuel slag (especially granulated) can lead to a decrease in cement consumption by improving the aggregate mixture granulometric composition, as well as strengthening the contact zone between slag and cement stone [4]. Despite available research results, showing the possibility of using TPP slag in concrete, the effective use of such material is significantly complicated due to the changes in its characteristics (grain size composition, porosity, water demand, etc.), which significantly affect the concrete properties [5]. Hence, the development of a method for determining the optimal concrete composition, which would provide an opportunity to predict and ensure the properties of concrete using TPP slag, taking into account the characteristics of its components and their content, is relevant.
The concrete composition’s effectiveness is determined by its technical and economic indicators, which characterize the rational use of material and energy resources. The rational concrete compositions must also provide a set of standardized properties, taking into account the manufacturing technology of structures and their operation features. Moreover, concrete composition design should also consider the possibility of using technogenic waste and its effect on the concrete properties [7,8,9,10,11]. The main material resource, the rational use of which characterizes, to a large extent, the concrete composition’s effectiveness, is cement [12,13,14,15,16]. As an integral economic criterion for the concrete composition’s optimality, the total costs of its production with standardized properties can be considered [17]. The integral criterion is directly related to other criteria, determining the effectiveness of the cement used in the concrete mixture and energy resources in the products and structures.
2. Criteria for Evaluating Material Consumption in Concrete
To analyze the effectiveness of various types of cement that have different cost, quality, and rational use criteria (Kc.r) [18], the following equation can be used:
where Sc.r and Sc are the specific costs of cement used per 1 m3 of concrete or for the specified structural element, respectively, for the reference and given technological solutions.
St is the specific cost of the technological methods aimed at reducing the cement costs without decreasing the concrete quality (using additives, electric or steam heating of the mixture, etc.).
CCc.r and CCc are the costs of reference and applied cements, respectively.
Cr and C are the consumptions of conditional reference and comparative cements used to obtain concrete with the specified design requirements.
Criterion Kc.r can be used to analyze the effectiveness of cements of different costs and qualities when changing their chemical and mineralogical composition, additive content, activity, normal consistency, etc. Kc.r, enables us to evaluate the cement use effectiveness in the analysis of technological and design solutions related to the reduction of material consumption in products and structures.
The criterion of rational energy costs (Kr.e) can be used to determine the relative specific consumption of conventional fuel (thermal energy) for the production of 1 m3 of concrete or products, including fuel consumption for cement production [19]:
where Cr and C are consumptions of the conditional reference and actually used cements required to obtain concrete with given design properties, kg/m3.
Fc.r and Fc are the «equivalent coal» (the heat of combustion is 29.3 MJ/kg) consumption for obtaining 1 kg of reference and the actually used cements.
Fst is the «equivalent coal» consumption for product steaming.
Fad is the additional fuel consumption for technological purposes.
Criterion Kr.e allows us to compare the energy consumption for the production of concrete with different properties and to evaluate the efficiency of using thermal energy in different compositions of concrete, both under conditions of normal hardening and heat processing. With the help of this criterion, researchers can choose the optimal heat treatment modes based on fuel consumption. When comparing normally curing concrete and steamed concrete, provided that the same type of cement is used, approaching the criterion value of 1 indicates an increase in the energy efficiency of the concrete steaming process. It is also possible to use the criterion to compare the energy efficiency of various technological solutions—adding mineral and chemical admixtures, concrete mixture heating, etc.
Using transition coefficients when determining Kr.e, it is possible to take into account, along with heat, electricity consumption (1 kWh~0.34 kg of «equivalent coal») [19]. All possible technological solutions that lead to an increase in Kr.e without an unacceptable decrease in line productivity and a significant increase in costs are progressive and can be recommended for implementation.
When using a certain type of cement and certain technological parameters of concrete production (concrete mixture workability and methods and modes of heat processing), the concrete composition’s effectiveness can be characterized using the ratio of the most important standardized parameter to the cement consumption (C). For this purpose, the following relation can be used [17]:
where fcm is the compressive strength of concrete with normal or accelerated hardening at a certain age.
For a more in-depth analysis, it is advisable to consider expression (3), taking into account important technological factors. In particular, for this purpose, it is possible to use the well-known dependences for concrete strength [17,20]:
where Rc is the cement strength, MPa;
C/W is the cement–water ratio;
D is the mineral additive content, kg/m3;
A and b are empirical coefficients that depend on the characteristics of the initial materials and other factors;
Kc.e is the coefficient of additive cementing efficiency [17].
The most detailed analysis with an appropriate search for the maximum value of criterion L is achieved when using detailed quantitative dependences of the concrete strength to cement consumption ratio, taking into account the set of influencing technological factors. With this aim can be used experimental-statistical models obtained by experiment design.
3. Research Aims, Scope, and Novelty
The aim of the present study is to obtain quantitative dependencies to enable the development of a method for designing optimal compositions of concrete using slag from thermal power plants, whereby a given strength is achieved at 4 h and 28 days after steaming. To achieve this goal, the following tasks should be solved:
- -
- Implementing a planned experiment in order to study the influence of characteristics and the consumption of concrete components, including slag from thermal power plants, on the steamed concrete strength and the optimality criterion L (Equation (3));
- -
- Carrying out statistical processing of experimental data, establishing quantitative estimates of the individual and joint influence of the investigated factors, and obtaining experimental–statistical models of the influence of concrete composition parameters and raw material characteristics;
- -
- Analyzing the obtained models and evaluating the influence of factors on the steamed concrete strength and optimality criterion L as well as to finding the optimal values of the factors;
- -
- Developing a method for designing the optimal composition of steamed concrete using TPP slag with a given strength, while considering criterion L.
To solve the above-mentioned tasks, the method of mathematical experiment planning was used [21,22]. This method is based on carrying out the experiments according to a pre-designed scheme, characterized by optimal properties in terms of the experimental work quantity and statistical requirements. The theory of experiment planning is based on probabilistic statistical methods that enable researcher to theoretically find the minimum required number and composition of experiments, as well as their order, to obtain quantitative relationships between the investigated parameter and the factors influencing it. The main task of mathematical experiment planning is to obtain a mathematical model that characterizes the relationship between the optimization parameter and independent variables (factors) [23].
As a result of statistically processing the experimental data, the regression coefficients of the investigated factors are obtained. Based on the magnitude of the regression coefficients, one can judge the effects—the influence degree of the relevant factors.
The result of mathematical experiment planning in concrete technology is usually presented in the form of an experimental–statistical model, which is a second-order polynomial [23]:
where y is the initial parameter;
b0, bi, bij, and bii are the regression coefficients;
xi, xij, and xii are the investigated factors;
k is the number of factors.
Optimizing the composition of concrete using TPP slag is aimed at finding the consumption of concrete components at which the specified strength parameters will be achieved and the maximum values of the optimization criterion L will be ensured (Equation (3)).
The main novelty of this study is that the proposed approach allows us to find a concrete composition that ensures the calculated strength characteristics at maximum cement use efficiency (criterion L), taking into account the characteristics of TPP slag and other aggregates.
4. Materials and Research Methods
To obtain the concrete mixture, Portland cement CEM 32.5 was used. The cement’s physical and mechanical properties are given in Table 1.
As a fine aggregate, quartz sand was use, with partial or complete replacement by fuel slag; crushed granite stone [20] served as a coarse aggregate. The water demand was used as the main aggregate characteristic [24], which was determined to fall within the accepted variation-in-factors range during the experiment, depending on the size, porosity, and content of impurities [25] (Table 2).
Slag from the ash–slag dumps of Burshtynskaya TPP (Ukraine) was used. It had the following chemical composition, %: SiO2—48.6; Al2O3—23.3; Fe2O3—15.3; CaO—4.4; MgO—2.2; Na2O—0.5; K2O—1.6; and SO3—0.47.
According to the known methodology [24], the water demands of sand (Ws), slag (Wsl), and crushed stone (Wsc) were found using the following expressions:
where (W/C)p is the W/C of the cement paste with cone spreading on a Flow Table [26] of about 170 mm, which approximately corresponds to its normal consistency.
(W/C)m is the W/C of the mortar on the tested sand or slag, at which it has the same cone slump as the cement paste of normal consistency.
(W/C)c is the W/C of the concrete mixture at which the same workability as that of the mortar mixture at (W/C)m is achieved.
To find the water demand of sand, a cement–sand mortar with a cement–sand ratio of 1:2 (by weight) and a concrete mix with a cement–sand–crushed stone ratio of 1:2:3.5 (by weight) were prepared. The workability of the mortar corresponded to the cone spreading on a Flow Table [26] of 170 mm. The slump of the concrete mixtures [27] was 160 mm. The water demand was calculated according to Equations (7) and (8).
The concrete mixes corresponded to the S4 class with a slump range of 160–210 mm [27]. In order to reduce the water content, an additive of naphthalene–formaldehyde superplasticizer in the amount of 0.7% of the cement weight was added to all of the investigated concrete mixture compositions.
Along with the water demands of sand, slag, and crushed stone, the influences of the cement–water ratio, the crushed stone part in the aggregate mixture, and the part of slag in the fine aggregate on the concrete compressive strength were also studied. The strength of concrete sample was studied after steaming at 80 °C using the 2 + 3 + 5 + 2 h mode (holding before steaming + temperature rise + holding at maximum temperature + cooling).
To find optimal concrete compositions, experiments were performed using the mathematical planning method according to the 3-level, 6-factor Box–Behnken plan [21,23] (Table 3 and Appendix A, Table A1). This plan includes 54 experimental points and enables researchers to study the nonlinear influence of six factors using a minimum number of experiments. The plan was selected using the Statistica 6.0 (Statsoft) software package [28]. Overall, 54 series of 100 mm × 100 mm × 100 mm cubic specimens were produced. Each series consisted of 6 specimens, 3 of which were tested 4 h after steaming and the other 3 after 28 days of curing. The specimens were manufactured and tested in accordance with the requirements of modern normative documents [29].
5. Experimental Data and Its Processing
The experiment planning conditions are given in Table 3, the planning matrix is presented in Appendix A, and Table A1 and the experimental data are shown in Appendix A, Table A2. After statistical processing [21,23,28] of the experimental results (Table A2), a complex of adequate experimental–statistical models with a confidence probability of 95% was obtained in the form of polynomial equations (Equation (6)), which are given in Table 4. The significance of the coefficients of the equations was checked using Student’s test [23]. The adequacy of the equations was checked by calculating the adequacy variance and using Fisher’s criterion. The calculations were performed using the Statistica 6.0 (Statsoft) software package [28].

Table 4.
Experimental–statistical models of the slag-containing concrete properties.
| Properties | Equation |
|---|---|
| Water demand of the concrete mixture, L/m3 |
W = 208.6 − 7.7X1 − 3.4X2 − 5.5X3 + 8.4X4 + 2.5X5 + 10.0X6
+ 17.0X12 + 26.5X22 + 1.5X32 − 1.0X42 + 12.1X1X2 + 5.6X1X3 − 5.1X1X5 + 8.5X2X4 − 10X2X5 |
| Concrete compressive strength, 4 h after steaming, MPa |
fcm4h = 18.9 + 2.1X1 + 1.0X2 − 0.4X3 + 0.5X4 − 0.5X5 + 8.9X6 − 0.8X12
− 2.0X22 + 0.3X32 − 0.7X42 + 1.1X52 + 1.5X62 − 1.3X1X3 − 0.3X1X5 + 0.7X1X6 − 0.3X2X3 + 0.3X2X4 + 0.2X2X5 + 0.7X2X6 − 0.9X3X4 − 0.3X3X5 − 0.8X4X5 |
| Concrete compressive strength, 28 days after steaming, MPa |
fcm28d = 30.9 + 2.6X1 + 2.5X2 + 1.3X3 + 1.8X4 + 1.8X5 + 13X6 + 0.4X12 − 1.5X22
+ 1.3X32 − 1.0X42 + 0.9X52 − 0.8X62 − 1.4X1X2 − 0.6X1X3 − 0.8X1X4 − 0.8X1X5 + 2.0X1X6 + 1.1X2X3 − 1.3X2X5 + 2.4X2X6 − 0.3X3X4 − 0.4X3X5 − 0.3X4X5 |
| Criterion of cement efficiency for concrete, 4 h after steaming (L4h), MPa/kg |
L4h = 0.048 + 0.006X1 + 0.002X2 − 0.002X3 − 0.003X4 + 0.005X6 − 0.005X12
− 0.009X22 − 0.001X42 + 0.002X52 − 0.001X62 − 0.001X1X2 − 0.003X1X3 − 0.010X1X5 + 0.002X2X5 + 0.001X2X6 − 0.002X3X4 − 0.015X3X5 − 0.002X4X5 |
| Criterion of cement efficiency for concrete, 28 days after steaming (L28d), MPa/kg |
L28d = 0.078 + 0.008X1 + 0.006X2 + 0.005X3 − 0.007X4 − 0.005X5 + 0.006X6
− 0.004X12 − 0.011X22 + 0.002X32 − 0.002X42 + 0.001X52 − 0.005X62 − 0.006X1X2 − 0.002X1X4 + 0.001X1X5 + 0.003X1X6 + 0.002X2X3 − 0.002X2X4 + 0.004X2X6 + 0.001X3X6 + 0.002X4X6 + 0.002X5X6 |
The obtained mathematical models (Table 4) enabled us to analyze the influence of the investigated factors on the properties of concrete with thermal power plant slag.
The concrete mixture water demand (Equation (9)) varied quite widely: from 185 to 275 L/m3. Such a wide range of change in water demand is caused by fluctuations in the concrete composition within rather wide limits, as well as by changes in the types of aggregates and their properties, since aggregates with different water demand were used, such as thermal power plant slag, crushed stone, and sand. Factors X1 and X2, characterizing the part of crushed stone in the aggregate, and the part of slag in sand cause a decrease in water demand when they increase. The maximum reduction in water demand causes an increase in the part of crushed stone in concrete (X1), which is logically explained by an increase in the total size of the aggregate (Figure 1a). The influence of slag (X2) in this case is somewhat lower. Factors X3–X6, when they increase, cause an increase in the concrete mixture water demand. The maximum increase in water demand is observed with an increase in the cement–water ratio (X6). This is mostly caused by an increase in the concrete mixture viscosity as a result of an increase in the amount of cement paste in this experiment within rather wide limits. Since factors X3–X5 characterize the water demand of aggregates (crushed stone, slag, and sand), the increase in the value of these indicators is reflected, accordingly, in the total water demand of the concrete mixture (Figure 1b). Since power plant slag, in most cases, acts as an alternative aggregate in concrete [30], it should be expected that a change in the water demand of a concrete mixture, due to the water demand of aggregates, will largely determine the change in concrete strength.
The strength of the concrete with TPP slag 4 h after steaming (Equation (10)) varied from 8 to 33 MPa. The most significant factor that causes an increase in strength is the cement–water ratio (X6) [17]. An increase in C/W from 1.3 to 2.5 causes an increase in compressive strength by almost 3 times. Additionally, the increase in strength, but to a much lower extent, is caused by an increase in the crushed stone part in the aggregate (factor X1) (Figure 2a) and an increase in the part of slag in sand (factor X2). Factor X2 is characterized by a significant negative quadratic effect, which indicates the existence of a maximum zone in the varied range of its influence. An increase in strength is observed up to values of the slag part of 0.5–0.6 (Figure 2b). Then, the strength begins to decrease, most likely due to the increased voids of the aggregate and increase in concrete porosity [31]. When factors that characterize the aggregates water demand (X3–X5) increase, it causes a decrease in concrete strength. The most significant, in the model of strength 4 h after steaming, is the interaction of factors X1 and X3—as the crushed stone water demand increases, its positive effect on strength decreases.
On the 28th day of hardening after steaming (Equation (11)), the described trends of influence of the investigated factors on the strength of the concrete with slag are mostly preserved (Figure 3a,b). The strength value at 28 days is 1.4–1.5 times higher than that at 4 h after steaming (achieved values from 15 to 45 MPa) (Figure 3a).
Models of criterion L obtained on the basis of strength values after steaming (L4h and L28d, Equations (12) and (13)) allow us to establish the optimal composition of concrete with slag, at which the strength achieved per each kilogram of cement is the maximum. According to the strength 4 h after steaming, the L4h criterion varies from 0.022 to 0.058 MPa/kg. After 28 days of hardening, the values of the criterion (L28d) are higher—from 0.041 to 0.094 MPa/kg. Analyzing the influence of factors on criteria L4h and L28d, it should be noted that factors X1 (crushed stone part), X2 (slag part) (Figure 4a), and X6 (cement–water ratio) (Figure 4b), when they increase, cause an increase in the criterion values. The influence of these factors on the models is also characterized by the presence of a quadratic effect, which indicates the existence of an optimal values region. The presence of an optimum zone for factors X1 and X2, which characterize an increase in the proportion of crushed stone and slag in concrete, is caused by an increase in voids with a high number of coarse fractions and a simultaneous decrease in the concrete mixture water demand [32]. The optimal zone of the C/W factor (about 2–2.3) (Figure 4b) is most likely caused by a significant increase in the mixture viscosity and the occurrence of some concrete under consolidation with a simultaneous increase in the cement paste density [19,24]. Factors that characterize the increase in aggregate water demand (X3–X5) cause a decrease in the values of concrete composition efficiency criteria.
The resulting models (Equations (9)–(13)) can be used to predict the properties of concrete with thermal power plant slag and design optimal concrete compositions. When calculating the composition, we first calculate the cement–water ratio under the condition of ensuring concrete strength 4 h after steaming (fcm4h, Equation (10)) and after 28 days (fcm28d, Equation (11)).
The values of crushed stone and slag parts are calculated according to the equations obtained via the joint solution of models L4h and L28d, provided that the maximum value of the cement efficiency coefficient is ensured. The water demand necessary to achieve the optimal concrete mixture consistency is calculated according to Equation (9). The consumptions of sand, crushed stone, and slag are obtained using the following sequence:
where
where
rsl = r′sc · r, rs = r − rsl;
r = 1 − rsc;
CS = rsc · K, Sl = rsl · K, S = rs · K;
K = (1000 − C/ρc − W/ρw)/(rsc/ρcs + rsl/ρsl + rs/ρs).
6. Example
It is necessary to determine the optimal composition of slag-containing concrete with a mixture cone slump of 160–200 mm and strength 4 h after steaming fcm4h = 25.0 MPa (concrete class C20/25) for Portland cement CEM 32.5 (ρc = 3.1 kg/L, NC = 27.3%), quartz sand (Ws = 10%, ρs = 2.69 kg/L), granite crushed stone (Wsc = 2.5%, ρsc = 2.61 kg/L), thermal power plant slag (Wsl = 9%, ρsl = 2.45 kg/L), and naphthalene formaldehyde type superplasticizer in the amount of 0.7% of the cement weight. The approximate value of the crushed stone part in the aggregates should be equal to 0.66—the part of slag in fine aggregates should be 0.5.
According to Equation (10), substituting the necessary value of strength and taking the values of factors X1–X5 according to the condition, we set the necessary C/W. C/W = 2.32.
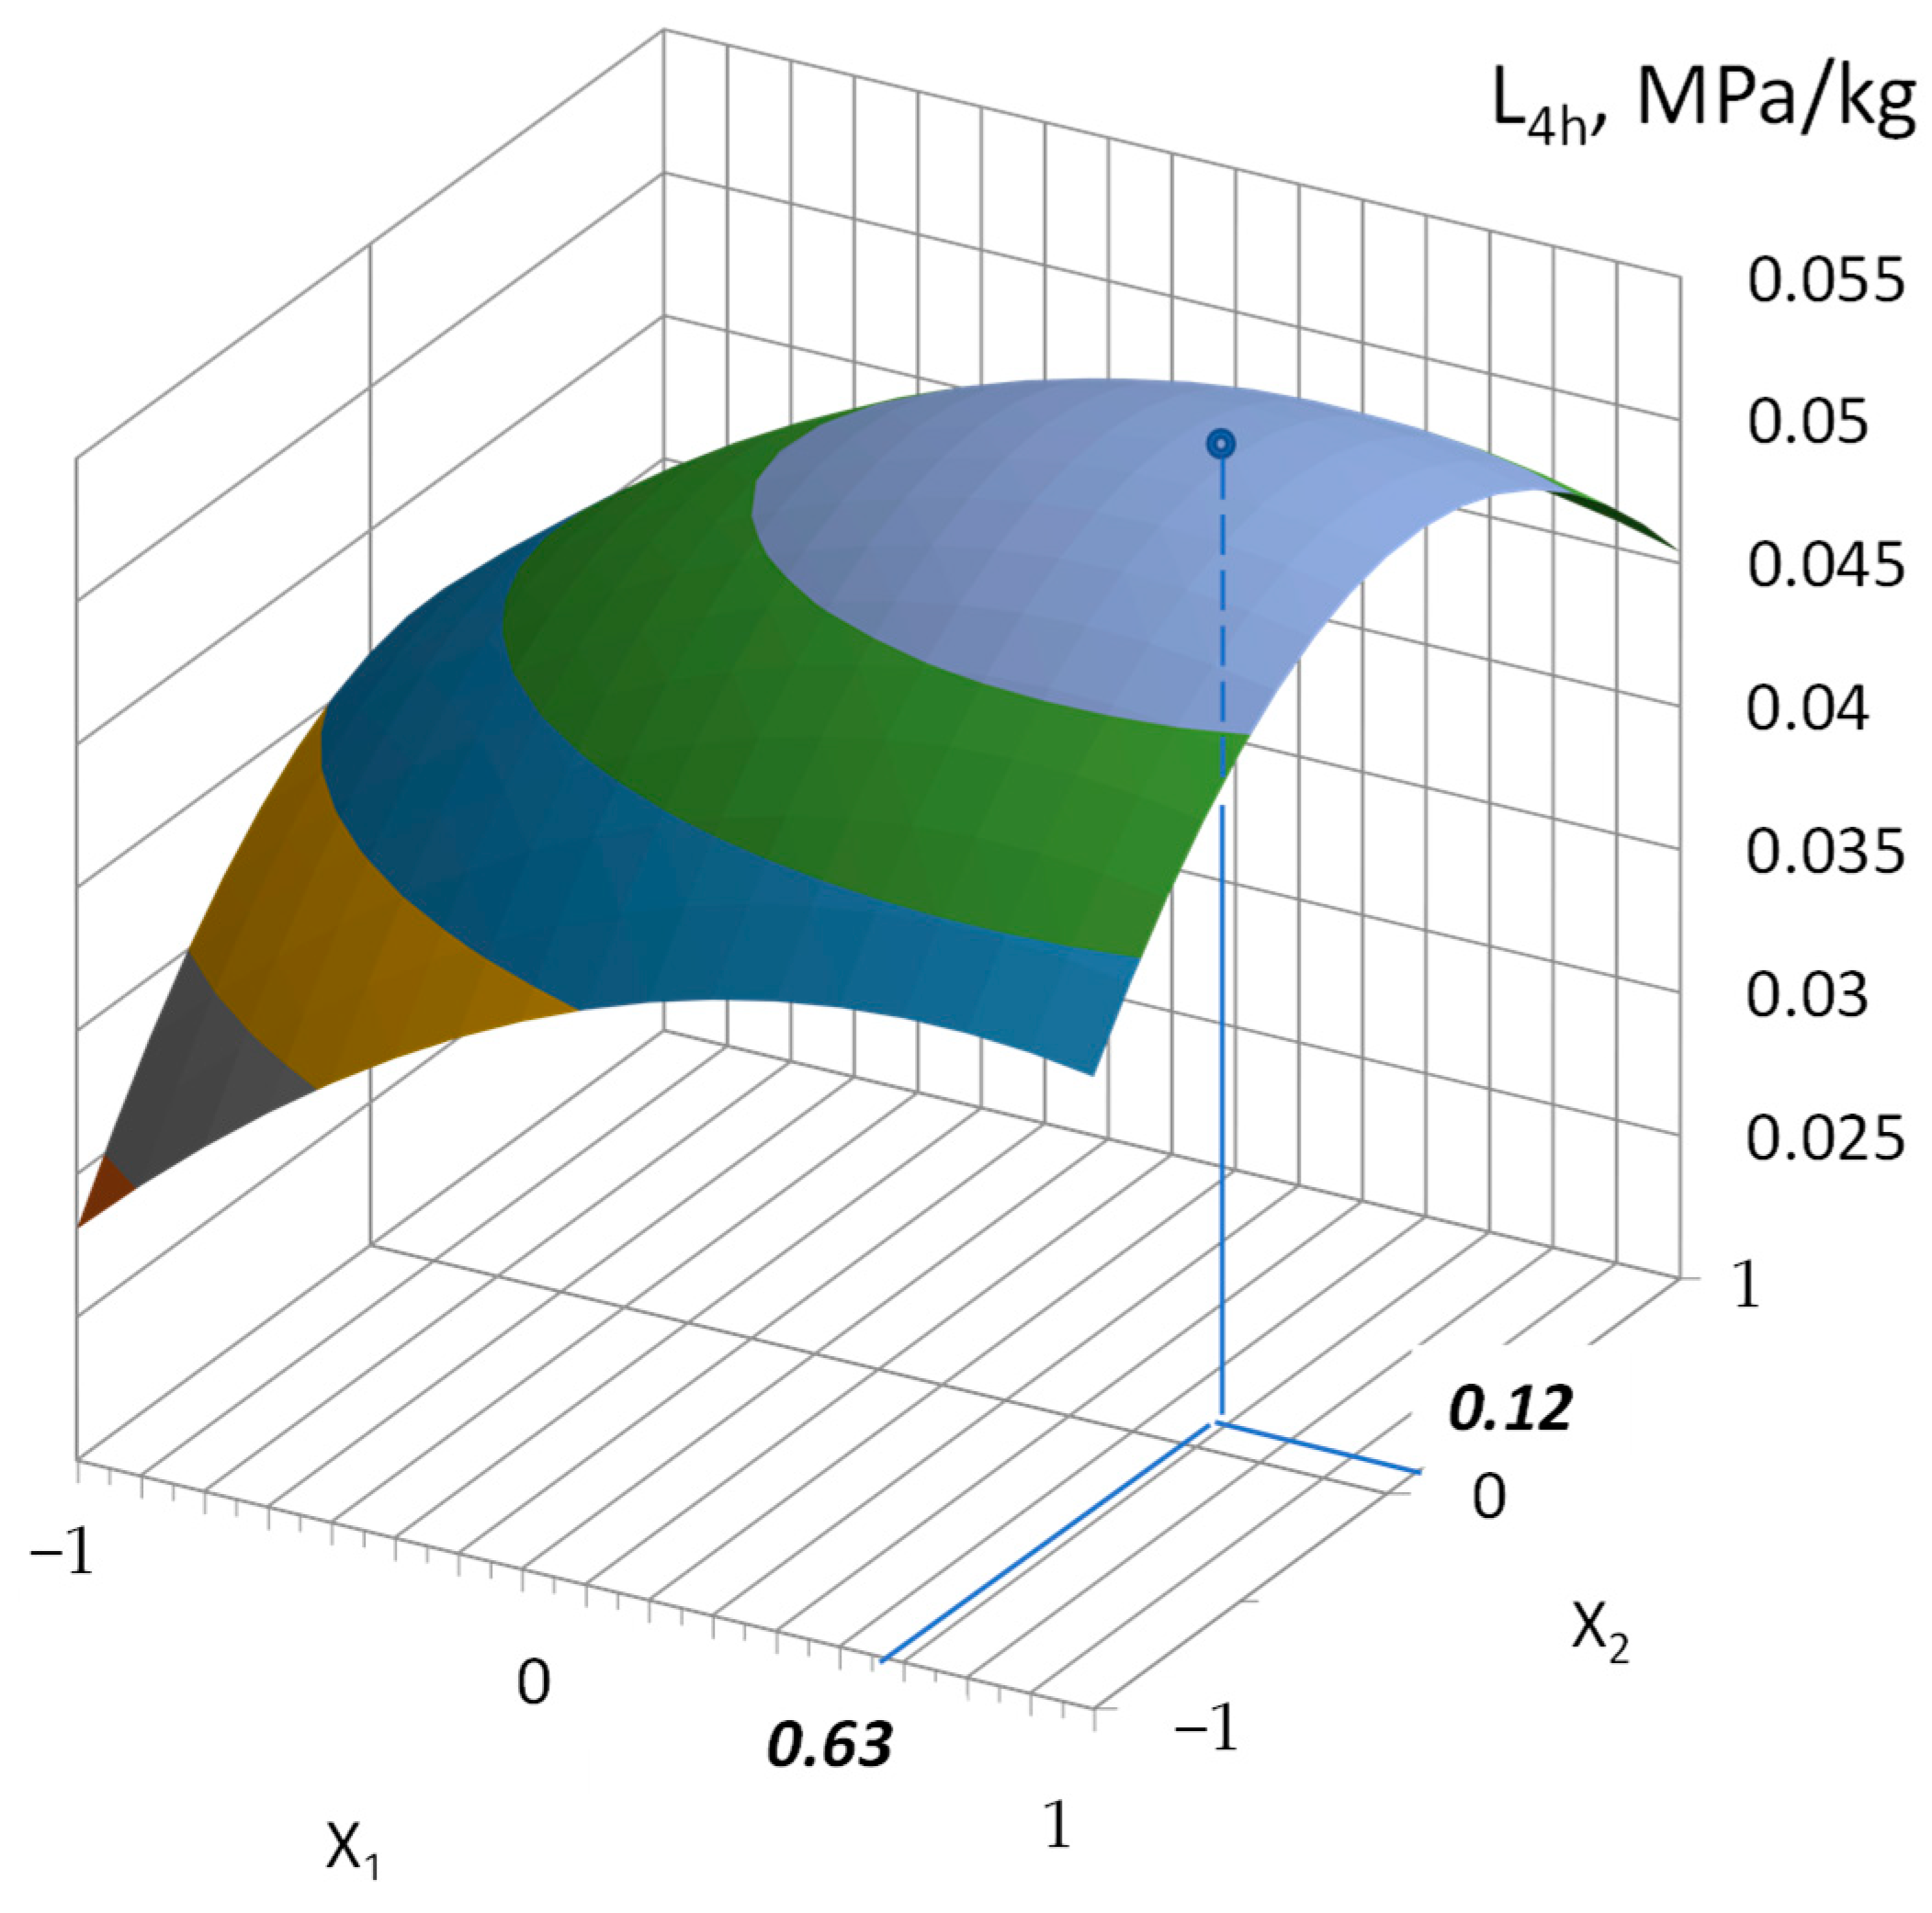
According to Equation (12), we determined the optimal part of crushed stone in the mixture of aggregates (X1) and the part of slag in the fine aggregates (X2) with this C/W and the characteristics of the aggregates according to the condition (Figure 5):
- X1 = 0.63;
- X2 = 0.12.
In natural units:
- rsc = 0.33 · 0.63 + 0.33 = 0.54;
- rsl = 0.5 · 0.12 + 0.5 = 0.56.
Figure 5.
Example of graphic determination of the optimal crushed stone part in the aggregates (X1) and the part of slag in the fine aggregates (X2) according to the maximum value of the L4h criterion. When constructing the response surface according to Equation (12), the following values were adopted: C/W = 2.32, Ws = 10%, Wsc = 2.5%, and Wsl = 9%.
After that, the water demand was obtained according to Equation (10): W = 218 kg/m3.
The cement consumption: C = 218 · 2.32 = 506 kg/m3.
The superplasticizer content: SP = 506 · 0.7/100 = 3.54 kg/m3.
The estimated values of optimal parts of slag rsl and sand rs in the mixture of aggregates according to Equations (14) and (15):
rsc = 1 − 0.54 = 0.46; rsl = 0.46 · 0.56 = 0.26; and rs = 0.46 − 0.26 = 0.2
According to Equations (16) and (17), the consumption of crushed stone, slag and sand are as follows:
- K = (1000 − 506/3.1−218/1)/(0.54/2.61 + 0.2/2.69 + 0.26/2.45) = 1597 kg/m3;
- CS = 1597 · 0.54 = 862 kg/m3;
- Sl = 1597 · 0.26 = 415 kg/m3;
- S = 1597· 0.2 = 320 kg/m3.
7. Conclusions
A planned experiment was carried out using a three-level Box–Behnken plan for six factors, containing fifty-four experimental points. The following factors were selected as the investigated factors: part of crushed stone in the aggregate mixture; part of TPP slag in fine aggregate; and water demand of crushed stone, water demand of slag, water demand of sand, cement–water ratio. The concrete strengths at 4 h and 28 days after steaming were obtained experimentally. The value of the concrete composition efficiency criterion L (strength per kilogram of cement) was calculated.
Using Statistica 6.0 (Statsoft) software, statistical processing of experimental data was carried out. Quantitative estimates of the investigated factors’ influence were established. Finally, experimental–statistical models describing the influence of concrete composition parameters and raw material characteristics on the compressive strength of steamed concrete with TPP slag and on criterion L were obtained.
As a result of the obtained model’s analysis, the influence of TPP slag consumption and aggregate characteristics on the water demand of the concrete mixture and strength of steamed concrete at 4 h and 28 days after steaming was established for a wide range of concrete compositions. It has been shown that the optimal value of the slag part in the aggregate, which allows the maximum strength at 4 h after steaming (from 13.2 to 32.3 MPa (depending on C/W)) to be achieved taking into account the efficiency of concrete composition criterion L, is 0.5–0.55. Maximum strength at 28 days after steaming (from 24.6 to 52.8 MPa) is achieved using a slag part of 0.45–0.55.
A method for selecting the optimal composition of steamed concrete with TPP slag has been developed. It provides maximum strength with minimal cement consumption.
Author Contributions
Conceptualization, L.D. and V.Z.; methodology, L.D. and V.Z.; software, R.M.; validation, V.Z. and R.M.; formal analysis, V.Z.; investigation, L.D.; resources, L.D.; data curation, V.Z.; writing—original draft preparation, L.D., V.Z. and Y.R.; writing—review and editing, L.D., V.Z., R.M. and Y.R.; visualization, V.Z.; supervision, L.D.; project administration, L.D.; funding acquisition, L.D. and Y.R. All authors have read and agreed to the published version of the manuscript.
Funding
This research received no external funding.
Data Availability Statement
Data are contained within the article.
Conflicts of Interest
The authors declare no conflicts of interest.
Appendix A
Table A1.
Experiment planning matrix.
| No. | Coded Factors | |||||
| X1 | X2 | X3 | X4 | X5 | X6 | |
| 1 | −1 | −1 | 0 | −1 | 0 | 0 |
| 2 | +1 | −1 | 0 | −1 | 0 | 0 |
| 3 | −1 | +1 | 0 | −1 | 0 | 0 |
| 4 | +1 | +1 | 0 | −1 | 0 | 0 |
| 5 | −1 | −1 | 0 | +1 | 0 | 0 |
| 6 | +1 | −1 | 0 | +1 | 0 | 0 |
| 7 | −1 | +1 | 0 | +1 | 0 | 0 |
| 8 | +1 | +1 | 0 | +1 | 0 | 0 |
| 9 | 0 | −1 | −1 | 0 | −1 | 0 |
| 10 | 0 | +1 | −1 | 0 | −1 | 0 |
| 11 | 0 | −1 | +1 | 0 | −1 | 0 |
| 12 | 0 | +1 | +1 | 0 | −1 | 0 |
| 13 | 0 | −1 | −1 | 0 | +1 | 0 |
| 14 | 0 | +1 | −1 | 0 | +1 | 0 |
| 15 | 0 | −1 | +1 | 0 | +1 | 0 |
| 16 | 0 | +1 | +1 | 0 | +1 | 0 |
| 17 | 0 | 0 | −1 | −1 | 0 | −1 |
| 18 | 0 | 0 | +1 | −1 | 0 | −1 |
| 19 | 0 | 0 | −1 | +1 | 0 | −1 |
| 20 | 0 | 0 | +1 | +1 | 0 | −1 |
| 21 | 0 | 0 | −1 | −1 | 0 | +1 |
| 22 | 0 | 0 | +1 | −1 | 0 | +1 |
| 23 | 0 | 0 | −1 | +1 | 0 | +1 |
| 24 | 0 | 0 | +1 | +1 | 0 | +1 |
| 25 | −1 | 0 | 0 | −1 | −1 | 0 |
| 26 | +1 | 0 | 0 | −1 | −1 | 0 |
| 27 | −1 | 0 | 0 | +1 | −1 | 0 |
| 28 | +1 | 0 | 0 | +1 | −1 | 0 |
| 29 | −1 | 0 | 0 | −1 | +1 | 0 |
| 30 | +1 | 0 | 0 | −1 | +1 | 0 |
| 31 | −1 | 0 | 0 | +1 | +1 | 0 |
| 32 | +1 | 0 | 0 | +1 | +1 | 0 |
| 33 | 0 | −1 | 0 | 0 | −1 | −1 |
| 34 | 0 | +1 | 0 | 0 | −1 | −1 |
| 35 | 0 | −1 | 0 | 0 | +1 | −1 |
| 36 | 0 | +1 | 0 | 0 | +1 | −1 |
| 37 | 0 | −1 | 0 | 0 | −1 | +1 |
| 38 | 0 | +1 | 0 | 0 | −1 | +1 |
| 39 | 0 | −1 | 0 | 0 | +1 | +1 |
| 40 | 0 | +1 | 0 | 0 | +1 | +1 |
| 41 | −1 | 0 | −1 | 0 | 0 | −1 |
| 42 | +1 | 0 | −1 | 0 | 0 | −1 |
| 43 | −1 | 0 | +1 | 0 | 0 | −1 |
| 44 | +1 | 0 | +1 | 0 | 0 | −1 |
| 45 | −1 | 0 | −1 | 0 | 0 | +1 |
| 46 | +1 | 0 | −1 | 0 | 0 | +1 |
| 47 | −1 | 0 | +1 | 0 | 0 | +1 |
| 48 | +1 | 0 | +1 | 0 | 0 | +1 |
| 49 | 0 | 0 | 0 | 0 | 0 | 0 |
| 50 | 0 | 0 | 0 | 0 | 0 | 0 |
| 51 | 0 | 0 | 0 | 0 | 0 | 0 |
| 52 | 0 | 0 | 0 | 0 | 0 | 0 |
| 53 | 0 | 0 | 0 | 0 | 0 | 0 |
| 54 | 0 | 0 | 0 | 0 | 0 | 0 |
Table A2.
Experimental data.
| No. | Cement Consumption, C, kg/m3 | Water Consumption, W, L/m3 | Concrete Compressive Strength, MPa (Average of Three Tested Specimens) | Criterion L, MPa/kg (Values Calculated According to Equation (3)) | ||
| 4 h after Steaming (fcm4h) | 28 Days after Steaming (fcm28d) | 4 h after Steaming (L4h) | 28 Days after Steaming (L28d) | |||
| 1 | 521 | 274 | 13.1 | 23.3 | 0.025 | 0.045 |
| 2 | 446 | 235 | 17.3 | 32.9 | 0.039 | 0.074 |
| 3 | 430 | 226 | 14.5 | 31.1 | 0.034 | 0.072 |
| 4 | 447 | 235 | 18.7 | 35.1 | 0.042 | 0.079 |
| 5 | 521 | 274 | 11.5 | 21.3 | 0.022 | 0.041 |
| 6 | 446 | 235 | 15.7 | 27.7 | 0.035 | 0.062 |
| 7 | 494 | 260 | 14.1 | 29.1 | 0.029 | 0.059 |
| 8 | 511 | 269 | 18.3 | 29.9 | 0.036 | 0.059 |
| 9 | 422 | 222 | 17.8 | 31.6 | 0.042 | 0.075 |
| 10 | 447 | 235 | 20 | 37 | 0.045 | 0.083 |
| 11 | 443 | 233 | 18.2 | 27.6 | 0.041 | 0.062 |
| 12 | 468 | 246 | 19.2 | 37.4 | 0.041 | 0.080 |
| 13 | 469 | 247 | 17 | 31.4 | 0.036 | 0.067 |
| 14 | 418 | 220 | 20 | 31.6 | 0.048 | 0.076 |
| 15 | 490 | 258 | 16.2 | 25.8 | 0.033 | 0.053 |
| 16 | 439 | 231 | 18 | 30.4 | 0.041 | 0.069 |
| 17 | 241 | 185 | 11.1 | 20.2 | 0.046 | 0.084 |
| 18 | 255 | 196 | 12.1 | 18.2 | 0.047 | 0.071 |
| 19 | 263 | 202 | 11.9 | 17.2 | 0.045 | 0.065 |
| 20 | 277 | 213 | 9.3 | 14 | 0.034 | 0.051 |
| 21 | 513 | 205 | 28.9 | 46.2 | 0.056 | 0.090 |
| 22 | 541 | 216 | 29.9 | 44.2 | 0.055 | 0.082 |
| 23 | 555 | 222 | 29.7 | 43.2 | 0.054 | 0.078 |
| 24 | 583 | 233 | 27.1 | 40 | 0.047 | 0.069 |
| 25 | 411 | 216 | 16.3 | 31.1 | 0.040 | 0.076 |
| 26 | 401 | 211 | 21.1 | 37.9 | 0.053 | 0.094 |
| 27 | 443 | 233 | 16.9 | 29.7 | 0.038 | 0.067 |
| 28 | 433 | 228 | 21.7 | 33.3 | 0.050 | 0.077 |
| 29 | 440 | 232 | 17.5 | 28.1 | 0.040 | 0.064 |
| 30 | 391 | 206 | 21.1 | 34.9 | 0.054 | 0.089 |
| 31 | 472 | 248 | 14.9 | 25.5 | 0.032 | 0.054 |
| 32 | 423 | 223 | 18.5 | 29.1 | 0.044 | 0.069 |
| 33 | 281 | 216 | 11 | 16.9 | 0.039 | 0.060 |
| 34 | 298 | 229 | 11.2 | 19.7 | 0.038 | 0.066 |
| 35 | 313 | 241 | 9.6 | 15.9 | 0.031 | 0.051 |
| 36 | 278 | 214 | 10.6 | 13.5 | 0.038 | 0.048 |
| 37 | 590 | 236 | 27.4 | 38.1 | 0.046 | 0.065 |
| 38 | 623 | 249 | 30.4 | 50.5 | 0.049 | 0.081 |
| 39 | 653 | 261 | 26 | 37.1 | 0.040 | 0.057 |
| 40 | 586 | 234 | 29.8 | 44.3 | 0.051 | 0.076 |
| 41 | 278 | 214 | 8.7 | 18.9 | 0.031 | 0.068 |
| 42 | 272 | 210 | 14.1 | 21.3 | 0.052 | 0.078 |
| 43 | 307 | 236 | 10.5 | 17.5 | 0.034 | 0.057 |
| 44 | 272 | 209 | 10.7 | 17.5 | 0.039 | 0.064 |
| 45 | 584 | 234 | 25.1 | 40.9 | 0.043 | 0.070 |
| 46 | 574 | 230 | 33.3 | 51.3 | 0.058 | 0.089 |
| 47 | 640 | 256 | 26.9 | 39.5 | 0.042 | 0.062 |
| 48 | 573 | 229 | 29.9 | 47.5 | 0.052 | 0.083 |
| 49 | 396 | 209 | 18.4 | 30.9 | 0.046 | 0.078 |
| 50 | 396 | 210 | 18.9 | 30.9 | 0.048 | 0.077 |
| 51 | 396 | 210 | 19 | 30.9 | 0.048 | 0.077 |
| 52 | 396 | 208 | 19.2 | 30.9 | 0.048 | 0.079 |
| 53 | 396 | 211 | 18.7 | 30.9 | 0.047 | 0.079 |
| 54 | 396 | 208 | 18.9 | 30.9 | 0.048 | 0.076 |
References
- Acosta, A.; Aineto, M.; Iglesias, I.; Romero, M.; Rincón, J.M. Physico-chemical characterization of slag waste coming from GICC thermal power plant. Mater. Lett. 2001, 50, 246–250. [Google Scholar] [CrossRef]
- Ortega, J.M.; Esteban, M.D.; Sánchez, I.; Climent, M.Á. Performance of Sustainable Fly Ash and Slag Cement Mortars Exposed to Simulated and Real In Situ Mediterranean Conditions along 90 Warm Season Days. Materials 2017, 10, 1254. [Google Scholar] [CrossRef] [PubMed]
- Rodríguez, C.; Sánchez, I.; Miñano, I.; Benito, F.; Cabeza, M.; Parra, C. On the Possibility of Using Recycled Mixed Aggregates and GICC Thermal Plant Wastes in Non-Structural Concrete Elements. Sustainability 2019, 11, 633. [Google Scholar] [CrossRef]
- Dvorkin, L.; Dvorkin, O.; Ribakov, Y. Construction Materials Based on Industrial Waste Products; Nova Publisher: New York, NY, USA, 2015; 252p, ISBN 978-1-63483-486-5. [Google Scholar]
- Kolokhov, V.; Moroz, L.; Romin, A.; Kovregin, V. Ash-Slag Waste of the Coal-Fired Thermal Power Plant as a Resource for the Construction Industry. Mater. Sci. Forum 2021, 1038, 290–295. [Google Scholar] [CrossRef]
- Thenepalli, T.; Ngoc, N.T.M.; Tuan, L.Q.; Son, T.H.; Hieu, H.H.; Thuy, D.T.N.; Thao, N.T.T.; Tam, D.T.T.; Huyen, D.T.N.; Van, T.T.; et al. Technological Solutions for Recycling Ash Slag from the Cao Ngan Coal Power Plant in Vietnam. Energies 2018, 11, 2018. [Google Scholar] [CrossRef]
- Konečný, P.; Ghosh, P.; Hrabová, K.; Lehner, P.; Teplý, B. Effective methodology of sustainability assessment of concrete mixtures. Mater. Struct. 2020, 53, 98. [Google Scholar] [CrossRef]
- Salvi Malacarne, C.; Silva, M.; Danieli, S.; Maciel, V.G.; Kirchheim, A.P. Environmental and technical assessment to support sustainable strategies for limestone calcined clay cement production in Brazil. Constr. Build. Mater. 2021, 310, 125261. [Google Scholar] [CrossRef]
- Hemalatha, T.; Ramaswamy, A. A review on fly ash characteristics—Towards promoting high volume utilization in developing sustainable concrete. J. Clean. Prod. 2017, 147, 546–559. [Google Scholar] [CrossRef]
- Koper, A.; Koper, M.; Kubissa, W. Determining Concrete Composition on Recycled Aggregates. Key Eng. Mater. 2016, 677, 266–272. [Google Scholar] [CrossRef]
- Hrabová, K.; Lehner, P.; Ghosh, P.; Konečný, P.; Teplý, B. Sustainability Levels in Comparison with Mechanical Properties and Durability of Pumice High-Performance Concrete. Appl. Sci. 2021, 11, 4964. [Google Scholar] [CrossRef]
- Teplý, B.; Rovnaníková, P.; Vymazal, T. Sustainability Quantification of Concrete Structures. In Advances in Environmental Research; NOVA Science Publishers: New York, NY, USA, 2018; ISBN 978-1-53613-918-1. [Google Scholar]
- Müller, H.S. Sustainable structural concrete—From today’s approach to future challenge. Struct. Concr. 2013, 14, 299–300. [Google Scholar] [CrossRef]
- Durastanti, C.; Moretti, L. Environmental Impacts of Cement Production: A Statistical Analysis. Appl. Sci. 2020, 10, 8212. [Google Scholar] [CrossRef]
- de Brito, J.; Kurda, R. The past and future of sustainable concrete: A critical review and new strategies on cement-based materials. J. Clean. Prod. 2021, 281, 123558. [Google Scholar] [CrossRef]
- Younsi, A.; Turcry, P.; Rozière, E.; Aït-Mokhtar, A.; Loukili, A. Performance-based design and carbonation of concrete with high fly ash content. Cem. Concr. Compos. 2011, 33, 993–1000. [Google Scholar] [CrossRef]
- Dvorkin, L.; Zhitkovsky, V.; Bordiuzhenko, O.; Ribakov, Y. High Performance Concrete Optimal Composition Design; CRC Press: Boca Raton, FL, USA, 2023; pp. 1–200. ISBN 978-1-03241-386-0. [Google Scholar]
- Dvorkin, L.; Dvorkin, O.; Ribakov, Y. Multi-Parametric Concrete Compositions Design; Nova Science Pub Inc.: New York, NY, USA, 2013; pp. 1–233. ISBN 978-1-62417-911-2. [Google Scholar]
- Dvorkin, L.; Dvorkin, O. Criterion for the rational use of thermal energy in the production of concrete and reinforced concrete products. Concr. Technol. 2014, 2, 32–35. (In Russian) [Google Scholar]
- EN 12620:2013; Aggregates for Concrete. CEN: Brussels, Belgium, 2013. Available online: https://standards.iteh.ai/catalog/standards/cen/aef412e6-36ce-49d3-afaa-5200d721ff84/en-12620-2013 (accessed on 9 March 2024).
- Box, G.E.P.; Hunter, J.S.; Hunter, W.G. Statistics for Experimenters: Design, Discovery, and Innovation, 2nd ed.; Wiley: New Jersey, NJ, USA, 2005; 672p, ISBN 978-0-471-71813-0. [Google Scholar]
- Chong, B.W.; Othman, R.; Putra Jaya, R.; Mohd Hasan, M.R.; Sandu, A.V.; Nabiałek, M.; Jeż, B.; Pietrusiewicz, P.; Kwiatkowski, D.; Postawa, P.; et al. Design of Experiment on Concrete Mechanical Properties Prediction: A Critical Review. Materials 2021, 14, 1866. [Google Scholar] [CrossRef] [PubMed]
- Dvorkin, L.; Dvorkin, O.; Ribakov, Y. Mathematical Experiments Planning in Concrete Technology; Nova Science Pub Inc.: New York, NY, USA, 2012; pp. 1–175. ISBN 978-1621002833. [Google Scholar]
- Bazhenov, Y. Concrete Technology; ACB: Moskow, Russia, 2011; pp. 1–524. ISBN 5-93093-138-0. (In Russian) [Google Scholar]
- DSTU B V.2.7-232:2010 Building Materials. Sand for Construction. Test Methods (Ukrainian Standart). Available online: https://online.budstandart.com/ua/catalog/doc-page?id_doc=26321 (accessed on 9 March 2024).
- EN 196-1:2016; Methods of Testing Cement—Part 1: Determination of Strength. CEN: Brussels, Belgium, 2016.
- EN 12350-2:2009; Testing Fresh Concrete—Part 2: Slump-Test. CEN: Brussels, Belgium, 2009.
- de Sá, J.P.M. Applied Statistics Using SPSS, STATISTICA, MATLAB and R; Springer: Berlin/Heidelberg, Germany, 2007; pp. 1–529. [Google Scholar] [CrossRef]
- EN 12390-1:2021; Testing Hardened Concrete—Part 1: Shape, Dimensions and Other Requirements for Specimens and Moulds. CEN: Brussels, Belgium, 2021. Available online: https://standards.iteh.ai/catalog/standards/cen/d1c9ccee-2e5a-425e-a964-961da95d2f99/en-12390-1-2021 (accessed on 9 March 2024).
- Kim, H.K.; Lee, H.K. Use of power plant bottom ash as fine and coarse aggregates in high-strength concrete. Constr. Build. Mater. 2011, 25, 1115–1122. [Google Scholar] [CrossRef]
- Kosmatka, S.H.; Wilson, M.L. Design and Control of Concrete Mixtures, 15th ed.; Portland Cement Association: Skokie, IL, USA, 2011; 460p, ISBN 0-89312-272-6. [Google Scholar]
- Hansen, T.C.; Hedegaard, S.E. Modified rule of constant water content for constant consistency of fresh fly ash concrete mixes. Mater. Struct. 1992, 25, 347–354. [Google Scholar] [CrossRef]
Figure 1.
The influence of the crushed stone part, C/W (a) and water demand of sand and slag (b) on the water demand of the concrete mixture with thermal power plant slag.
Figure 1.
The influence of the crushed stone part, C/W (a) and water demand of sand and slag (b) on the water demand of the concrete mixture with thermal power plant slag.

Figure 2.
The influence of water demand and crushed stone part (a) as well as C/W and slag part (b) on concrete strength 4 h after steaming.
Figure 2.
The influence of water demand and crushed stone part (a) as well as C/W and slag part (b) on concrete strength 4 h after steaming.

Figure 3.
The effect of C/W and the part of slag (a) as well as the water demand of slag and sand (b) on the strength of steamed concrete after 28 days.
Figure 3.
The effect of C/W and the part of slag (a) as well as the water demand of slag and sand (b) on the strength of steamed concrete after 28 days.
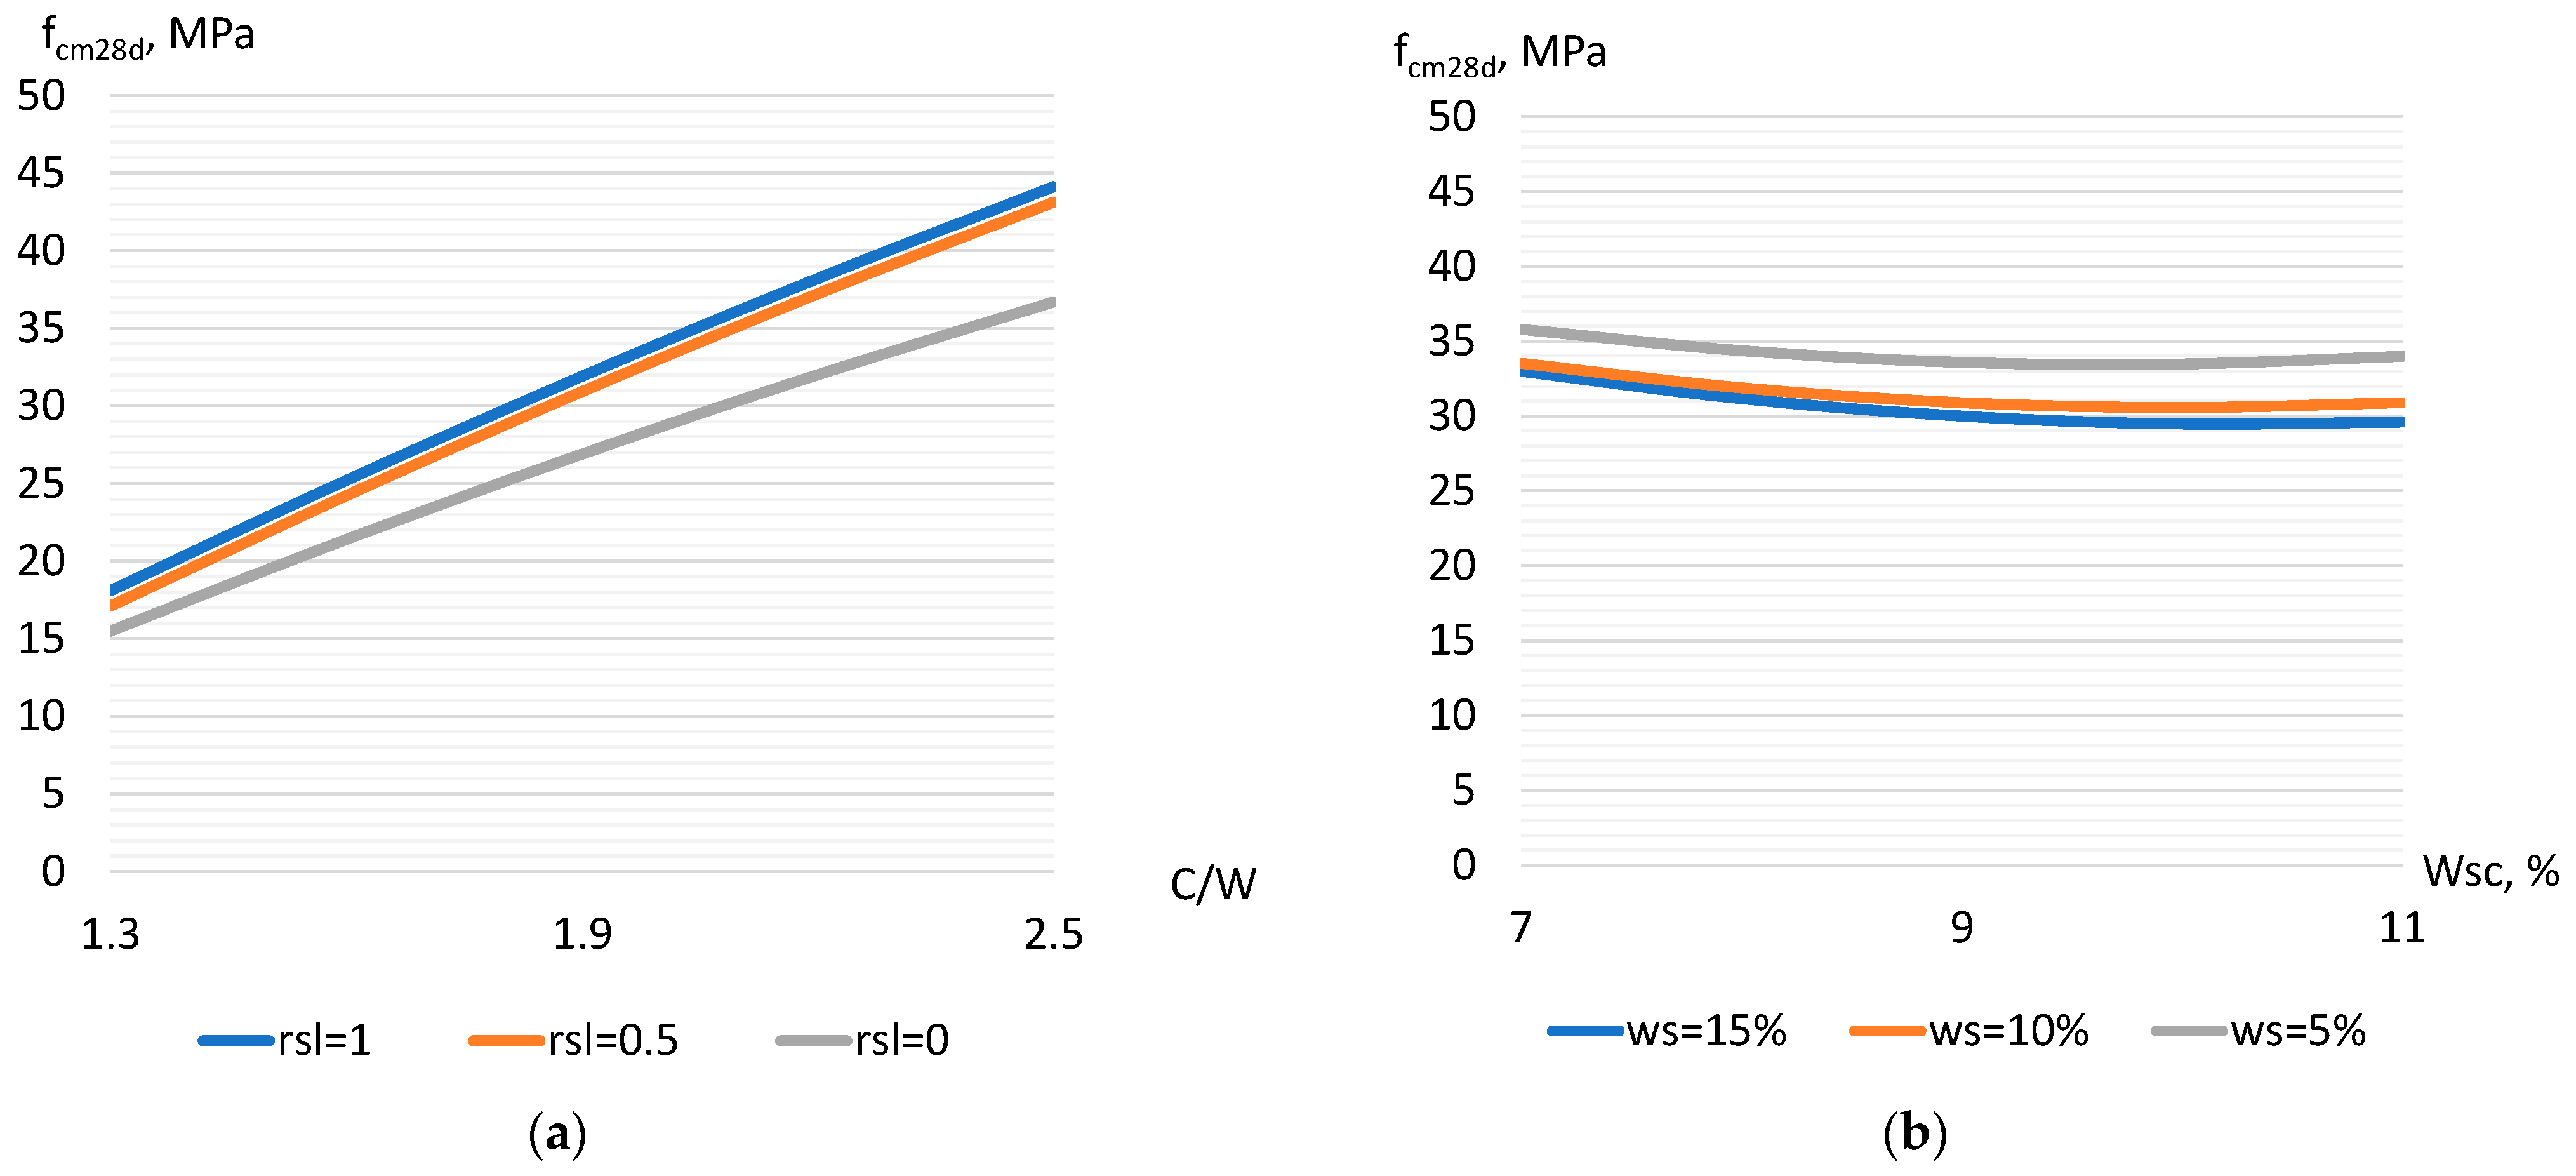
Figure 4.
The influence of the investigated factors on the cement use efficiency criterion for strength 4 h after steaming (a) and after 28 days (b).
Figure 4.
The influence of the investigated factors on the cement use efficiency criterion for strength 4 h after steaming (a) and after 28 days (b).
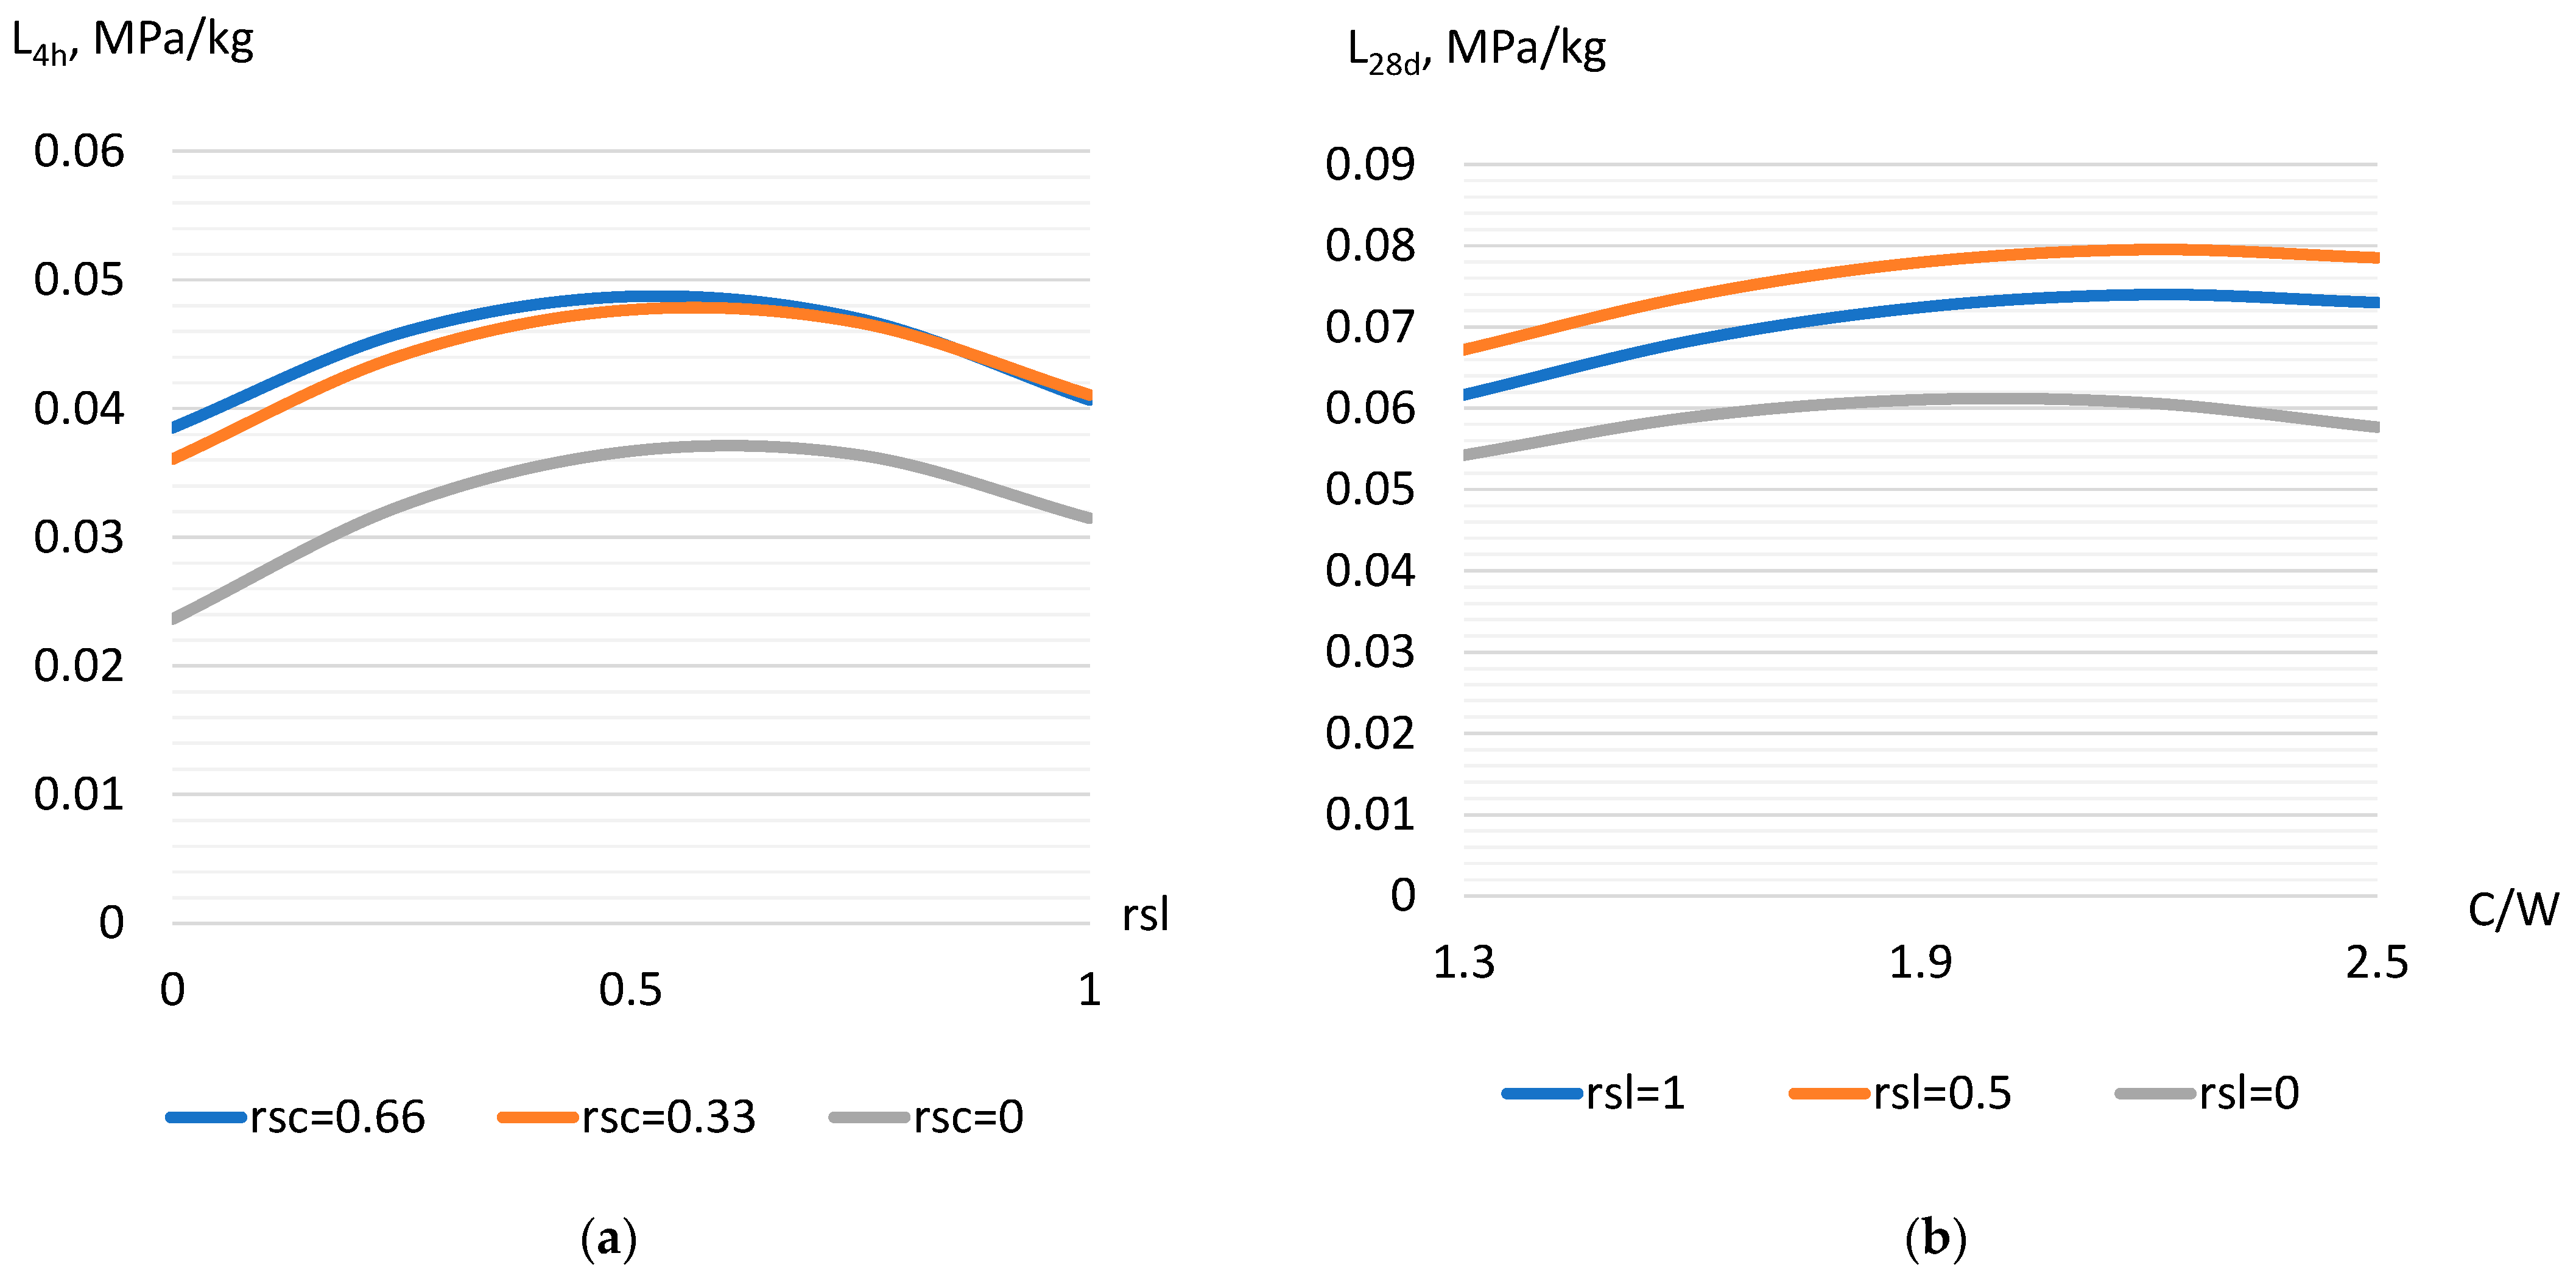
Table 1.
Physical and mechanical properties of Portland cement.
| Normal Consistency, % | Setting Time | Compressive Strength, MPa | |||
|---|---|---|---|---|---|
| Initial | Final | 2 Days | 7 Days | 28 Days | |
| 27.3 | 52 min | 2 h 35 min | 14.5 | 21.3 | 46.2 |
Table 2.
Water demand of aggregates.
| Aggregate | Fineness Modulus | Maximal Fraction, mm | The Content of Dusty and Clay Impurities, % | Water Demand, % |
|---|---|---|---|---|
| Quartz sand | 2.9 | 5 | 0.5 | 5 |
| 1.5 | 2.5 | 3.5 | 10 | |
| 1.1 | 1.25 | 5.2 | 15 | |
| Thermal power plant slag | 2.5 | 5 | 0.8 | 7 |
| 1.8 | 5 | 3.9 | 9 | |
| 1.5 | 2.5 | 4.5 | 11 | |
| Crushed granite stone | – | 20 | 0.5 | 1.5 |
| – | 20 | 2.5 | 2.5 | |
| – | 20 | 3.5 | 3.5 |
Table 3.
Experiment planning conditions.
| Factors | Variation Levels | Variation Interval | |||
|---|---|---|---|---|---|
| Natural | Coded | −1 | 0 | +1 | |
| Part of crushed stone in the aggregate mixture rsc | X1 | 0 | 0.33 | 0.66 | 0.33 |
| Part of slag in fine aggregate rsl | X2 | 0 | 0.5 | 1.0 | 0.5 |
| Water demand of crushed stone (wsc), % | X3 | 1.5 | 2.5 | 3.5 | 1.0 |
| Water demand of slag (wsl), % | X4 | 7.0 | 9.0 | 11.0 | 2.0 |
| Water demand of sand (ws), % | X5 | 5.0 | 10.0 | 15.0 | 5.0 |
| Cement–water ratio | X6 | 1.3 | 1.9 | 2.5 | 0.6 |
Disclaimer/Publisher’s Note: The statements, opinions and data contained in all publications are solely those of the individual author(s) and contributor(s) and not of MDPI and/or the editor(s). MDPI and/or the editor(s) disclaim responsibility for any injury to people or property resulting from any ideas, methods, instructions or products referred to in the content. |
© 2024 by the authors. Licensee MDPI, Basel, Switzerland. This article is an open access article distributed under the terms and conditions of the Creative Commons Attribution (CC BY) license (https://creativecommons.org/licenses/by/4.0/).
Share and Cite
MDPI and ACS Style
Dvorkin, L.; Zhitkovsky, V.; Makarenko, R.; Ribakov, Y. Analysis of Slag-Containing Steamed Concrete’s Composition Efficiency. Materials 2024, 17, 1300. https://doi.org/10.3390/ma17061300
AMA Style
Dvorkin L, Zhitkovsky V, Makarenko R, Ribakov Y. Analysis of Slag-Containing Steamed Concrete’s Composition Efficiency. Materials. 2024; 17(6):1300. https://doi.org/10.3390/ma17061300
Chicago/Turabian StyleDvorkin, Leonid, Vadim Zhitkovsky, Ruslan Makarenko, and Yuri Ribakov. 2024. "Analysis of Slag-Containing Steamed Concrete’s Composition Efficiency" Materials 17, no. 6: 1300. https://doi.org/10.3390/ma17061300
Note that from the first issue of 2016, this journal uses article numbers instead of page numbers. See further details here.