
Effect of Heteroatom Doping on Electrochemical Properties of Olivine LiFePO4 Cathodes for High-Performance Lithium-Ion Batteries
Key Laboratory of Power Station Energy Transfer Conversion and System of Ministry of Education and School of Energy Power and Mechanical Engineering, North China Electric Power University, Beijing 102206, China
*
Authors to whom correspondence should be addressed.
Materials 2024, 17(6), 1299; https://doi.org/10.3390/ma17061299
Submission received: 1 February 2024
/
Revised: 1 March 2024
/
Accepted: 8 March 2024
/
Published: 11 March 2024
(This article belongs to the Special Issue Electrodes, Electrolytes and Interfaces for High-Performance Rechargeable Batteries)
Abstract
:Lithium iron phosphate (LiFePO4, LFP), an olivine–type cathode material, represents a highly suitable cathode option for lithium–ion batteries that is widely applied in electric vehicles and renewable energy storage systems. This work employed the ball milling technique to synthesize LiFePO4/carbon (LFP/C) composites and investigated the effects of various doping elements, including F, Mn, Nb, and Mg, on the electrochemical behavior of LFP/C composite cathodes. Our comprehensive work indicates that optimized F doping could improve the discharge capacity of the LFP/C composites at high rates, achieving 113.7 mAh g−1 at 10 C. Rational Nb doping boosted the cycling stability and improved the capacity retention rate (above 96.1% after 100 cycles at 0.2 C). The designed Mn doping escalated the discharge capacity of the LFP/C composite under a low temperature of −15 °C (101.2 mAh g−1 at 0.2 C). By optimizing the doping elements and levels, the role of doping as a modification method on the diverse properties of LFP/C cathode materials was effectively explored.
1. Introduction
In recent decades, traditional energy consumption, notably that of coal and oil, has escalated, necessitating the exploration of developing renewable energy technologies to support energy consumption in a sustainable modern society. Based on the development of the sustainable energy transition, electrochemical energy storage (EES) technology has emerged [1,2,3]. EES systems are regarded as efficient systems which can store energy through chemical reactions to convert chemical energy into electric energy. According to the different reaction mechanisms, it can contain different energy storage technologies such as lead–acid batteries, sodium–sulfur batteries, liquid metal batteries, lithium–ion batteries (LIBs) [2], etc. Simultaneously, advanced EES systems featuring a high energy density, long–term cycle life, and superior energy conversion efficiency can effectively satisfy the demand of the peak–frequency regulation of power systems [2,3].
As an emerging energy storage device, LIBs have been widely applied due to their safety, high energy, long life, and good thermal stability [4,5]. In particular, the electrochemical properties of LIBs, such as their cycling lifespan, energy density, and rate performance, largely depend on the electrochemical properties of the selected cathode materials [6]. Therefore, the exploration of high–performance LIB cathode materials is one of the key directions to promote the further applications of LIBs in EES systems [7]. Currently, cathode materials for LIBs, including LiCoO2 (LCO), LiMn2O4 (LMO), LiNixCoyMn1−x−yO2 (NCM), LiNixCoyAl1−x−yO2 (NCA), and LiFePO4 (LFP), are extensively utilized. Each of these cathode materials has its own advantages and disadvantages in terms of energy density, cost, stability, lifetime, and safety. As one of the leading candidates for LIB cathode materials, LFP cathodes are widely used in various electrical appliances and electric vehicles due to their reasonable specific capacity (170 mAh g−1) [8], excellent cycling stability, and low cost. However, their lower Li+ diffusion coefficient (~10−16–10−14 cm2 s−1) and lower electrical conductivity (<10−9 S cm−1) [9,10] limit the further development of LFP cathodes. Therefore, diversified strategies have been undertaken to enhance the electrochemical performance of LFP cathodes, mainly including grain size tuning [11], carbon coating [12], and heteroatom doping [11,13]. For example, reducing the size of LFP particles aids in shortening the Li+ diffusion distance, thereby enhancing the rate performance and cycling stability. Carbon coatings can improve the electrical conductivity of cathode materials and further optimize the electrochemical performance of LFP cathodes. Meanwhile, carbon species can impede the growth of LFP grains during heat treatment, and they can be used as reduction agents to avoid the oxidation of Fe2+ to Fe3+. In addition, the problem of the low electrical conductivity of LFP could be partially solved by heteroatom doping. Yet, the doping mechanism is complex and requires further study.
Carbon coatings can fundamentally be categorized into in situ and ex situ coatings [14,15,16]. The in situ coating strategy requires the addition of an organic carbon source during the preparation of cathode materials. The organic carbon source can be decomposed to form carbon monomers, which are then attached to the surface of the LFP particles during the heat treatment process. Studies have suggested that in situ coating is more effective than ex situ coating with the direct addition of carbon materials [16,17,18,19]. The carbon sources used for carbon coatings are mainly organic carbon sources, including glucose, sucrose, citric acid, and cotinine black. These carbon sources have a strong affinity for the LFP surface and can be thermally decomposed during heat treatment. Due to their film–forming properties, a carbon coating is formed to encapsulate the LFP surface uniformly, thus promoting electrical conductivity [20,21]. Generally speaking, a carbon coating on a cathode material mainly enhances the surface conductivity, yet it has no significant impact on the internal material electrical conductivity due to the inherent structure. It is worth noting that the lattice structure can be altered by doping ions during the preparation of cathode materials. This may help to increase the intrinsic conductivity, Li+ diffusion coefficient, and charge–discharge voltage plateau of the materials, thereby improving the rate performance, cycling performance, and low–temperature electrochemical performance of the batteries. For doping modification, most common single-element doping techniques have been reported, and even synergistic modification by the co–doping of multiple elements has been applied. Due to the complexity of the doping mechanism, many types of cation doping, such as with Mg2+, Nb3+, Co2+, Ti4+, and V5+, and anion doping, such as with F−, Cl−, etc., have not been fully understood [22,23,24,25,26,27].
In this work, we used FePO4 (FP) as the precursor material and adopted the ball milling method to prepare LFP/C composites. We investigated the effects of different doping elements (F, Mn, Nb, and Mg) and doping amounts on the electrochemical properties of LFP/C composite cathodes. Specifically, our work presents a method for creating high–performance olivine–type cathode materials that are specifically suitable for LIBs under low–temperatrure operation conditions (−15 °C).
2. Experimental Section
2.1. Synthesis and Doping of LFP/C
As a control sample, an LFP/C cathode material was fabricated via the sol−gel method. We added FePO4 (Macklin, Shanghai, China, 99%) and CH3COOLi·H2O (Aladdin, Shanghai, China, 99%) into 20 mL of deionized water (Aladdin, Shanghai, China, AR) at a molar mass ratio of 1:1.05, followed by the addition of 15 wt.% ethylene glycol (Macklin, Shanghai, China, 99%) as well as 20 wt.% citric acid (C6H8O7, Macklin, Shanghai, China, 99%). Ethylene glycol serves as a complexing agent, increasing solution viscosity for sol–gel formation. Citric acid acts as both a carbon source and a complexing agent. The solution was stirred in a water bath at a temperature of 80 °C until a sol was formed. The sol was dried overnight at 80 °C in a vacuum oven before being fully ground in a mortar for 40 min and sieved (200 mesh). Then, the sieved powder was calcined in an OTF–1200X tube furnace (Hefei KeJing, Hefei, China) at 300 °C for 3 h and 700 °C for 7 h in an Ar atmosphere. Figure S1 shows the charge–discharge curve of the first cycle of the LFP/C prepared by the sol–gel method and its cycling performance. It can be seen that the cycling performance of the sample was poor, and the capacity retention rate was only 60% after 100 cycles at 0.2 C.
The studied LFP/C cathode materials were synthesized using the ball milling method coupled with a heat treatment. Firstly, the precursors FePO4 and Li2CO3 (calculated as 5% excess, Macklin, Shanghai, China, 99%); various dopant sources, including LiF (Macklin, Shanghai, China, 99%), Mn (CH3COO)2·4H2O (Macklin, Shanghai, China, 99%), and C10H5NbO20·xH2O (Aladdin, Shanghai, China, 99%); and the carbon source of glucose (Macklin, Shanghai, China, 99%) were placed in a ball milling jar, along with an appropriate amount of ethanol(Lanyi, Beijing, China, 99.8%) as a dispersant. The mixture was ground at a speed of 400 r/min for 12 h, filtered, and dried overnight at 80 °C. The dried filter cake was thoroughly ground for 40 min in a mortar and sieved (200 mesh). This powder was transferred to the OTF–1200X tube furnace for initial calcination at 300 °C for 3 h in an Ar atmosphere, followed by a secondary heat treatment at 700 °C for 7 h. The heating/cooling rate of the calcination process was 5 °C/min, and the gas flow rate was maintained at 0.5 L/min. The resulting modified materials were labeled as LFP/C and LFP/C–Xn, respectively (X is the dopant element, and n is the ratio of molar fraction of the doping element, X = F, Mn, Nb, and Mg). The preparation process of the LFP/C cathode materials is illustrated in Figure 1.
To assess the electrochemical performance of the LFP/C and LFP/C–Xn, the preparation of cathode disks was carried out. Sintered LFP/C active material, conductive carbon black (Super P, conductive agent), and polyvinylidene fluoride (PVDF, binder) were weighed at a ratio of 8:1:1. The weighed PVDF was added to a stirring bottle prior to the introduction of an appropriate amount of N–methyl–2–pyrrolidone (NMP). The solution underwent magnetic stirring until the PVDF was completely dissolved in the NMP. Meanwhile, the weighed active material and Super P were homogenized in a mortar to obtain a uniform mixture. The well–mixed material was added to the stirring bottle and continued to be stirred for 6 h to achieve a homogeneous slurry. Subsequently, the slurry was uniformly deposited onto Al foil using an applicator and dried overnight at 120 °C, and then punched and pressed into 12 mm diameter cathode disks.
2.2. Material Characterization
The crystal structures of the synthesized samples were elucidated via X–ray diffraction (XRD, PANalytical X´Pert3 Powder, Alemlo, The Netherlands). A diffractometer, utilizing Cu–Kα radiation (λ = 0.15418 nm) at 36 kV and 30 mA and scanning at 2° min−1, was utilized to record XRD patterns from 2θ = 10° to 80°. Scanning electron microscopy (SEM, Hitachi S–4800, Tokyo, Japan) was employed for surface morphology analysis. Simultaneously, an energy-dispersive spectrometer (EDS, Oxford EMAX, Oxford, UK) was employed for element mapping to verify homogeneous doping. Fourier-transform infrared (FT-IR, Shimadzu IR Affinity-1S spectrometer, Shimadzu, Kyoto, Japan) spectra in the range of 2000–400 cm−1 were recorded by a Shimadzu IRAffinity-1s spectrometer. Surface compositions and included elements were characterized using X-ray photoelectron spectroscopy (XPS, EscaLab 250Xi, Perkin Elmer, Waltham, MA, USA). The X-ray source was an aluminum (Al) and magnesium (Mg) thin-film dual-anode target with a spot size of 650 μm. C 1s (284.8 eV) was selected as the calibration value. A thermogravimetric analyzer (TGA, TGDTA7300, Tokyo, Japan) was utilized to study the mass variation in the sample versus temperature shift. In this experiment, the sintered LFP was thermogravimetrically analyzed to examine the carbon content under the following conditions: air atmosphere, temperatures between 20 °C and 800 °C, heating rate of 10 °C min−1.
2.3. Electrochemical Characterization
All coin–type cells (CR2032) were assembled in an argon–filled glovebox, utilizing the prepared cathode disk as the cathode, the Celgard 2500 apparatus as a separator, and Li foil for counter electrodes. As an electrolyte, 1 mol L−1 LiPF6 dissolved in organic solvents of dimethyl carbonate/ethylene carbonate/ethyl methyl carbonate (DMC: EC: EMC = 1:1:1 by volume) and 1 vol.% vinylidene carbonate (VC) was used.
Galvanostatic charge–discharge tests between 2.5 and 4.2 V at 25 °C were performed by a Land battery tester (CT3002A), initially at 0.2 C (1 C = 170 mA g−1) for the first three cycles, followed by additional charge–discharge assessments at 0.2 C, 0.5 C, 1.0 C, 2.0 C, 5.0 C, and 10.0 C. In addition, the low–temperature electrochemical performance was evaluated at −15 °C in a high–low–temperature test chamber (BPH−060B, Shanghai Yiheng, Shanghai, China).
Electrochemical Impedance Spectroscopy (EIS) and Cyclic Voltammetry (CV) were conducted utilizing an electrochemical workstation (CHI760E, Chenhua, Shanghai, China). CV tests were operated between 2.5 and 4.2 V at 0.1–0.5 mV s−1. EIS tests were carried out by sweeping frequencies from 100 kHz to 0.01 Hz at an amplitude of 5 mV.
3. Results and Discussion
Figure 2, Figure 3, and Figure S2 show the XRD patterns of the prepared LFP/C and LFP/C–Xn materials with their refinement results and associated structural details (PDF#40–1499). All the samples have similar XRD diffraction peaks, all of which can be indexed to an orthorhombic crystal system (the space group Pnma). No peaks related to dopant elements appeared, as only trace amounts of dopant elements (F, Mn, Nb, and Mg) were contained in the doped LFP samples.
Figure 2b,c present the local amplification of (020), (031), (211), and (140) diffraction peaks. When doped with other elements, the diffraction peaks shifted to lower 2θ degrees. The ionic radii of Mn2+, Nb5+, Mg2+, and F− are 0.83 Å, 0.64 Å, 0.72 Å, and 1.33 Å, respectively, compared to O2− (1.4 Å) and Fe2+ (0.74 Å). Therefore, Nb5+, Mg2+, and Mn2+ can substitute Fe2+ for diffusion into the octahedral interstices on the LFP surface lattice, while Fˉ can easily replace O2− in the LFP lattice [28,29]. Furthermore, Tables S1 and S2 exhibit the lattice parameters obtained by structural refinement in Figure 3. As shown in Figure 2b,c and Table S1, the variation patterns of lattice parameters a, b, and c are consistent with the shifts of the (020), (031), (211), and (140) diffraction peaks. The lattice parameter decreased, while the diffraction peaks were all shifted towards the left direction. According to the refinement results in Tables S1 and S2, the lattice parameters a, b, and c of the doped LFP/C are less than those of the undoped LFP/C, suggesting that elemental doping affects the crystal structure of LFP/C by influencing the lattice parameters. Inside the LFP lattice, Li+ migration is one–dimensional, and reducing the lattice parameter b can shorten the Li+ diffusion pathway and increase the Li+ diffusion coefficient, thus improving the electrochemical properties of the samples [13].
In addition, SEM and EDS elemental mapping were performed to observe the morphologies and compositions of the LFP/C and doped samples. SEM images of the precursor FePO4, LFP/C, and doped modified LFP/C–Xn are shown in Figure 4 and Figure S3. It can be observed that there was no significant change in the morphology of the particles of the doped modified sample compared to the undoped sample. The size of the cathode material particles ranged from 2 to 5 μm. The secondary particles were aggregated from primary particles [30,31]. Figures S4–S7 illustrate the elemental mapping in the LFP/C and LFP/C–Xn. In the EDS spectra, the distribution of doping elements F, Nb, Mn, and matrix elements Fe, P, and O almost coincide uniformly, indicating that the doped elements were successfully doped into the bulk phase of the LFP matrix, while the C elements are mainly distributed on the surface of the LFP particles, indicating that the carbon film formed by the carbon coating was uniformly distributed around the surface of the LFP cathode.
To further confirm that the carbon in the materials was produced by the pyrolysis of glucose, FT–IR was performed on glucose, LFP, LFP/C and doped cathode materials. The FT–IR spectra shown in Figure S8 indicate that the thermal decomposition of glucose occurred during the heat treatment, resulting in the formation of a uniform and dense carbon coating layer around the LFP particles. This layer could largely enhance the electrical conductivity of the LFP/C cathode materials [32,33]. From the FT–IR spectra, the carbon–coated LFP/C showed blue–shifted absorption bands in the ranges of 1200–900 cm−1 and 700–400 cm−1 with additional absorption peaks of ~1141 cm−1 as compared to that of the LFP without carbon coating, which further proves that glucose interacts with LFP during heat treatment [34,35].
TGA tests were performed on the cathode materials to roughly calculate the carbon contents of the materials. The TGA plots in Figure S9 reveal a small degree of sample weight loss below 300 °C, which is attributed to crystallization water loss. Beyond 300 °C, LFP/C began to be oxidized with the oxidation products Fe2O3 and Li3Fe2(PO4)3. At this point, the carbon–coated LFP undergoes the following two reactions [36]:
Based on these two reactions, the theoretical weight gain of pure LFP is 5.07 wt.%. According to the measured TG curves shown in Figure S9, the actual weight gain of the LFP/C–F3, LFP/C–Nb1, and LFP/C–Mn3 samples were 3.07, 3.16, and 2.6 wt.%, respectively. The percentage of carbon (Cwt%) can be calculated using the following equation [36]:
In Equation (1), a is the percentage of actual weight increase for the samples and b is the percentage of theoretical weight increase for the pure LFP. The carbon contents in LFP/C–F3, LFP/C–Nb1, and LFP/C–Mn3 were calculated as 1.90, 1.82, and 2.35 wt.%, respectively [37]. Figure S10 shows the charge–discharge curves of LFP/C samples with varying glucose contents. The discharge capacity of LFP/C increased remarkably with 5% glucose content but gradually diminished with the glucose content further increasing to 20%. In conjunction with Figure S9, only a limited amount of glucose interacts with the LFP surface as the carbon content increases, while partially pyrolyzed carbon produces an excessively thick carbon layer, which leads to negative effects such as higher battery resistance and lower reversible capacity [12,38]. In the LFP/C–Xn preparation process, the carbon content was optimized to be 5%.
In order to further prove that the structural changes from the XRD results were caused by the doping of elements, the elemental compositions and chemical bonding states of LFP/C, LFP/C–F3, and LFP/C–Nb1 were elucidated using XPS, as illustrated in Figure S11. The full spectrum is presented in Figure S11h. The XPS spectra of all samples show typical peaks for C 1s, P 2p, O 1s, Li 1s, and Fe 2p. Figure S11f,g confirm the presence of Nb 3d5/2 and Nb 3d3/2 at the 206.64 and 209.39 eV peaks [39,40] and F 1s at the 691.85 eV peak in LFP/C–Nb1 and LFP/C–F3, respectively, signifying the successful doping of F and Nb elements in the LFP/C cathode material.
The electrochemical performances of the LFP/C and doped samples were tested using a variety of test methods and treatments. Figure S12 demonstrates the charge–discharge curves at 0.2 C in the first cycle for the LFP/C and LFP/C–Xn cathode materials. These data indicate that LFP/C, LFP/C–F3, LFP/C–Nb1, and LFP/C–Mn3 have discharge capacities of 156.5 mAh g−1, 153.3 mAh g−1, 152.5 mAh g−1, and 148.1 mAh g−1, respectively. Figure S13 presents the irreversible capacity difference between the first lap charge capacity and discharge capacity for each sample; the irreversible capacity of the LFP/C, LFP/C–Mn3, LFP/C–Nb1, and LFP/C–F3 cathodes is 21.9 mAh g−1, 19.5 mAh g−1, 18 mAh g−1, 16 mAh g−1, respectively. This figure allows for a more visual comparison of initial Coulombic efficiency. The charge–discharge profiles of LFP/C and LFP/C–Xn at 0.2 C for the 1st, 25th, 50th, 75th, and 100th cycles are depicted in Figure 5a–d. The decaying discharge capacities of the cycled LFP/C, LFP/C–F3, LFP/C–Nb1, and LFP/C–Mn3 cathodes are 14.2 mAh g−1, 10.4 mAh g−1, 6.9 mAh g−1, and 13.3 mAh g−1 at 0.2 C, respectively. The rate performances of the LFP/C and LFP/C–Xn are illustrated in Figure 5e. As the rate increases, LFP/C–F3 exhibits the highest discharge capacity, and the discharge capacity of LFP/C drops below that of LFP/C–Mn3 at 5 C and 10 C. Returning from 10 C to 0.2 C, LFP/C–Nb1 and LFP/C–F3 maintain the highest capacity, which shows their superior electrochemical performance. It could also indicate that the cycling performance of the doped LFP was improved to some extent. Among the cathodes, the cycling performance of LFP/C–Nb1 was the best. Figure 5f compares the cycling performance of these samples at 0.2 C, revealing that LFP/C–Nb1 exhibits a higher capacity retention rate of 96.1% after 100 cycles, compared to LFP/C–F3 (93.3%), LFP/C–Mn3 (90.9%), and undoped LFP/C (90.1%). Combined with the XRD refinement results, F− and Nb5+ can be effectively doped into the lattice to change the lattice structure, producing defects favorable to the lattice, reducing the internal resistance of the material and the Li+ diffusion path, and improving the electrical conductivity of the material, which in turn improves the high rate performance and cycling performance of the materials. The EIS test and CV test of the Li+ diffusion coefficient were conducted on the batteries later to verify our speculation.
To evaluate the electrochemical properties of cathode materials upon cycling, the evolution of the capacity differential curves was investigated. The dQ/dV curves of the samples are shown in Figure S14. During the cycling process, the prepared cathodes underwent a series of phase transitions from the LFP phase to the FP phase, and the reasonable introduction of other elements enhanced the cycling stability of the materials. By observing the dQ/dV curves for each number of cycles and comparing the changes in the curves as the cycle proceeds, the greater the change in the shape of the curves, the more stable the structure of the material is, which also implies a higher reversibility and better cycling stability. By comparison, the LFP/C–Nb1 exhibits higher reversibility, corresponding to its superior cycling performance. To visualize the degradation of the specific capacity of samples at different rates, the charge–discharge curves of the samples at rates of 0.2 C–2 C–5 C–10 C were integrated, as shown in Figure S15. From 0.2 C to 10 C, the capacities of LFP/C, LFP/C–F3, LFP/C–Nb1, and LFP/C–Mn3 decrease from 149.9 mAh g−1, 155.1 mAh g−1, 154.3 mAh g−1, and 151.7 mAh g−1 to 97.9 mAh g−1, 113.7 mAh g−1, 108.9 mAh g−1, and 100.4 mAh g−1, respectively. As the discharging current increases, the LFP/C–F3 cathode displays superior rate performance. In order to verify whether the electrochemical performance of the doped LFP at a high rate is the same as that at low rate, the samples were subjected to high–rate long–cycle tests. The cycling performance of the LFP/C and LFP/C–Xn cathodes at 2 C and 5 C is illustrated in Figure S16. Notably, the LFP/C–F3 cathode outperformed the rest in both discharge specific capacity at 2 C and 5 C–, while the LFP/C–Nb1 was able to maintain high capacity retention after 100 cycles. LFP/C–Mn3 exhibited enhanced cycling performance compared to LFP/C. Figure 6 shows the charge–discharge curves of LFP after doping with different contents of each element, which shows the optimum doping content of each element. Figure 6 demonstrates that superior electrochemical performance was achieved by LFP/C–F3, LFP/C–Nb1, LFP/C–Mn1, and LFP/C–Mg1 when subjected to F, Nb, Mn, and Mg single–element doping, respectively. The Mg doping, however, proved ineffective due to its overall inferior doping effect. Concerning Mn doping, LFP/C–Mn3 was chosen for further examination due to its superior low–temperature properties compared to LFP/C–Mn1, as depicted in Figure S17. All of these data indicate that appropriate F, Nb doping can improve the cycling stability of LFP/C materials without compromising capacity [41,42]. Figure 5e,f, Figure 6, Figures S15 and S16 confirm the superior discharge capacity and cycling stability of the doped LFP/C–F3 and LFP/C–Nb1 at different rates, attributed to the enhanced interfacial stability between the electrode and the electrolyte [43,44,45].
To investigate the effect of different doping elements on the low–temperature capacity of LFP/C cathode materials, LFP/C cells were assembled using three different electrolytes (electrolyte No. 1, 2, and 3) [46,47,48], which underwent charging and discharging assessments at −15 ℃. Electrolyte No. 1 contained 1M LiPF6 in PC: EC: EMC = 1:1:4 Vol%. Electrolyte No. 2 was composed of 1M LiPF6 in EC: EMC = 3:7 Vol% + 1%VC, and electrolyte No. 3 consisted of 1M LiPF6 in DMC: EC: EMC = 1:1:1 Vol% + 1%VC. Figure 7a depicts the charge–discharge curves of LFP/C batteries at −15 °C at 0.2 C, and the battery assembled with the No. 1 electrolyte demonstrated the highest discharge capacity of 79.4 mAh g−1. The battery using the No. 2 and No. 3 electrolytes had reduced capacities of 72.2 mAh g−1 and 62.5 mAh g−1, respectively. These findings suggest that the optimized electrolytes can significantly boost the capacity of the doped LFP/C cathodes. Therefore, all subsequent low–temperature performance tests were conducted using the No. 1 electrolyte. Figure 7b demonstrates the charge–discharge curves of LFP/C and LFP/C–Xn at 0.2 C, where the highest discharge capacity was achieved by LFP/C–Mn3, reaching 102.8 mAh g−1 at −15 °C. Figure 7c shows the cycling performances at 2 C, with the LFP/C–Mn3, LFP/C–F3, and LFP/C–Nb1 demonstrating improved discharge capacities of 78.4, 63.7, and 57.1 mAh g−1, respectively, over the undoped LFP/C at 50.8 mAh g−1. It indicates that the doping of Mn effectively modified the structure of LFP, giving it some of the performance of the LiFexMn1−xPO4 (LFMP), with the low–temperature performance being superior to that of LFP. Meanwhile, the discharge capacity of LFP/C–Nb1 decayed faster with increasing current density, which is consistent with its rate properties at room temperature. Figure 7d displays the charge–discharge curves for 100 cycles at 0.2 C (−15 °C), highlighting superior cycling performances at low temperatures, with no significant capacity loss after 100 cycles. In particular, LFP/C–Mn3 displayed superior low–temperature discharge capacity and rate performance compared to the undoped LFP/C, LFP/C–F3, and LFP/C–Nb1, suggesting that rational Mn doping can effectively enhance the low–temperature performance of the LFP/C. This is attributed to the fact that with the addition of an appropriate amount of Mn, the material exhibits some of the partial electrochemical properties of the LFMP. Although the LFMP is poor in electrical conductivity, it has better low–temperature performance than that of LFP, which is also consistent with the above test results.
The constant–current charge–discharge tests, CV measurements, and EIS tests were performed on the samples, and the fitting results were analyzed to support the above conclusions. Figure 8a–c and S18a depict the CV curves of the LFP/C, LFP/C–Nb1, LFP/C–F3, and LFP/C–Mn3 between 2.5 and 4.2 V at a rate of 0.1 mV s−1. The data reveal a pair of characteristic peaks that mark Li+ extraction and intercalation phase transitions. The potential difference (ΔE), defined as the difference between the peak oxidation voltage and the peak reduction voltage, provides crucial insights into electrode polarization and the reversibility of redox reactions in materials [49]. A lower ΔE value indicates a lower polarization degree of the electrode reaction and faster Li+ transfer during cycling, thereby improving stability and reversibility [50]. Therefore, it can be concluded that LFP/C–F3 and LFP/C–Nb1 possess superior structural stability and phase transition reversibility [51,52], with their ΔE values in the first cycle (0.199 V and 0.227 V, respectively) being lower than both LFP/C–Mn3 and the undoped LFP/C (0.253V and 0.323 V, respectively). The subsequent ΔE values at the second and third cycles corroborate this finding.
To assess the effect of doping modification on Li+ transport at the surface of the LFP/C electrodes, CV analysis was executed at different scan rates (0.1–0.5 mV s−1), as shown in Figure 8d–f and S18b. A linear correlation of the open–square value of the CV scan rate (v1/2) with the peak current (ip) yields the slopes of the charging and discharging processes (IA and IC), indirectly representing the Li+ diffusion coefficient of the samples (DLi+). For the precise determination of DLi+, the Randles–Sevcik equation should be used, as shown in Equation (2) [39,53,54].
Here, n denotes the number of electrons involved in redox reactions; ip represents the peak current (mA); A signifies the electrode geometric area (cm2); DLi+ denotes the Li+ diffusion coefficient; C relates to the Li+ concentration of (mol cm−3); and v corresponds to the potential scan rate (V s−1) [39].
The relation between DLi+ and the slope of ip–v1/2 suggests a direct proportionality. A larger slope implies increased DLi+. The slopes of the curves (IA and IC) for all samples’ curves were initially calculated through linear fitting, followed by the calculation of DLi+ during charging (DOI) and discharging (DRI) by Equation (2), and the results are shown in Table S3 and Figure 8g; they highlight that LFP/C–F3 exhibits superior slopes and subsequent DRI (1.15 × 10⁻¹¹ cm2 s−1) compared to the undoped LFP/C, LFP/C–Nb1, and LFP/C–Mn3 cathodes. The fitting results of the EIS spectra can be seen in Figure 8h,i and Table S4. As illustrated in Figure S19, an equivalent circuit model fitted using the EIS data indicates Rs, Rct, ω1, and CPE1 correspond to ohmic resistance, charge transfer resistance, Warburg impedance, and nonideal capacitance of the surface layer, respectively [55,56]. Table S4 shows that LFP/C–F3 displayed the lowest Rs value of 1.76 Ω after the initial three cycles, rising to 3.381 Ω after 100 cycles. LFP/C–Nb1 displayed a rise of Rs value from 2.509 Ω to 3.326 Ω, and the Rs value of LFP/C–Mn3 grew from 2.844 Ω to 4.231 Ω after 100 cycles. After 100 cycles, the Rct value of LFP/C–Nb1 increased slowly from 20.88 Ω to 110.1 Ω, while the LFP/C’s Rct escalated dramatically from 76.52 Ω to 378.5 Ω. In contrast, the Rct values for LFP/C–F3 and LFP/C–Mn3 rose to 199.7 Ω and 206.14 Ω after 100 cycles. The lower the impedance of the cell, the better the Li+ diffusion rate and the better the cycling performance of the cell. The impedance fitting results underscore the superior stability of LFP/C–Nb1 under prolonged cycling. The determination of the Li+ diffusion coefficient (DLi+) is outlined in Equations (3)–(5) [39,57,58,59], which are provided below.
In Equations (3) and (4), A signifies the cathode surface area (1.1304 cm−2), n reflects the number of transferred electrons (1), F equates to Faraday’s constant (96,485. 34 C mol−1), R represents the gas constant (8.314 J mol−1 K−1), T is the absolute temperature (298.15 K), and ω denotes the Li+ concentration, with σω being the characteristic Warburg factor related to Z′ [39] as calculated from Equation (4) by fitting to Figure S20. In Equations (3) and (5), c0 denotes the active substance concentration in mol cm−3; m stands for the active substance mass on the test electrode in g; M symbolizes the relative molecular weight of the material in g mol−1; d is the electrode coating thickness in cm; and A is the previously described electrode surface area.
This analysis affirms that the DLi+ of LFP/C was 2.36 × 10⁻¹³ cm2 s−1 in the third cycle, with this rapidly declining in subsequent cycles. The DLi+ values for LFP/C–F3, LFP/C–Nb1, and LFP/C–Mn3 were 8.72 × 10⁻¹³ cm2 s−1, 7.14 × 10⁻¹³ cm2 s−1, and 4.06 × 10⁻¹³ cm2 s−1, respectively. After 100 cycles, the DLi+ of LFP/C decreased to 5.58 × 10⁻¹⁴ cm2 s−1, while the DLi+ of LFP/C–F3, LFP/C–Nb1, and LFP/C–Mn3 decreased to 2.15 × 10⁻¹³ cm2 s−1, 4.59 × 10⁻¹³ cm2 s−1, and 1.37 × 10⁻¹³ cm2 s−1, respectively. This signifies the effectiveness of F and Nb modification in enhancing ion transfer kinetics, concurring with the electrochemical performance of the batteries.
4. Conclusions
A variety of high–performance LFP/C composite cathodes modified by doping different elements (F, Mn, Nb, and Mg) were prepared via ball milling and carbothermal reduction. Comparing the samples after doping with each element, the elements F, Nb, and Mn could improve the performance of LFP in some respects, while Mg doping was less effective. The results indicate that the optimized LFP/C–F3 cathode showed an excellent specific capacity at an elevated rate (123.3 mAh g−1 at 5 C and 113.7 mAh g−1 at 10 C). The designed LFP/C–Nb1 cathode presented stable cycling performance (96.1% capacity retention after 100 cycles at 0.2 C), and the selected LFP/C–Mn3 cathode exhibited superior low–temperature performance (101.2 mAh g−1 at 0.2 C at −15 °C). Meanwhile, in order to give support to the above results, an EIS test and CV test were conducted, and Li+ diffusion coefficients were calculated based on the results of both tests. These calculated and fitted results indicated that the F− and Nb+ doped LFPs possessed higher Li+ diffusion coefficients and lower impedances, attributed to the improved rate and cycling performance. This study provides a strategic pathway to improve the properties of LFP/C cathode materials through doping modification, intensifying the understanding of the doping mechanism in LFP/C cathode materials for LIBs. Future work will be conducted to explore the effect of elemental doping on LFP, including the elements that have been doped (F, Nb, Mn) and those that have not yet been investigated (e.g., Ti, Al, Zr, Ru, etc.). At the same time, we will increase the content of Mn elements in LFP/C−Mnn transitioning to LFMP, initiating related studies on LFMP.
Supplementary Materials
The following supporting information can be downloaded at: https://www.mdpi.com/article/10.3390/ma17061299/s1. Figure S1. (a)Charge/discharge curves of LFP cathode materials prepared by sol–gel method at first cycle and (b) the related cycling performance of as–prepared LFP cathode at 0.2C. Figure S2. The optimized structures of (a) LiFePO4 and (b) FePO4. Figure S3. SEM images of the FePO4 precursor particles (a) and the corresponding magnified images (b). Figure S4. The SEM image and the corresponding elemental mapping images for the selected area of LFP/C particle. Figure S5. The SEM image and the corresponding elemental mapping images for the selected area of LFP/C–F3 particle. Figure S6. The SEM image and the corresponding elemental mapping images for the selected area of LFP/C–Nb1 particle. Figure S7. The SEM image and the corresponding elemental mapping images for the selected area of LFP/C–Mn3 particle. Figure S8. FT–IR spectra of C6H12O6, LFP, LFP/C and LFP/C–Xn cathode materials. Figure S9. TGA curves of LFP/C–Nb1, LFP/C–F3, LFP/C–Mn3. Figure S10. Charge–discharge curves of LFP/C samples with different glucose contents. Figure S11. XPS spectra and the fitting results of LFP/C–F3, LFP/C–Nb1 and LFP/C for cathode materials. (a) C 1s spectra, (b) P 2p spectra, (c) O 1s spectra, (d) Li 1s spectra, (e) Fe 2p spectra, (f) Nb 3d spectra, (g) F 1s spectra and (h) the full spectrum of the as–prepared samples. Figure S12. The first–cycle charge–discharge curves of LFP/C and LFP/C–Xn cathodes. Figure S13. The first charge–discharge curves of the (a) LFP/C, (b) LFP/C–F3, (c) LFP/C–Nb1, and (d) LFP/C–Mn3 cathodes at 0.2 C. Figure S14. The selected dQ/dV curves of (a) LFP/C, (b) LFP/C–F3, (c) LFP/C–Nb1 and (d) LFP/C–Mn3 at 0.2C in different cycles. Figure S15. Charge–discharge curves of (a) LFP/C, (b) LFP/C–F3, (c) LFP/C–Nb1 and (d) LFP/C–Mn3 under different charge/discharge rates. Figure S16. Cycling performance of LFP/C, LFP/C–F3, LFP/C–Nb1, and LFP/C–Mn3 samples at (a) 2 C and (b) 5C in the range of 2.5–4.2 V at 25 °C. Figure S17. The charge–discharge curves of Mn–doped LFP/C cathodes at 0.2 C at low temperature −15 °C. Figure S18. CV curves of (a) LFP/C–Mn3 at a scan rate of 0.1 mV s−1 and (b) LFP/C–Mn3 at various scan rates. Figure S19. Equivalent circuit diagram fitted and used in EIS data. Figure S20. The relationship between low–frequency Z′ and ω−0.5 values derived from EIS results of LFP/C, LFP/C–F3, LFP/C–Nb1 and LFP/C–Mn3 samples after (a) 3 cycles and (b)100 cycles. Table S1. Structural parameters obtained from Rietveld refinements of XRD patterns of the LFP/C and dopant–modified cathode materials [27,60]. Table S2. Rietveld refinement results of the LFP cathode materials modified by doping. Table S3. Slope values of fitted ip–v1/2 curves and diffusion coefficients of charged (DOI) and discharged (DRI) lithium ions of LFP/C, LFP/C–F3, LFP/C–Nb1, and LFP/C–Mn3 cathodes for CV tests at different scan rates. Table S4. Ohmic resistance (Rs) and charge transfer resistance (Rct) values and calculated Li+ diffusion diffusion coefficients (DLi+) for LFP/C, LFP/C–F3, LFP/C–Nb1, and LFP/C–Mn3 cathodes after different cycles. Table S5. Specific capacity of multiple LFP/C and doped LFP/C samples at different rates. Table S6. Standard deviation of LFP/C and doped samples at different rates.
Author Contributions
Conceptualization, Y.X. and H.T.; formal analysis, X.J., B.H., F.Z. and H.T.; investigation, X.J.; methodology, H.T.; supervision, Y.X. and H.T.; writing—original draft, X.J.; writing—review and editing, Y.X., B.H., F.Z. and H.T. All authors have read and agreed to the published version of the manuscript.
Funding
The Interdisciplinary Innovation Program of North China Electric Power University (No. XM2212315).
Institutional Review Board Statement
Not applicable.
Informed Consent Statement
Not applicable.
Data Availability Statement
Data are contained within the article.
Conflicts of Interest
The authors declare no conflicts of interest.
Abbreviations
| LFP | LiFePO4 |
| FP | FePO4 |
| LFP/C | Carbon–coated LiFePO4 |
| LFP/C–Fn | Carbon–coated LiFePO4 doped with n at.% F |
| LFP/C–Nbn | Carbon–coated LiFePO4 doped with n at.% Nb |
| LFP/C–Mnn | Carbon–coated LiFePO4 doped with n at.% Mn |
| LFMP | LiFeMnPO4 |
| LFP/C–Xn | Carbon–coated LiFePO4 doped with n at.% X dopant element |
References
- Karami, M.; Masoudpanah, S.M.; Rezaie, H.R. Solution combustion synthesis of hierarchical porous LiFePO4 powders as cathode materials for lithium-ion batteries. Adv. Powder Technol. 2021, 32, 1935–1942. [Google Scholar] [CrossRef]
- Huang, J.; Zhu, Y.; Feng, Y.; Han, Y.; Gu, Z.; Liu, R.; Yang, D.; Chen, K.; Zhang, X.; Sun, W.; et al. Research Progress on Key Materials and Technologies for Secondary Batteries. Acta Phys.-Chim. Sin. 2022, 38, 2208008. [Google Scholar] [CrossRef]
- Choi, J.; Zabihi, O.; Ahmadi, M.; Naebe, M. Advancing structural batteries: Cost-efficient high-performance carbon fiber-coated LiFePO4 cathodes. RSC Adv. 2023, 13, 30633–30642. [Google Scholar] [CrossRef]
- Catenaro, E.; Onori, S. Experimental data of lithium-ion batteries under galvanostatic discharge tests at different rates and temperatures of operation. Data Brief 2021, 35, 106894. [Google Scholar] [CrossRef] [PubMed]
- Hsieh, H.W.; Wang, C.H.; Huang, A.F.; Su, W.N.; Hwang, B.J. Green chemical delithiation of lithium iron phosphate for energy storage application. Chem. Eng. J. 2021, 418, 129191. [Google Scholar] [CrossRef]
- Apachitei, G.; Heymer, R.; Lain, M.; Dogaru, D.; Hidalgo, M.; Marco, J.; Copley, M. Scale-Up of Lithium Iron Phosphate Cathodes with High Active Materials Contents for Lithium Ion Cells. Batteries 2023, 9, 518. [Google Scholar] [CrossRef]
- Gadomski, K.; Buchberger, D.A.; Pietrzak, T.K. Synthesis and electrical properties of glassy and nanocrystalline LiFePO4. J. Non Cryst. Solids 2024, 625, 122771. [Google Scholar] [CrossRef]
- Bal, B.; Ozdogru, B.; Nguyen, D.T.; Li, Z.; Murugesan, V.; Capraz, O.O. Probing the Formation of Cathode-Electrolyte Interphase on Lithium Iron Phosphate Cathodes via Operando Mechanical Measurements. ACS Appl. Interfaces 2023, 15, 42449–42459. [Google Scholar] [CrossRef]
- Dos Santos Junior, G.A.; Fortunato, V.D.S.; Gandra, F.G.; Nascentes, C.C.; Silva, G.G.; Ortega, P.F.R.; Lavall, R.L. Electrochemical performance of hybrid supercapacitor device based on Mn-doped LiFePO4/C and imidazolium ionic liquid electrolyte. J. Energy Storage 2023, 74, 109112. [Google Scholar] [CrossRef]
- Kanagaraj, A.B.; Chaturvedi, P.; Alkindi, T.S.; Susantyoko, R.A.; An, B.H.; Patole, S.P.; Shanmugam, K.; AlMheiri, S.; AlDahmani, S.; AlFadaq, H.; et al. Mechanical, thermal and electrical properties of LiFePO4/MWCNTs composite electrodes. Mater. Lett. 2018, 230, 57–60. [Google Scholar] [CrossRef]
- Mayer, S.F.; de la Calle, C.; Fernandez-Diaz, M.T.; Amarilla, J.M.; Alonso, J.A. Nitridation effect on lithium iron phosphate cathode for rechargeable batteries. RSC Adv. 2022, 12, 3696–3707. [Google Scholar] [CrossRef] [PubMed]
- Nitou, M.V.M.; Pang, Y.; Wan, Z.; Li, W.; Zhong, Z.; Muhammad, W.; Muhammad, S.; Muhammad, S.; Niu, Y.; Lv, W. LiFePO4 as a dual-functional coating for separators in lithium-ion batteries: A new strategy for improving capacity and safety. J. Energy Chem. 2023, 86, 490–498. [Google Scholar] [CrossRef]
- Reizabal, A.; Fidalgo-Marijuan, A.; Goncalves, R.; Gutierrez-Pardo, A.; Aguesse, F.; Perez-Alvarez, L.; Vilas-Vilela, J.L.; Costa, C.M.; Lanceros-Mendez, S. Silk fibroin and sericin polymer blends for sustainable battery separators. J. Colloid Interface Sci. 2022, 611, 366–376. [Google Scholar] [CrossRef] [PubMed]
- Fagundes, W.S.; Xavier, F.F.S.; Santana, L.K.; Azevedo, M.E.; Canobre, S.C.; Amaral, F.A. PAni-coated LiFePO4 Synthesized by a Low Temperature Solvothermal Method. Mater. Res. 2018, 22, e20180566. [Google Scholar] [CrossRef]
- Zhang, P.; Liu, D. Effect of organic carbon coating prepared by hydrothermal method on performance of lithium iron phosphate battery. Alex. Eng. J. 2023, 80, 1–7. [Google Scholar] [CrossRef]
- Apachitei, G.; Hidalgo, M.; Dogaru, D.; Lain, M.; Heymer, R.; Marco, J.; Copley, M. Optimisation of Industrially Relevant Electrode Formulations for LFP Cathodes in Lithium Ion Cells. Batteries 2023, 9, 192. [Google Scholar] [CrossRef]
- Bezerra, C.A.G.; Davoglio, R.A.; Biaggio, S.R.; Bocchi, N.; Rocha-Filho, R.C. High-purity LiFePO4 prepared by a rapid one-step microwave-assisted hydrothermal synthesis. J. Mater. Sci. 2021, 56, 10018–10029. [Google Scholar]
- Kroff, M.; Hevia, S.A.; O’Shea, J.N.; Muro, I.G.; Palomares, V.; Rojo, T.; Del Rio, R. Lithium Iron Phosphate/Carbon (LFP/C) Composite Using Nanocellulose as a Reducing Agent and Carbon Source. Polymers 2023, 15, 2628. [Google Scholar] [CrossRef] [PubMed]
- Kanagaraj, A.B.; Al Shibli, H.; Alkindi, T.S.; Susantyoko, R.A.; An, B.H.; AlMheiri, S.; AlDahmani, S.; Fadaq, H.; Choi, D.S. Hydrothermal synthesis of LiFePO4 micro-particles for fabrication of cathode materials based on LiFePO4/carbon nanotubes nanocomposites for Li-ion batteries. Ionics 2018, 24, 3685–3690. [Google Scholar] [CrossRef]
- Alsamet, M.A.M.M.; Burgaz, E. Synthesis and characterization of nano-sized LiFePO4 by using consecutive combination of sol-gel and hydrothermal methods. Electrochim. Acta 2021, 367, 137530. [Google Scholar] [CrossRef]
- Rikka, V.R.; Sahu, S.R.; Chatterjee, A.; Prakash, R.; Sundararajan, G.; Gopalan, R. Enhancing cycle life and usable energy density of fast charging LiFePO4-graphite cell by regulating electrodes’ lithium level. iScience 2022, 25, 104831. [Google Scholar] [CrossRef] [PubMed]
- Tong, L.; Hu, Z.; Long, Z.; Tang, M.; Qiu, X. Improvement of electrochemical properties of lithium iron phosphate cathode by rare earth oxides modification. J. Alloys Compd. 2023, 947, 169581. [Google Scholar] [CrossRef]
- Sellami, M.; Barre, M.; Dammak, M.; Toumi, M. Local Structure, Thermal, Optical and Electrical Properties of LiFePO4 Polycrystalline Synthesized by Co-Precipitation Method. Braz. J. Phys. 2021, 51, 1521–1528. [Google Scholar] [CrossRef]
- Yi, W.; Sun, C.; Jiang, W.; Zhai, Y.; Gao, Y. Effect of different carbon and nitrogen co-doping on electrochemical performance of LiFePO4/CN. Mater. Lett. 2022, 324, 132713. [Google Scholar] [CrossRef]
- Jiao, L.X.; Li, Z.Q.; Zhu, Y.Z.; Wei, Z.; Liang, Y.; Wang, X.L.; Cui, Y.; Zhang, Z.H.; He, M.; Song, B. Enhanced electrical conductivity and lithium ion diffusion rate of LiFePO4 by Fe site and P site doping. AIP Adv. 2023, 13, 075306. [Google Scholar] [CrossRef]
- Hu, H.; Li, H.; Lei, Y.; Liu, J.; Liu, X.; Wang, R.; Peng, J.; Wang, X. Mg-doped LiMn0.8Fe0.2PO4/C nano-plate as a high-performance cathode material for lithium-ion batteries. J. Energy Storage 2023, 73, 109006. [Google Scholar] [CrossRef]
- Jiang, F.; Qu, K.; Wang, M.; Chen, J.; Liu, Y.; Xu, H.; Huang, Y.; Li, J.; Gao, P.; Zheng, J.; et al. Atomic scale insight into the fundamental mechanism of Mn doped LiFePO4. Sustain. Energy Fuels 2020, 4, 2741–2751. [Google Scholar] [CrossRef]
- Suarso, E.; Setyawan, F.A.; Subhan, A.; Ramli, M.M.; Ismail, N.S.; Zainuri, M.; Arifin, Z.; Darminto. Enhancement of LiFePO4 (LFP) electrochemical performance through the insertion of coconut shell-derived rGO-like carbon as cathode of Li-ion battery. J. Mater. Sci. Mater. Electron. 2021, 32, 28297–28306. [Google Scholar] [CrossRef]
- Hua, W.; Yang, X.; Casati, N.P.M.; Liu, L.; Wang, S.; Baran, V.; Knapp, M.; Ehrenberg, H.; Indris, S. Probing thermally-induced structural evolution during the synthesis of layered Li−, Na−, or K− containing 3d transition-metal oxides. eScience 2022, 2, 183–191. [Google Scholar] [CrossRef]
- Chuang, H.C.; Teng, J.W.; Kuan, W.F. Supercritical CO2-enhanced surface modification on LiFePO4 cathodes through ex-situ carbon coating for lithium-ion batteries. Colloids Surf. A Physicochem. Eng. Asp. 2024, 684, 133110. [Google Scholar] [CrossRef]
- Torabi, M.; Sadrnezhaad, S.K. Nanostructured-microfibrillar polypyrrole coated NiTi current collectors for high power and shape memory LiFePO4 cathodes for Li-ion batteries. J. Alloys Compd. 2023, 969, 172467. [Google Scholar] [CrossRef]
- Yang, G.; Liang, X.; Zheng, S.; Chen, H.; Zhang, W.; Li, S.; Pan, F. Li-rich channels as the material gene for facile lithium diffusion in halide solid electrolytes. eScience 2022, 2, 79–86. [Google Scholar] [CrossRef]
- Sun, C.; Rajasekhara, S.; Goodenough, J.B.; Zhou, F. Monodisperse porous LiFePO4 microspheres for a high power Li-ion battery cathode. J. Am. Chem. Soc. 2011, 133, 2132–2135. [Google Scholar] [CrossRef] [PubMed]
- Chai, S.; Zhang, Y.; Wang, Y.; He, Q.; Zhou, S.; Pan, A. Biodegradable composite polymer as advanced gel electrolyte for quasi-solid-state lithium-metal battery. eScience 2022, 2, 494–508. [Google Scholar] [CrossRef]
- Dose, W.M.; Peebles, C.; Blauwkamp, J.; Jansen, A.N.; Liao, C.; Johnson, C.S. Synthesis of high-density olivine LiFePO4 from paleozoic siderite FeCO3 and its electrochemical performance in lithium batteries. APL Mater. 2022, 10, 041113. [Google Scholar] [CrossRef]
- Li, B.; Xiao, J.; Zhu, X.; Wu, Z.; Zhang, X.; Han, Y.; Niu, J.; Wang, F. Enabling high-performance lithium iron phosphate cathodes through an interconnected carbon network for practical and high-energy lithium-ion batteries. J. Colloid Interface Sci. 2024, 653, 942–948. [Google Scholar] [CrossRef]
- Li, Z.; Ren, X.; Tian, W.; Zheng, Y.; Sun, J.; An, L.; Wen, L.; Wang, L.; Liang, G. High Volumetric Energy Density of LiFePO4/KB Cathode Materials Based on Ketjen Black Additive. ChemElectroChem 2020, 7, 2174–2183. [Google Scholar] [CrossRef]
- Krishnan, S.; Yadav, V.; Devotta, I.; Srivastava, U.; Ssv, R. Effect of multi-walled carbon nanotubes diameter in electrochemical activity of lithium iron phosphate. Diam. Relat. Mater. 2024, 141, 110651. [Google Scholar] [CrossRef]
- Li, T.; Chang, X.; Xin, Y.; Liu, Y.; Tian, H. Synergistic Strategy Using Doping and Polymeric Coating Enables High-Performance High-Nickel Layered Cathodes for Lithium-Ion Batteries. J. Phys. Chem. C 2023, 127, 8448–8461. [Google Scholar] [CrossRef]
- Galaguz, V.; Korduban, O.; Panov, E.; Malovanyi, S. The use of Raman and XPS spectroscopy to study the cathode material of LiFePO4/C. J. Serbian Chem. Soc. 2020, 85, 1047–1054. [Google Scholar] [CrossRef]
- Connor, W.D.; Arisetty, S.; Yao, K.P.; Fu, K.; Advani, S.G.; Prasad, A.K. Analysis of solvent-free lithium-ion electrodes formed under high pressure and heat. J. Power Sources 2022, 546, 231972. [Google Scholar] [CrossRef]
- Levin, O.V.; Eliseeva, S.N.; Alekseeva, E.V.; Tolstopjatova, E.G.; Kondratiev, V.V. Composite LiFePO4/poly-3,4-ethylenedioxythiophene Cathode for Lithium-Ion Batteries with Low Content of Non-Electroactive Components. Int. J. Electrochem. Sci. 2015, 10, 8175–8189. [Google Scholar] [CrossRef]
- Valvo, M.; Chien, Y.C.; Liivat, A.; Tai, C.W. Detecting voltage shifts and charge storage anomalies by iron nanoparticles in three-electrode cells based on converted iron oxide and lithium iron phosphate. Electrochim. Acta 2023, 440, 141747. [Google Scholar] [CrossRef]
- Naik, A.; Zhou, J.; Gao, C.; Wang, L. Microwave Assisted Solid State Synthesis of LiFePO4/C Using Two Different Carbon Sources. Int. J. Electrochem. Sci. 2014, 9, 6124–6133. [Google Scholar] [CrossRef]
- Sundarayya, Y.; Vijeth, H.; Nagaraju, D.; Kumara Swamy, K.C.; Sunandana, C.S. Isovalent substitution of vanadium in LiFePO4: Evolution of monoclinic α-Li3Fe2(PO4)3 phase. Inorg. Chem. Commun. 2023, 150, 110530. [Google Scholar] [CrossRef]
- Rastgoo-Deylami, M.; Javanbakht, M.; Ghaemi, M.; Naji, L.; Omidvar, H.; Ganjali, M.R. Synthesis and Electrochemical Properties of Rhombohedral LiFePO4/C Microcrystals Via a Hydrothermal Route for Lithium Ion Batteries. Int. J. Electrochem. Sci. 2014, 9, 3199–3208. [Google Scholar] [CrossRef]
- Ma, C.; Wang, X.; Song, Y.; Hu, H.; Li, W.; Qiu, Z.; Cui, Y.; Xing, W. Low-temperature performance optimization of LiFePO4-based batteries. Asia-Pac. J. Chem. Eng. 2022, 18, e2841. [Google Scholar] [CrossRef]
- Na, Y.; Sun, X.; Fan, A.; Cai, S.; Zheng, C. Methods for enhancing the capacity of electrode materials in low-temperature lithium-ion batteries. Chin. Chem. Lett. 2021, 32, 973–982. [Google Scholar] [CrossRef]
- Myalo, Z.; Ikpo, C.O.; Nwanya, A.C.; Ndipingwi, M.M.; Duoman, S.F.; Mokwebo, K.V.; Iwuoha, E.I. Graphenised Lithium Iron Phosphate and Lithium Manganese Silicate Hybrid Cathodes: Potentials for Application in Lithium-ion Batteries. Electroanalysis 2020, 32, 2982–2999. [Google Scholar] [CrossRef]
- Zaki, N.H.M.; Ahmad, S.I.; Sazman, F.N.; Badrudin, F.W.; Abdullah, A.L.A.; Taib, M.F.M.; Hassan, O.H.; Yahya, M.Z.A. The influence of Cl doping on the structural, electronic properties and Li-ion migration of LiFePO4: A DFT study. Comput. Theor. Chem. 2023, 1221, 114029. [Google Scholar] [CrossRef]
- Seo, S.B.; Song, Y.; Choi, Y.R.; Kang, M.; Choi, G.B.; Kim, J.H.; Han, J.H.; Hong, S.; Muramatsu, H.; Kim, M.Y.; et al. Double-walled carbon nanotubes as effective conducting agents for lithium iron phosphate cathodes. Carbon 2023, 218, 118731. [Google Scholar] [CrossRef]
- Sharmila, V.; Parthibavarman, M. Lithium manganese phosphate associated with MWCNT: Enhanced positive electrode for lithium hybrid batteries. J. Alloys Compd. 2021, 858, 157715. [Google Scholar] [CrossRef]
- Jheng, S.C.; Chen, J.S. The Synthesis of LiFePO4/C Composite by the Precipitation Between Two Water/Oil Emulsions. Int. J. Electrochem. Sci. 2013, 8, 4901–4913. [Google Scholar] [CrossRef]
- Shaji, N.; Jiang, F.; Sung, J.Y.; Nanthagopal, M.; Kim, T.; Jeong, B.J.; Jung, S.P.; Lee, C.W. Heteroatoms-doped carbon effect on LiFePO4 cathode for Li-ion batteries. J. Energy Storage 2023, 72, 108710. [Google Scholar] [CrossRef]
- Vásquez, F.A.; Rosero-Navarro, N.C.; Miura, A.; Goto, Y.; Tadanaga, K.; Calderón, J.A. Beneficial Effect of LiFePO4/C coating on Li0.9Mn1.6Ni0.4O4 obtained by microwave heating. Electrochim. Acta 2023, 437, 141544. [Google Scholar] [CrossRef]
- Zhu, H.; Li, Z.; Li, C.; Jia, H.; Fang, H.; Qiao, L.; Lv, P.; Li, X. Near-in-situ electrochemical impedance spectroscopy analysis based on lithium iron phosphate electrode. Electrochim. Acta 2023, 464, 142919. [Google Scholar] [CrossRef]
- Yücel, Y.D.; Zenkert, D.; Lindström, R.W.; Lindbergh, G. LiFePO4-coated carbon fibers as positive electrodes in structural batteries: Insights from spray coating technique. Electrochem. Commun. 2024, 160, 107670. [Google Scholar] [CrossRef]
- Liu, X.; Zhang, Y.; Meng, Y.; Xiao, M.; Kang, T.; Gao, H.; Huang, L.; Zhu, F. Preparation and electrochemical properties of Co doped core-shell cathode material on a lithium iron phosphate surface. J. Alloys Compd. 2022, 923, 166326. [Google Scholar] [CrossRef]
- Kim, J.; Song, S.; Lee, C.S.; Lee, M.; Bae, J. Prominent enhancement of stability under high current density of LiFePO4-based multidimensional nanocarbon composite as cathode for lithium-ion batteries. J. Colloid Interface Sci. 2023, 650, 1958–1965. [Google Scholar] [CrossRef]
- Karimzadeh, S.; Safaei, B.; Huang, W.; Jen, T.C. Theoretical investigation on niobium doped LiFePO4 cathode material for high performance lithium-ion batteries. J. Energy Storage 2023, 67, 107572. [Google Scholar] [CrossRef]
Figure 1.
Simple schematic preparation process of LFP/C cathode materials using a carbothermal reduction combined with a synergistic strategy of bulk–phase doping.
Figure 1.
Simple schematic preparation process of LFP/C cathode materials using a carbothermal reduction combined with a synergistic strategy of bulk–phase doping.
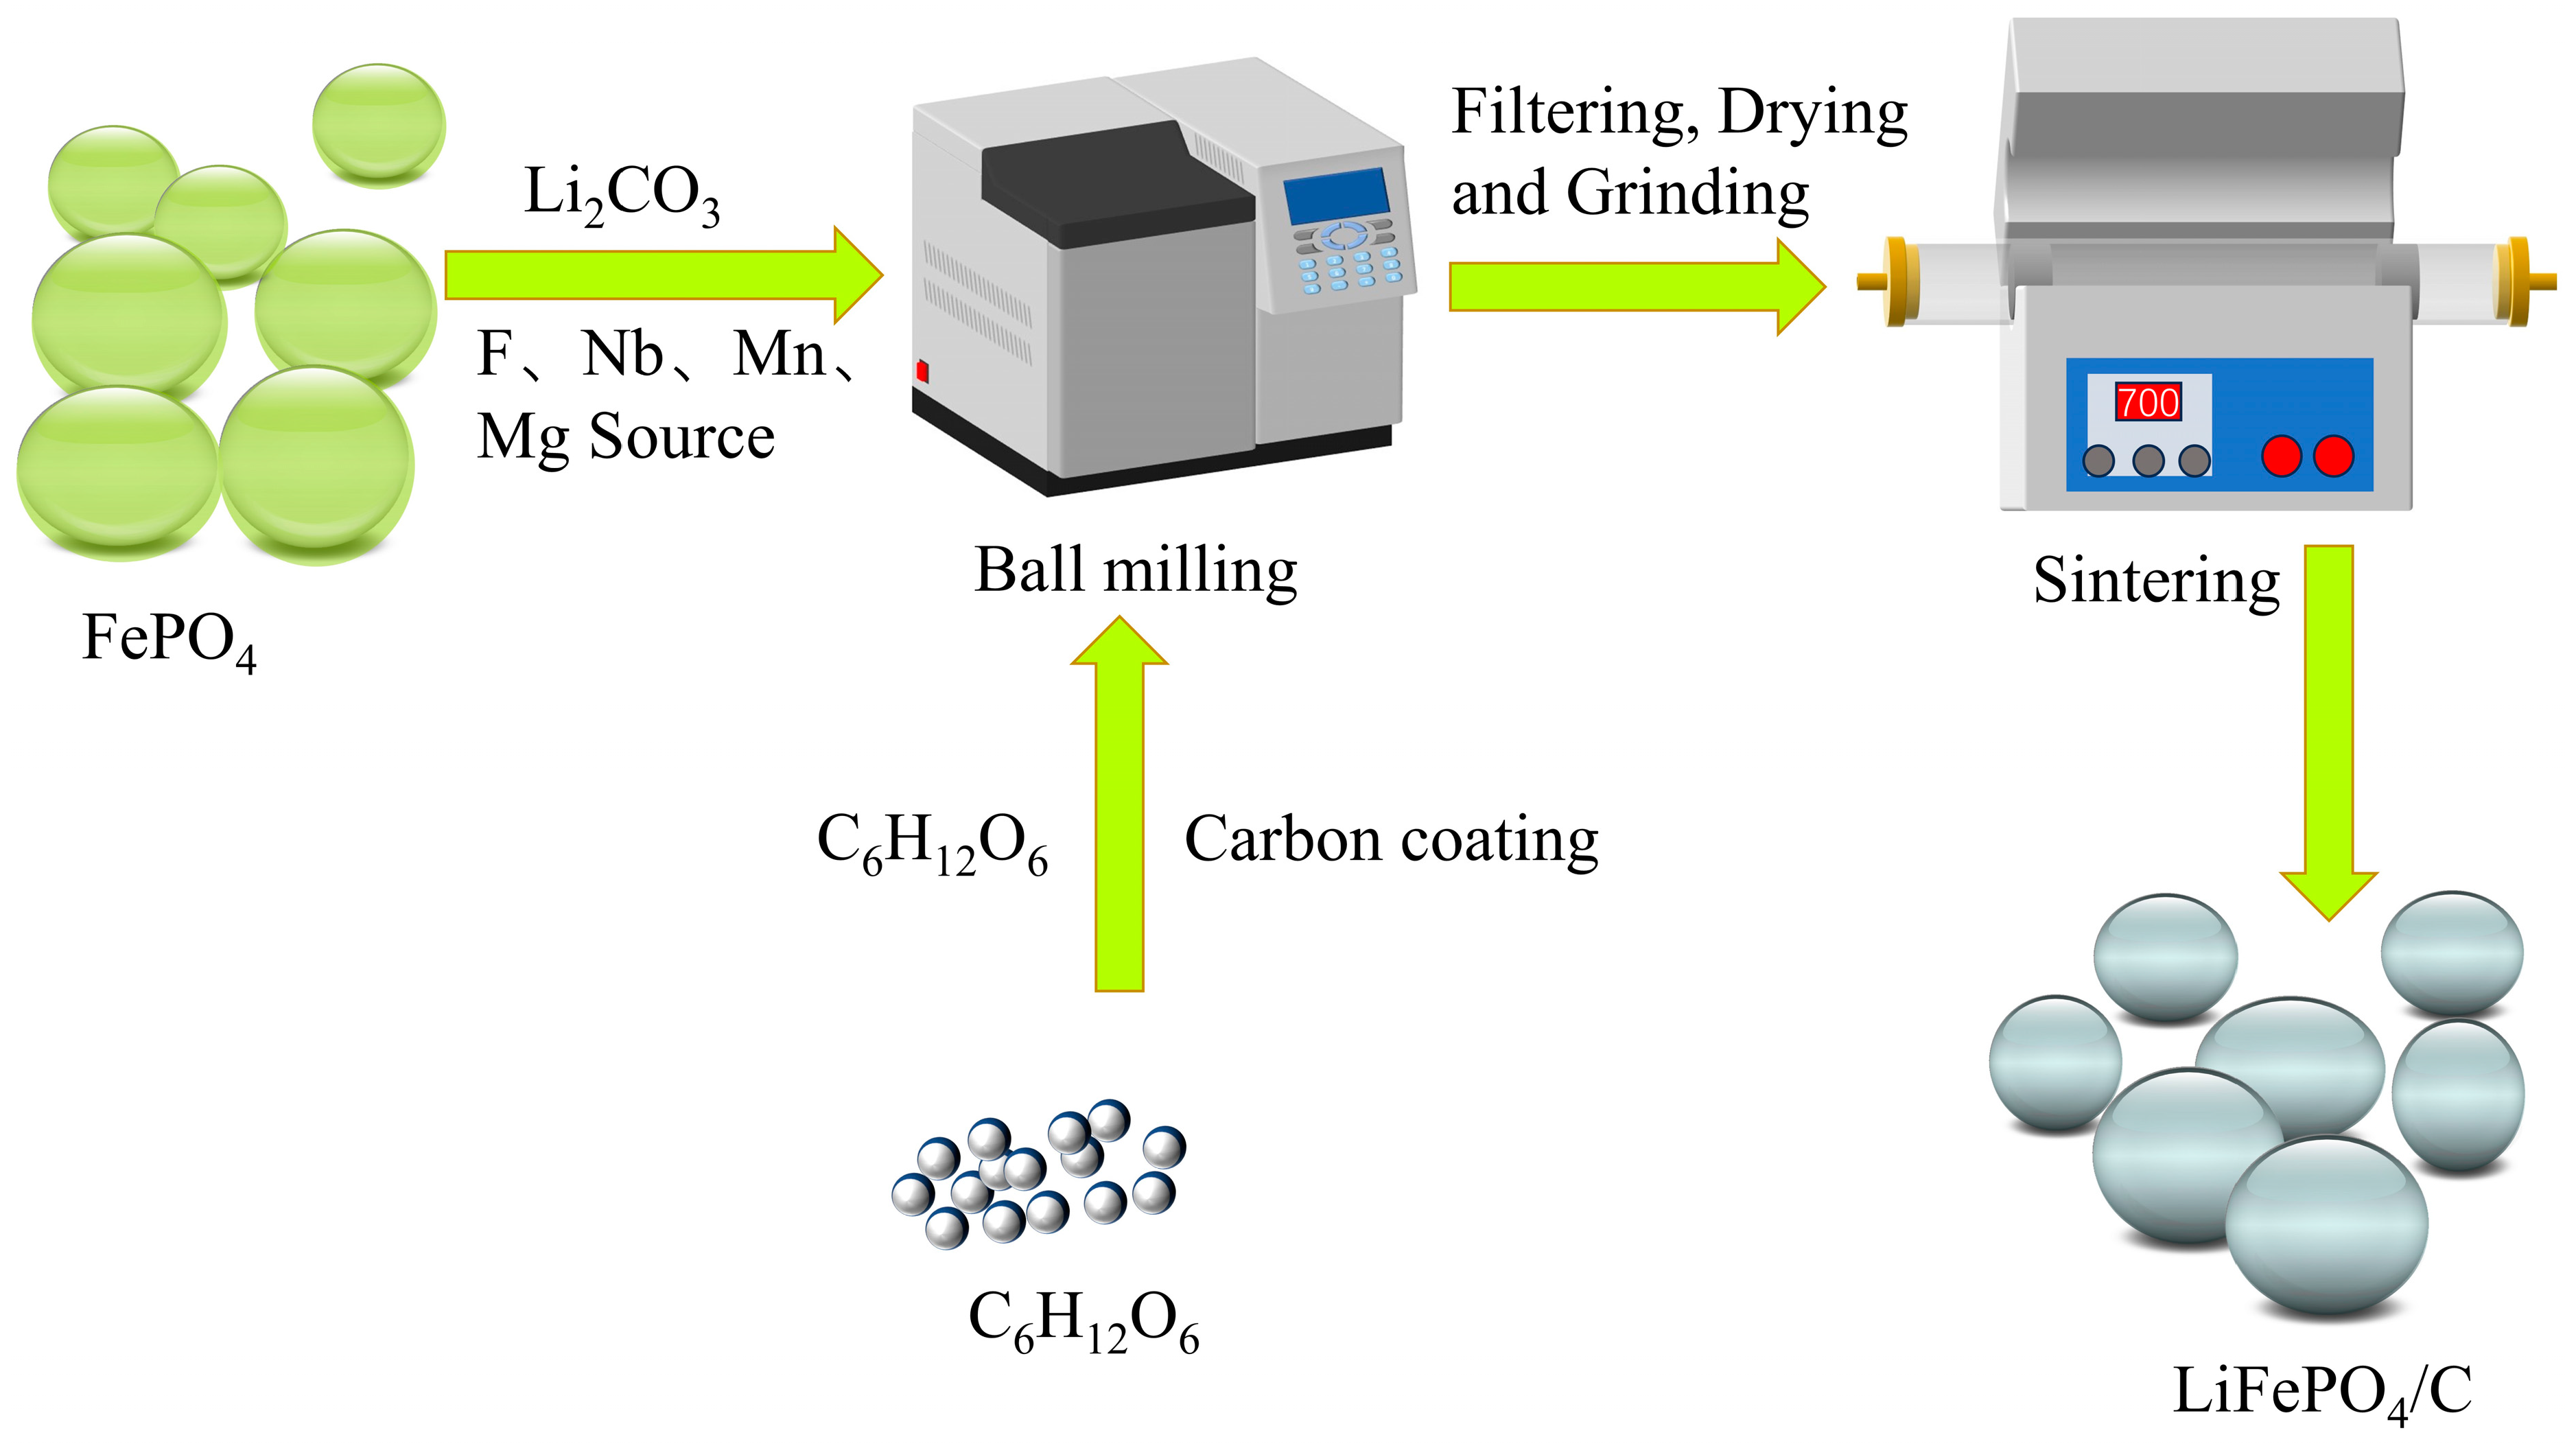
Figure 2.
(a) XRD patterns of LFP/C and LFP/C modified by doping with different elements, (b) the zoomed–in patterns in the 2θ range of 10–20°, and (c) the zoomed–in patterns in the 2θ range of 30–40°.
Figure 2.
(a) XRD patterns of LFP/C and LFP/C modified by doping with different elements, (b) the zoomed–in patterns in the 2θ range of 10–20°, and (c) the zoomed–in patterns in the 2θ range of 30–40°.
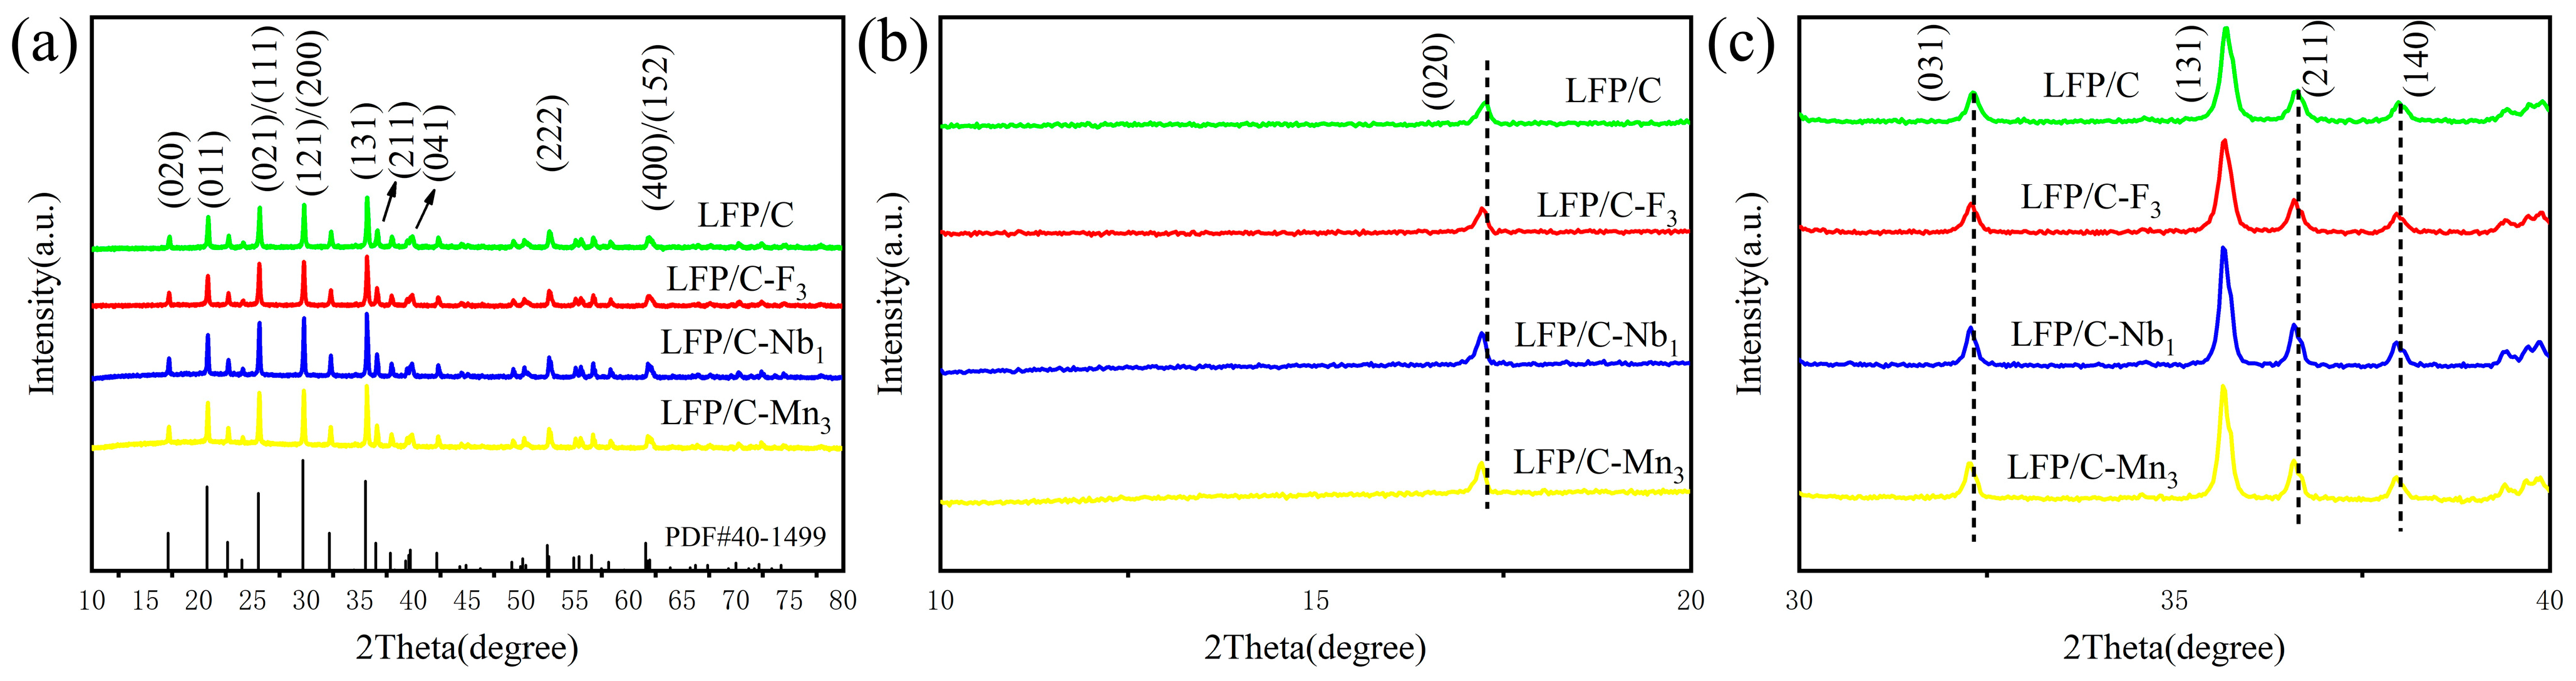
Figure 3.
Rietveld refinements of the XRD patterns of (a) LFP/C, (b) LFP/C–F3, (c) LFP/C–Nb1, and (d) LFP/C–Mn3 samples.
Figure 3.
Rietveld refinements of the XRD patterns of (a) LFP/C, (b) LFP/C–F3, (c) LFP/C–Nb1, and (d) LFP/C–Mn3 samples.

Figure 4.
SEM images of (a) LFP/C, (b) LFP/C–Nb1, (c) LFP/C–Mn3, and (d) LFP/C–F3 particles.

Figure 5.
Galvanostatic charge–discharge curves of (a) LFP/C, (b) LFP/C–F3, (c) LFP/C–Nb1, and (d) LFP/C–Mn3 samples at different cycles. (e) Rate performance of LFP/C and doped modified LFP/C cathodes between 2.5 and 4.2 V (25 °C) and (f) cycling performance at 0.2 C.
Figure 5.
Galvanostatic charge–discharge curves of (a) LFP/C, (b) LFP/C–F3, (c) LFP/C–Nb1, and (d) LFP/C–Mn3 samples at different cycles. (e) Rate performance of LFP/C and doped modified LFP/C cathodes between 2.5 and 4.2 V (25 °C) and (f) cycling performance at 0.2 C.
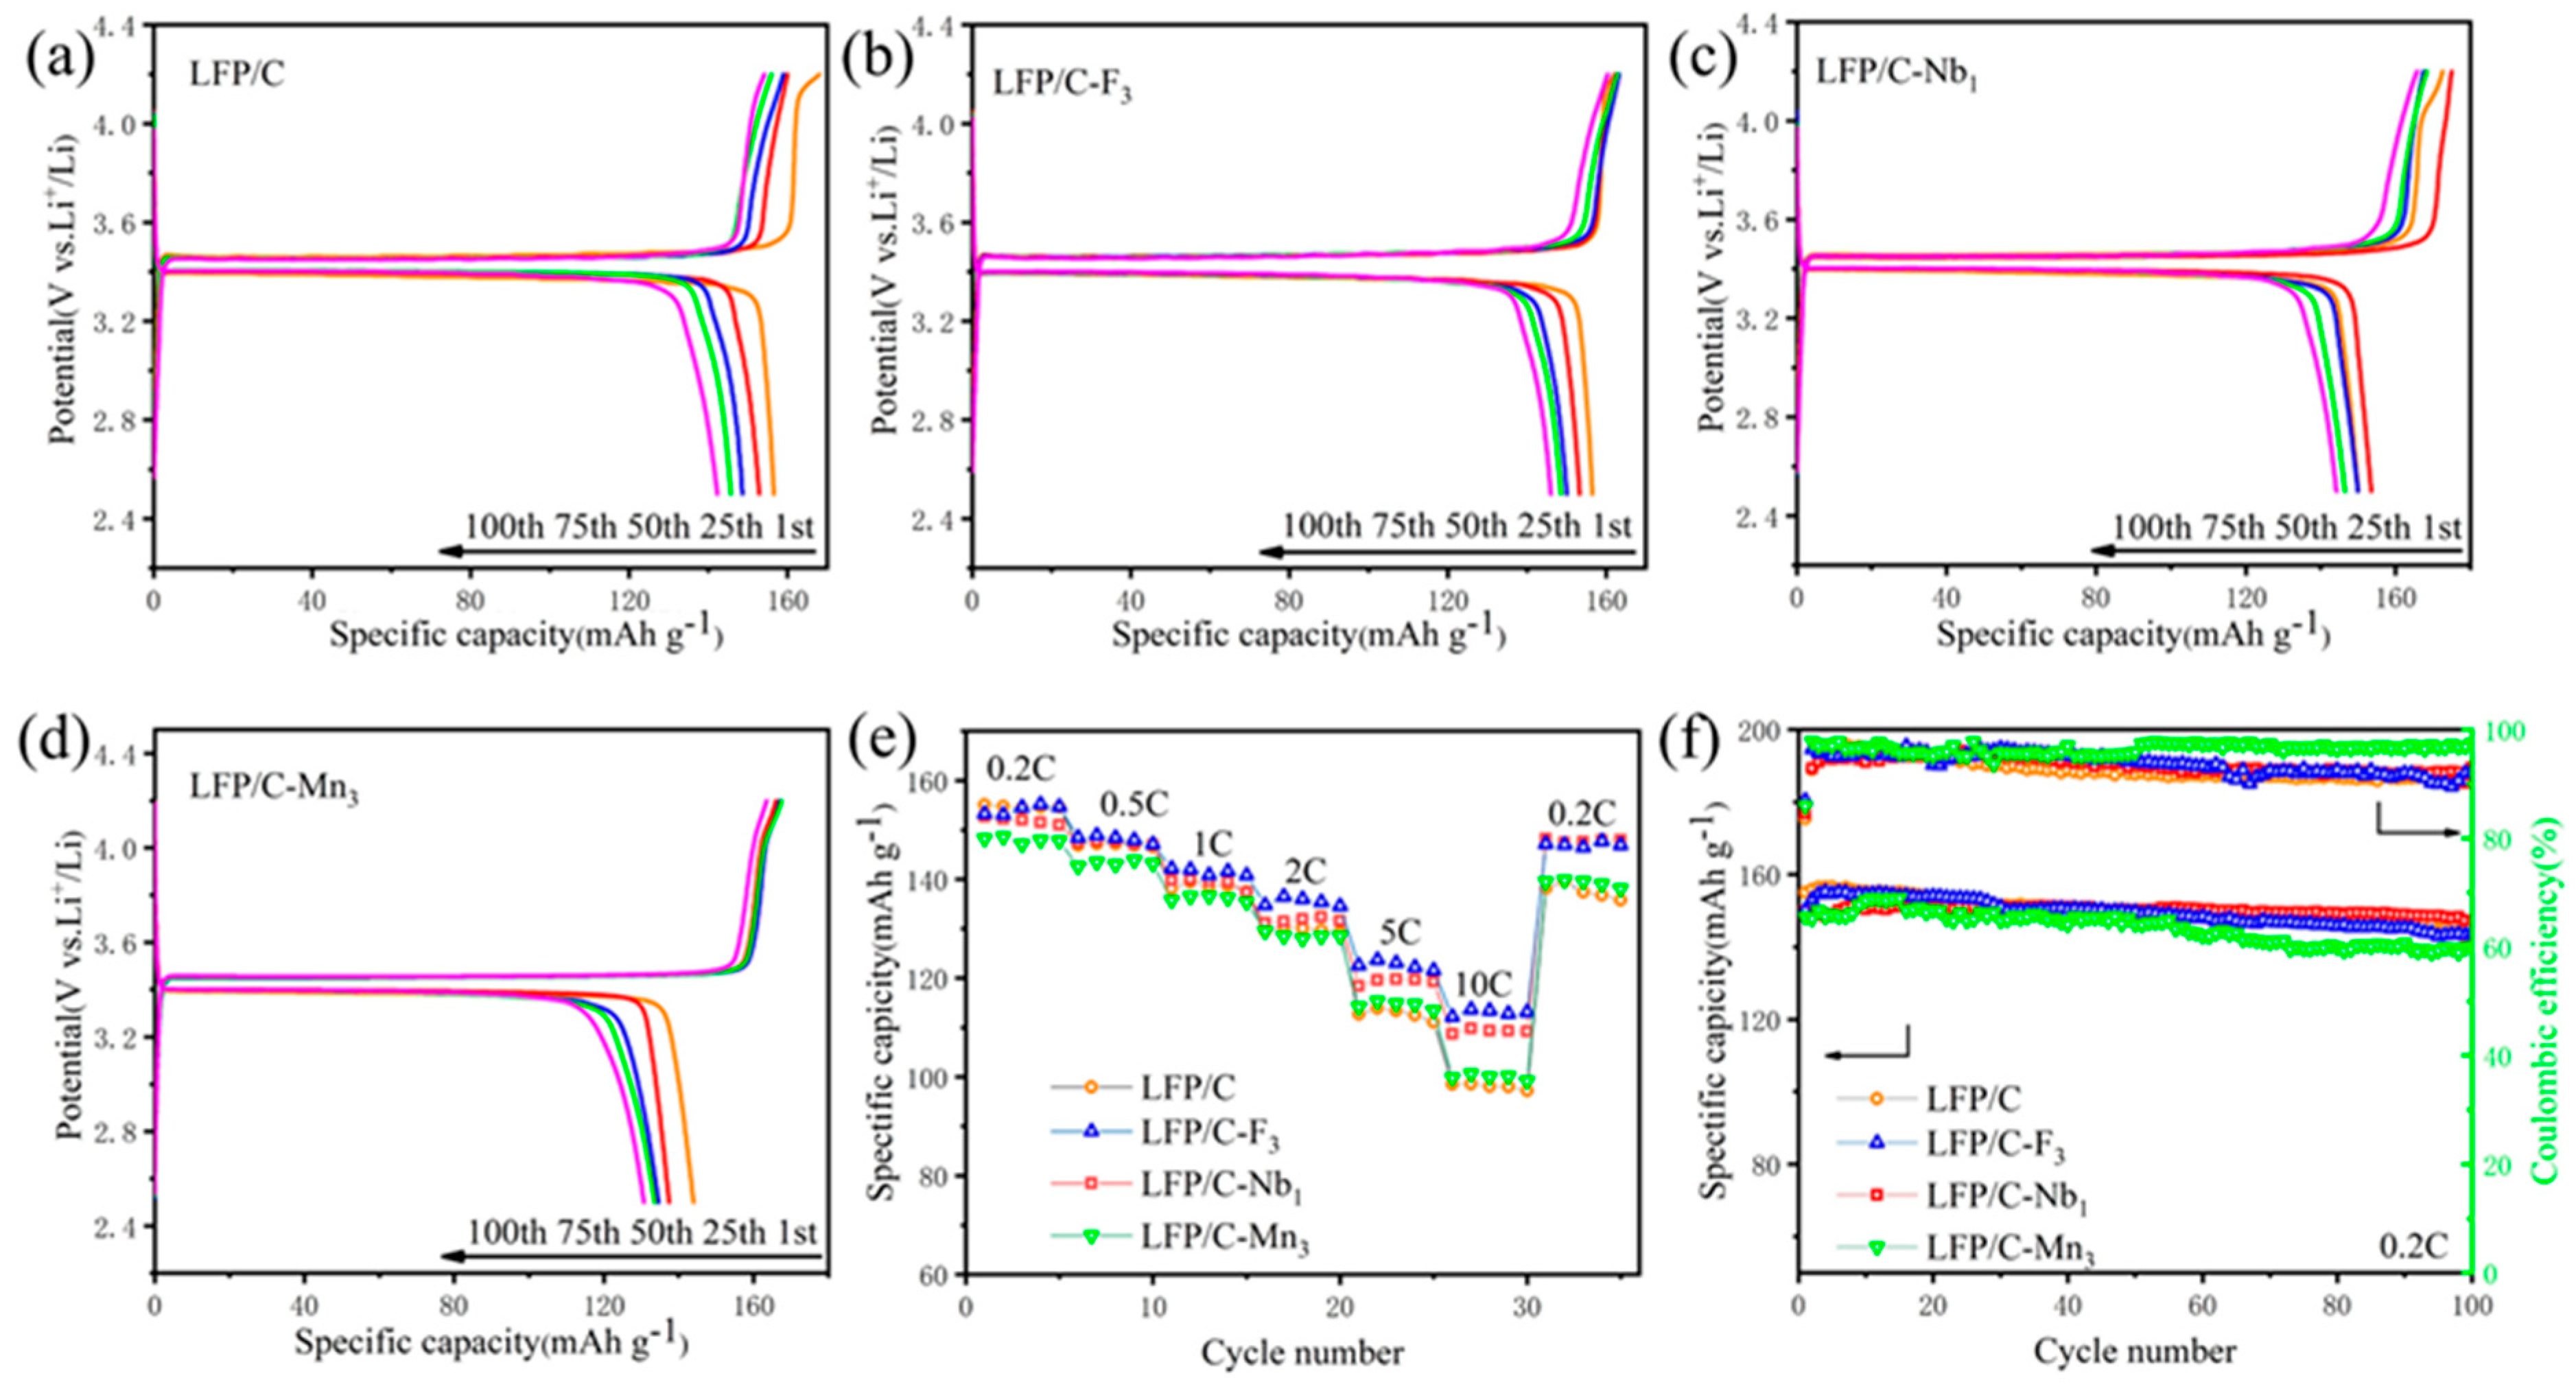
Figure 6.
The charge–discharge curves of (a) LFP/C–Fn, (b) LFP/C–Nbn, (c) LFP/C–Mnn, and (d) LFP/C–Mgn cathodes at 0.2 C.
Figure 6.
The charge–discharge curves of (a) LFP/C–Fn, (b) LFP/C–Nbn, (c) LFP/C–Mnn, and (d) LFP/C–Mgn cathodes at 0.2 C.
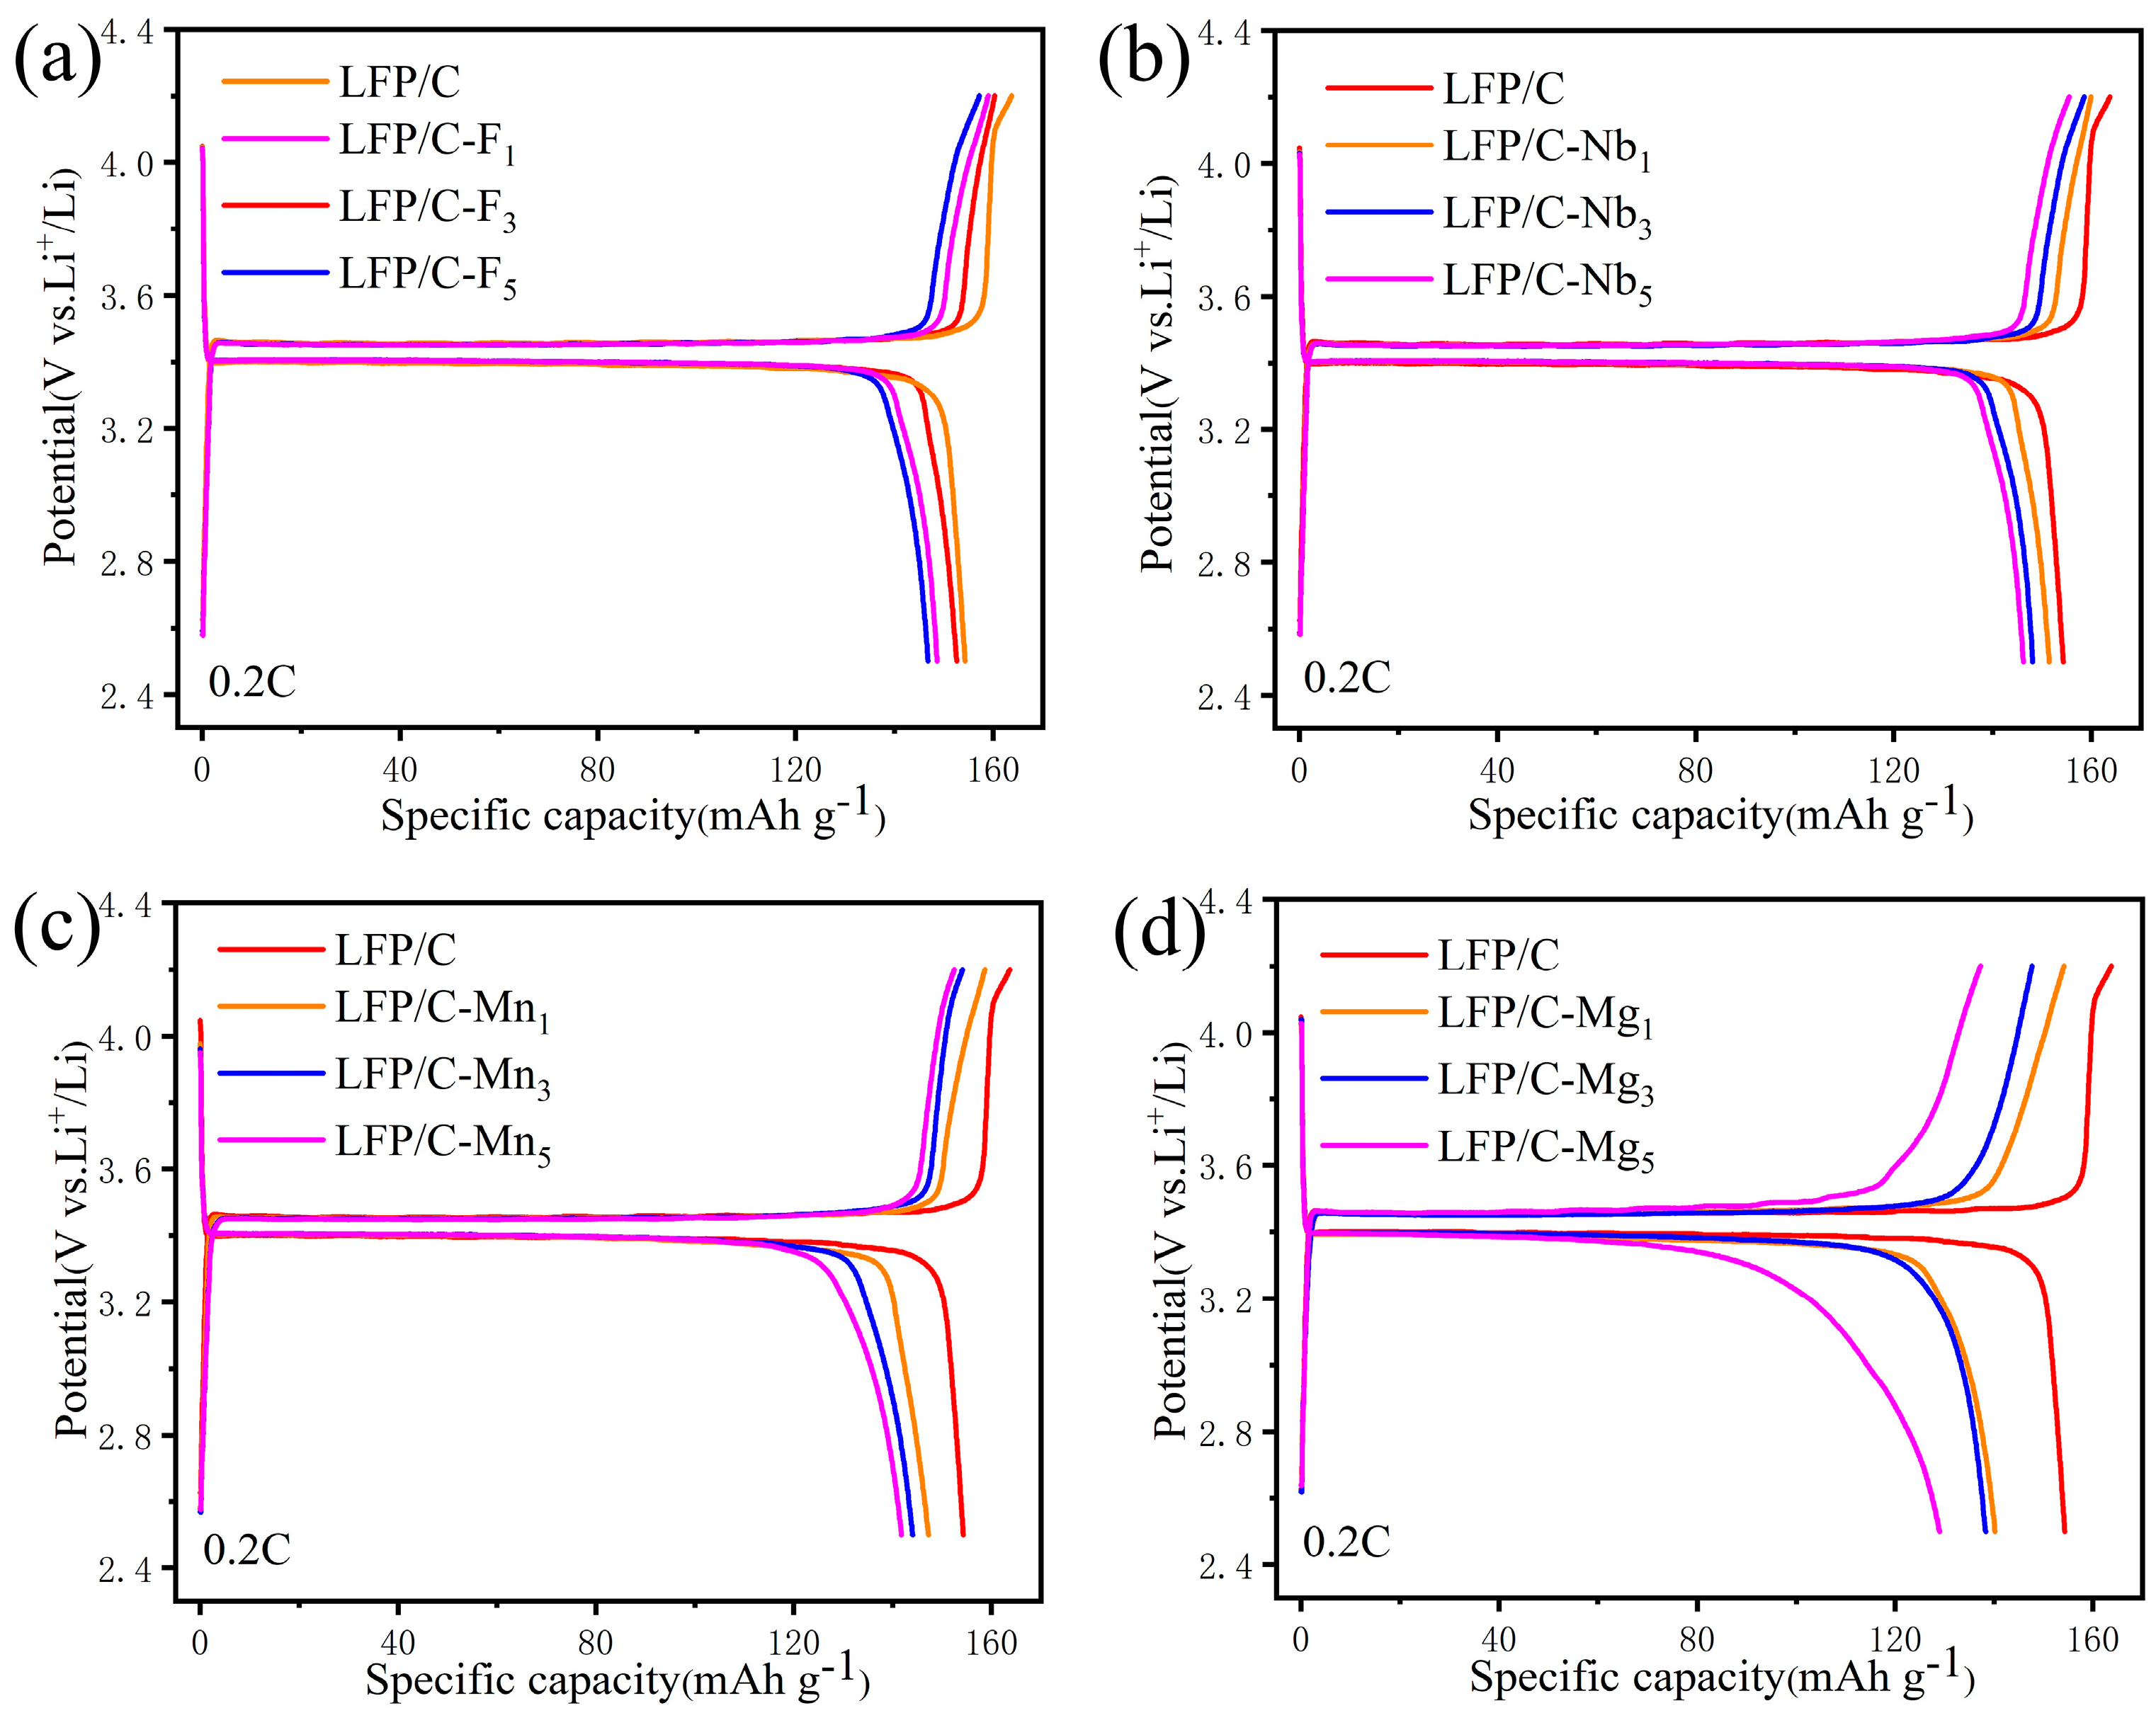
Figure 7.
The electrochemical performances of LFP/C and LFP/C–Xn cathodes at low temperature of −15 °C. (a) Charge–discharge curves of LFP/C cells assembled with different electrolytes at 0.2 C. Charge–discharge curves of LFP/C, LFP/C–F3, LFP/C–Nb1, and LFP/C–Mn3 cathodes at 0.2 C (b) and 2 C (c). (d) Cycling performance of LFP/C, LFP/C–F3, LFP/C–Nb1, and LFP/C–Mn3 cathodes at 0.2 C.
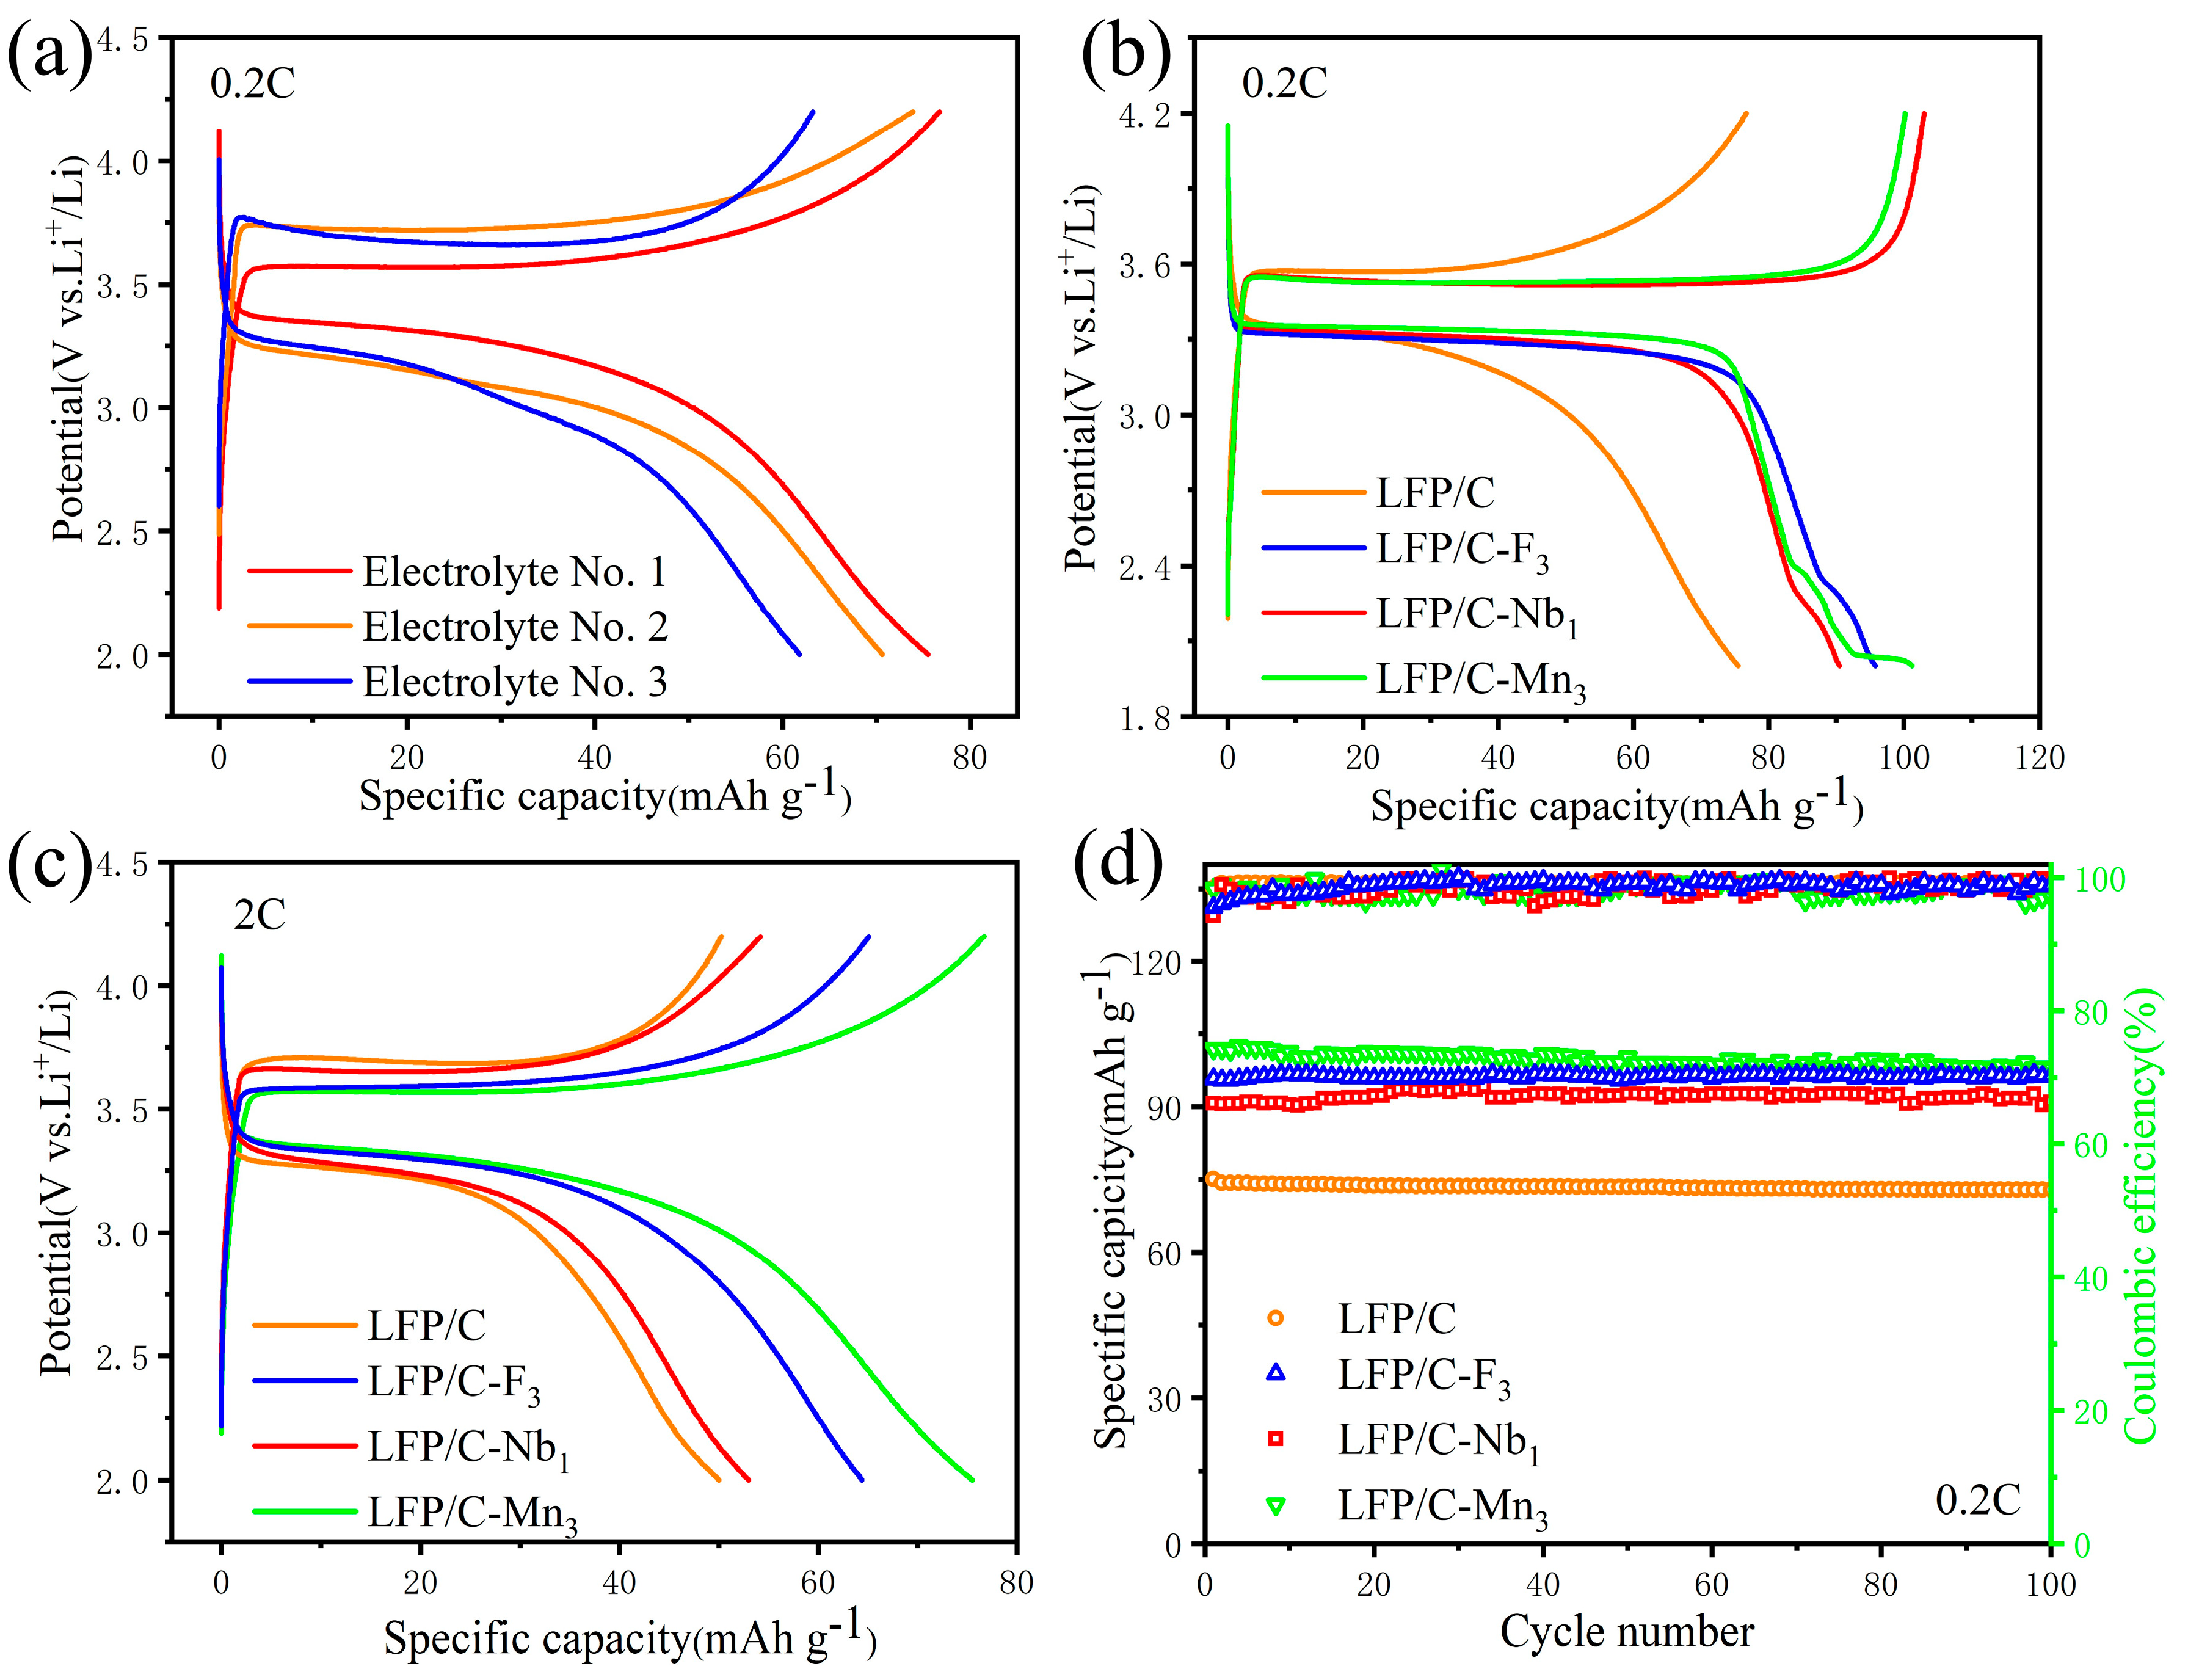
Figure 8.
CV curves of (a) LFP/C, (b) LFP/C–Nb1, and (c) LFP/C–F3 at a scan rate of 0.1 mV s−1. CV curves of (d) LFP/C, (e) LFP/C–Nb1, and (f) LFP/C–F3 at different scan rates, and (g) peak current (ip) versus square root of the scan rate (v1/2) curves for LFP/C, LFP/C–Nb1, and LFP/C–F3 samples. Also shown are the Nyquist plots and the fitting data of LFP/C, LFP/C–F3, LFP/C–Nb1, and LFP/C–Mn3 samples at the 3rd (h) and the 100th (i) cycles.

Disclaimer/Publisher’s Note: The statements, opinions and data contained in all publications are solely those of the individual author(s) and contributor(s) and not of MDPI and/or the editor(s). MDPI and/or the editor(s) disclaim responsibility for any injury to people or property resulting from any ideas, methods, instructions or products referred to in the content. |
© 2024 by the authors. Licensee MDPI, Basel, Switzerland. This article is an open access article distributed under the terms and conditions of the Creative Commons Attribution (CC BY) license (https://creativecommons.org/licenses/by/4.0/).
Share and Cite
MDPI and ACS Style
Jiang, X.; Xin, Y.; He, B.; Zhang, F.; Tian, H. Effect of Heteroatom Doping on Electrochemical Properties of Olivine LiFePO4 Cathodes for High-Performance Lithium-Ion Batteries. Materials 2024, 17, 1299. https://doi.org/10.3390/ma17061299
AMA Style
Jiang X, Xin Y, He B, Zhang F, Tian H. Effect of Heteroatom Doping on Electrochemical Properties of Olivine LiFePO4 Cathodes for High-Performance Lithium-Ion Batteries. Materials. 2024; 17(6):1299. https://doi.org/10.3390/ma17061299
Chicago/Turabian StyleJiang, Xiukun, Yan Xin, Bijiao He, Fang Zhang, and Huajun Tian. 2024. "Effect of Heteroatom Doping on Electrochemical Properties of Olivine LiFePO4 Cathodes for High-Performance Lithium-Ion Batteries" Materials 17, no. 6: 1299. https://doi.org/10.3390/ma17061299
Note that from the first issue of 2016, this journal uses article numbers instead of page numbers. See further details here.