
Research on the Hot Deformation Process of A100 Steel Based on High-Temperature Rheological Behavior and Microstructure


Abstract
1. Introduction
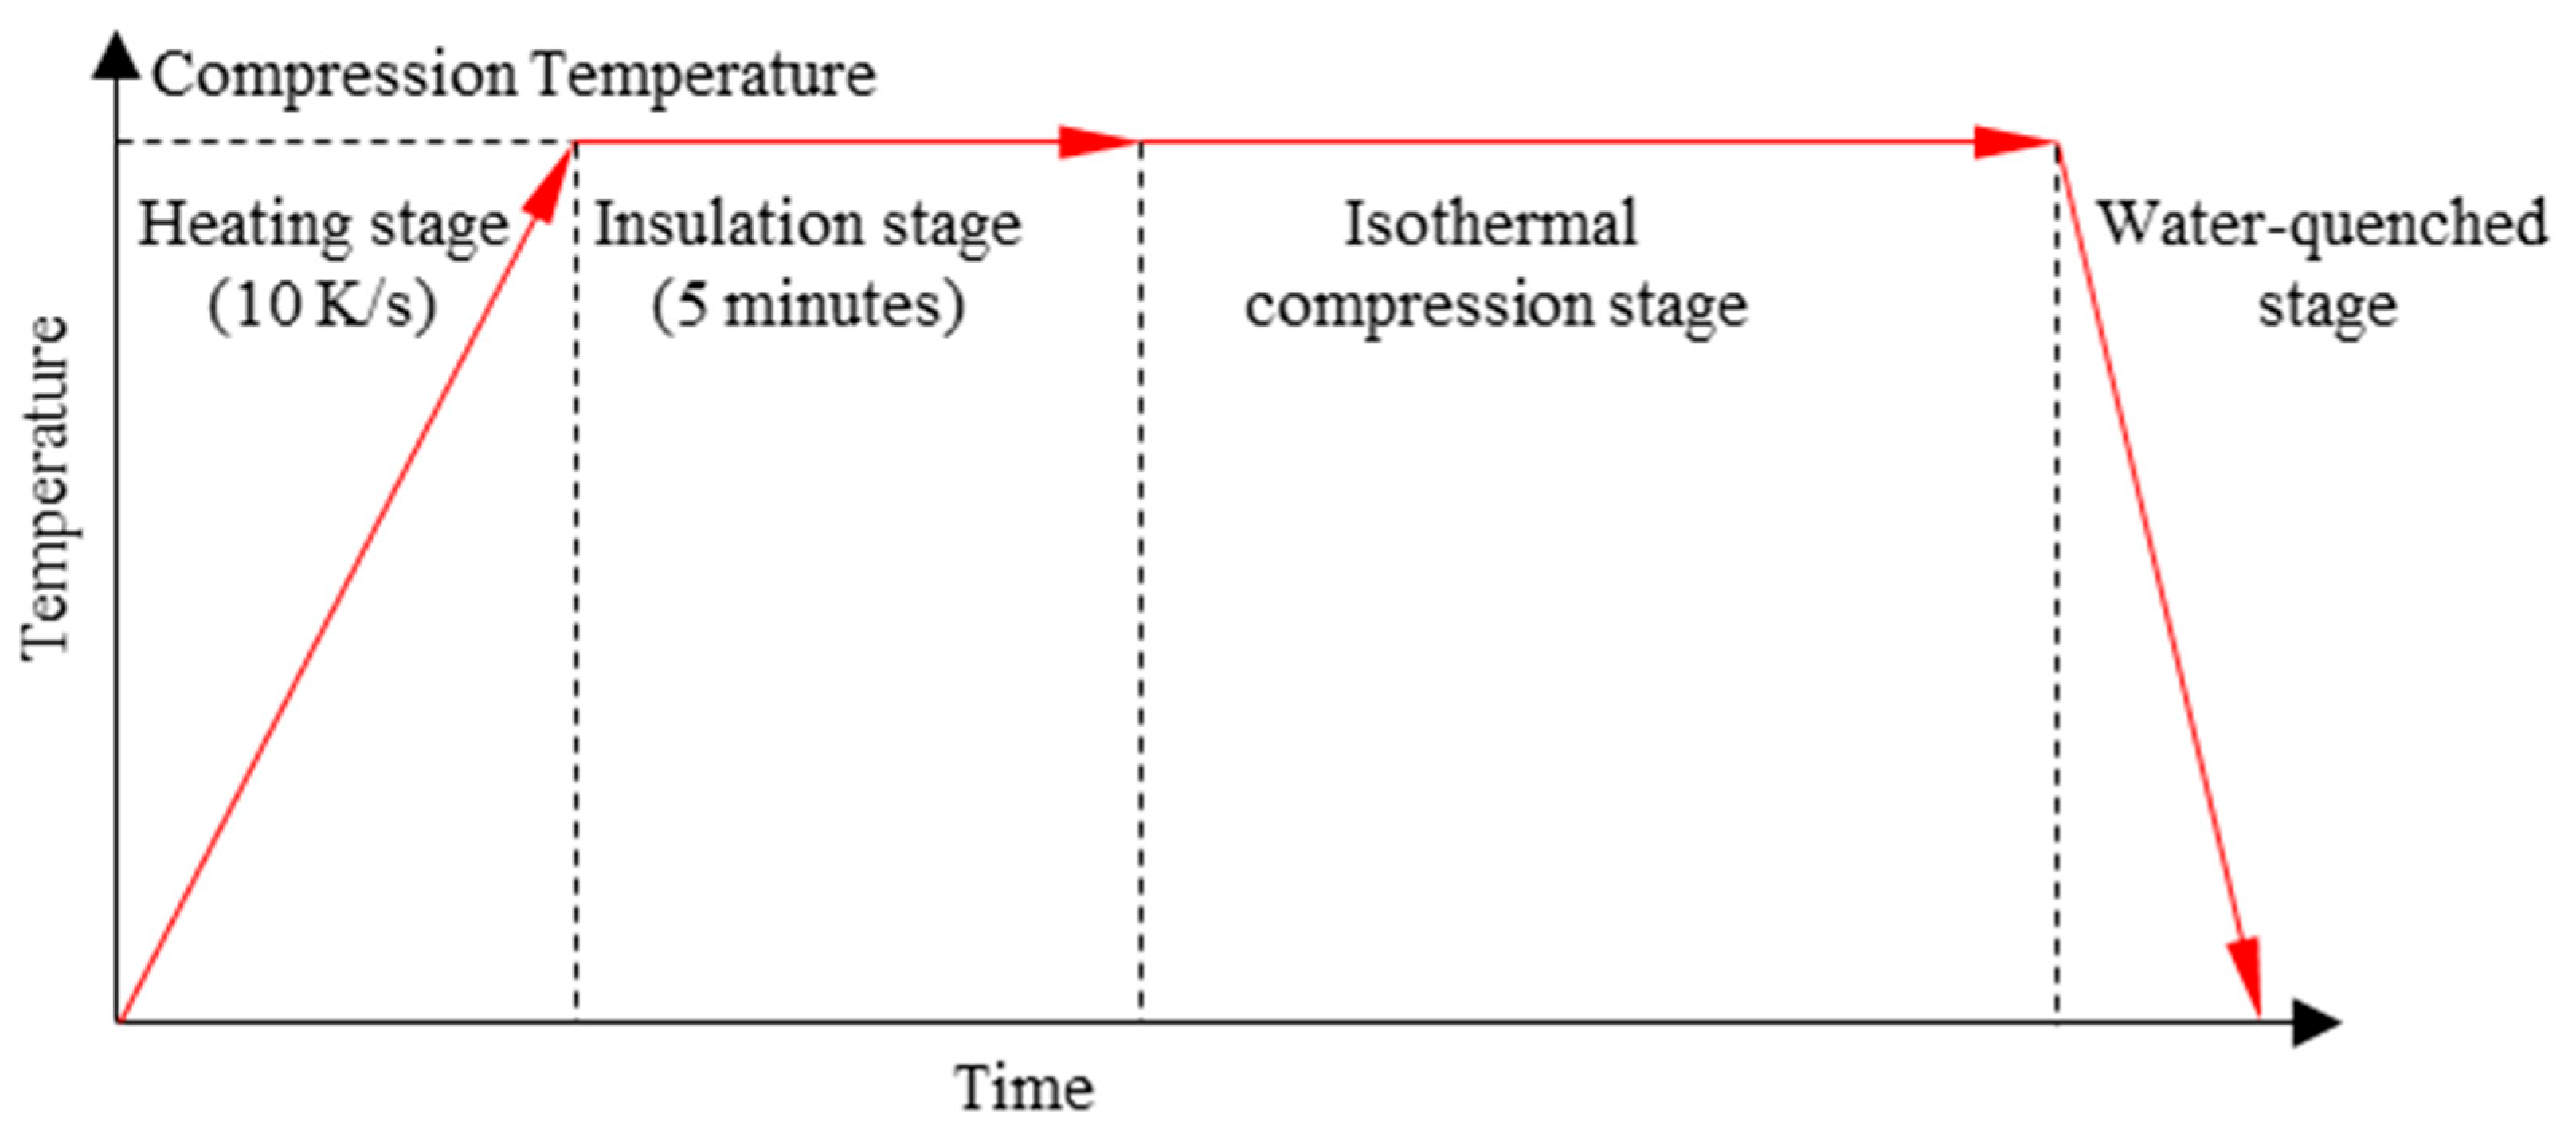
2. Experiments with Materials
3. Hot Rheological Behavior
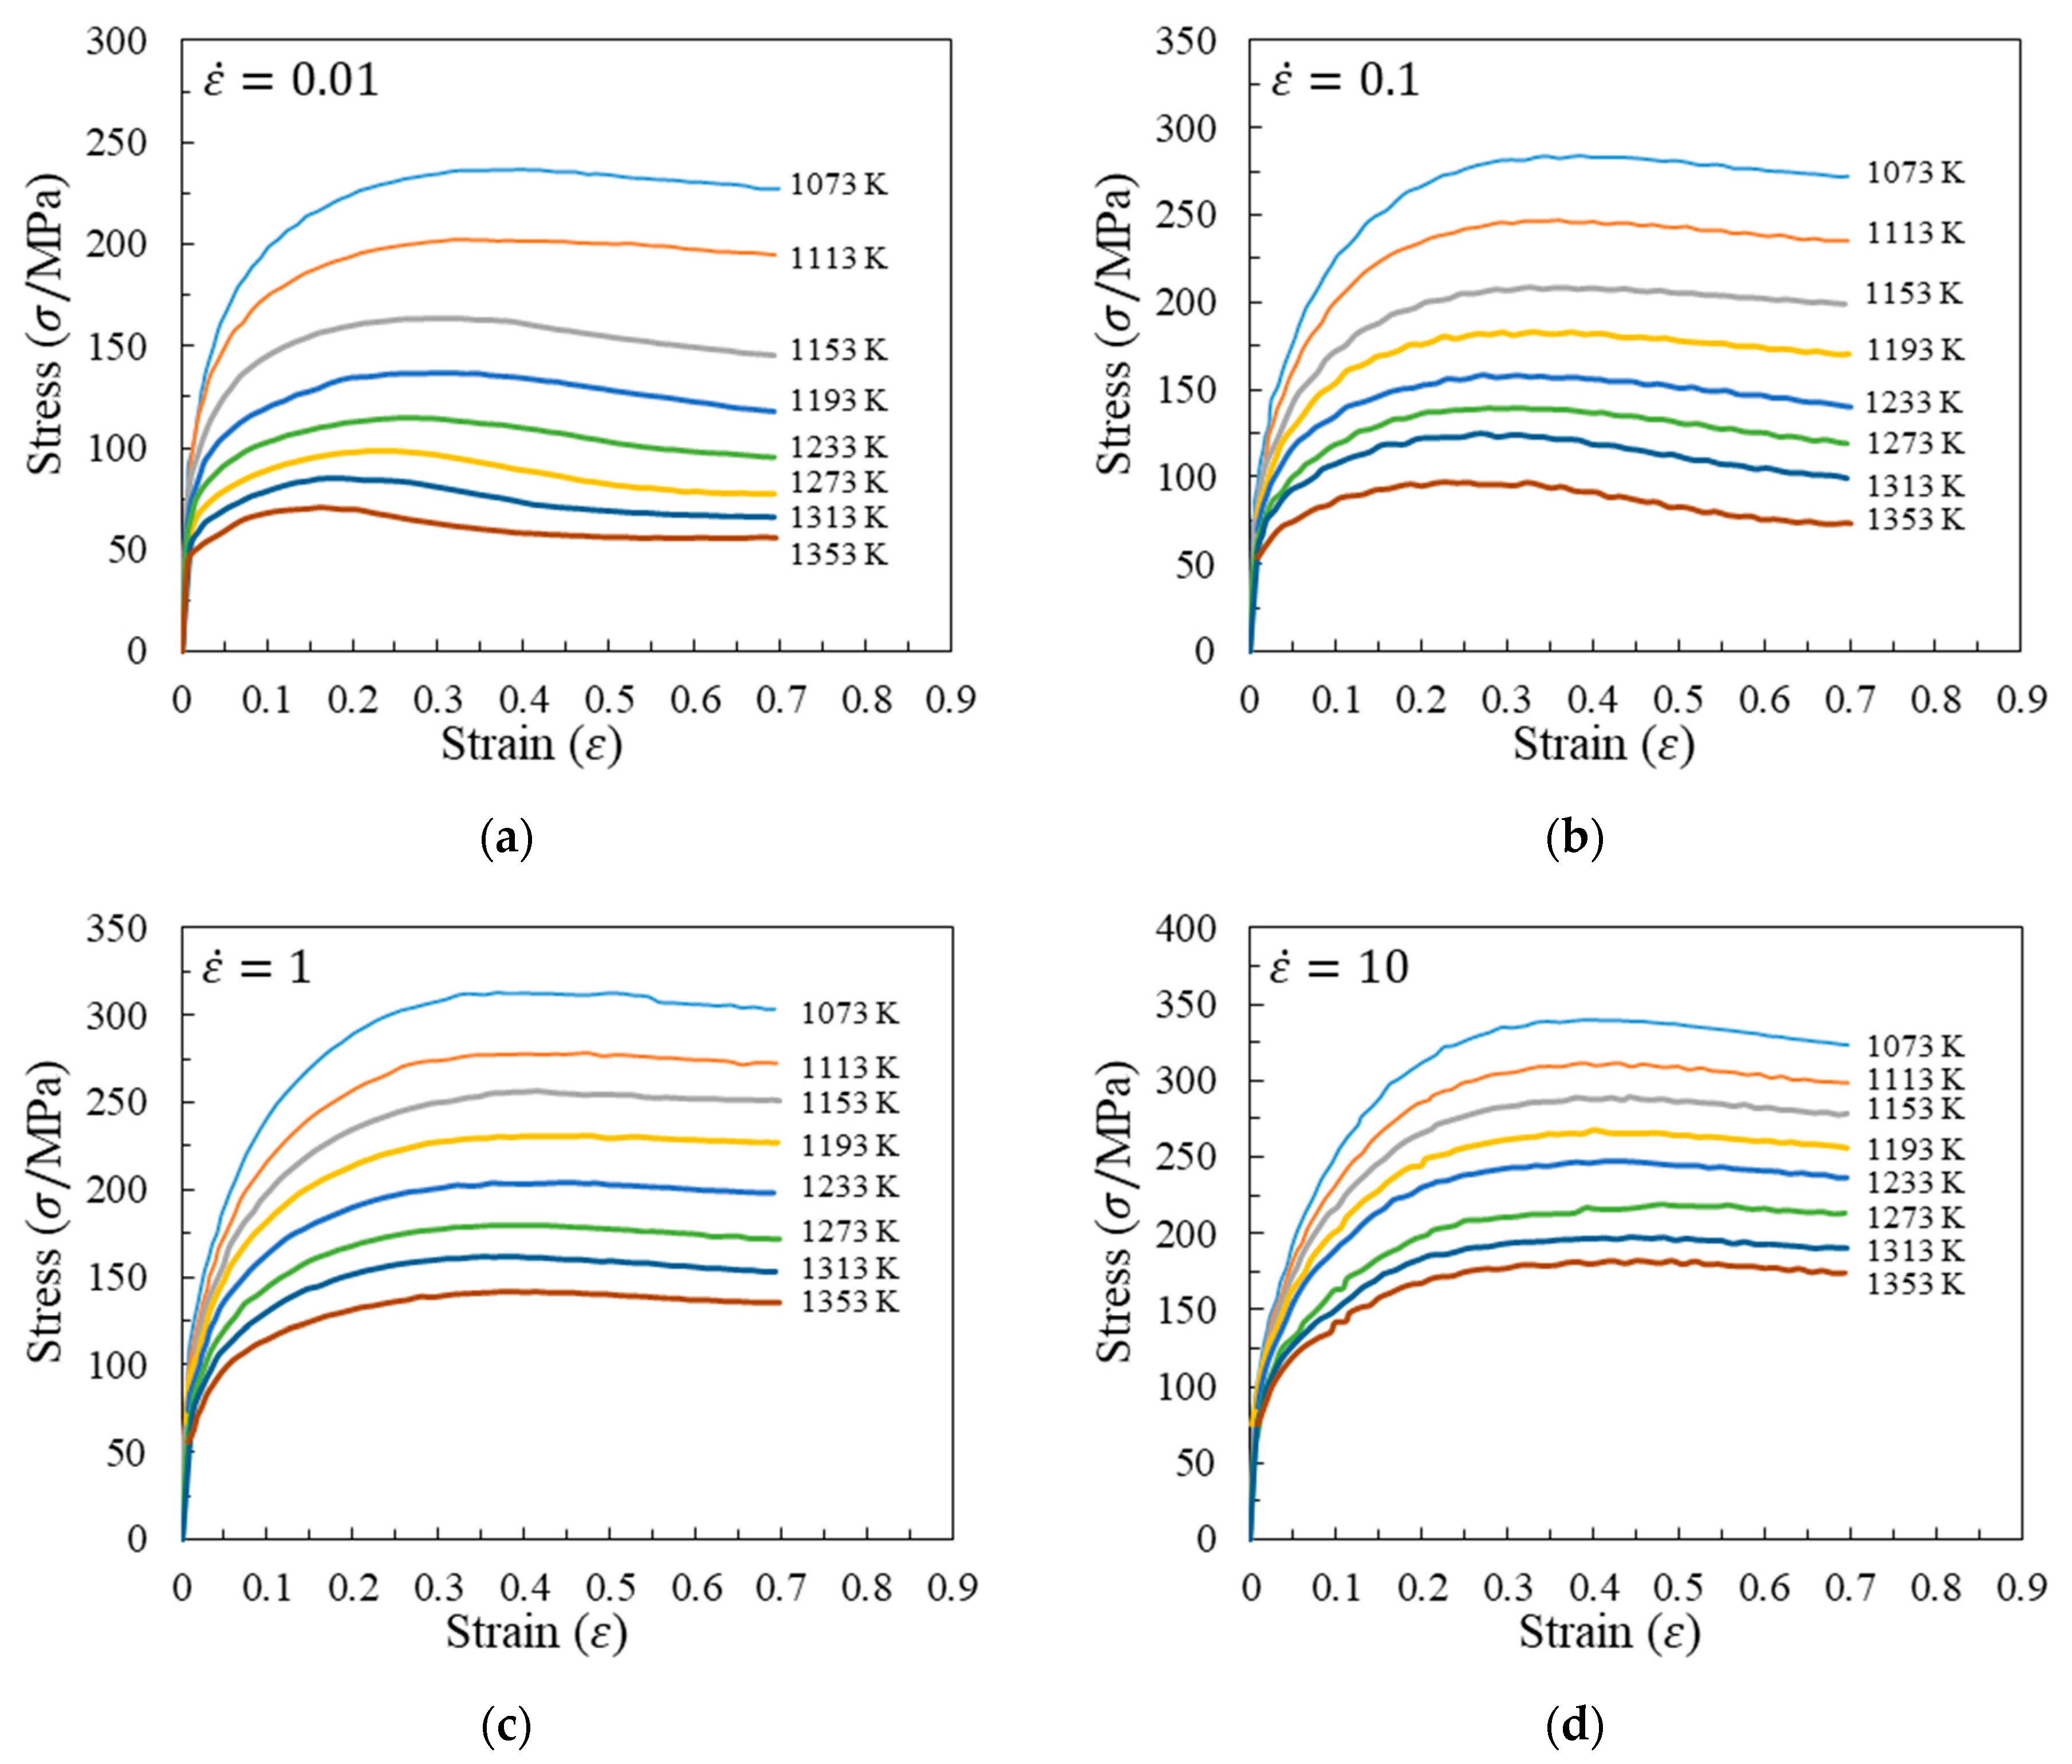
3.1. Rheological Curve
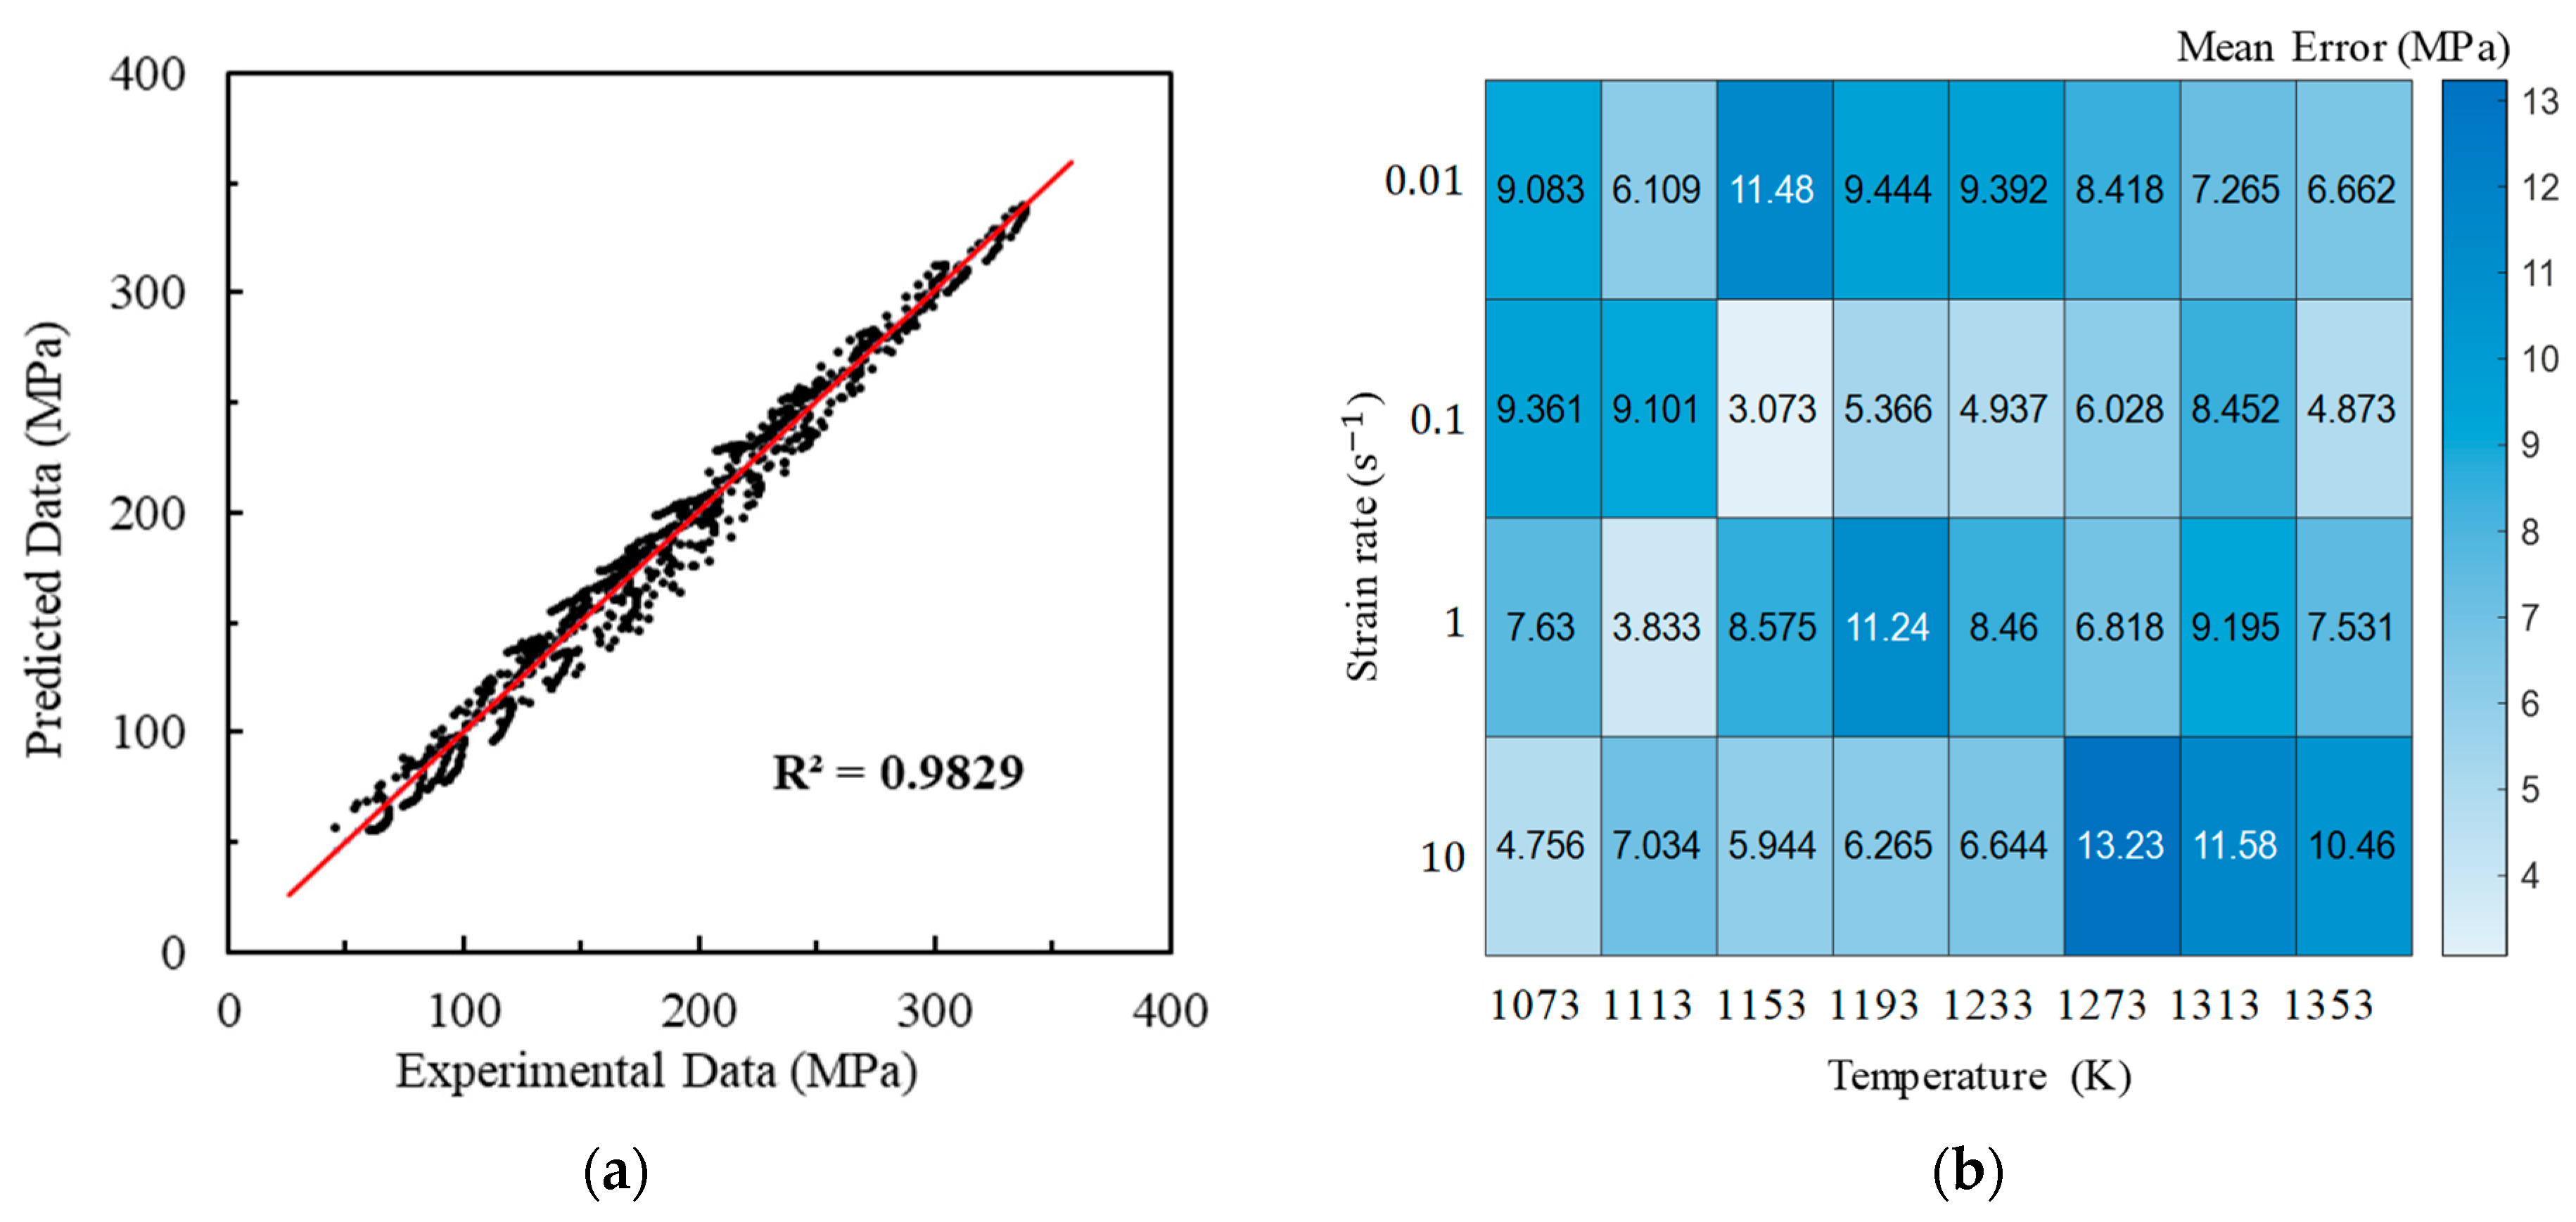
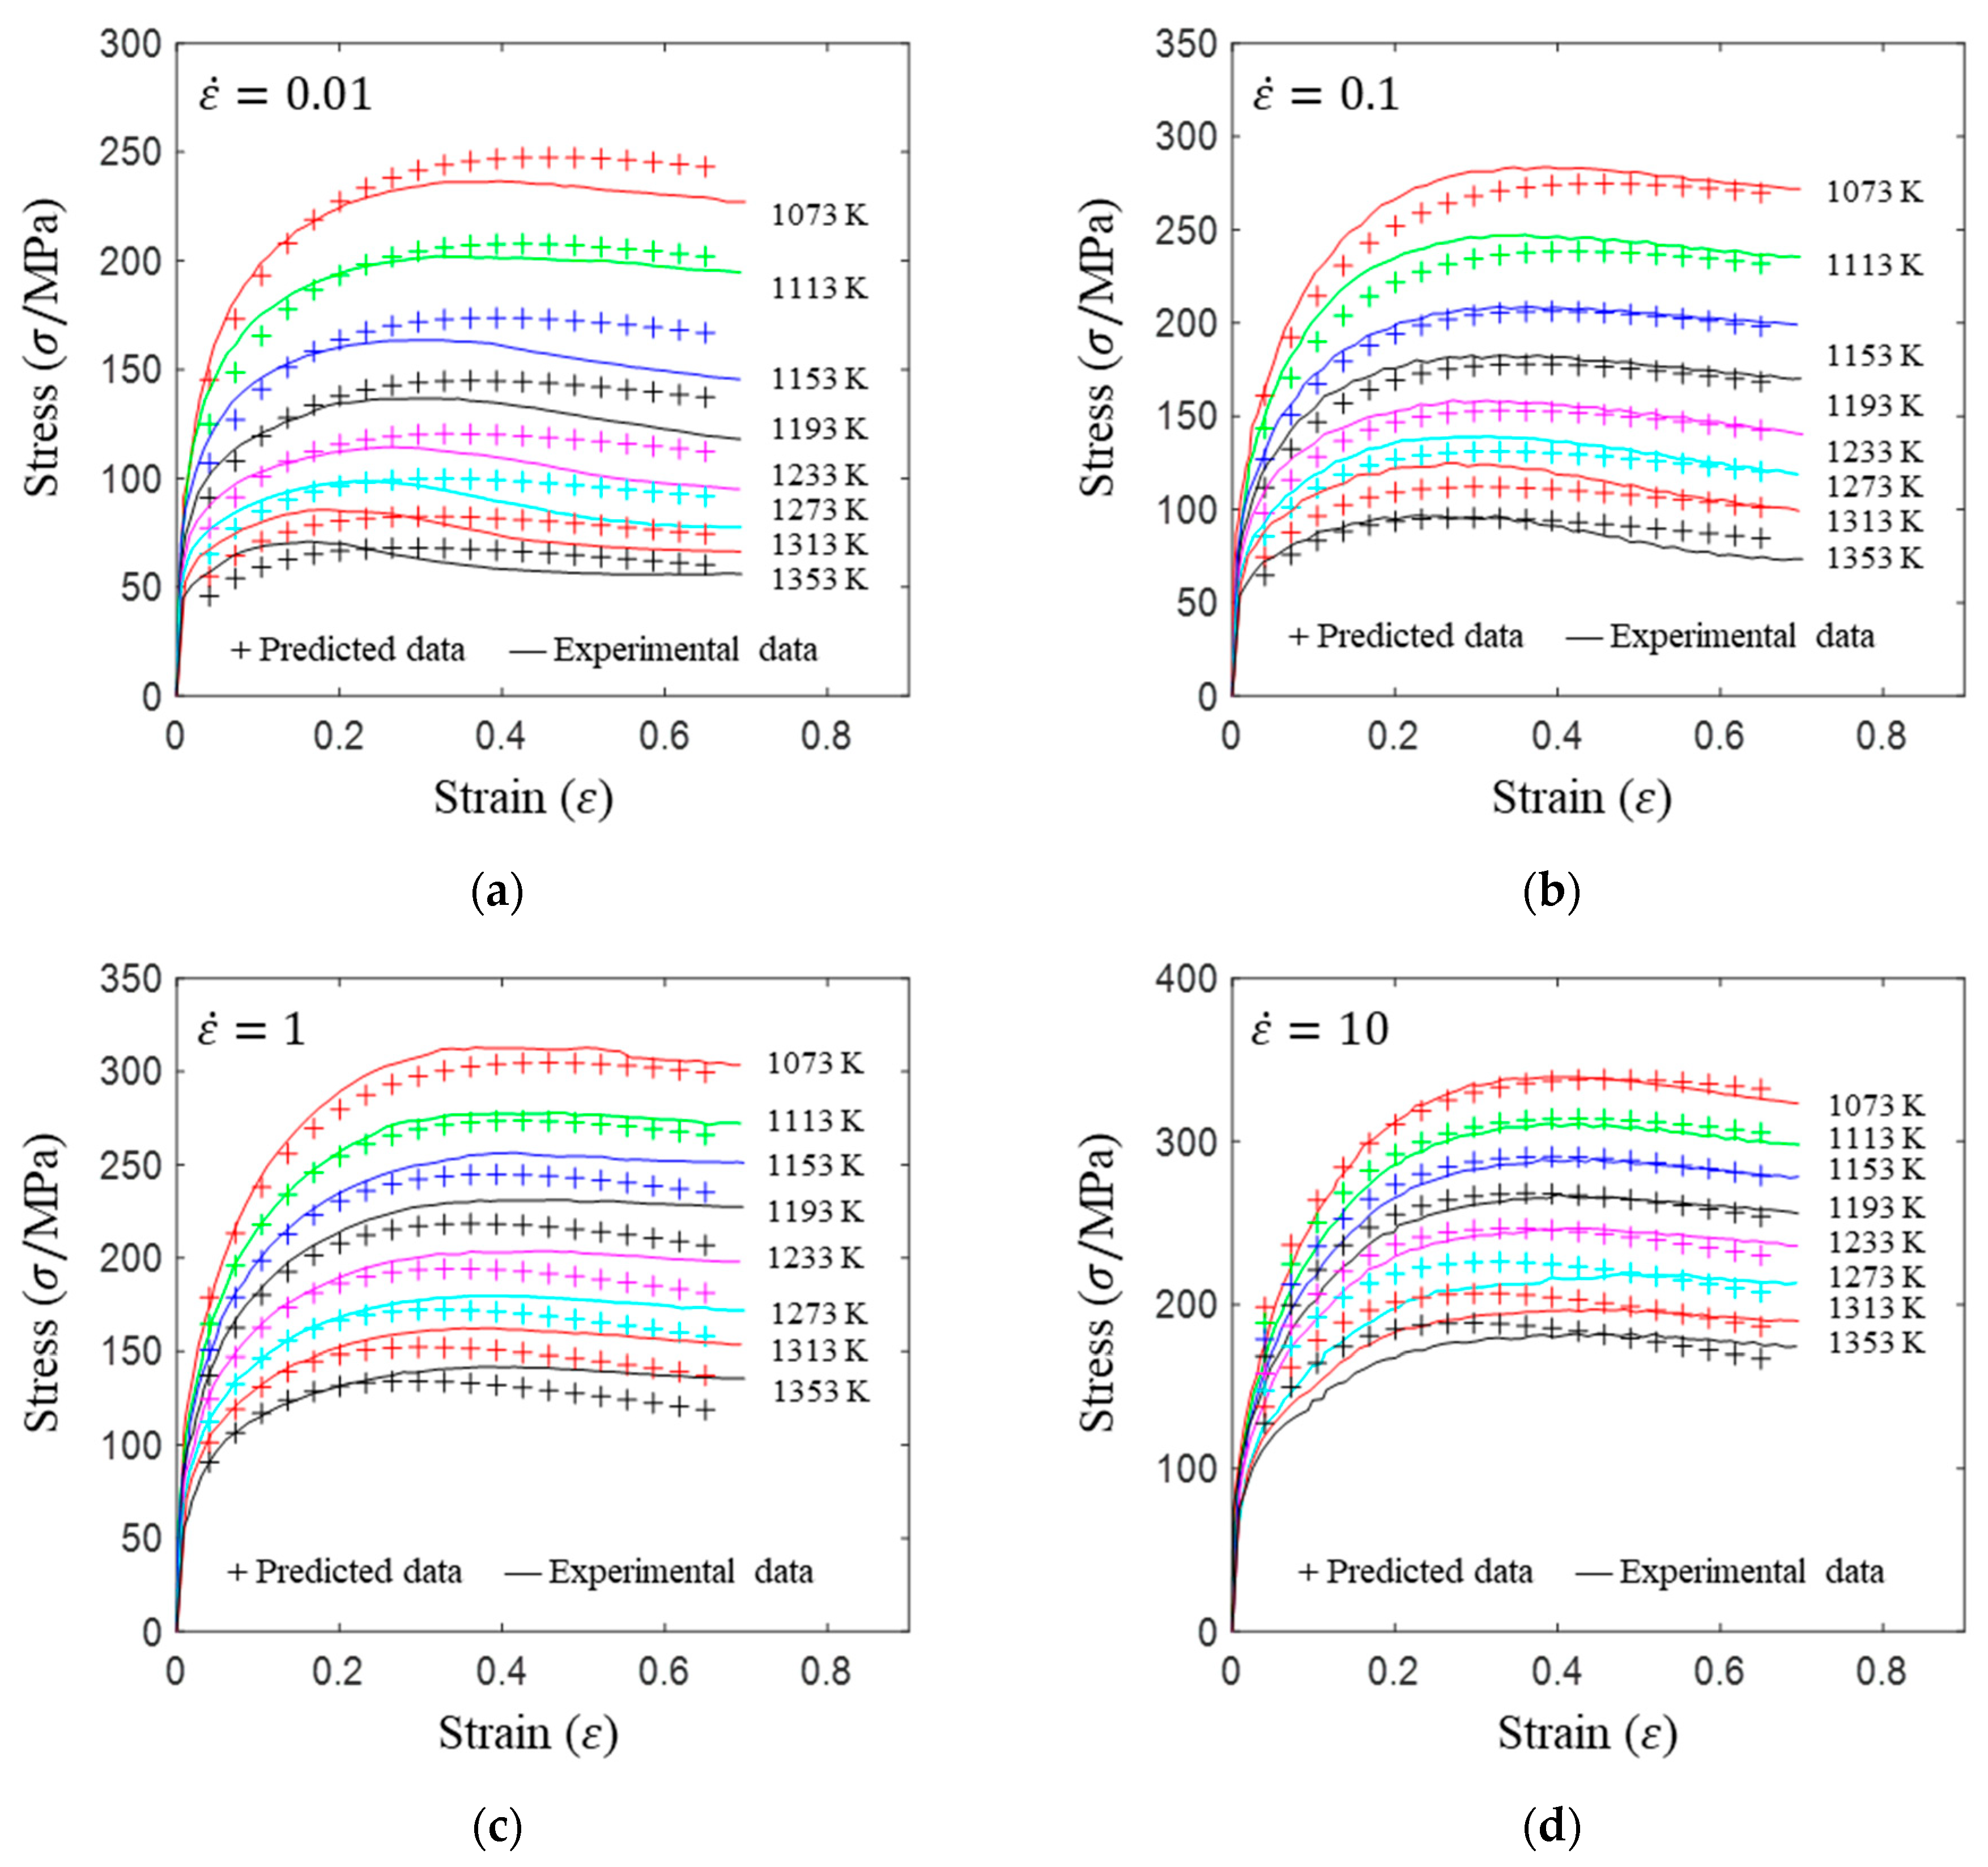
3.2. Constitutive Model
4. Recrystallization Behavior
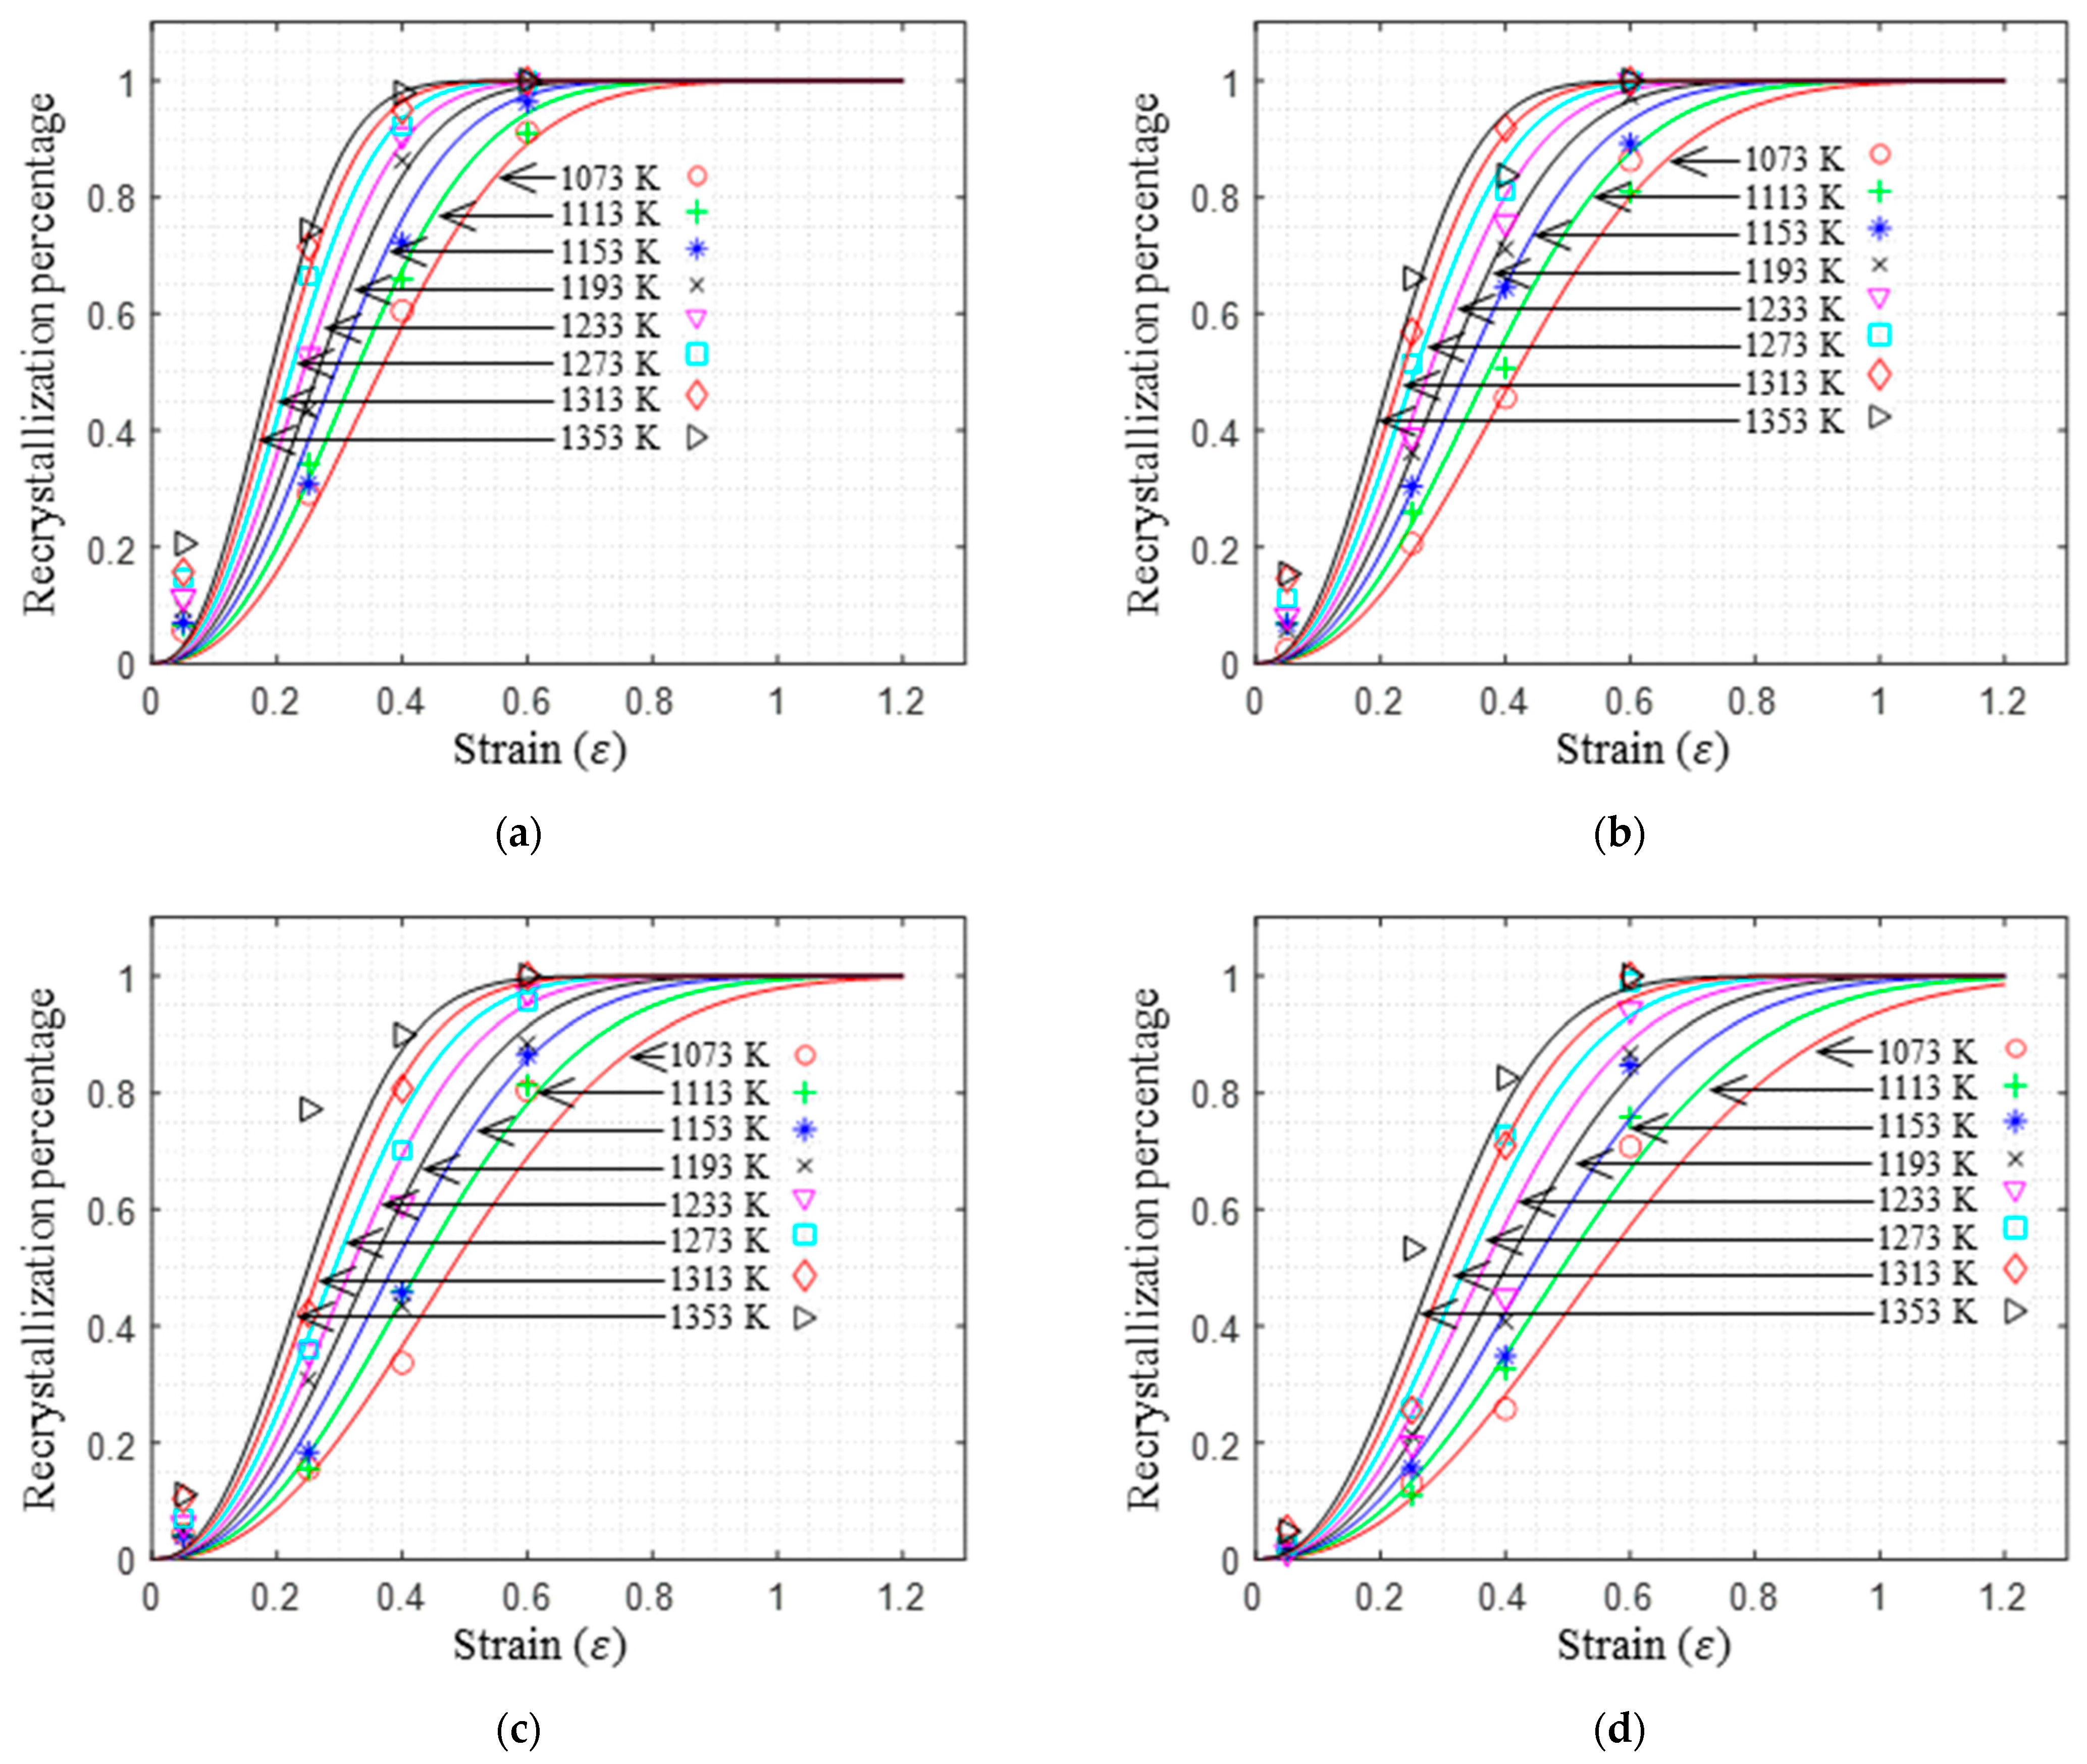
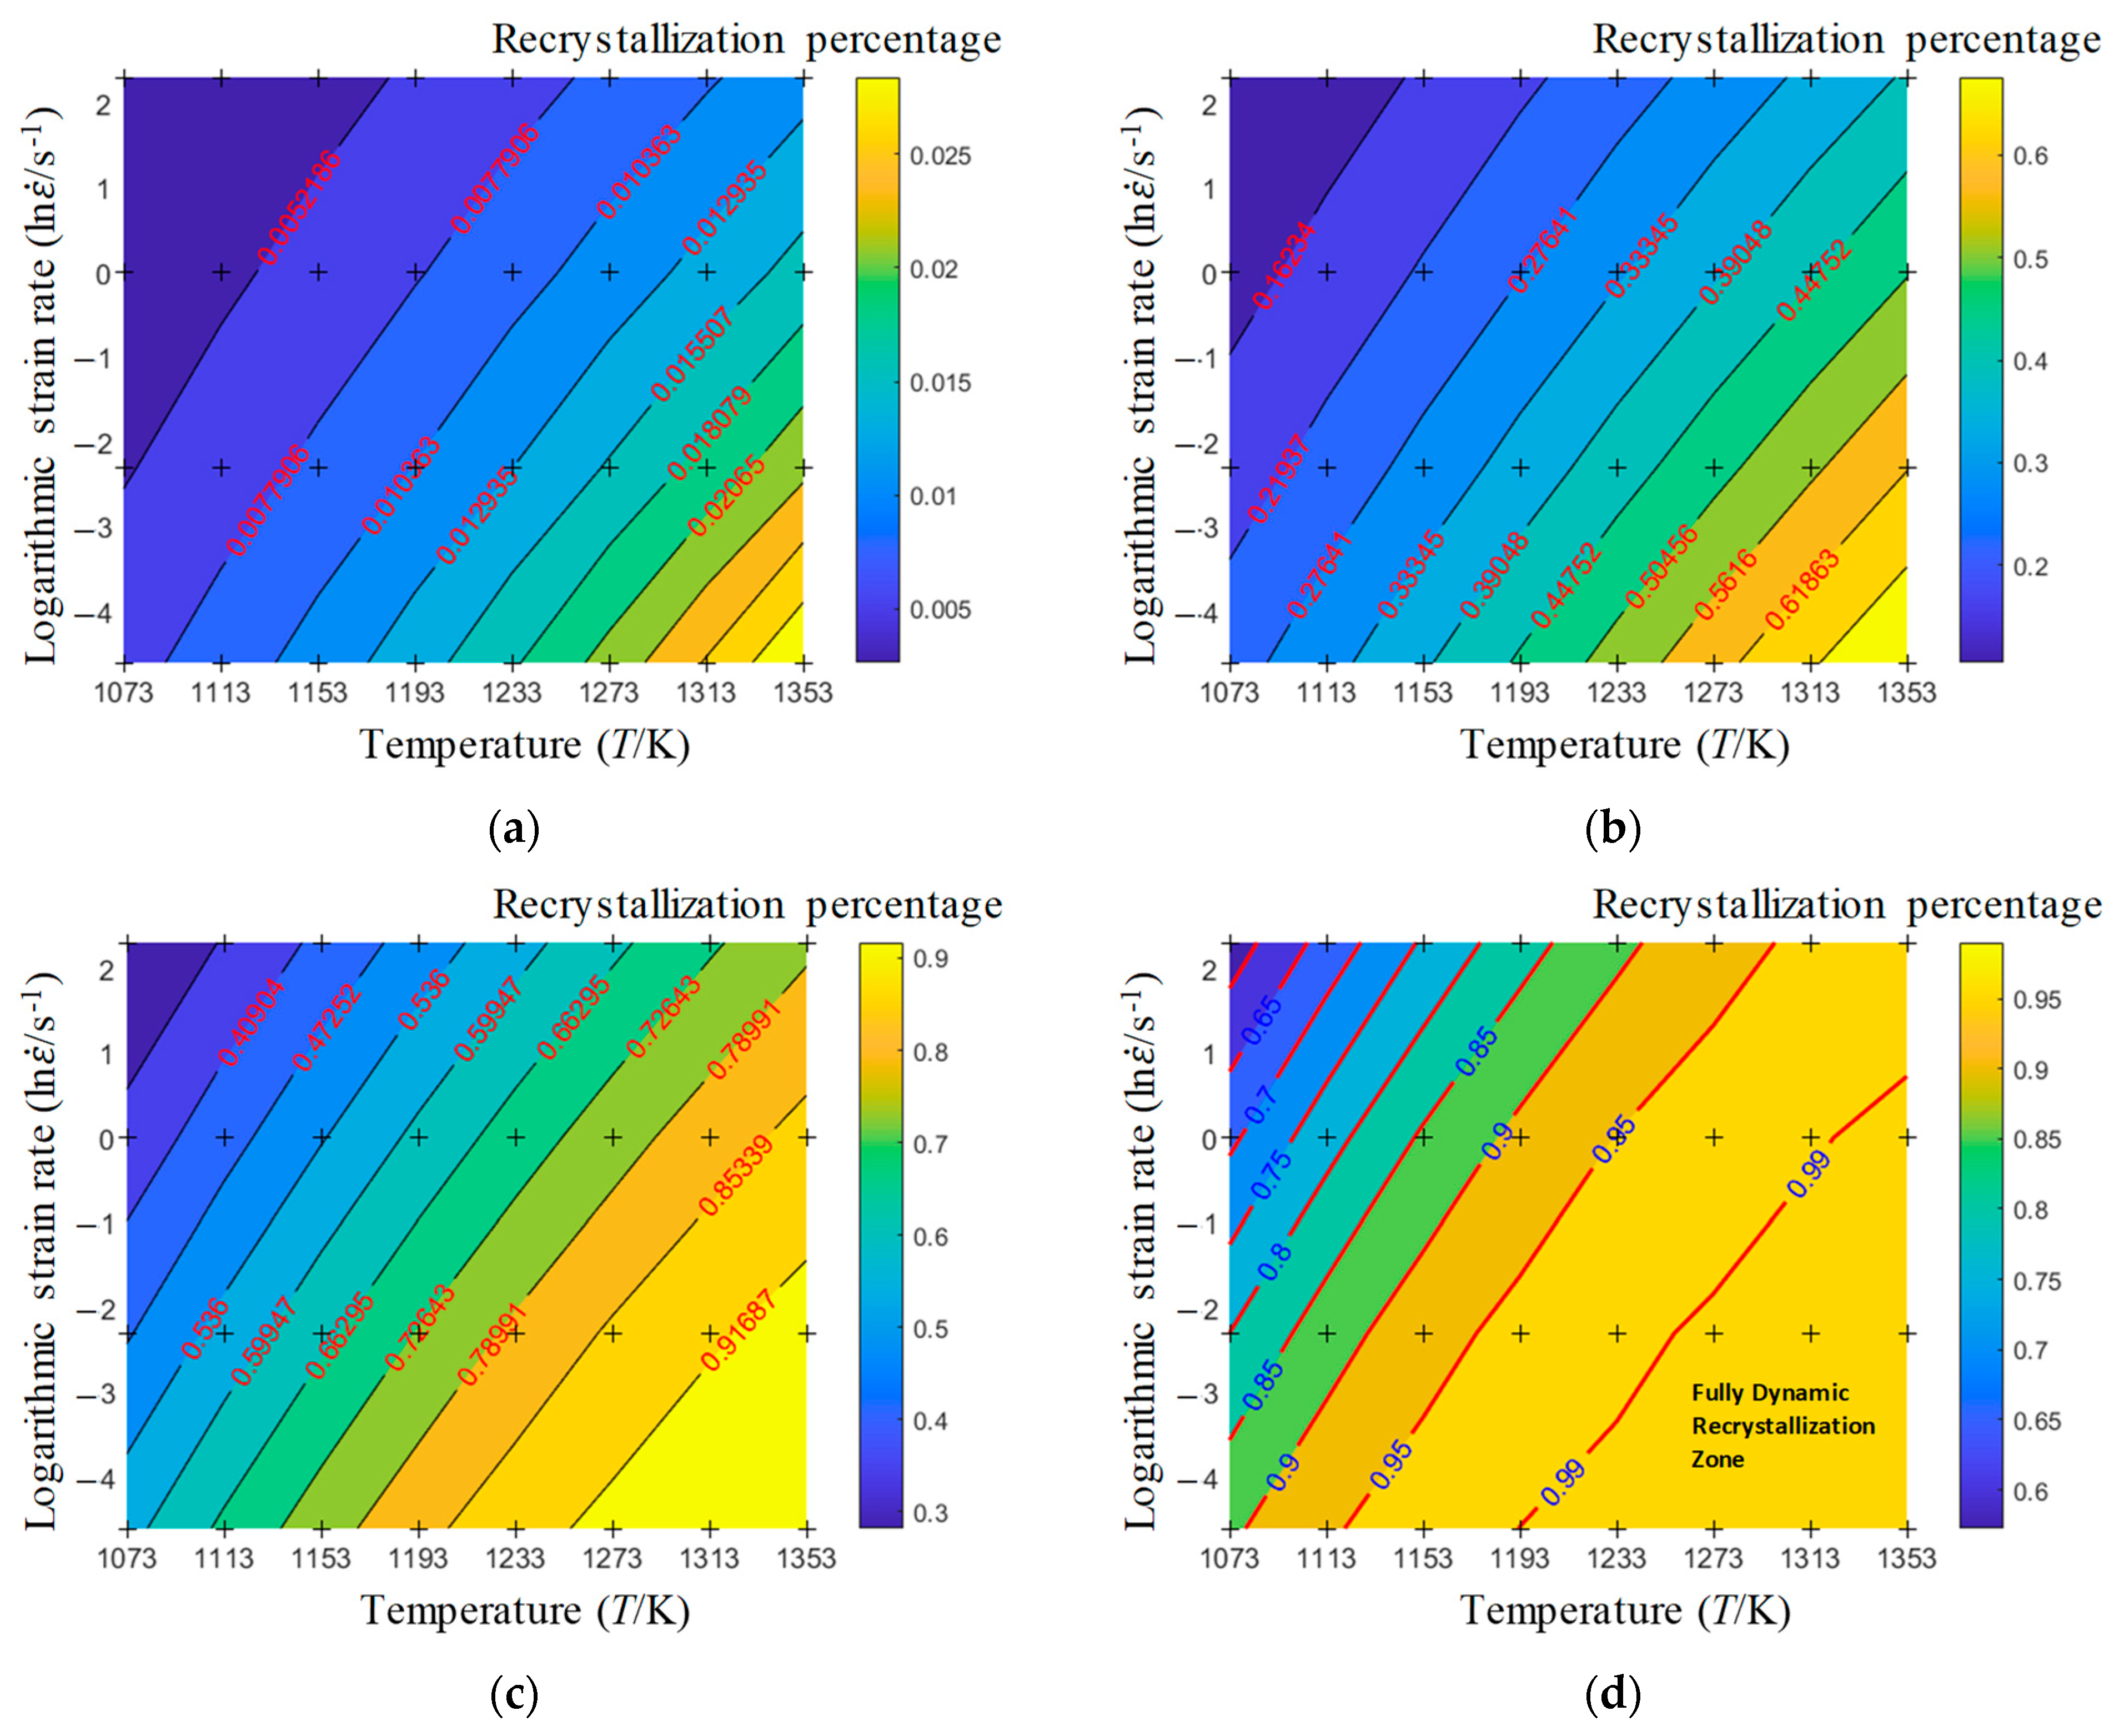
4.1. Recrystallization Percentage
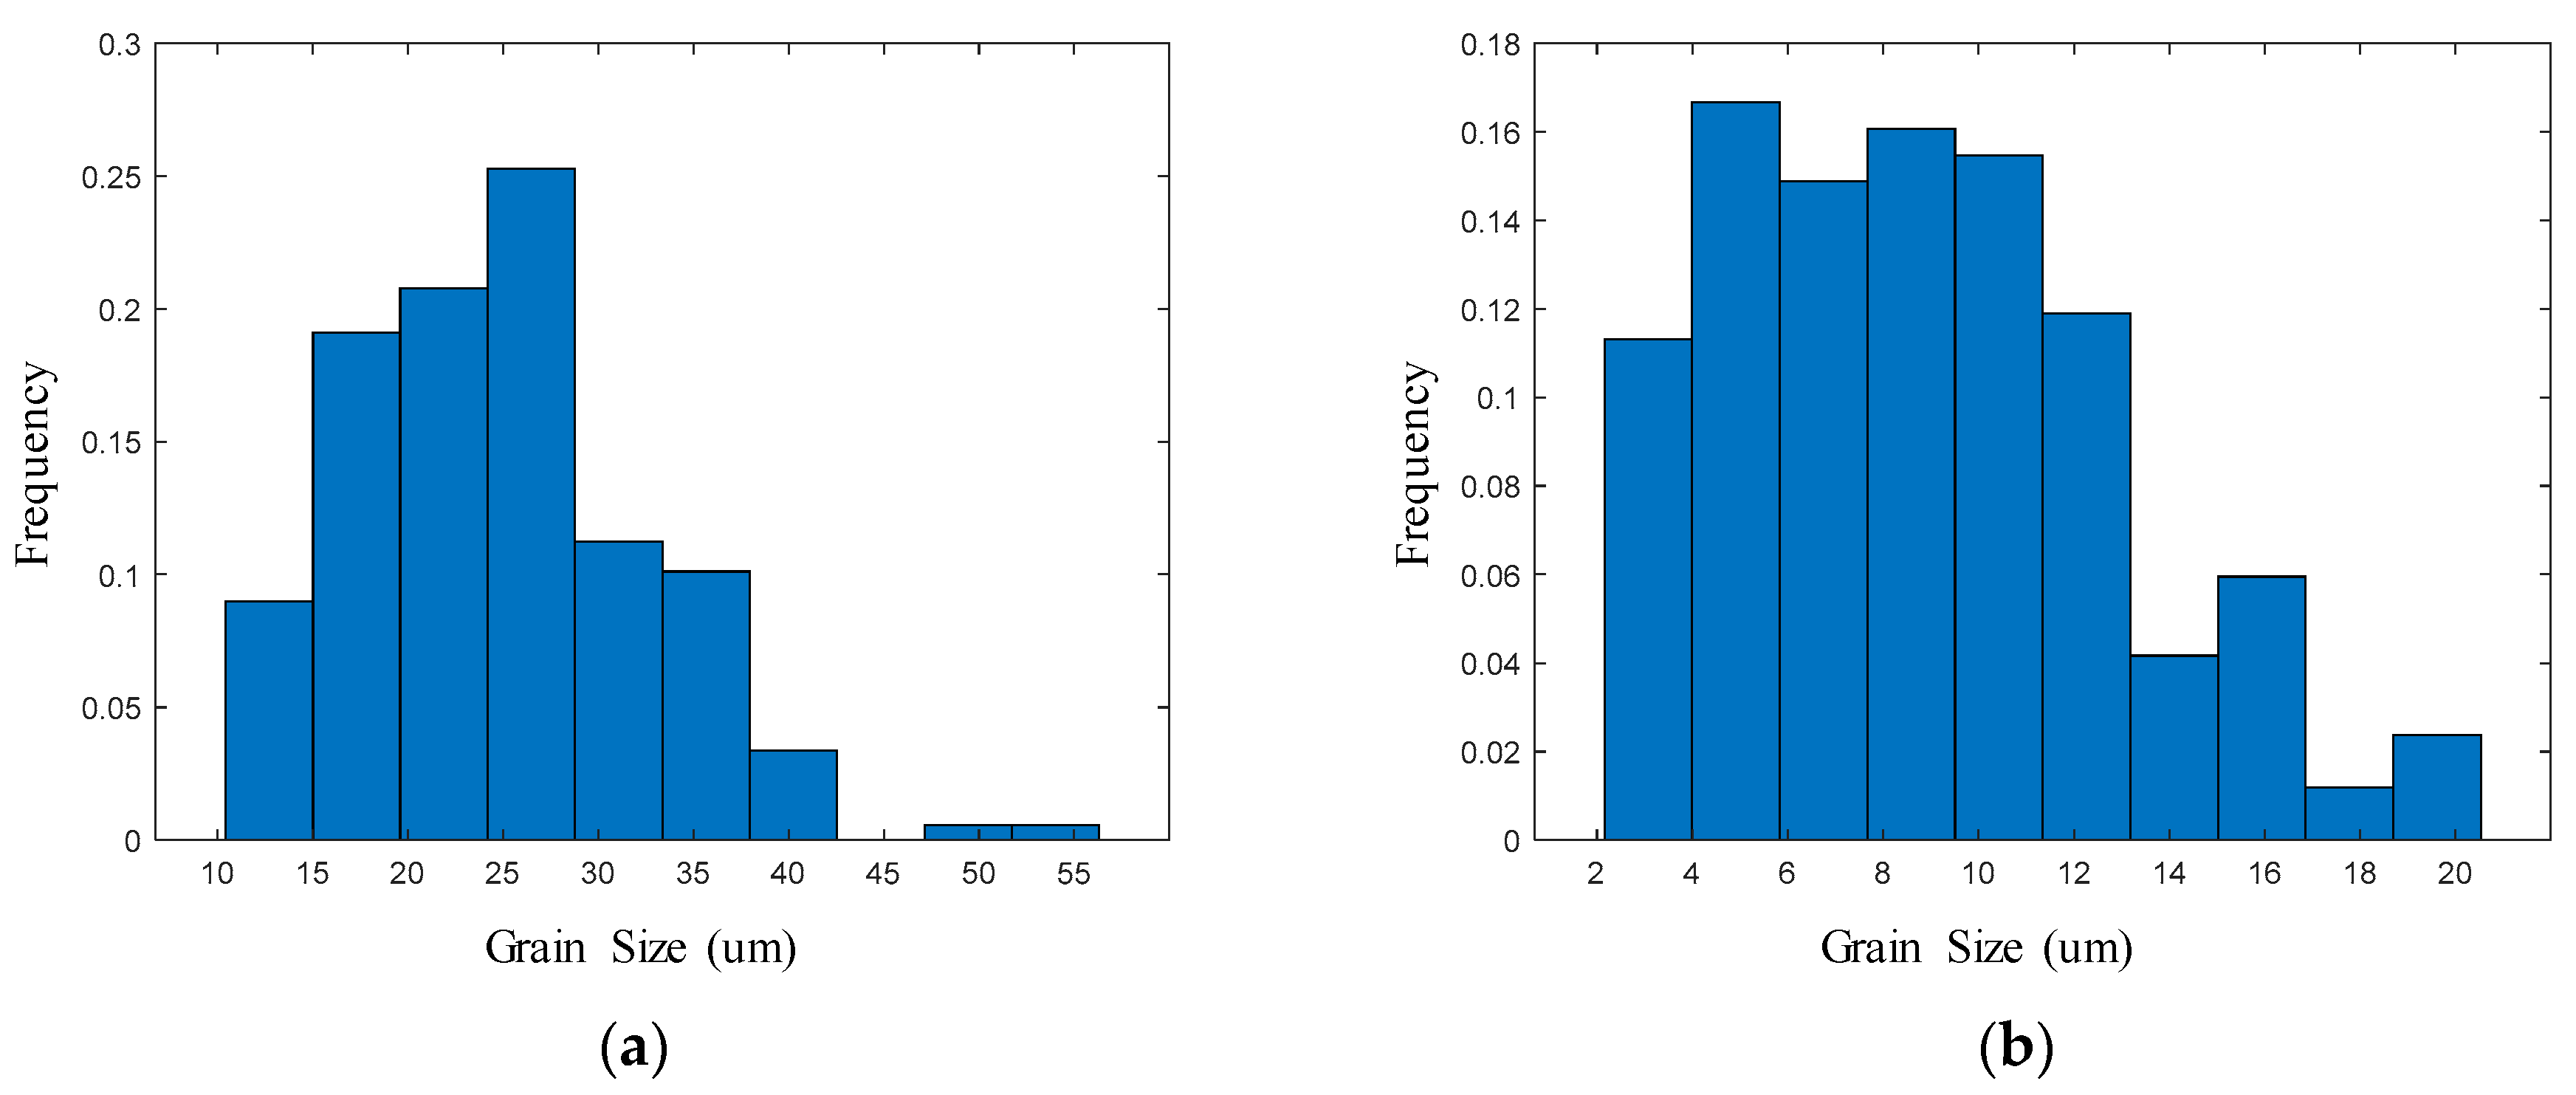
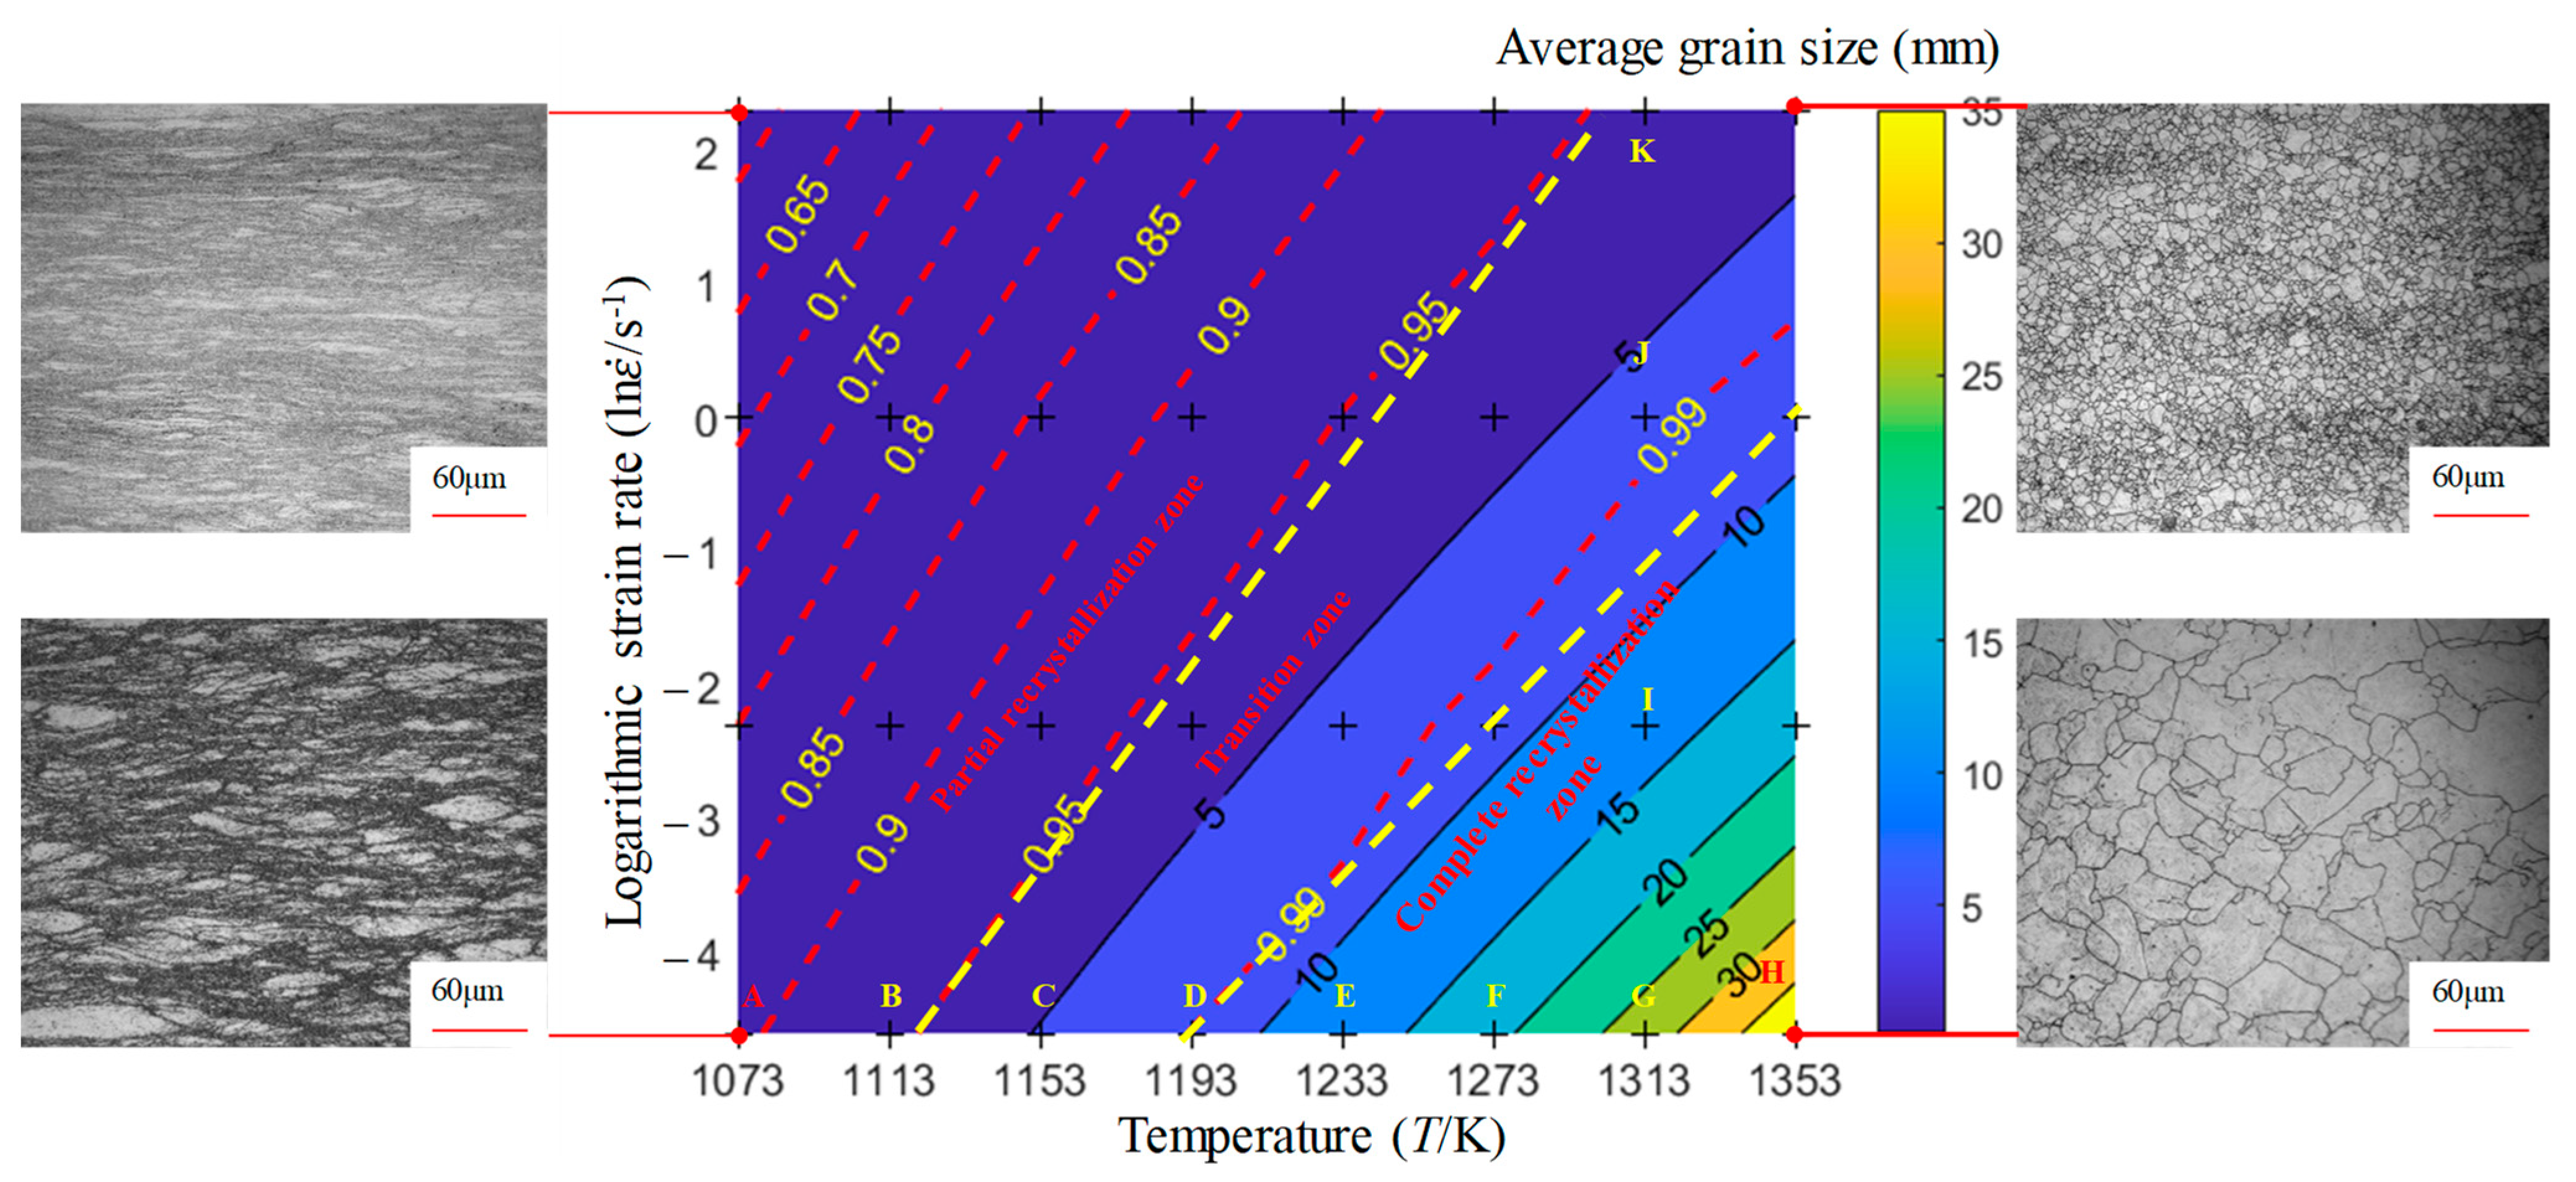
4.2. Recrystallization Size
5. Discussion
6. Conclusions
- (1)
- The stress–strain behavior reveals an initial rapid increase to a peak, followed by a gradual decline into a steady-state flow, demonstrating flow softening from high to low stress levels. This softening phenomenon is attributed to the interplay of stress increase from work hardening and stress decrease due to elevated deformation temperatures, dynamic recovery, and recrystallization. Additionally, the flow stress is highly sensitive to the strain rate. Higher strain rates correspond to increased true stress under the same deformation temperature.
- (2)
- The HS model demonstrates a high predictive accuracy for the flow deformation of A100 steel, with a correlation coefficient of 0.9914 between the predicted and experimental values. The distribution of the average prediction errors across the temperature and the strain rate appears to be relatively random, indicating that the HS model predictions lack systematic bias and showcase the model’s capability to accurately predict A100 steel with a high level of precision. The AH model for A100 steel is represented as .
- (3)
- Models for the dynamic recrystallization percentage and the dynamic recrystallization grain size have been established and validated. The results indicate that these models can effectively predict the dynamic recrystallization behavior of A100 steel. The dynamic recrystallization percentage model is represented as . The dynamic recrystallization size model when the strain is equal to 0.6 is represented as . Considering the prerequisite of complete dynamic recrystallization, the hot forming process window for obtaining a smaller average grain size is as follows: a strain greater than or equal to 0.6, a temperature between 1193 and 1353 K, and a strain rate between 0.1 and 1 s−1.
Author Contributions
Funding
Institutional Review Board Statement
Informed Consent Statement
Data Availability Statement
Conflicts of Interest
References
- Zeng, H.; Yan, R.; Wang, W.; Zhang, H.; Yan, J.; Peng, F. Analytical modeling of the heat-affected zone in laser-assisted milling of AerMet100 steel. Int. J. Adv. Manuf. Technol. 2020, 109, 2481–2490. [Google Scholar] [CrossRef]
- Wang, C.; Zhang, C.; Yang, Z.; Su, J. Carbide precipitation and element distribution in high Co–Ni secondary hardening steel. J. Iron Steel Res. Int. 2018, 25, 340–346. [Google Scholar] [CrossRef]
- Shi, X.; Zeng, W.; Zhao, Q.; Peng, W.; Kang, C. Study on the microstructure and mechanical properties of AerMet 100 steel at the tempering temperature around 482 °C. J. Alloys Compd. 2016, 679, 184–190. [Google Scholar] [CrossRef]
- Eckert, M.; Krbata, M.; Kohutiar, M.; Kuba, M. Hot deformation analysis of 100MnCrW4 tool steel. Process. Struct. Integr. 2023, 43, 318–323. [Google Scholar] [CrossRef]
- Sung, J.H.; Kim, J.H.; Wagoner, R. A plastic constitutive equation incorporating strain, strain-rate, and temperature. Int. J. Plast. 2010, 26, 1746–1771. [Google Scholar] [CrossRef]
- Sirigiri, V.K.R.; Gudiga, V.Y.; Gattu, U.S.; Suneesh, G.; Buddaraju, K.M. A review on Johnson Cook material model. Mater. Today Proc. 2022, 62, 3450–3456. [Google Scholar] [CrossRef]
- Zerilli, F.J.; Armstrong, R.W. Dislocation-Mechanics-Based constitutive relations for material dynamics calculations. J. Appl. Phys. 1987, 61, 1816–1825. [Google Scholar] [CrossRef]
- Kocks, U.F. Realistic constitutive relations for metal plasticity. Mater. Sci. Eng. A 2001, 317, 181–187. [Google Scholar] [CrossRef]
- Samantaray, D.; Mandal, S.; Bhaduri, A. A comparative study on johnson cook, modified zerilli-armstrong and arrhenius-type constitutive models to predict elevated temperature flow behaviour in modified 9Cr-1Mo steel. Compos. Mater. Sci. 2009, 47, 568–576. [Google Scholar] [CrossRef]
- Lin, Y.; Chen, M.S.; Zhong, J. Constitutive modeling for elevated temperature flow behavior of 42CrMo steel. Compos. Mater. Sci. 2008, 42, 470–477. [Google Scholar] [CrossRef]
- Sellars, C.M.; McTegart, W.J. On the mechanism of hot deformation. Acta Metall. 1966, 14, 1136–1138. [Google Scholar] [CrossRef]
- Khan, A.S.; Kazmi, R.; Farrokh, B. Multiaxial and non-proportional loading responses, anisotropy and modeling of Ti-6Al-4V titanium alloy over wide ranges of strain rates and temperatures. Int. J. Plast. 2007, 23, 931–950. [Google Scholar] [CrossRef]
- Hu, D.Y.; Meng, K.P.; Jiang, H.L.; Xu, J.; Liu, R.R. Strain rate dependent constitutive behavior investigation of AerMet 100 steel. Mater. Des. 2015, 87, 759–772. [Google Scholar] [CrossRef]
- Jakus, A.; Fredenburg, A.; Thadhani, N. High-strain-rate behavior of maraging steel linear cellular alloys: Mechanical deformations. J. Mater. Sci. Eng. A. 2012, 534, 452–458. [Google Scholar] [CrossRef]
- Ramana, A.V.; Balasundar, I.; Davidson, M.J.; Balamuralikrishnan, R.; Raghu, T. Constitutive modelling of a new high-strength low-alloy steel using modified Zerilli-Armstrong and arrhenius model. Trans. Indian Inst. Met. 2019, 72, 2869–2876. [Google Scholar] [CrossRef]
- Yuan, Z.; Li, F.; Ji, G. A modified johnson cook constitutive model for Aermet 100 at elevated temperatures. High Temp. Mater. Proc. 2018, 37, 163–172. [Google Scholar]
- Liu, Y.; Yin, Z.; Luo, J.; Zhang, C.; Zhang, Y. The constitutive relationship and processing map of hot deformation in A100 steel. High Temp. Mater. Proc. 2016, 35, 399–405. [Google Scholar] [CrossRef]
- Yuan, Z.; Li, F.; Qiao, H.; Ji, G. Constitutive flow behavior and hot workability of AerMet100 at elevated temperatures. J. Mater. Eng. Perform 2014, 23, 1981–1999. [Google Scholar] [CrossRef]
- Ji, G.; Li, F.; Li, Q.; Li, H.; Li, Z. A comparative study on Arrhenius-Type constitutive model and artificial neural network model to predict high-temperature deformation behaviour in Aermet100 steel. J. Mater. Sci. Eng. A 2011, 528, 4774–4782. [Google Scholar] [CrossRef]
- Bariani, P.; Bruschi, S.; Negro, T.D. Prediction of nickel-base superalloys’ rheological behaviour under hot forging conditions using artificial neural networks. Process Technol. 2004, 152, 395–400. [Google Scholar] [CrossRef]
- Fangpo, L.; Ning, L.; Xiaojian, R.; Song, Q.; Caihong, L.; Jianjun, W.; Yang, X.; Bin, W. Arrhenius constitutive equation and artificial neural network model of flow stress in hot deformation of offshore steel with high strength and toughness. Mater. Technol. 2023, 38, 1066–7857. [Google Scholar] [CrossRef]
- Mehtedi, M.E.; Spigarelli, S.; Gabrielli, F.; Donati, L. Comparison study of constitutive models in predicting the hot deformation behavior of AA6060 and AA6063 aluminium alloys. Mater. Today Proc. 2015, 2, 4732–4739. [Google Scholar] [CrossRef]
- Mehtedi, M.E.; Musharavati, F.; Spigarelli, S. Modelling of the flow behaviour of wrought aluminium alloys at elevated temperatures by a new constitutive equation. Mater. Des. 2014, 54, 869–873. [Google Scholar] [CrossRef]
- Wang, J.; Xiao, G.; Zhang, J. A new constitutive model and hot processing map of 5A06 aluminum alloy based on high-temperature rheological behavior and higher-order gradients. Mater. Today Commun. 2023, 36, 106502. [Google Scholar] [CrossRef]
- Yu, W.; Wang, T.; Yang, L.; An, Q.; Ming, W.; Chen, M. Finite element and experimental analysis of grain refinement caused by dynamic recrystallization during high-speed cutting of nickel-based superalloys. Simul. Model Pract. Theory 2023, 128, 102807. [Google Scholar] [CrossRef]
- Dong, C.; Zhao, X. Dynamic recrystallization behavior and microstructure evolution of high-strength low-alloy steel during hot deformation. J. Mater. Res. Technol. 2023, 25, 6087–6098. [Google Scholar] [CrossRef]
- Lee, H.; Jo, Y.; Jang, B. Hot deformation behavior and dynamic recrystallization of a medium carbon Cr–Mo steel for class 16.8 Bolts. Met. Mater. Int. 2023, 30, 39–47. [Google Scholar] [CrossRef]
- Jo, Y.D.; Lee, H.J.; Nam, S.S.; Kang, H.W.; Jang, B.L. Hot workability and dynamic recrystallization behaviors of medium-Carbon Cr-Mo alloys for high strength cold heading quality wire rod. Korean J. Met. Mater. 2022, 60, 423–431. [Google Scholar] [CrossRef]
- Sellars, C. Modelling microstructural development during hot rolling. Mater. Sci. Technol. 1990, 6, 1072–1081. [Google Scholar] [CrossRef]
- Kumar, A.; Prasad, T.V.V.S.V.; Karthik, V.V.; Banerjee, K.; Gopinath, K.; Balamuralikrishnan, R. Recrystallisation characteristics of a Cu-Bearing HSLA steel assessed through high temperature compressive deformation. Def. Sci. J. 2023, 73, 121–130. [Google Scholar] [CrossRef]
- Qiao, H.; Li, F.; Ji, G.; Xiao, M. Deformation behavior at elevated temperature and processing map of Aermet100 steel. Rare Met. Mater. Eng. 2014, 43, 926–931. [Google Scholar]
- Ji, G.; Li, F.; Li, Q.; Li, H.; Li, Z. Research on the dynamic recrystallization kinetics of Aermet100 steel. J. Mater. Sci. Eng. A 2010, 527, 2350–2355. [Google Scholar] [CrossRef]


| C | Co | Ni | Cr | Mo | Si | O | S | Mn | Fe |
|---|---|---|---|---|---|---|---|---|---|
| 0.24 | 13.40 | 11.50 | 3.22 | 1.25 | 0.11 | 0.0008 | 0.001 | ≤0.10 | Bal. |
| Tensile Strength (MPa) | Yield Strength (MPa) | Elongation Rate (%) | Hardness (HRC) |
|---|---|---|---|
| 1900 | 1700 | 14 | 50 |
| Constants | |||||||||
|---|---|---|---|---|---|---|---|---|---|
| Value | −9.30 | 0.00 | 0.50 | −0.30 | 0.01 | 0.00 | 0.28 | 0.00 | 3.04 |
| Lower Limit | −32.39 | −0.01 | 0.34 | −0.35 | 0.00 | 0.00 | −0.28 | 0.00 | −0.75 |
| Upper Limit | 13.79 | 0.00 | 0.66 | −0.25 | 0.02 | 0.00 | 0.85 | 0.00 | 6.83 |
| Strain | ||||
|---|---|---|---|---|
| T/K | 0.05 | 0.25 | 0.40 | 0.60 |
| 1073 | 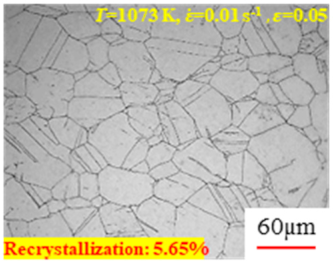 | 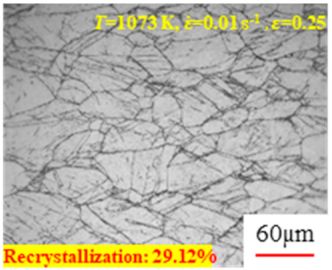 | 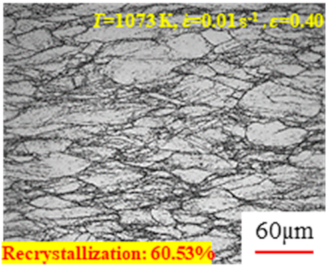 | 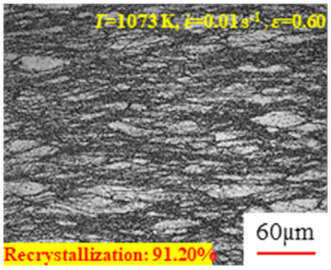 |
| 1113 | 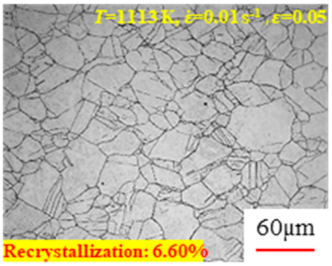 | 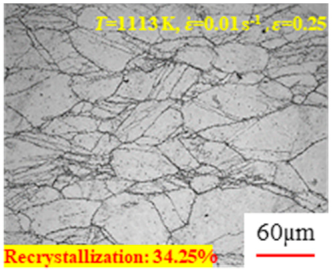 |  | 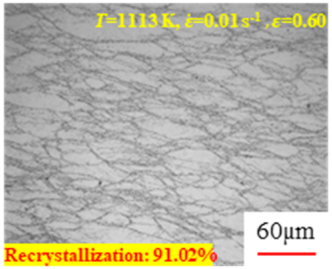 |
| 1153 |  | 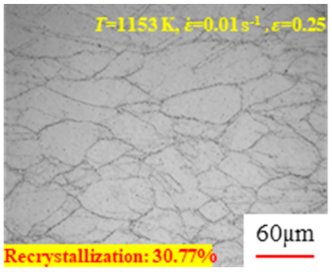 | 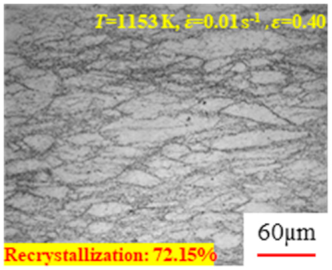 | 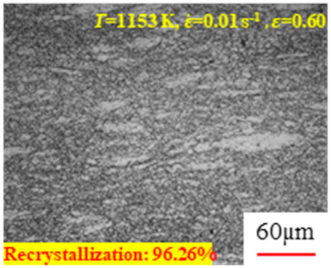 |
| 1193 | 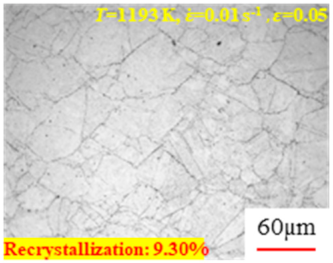 |  |  | 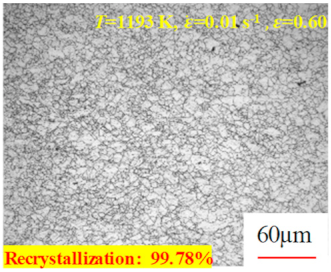 |
| 1233 | 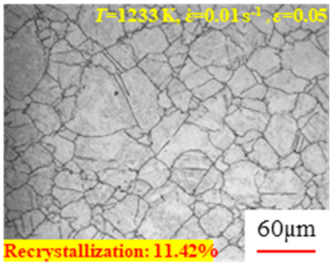 | 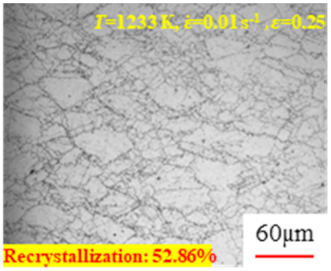 | 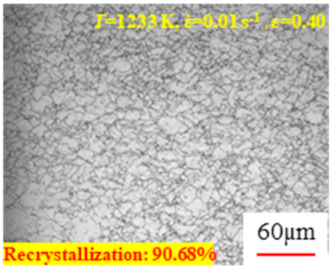 | 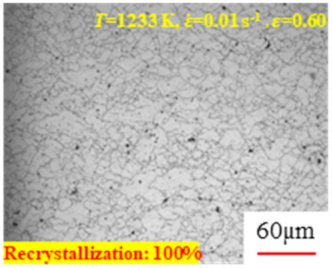 |
| 1273 |  | 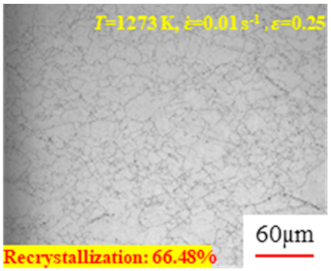 | 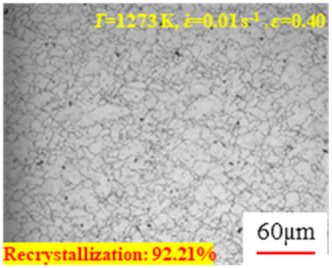 | 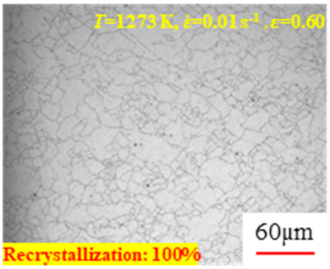 |
| 1313 |  | 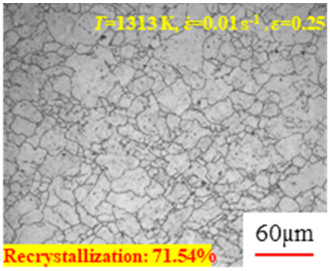 |  | 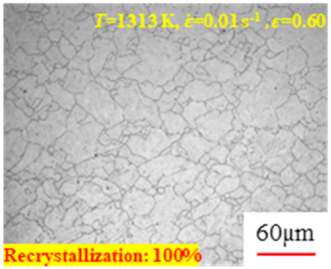 |
| 1353 | 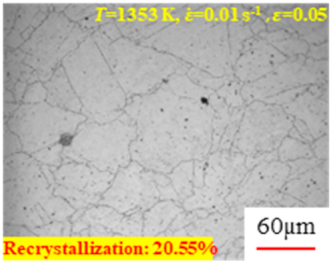 | 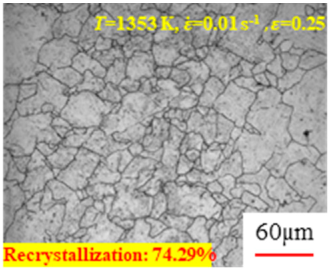 | 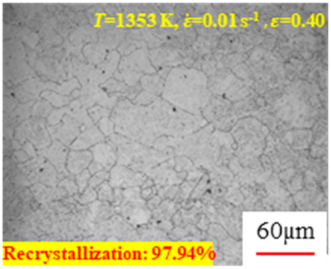 | 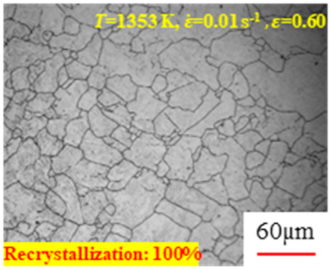 |
| /s−1) | /s−1) | ||||||||
|---|---|---|---|---|---|---|---|---|---|
| Temperature (T/K) | 0.01 | 0.1 | 1 | 10 | Temperature (T/K) | 0.01 | 0.1 | 1 | 10 |
| 1073 | 0.056 | 0.024 | 0.043 | 0.024 | 1073 | 0.291 | 0.206 | 0.155 | 0.131 |
| 1113 | 0.066 | 0.069 | 0.041 | 0.012 | 1113 | 0.343 | 0.259 | 0.155 | 0.110 |
| 1153 | 0.070 | 0.068 | 0.039 | 0.017 | 1153 | 0.308 | 0.304 | 0.184 | 0.156 |
| 1193 | 0.093 | 0.058 | 0.049 | 0.022 | 1193 | 0.435 | 0.362 | 0.308 | 0.214 |
| 1233 | 0.114 | 0.082 | 0.061 | 0.012 | 1233 | 0.529 | 0.390 | 0.356 | 0.198 |
| 1273 | 0.147 | 0.112 | 0.070 | 0.024 | 1273 | 0.665 | 0.514 | 0.360 | 0.259 |
| 1313 | 0.157 | 0.146 | 0.104 | 0.052 | 1313 | 0.715 | 0.569 | 0.422 | 0.256 |
| 1353 | 0.206 | 0.154 | 0.111 | 0.048 | 1353 | 0.743 | 0.661 | 0.772 | 0.533 |
| /s−1) | /s−1) | ||||||||
| Temperature (T/K) | 0.01 | 0.1 | 1 | 10 | Temperature (T/K) | 0.01 | 0.1 | 1 | 10 |
| 1073 | 0.605 | 0.456 | 0.337 | 0.258 | 1073 | 0.912 | 0.863 | 0.804 | 0.708 |
| 1113 | 0.659 | 0.507 | 0.460 | 0.326 | 1113 | 0.910 | 0.809 | 0.813 | 0.758 |
| 1153 | 0.722 | 0.645 | 0.457 | 0.349 | 1153 | 0.963 | 0.892 | 0.865 | 0.847 |
| 1193 | 0.863 | 0.711 | 0.435 | 0.408 | 1193 | 1.000 | 0.973 | 0.884 | 0.867 |
| 1233 | 0.907 | 0.757 | 0.610 | 0.450 | 1233 | 1.000 | 1.000 | 0.973 | 0.942 |
| 1273 | 0.922 | 0.811 | 0.701 | 0.728 | 1273 | 1.000 | 1.000 | 0.957 | 0.990 |
| 1313 | 0.950 | 0.919 | 0.807 | 0.710 | 1313 | 1.000 | 1.000 | 1.000 | 1.000 |
| 1353 | 0.979 | 0.837 | 0.899 | 0.826 | 1353 | 1.000 | 1.000 | 1.000 | 1.000 |
Disclaimer/Publisher’s Note: The statements, opinions and data contained in all publications are solely those of the individual author(s) and contributor(s) and not of MDPI and/or the editor(s). MDPI and/or the editor(s) disclaim responsibility for any injury to people or property resulting from any ideas, methods, instructions or products referred to in the content. |
© 2024 by the authors. Licensee MDPI, Basel, Switzerland. This article is an open access article distributed under the terms and conditions of the Creative Commons Attribution (CC BY) license (https://creativecommons.org/licenses/by/4.0/).
Share and Cite
Sun, C.; Qin, Y.; Liu, Y.; Xiao, G.; Zhang, J.; Zhou, J. Research on the Hot Deformation Process of A100 Steel Based on High-Temperature Rheological Behavior and Microstructure. Materials 2024, 17, 991. https://doi.org/10.3390/ma17050991
Sun C, Qin Y, Liu Y, Xiao G, Zhang J, Zhou J. Research on the Hot Deformation Process of A100 Steel Based on High-Temperature Rheological Behavior and Microstructure. Materials. 2024; 17(5):991. https://doi.org/10.3390/ma17050991
Chicago/Turabian StyleSun, Chaoyuan, Yi Qin, Yang Liu, Guiqian Xiao, Jiansheng Zhang, and Jie Zhou. 2024. "Research on the Hot Deformation Process of A100 Steel Based on High-Temperature Rheological Behavior and Microstructure" Materials 17, no. 5: 991. https://doi.org/10.3390/ma17050991
APA StyleSun, C., Qin, Y., Liu, Y., Xiao, G., Zhang, J., & Zhou, J. (2024). Research on the Hot Deformation Process of A100 Steel Based on High-Temperature Rheological Behavior and Microstructure. Materials, 17(5), 991. https://doi.org/10.3390/ma17050991