Article

Evaluation of Microstructure and Abrasive Wear-Resistance of Medium Alloy SiMo Ductile Cast Iron

by
Łukasz Dyrlaga
1,2,*,
Renata Zapała
1,
Krzysztof Morgiel
1,
Andrzej Studnicki
3,
Andrzej Szczęsny
1 and
Dariusz Kopyciński
1
1
Faculty of Foundry Engineering, AGH University, al. Adama Mickiewicza 30, 30-059 Krakow, Poland
2
METALPOL Węgierska Górka, ul. Kolejowa 6, 34-350 Węgierska Górka, Poland
3
Department of Foundry Engineering, Silesian University of Technology, ul. Towarowa 7, 44-100 Gliwice, Poland
*
Author to whom correspondence should be addressed.
Materials 2024, 17(5), 1223; https://doi.org/10.3390/ma17051223
Submission received: 30 December 2023 / Revised: 14 February 2024 / Accepted: 24 February 2024 / Published: 6 March 2024

Abstract

:
Medium-alloy ductile iron with a SiMo ferritic matrix has very good heat resistance. The addition of chromium and aluminum also increases this resistance. This article presents the impact of chromium and aluminum on the structure of SiMo cast iron, especially their impact on the deformation of the spherical graphite precipitates and the formation of M6C and M3C2 carbide phases. These carbides are formed in a ferritic matrix or at the grain boundaries, resulting in increased hardness and a drastic reduction in impact strength. The article presents the influence of heat treatment on the material’s microstructure and resistance to abrasive wear. Chromium and aluminum additions can also indirectly reduce the abrasive wear resistance of SiMo cast iron. The presented research shows the possibility of doubling the abrasive wear resistance of SiMo cast iron.

1. Introduction

Medium-alloy ductile iron with a ferritic matrix of the SiMo type is comparable to white high-chromium cast iron in terms of oxidation resistance. The difference is that silicon–molybdenum ductile iron (SiMo) can be used to make complex shapes, e.g., the bodies of various types of turbines and turbine rotors, and exhaust gas collectors in diesel engines [1,2]. It should be noted that SiMo cast iron should have a ferritic matrix to eliminate the pearlite precipitates that occur at the grain boundaries; ferritising annealing is planned [3,4]. The purpose of ferritising annealing is to completely or partially disintegrate the M3C eutectoid carbide. Because this carbide is a thermodynamically unstable component of the structure, it decomposes into ferrite, austenite, and graphite during the long-term annealing of cast iron at high temperatures. The speed of the process depends on the temperature. The precipitation of pearlite at the grain boundaries is an unfavourable phenomenon; heat treatment may be necessary to eliminate the pearlite from the matrix. Perlite reduces the plasticity, which makes SiMo cast iron highly brittle when it is combined with the carbide mesh at the grain boundaries. The high silicon content in this type of cast iron partially neutralises the harmful effect of molybdenum on the structure and properties, increasing the ability to form ferrite in the cast iron. As a result, the plasticity increases. Due to its properties, the silicon means that the amount of carbon in cast iron in foundry practice does not exceed 3% by weight, especially with Si contents that are greater than 4.5% by mass [5,6,7,8].
From an economic point of view, it is advantageous to keep the heating time as short as possible while using the highest permissible value of the treatment temperature. For unalloyed grey cast iron, the temperature range is 760–820 °C (silicon and chromium can increase the Ac1 temperature), and the heating time should be approximately 60 min per 25 mm of wall thickness [4]. In [9], research was carried out to determine the heat-treatment temperature for SiMo iron castings. It is true that the carbides were dissolved at a temperature of 1100 °C; when the castings cooled, however, molybdenum was released again in the form of carbides with a different morphology at the grain boundaries. As a consequence, the plasticity of the material that was produced was much lower than that of the others. The tests showed that the best mechanical properties were obtained when heated at 950 °C and were slightly worse at 800 °C. However, a temperature of 800 °C is more acceptable to casting manufacturers from an economic point of view.
An analysis of the literature on abrasion wear indicated that the research often concerned Fe–C alloys in which the matrix was reinforced with carbides or nitrides or the castings had abrasion-resistant composite zones [10]. Another solution was to produce the primary carbides of vanadium, titanium, and niobium [11] in the entire volume of the molten steel during the metallurgical process, where, in abrasion-resistance tests, a much higher resistance to abrasive wear was achieved as compared to the reference samples.
In [12], it was shown that in the case of SiMo cast iron castings, the hardness and resistance to abrasive wear increase with increasing molybdenum content. The authors emphasise that this is most likely related to the formation of molybdenum carbides at the grain boundaries. In [13], the authors showed that the addition of chromium, vanadium, and nickel to SiMo cast iron improves resistance to abrasive wear. The authors see a beneficial effect of M7C3 alloy carbides and pearlite in SiMo cast iron with alloy additions. The paper presents the issue of the abrasive wear resistance of silicon–molybdenum ductile cast iron enriched with aluminium and chromium at ambient temperatures. This type of cast iron can be used in devices requiring high resistance to high-temperature corrosion. An example of such a casting is turbocharger housings operating in cycles from ambient temperatures to temperatures above 1000 °C. High-temperature corrosion products are deposited on the casting surface [14]. Regeneration of such a casting can be achieved by performing mechanical sandblasting, which is a special case of micro-cutting.
As an addition to cast iron, chromium increases its resistance to high temperatures [14,15,16,17,18]. As a component of nickel–chromium cast iron at an amount of up to 2%, it also has a positive effect on the hardness [19]. Chromium enhances the tendency of cast iron to metastable crystallisation with precipitation carbides, which may make it necessary to produce cast iron with an addition of aluminium. In high-chromium cast iron, the chromium forms M7C3 carbides, which results in this type of cast iron having good resistance to abrasive wear [20,21]. The addition of this element to SiMo cast iron can also cause chromium carbides to appear in the structure, improving its abrasion resistance [22].
Aluminium improves the graphitisation of cast iron [22,23,24]. With an aluminium content of 3.2–3.8%, the structure is ferritic [25]. The high silicon content raises the eutectoid transformation A1 temperature to approximately 900 °C. Molybdenum forms a carbide phase at the grain boundaries. The carbide mesh improves the dimensional stability and, above all, increases the tensile strength and creep resistance [26,27].
Molybdenum increases the temperatures of the phase transformations and increases their ranges [28,29]. In addition to the previously mentioned formation of carbides at the grain boundary in SiMo cast iron, other components can also segregate (such as magnesium [29,30]), creating phases that reduce the mechanical properties, that, when in combination with molybdenum carbides, will be unfavourable for castings that are made of this type of cast iron.
The purpose of the research was to determine the influence of the content of aluminum, chromium, and molybdenum in SiMo cast iron on the resistance to abrasive wear.

2. Research Methodology

The melts of ductile silicon–molybdenum cast iron that were used for the tests were carried out in the Experimental Foundry at the Faculty of Foundry of AGH University of Science and Technology in Krakow. The melts were made in a medium-frequency induction furnace with a crucible capacity of 15 kg. The chemical composition of the metal charge that was used during the melting is listed in Table 1. The molten metal was superheated to a temperature of 1550 °C and held at this temperature for 3 min. After this time, the process of spheroidising the cast iron was carried out using the bell method.
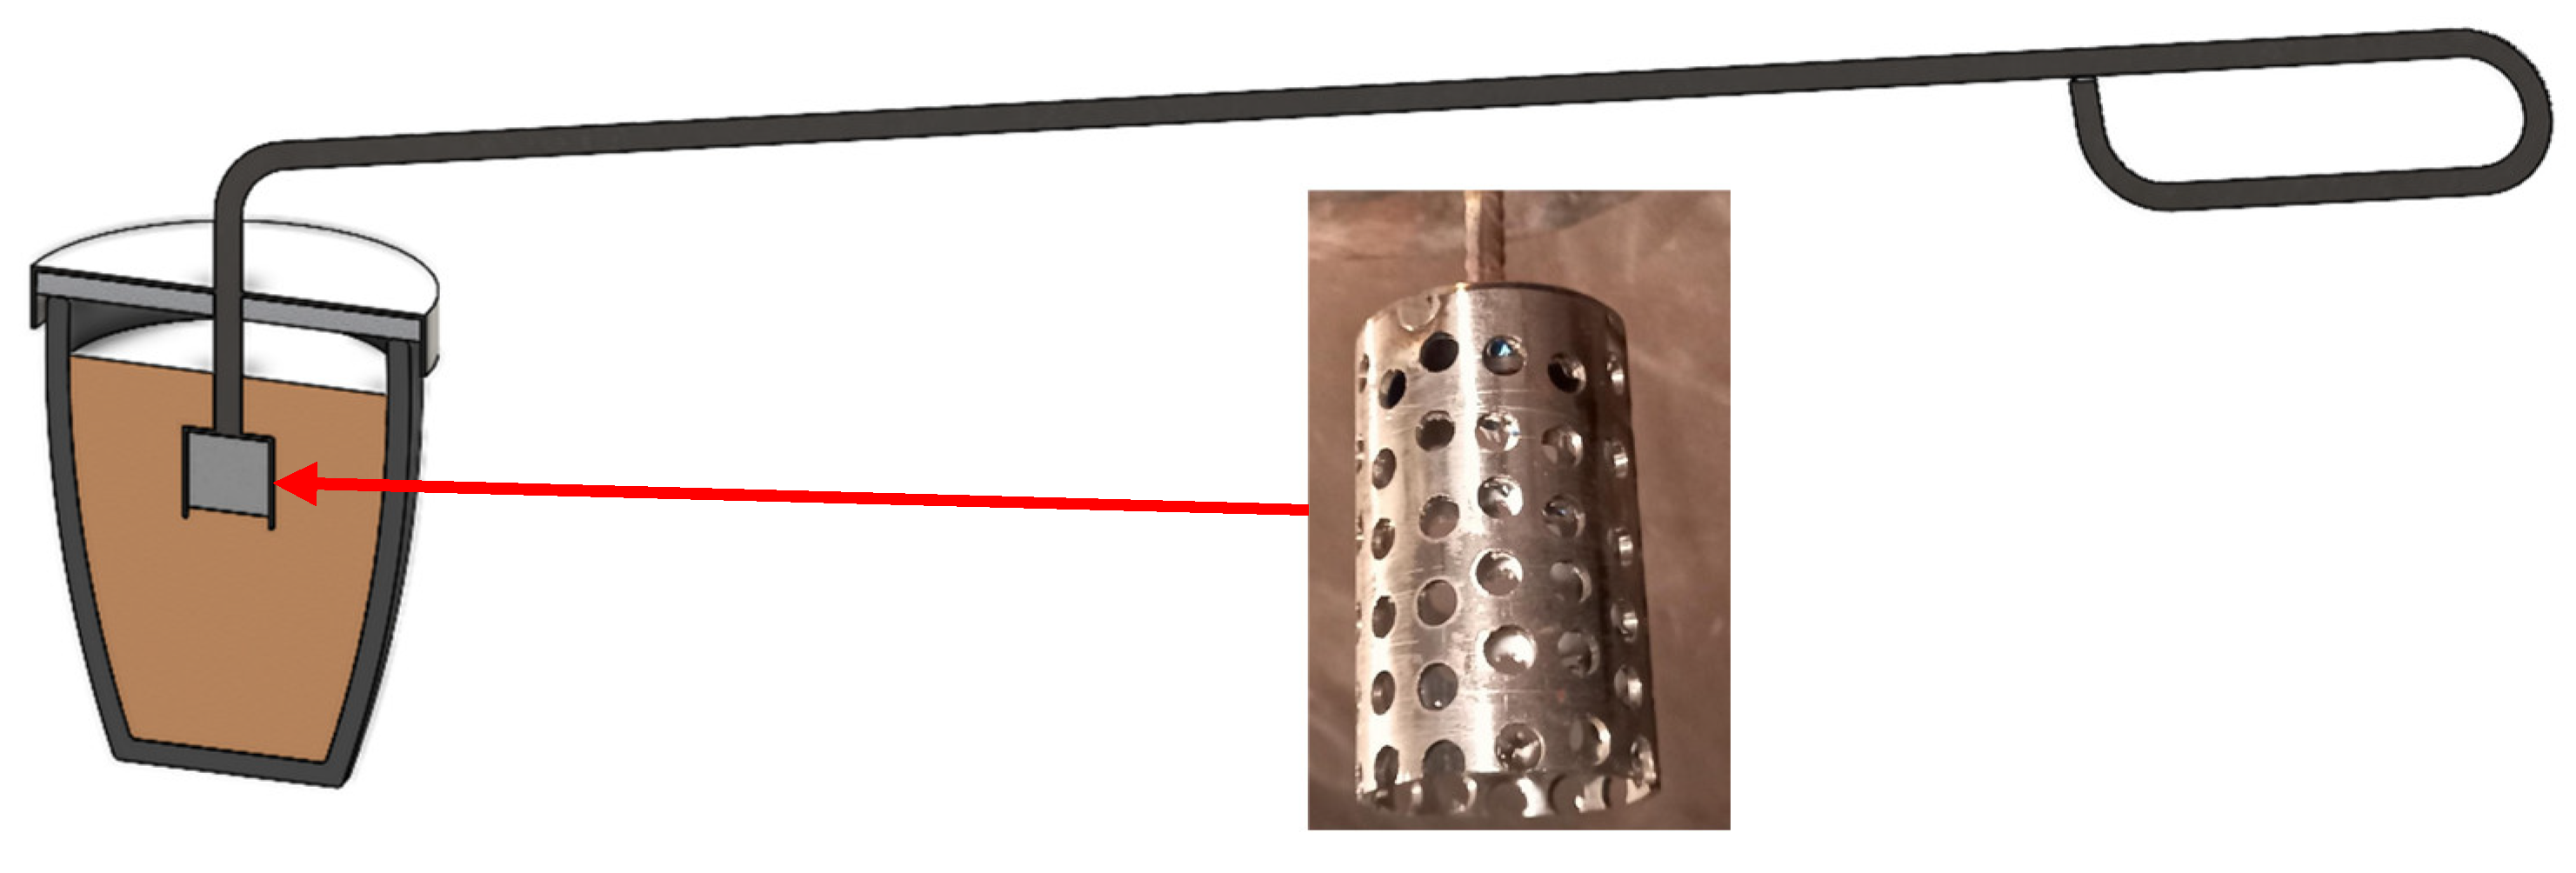
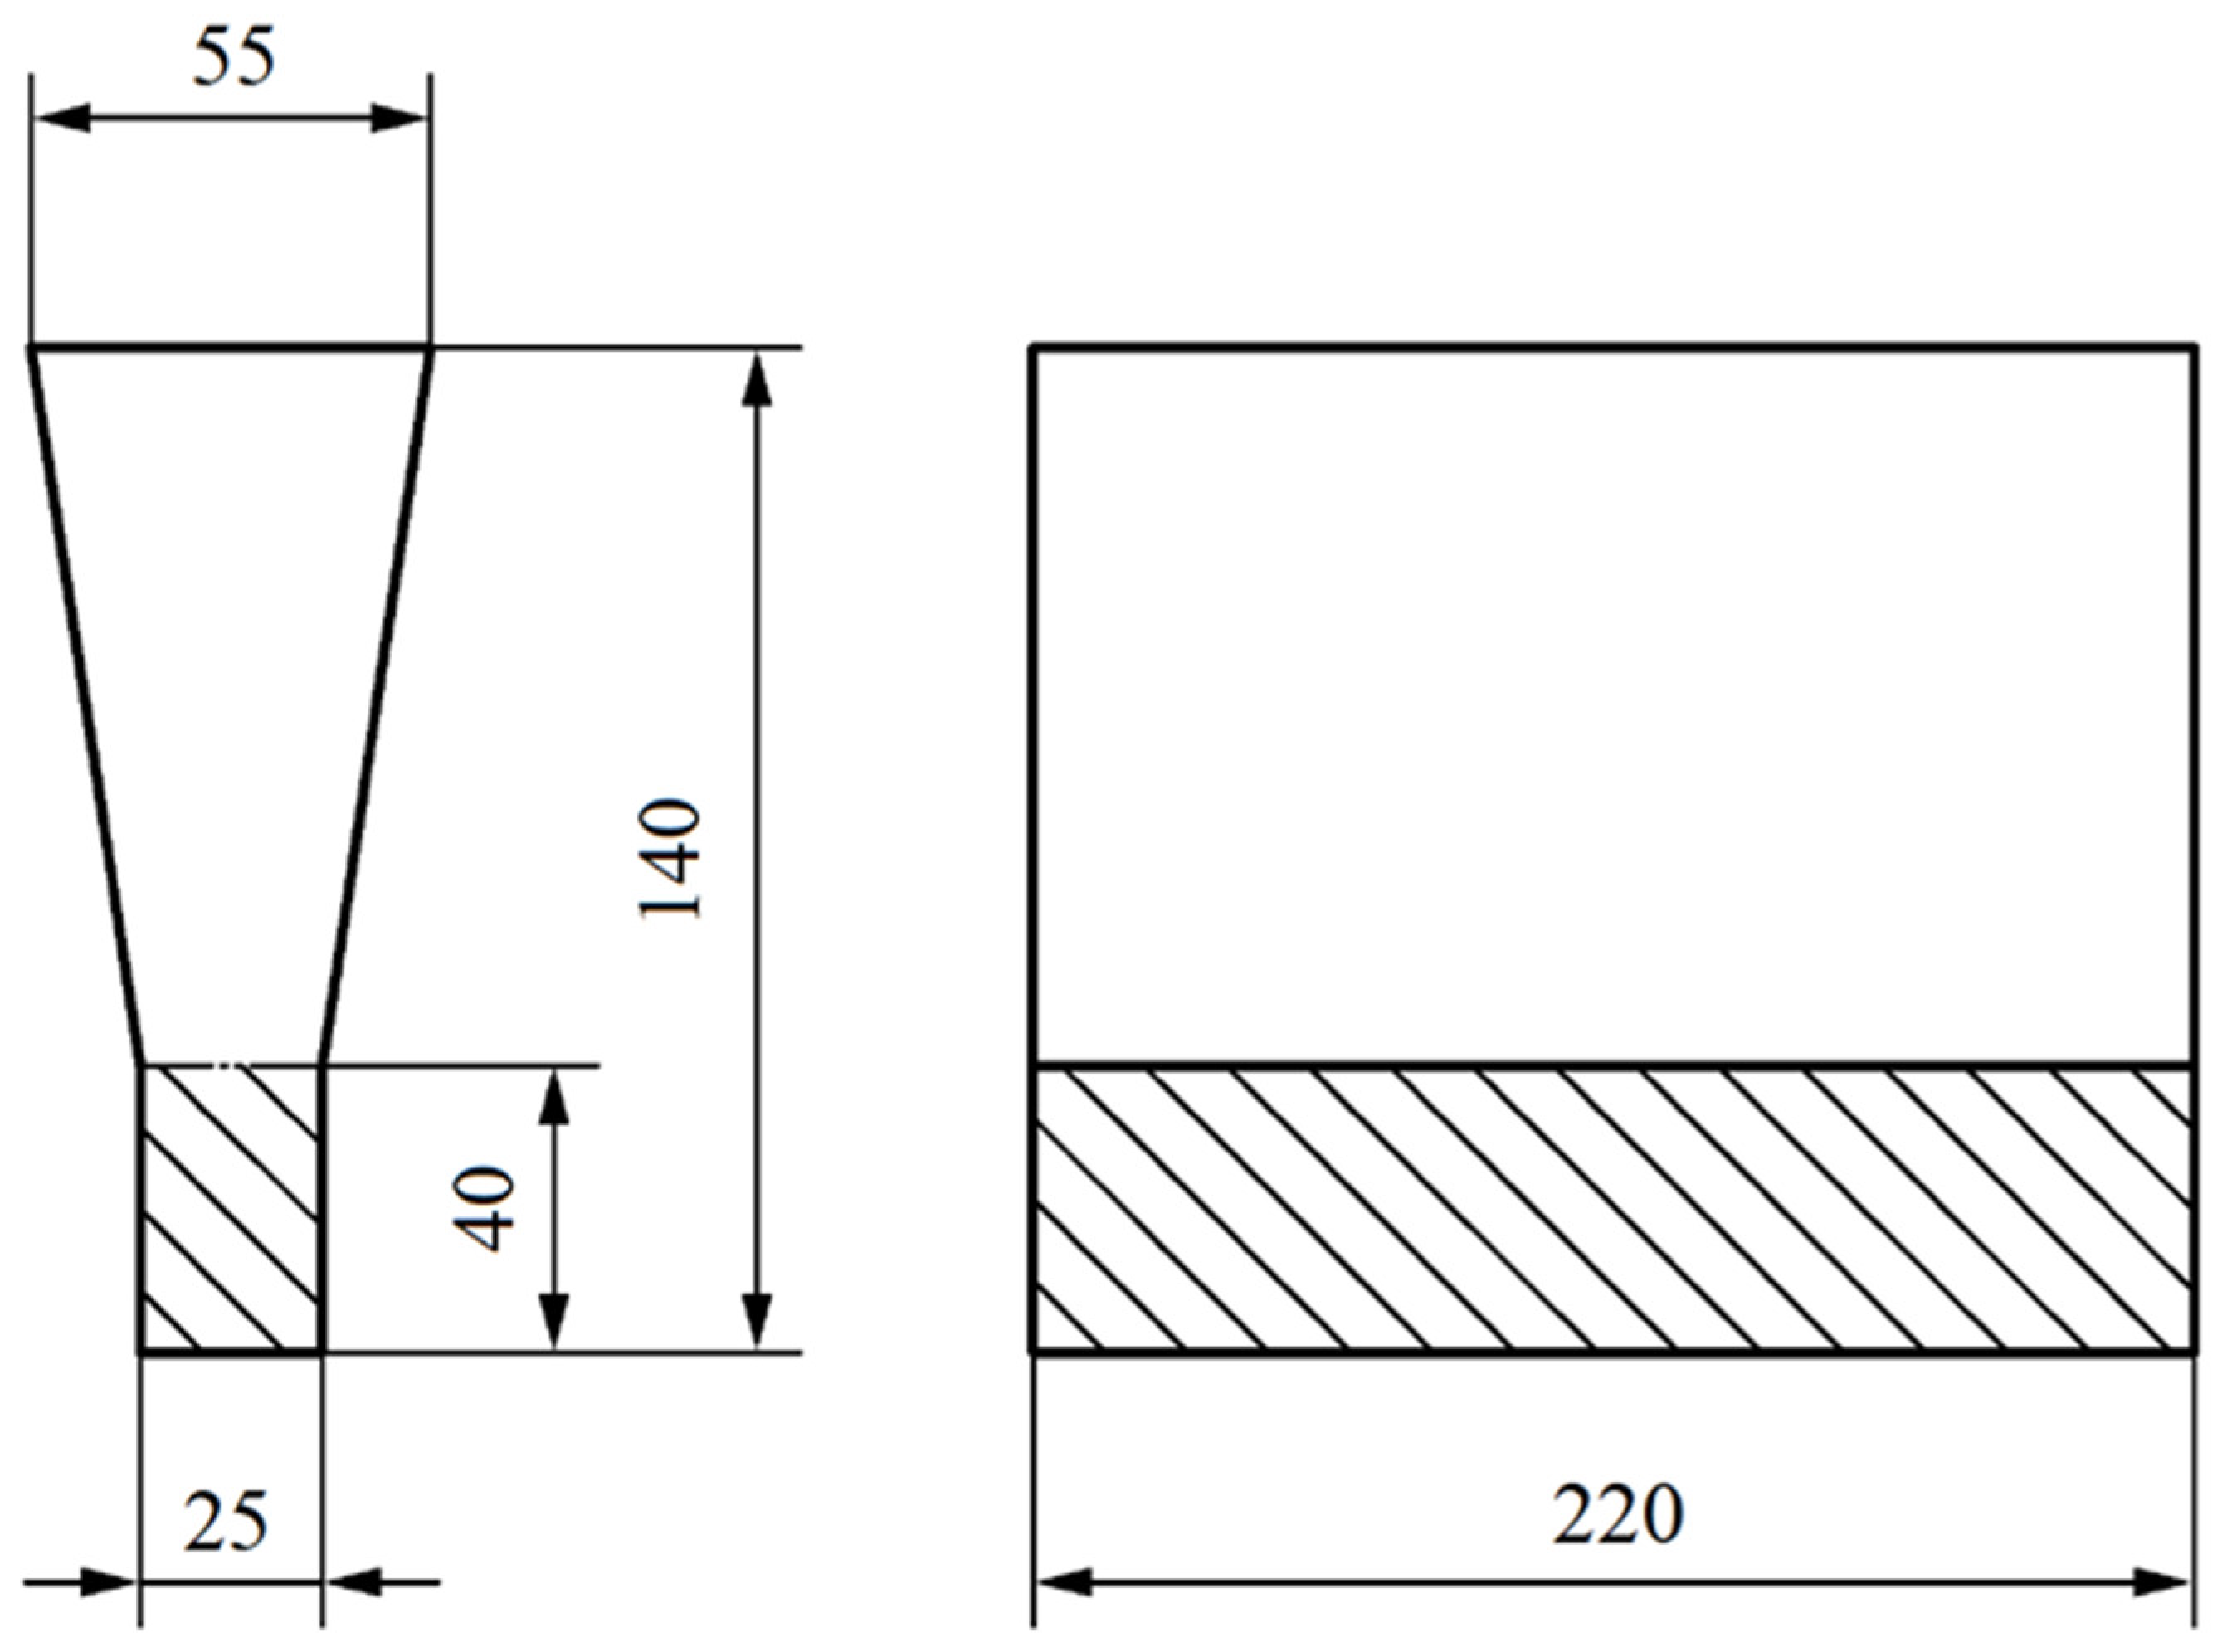
In this method, a steel container (bell) filled with a nodulant is introduced into the crucible with the molten metal on a special arm. A schematic diagram of the container (bell) that was used in this method is shown in Figure 1. For the nodularisation treatment, FeSiMg that contained 6.5% Mg was used in an amount that allowed for a magnesium content in the cast iron within a range of 0.03 ÷ 0.04%. Then, an inoculation was performed using an Elkem Zircinoc inoculant in an amount of 0.2% by mass. The composition of the inoculant is provided in Table 2. The nodularisation process lasted 5 min. The molten metal prepared this way was poured into moulds that were made of bentonite mass, reproducing the experimental castings of a Type-2 “Y” ingot with a wall thickness of 25 mm. The cast of sample Y is shown in Figure 2.
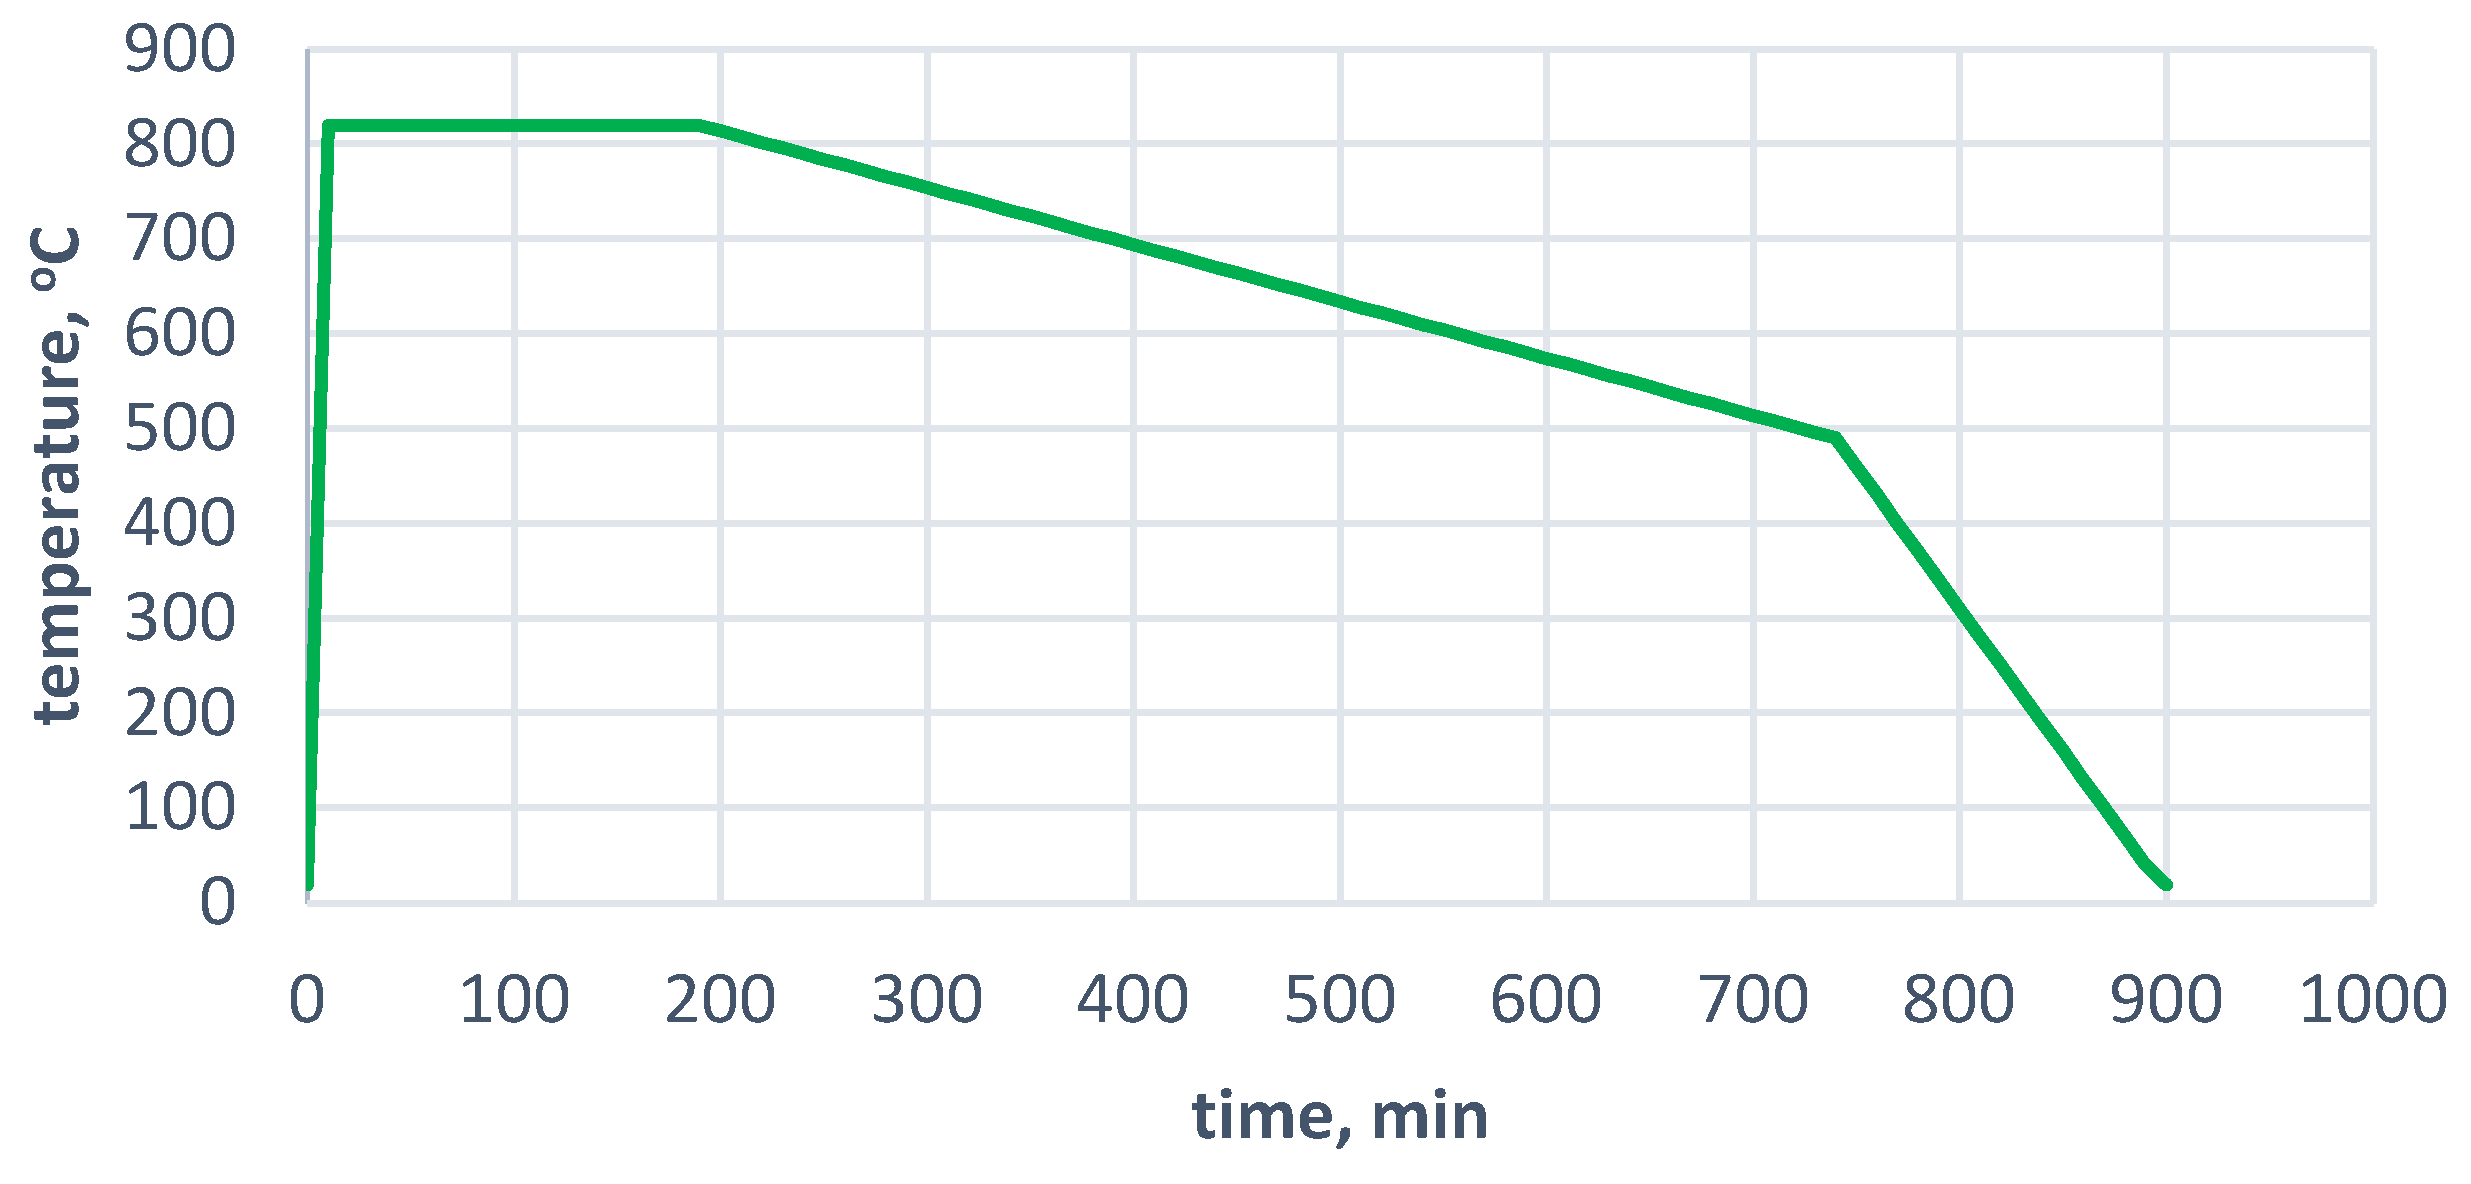
The material that was obtained from the Y ingots was heat-treated to remove the pearlite from the matrix and attempt to dissolve the carbides that were located at the grain boundaries. For this purpose, the material was placed in a furnace at 820 °C and annealed for 3 h, followed by cooling in the furnace to an ambient temperature. A diagram of the heat-treatment process is shown in Figure 3.
Samples for testing microstructure, hardness, and abrasion resistance were cut from the casting shown in Figure 3. A chemical analysis of the cast iron samples from the test ingots was performed using a BRUKER TASMAN Q4 spectrometer that was manufactured at the Upper Silesian Institute of Technology of the Łukasiewicz Research Network. in Gliwice. The chemical composition of the tested cast iron is presented in Table 3.
Calculations of the crystallisation temperatures of the individual phases for the cast iron with a specific chemical composition were performed using the Thermo-Calc, program version 2019a (based on the CALPHAD method).
The microscope observations were made on a Leica MEF4M optical microscope, (Leica Microsystems, Wetzlar, Germany) using the Leica Q Win program (Version 6).
Along with the chemical composition analysis, the SEM microstructure and phase composition analysis in the structure of the investigated cast iron were performed on a JEOL 500LV scanning microscope (JEOL Ltd., Tokyo, Japan) with an X-ray microanalysis (EDS) attachment.
Microanalysis investigations were performed with a probe-corrected Themis (200 kV) field emission gun (FEG) transmission electron microscope (TEM) that was equipped with a windowless four-quadrant Super-X detector of the integrated energy dispersive spectroscopy (EDS) system manufactured by the Thermo Fisher company, Waltham, MA, USA. The maps that presented the local chemical composition were built of 500 × 500 pixels (acquired with a 0.5 nm electron probe) using ‘net counts’; this helped to minimise the overlap of the neighbouring lines. Thin foils for these investigations were prepared with the focused ion beam (FIB) method using a Scios dual-beam (e−/Ga+) scanning micro, scope (also manufactured by Thermo Fisher).
Samples for EDS testing were prepared so that the analysis surface covered the grain boundaries with carbides located there.
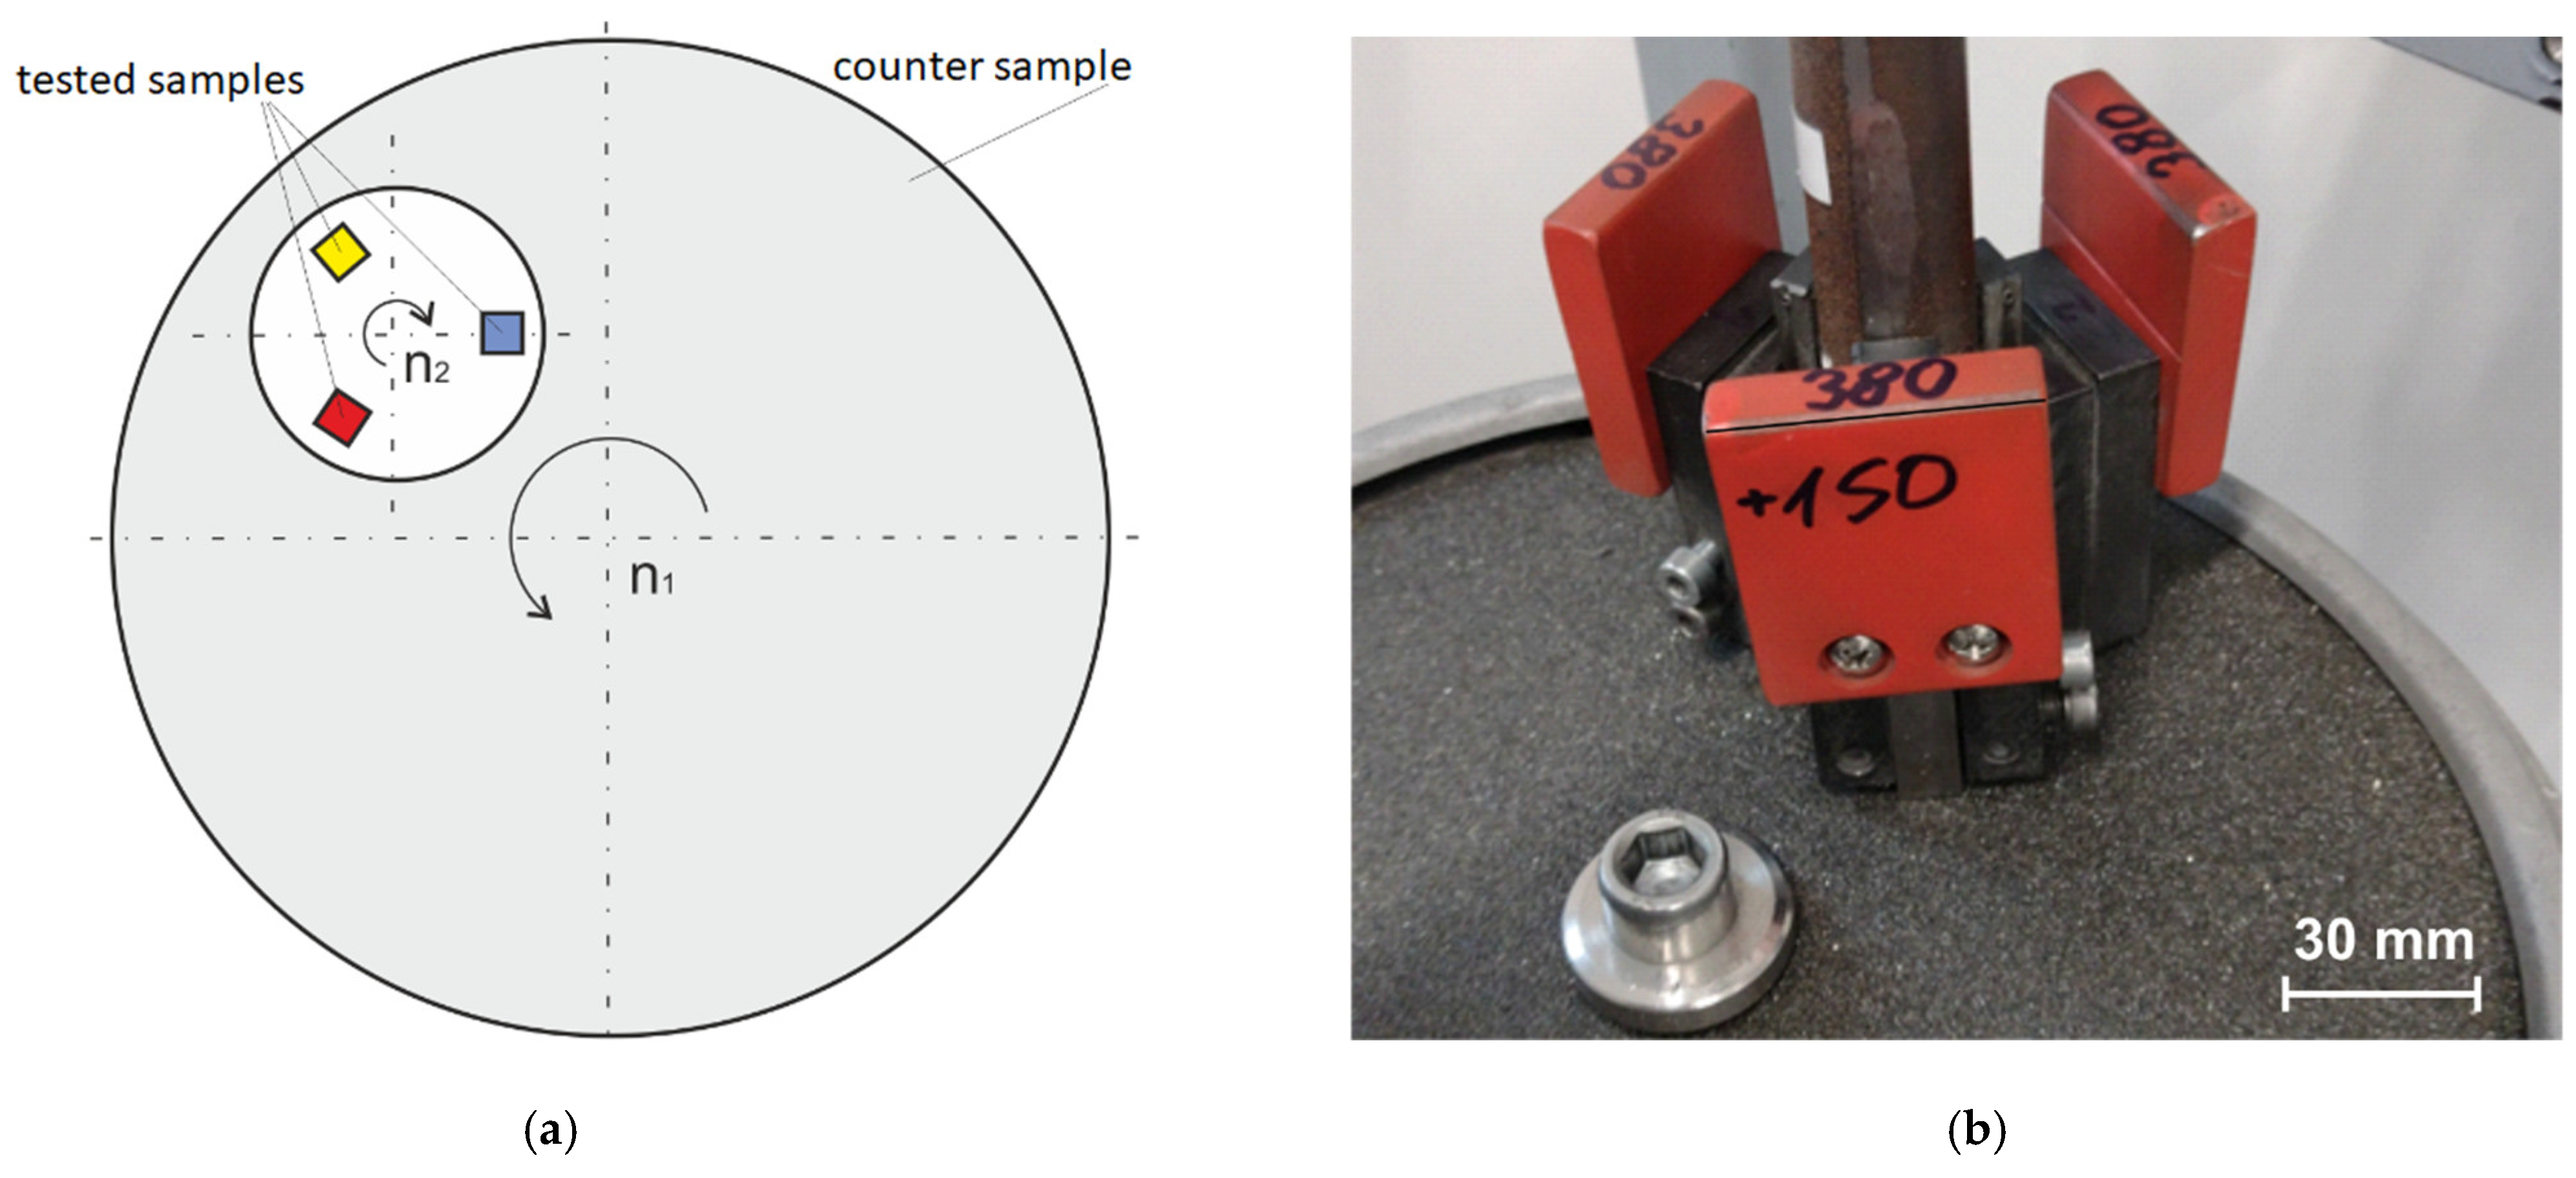
The Vickers hardness measurement was performed using an SBRV-100D hardness tester (Guizhou Sunpoc Tech Industry Co., Ltd., Guiyang City, China). The tribotester 3-POD stand that was developed at the Department of Foundry of the Silesian University of Technology was used to test the abrasive wear. This station was largely modelled on the solutions of stations that are classified as pin-on-disc wear-testing methods in which a tested rod-shaped sample (e.g., a square or circular cross section) is pressed with a given force P to a rotating disc that constitutes the counter sample, which causes the abrasive wear of the tested samples [31,32].
The mechanism of abrasive wear that occurs on the Tribotester 3-POD abrasive wear test stand used in this work can be described by three processes: microcutting, grooving, and scratching [15,33].
Such processes occur when, in the friction areas of interacting elements, there are loose or fixed abrasive particles or protruding irregularities of a harder material that act as microblades. The counter-sample in the research device used is sandpaper with hard-fixed silicon carbide (SiC) abrasive grains, causing intense abrasive wear mainly by the micro-cutting mechanism.
The device can test three samples simultaneously. The samples were divided into two sets: Set 1—Samples 0 and B; and Set 2—Samples A, C, and D. The samples were mounted in a special rotating holder that allowed for the individual pressure of each sample to be transferred to the abrasive disc by the use of linear guides. The abrasive disc was a sandpaper disc with a specific gradation (grain) and type of abrasive grain. A new abrasive disc was used for each set of samples, and the number of abrasion stages was determined within the established total abrasion path. After each stage, the samples were weighed.
The direction of the rotation of the abrasive disc was opposite to the direction of the rotation of the sample holder. The rotational speed of the abrasive disc (counter sample) was 92.0 rpm, and the rotational speed of the test sample holder was 87.5 rpm. The abrasion path was determined by the number of revolutions of the abrasive disc. Sample clamping force P resulted from the sum of the weight of the moving part of the test sample holder, the attached weight, and the weight of the test sample. Figure 4 shows a diagram (a) and a photo of the working part of the device (b)
The operating parameters of the 3-POD tribotester in the conducted tests were as follows:
  • Counter sample (abrasive disc): sandpaper with SiC grains (80 grit);
  • Test samples with nominal dimensions of 10 × 10 × 30 mm;
  • Single sample load: 230, 300, and 380 G;
  • Total abrasion distance on new sandpaper: 3000 m;
  • Three stages of abrasion: Stage I—500 m; Stage II—1000 m, Stage III—1500 m (weighing after each stage);
  • Dry abrasion.

3. Test Results and Analysis

Modelling of Thermodynamic Parameters of Tested Cast Iron Using Thermo-Calc Program

Calculations were made using ThermoCalc to check which carbides and phases could be separated during crystallisation.
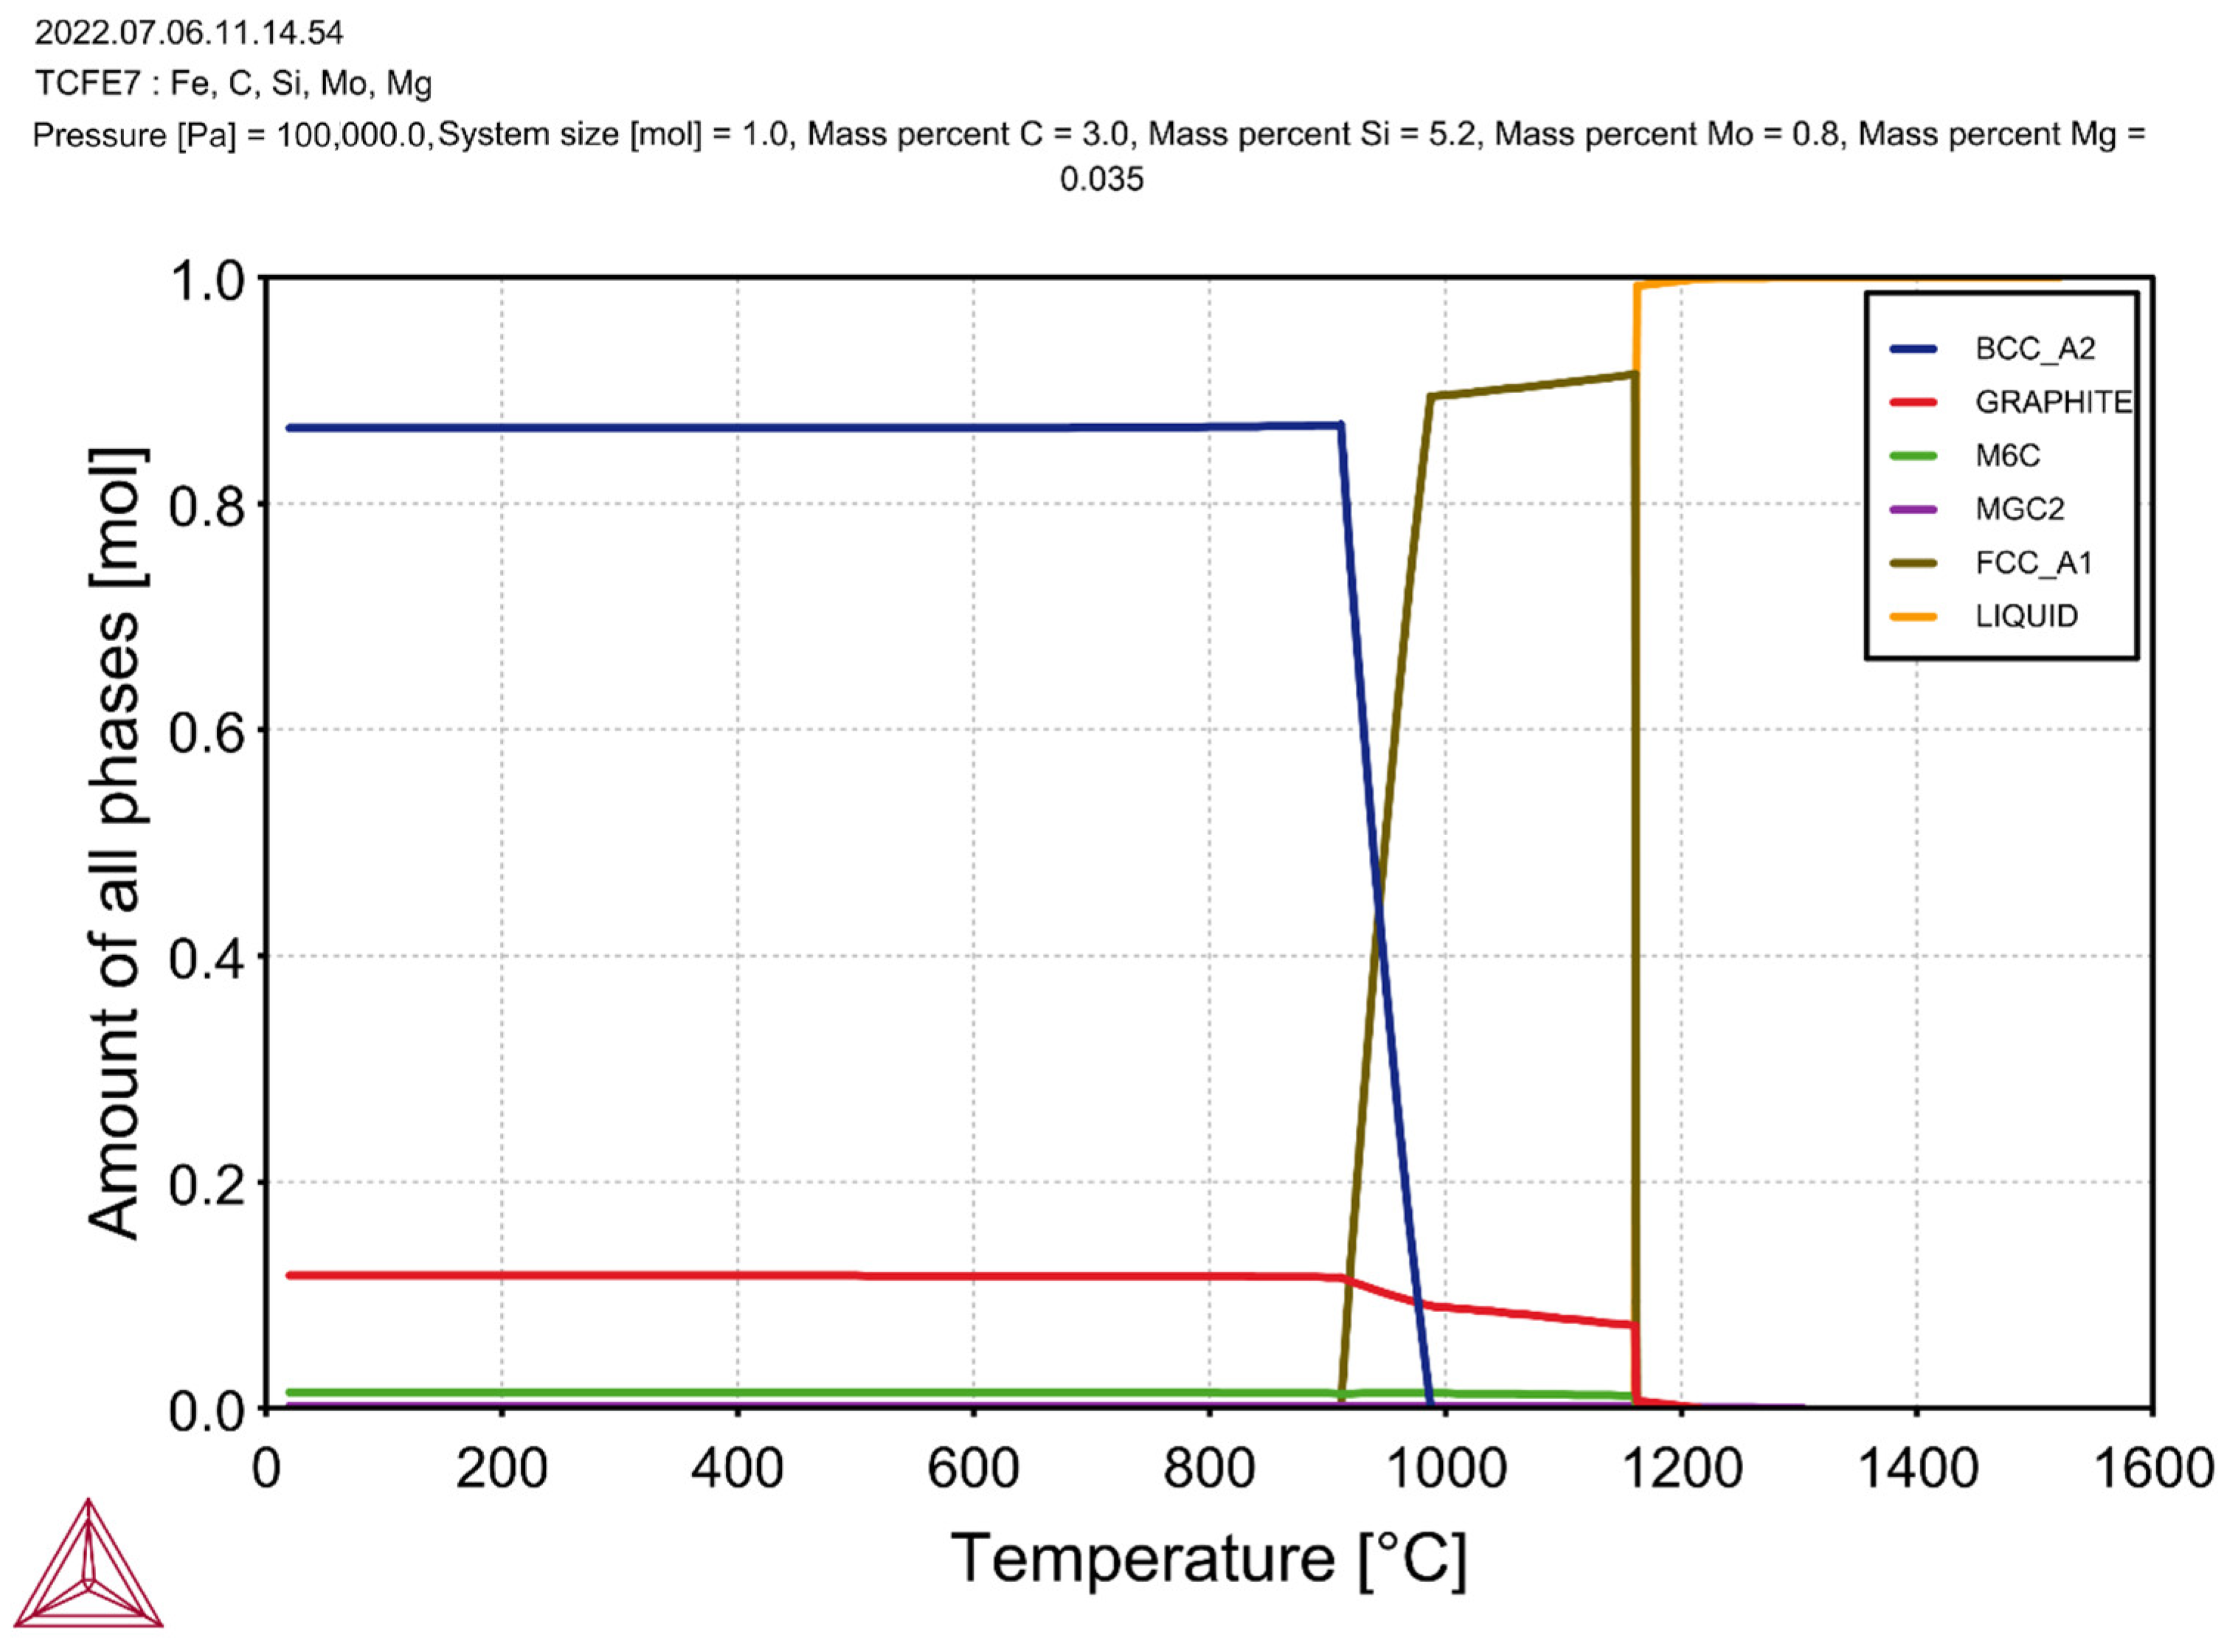
Figure 5 shows the results of the thermodynamic calculations for the tested SiMo cast iron that contained 5.2% Si and 3% C.
It can be seen that, during the crystallisation of the cast iron, M6C carbide was released and stable at room temperature. In the case of the cast iron without the additions of Cr and Al (Figure 5), the first phase that crystallised from the molten metal at a temperature of 1210 °C was the graphite. This proved the hypereutectic nature of the alloy. The austenite appeared at a temperature of 1162 °C, while the M6C carbide phase appeared at 1160 °C (almost simultaneously with the austenite). The beginning of the eutectoid transformation was at a temperature of 980 °C; below a temperature of 920 °C, there was no more austenite in the cast iron. The simulation results for the cast iron with the same carbon and silicon contents yet with the addition of 1% Cr and 2% Al are shown in Figure 6.
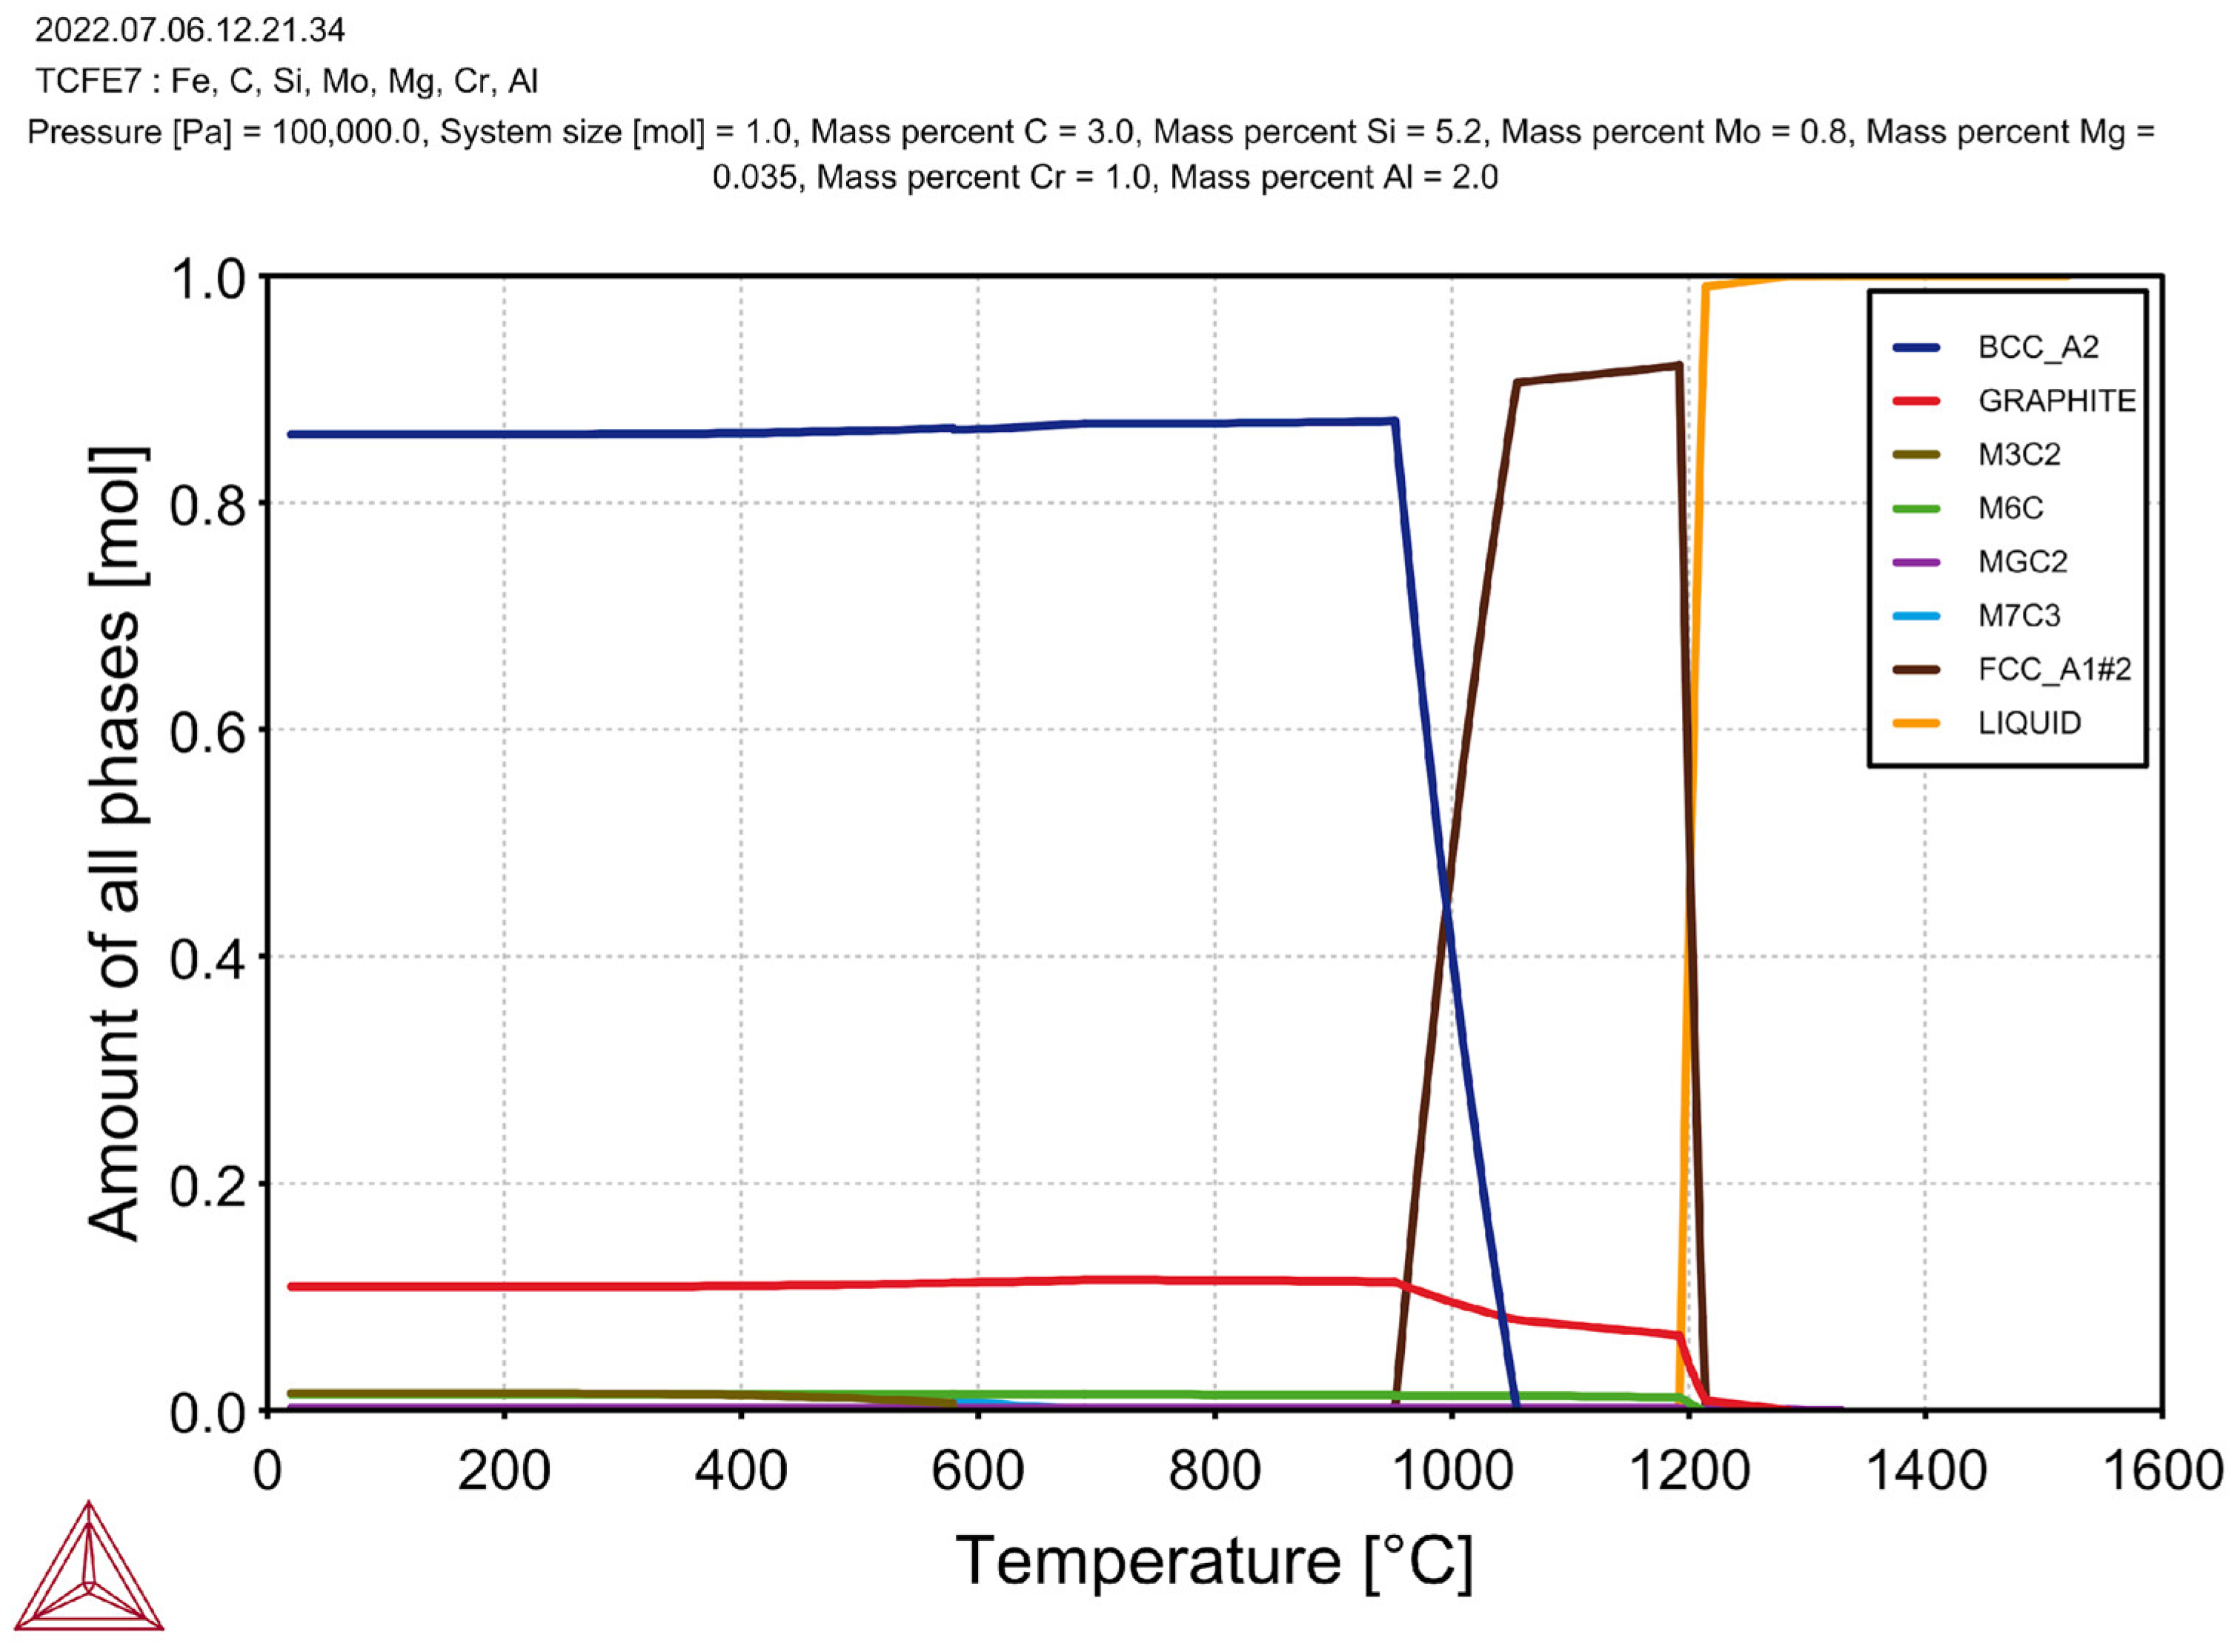
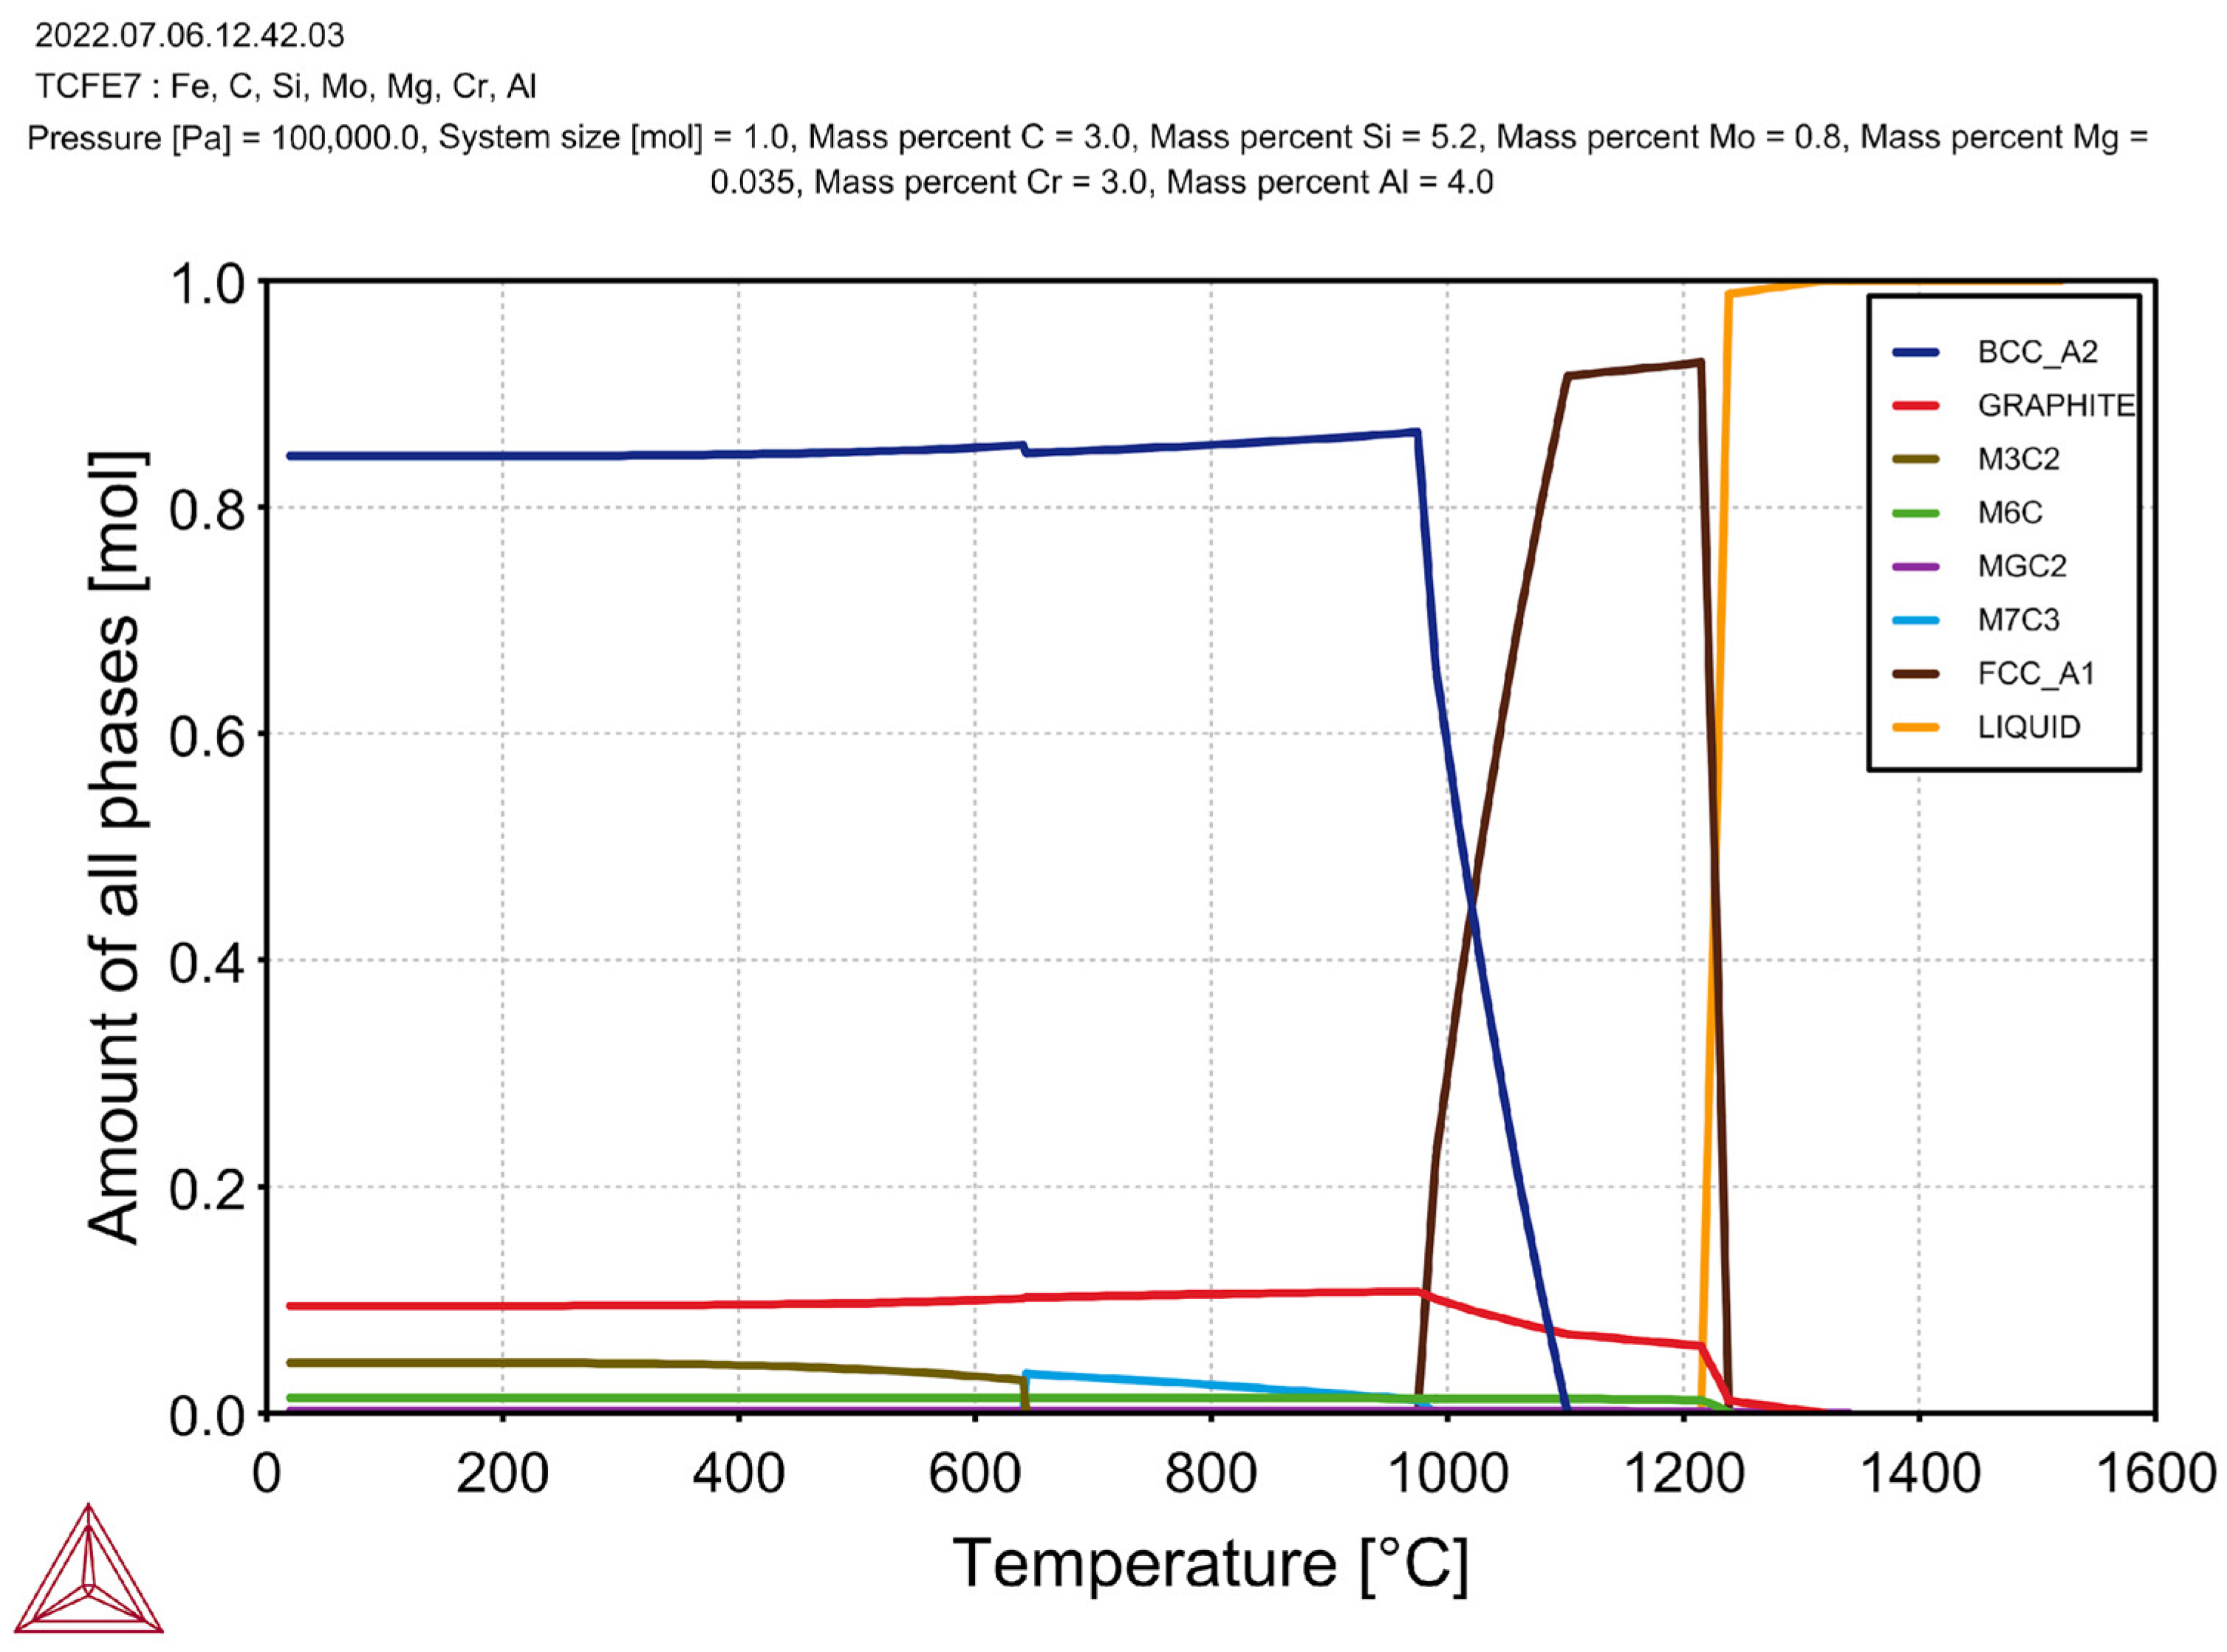
In addition to the M6C carbide, the M3C2 carbide also crystallised in the case of this alloy (which was also stable at room temperature). After adding 1% Cr and 2% Al, the first phase to crystallise at 1280 °C was the graphite. The beginning of the austenite formation occurred at a temperature of 1212 °C; this indicated a significant increase in the liquidus temperature as compared to the previous sample that was discussed above. The M6C carbide crystallised at 1210 °C (i.e., its formation temperature was close to the formation temperature of the austenite). The M7C3 carbide was formed at a temperature of 690 °C, but it disappeared at 579 °C (the M3C2 carbide was formed in its place). The beginning temperature of the eutectoid transformation was 1050 °C, and its ending temperature was 960 °C. After increasing the amount of the Cr to 3% and the Al to 4% (Figure 7), no additional phase crystallisations could be observed in the cast iron (but the amounts of the M6C and M3C2 carbides increased).
The SiMo cast iron with the addition of 3% Cr and 4% Al was characterised by even higher crystallisation temperatures of the individual alloy phases. In this case, the graphite was also the first to crystallise (at a temperature of 1310 °C). The beginning of the eutectic crystallisation occurred at a temperature of 1230 °C, but the first M6C carbides crystallised earlier (at a temperature of 1240 °C). The M7C3 carbides appeared at 990 °C; below 640 °C, the M3C2 carbides appeared instead. The starting temperature of the eutectoid transformation was 1100 °C, and its ending temperature was 980 °C. Table 4 shows the chemical compositions of the carbide phases, as calculated by the Thermo-Calc programme.

4. Microstructures of Tested Cast Iron

4.1. Sample 0 (Reference)

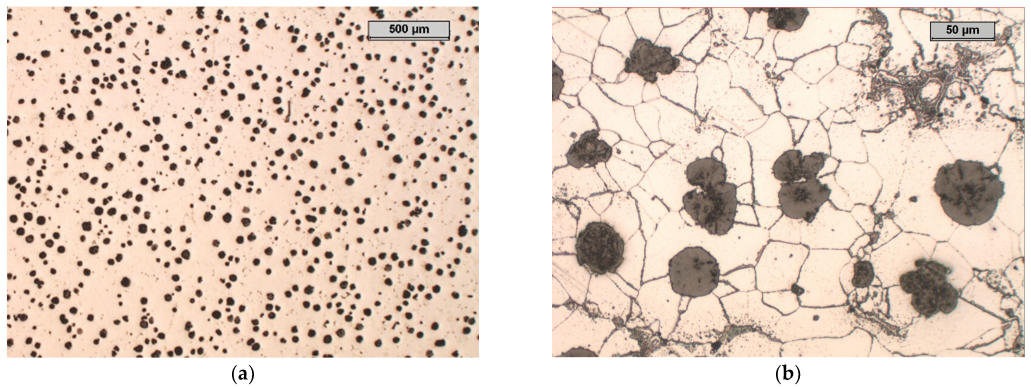
The reference sample for testing the microstructure, hardness, and resistance to abrasive wear was made of EN-GJS-500-7-grade cast iron, according to the EN-1563:2018 standard [34]. The structure of the cast iron is shown in Figure 8. The structure was characterised by spheroidal graphite (approx. 90% of all of the graphite precipitates), which was evenly distributed throughout the volume of the cast iron, and a small amount of degenerate graphite. The matrix of this type of cast iron was ferritic and pearlitic, with the amount of ferrite being approximately 60% and the pearlite about 40%. It should be noted that GJS-500-7 cast iron does not contain elements such as Cr or Al in quantities that would lead to the degeneration of the spheroidal graphite precipitates.

4.2. Sample A

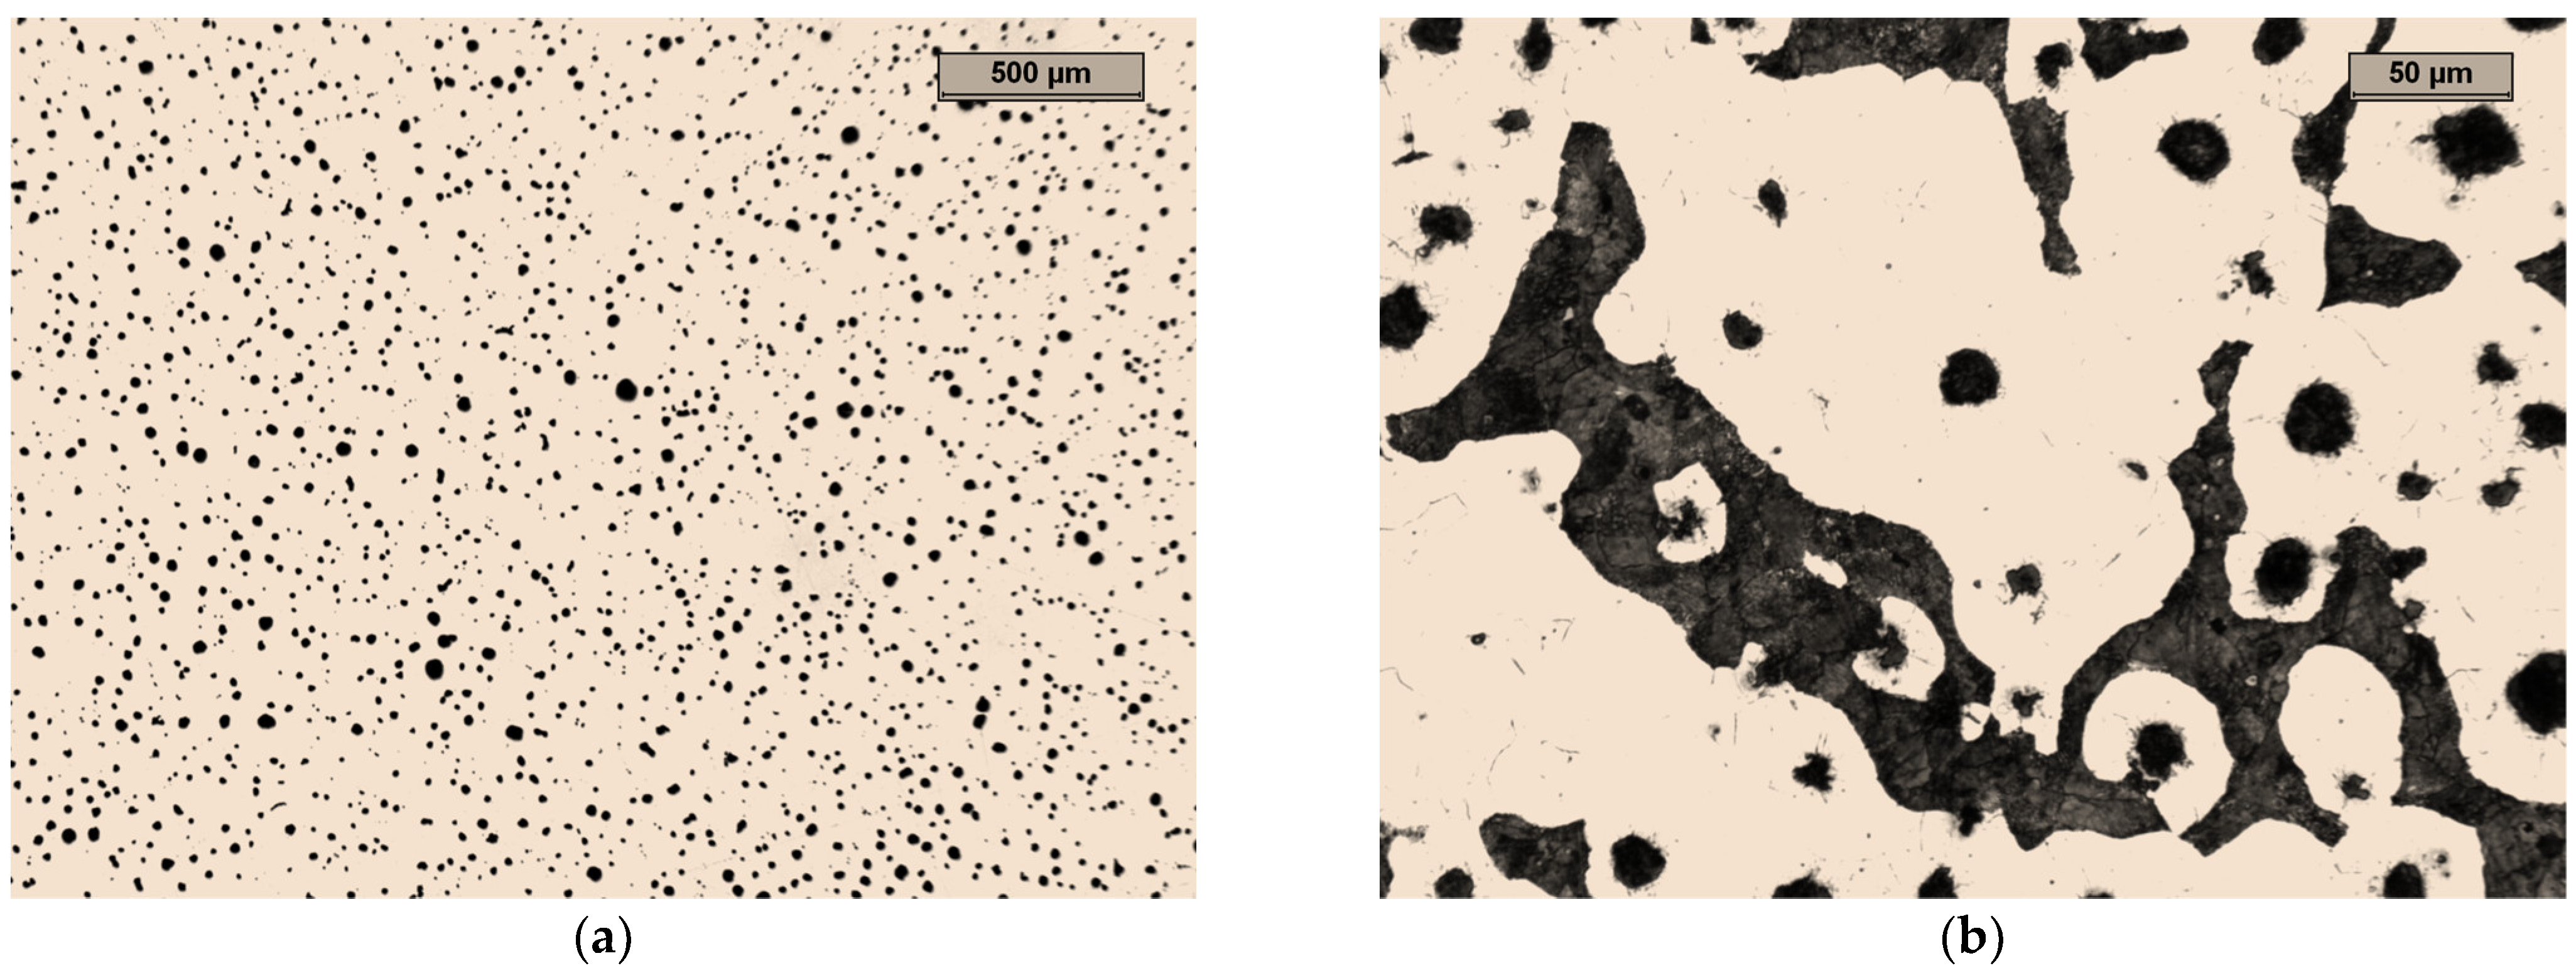
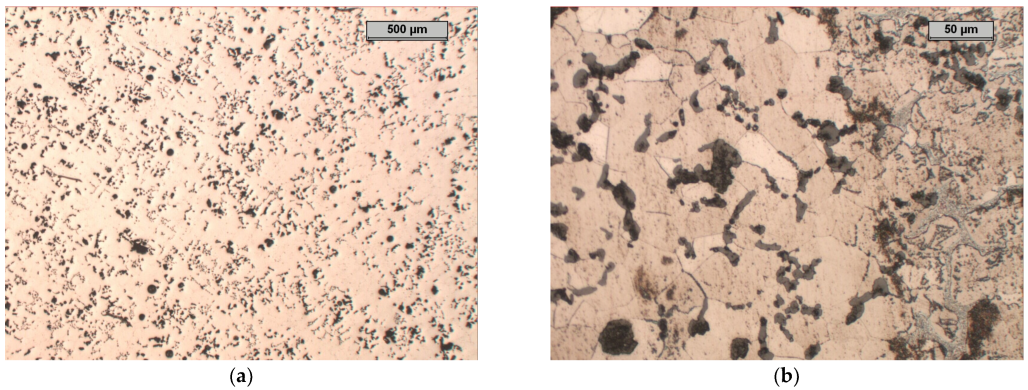
In the microstructure of the unetched specimen that is shown in Figure 9a, it can be seen that most of the graphite precipitates were in the form of spheres. The graphite was evenly distributed. About 20 to 25% of the graphite precipitates were degenerate. Some graphite precipitates in the form of interconnected balls indicate the low degree of mixing of the inoculant.
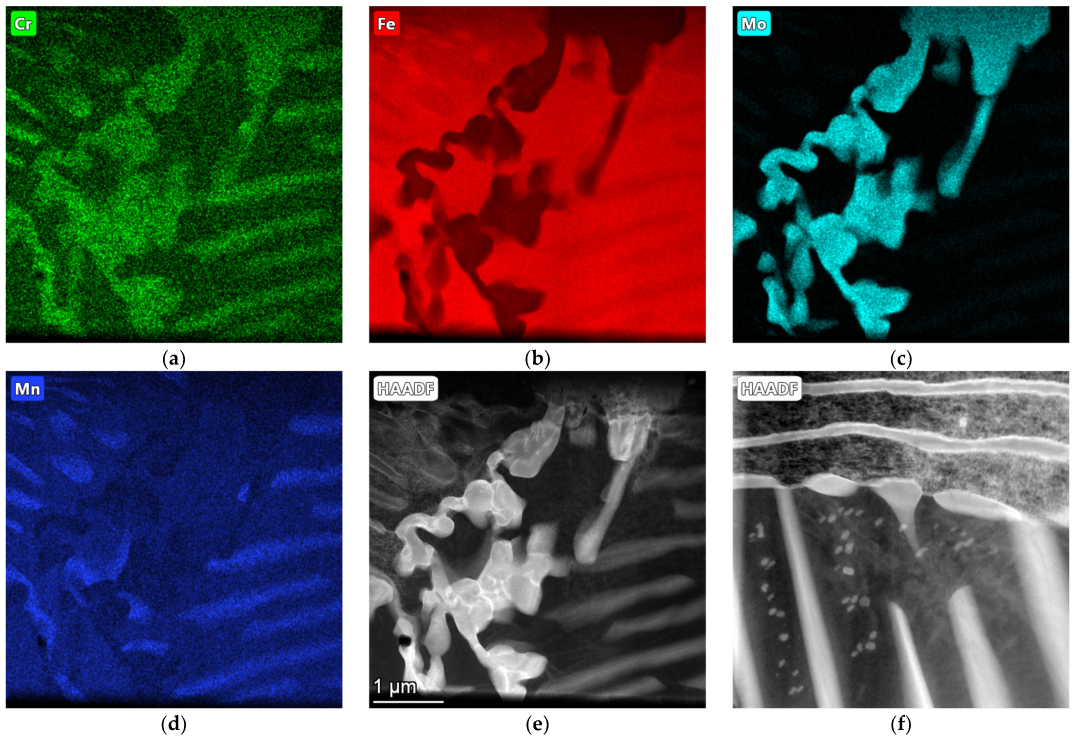
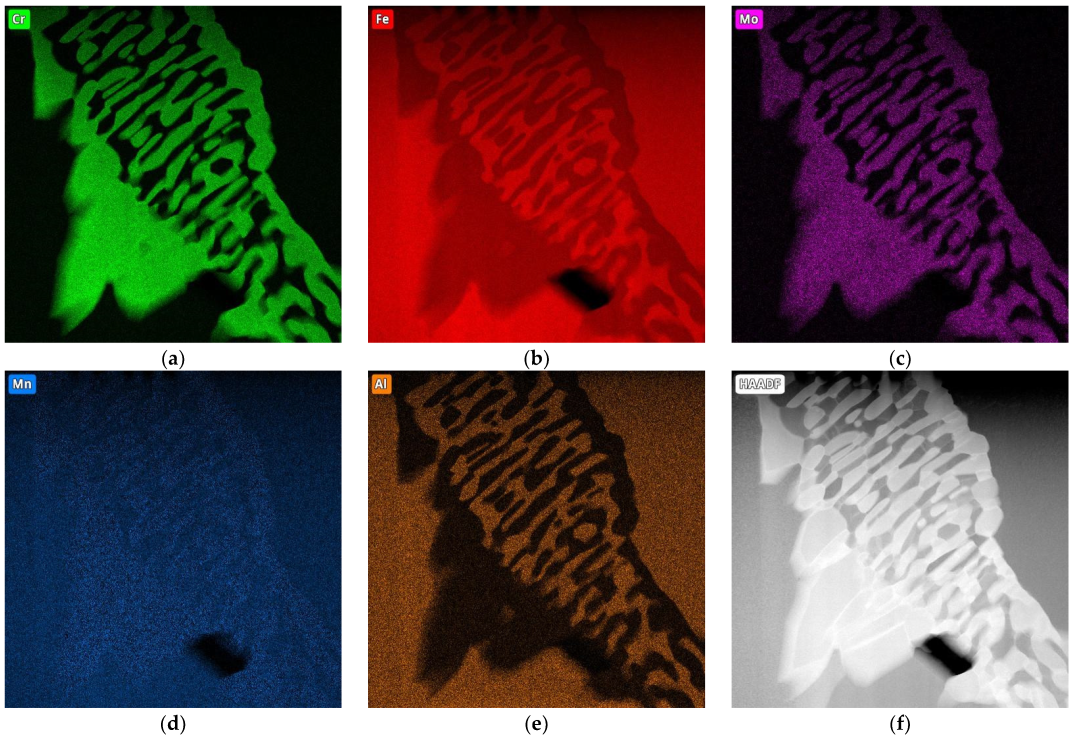
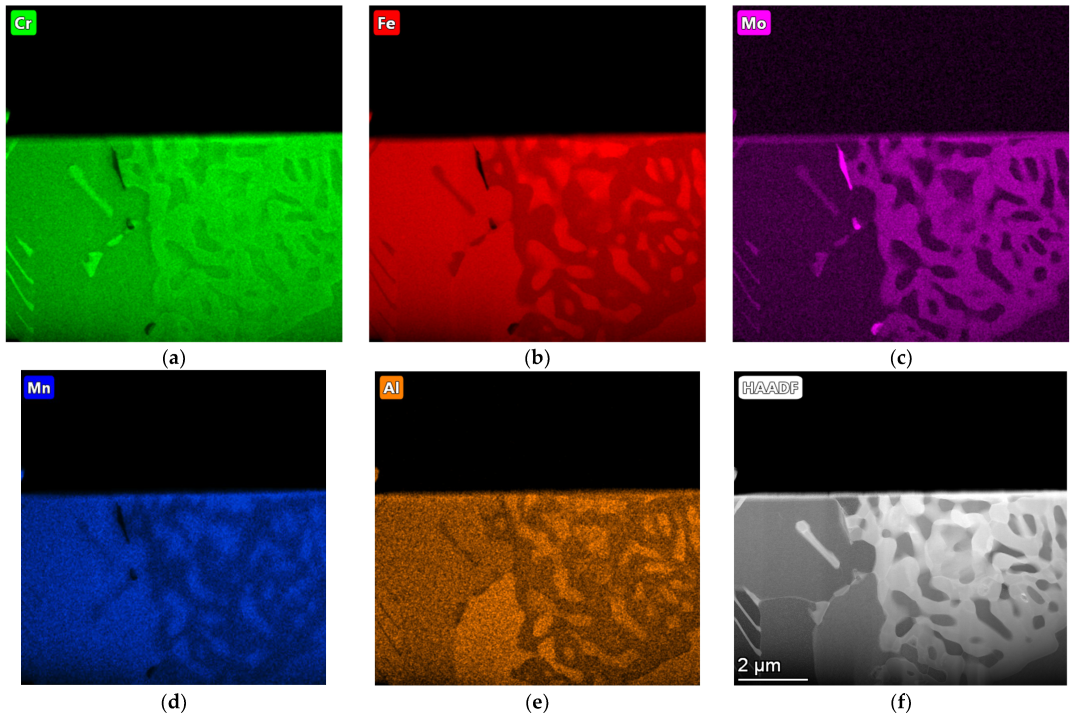
The microstructure of the etched specimen that is shown in Figure 9b shows a matrix that consisted of ferrite. Alloy carbides that contained molybdenum were visible at the grain boundaries; these were M6C carbides that were stable during the heat treatment. The distributions of the most important elements in the individual phases of the structure are shown in the EDS maps in Figure 10. It can be seen that the small amounts of chromium, manganese, silicon, and iron that were contained in Sample A were present in both the matrix and the carbide precipitates. The molybdenum was concentrated exclusively in the carbide precipitates.

4.3. Sample B

In the microstructure of Sample B, it can be seen that approximately 50% of the graphite precipitates were spheroidal graphite (Figure 11). The remaining 50% of the degenerated precipitates took the form of very fine graphite precipitates of various shapes. There were noticeable areas where the graphite was much larger than that in the rest of the structure; this was most likely the effect of the increased aluminium concentration, which led to the phenomenon of increased graphitisation in these areas of the molten metal. One can also notice the precipitation of the exploded graphite, which was related to the too-high magnesium content in the cast iron and the degenerative effect of the aluminium on the precipitation of the nodular graphite.
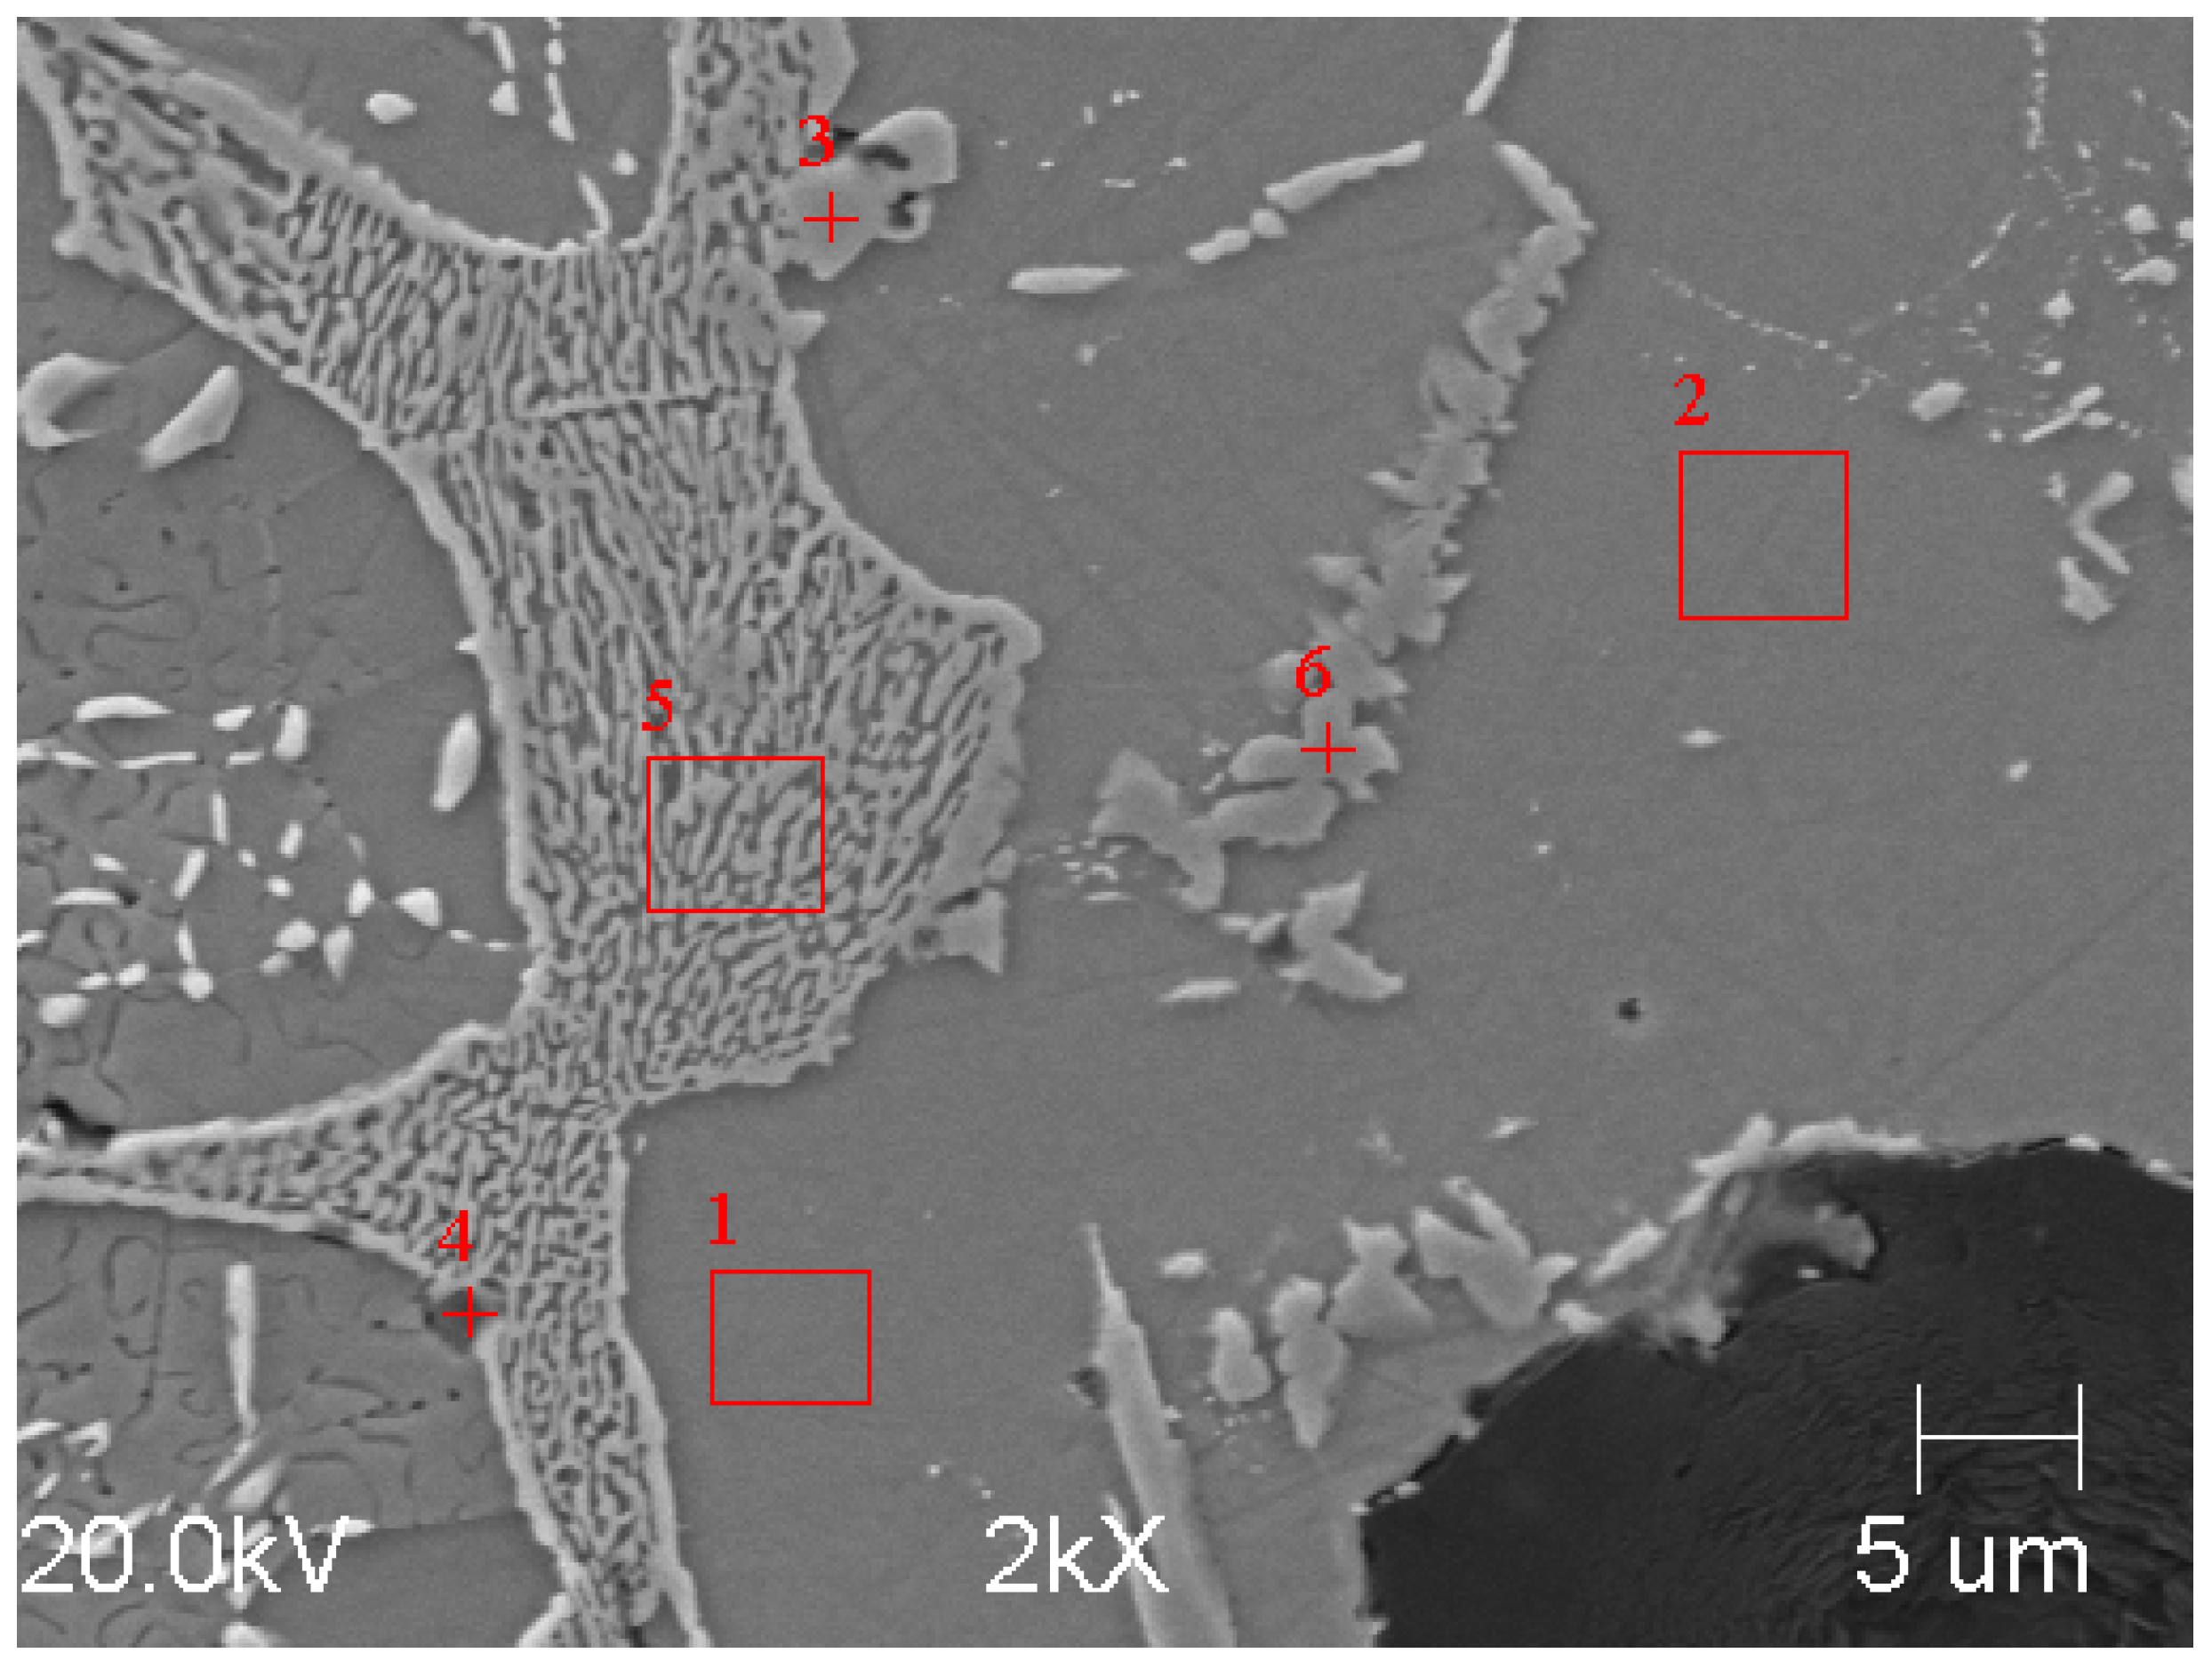
The microstructure of the etched specimen that is shown in Figure 11b shows a matrix that consisted of ferrite. A network of M3C2 alloy carbides was revealed at the grain boundaries, which were stable during the heat treatment. Moreover, small precipitates of alloyed carbides were formed in the ferrite grains. To determine the chemical compositions of the phases in the structure of the tested cast iron, an EDS analysis was performed (Figure 12). The results of the analysis for Area 5 and Point 6 are in Table 5 and Table 6. According to the analysis, the M3C2 carbides appeared in Area 5, while the MC carbides appeared at Point 6.
The surface distribution of the individual elements is shown in Figure 13. In the case of Sample B, chromium and molybdenum mainly formed carbides and were not dissolved in the matrix. In addition to iron, however, the matrix also consisted of silicon and aluminium.

4.4. Sample C

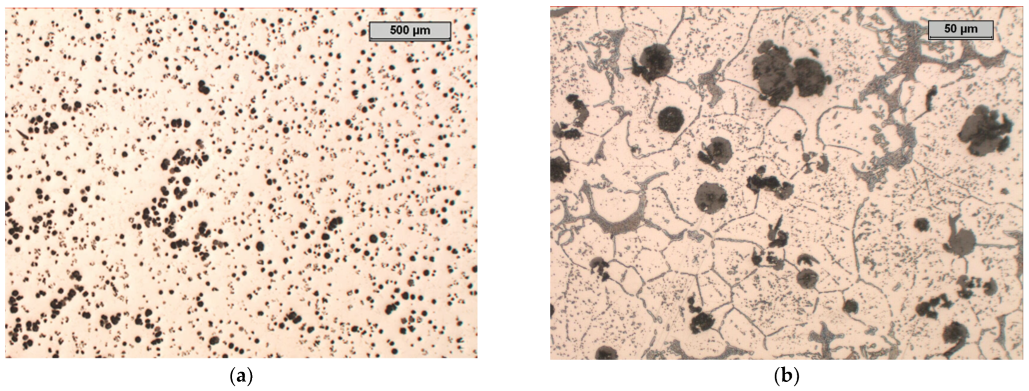
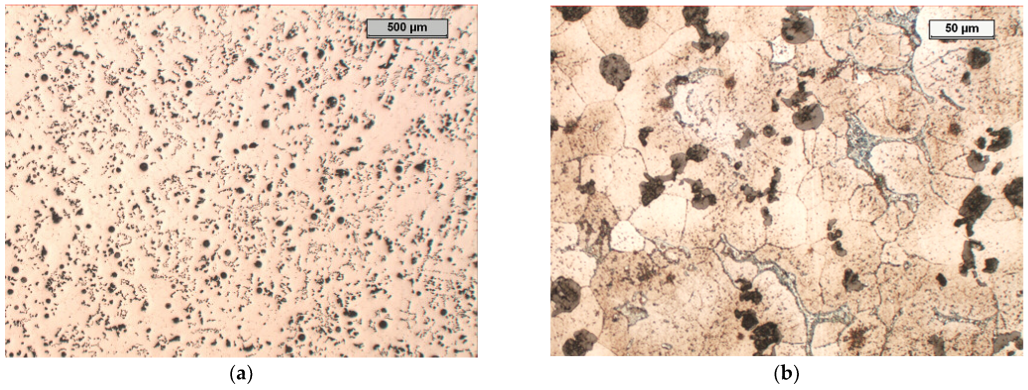
In the microstructure of the unetched specimen of Sample C (Figure 14), it can be stated that approximately 25% of the graphite precipitates were spheroidal graphite. Most of the graphite precipitates were vermicular; this was due to the too-low magnesium content, taking the graphite’s degenerate effect of the aluminium into account. The smaller amount of aluminium than in Sample B meant that there were no large graphite precipitations in the structure. The heat treatment in this case was intended to remove the carbides (which was not achieved). After the heat treatment, there were no small carbides inside the grains (which was the case in the structure of Sample B). It can be seen that the number of carbides was smaller than in the case of Sample B.
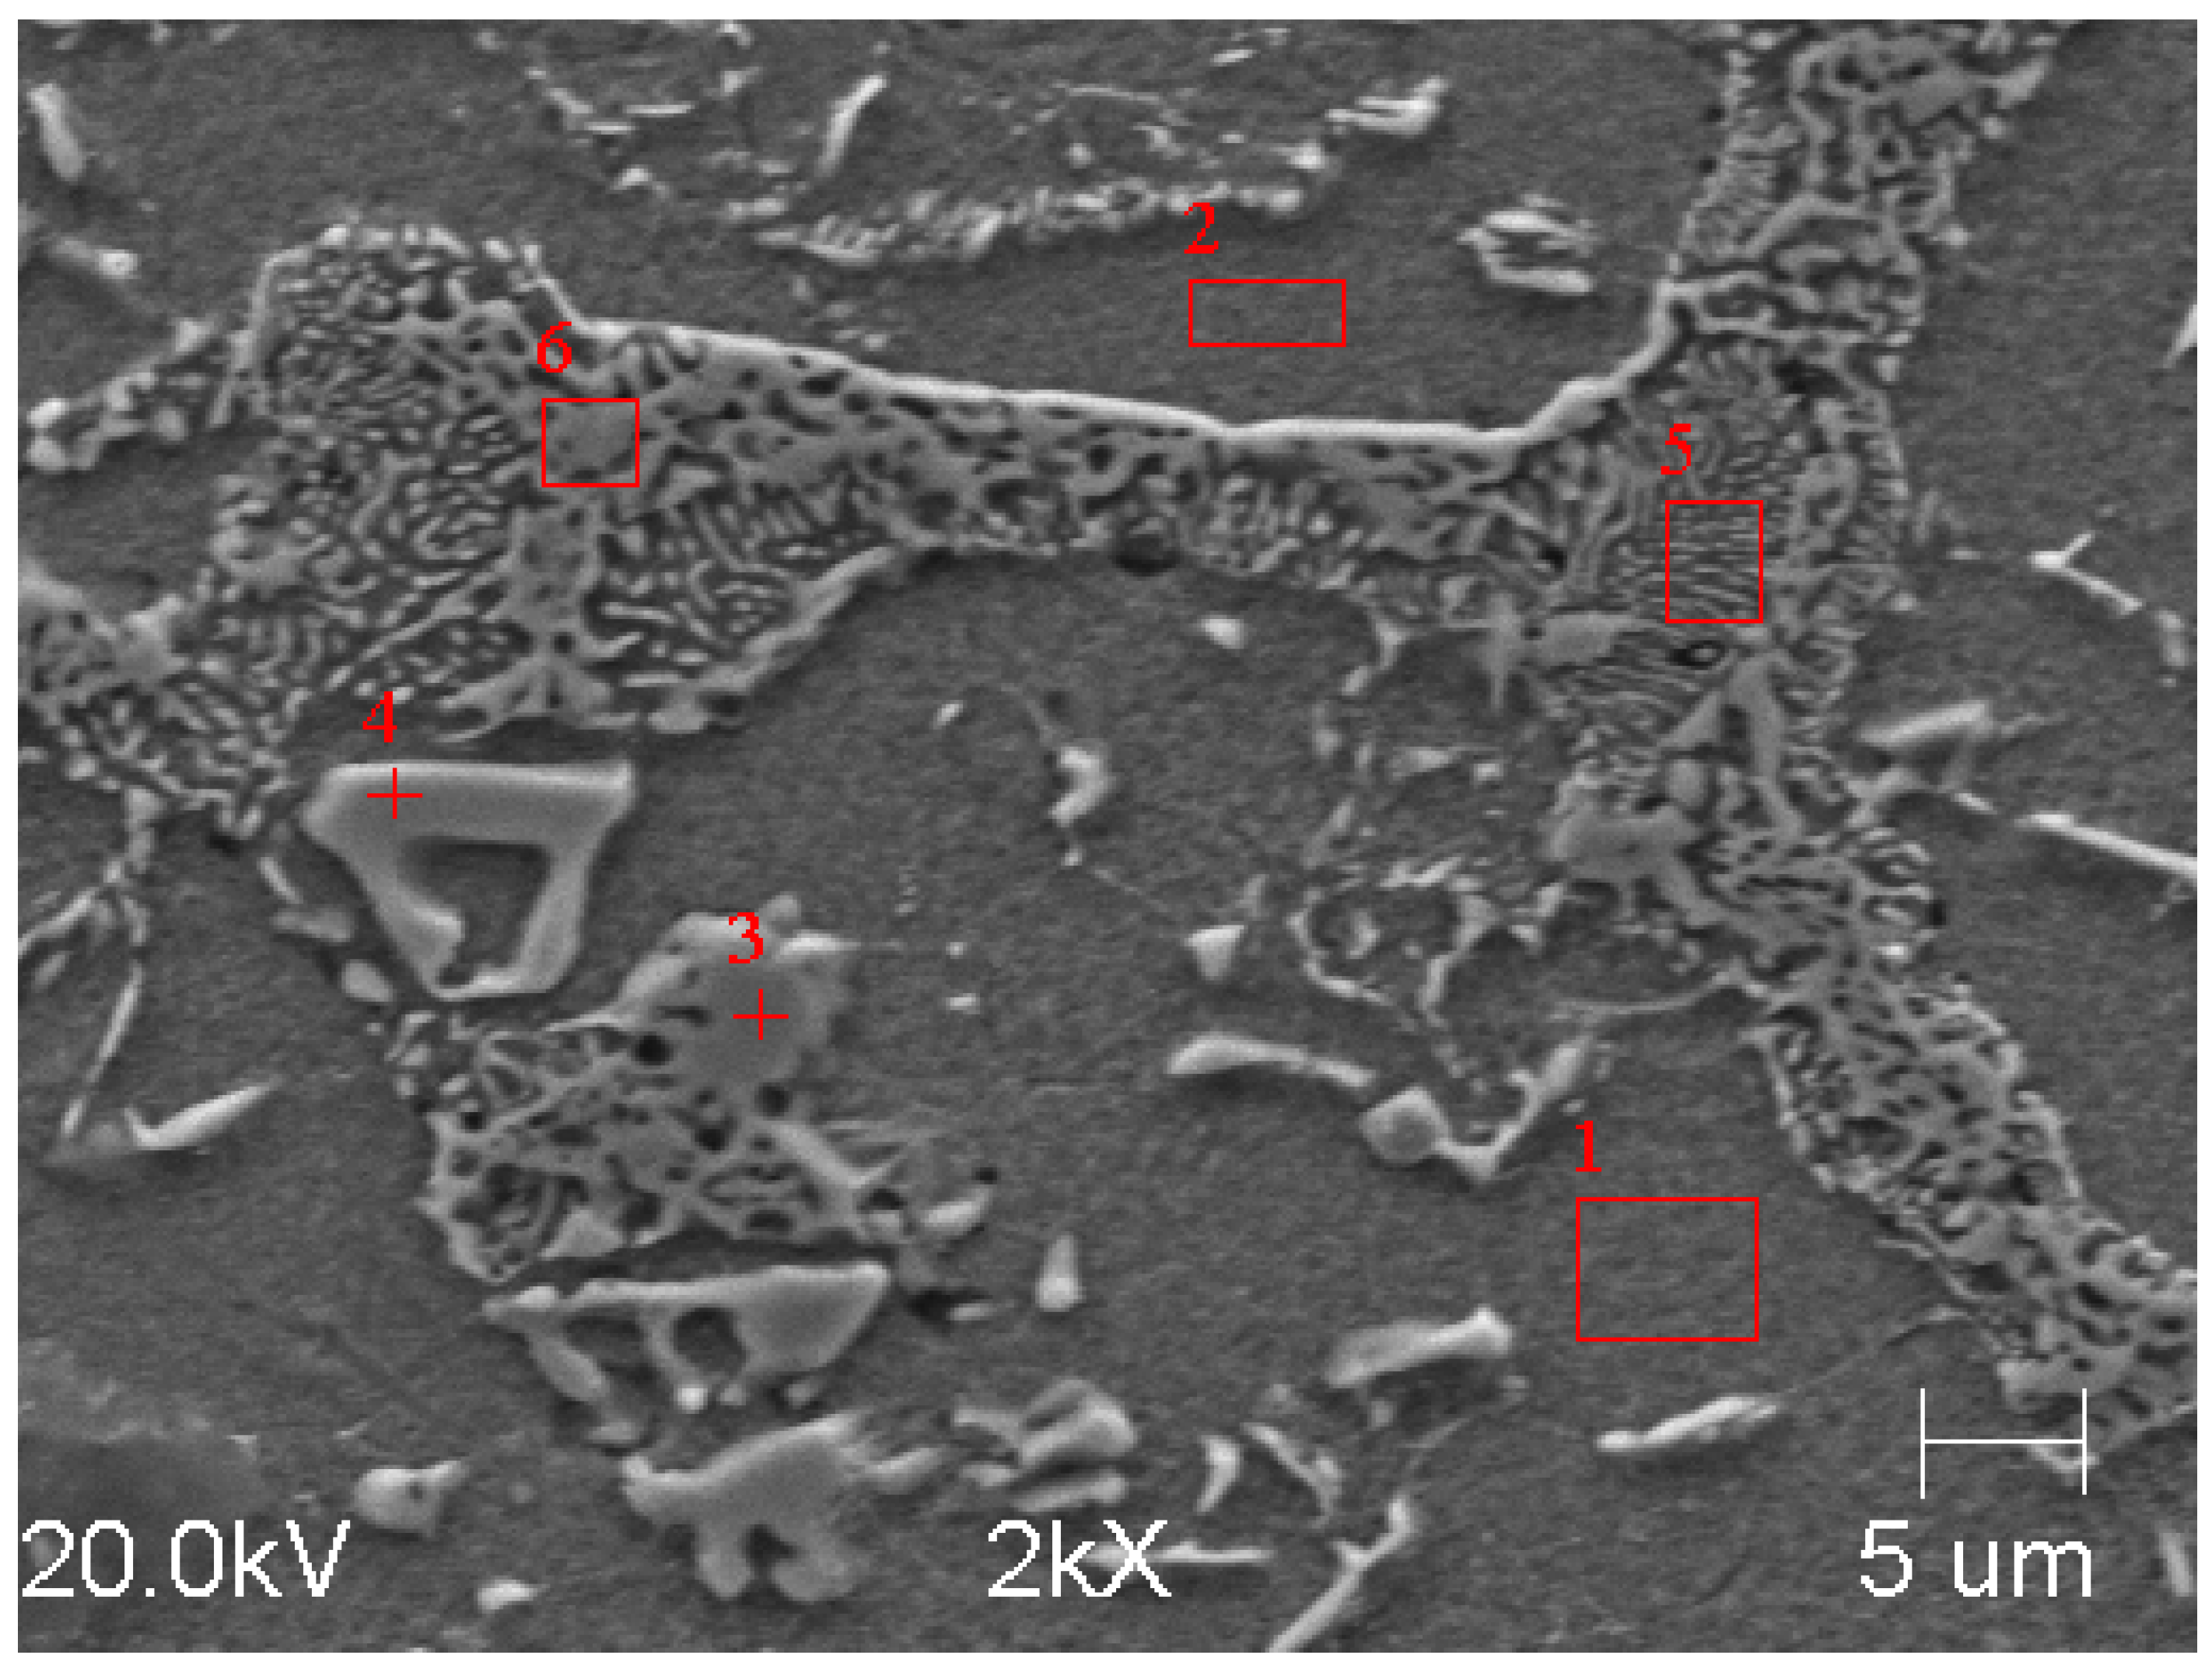
In the case of Sample C, an EDS analysis of the precipitates (marked in Figure 15) was also performed. The results of the analysis for Point 4 and Area 5 are presented in Table 7 and Table 8. In the case of Point 4, it was an MC-type carbide, and its morphology was similar to the MC carbide from Sample B. However, the analysis of Area 5 indicated that there were M6C carbides on the grain boundaries of Sample C.
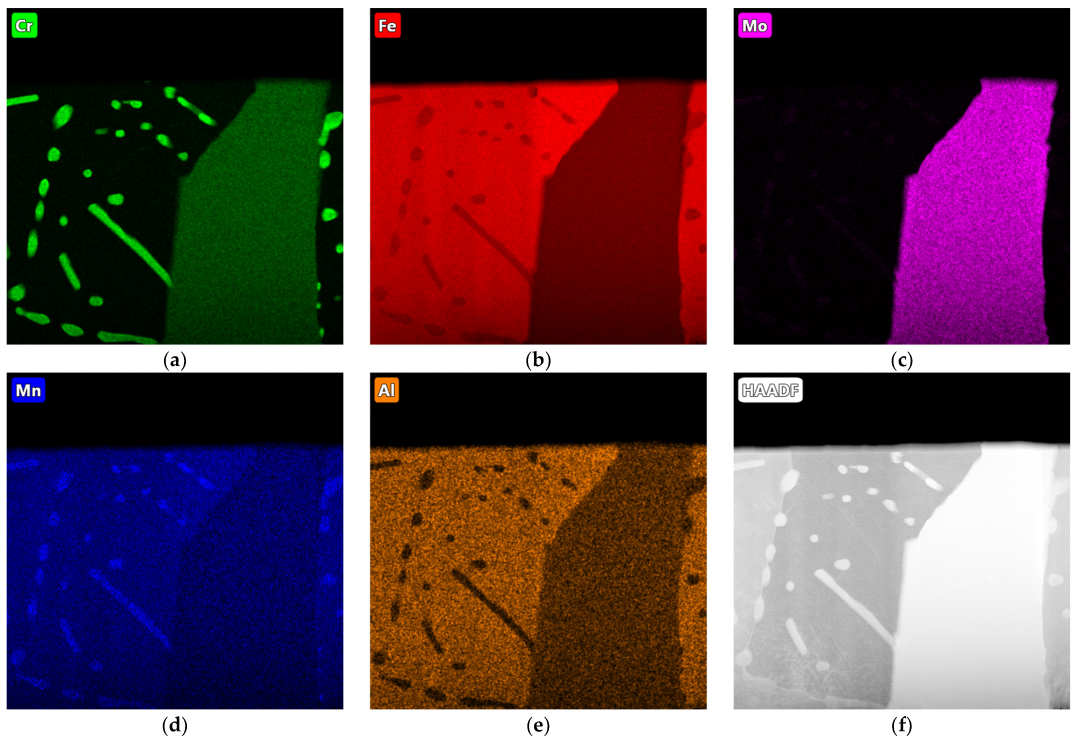
The distribution of the elements in the structure is shown in Figure 16. In this case, it was clearly visible that the large carbide precipitates were complex carbides (but mainly molybdenum); on the other hand, the fine carbides were chromium carbides. In this case, aluminium and silicon were also dissolved in the matrix, and silicon was also present in the large carbides.

4.5. Sample D

In the microstructure of the unetched specimen of Sample D that is shown in Figure 17a, it can be seen that only about 10% of the graphite precipitates were spheroidal graphite; about 70% were vermicular graphite precipitates, and the remaining graphite precipitates degenerated in various ways. Carbide precipitates were visible at the ferrite grain boundaries, as was the case in Sample C (Figure 17b). The carbide precipitates in the discussed Sample D were not as extensive as those in Sample B.
The distribution of the elements in the structure of Sample D is shown in Figure 18. The precipitations at the grain boundaries were complex carbides. The fine carbide precipitates consisted of chromium and molybdenum. Aluminium was dissolved in the metal matrix, although a small spectrum of this element could also be seen in the carbides.
The characteristics of the microstructures of the samples are listed in Table 9. The table specifies the matrix, the types of the graphite precipitates, and the other phases that were present in the structure.

5. Results of Abrasive Wear Tests Using Pin-on-Disc Method

Table 10 contains the results of the abrasive wear tests of the tested samples that were carried out on the tribotester 3-POD stand. Additionally, Table 10 also shows the hardness of the samples (measured on the Vickers scale) and the total abrasive wear at a specific sample load.
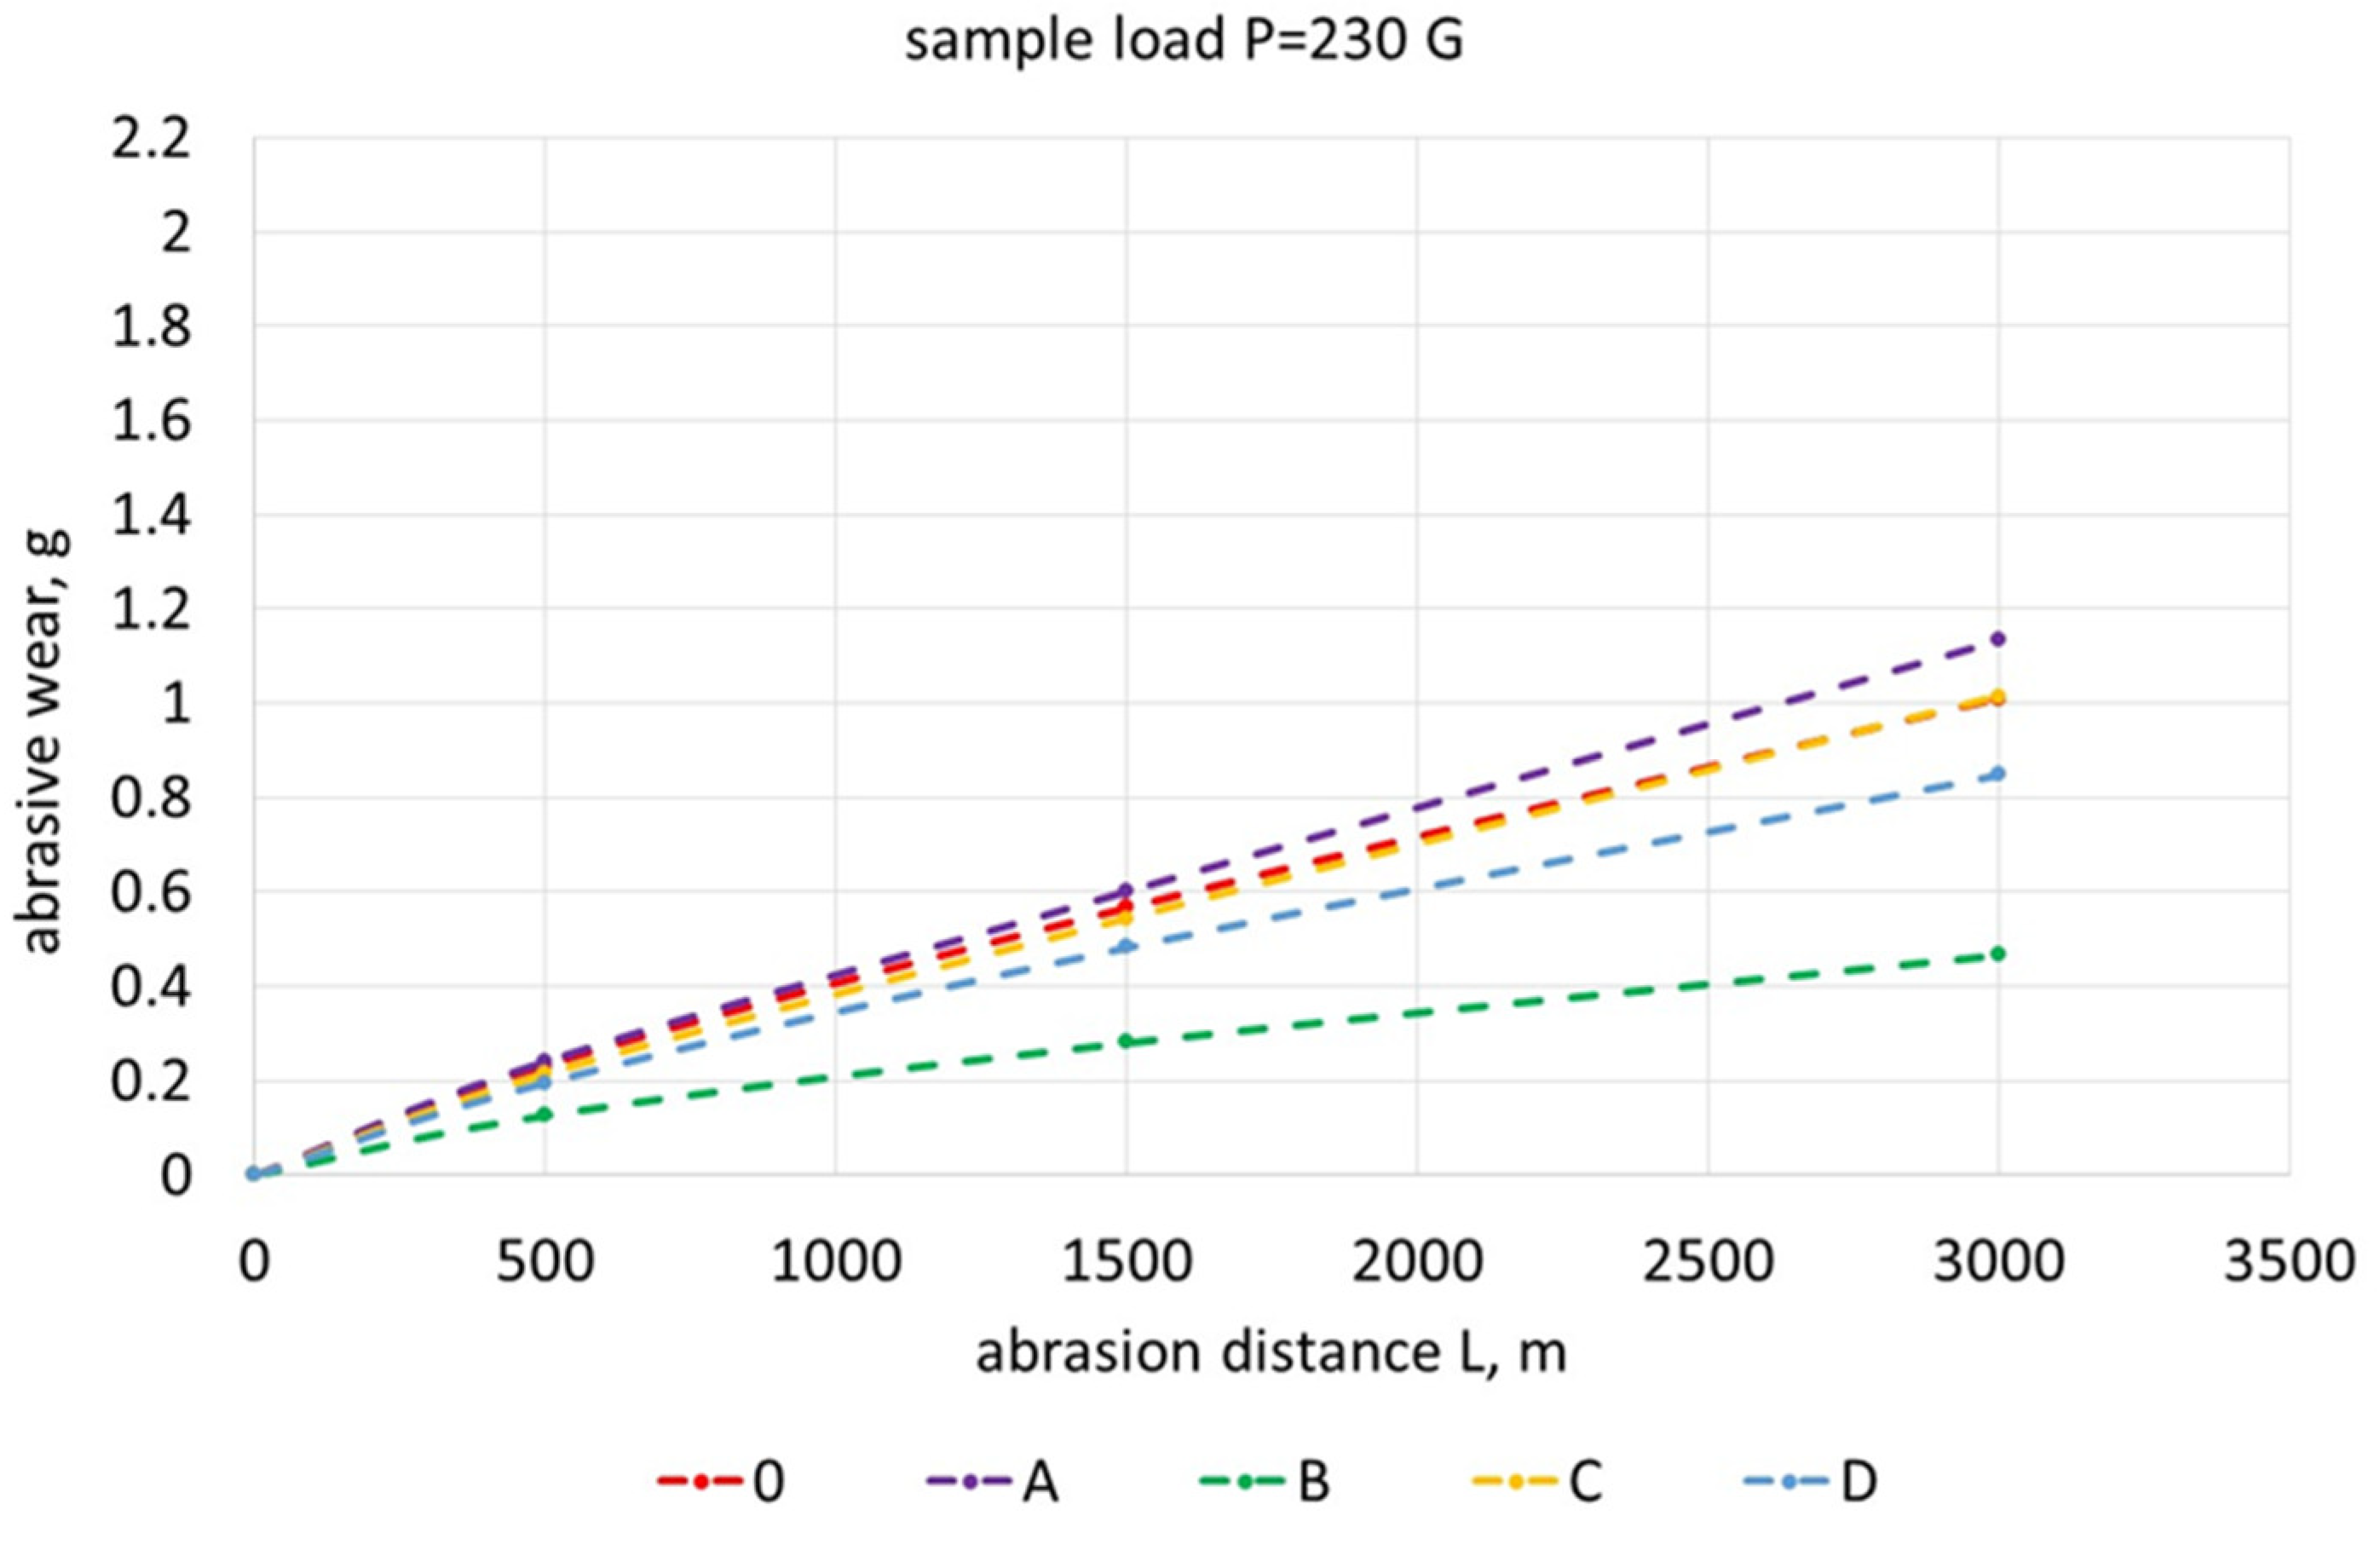
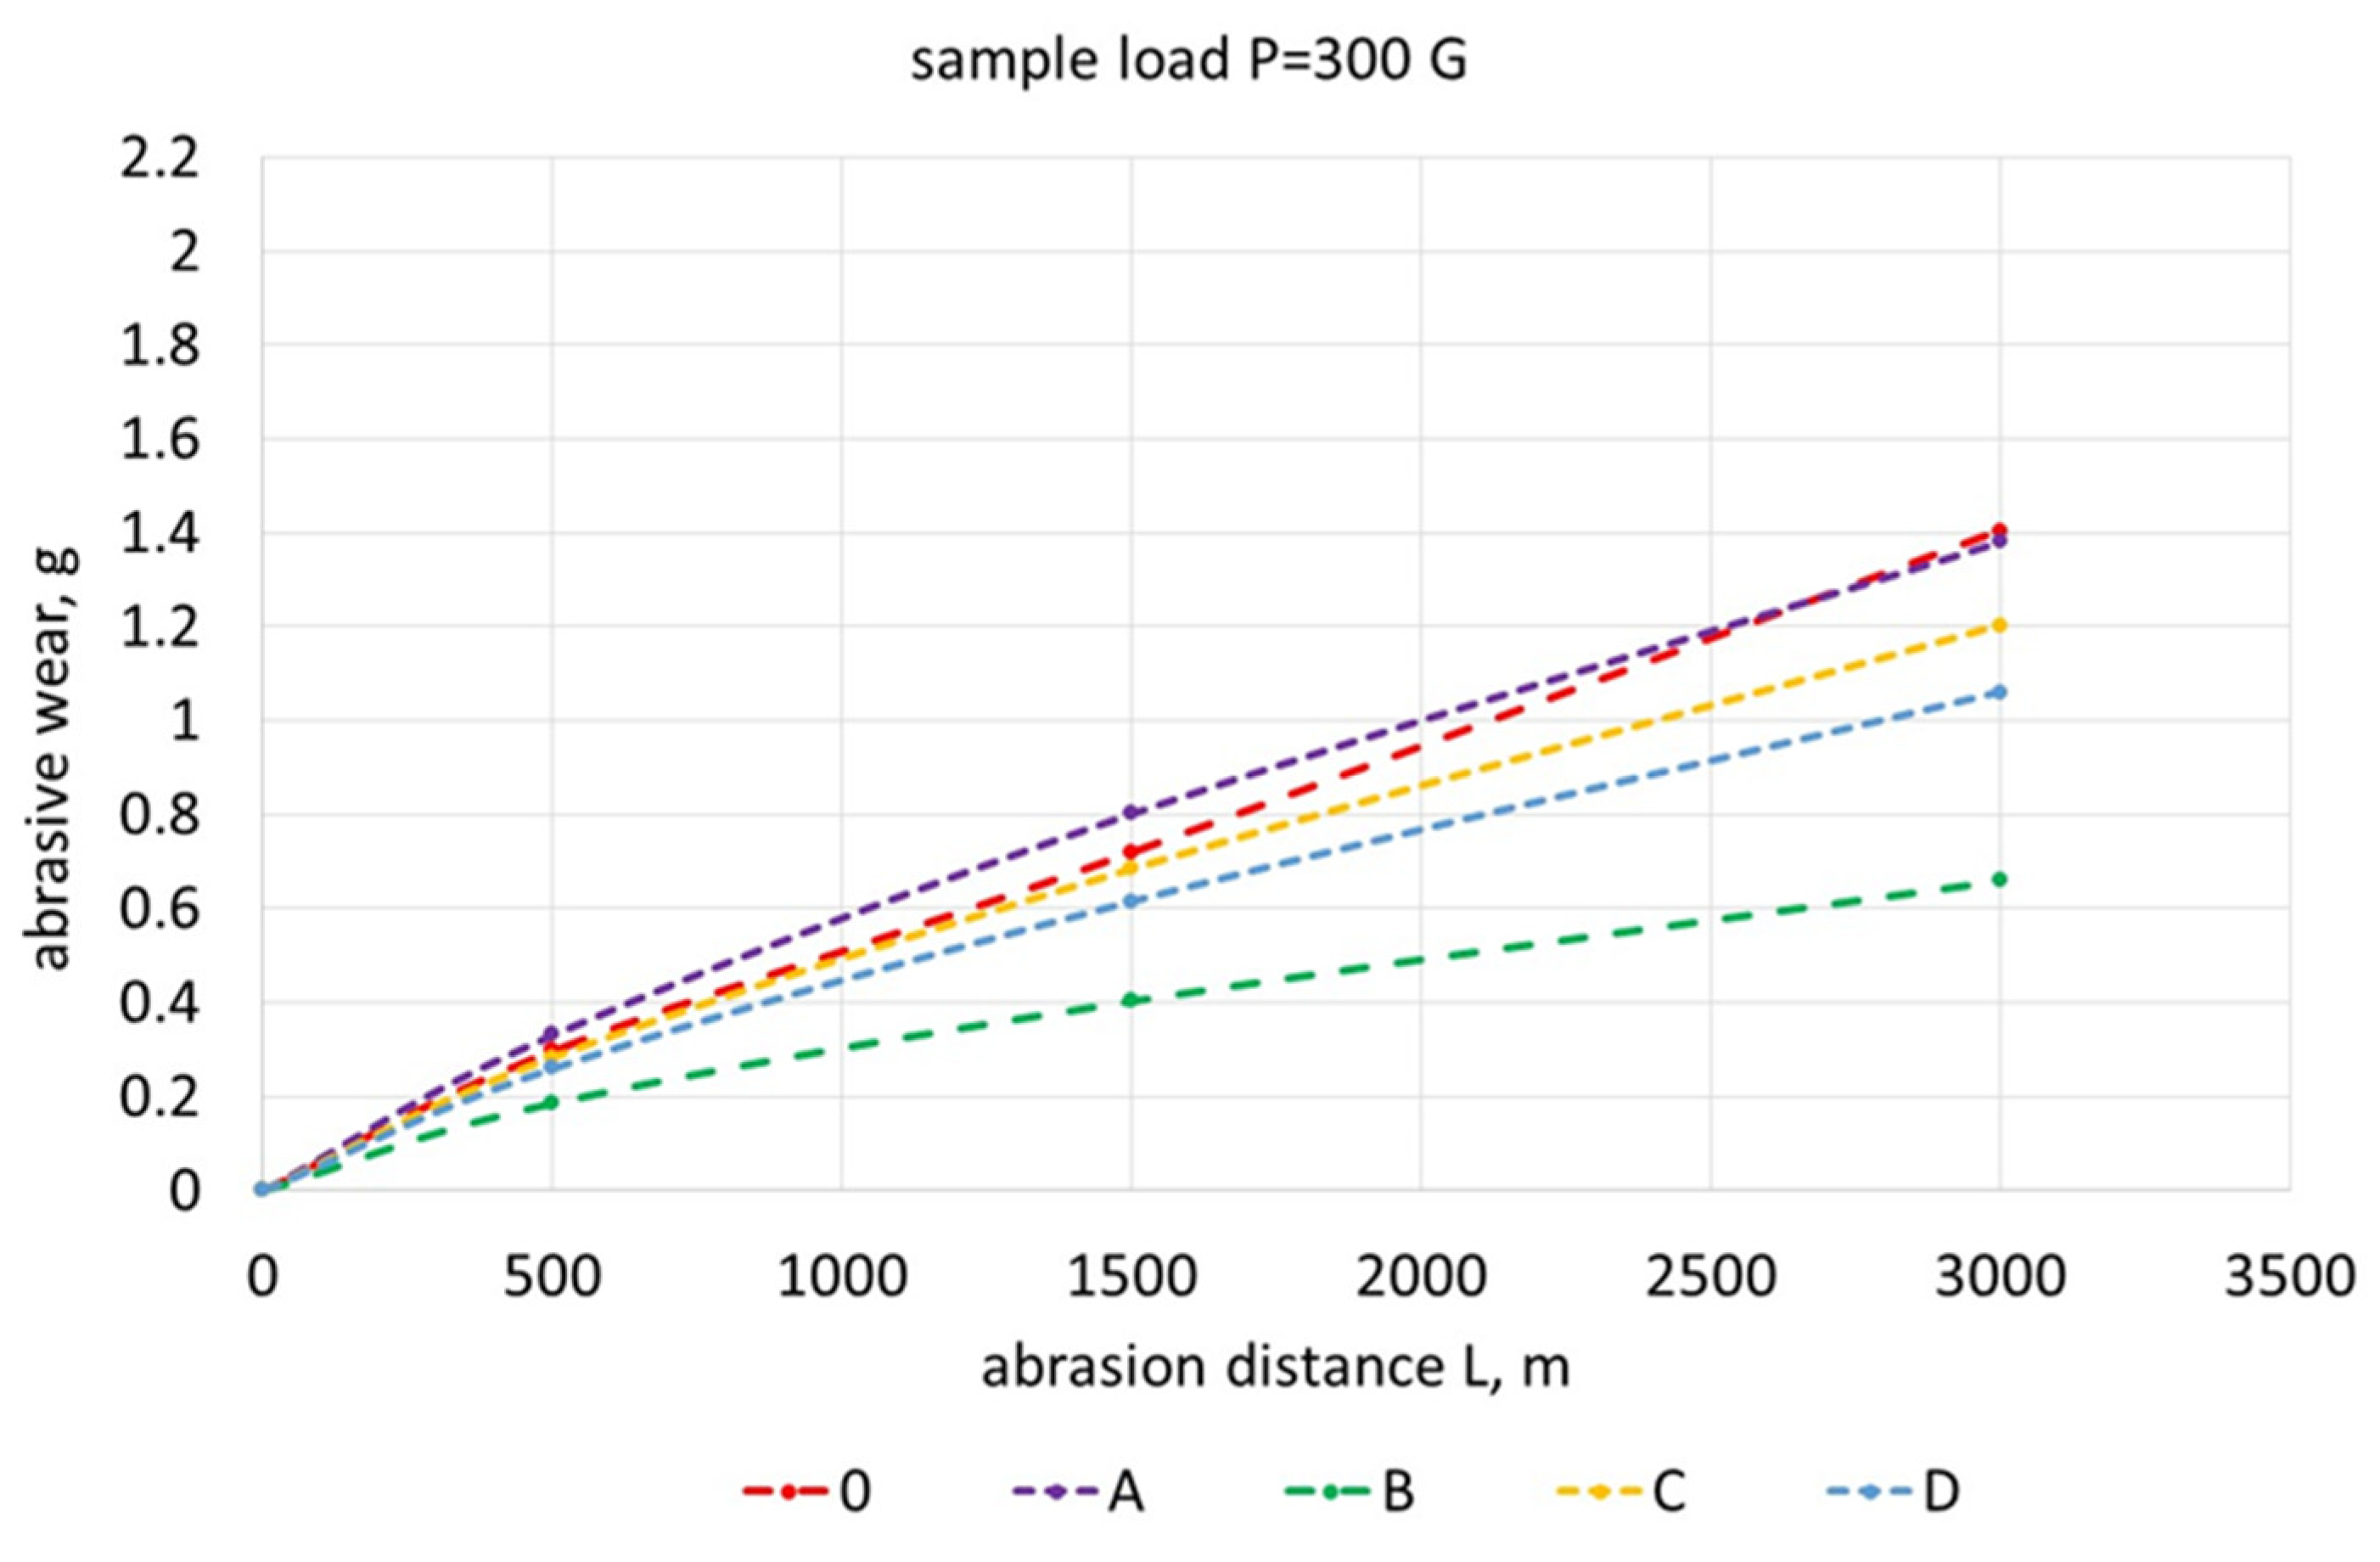
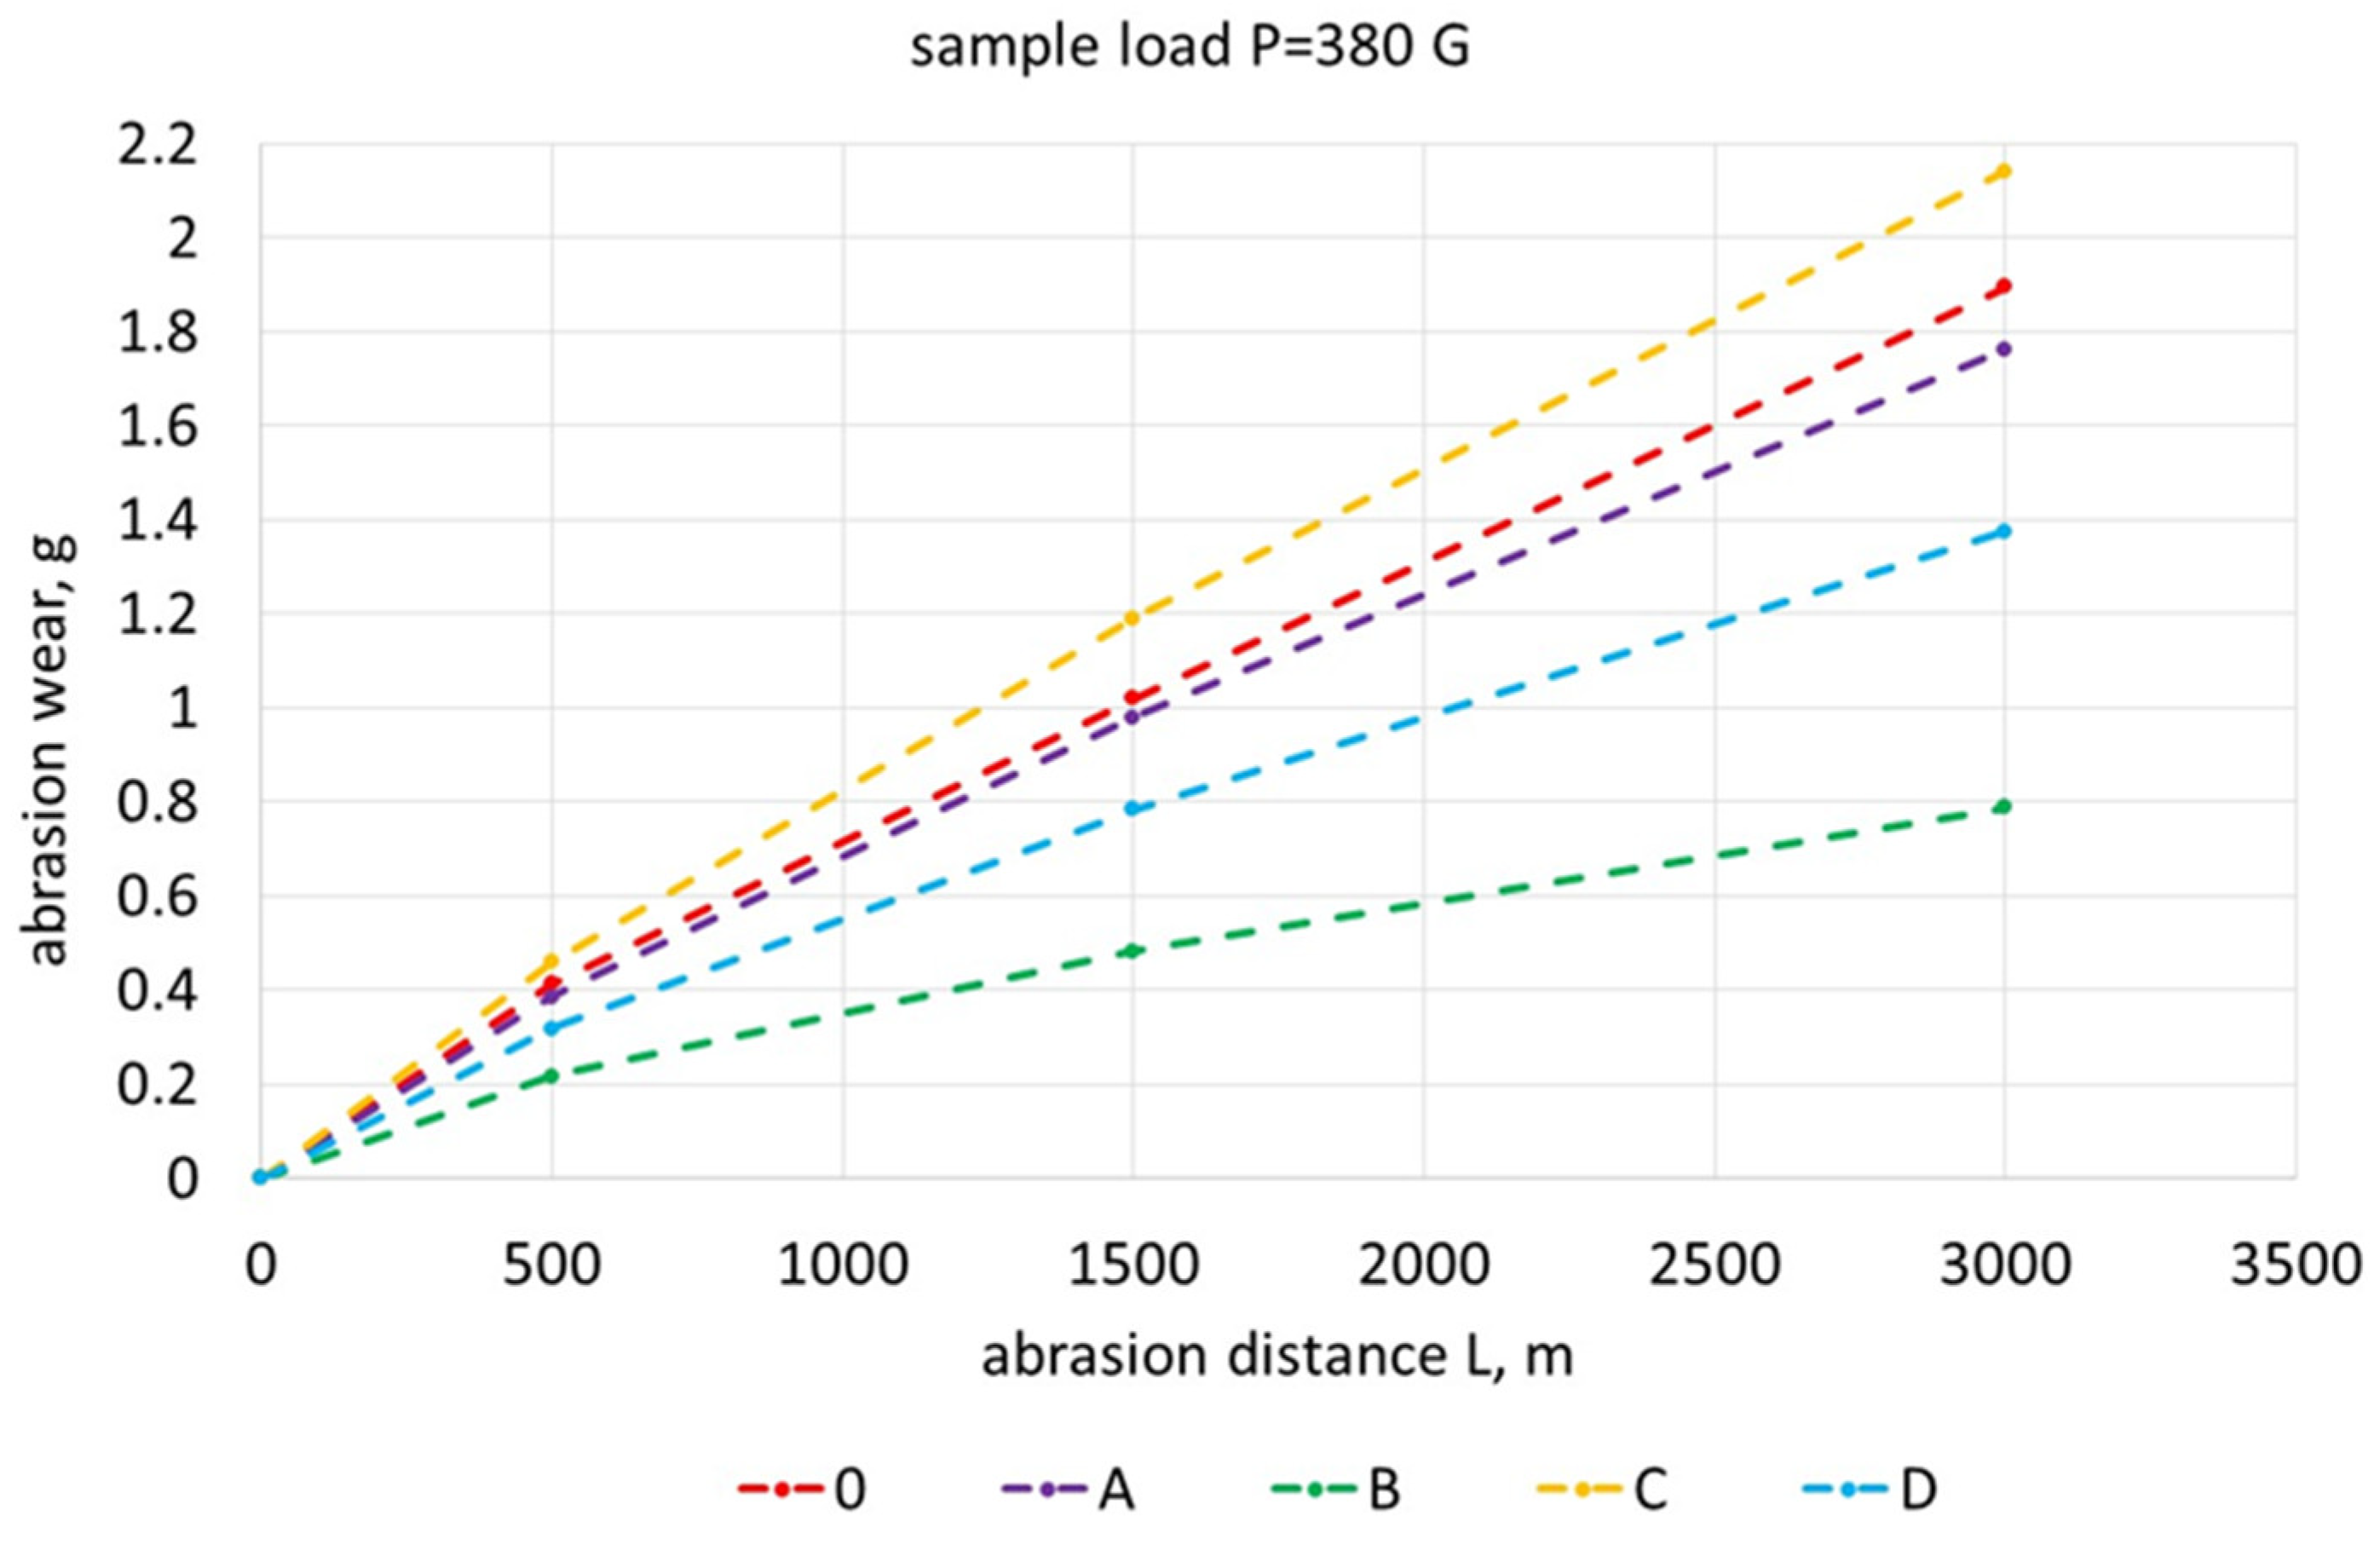
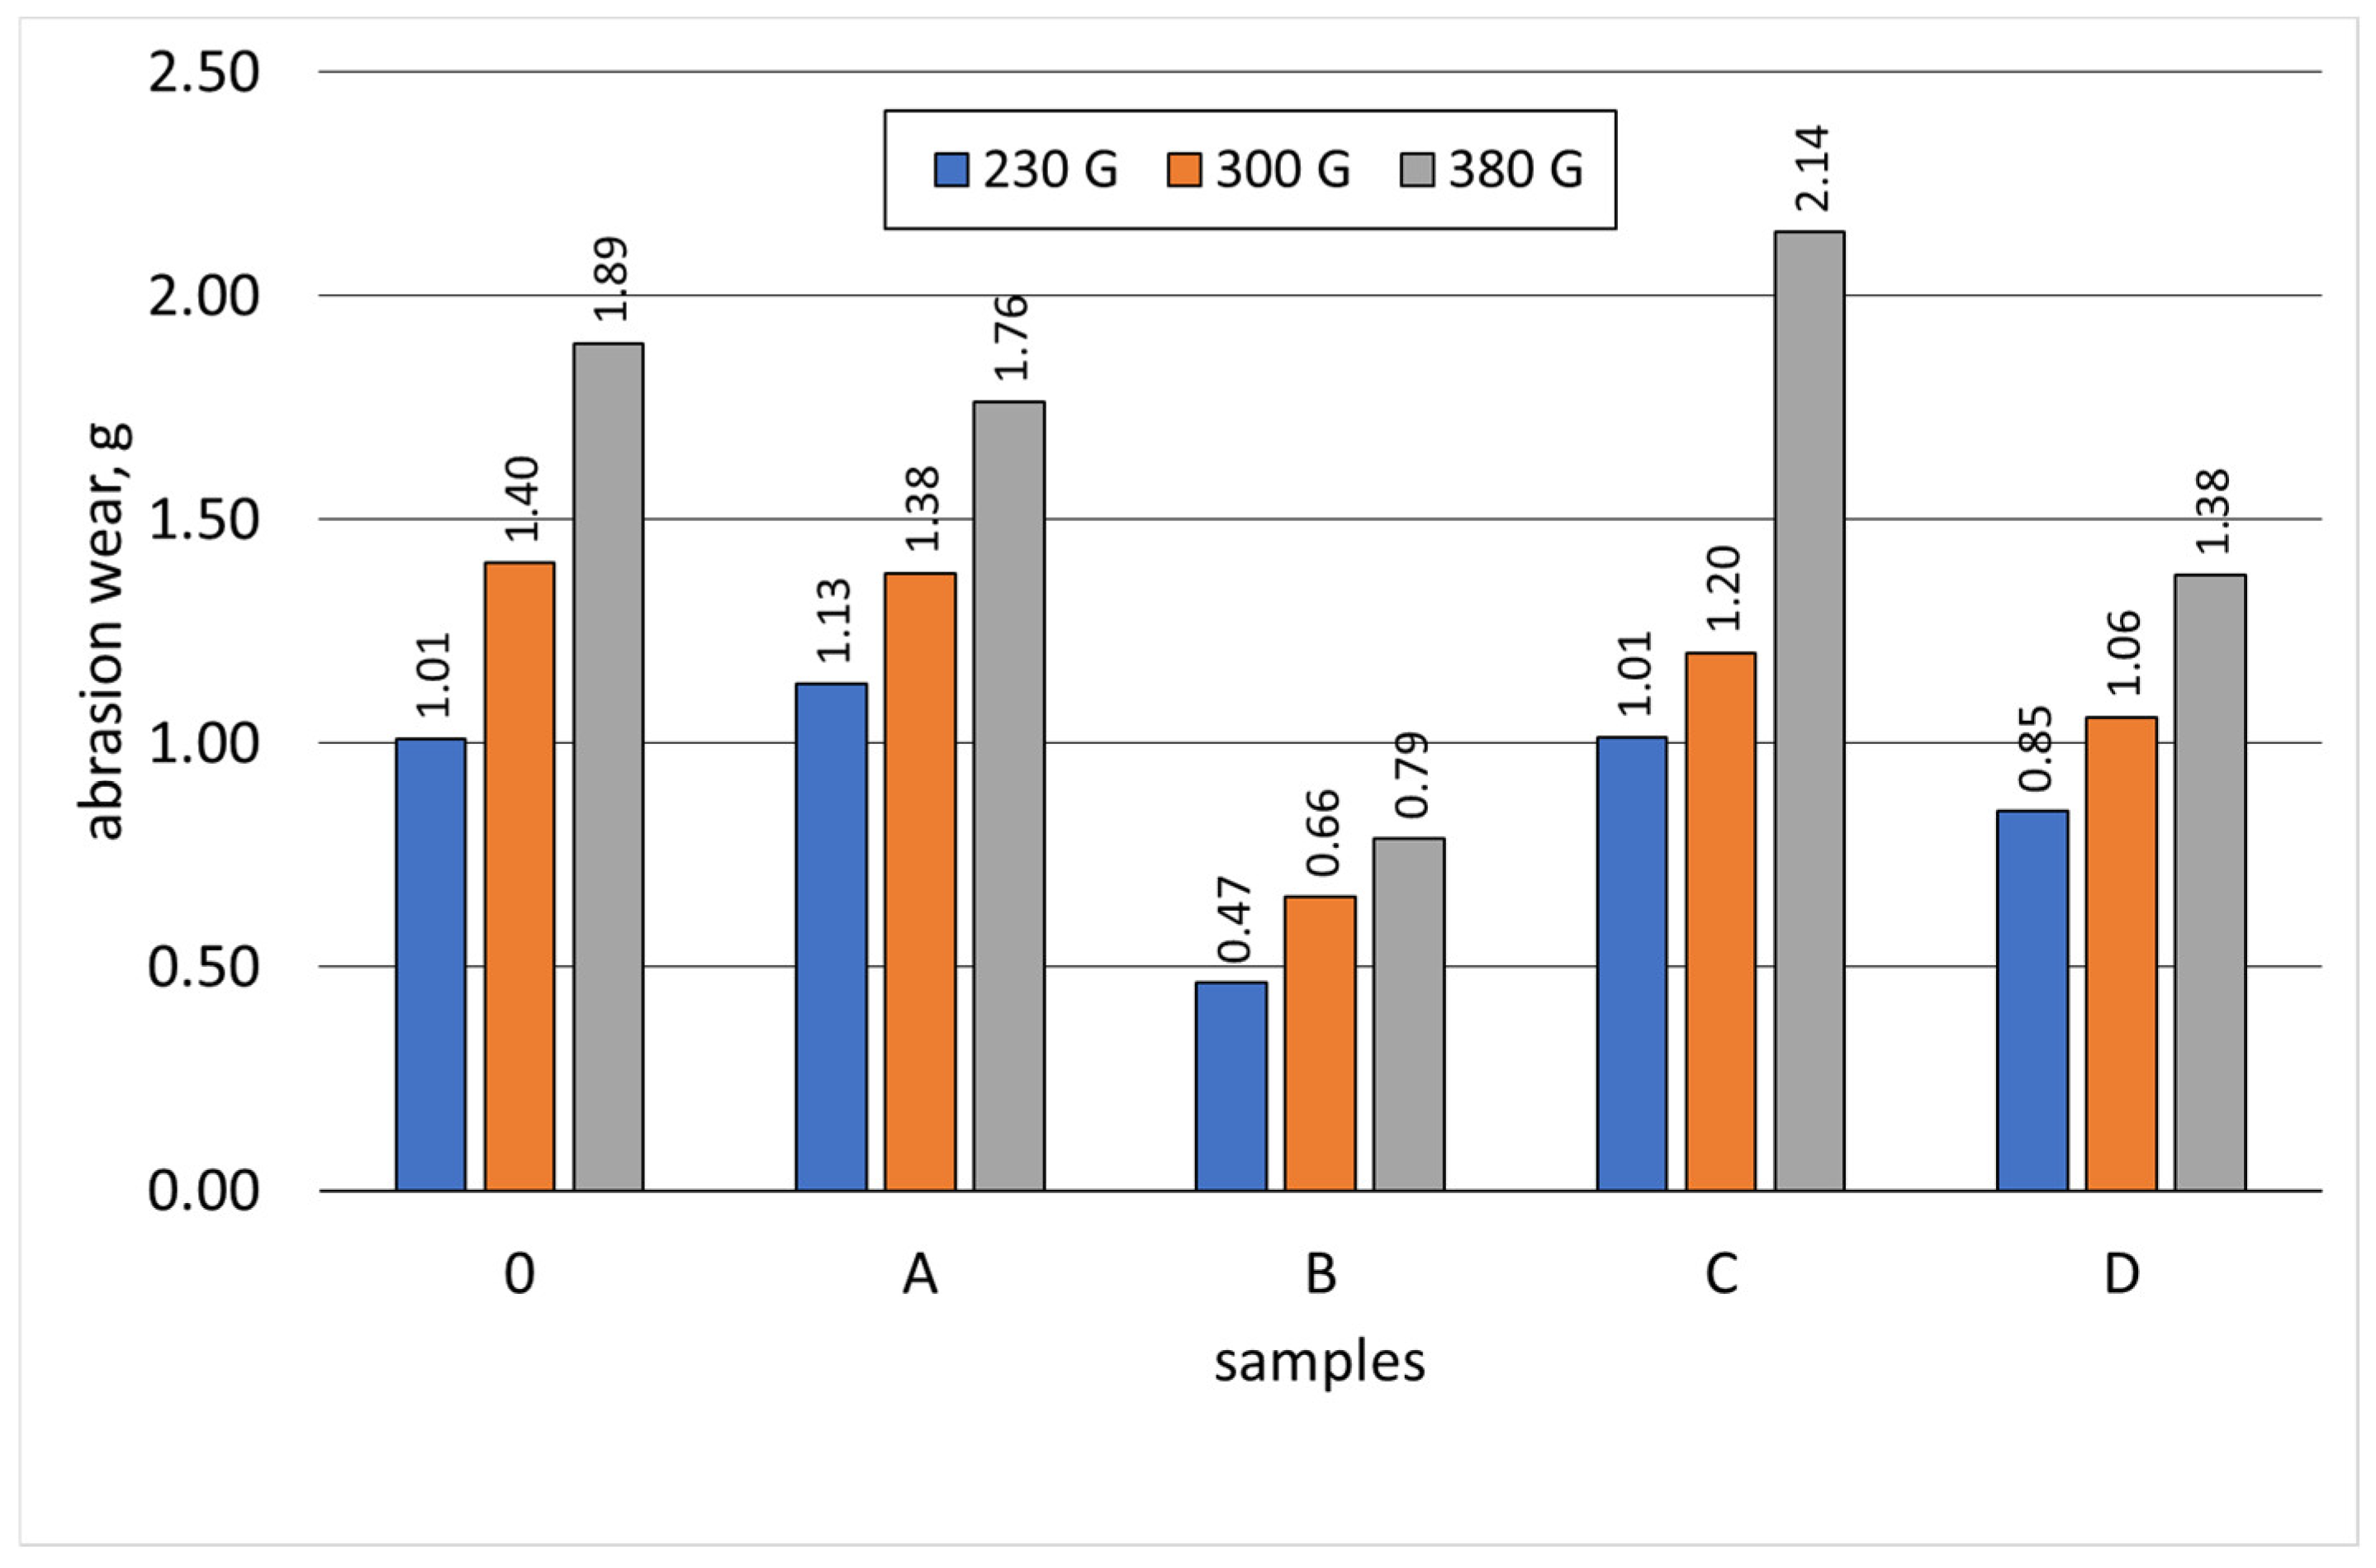
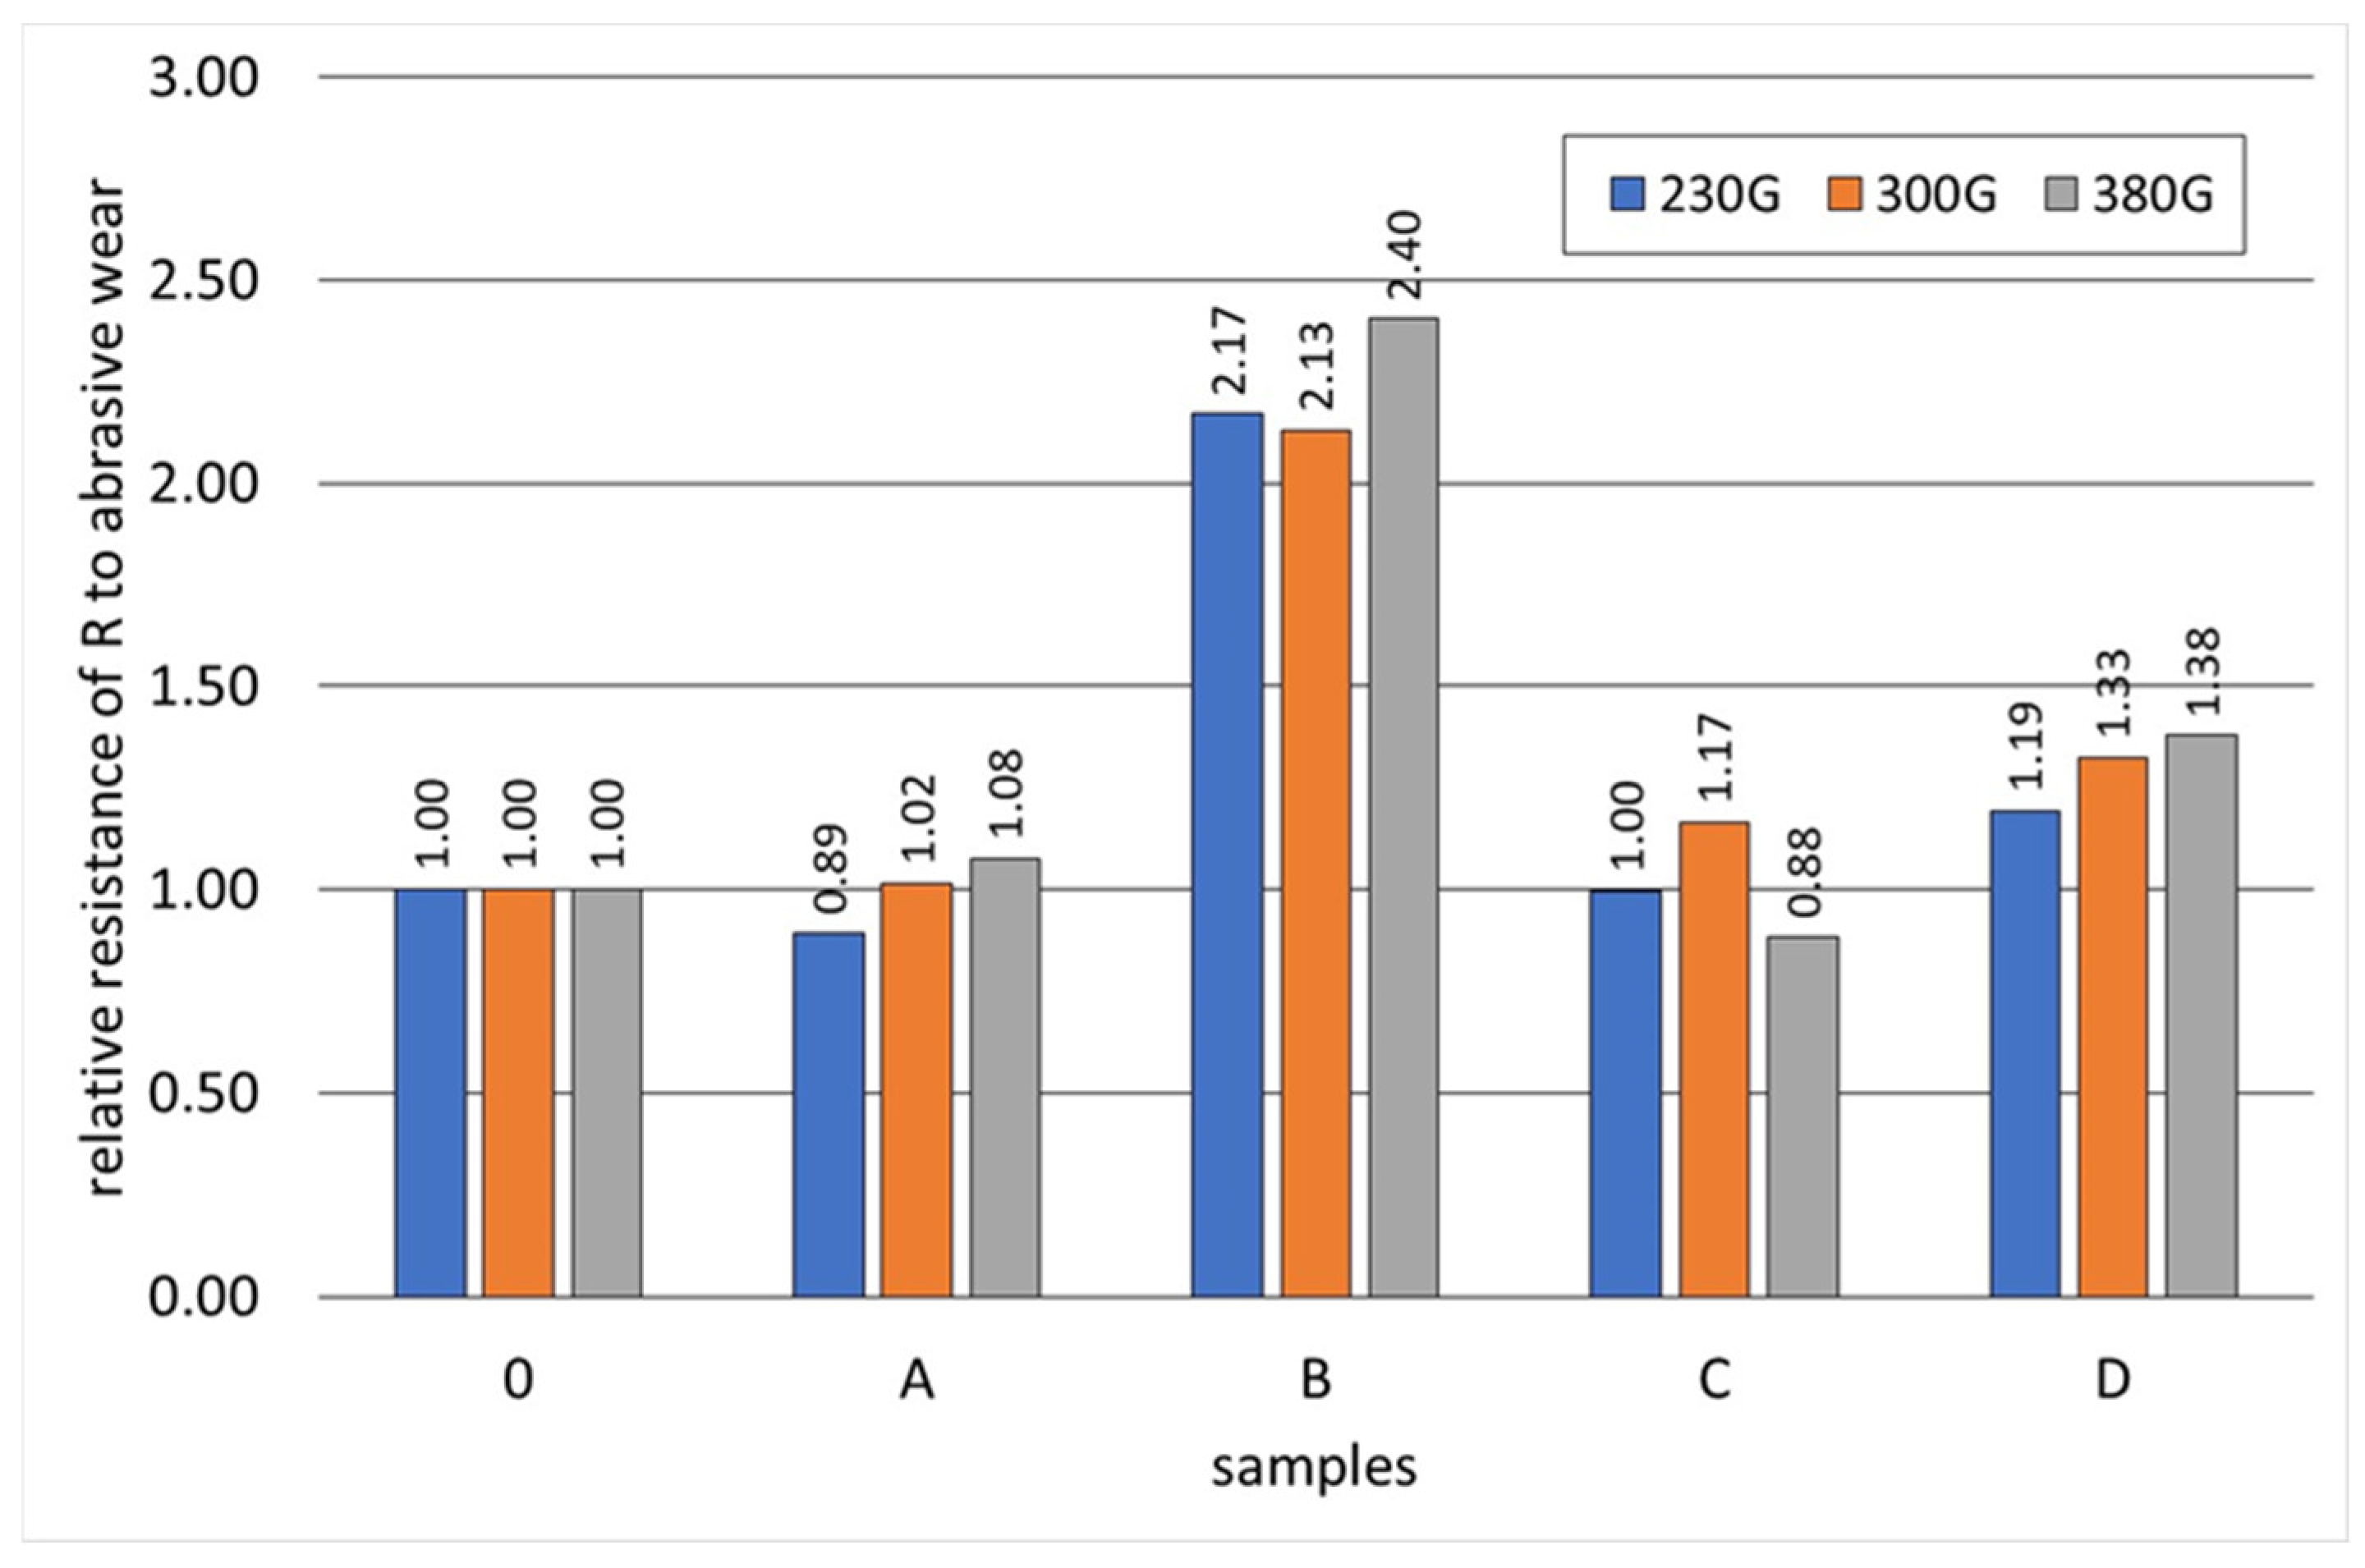
Figure 19, Figure 20, Figure 21, Figure 22 and Figure 23 show the abrasive wear graphs of all of the tested samples. Increases in abrasive wear could be observed as the abrasive distance was covered and the sample pressure on the abrasive disc increased. The abrasive wear rate decreased as the abrasive distance increased, which was justified by the wear of the abrasive disc (sandpaper). The graph in Figure 23 confirms the strong influence of the sample load on its wear. The calculations were made according to Formula (1):
R = m 0 m B
where:
Δm0—total abrasive wear of reference sample, g;
ΔmB—total abrasive wear of test sample, g.
Samples B, C, and D had relatively high hardness values (more than 350 HV) but only slightly higher abrasive wear resistance as compared to Reference Sample 0. Among these samples, only Sample B exceeded the relative abrasive wear resistance (R > 2).
The test result of Sample C is interesting, having a hardness greater than 350 HV showed worse resistance to abrasive wear when compared to Reference Sample 0 (whose hardness did not exceed 200 HV). Sample C had the lowest wear resistance (Figure 23) with the highest sample load during the abrasive wear measurements. The research showed that the tested SiMo medium alloy cast iron had a soft structure in the form of ferrite and numerous hard, complex carbides. During the abrasive wear, some of the carbides may have crumbled, especially under heavy loads. Therefore, this type of cast iron had a slightly lower relative resistance to abrasive wear. Furthermore, it can be observed that an appropriately selected heat treatment for Sample B doubled its relative resistance to abrasive wear when compared to the cast iron that made up Reference Sample 0.

6. Conclusions

  • The addition of aluminium and chromium to SiMo cast iron increased the amount of M6C, M3C2, and MC carbides; these remained stable during the proposed heat treatment and consequently increased the hardness of the cast iron.
  • The addition of aluminium caused the degeneration of the spheroidal graphite precipitates.
  • The highest abrasion resistance, more than twice the abrasion resistance of the reference sample with a ferrite–pearlite matrix, was obtained with the highest addition of Cr, Mo, and Al—sample B.
  • Samples A and C with a ferritic matrix, having a smaller amount of carbides in the structure than sample B, had abrasion resistance comparable to that of the reference sample.
  • Sample D had 19 to 38% better abrasion resistance than the reference sample.

Author Contributions

Conceptualization, Ł.D. and D.K.; Methodology, Ł.D., R.Z., A.S. (Andrzej Studnicki), A.S. (Andrzej Szczęsny) and D.K.; Formal analysis, R.Z.; Investigation, Ł.D., K.M., A.S. (Andrzej Studnicki) and A.S. (Andrzej Szczęsny); Resources, Ł.D., R.Z. and K.M.; Writing—original draft, Ł.D.; Writing—review & editing, R.Z., A.S. (Andrzej Szczęsny) and D.K.; Project administration, D.K. All authors have read and agreed to the published version of the manuscript.

Funding

This research received no external funding.

Institutional Review Board Statement

Not applicable.

Informed Consent Statement

Not applicable.

Data Availability Statement

Data are contained within the article.

Conflicts of Interest

Author Łukasz Dyrlaga was employed by the company METALPOL Węgierska Górka. The remaining authors declare that the research was conducted in the absence of any commercial or financial relationships that could be construed as a potential conflict of interest.

References

  1. Kleiner, S.; Track, K. SiMo 1000—Ein aluminium—legiertes Gusseisen für Hochtemperaturanwendungen. Giesserei 2010, 10, 28–34. [Google Scholar]
  2. Papis, K.; Tunziniand, S.; Menk, W. Cast iron alloys for exhaust applications. In Proceedings of the 10th International Symposium on the Science and Processing of Cast Iron—SPCI10, Mar del Plata, Argentina, 10–13 November 2014. [Google Scholar]
  3. Çelik, G.A.; Tzini, M.I.T.; Polat, S.; Aristeidakis, J.S. Simulation and analysis of the solidification characteristics of a Si-Mo ductile iron. J. Min. Metall. Sect. B Metall. 2021, 57, 53–62. [Google Scholar] [CrossRef]
  4. Mróz, M.; Orłowicz, A.W.; Tupaj, M.; Kupiec, B.; Kawiński, M. Ductile Cast Iron Microstructure Adjustment by Means of Heat Treatment. Arch. Foundry Eng. 2020, 20, 37–40. [Google Scholar] [CrossRef]
  5. Xavier, T.; Ribeiro da Silva, L.R.; Guesser, W.; Machado, A. Influence of Si content on the machinability of ductile iron. Tecnol. Em Metal. Mater. E Mineração 2022, 19, e2668. [Google Scholar] [CrossRef]
  6. Dong, F.; Zhang, M.; Peng, F.; Zhang, J. Preparation and Mechanical Properties of High Silicon Molybdenum Cast Iron Materials: Based on Deep Learning Model. Comput. Intell. Neurosci. 2022, 2022, 4825356. [Google Scholar] [CrossRef]
  7. Górny, M.; Kawalec, M.; Gracz, B.; Tupaj, M. Influence of Cooling Rate on Microstructure Formation of Si–Mo Ductile Iron Castings. Metals 2021, 11, 1634. [Google Scholar] [CrossRef]
  8. Angella, G.; Taloni, M.; Donnini, R.; Zanardi, F. The Correlation between Solidification Rates, Microstructure Integrity and Tensile Plastic Behaviour in 4.2 wt.% Silicon Strengthened Ductile Iron. J. Cast. Mater. Eng. 2022, 6, 1–7. [Google Scholar] [CrossRef]
  9. Cygan, B.; Stawarz, M.; Jezierski, J. Heat Treatment of the SiMo Iron Castings—Case Study in the Automotive Foundry. Arch. Foundry Eng. 2018, 18, 103–109. [Google Scholar] [CrossRef]
  10. Szymański, Ł.; Olejnik, E.; Sobczak, J.J.; Szala, M.; Kurtyka, P.; Tokarski, T.; Janas, A. Dry sliding, slurry abrasion and cavitation erosion of composite layers reinforced by TiC fabricated in situ in cast steel and gray cast iron. J. Mater. Process. Technol. 2022, 308, 117688. [Google Scholar] [CrossRef]
  11. Tęcza, G. Changes in abrasion resistance of cast Cr-Ni steel as a result of the formation of niobium carbides in alloy matrix. Materials 2023, 16, 1726. [Google Scholar] [CrossRef]
  12. Abdelrahim, D.M.; Ateia, E.E.; Nofal, A.A. Effect of Molybdenum Contents on Microstructure and High-Temperature Wear Behavior of SiMo Ductile Iron. Int. J. Met. 2023, 18, 530–545. [Google Scholar] [CrossRef]
  13. Abdelrahim, D.M.; Ateia, E.E.; Youssef, M. Influence of Cooling Rate and Alloying by “Cr, V, and Ni” on Microstructure and High-Temperature Wear Behavior of SiMo Ductile Iron. Int. J. Met. 2024, 1–14. [Google Scholar] [CrossRef]
  14. Xiang, S.; Zhu, B.; Jonsson, S. High-Temperature Corrosion-Fatigue Behavior of Ductile Cast Irons for Exhaust Manifolds Applications. Mater. Sci. Forum 2018, 925, 369–376. [Google Scholar] [CrossRef]
  15. Berns, H.; Theisen, W. Ferrous Materials. Steel and Cast Iron; Springer: Berlin/Heidelberg, Germany, 2008. [Google Scholar]
  16. Öberg, C.; Zhu, B.; Jonsson, S. Plastic Deformation and Creep of Two Ductile Cast Irons, SiMo51 and SiMo1000, during Thermal Cycling with Large Strain. Mater. Sci. Forum 2017, 925, 361–368. [Google Scholar] [CrossRef]
  17. Xiang, S.; Hedström, P.; Zhu, B.; Linder, J.; Odqvist, J. Influence of graphite morphology on the corrosion-fatigue properties of the ferritic Si-Mo-Al cast iron SiMo1000. Int. J. Fatigue 2020, 140, 105781. [Google Scholar] [CrossRef]
  18. Kopyciński, D.; Guzik, E.; Szczęsny, A.; Dyrlaga, Ł. Struktura i właściwości żeliwa odpornego na działanie wysokiej temperatury oraz na zużycie ścierne. In Proceedings of the Metalurgia 2020, Bukowina Tatrzańska, Polska, 20–22 October 2021. [Google Scholar]
  19. Shantanu, U.; Saxena, K.K. Effect of Cu and Mo addition on mechanical properties and microstructure of grey cast iron. Mater. Today Proc. 2020, 26, 2462–2470. [Google Scholar]
  20. Siekaniec, D.; Kopyciński, D.; Tyrała, E.; Guzik, E.; Szczęsny, A. Optimisation of solidification structure and properties of hypoeutectic chromium cast iron. Materials 2022, 15, 6243. [Google Scholar] [CrossRef] [PubMed]
  21. Studnicki, A.; Szajnar, J. Investigation of Wear Resistant of Low-Alloyed and Chromium Cast Steel. Arch. Foundry Eng. 2012, 12, 79–84. [Google Scholar] [CrossRef]
  22. Gong, L.; Fu, H.; Yang, P.; Ji, X.; Yin, W.; Lin, J. Refinement of primary carbides and improvement of wear resistance of hypereutectic high chromium cast iron after modification. J. Mater. Res. Technol. 2023, 24, 5724–5742. [Google Scholar] [CrossRef]
  23. Dawood, N.M.; Al khaqani, B.H.; Salim, A.M. Effect of Aluminum Addition on Microstructure and Oxidation Performance of Cast Irons. J. Mech. Eng. Res. Dev. 2020, 43, 360–372. [Google Scholar]
  24. Gilewski, R.; Kopyciński, D.; Guzik, E.; Szczęsny, A. Shaping the Microstructure of High-Aluminum Cast Iron in Terms of the Phenomenon of Spontaneous Decomposition Generated by the Presence of Aluminum Carbide. Materials 2021, 14, 5993. [Google Scholar] [CrossRef]
  25. Mostafavi Kashani, S.M.; Boutorabi, S.M.A. AsCast Acicular Ductile Aluminum Cast Iron. J. Iron Steel Res. Int. 2009, 16, 23–29. [Google Scholar] [CrossRef]
  26. Roučka, J.; Abramová, E.; Kaňa, V. Properties of Type SiMo Ductile Irons at High Temperatures. Arch. Metall. Mater. 2018, 63, 601–607. [Google Scholar] [CrossRef] [PubMed]
  27. Mervat, M.I.; Nofal, A.; Mourad, M.M. Microstructure and Hot Oxidation Resistance of SiMo Ductile Cast Irons Containing Si-Mo-Al. Metall. Mater. Trans. B 2017, 48, 1149–1157. [Google Scholar]
  28. Stawarz, M. SiMo Ductile Iron Crystalization Process. Arch. Foundry Eng. 2017, 17, 147–152. [Google Scholar] [CrossRef]
  29. Magnusson, A.L.; Hartung, C. Solidification of SiMo Nodular cast iron for high temperature applications. Trans Indian Inst. Met. 2012, 65, 633–636. [Google Scholar] [CrossRef]
  30. Tholence, F.; Norell, M. High Temperature Corrosion of Cast Alloys in Exhaust Environments in Ductille Cast Irons. Oxid Met. 2008, 69, 13–36. [Google Scholar] [CrossRef]
  31. Dojka, M.; Dojka, R.; Stawarz, M.; Studnicki, A. Influence of Ti and REE on Primary Crystallization and Wear Resistance of Chromium Cast Iron. J. Mater. Eng. Performace 2019, 28, 4002–4011. [Google Scholar] [CrossRef]
  32. Studnicki, A.; Gromczyk, M.; Kondracki, M.; Suchoń, J.; Szajnar, J. Primary Crystallization Studies and Abrasion Analysis of Cr-Ni-Mo Cast Steel. Arch. Foundry Eng. 2015, 15, 75–80. [Google Scholar] [CrossRef]
  33. Su, C.; Sang, X.; Niu, S. A Comparison of the Abrasive Wear Behaviors of Cast Iron and Cast Steel Materials. J. Mater. Eng. Perform. 2021, 30, 4572–4582. [Google Scholar] [CrossRef]
  34. EN-1563:2018; Founding—Spheroidal Graphite Cast Iron. BSI Standards Publication: London, UK, 2018.
Figure 1. Steel container (bell) containing nodulant and inoculant used in the process of nodularisation of molten metal.
Materials 17 01223 g001
Figure 2. Type 2 Y ingot with marked test sampling areas and dimensions in mm.
Materials 17 01223 g002
Figure 3. Scheme of ferritising annealing procedure that was used for SiMo cast iron carried out at METALPOL Węgierska Górka foundry.
Materials 17 01223 g003
Figure 4. 3-POD tribotester: (a) device operation diagram; (b) view of working system (research samples–counter sample).
Materials 17 01223 g004
Figure 5. Simulation results for cast iron without addition of Cr and Al.
Materials 17 01223 g005
Figure 6. Simulation results for cast iron with addition of 1% Cr and 2% Al.
Materials 17 01223 g006
Figure 7. Simulation results for cast iron with addition of 3% Cr and 4% Al.
Materials 17 01223 g007
Figure 8. Microstructure of sample 0: (a) optical microscope: unetched, magnification 25×; (b) etched with nital, phases: light—ferrite, dark brown—perlite, black with a round shape—graphite, magnification 200×.
Materials 17 01223 g008
Figure 9. Microstructure of sample A, optical microscope: unetched, magnification 25× (a); etched with nital, phases: light—ferrite, shades of grey—carbides, black—graphite, magnification 200× (b).
Materials 17 01223 g009
Figure 10. EDS maps of sample A, indicating concentrations of (a) chromium, (b) iron, (c) molybdenum, and (d) manganese; (e,f) HAADF imaging (transmission microscope).
Materials 17 01223 g010
Figure 11. Microstructure of sample B, optical microscope: (a) unetched, magnification 25×; (b) etched with nital, phases: light—ferrite, shades of grey—carbides, black—graphite, magnification 200× (b).
Materials 17 01223 g011
Figure 12. Microstructure of sample B, etched with nital, magnification 2000× (SEM), 1 and 2—metal matrix, 3, 4 and 6—carbides, 5—molybdenum carbide precipitates.
Materials 17 01223 g012
Figure 13. EDS maps of Sample B, indicating concentrations of (a) chromium, (b) iron, (c) molybdenum, (d) manganese, and (e) aluminium; (f) HAADF imaging (transmission microscope).
Materials 17 01223 g013
Figure 14. Microstructure of Sample C, optical microscope: (a) unetched, magnification 25×; (b) etched with nital, phases: light—ferrite, shades of grey—carbides, black—graphite, magnification 200× (b).
Materials 17 01223 g014
Figure 15. Sample C etched with nital, magnification 2000× (SEM), 1 and 2—metal matrix, 3 and 4—carbides, 5 and 6—molybdenum carbide precipitates.
Materials 17 01223 g015
Figure 16. EDS maps of sample C, indicating concentrations of (a) chromium, (b) iron, (c) molybdenum, (d) manganese, and (e) aluminium; (f) HAADF imaging (transmission microscope).
Materials 17 01223 g016
Figure 17. Microstructure of sample D, optical microscope: (a) unetched, magnification 25×; (b) etched with nital, phases: light—ferrite, shades of grey—carbides, black—graphite, magnification 200× (b).
Materials 17 01223 g017
Figure 18. EDS maps of sample D, indicating concentrations of (a) chromium, (b) iron, (c) molybdenum, (d) manganese, and (e) aluminium; (f) HAADF imaging (transmission microscope).
Materials 17 01223 g018
Figure 19. Abrasive wear of tested samples as function of abrasion path with sample load of 230 G.
Materials 17 01223 g019
Figure 20. Abrasive wear of tested samples as function of abrasion path with sample load of 300 G.
Materials 17 01223 g020
Figure 21. Abrasive wear of tested samples as function of abrasion path with sample load of 380 G.
Materials 17 01223 g021
Figure 22. Effect of sample load on abrasive wear.
Materials 17 01223 g022
Figure 23. Relative resistance R to abrasive wear of tested samples (Reference Sample 0).
Materials 17 01223 g023
Table 1. Chemical composition of charge materials used during cast iron melting.
Charge MaterialCSiMnPSMoCrAlFe
wt.%
Foundry pig iron4.440.810.020.0250.009---rest
W3 silicon steel scrap0.021.600.370.0740.01---rest
W3 manganese steel scrap0.250.250.400.0090.02---rest
Cast iron scrap3.502.600.350.0350.004---rest
FeSi0.1275.21-0.0170.004---rest
FeMo0.200.30---68.0--rest
FeCr------65.0-rest
Al-------100.0rest
Carburizer 990499.59---0.020---
Table 2. Chemical composition of Zircinoc inoculant.
InoculantSiZrCaAl
%mas.
Zircinoc73.0–78.01.3–1.82.0–2.51.0–1.5
Table 3. Chemical composition of tested cast iron.
Melts Chemical Composition, % mas.
CCrCuMgMnPSSiTiMoAlFe
03.560.0160.1760.0370.4160.0330.0092.7410.011-0.006rest
A2.670.0990.0950.0310.3840.0210.0085.560.0190.810.023rest
B2.662.180.1150.0470.4750.0450.0125.910.0241.193.41rest
C2.600.970.1260.0340.4550.0470.0135.610.0201.021.66rest
D3.130.0920.1080.0380.4610.0320.0075.270.0200.781.48rest
Table 4. Chemical compositions of carbide phases calculated by Thermo-Calc program.
Phase Chemical Composition, % mas.
CSiMoMgCrFe
M6C3.215.151.6--rest
M3C213.3---86.6rest
Table 5. Quantitative EDS analysis of Area 5 of Sample B.
Chemical Composition
% mas.
CMgAlSiPSTiCrMnFeMo
10.9670.1220.8904.3390.0000.0000.1449.3760.59866.0367.529
Table 6. Quantitative EDS analysis of Point 6 of Sample B.
Chemical Composition
% mas.
CMgAlSiPSTiCrMnFeMo
19.7910.2291.6124.9170.0700.8880.0005.2190.14466.4310.699
Table 7. Quantitative EDS analysis from Point 4 of Sample C.
Chemical Composition
% mas.
CMgAlSiPSTiCrMnFeMo
15.3580.0910.7064.6260.0650.0000.2912.7880.14674.6971.233
Table 8. Quantitative EDS analysis from Area 5 of Sample C.
Chemical Composition
% mas.
CMgAlSiPSTiCrMnFeMo
6.2210.1381.7395.8280.0000.4410.0470.6930.25083.4841.160
Table 9. Characteristics of structures of tested samples.
Sample0ABCD
Metal matrixFerritic-pearliticFerriticFerriticFerriticFerritic
Graphite precipitationNodular graphite
(>90%)
Nodular graphite
(>75%)
Nodular graphite (approx. 50%) Nodular graphite (approx. 25%) + compacted graphite (approx. 75%)Nodular graphite (approx. 10%) + compacted graphite (approx. 70%)
Carbides-M6C carbides at grain boundariesM3C2 carbides and MC at grain boundariesM6C carbides and MC at grain boundariesM6C carbides and MC at grain boundaries
Table 10. Abrasive wear test results (total abrasive wear and resistance R) and Vickers hardness.
SetSampleHardness
HV
Sample Load, G Sample Load, G
230 300 380 230300380
Total Abrasive Wear, gRelative Resistance, R
101971.0101.4031.8951.001.001.00
B4120.4650.6580.7882.172.132.40
2C3551.0131.2032.1431.001.170.88
D3620.8481.0581.3751.191.331.38
A2501.1321.3811.7630.891.021.08
Disclaimer/Publisher’s Note: The statements, opinions and data contained in all publications are solely those of the individual author(s) and contributor(s) and not of MDPI and/or the editor(s). MDPI and/or the editor(s) disclaim responsibility for any injury to people or property resulting from any ideas, methods, instructions or products referred to in the content.