1. Introduction
Since their inception, reinforced concrete (RC) structures have been extensively utilized across various engineering domains, including buildings, roads, bridges, tunnels, and water conservancy projects. They are fundamental engineering materials. However, RC structures are susceptible to durability issues during extended utilization. Steel-bar corrosion is the most prevalent and severe concern of durability problems in RC structures [
1,
2,
3]. The hazards associated with steel-bar corrosion encompass several critical aspects. (1) The decreases in bond strength between the concrete and steel and the decline in the effective cross-sectional area of the steel bars lead to a decrease in the load-bearing capacity of the structural components. (2) The rust volume expansion exceeds that of the original steel (often reaching two–six times its initial size) [
4,
5], resulting in concrete cover cracking and a subsequent reduction in the component’s stiffness and integrity. (3) The decreased ductility and alterations in failure modes collectively affect safety, applicability, and RC structural durability.
Before the 1990s, China constructed numerous RC bridges in the coastal regions to foster economic development. These bridges have experienced severe steel corrosion issues after a decade or two of service [
6]. Among these bridges, a considerable portion exhibits a reduced bearing capacity, posing a substantial threat to road safety. The prospect of demolishing and reconstructing these bridges presents several drawbacks, including the generation of waste that is difficult to recycle and exacerbation of the existing tension between economic development and resource, energy, and environmental conservation [
7]. In comparison, reinforcing bridges that exhibit early signs of corrosion is a more rational alternative.
Fiber-reinforced polymer (FRP) materials have been employed for enhancing corroded RC structures, owing to their notable advantages, including lightweight composition, ease of installation, high tensile strength, and robust resistance against corrosion. Research findings have indicated that FRP can effectively redistribute the tensile stress in corroded steel bars, improving the load-bearing capacity of deteriorated structures. Concurrently, adding an FRP layer, particularly when augmented with U-shaped hoop restraints at its extremities, significantly promotes the stiffness of the structure by effectively restraining deteriorated concrete [
8,
9,
10,
11]. Nevertheless, the prevalent utilization of organic materials, such as epoxy resin, as bonding agents in FRP systems presents certain limitations. These shortcomings include inadequate high-temperature resistance, suboptimal compatibility with concrete substrates, and challenges associated with their application on damp structural surfaces [
12,
13,
14,
15].
Recently, textile-reinforced concrete (TRC) has emerged as a promising alternative to FRP. TRC consists of one or more layers of textiles embedded in a high-performance cementitious mortar. These textiles may be composed of carbon, glass, basalt, or polypropylene benzobisoxazole (PBO) fibers. TRC has outstanding properties, including high tensile strength, lightweight composition, and resistance to corrosion. TRC also exhibits good durability. For example, the study of Verre and Sheng showed that FRCM (fiber-reinforced cementitious matrix is another name of TRC) exhibited excellent resistance to alkaline, hot water, and freeze-thawing environments [
16,
17]. Moreover, TRC is compatible with existing concrete and masonry structures, rendering it straightforward to install [
18,
19,
20,
21]. Franzoni et al. [
22] performed direct shear tests on FRCM-masonry joints after capillary water absorption and salt crystallization cycles. The results show that FRCM-masonry joints exhibited excellency due to the permeable matrix that did not hinder the migration of the saline solution. Numerous studies have investigated the mechanical properties of RC structures reinforced with TRC, demonstrating its feasibility in enhancing the performance of RC structures. For instance, Yin et al. [
23,
24,
25] conducted an extensive series of studies on TRC reinforcement for RC beams and columns, revealing that TRC can effectively augment the ultimate bearing capacity of these elements. Notably, this enhancement increased as the number of textile layers increased. Furthermore, TRC significantly improved the distribution pattern of bending cracks in the specimens, characterized by their fine and dense nature. Schladitz et al. [
26] identified a remarkable rise in the load-bearing capacity of RC slabs that were enhanced with one and four layers of FRCM, recognized as an alternative to TRC. Specifically, the load-bearing capacity improved by 67% with one layer and 245% with four layers of FRCM. Additionally, the application of a four-layer FRCM system led to a notable reduction in slab deflection.
However, limited research has focused on the flexural behavior of TRC used to strengthen corroded RC beams. Bressan et al. [
27] and El Maddawy et al. [
28] explored the flexural behavior of FRCM strengthening in corrosion-damaged RC beams. Their findings indicated a significant enhancement in both the yield and ultimate capacity of corrosion-damaged specimens following FRCM strengthening. Specifically, the applications of C-FRCM (Carbon-FRCM) and PBO-FRCM successfully restored and even surpassed the ultimate load-bearing capacity of the non-corroded control specimens. The failure mode was ductile. Similarly, Elghazy et al. [
29,
30,
31] conducted research on the flexural behavior of corroded RC beams strengthened with FRCM, adopting a single-sided reinforcement method. The experimental results demonstrated that FRCM could enhance the yield strength of corroded beams by 6% to 22% and the ultimate strength by 5% to 52%. Notably, despite the anchoring measures implemented at both ends of the reinforcement area, there were instances of FRCM delamination during loading, hindering the full realization of its potential.
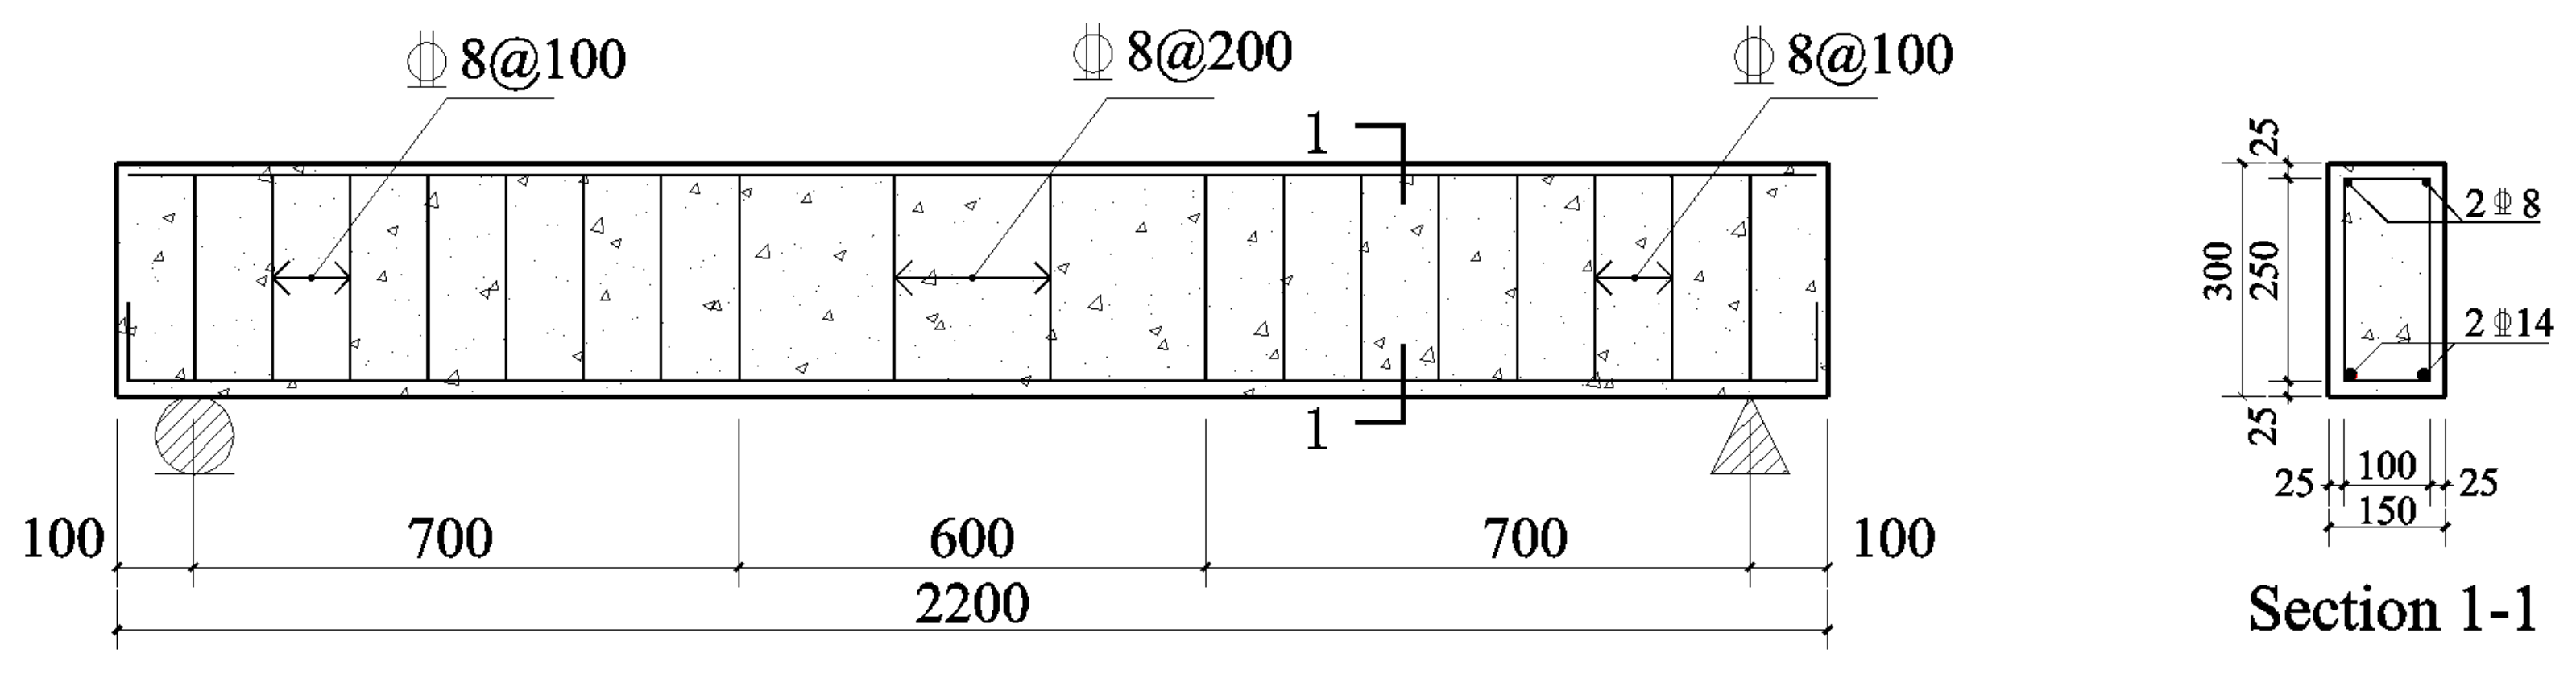
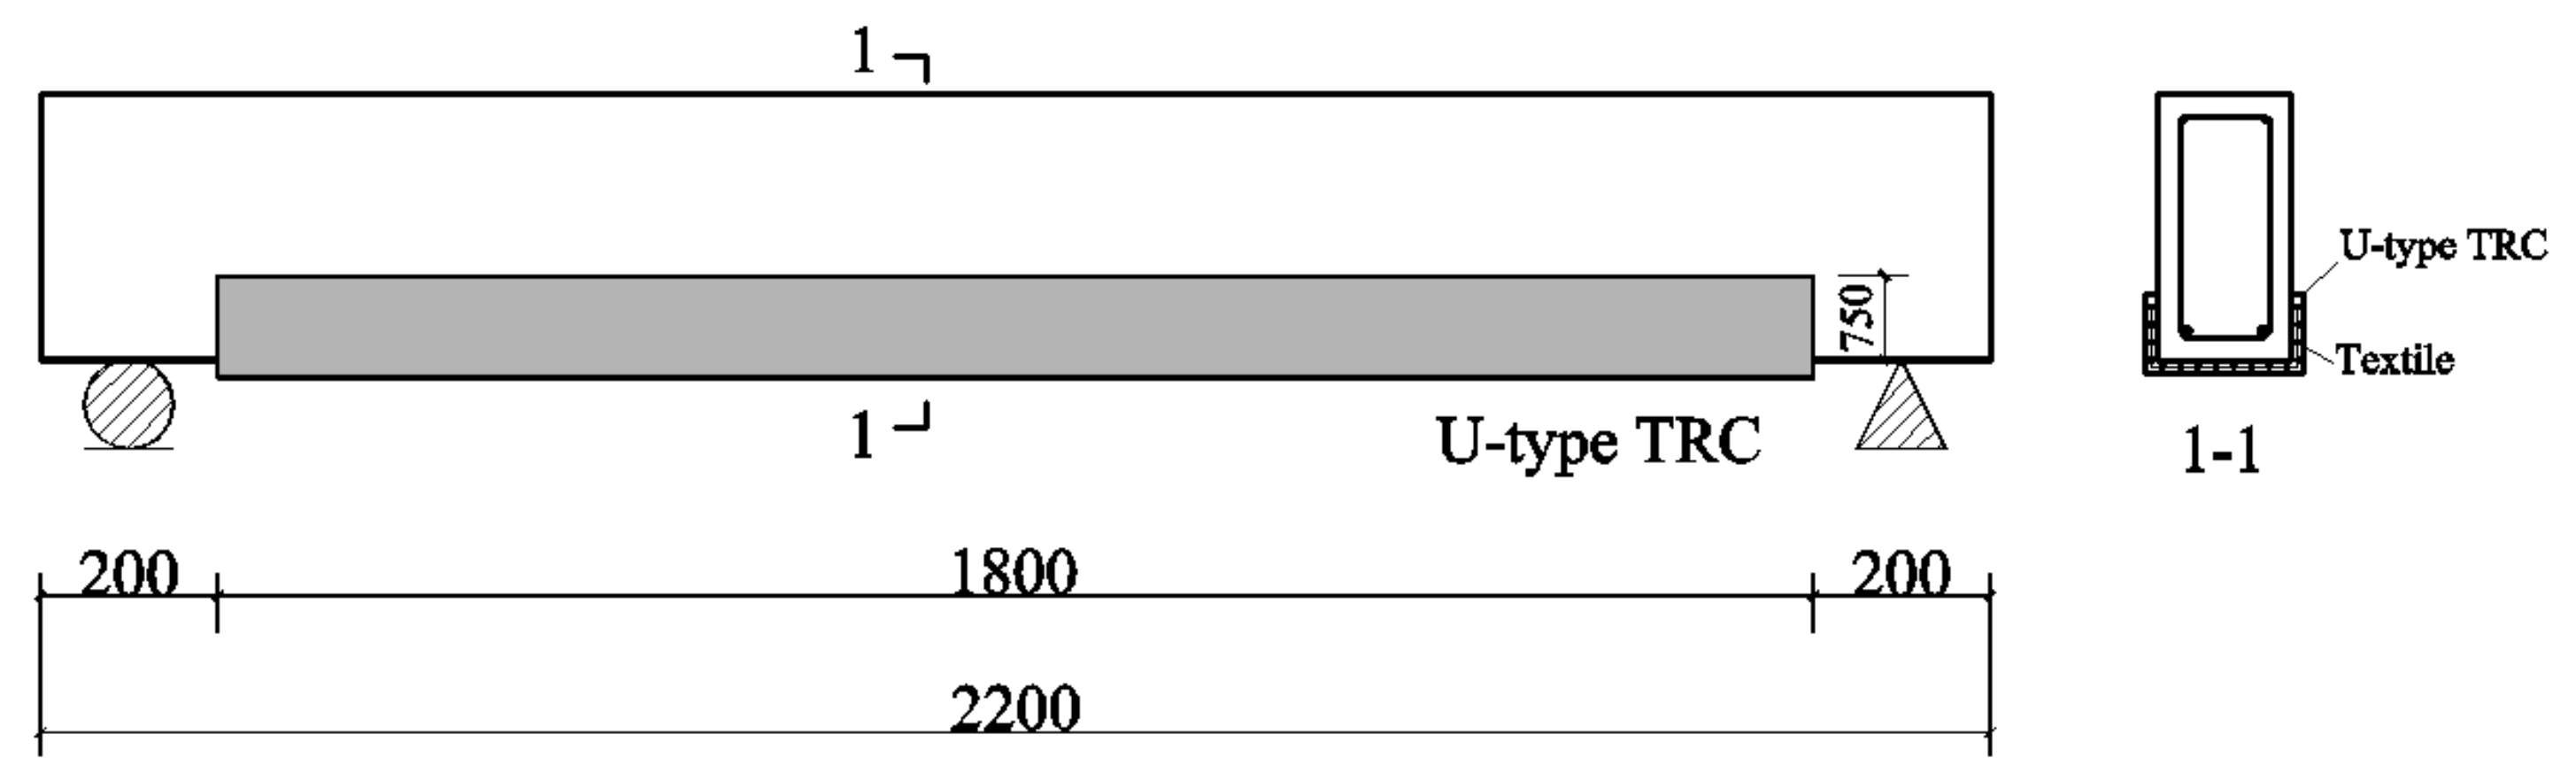
To further investigate the flexural bearing performance of TRC in enhancing corroded RC beams and explore methods to avoid TRC delamination during loading, this study employs a continuous U-type TRC for the reinforcement of such beams. In this study, nine test beams were proposed: one reference beam that remained free from corrosion and reinforcement, three beams subjected to corrosion alone, and five beams reinforced with TRC following corrosion. The parameters encompassed the corrosion degree and number of textile layers. Comprehensive analyses were conducted to evaluate the ductility performance, load–displacement curves, bearing capacity, and failure modes. An equation for quantifying the flexural bearing capacity of a U-type TRC in reinforcing corroded RC beams was established.
3. Results
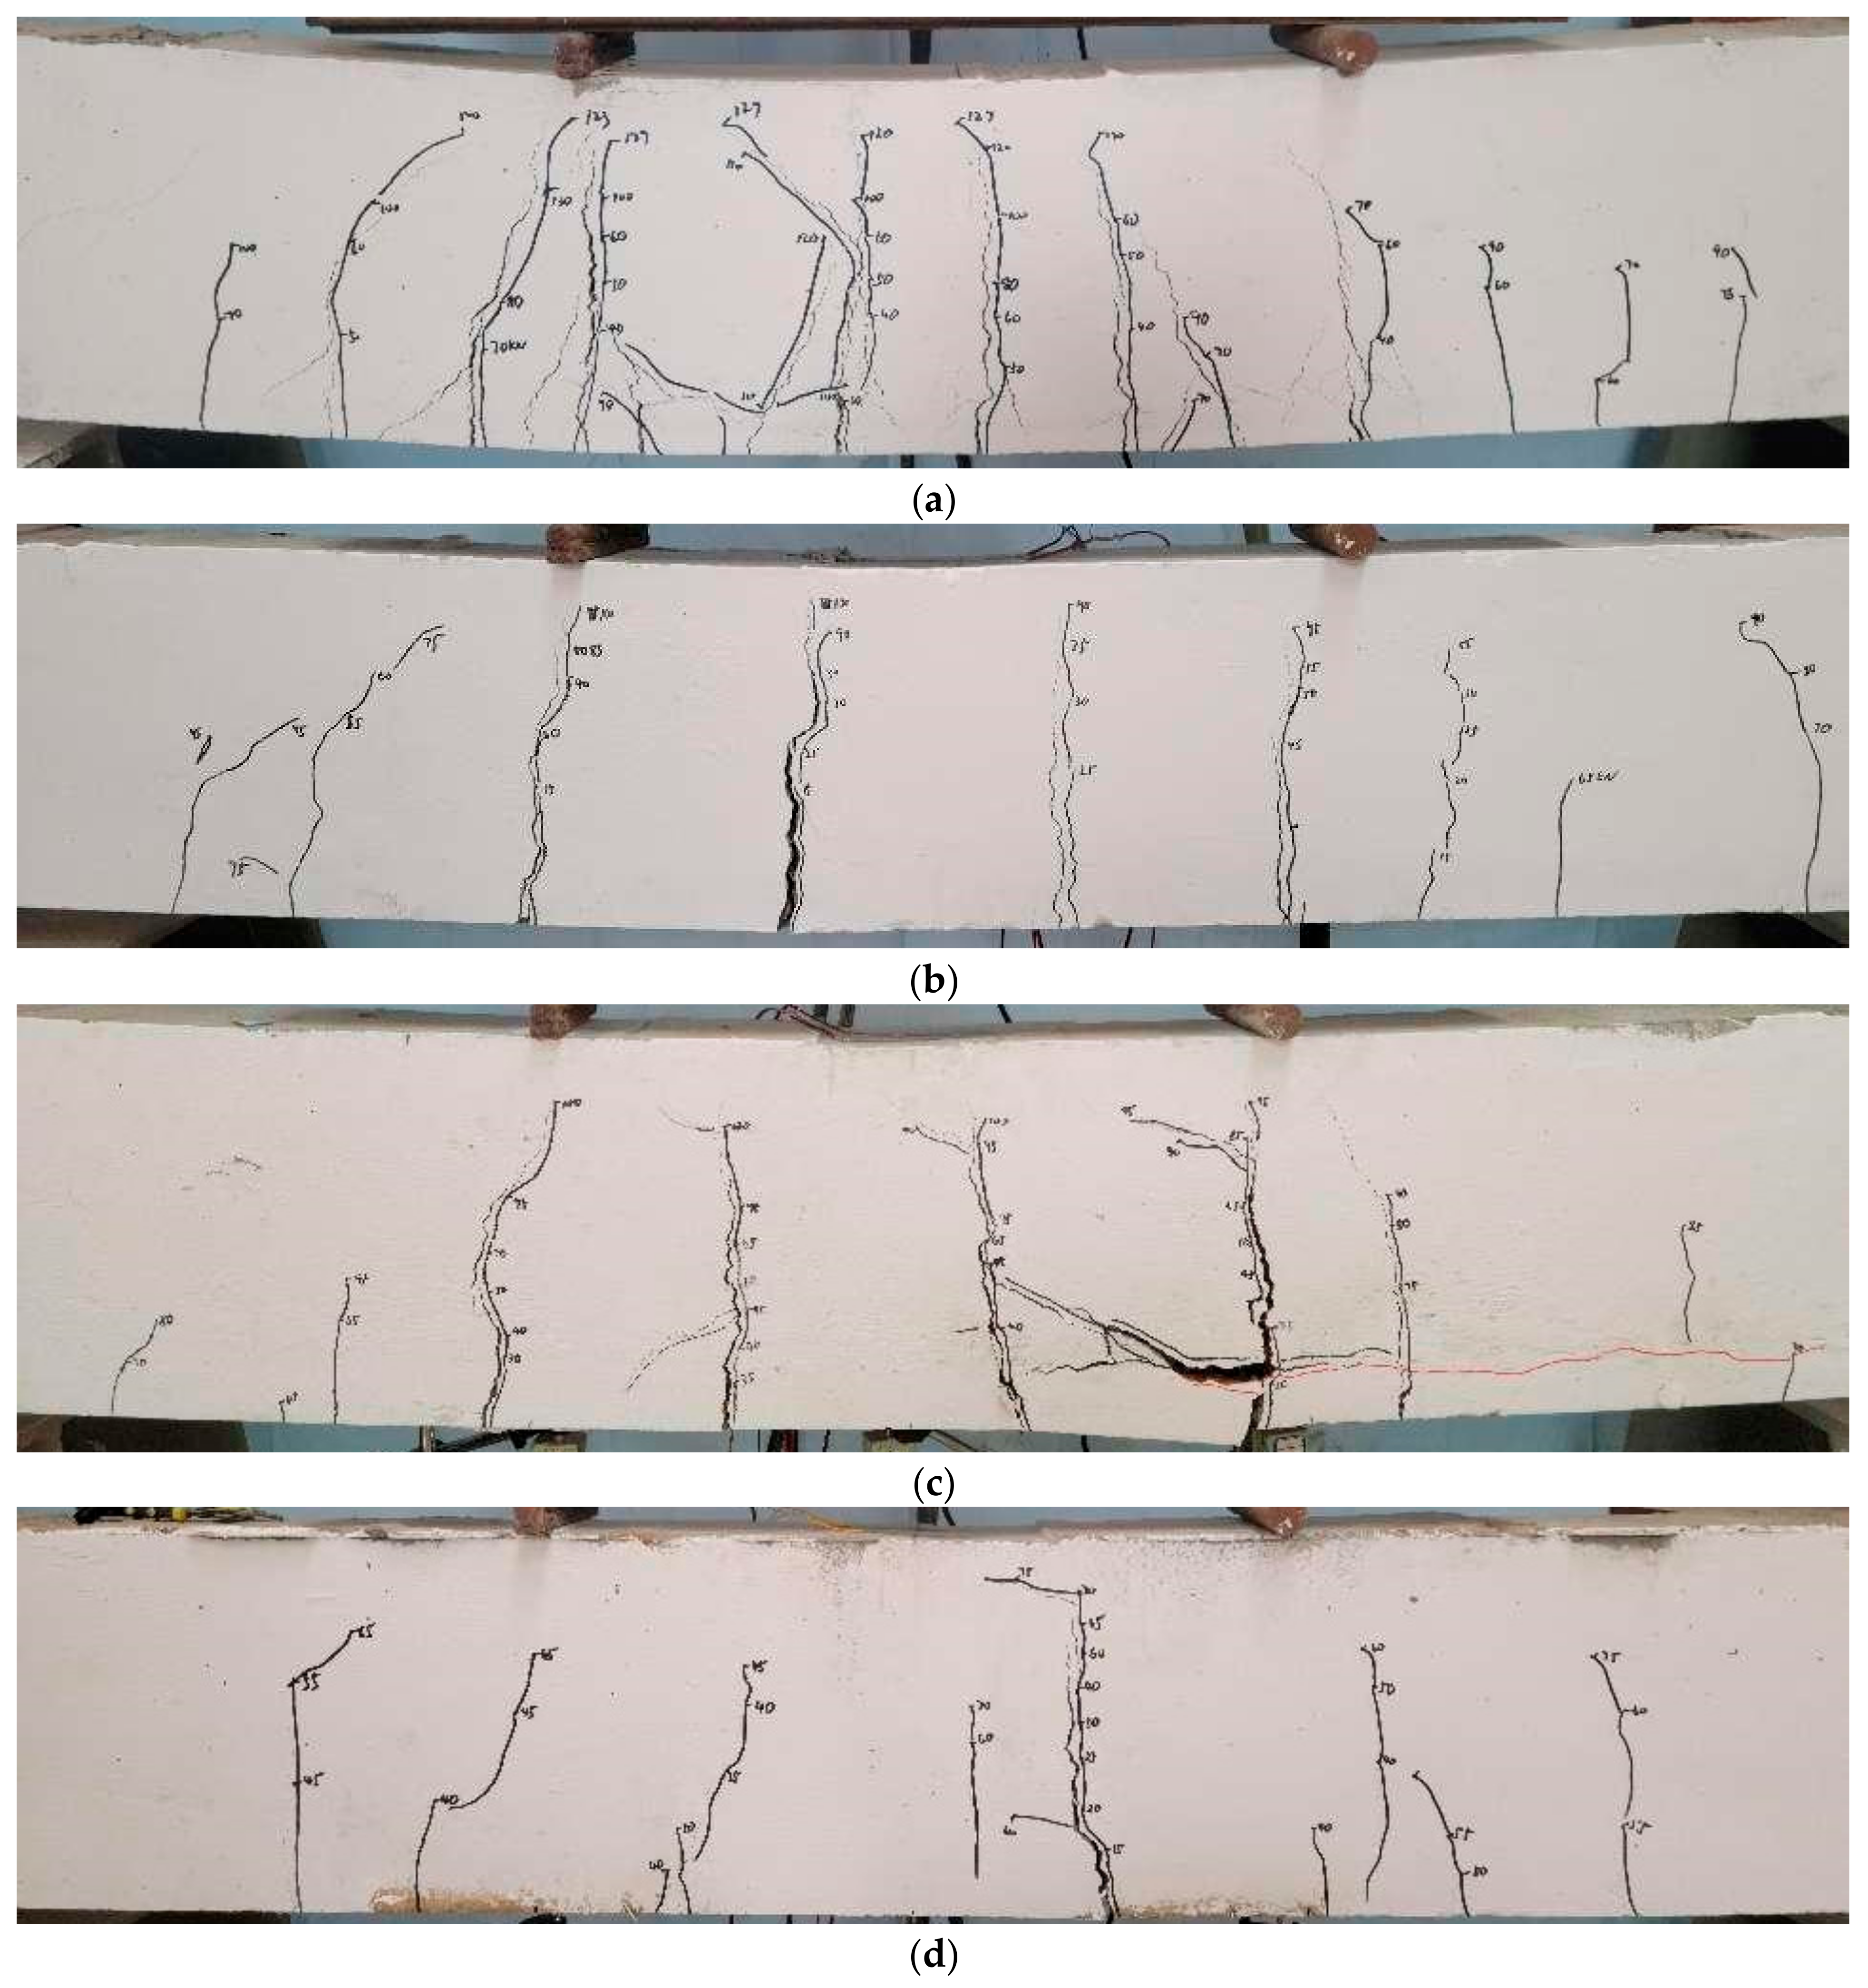
3.1. Failure Mode
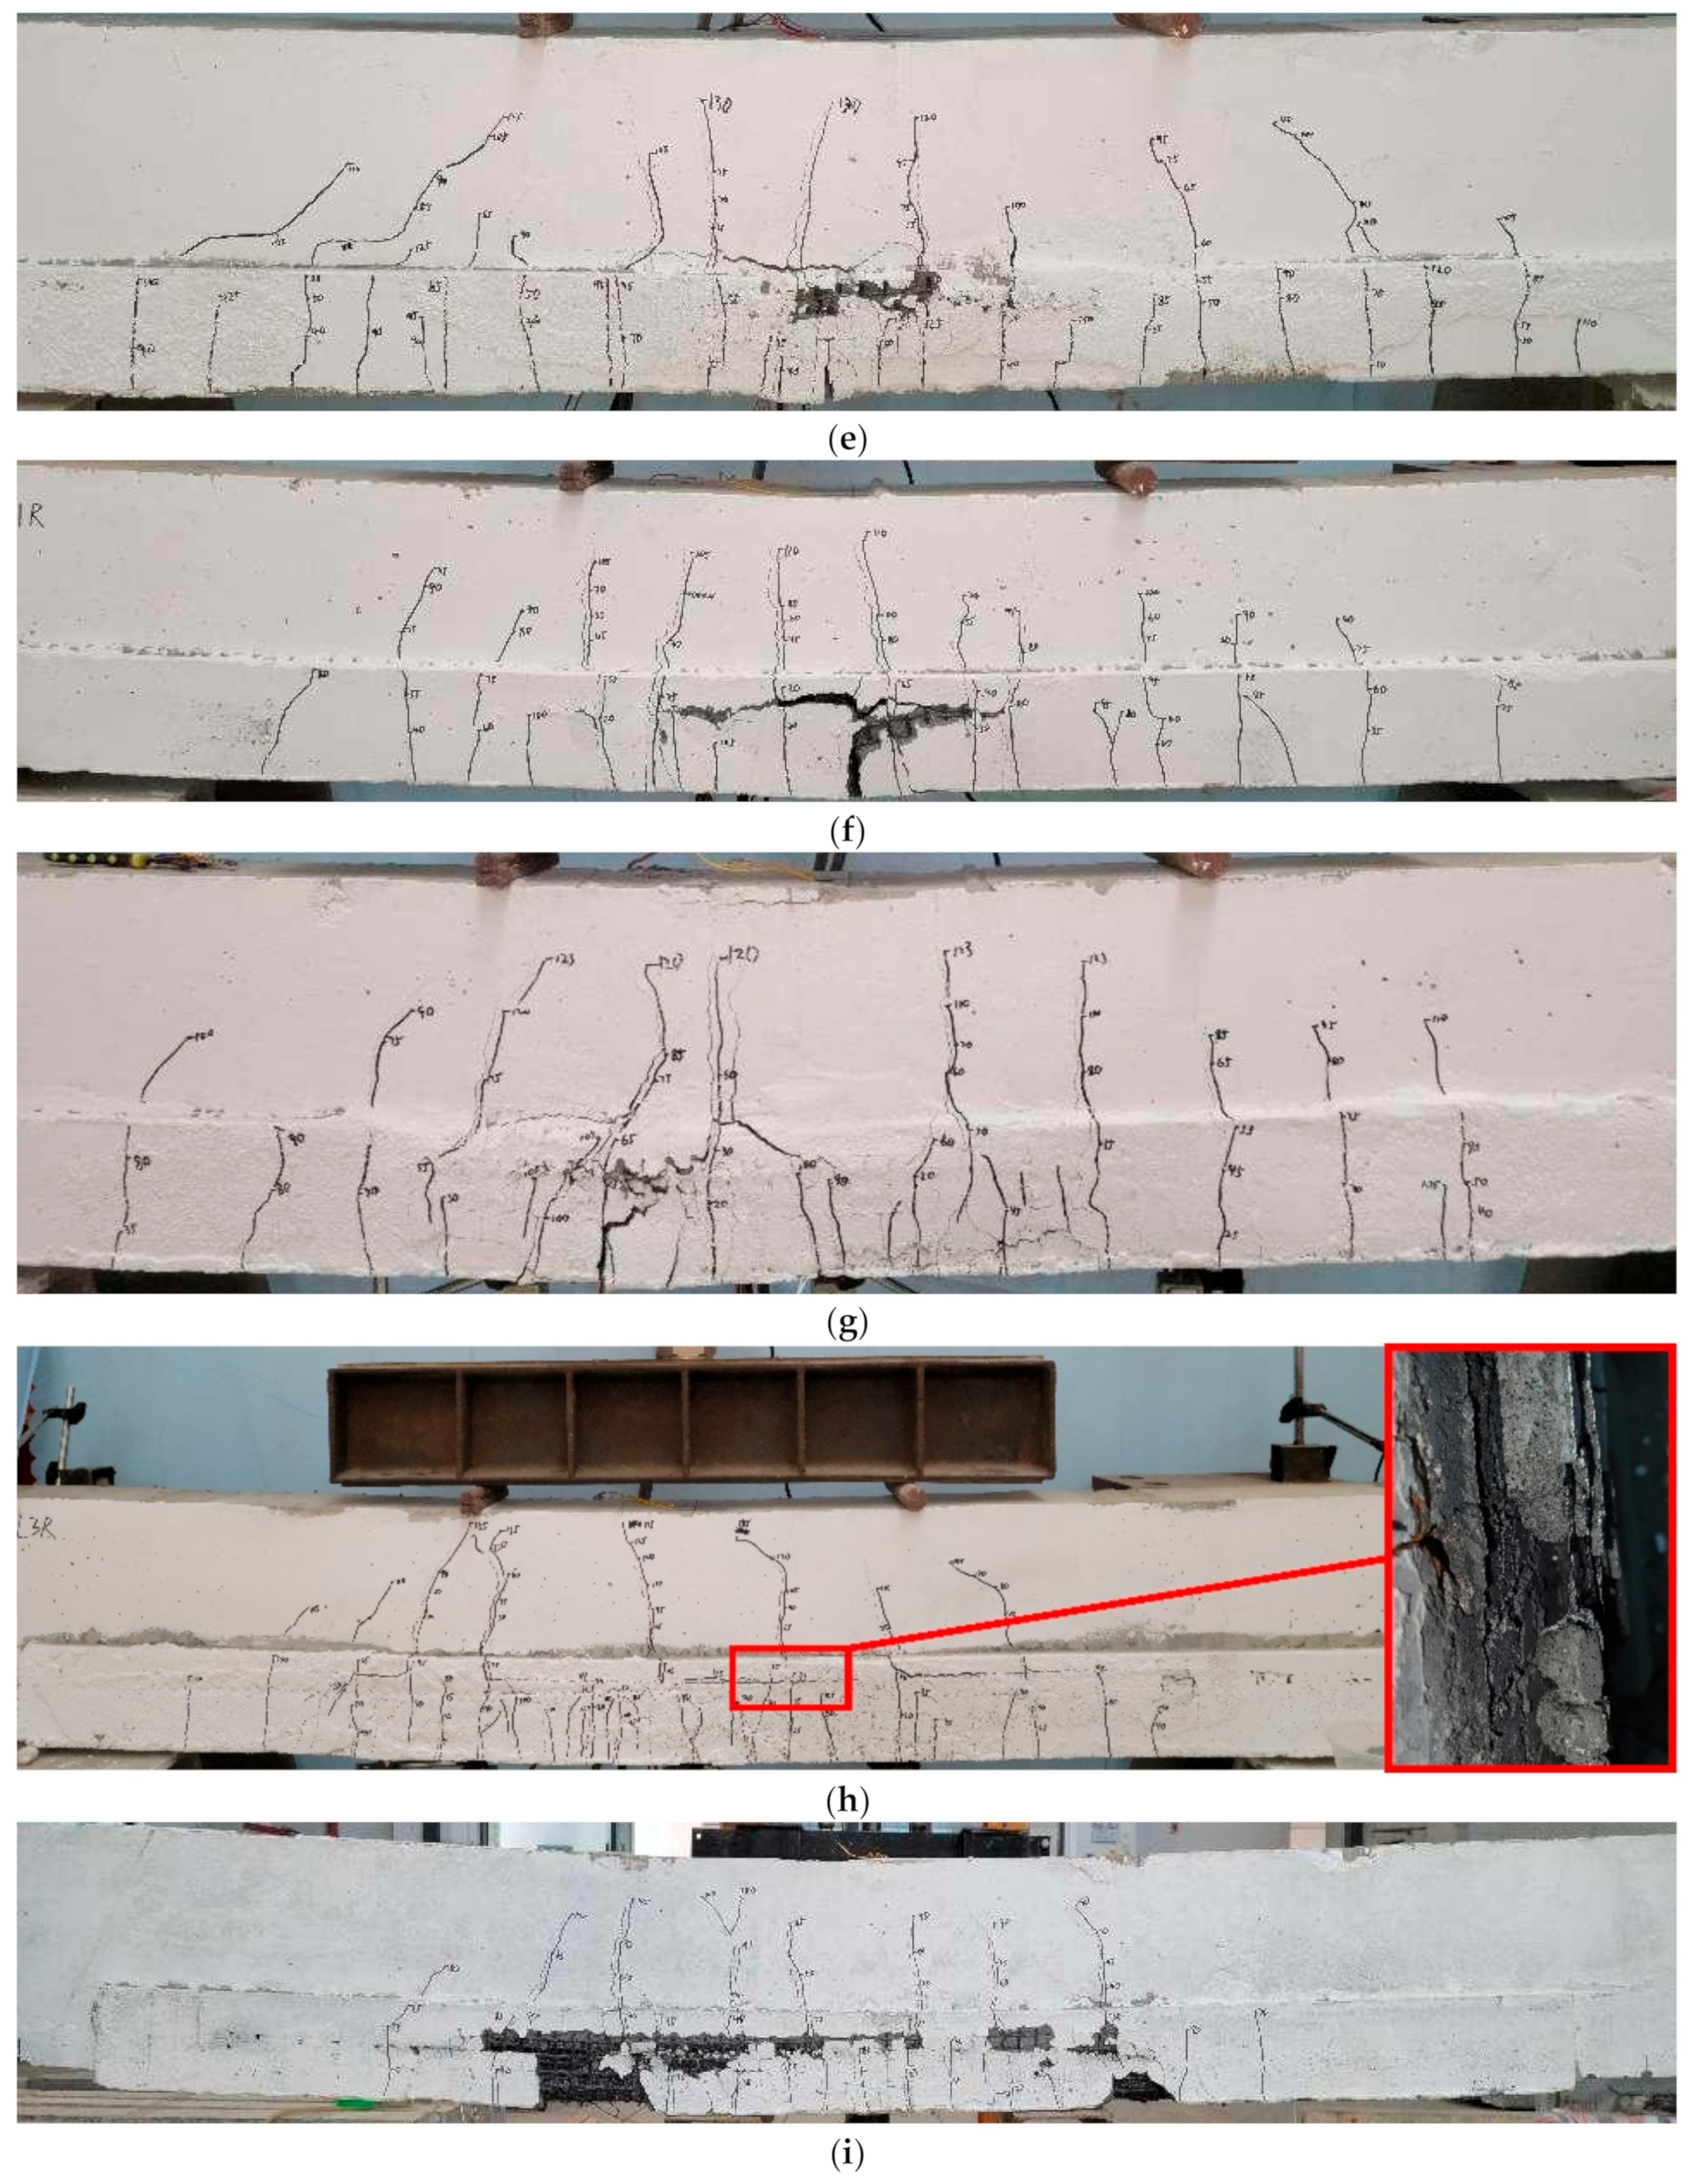
The ultimate failure modes of each specimen are shown in
Figure 7. In the case of the corrosion-only beams (M-5, M-10, M-15) and original beam (M-0), a bending failure mode was observed, where the tensile steel bars yield initially, followed by subsequent concrete crushing within the compression zone. The failure characteristics of corroded RC beams, where TRC was strengthened, were summarized as follows: the tensile steel bars yielded first, followed by failure of the textile layer, and ultimately, concrete crushing within the compression zone. Nevertheless, TRC exhibited varying failure modes categorized as follows:
The first type of failure resembled the bending failure observed in RC beams. This mode of failure was evident in three beams, namely, M-5-L2, M-10-L1, and M-10-L2. As the load intensified following the yielding of steel bars, there was an audible indication of certain fiber bundles undergoing tension, indicating an uneven stress distribution within the fiber bundles. As the load increased further, the rest of the fiber bundles were unable to resist external forces and underwent sudden separation. Owing to the internal force redistribution, an abrupt surge in the compressive stress emerged within the concrete located in the compression zone, causing its crushing.
The second type of damage involved the delamination between the textile and its matrix. This destructive process commenced with obtaining the tensile steel bars, followed by the debonding of the textile from its matrix. Consequently, the reinforced beam was unable to sustain the load, with the compression zone concrete being crushed. In the case of the damaged strengthened beam, only a portion of the fiber bundles was pulled apart. Specifically, this damage occurred in specimens M-10-L3 due to the proximity of the textile.
The third type of damage involved a fiber bundle slip, coupled with matrix detachment. Specimen M-15-L2 exhibited this type of damage. After reaching the yield point, the beam experienced slippage between the fiber bundles and the matrix. With the continued increase in load, matrix detachment became more pronounced, followed by a loss of load-bearing capacity. This occurrence was attributed to the relatively short curing time of the TRC layer in this beam, causing a weaker bonding performance between the matrix and textile, in contrast to the other beams.
3.2. Bearing Capacity Analysis
Table 5 presents the ultimate load and yield data for test beams. As shown in
Table 5, the yield loads for test beams M-15, M-10, and M-5 experienced reductions of 41.03%, 20.51%, and 12.54%, respectively, compared to the original beam M-0. Correspondingly, the ultimate loads decreased by 10.33%, 18.82%, and 33.55%, respectively. This demonstrates the notable impact of tensile steel bar corrosion on the load-bearing capacity of RC beams, with a more pronounced reduction occurring as the corrosion degree escalates.
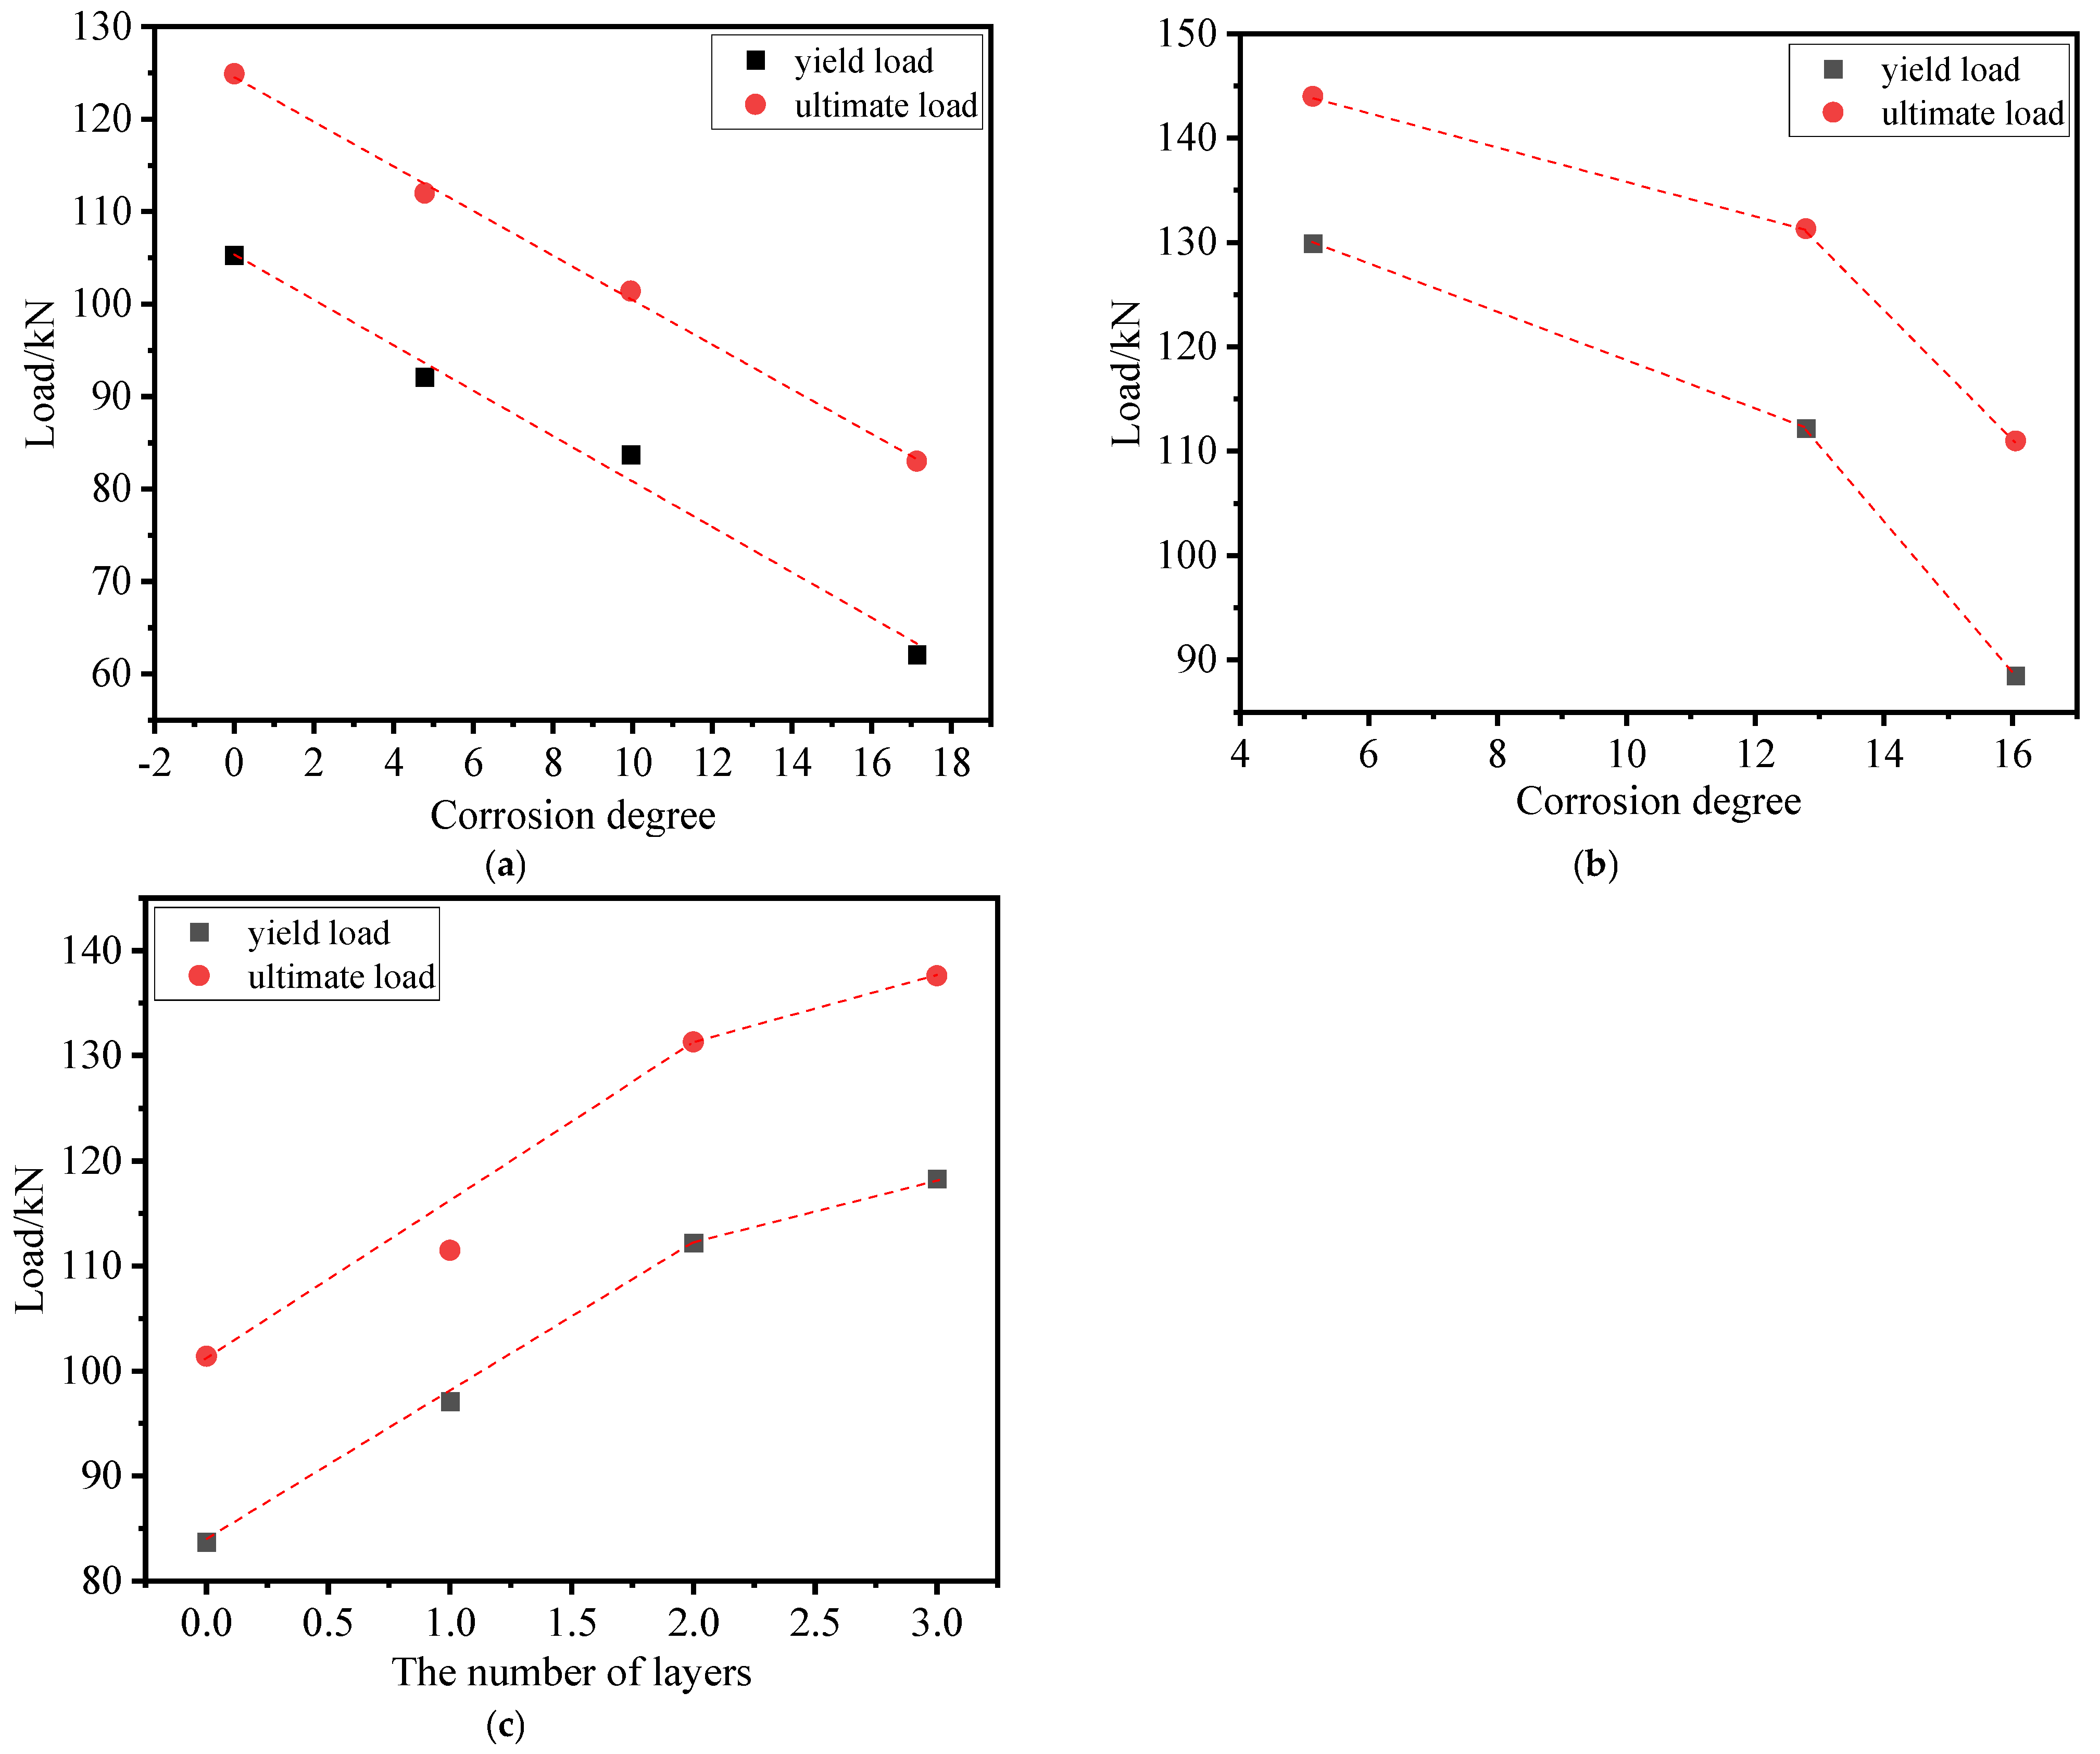
Figure 8a illustrates the relationship among corrosion degree, ultimate load, and the yield load in corrosion-only beams, indicating that the ultimate and yield loads of the corrosion-only beam exhibited an approximately linear correlation with increasing corrosion degree. This behavior was attributed to the uniform corrosion of the steel bars induced by the electrification corrosion method.
According to the data in
Table 5, specimens M-15-L2, M-10-L2, and M-5-L2 exhibited yield loads of 88.5 kN, 112.2 kN, and 129.9 kN, respectively. These values represent 143%, 134%, and 141% of the corresponding yield loads in corrosion-only beams, respectively. Furthermore, the ultimate loads for specimens M-15-L2, M-10-L2, and M-5-L2 were 111 kN, 131.3 kN, and 144 kN, respectively, reaching 134%, 129%, and 128% of the ultimate loads in the corresponding corrosion-only specimens. This observation underscores the significant enhancement in both the yield and ultimate load capacities when TRC is introduced. This improvement stems from the transfer of a portion of the tensile stress initially carried by the steel bars to the textile, compensating for the reduced load-bearing capacity owing to the steel bar cross-sectional area loss.
Figure 8b depicts the relationship between the corrosion degree, ultimate load, and yield load for M-5-L2, M-10-L2, and M-15-L2. A nonlinear association existed between the corrosion degree, ultimate load, and yield load of these specimens. Specifically, the ultimate bearing capacity of specimen M-5-L2 increased by 28.57% when compared to M-5, whereas M-10-L2 and M-15-L2 exhibited increases of 29.49% and 33.74%, respectively, compared to M-10 and M-15. This suggests that the effectiveness of the TRC system in repairing beams with more severe corrosion was more pronounced.
Table 5 displays the yield loads for M-10-L1, M-10-L2, and M-10-L3 as 97.1 kN, 112.2 kN, and 118.3 kN, respectively, along with ultimate loads of 111.5 kN, 131.3 kN, and 137.6 kN. An increased number of textile layers correlated with high and ultimate loads.
Figure 8c illustrates that when the amount of textile layers was less than or equal to two, the ultimate and yield loads exhibited a linear increase with the addition of textile layers. However, when the textile layer count exceeded two, a nonlinear relationship emerged between the yield load, ultimate load, and number of textile layers. This was attributed to two factors: a decrease in the utilization rate of the textile with the increase in the number of layers and the impacts of different failure modes. For instance, M-10-L3 experienced delamination failure in the strengthening layer, whereas M-10-L1 and M-10-L2 exhibited bending failures.
3.3. Load–Displacement Curve
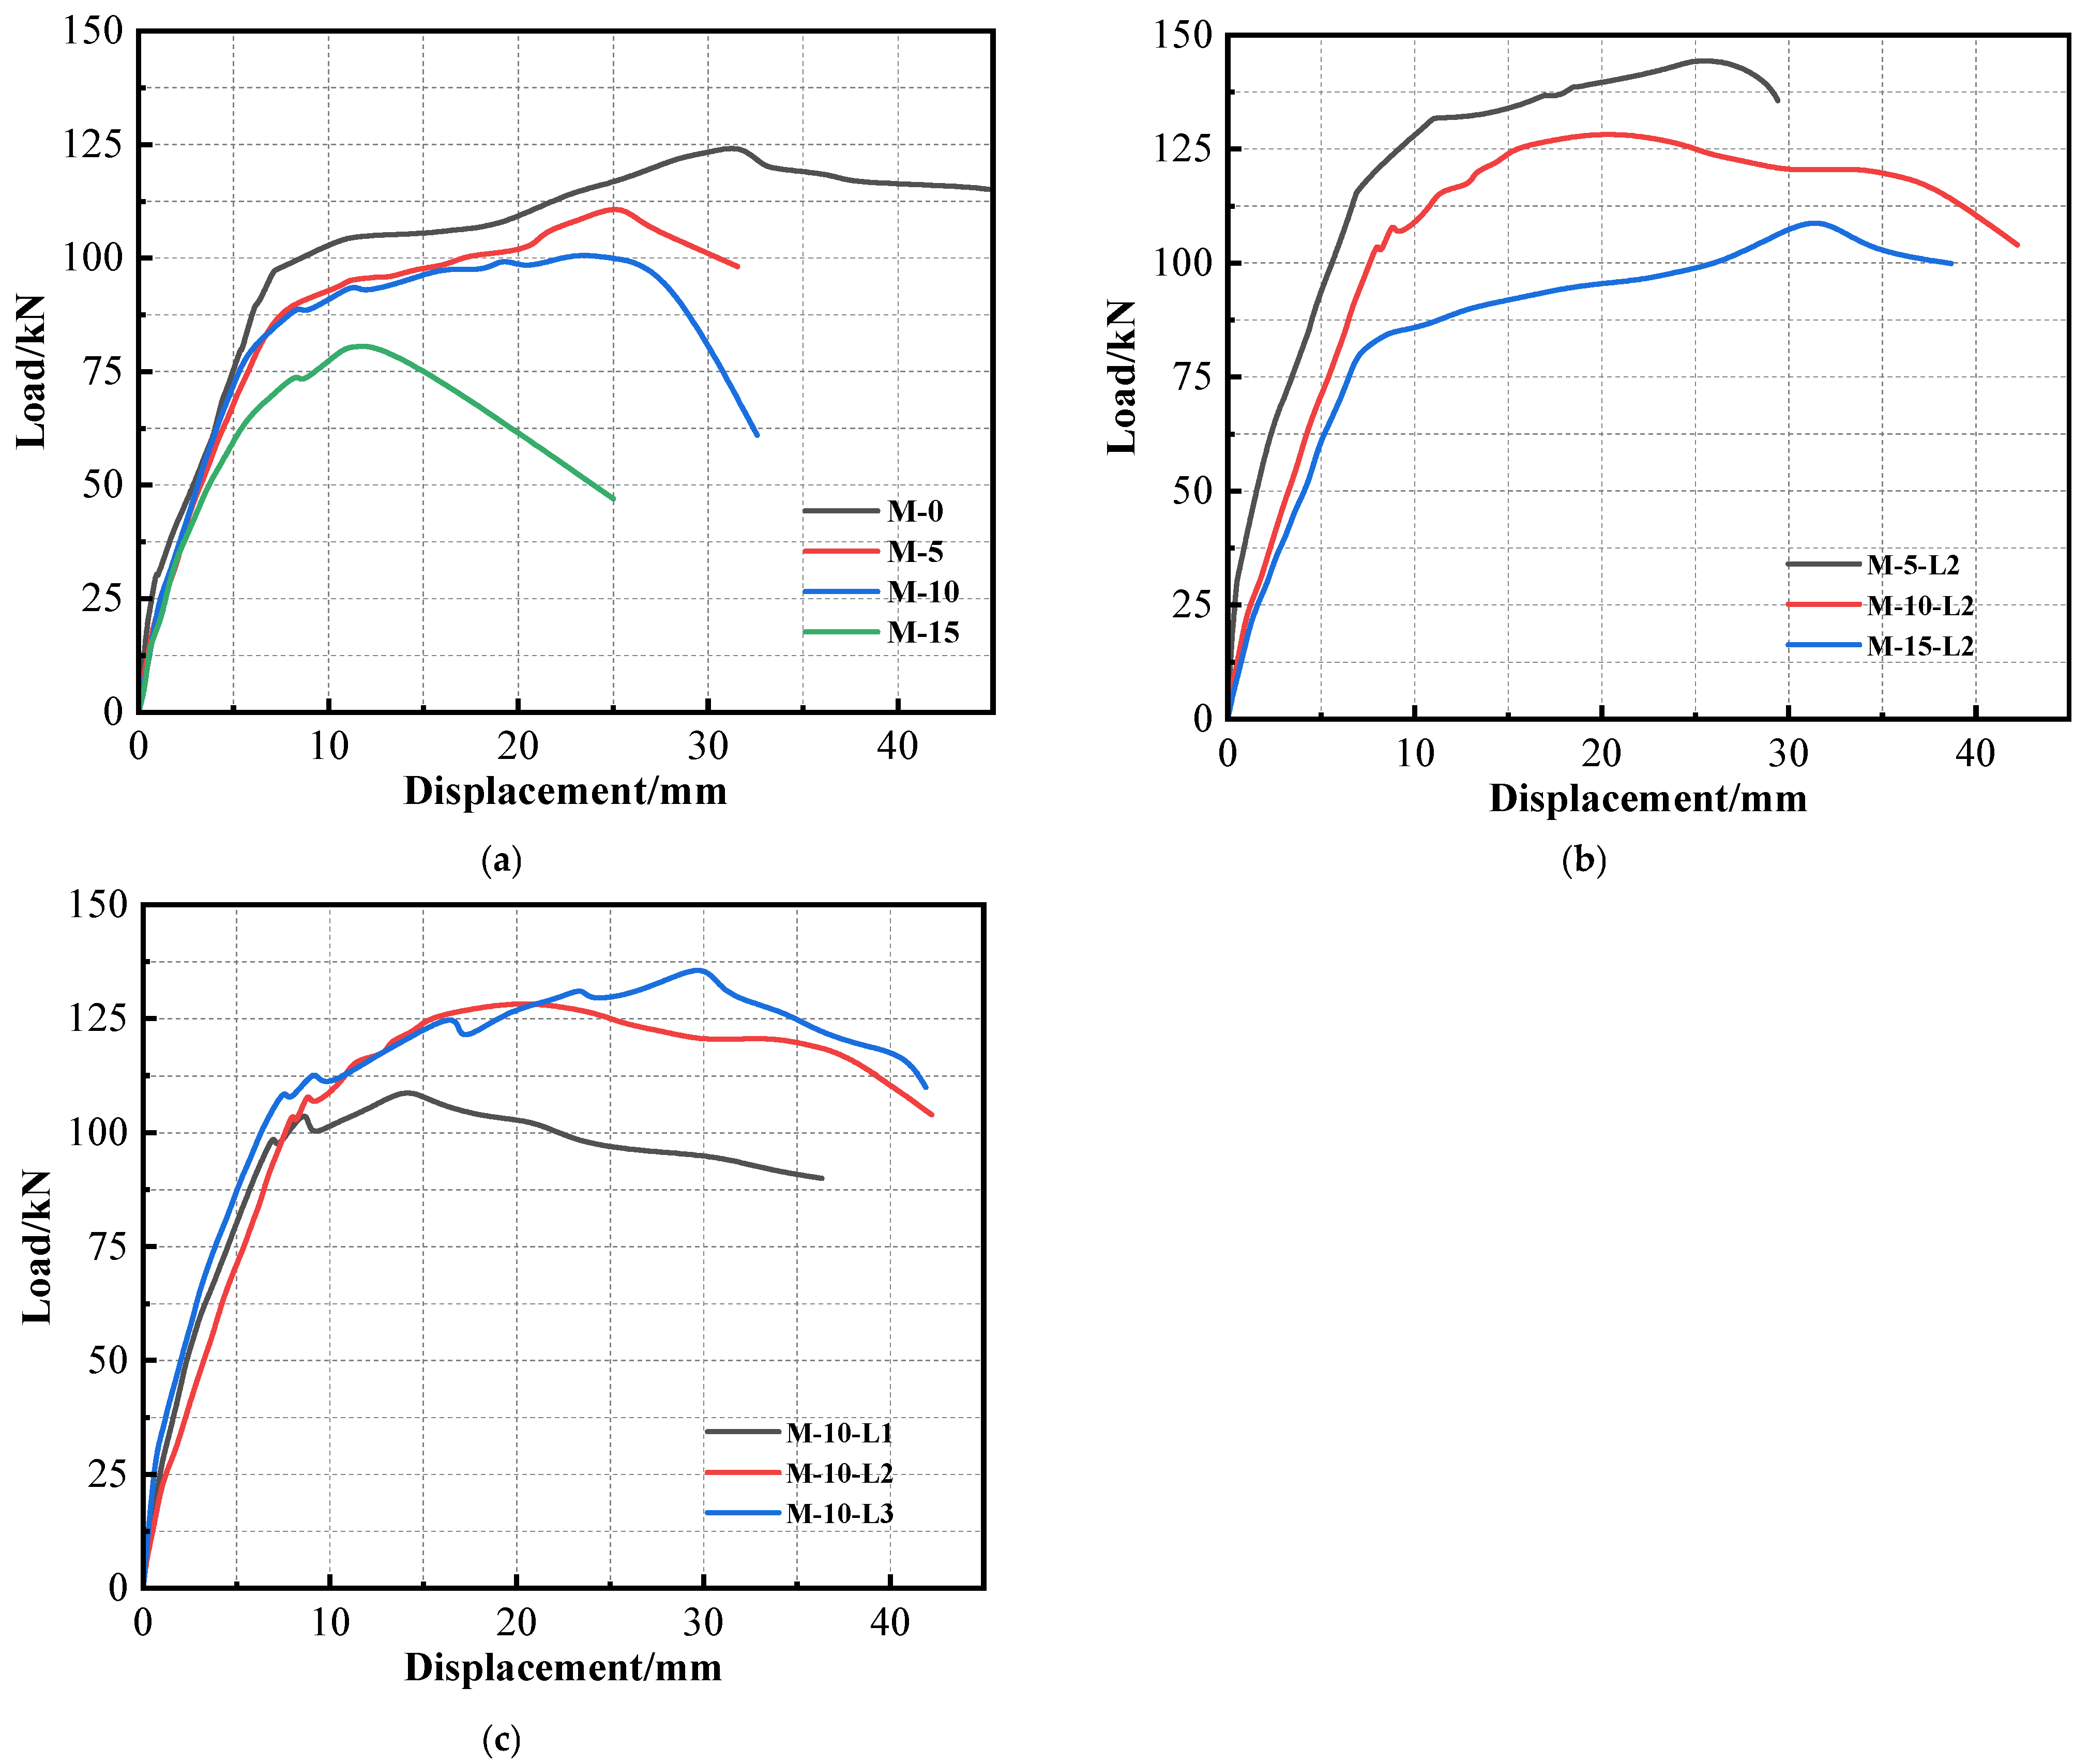
Figure 9 presents the curves of load displacements for each specimen. Specifically,
Figure 9a illustrates the curve of load displacements for the corrosion-only beam. An examination of these curves in
Figure 9a reveals that, with the exception of specimen M-15, which exhibited severe corrosion with a measured rate of 17.14%, the curves for M-10, M-5, and M-0 shared a common three-stage characteristic pattern. The first stage occurred before cracking, during which the tested beam exhibited the highest stiffness. The second stage encompassed the cracking phase, which extended until the steel bars reached their yield point, resulting in a decrease in beam stiffness. The third stage encompassed the period from yielding to failure, during which the stiffness of the test beam diminished further. In stark contrast, the curve of load displacements for M-15 significantly differed from those of M-0, M-5, and M-10. M-15 did not exhibit a noticeable yield point and demonstrated minimal plastic deformation, which was indicative of brittleness. This behavior resulted from corrosion-induced deterioration of the mechanical properties of the steel bar. The research cited in [
37] indicates that when the corrosion degree of the steel bar surpassed a specific threshold, its stress–strain curve underwent transformation: the yield plateau disappeared, ductility deteriorated, the softening stage vanished, and brittle fracture occurred.
Figure 9b illustrates the load–displacement curves of three specimens, M-10-L2, M-5-L2, and M-15-L2. As depicted in
Figure 9b, the load–displacement curves of the TRC-strengthened corroded beams also displayed three stages: pre-cracking, cracking until steel yield, and yielding until failure. Additionally, for specimens M-15-L2, M-10-L2, and M-5-L2, the midspan displacement increased sequentially under the same applied load. The stiffness of the strengthened beam was influenced by the corrosion degree of the steel bars when the number of textile layers remained constant. A comparison between the load and displacement curves of specimens M-15-L2 and M-15 revealed that despite the degradation in that of M-15, the TRC loaded and displaced it to maintain the three-stage characteristic behavior and exhibited a certain level of ductility.
In
Figure 9c, the load–displacement curves for specimens M-10-L1, M-10-L2, and M-10-L3 are presented. Examining the deflection development in relation to the actual corrosion degree of the specimens, it was observed that the pre-yielding deflection control capability was positively correlated with the number of textile layers. This correlation is attributed to the ability of the TRC layer to maintain an optimal performance with the corroded beam during this stage. A higher number of textile layers results in increased tensile stress sharing by the TRC layer, thereby retarding deflection development. As indicated in
Figure 9c, it is apparent that a single layer of TRC is insufficient for effective deflection control. Notably, the deflection of M-10-L1 experienced a significant increase during this stage, while the deflection curves of M-10-L2 and M-10-L3 were closely aligned. Moreover, in the early stages of plastic deformation, the deflection of the former was smaller than that of the latter.
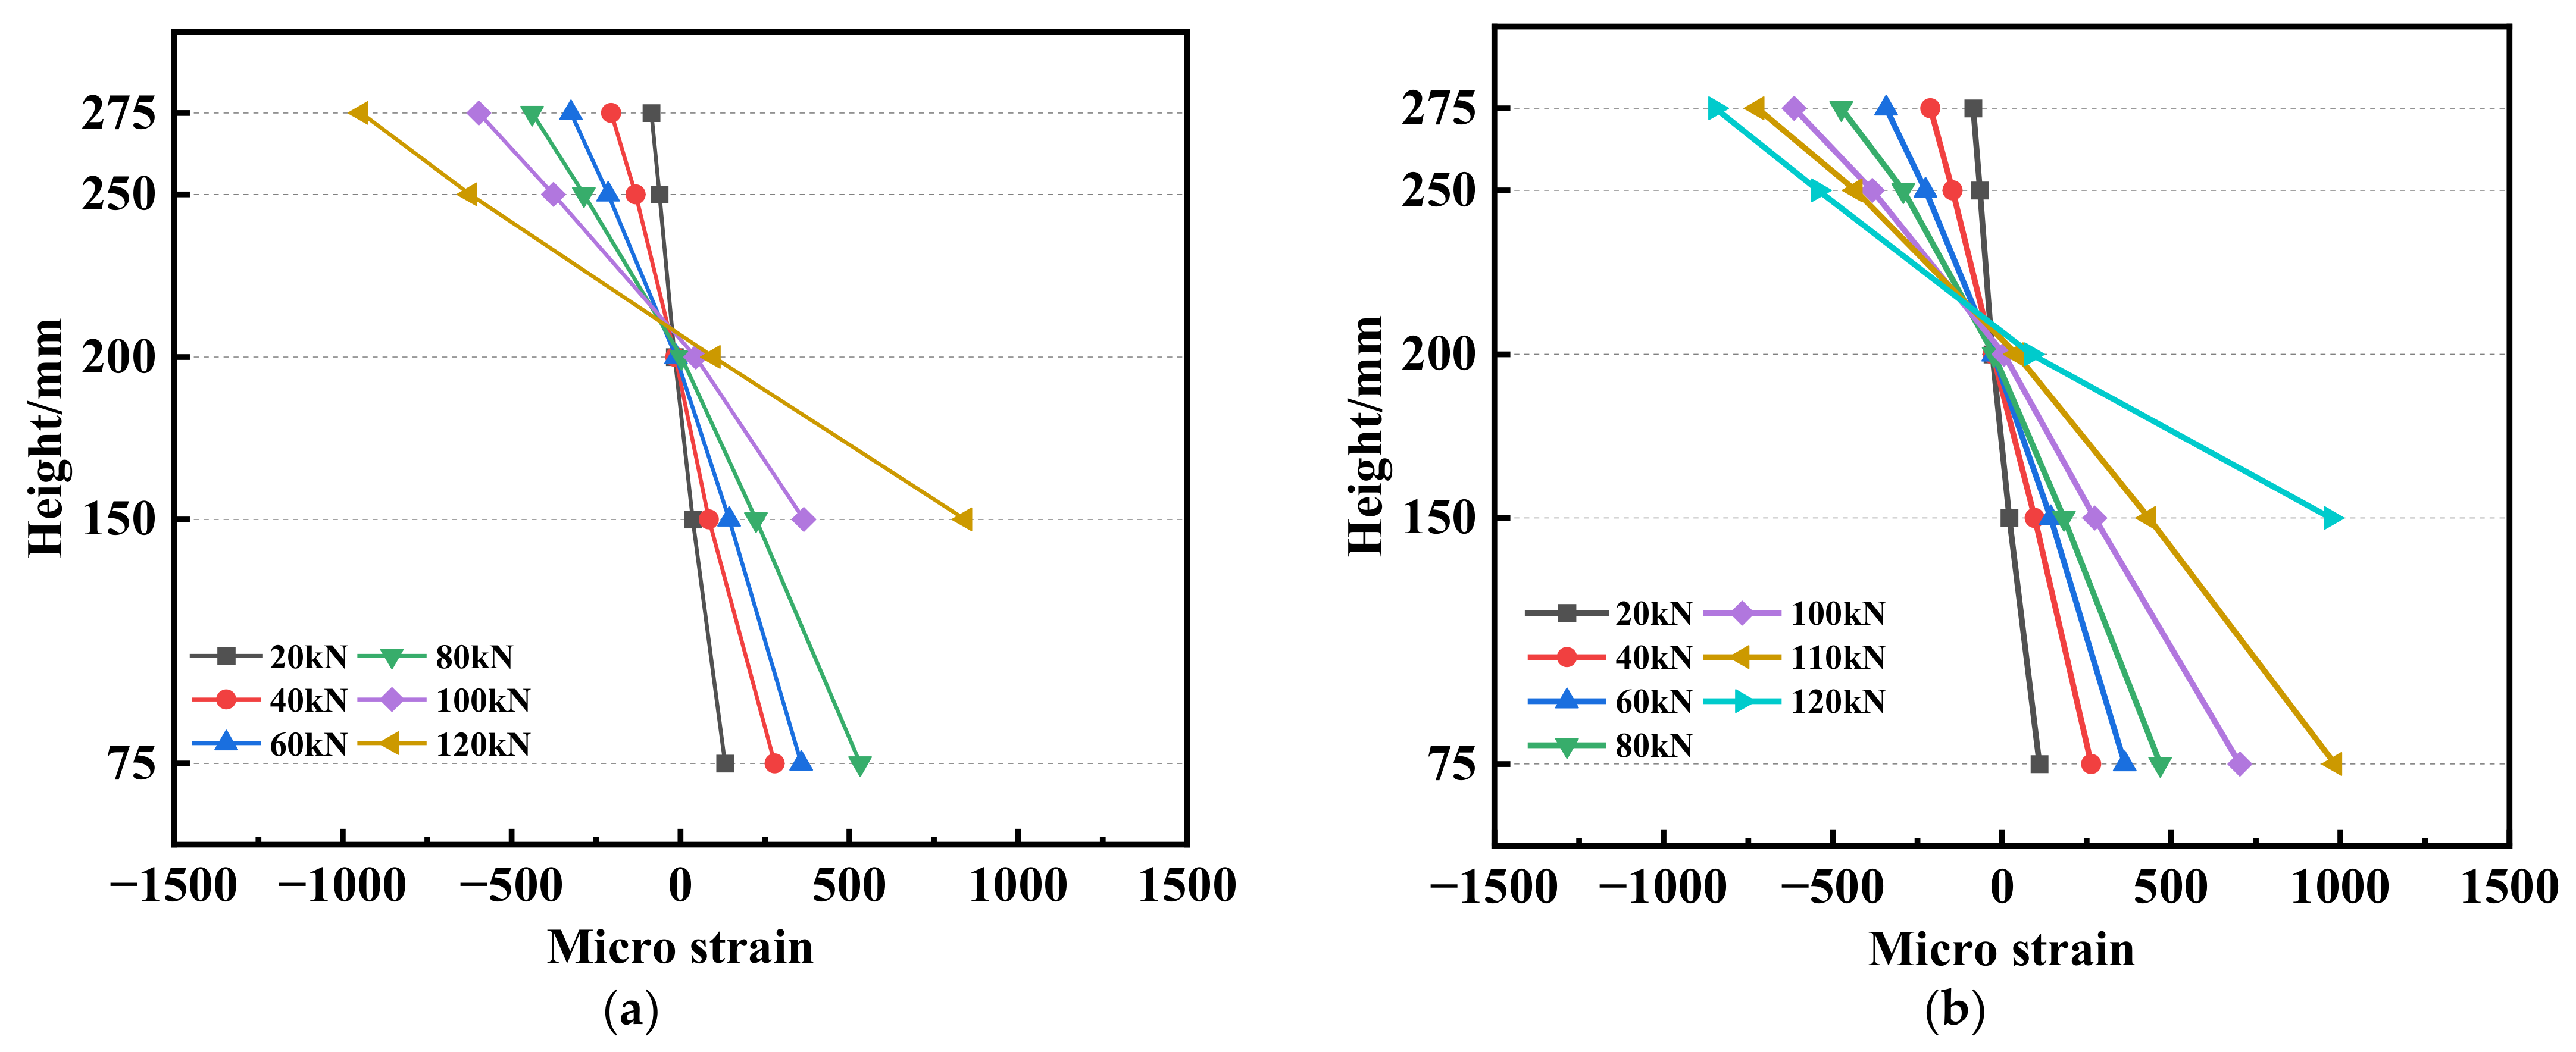
3.4. Cross-Section Verification
Using M-5-L2 and M-10-L2 as representative examples, we illustrated the distribution of concrete strains along the direction of the mid-span section height of the test beam.
Figure 10a,b presents the correlation between the strain and load in the midspan section of M-5-L2 and M-10-L2. As shown in
Figure 10, as the load continued to increase, the neutral axis of the specimens ascended, causing the strain distribution curve to shift progressively to the right. Despite this shift, the strain–distribution curve remained linear as the load increased. Consequently, it is reasonable to conclude that M-5-L2 and M-0-L2 adheres to the assumption that a flat section is maintained during the loading process. It is worth noting that the remaining test beams also conform to the plane section assumption, although they are not discussed in detail here.
4. Theoretical Calculation of Bending–Bearing Capacity
4.1. Basic Assumptions
To formulate the ultimate flexural bearing capacity model for U-type TRC-strengthened corroded RC beams, the following assumptions were made:
(1) The U-type TRC-strengthened corroded RC beams adhere to the plane section assumption during loading.
(2) Concrete in the tensile zone exits immediately after cracking.
(3) During loading, the relative slip between materials is ignored.
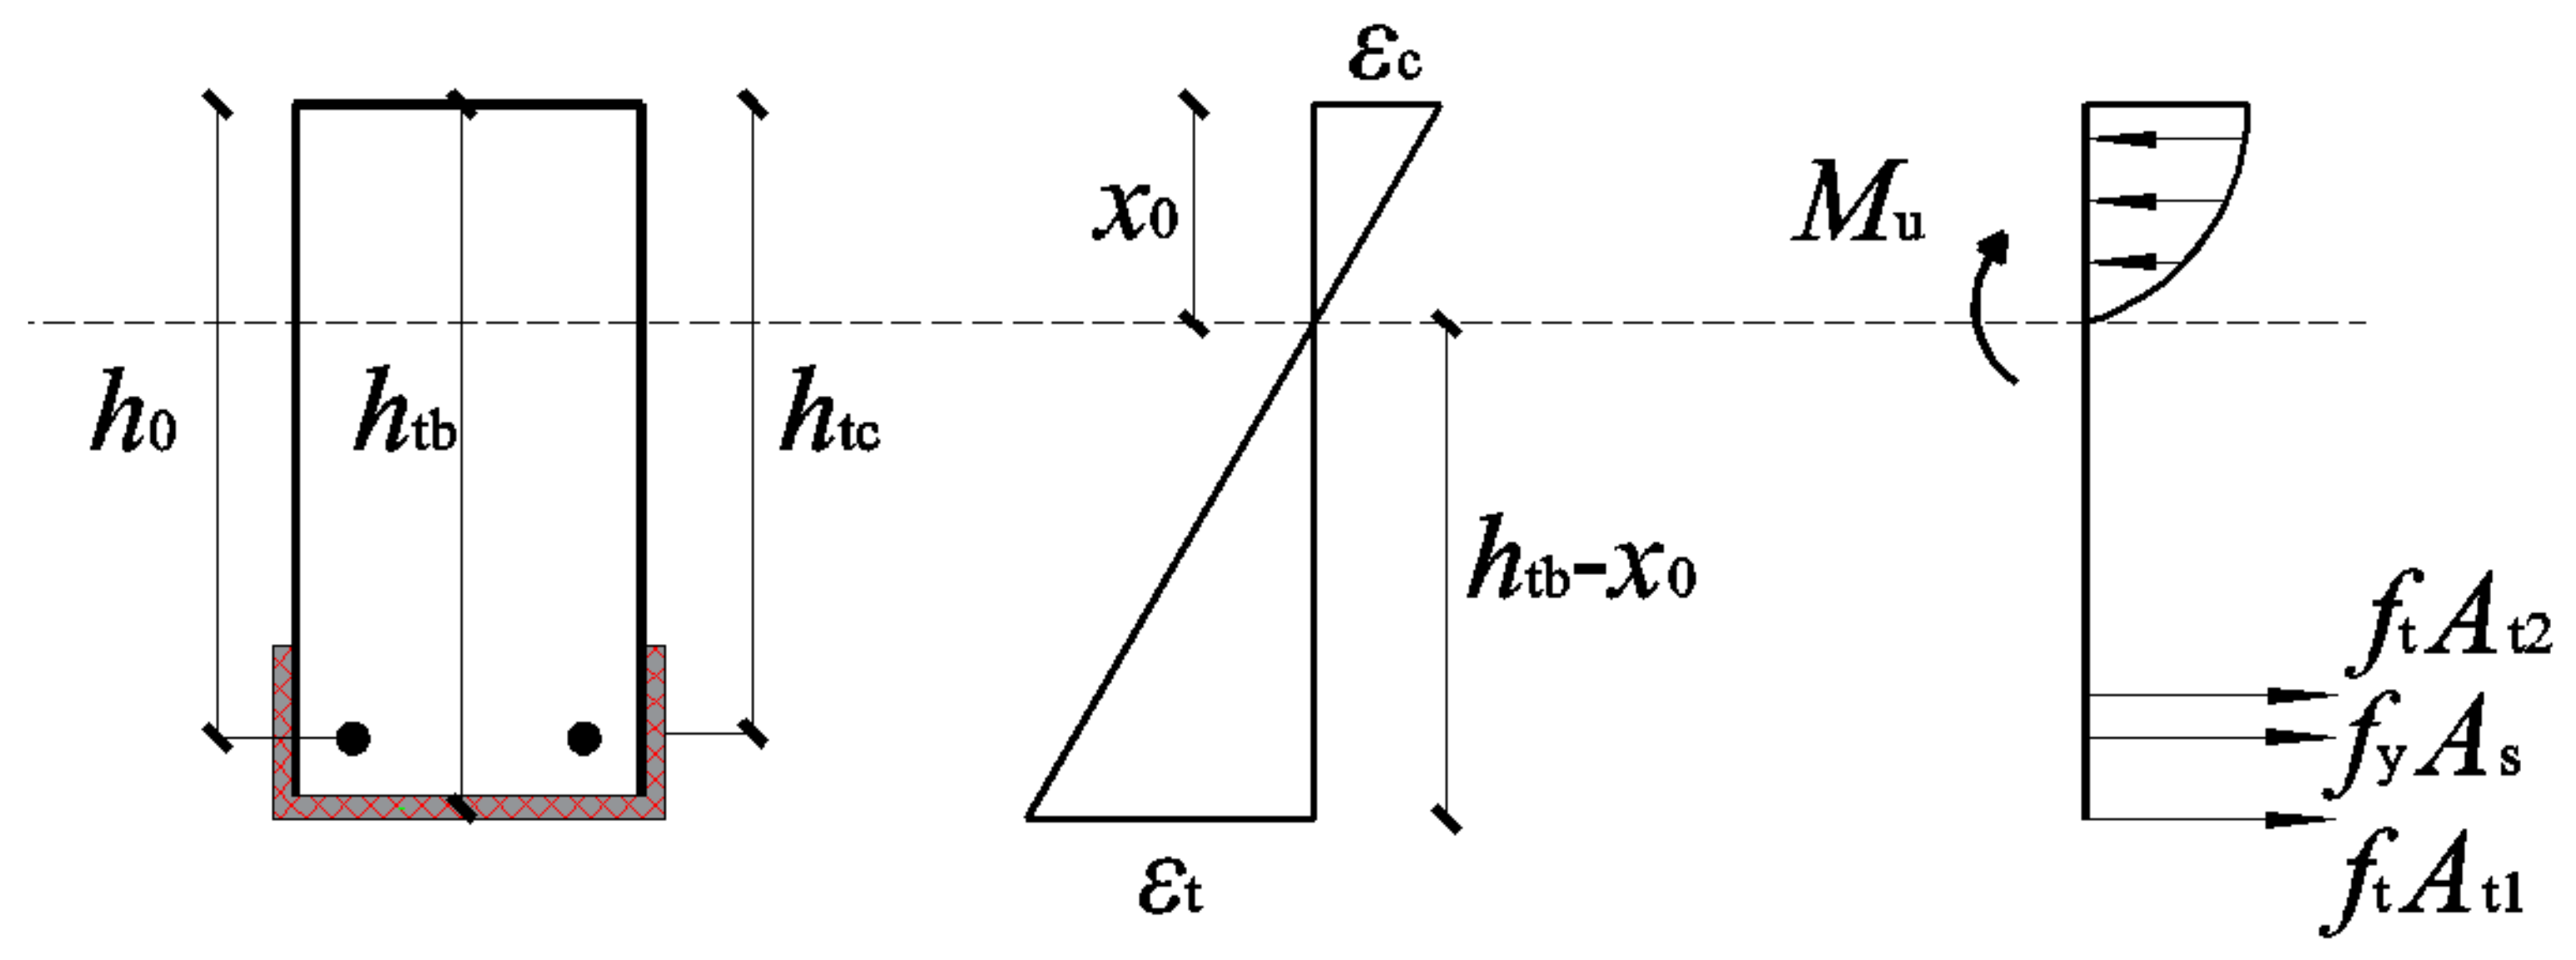
4.2. Derivation of Computational Models
The stress–strain distribution of the cross-section of the U-type TRC-strengthened corroded RC beams before failure is shown in
Figure 11.
On the verge of failure, the tensile stress in the lowermost tensile zone of the specimen was distributed among three components: the corroded steel bars, the lower TRC layer, and the side TRC layer. Upon failure, the steel bars have already yielded, the textile within the TRC layer is entirely separated, and the upper concrete of the beam is crushed.
Based on the geometric relationship depicted in
Figure 11, we calculated the equivalent compression zone height, denoted as
x0, using the following equation:
Following the calculation of the equivalent height of the compression zone, we determined the location of the resultant force moment within the compression zone:
In this context, based on ACI 549.4R-13 [
38], the maximum strain of the textile (ε
t) and the maximum compressive strain of concrete (
εc) are 0.012 and 0.0033, respectively. The variables
h0,
htb, and
htc represent the heights measured from the point of action of the combined force exerted by the steel bar, bottom TRC layer, and side TRC layer to the top of the beam, respectively, expressed in millimeters (mm). Additionally,
x0 denotes the equivalent compression zone height of the cross-section, measured in millimeters (mm). Furthermore,
At1 and
At2 correspond to the cross-sectional areas of the bottom and side textiles, respectively, in square millimeters (mm²), where
Et is the elastic modulus of the textile, which was assumed to be 246 GPa. The tensile strength (
fy,corr) and effective cross-sectional area (
Acorr) of the corroded steel bars were obtained, using the formula provided in [
39]:
where
fy and
As represent the yield strength and cross-sectional area of the steel bar before corrosion, respectively; and
Qcorr is the measured corrosion degree.
After calculating the ultimate bending moment
Mu, the ultimate bending bearing capacity of the TRC-strengthened beam was calculated using structural mechanics methods:
where
a is the shear span of the specimen (700 mm).
4.3. Verification
This section presents the theoretical calculations regarding the ultimate bending bearing capacity of specimens M-5-L2, M-10-L1/2/3, and M-15-L2. The calculated values were then compared with the corresponding results (
Table 6).
The theoretical bearing capacity calculations for all specimens aligned closely with the experimental results, exhibiting deviations predominantly within the 10% range. It is noteworthy that the theoretical bearing capacity values for all specimens were generally lower than the experimentally measured values. This disparity can be caused by the non-uniform extent of corrosion in the steel bars owing to the non-uniform nature of mass loss rates in certain areas, which may be lower than the design assumptions. However, this observation underscores the relative safety of predicting the bearing capacity of reinforced components using this formula.
5. Conclusions
This study conducted experiments on the flexural bearing capacity of corroded RC beams strengthened with U-type TRC. The following key conclusions can be obtained:
(1) Three distinct failure modes were identified in corroded RC beams reinforced with U-type TRC. Specifically, when the corrosion degree reached 10%, specimens with one and two layers of textile experienced bending failure, while specimens with three layers of textile exhibited TRC lateral peel failure.
(2) The TRC strengthening system proved to be highly effective in enhancing the flexural bearing capacity of the corroded RC beams. Notably, both the ultimate and yield loads increased with the increased textile layer count.
(3) In the case of mild and moderate corrosion levels in beams, employing TRC with more than one layer of textile proved capable of not only restoring but also surpassing the original bearing capacity. However, for beams exhibiting severe corrosion, the use of two textile layers is insufficient to restore their bearing capacity to the level of the original beam.
(4) A theoretical equation for determining the ultimate bearing capacity of corroded RC beams strengthened with U-type TRC was developed, and it demonstrated a high level of accuracy in its calculations.


