
A First-Principles Study of Mechanical and Electronic Properties of Cr0.5-xAl0.5TMxN Hard Coatings (TM = Ti, V, Y, Zr, Hf, and Ta)

Abstract
1. Introduction
2. Methodology
2.1. First-Principles Calculations
2.2. Elastic Properties
3. Results and Discussion
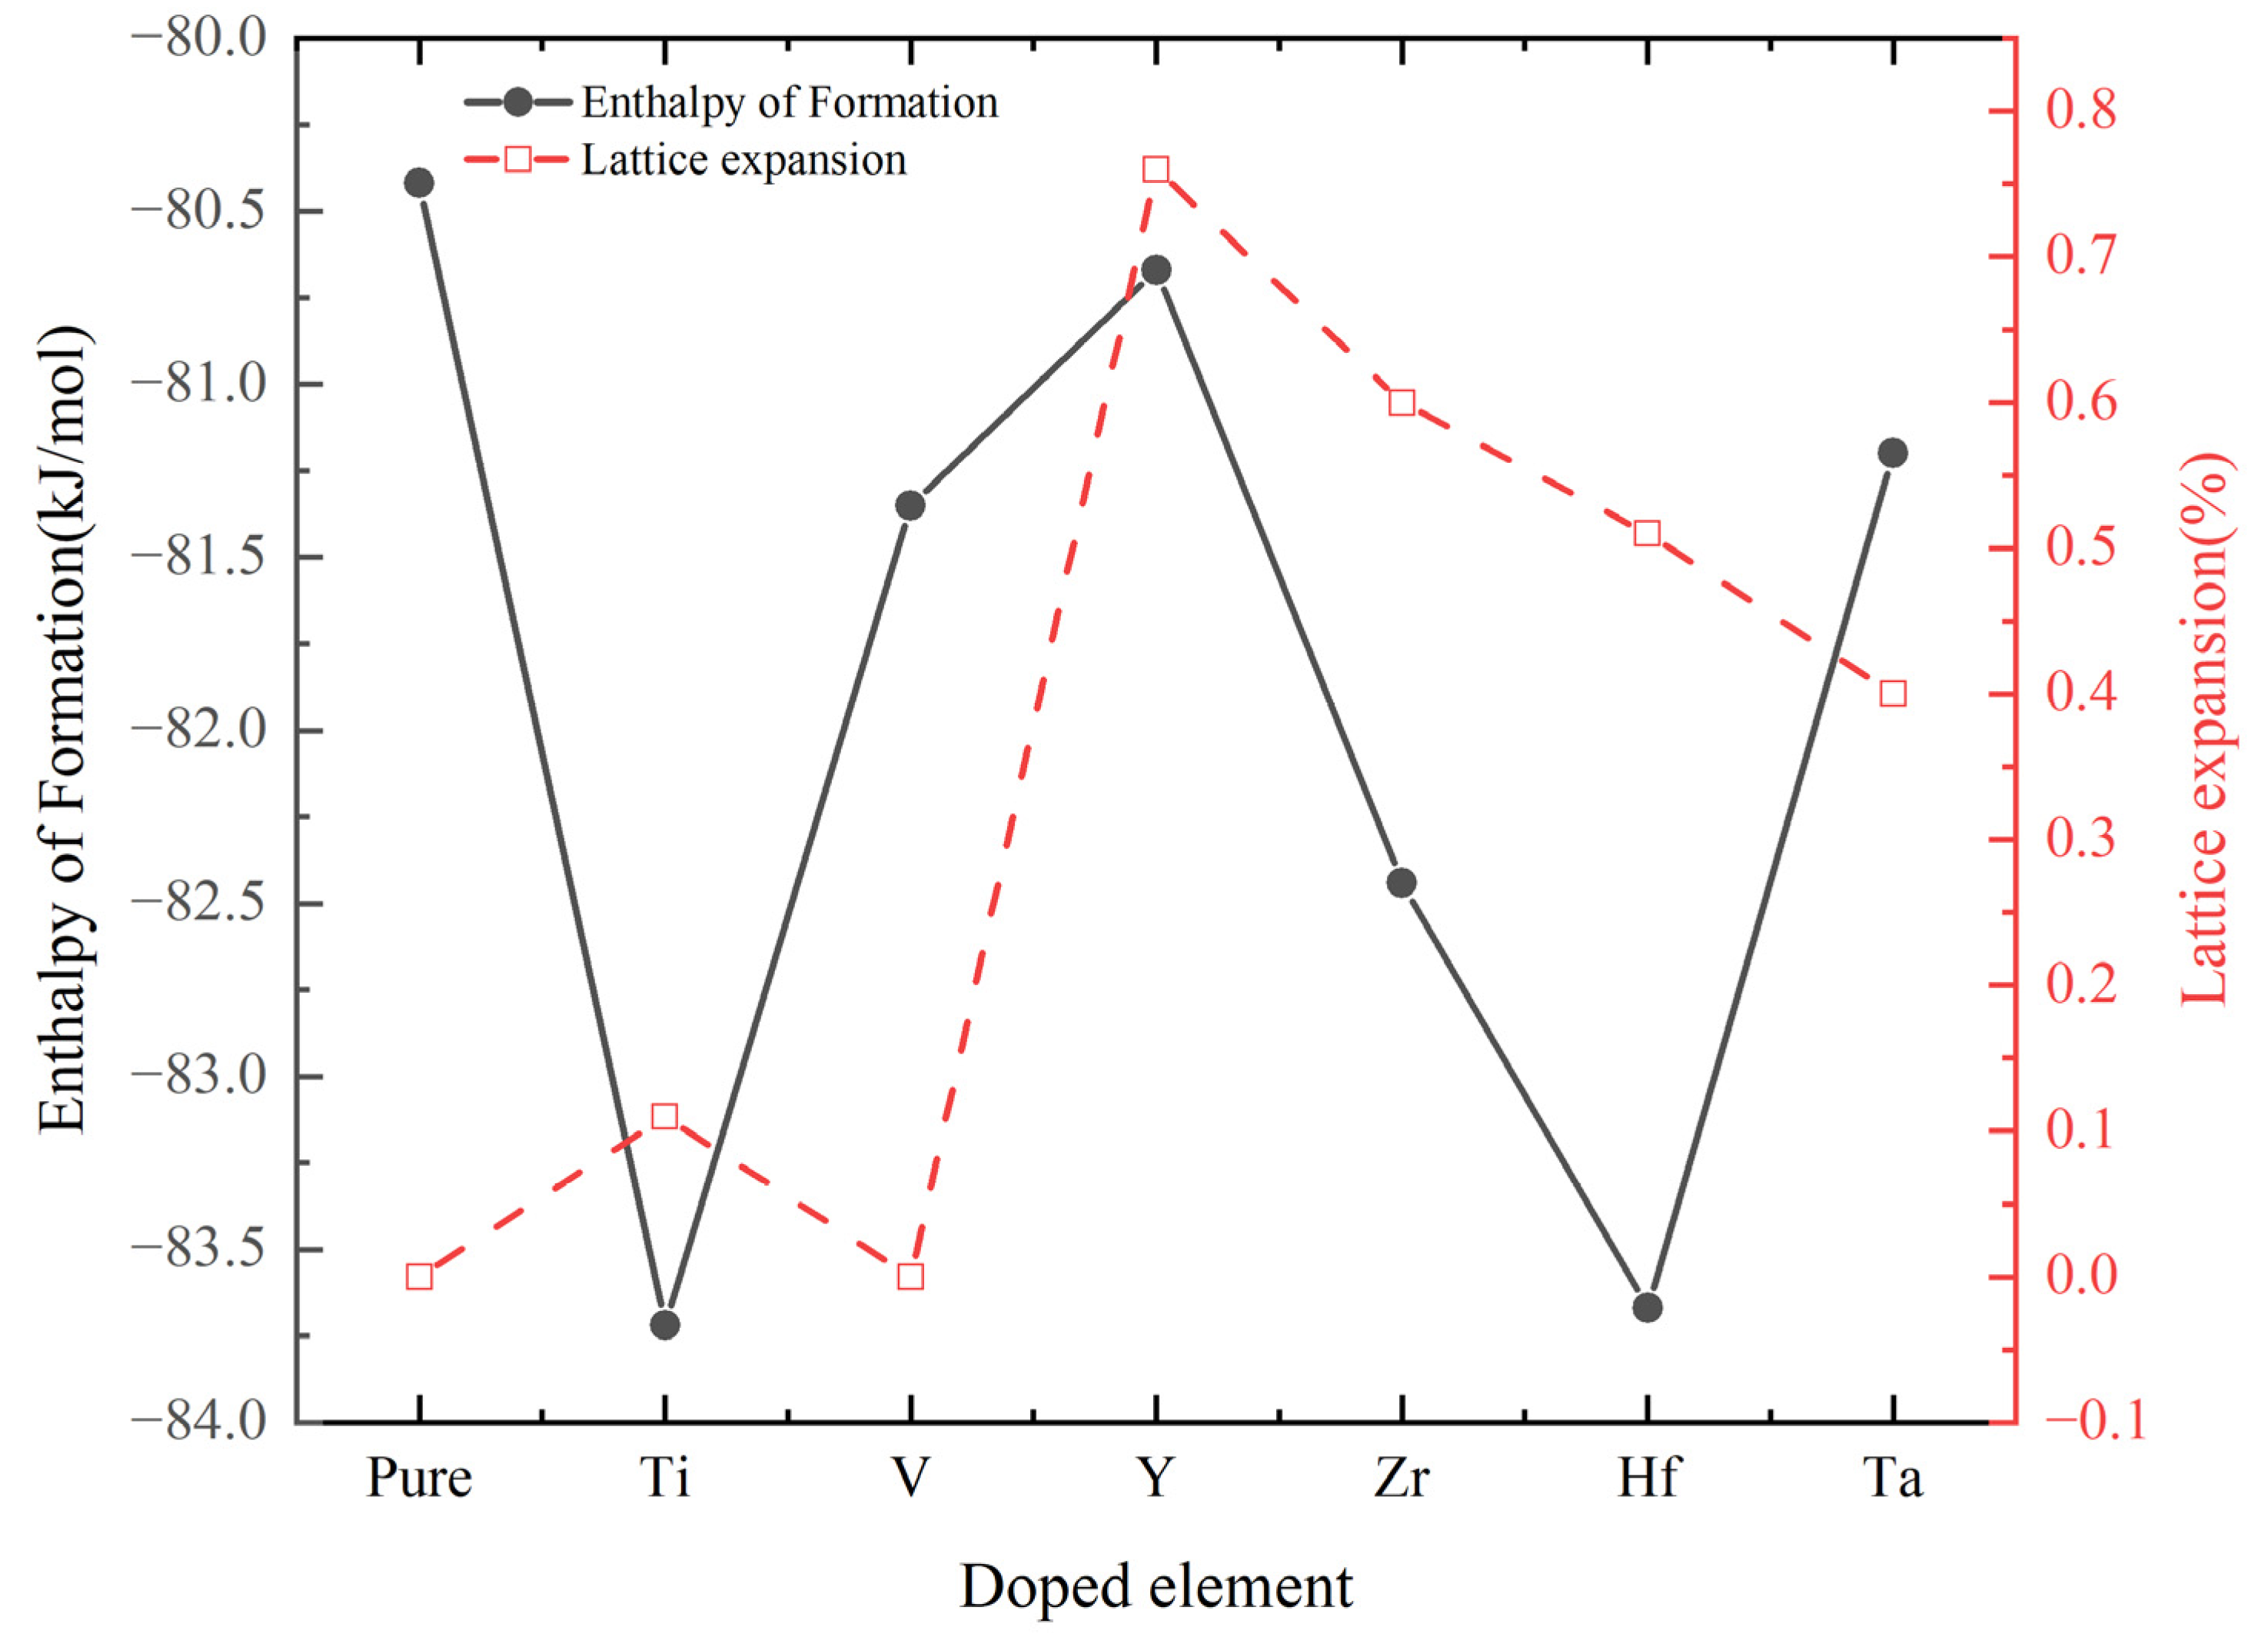
3.1. Ground State Properties
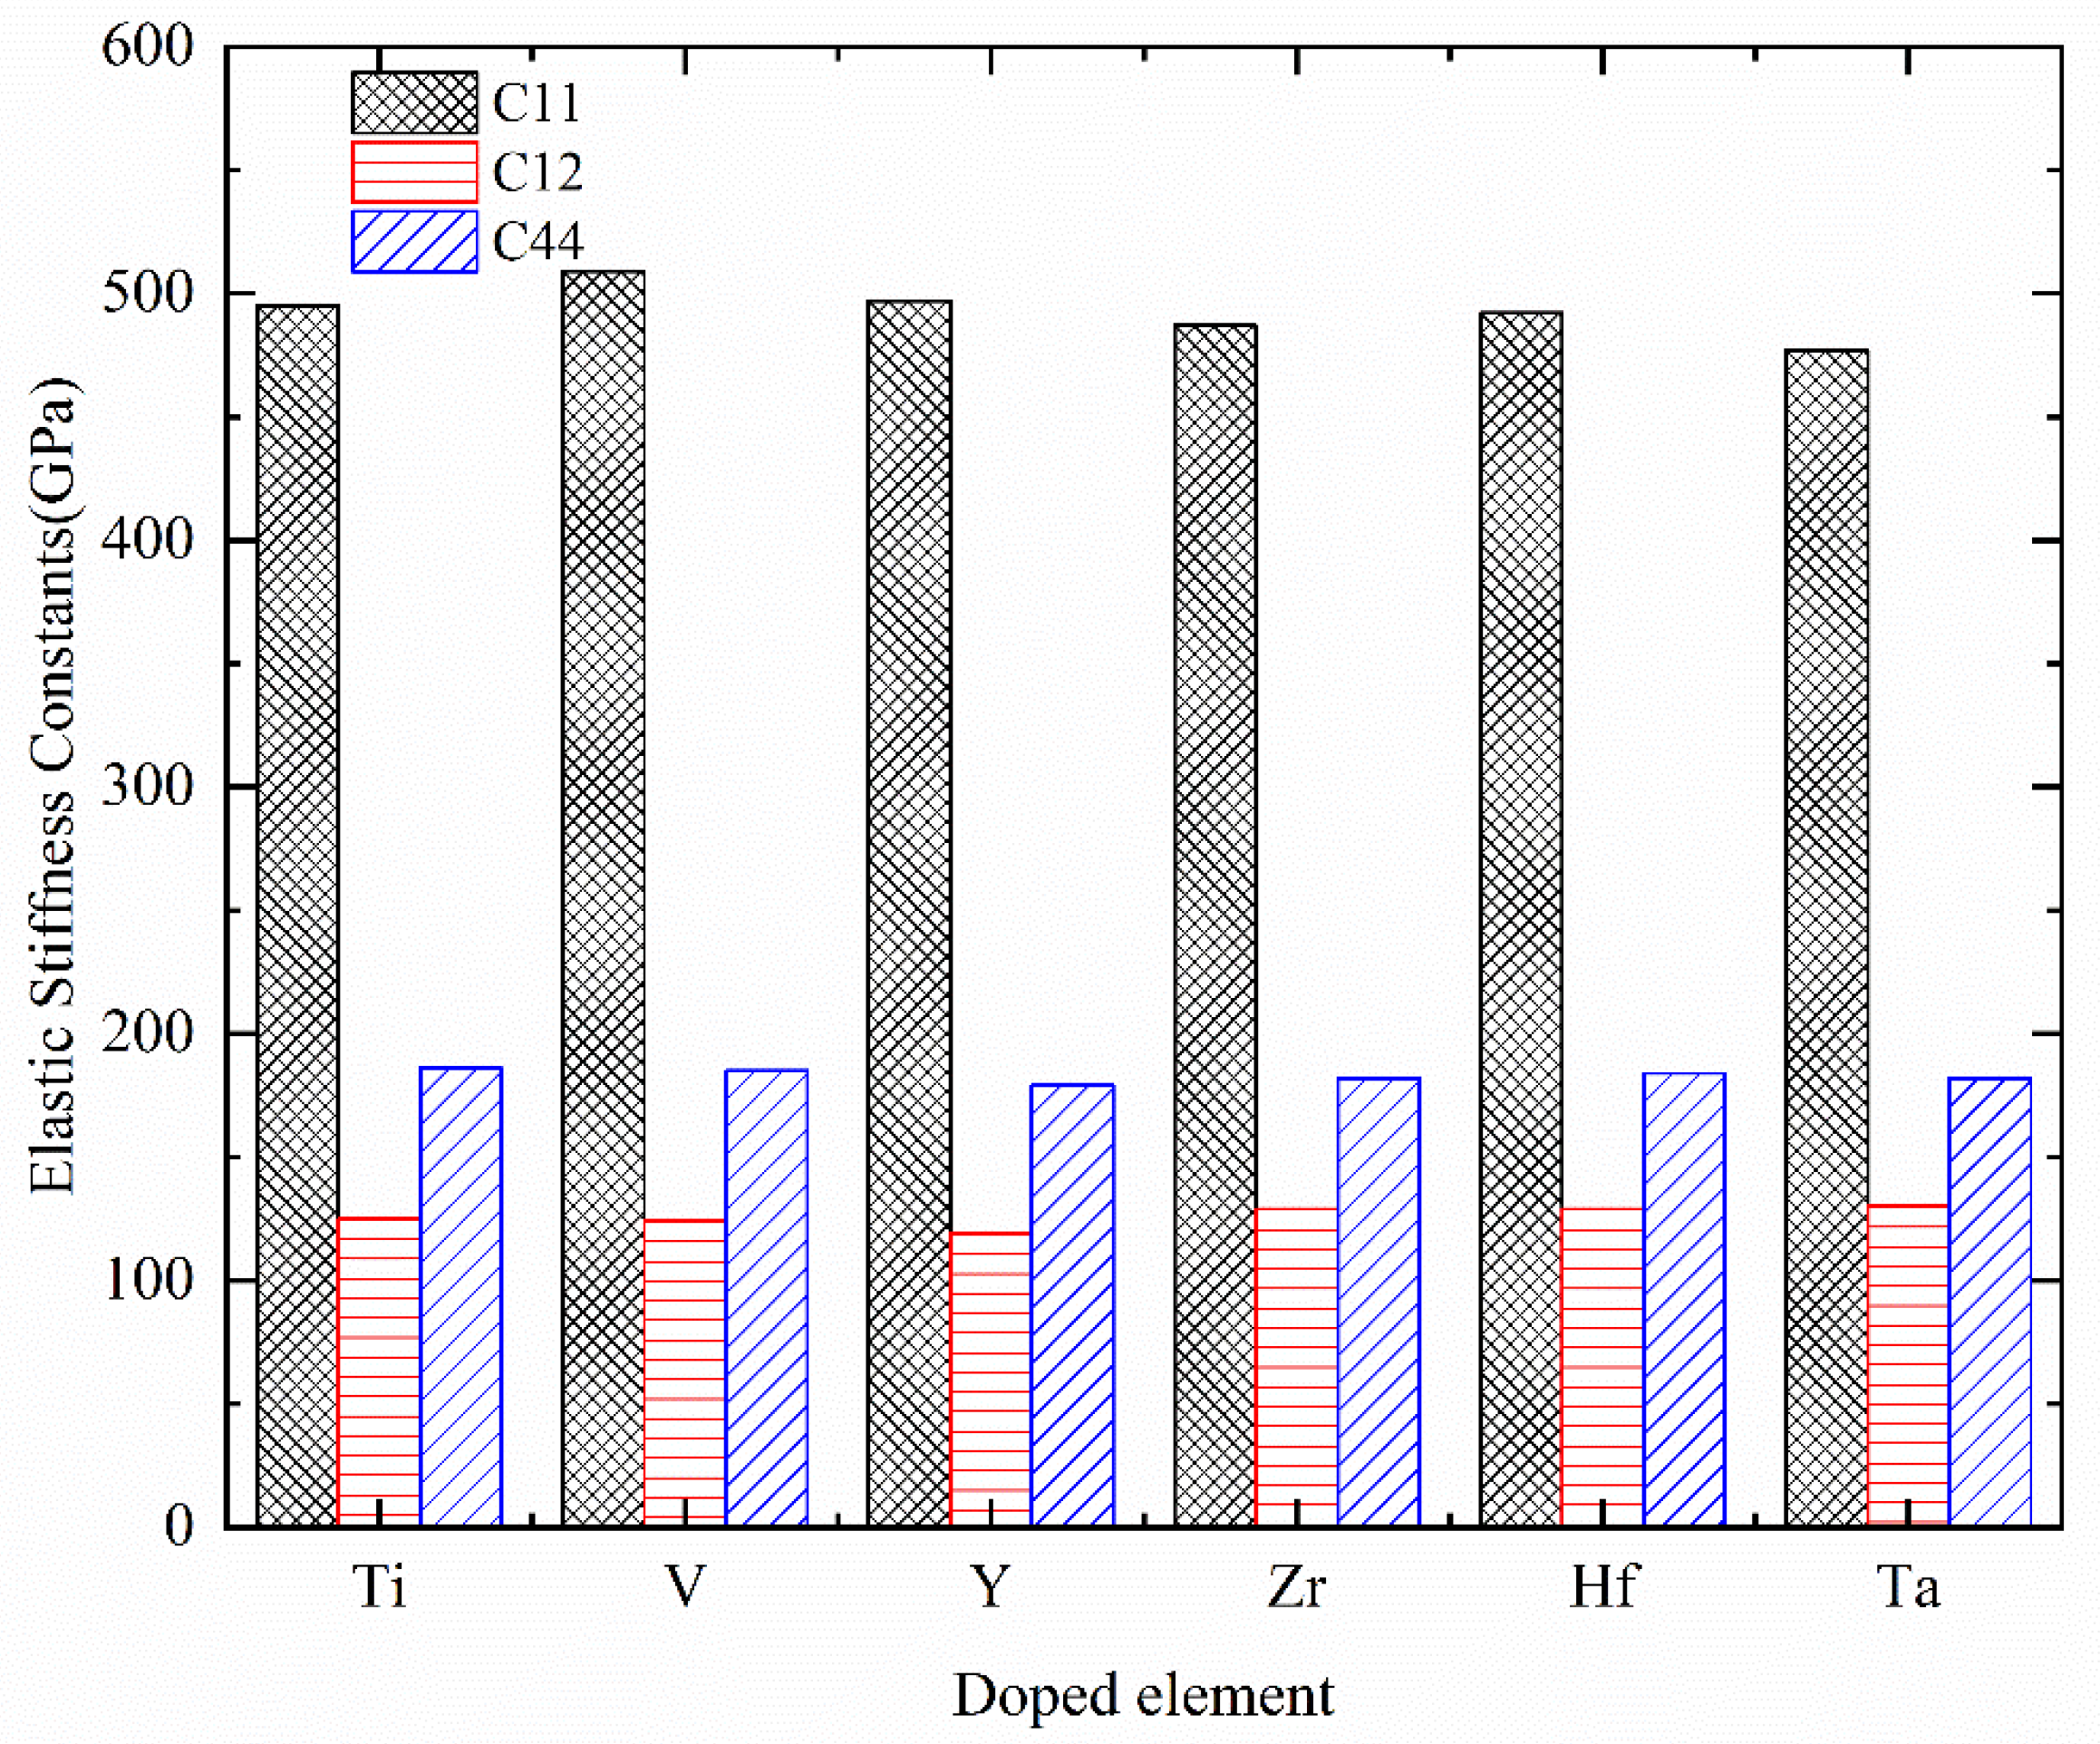
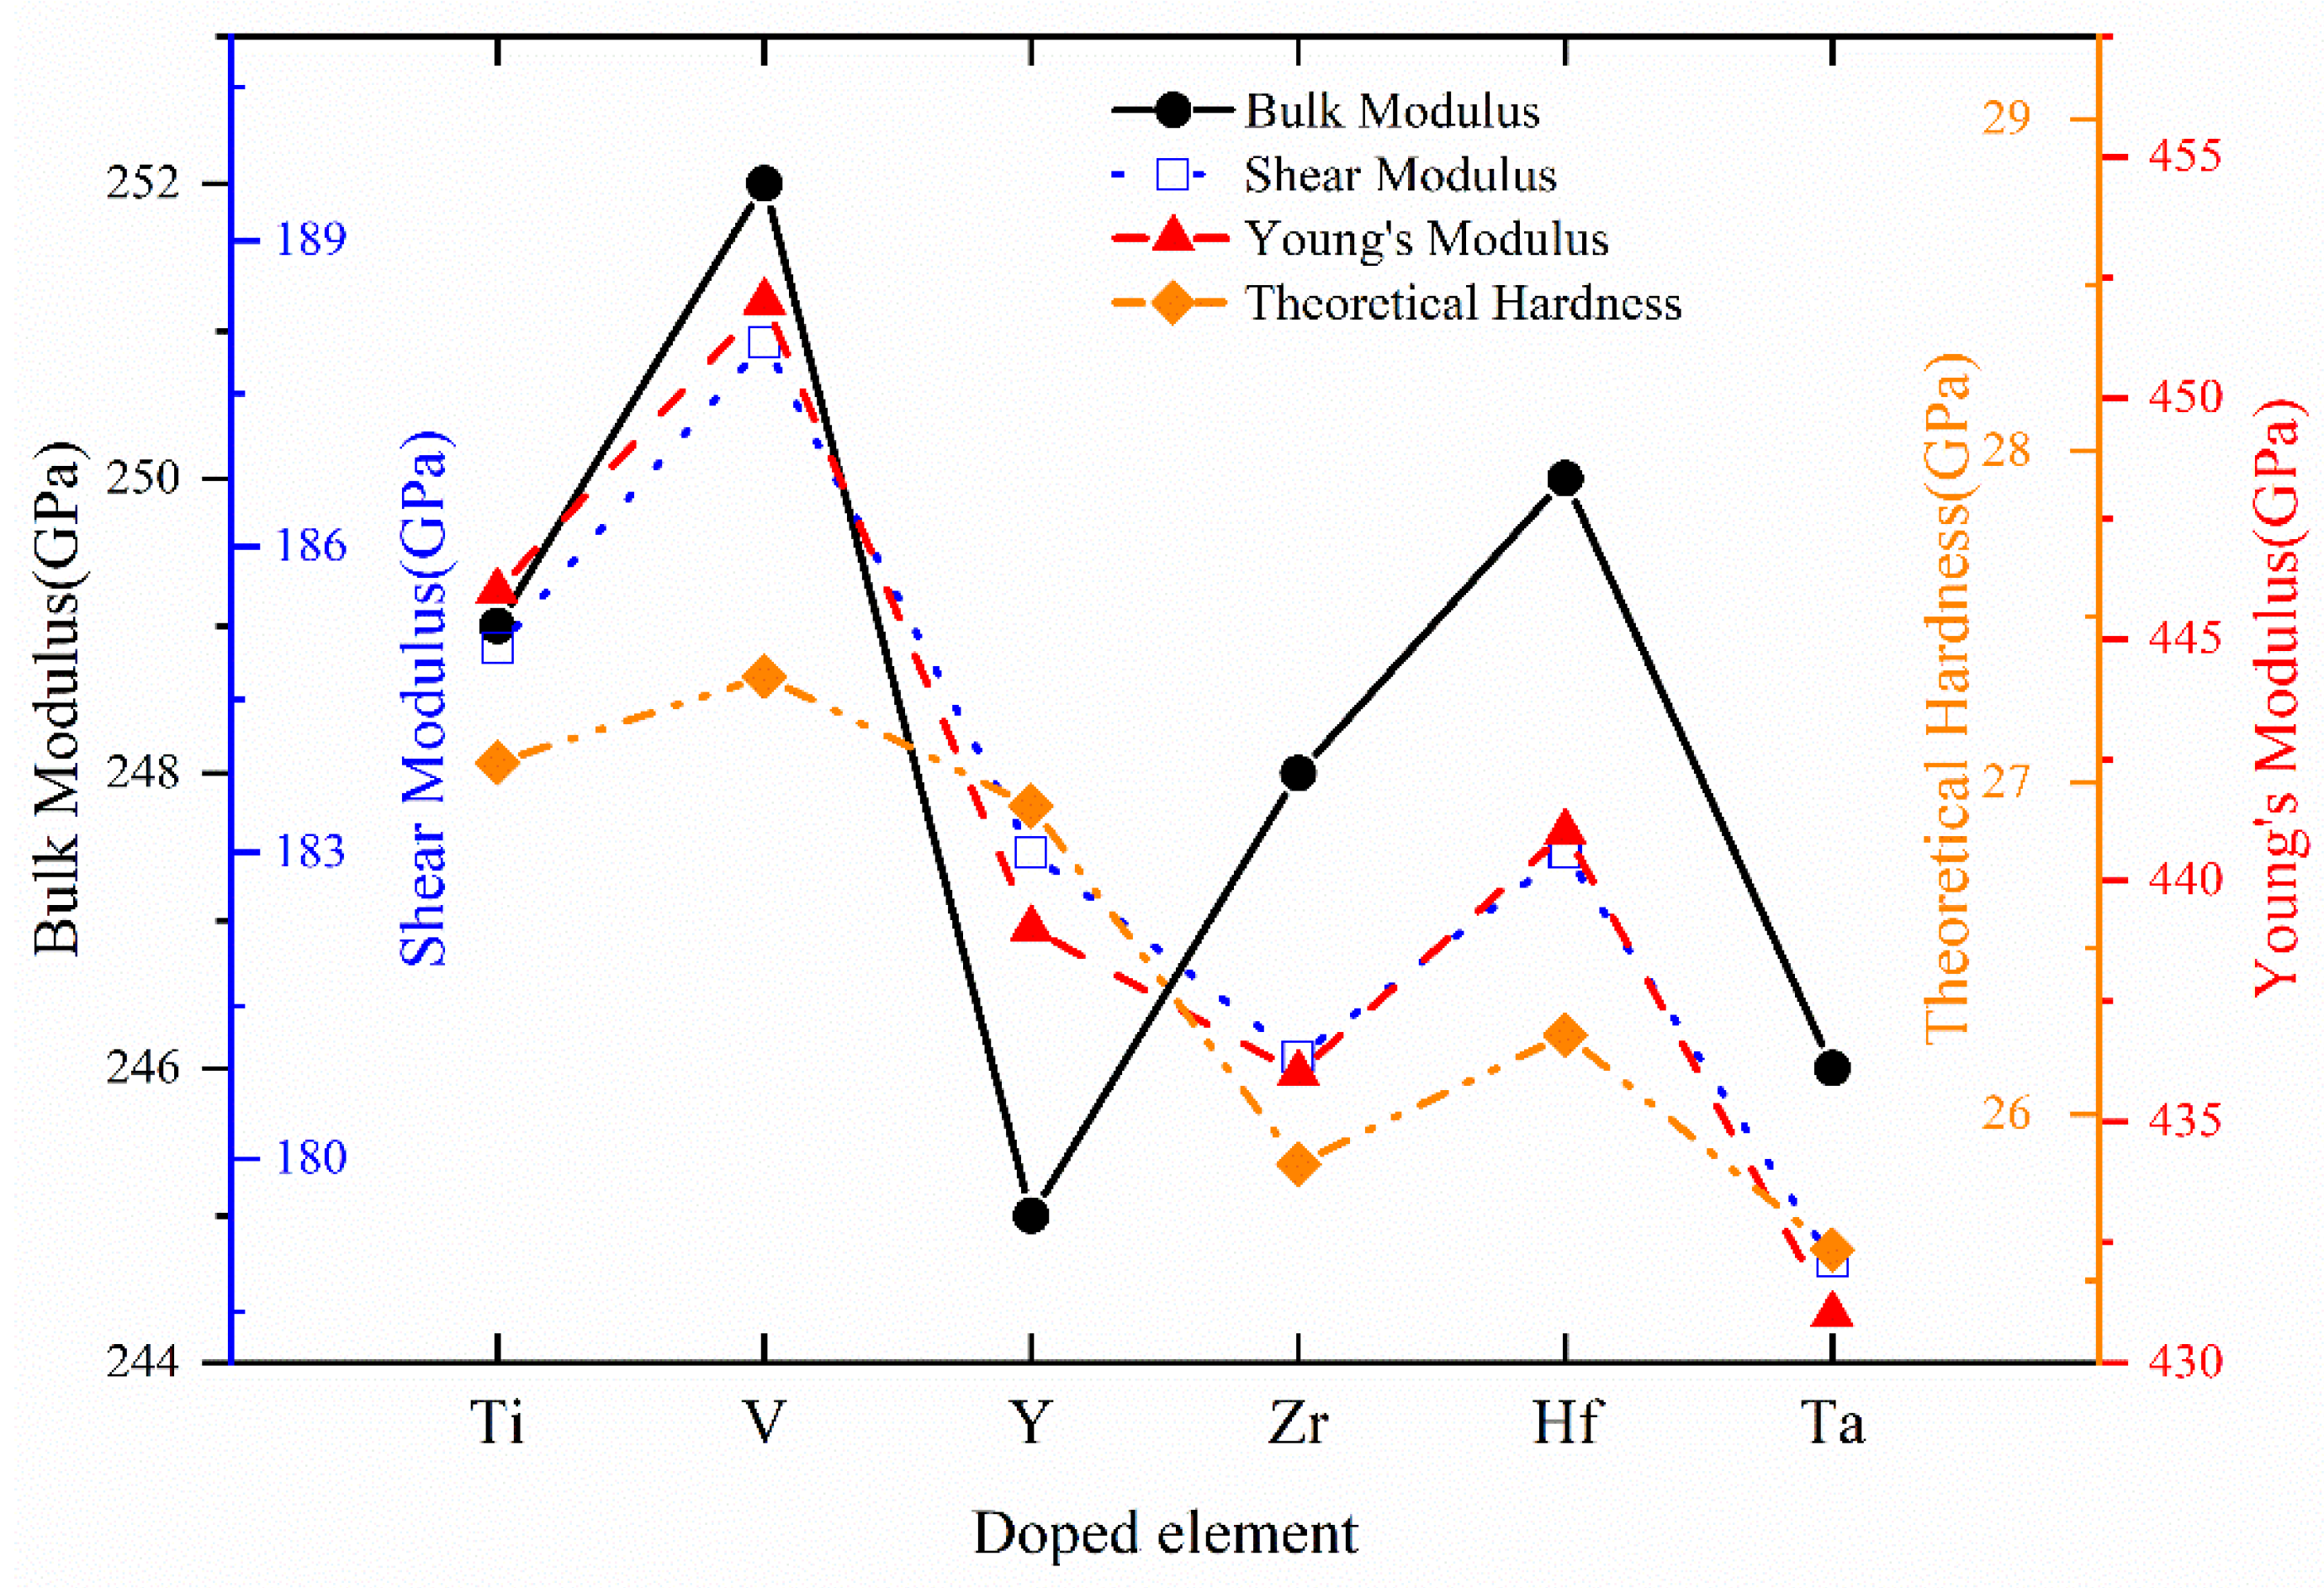
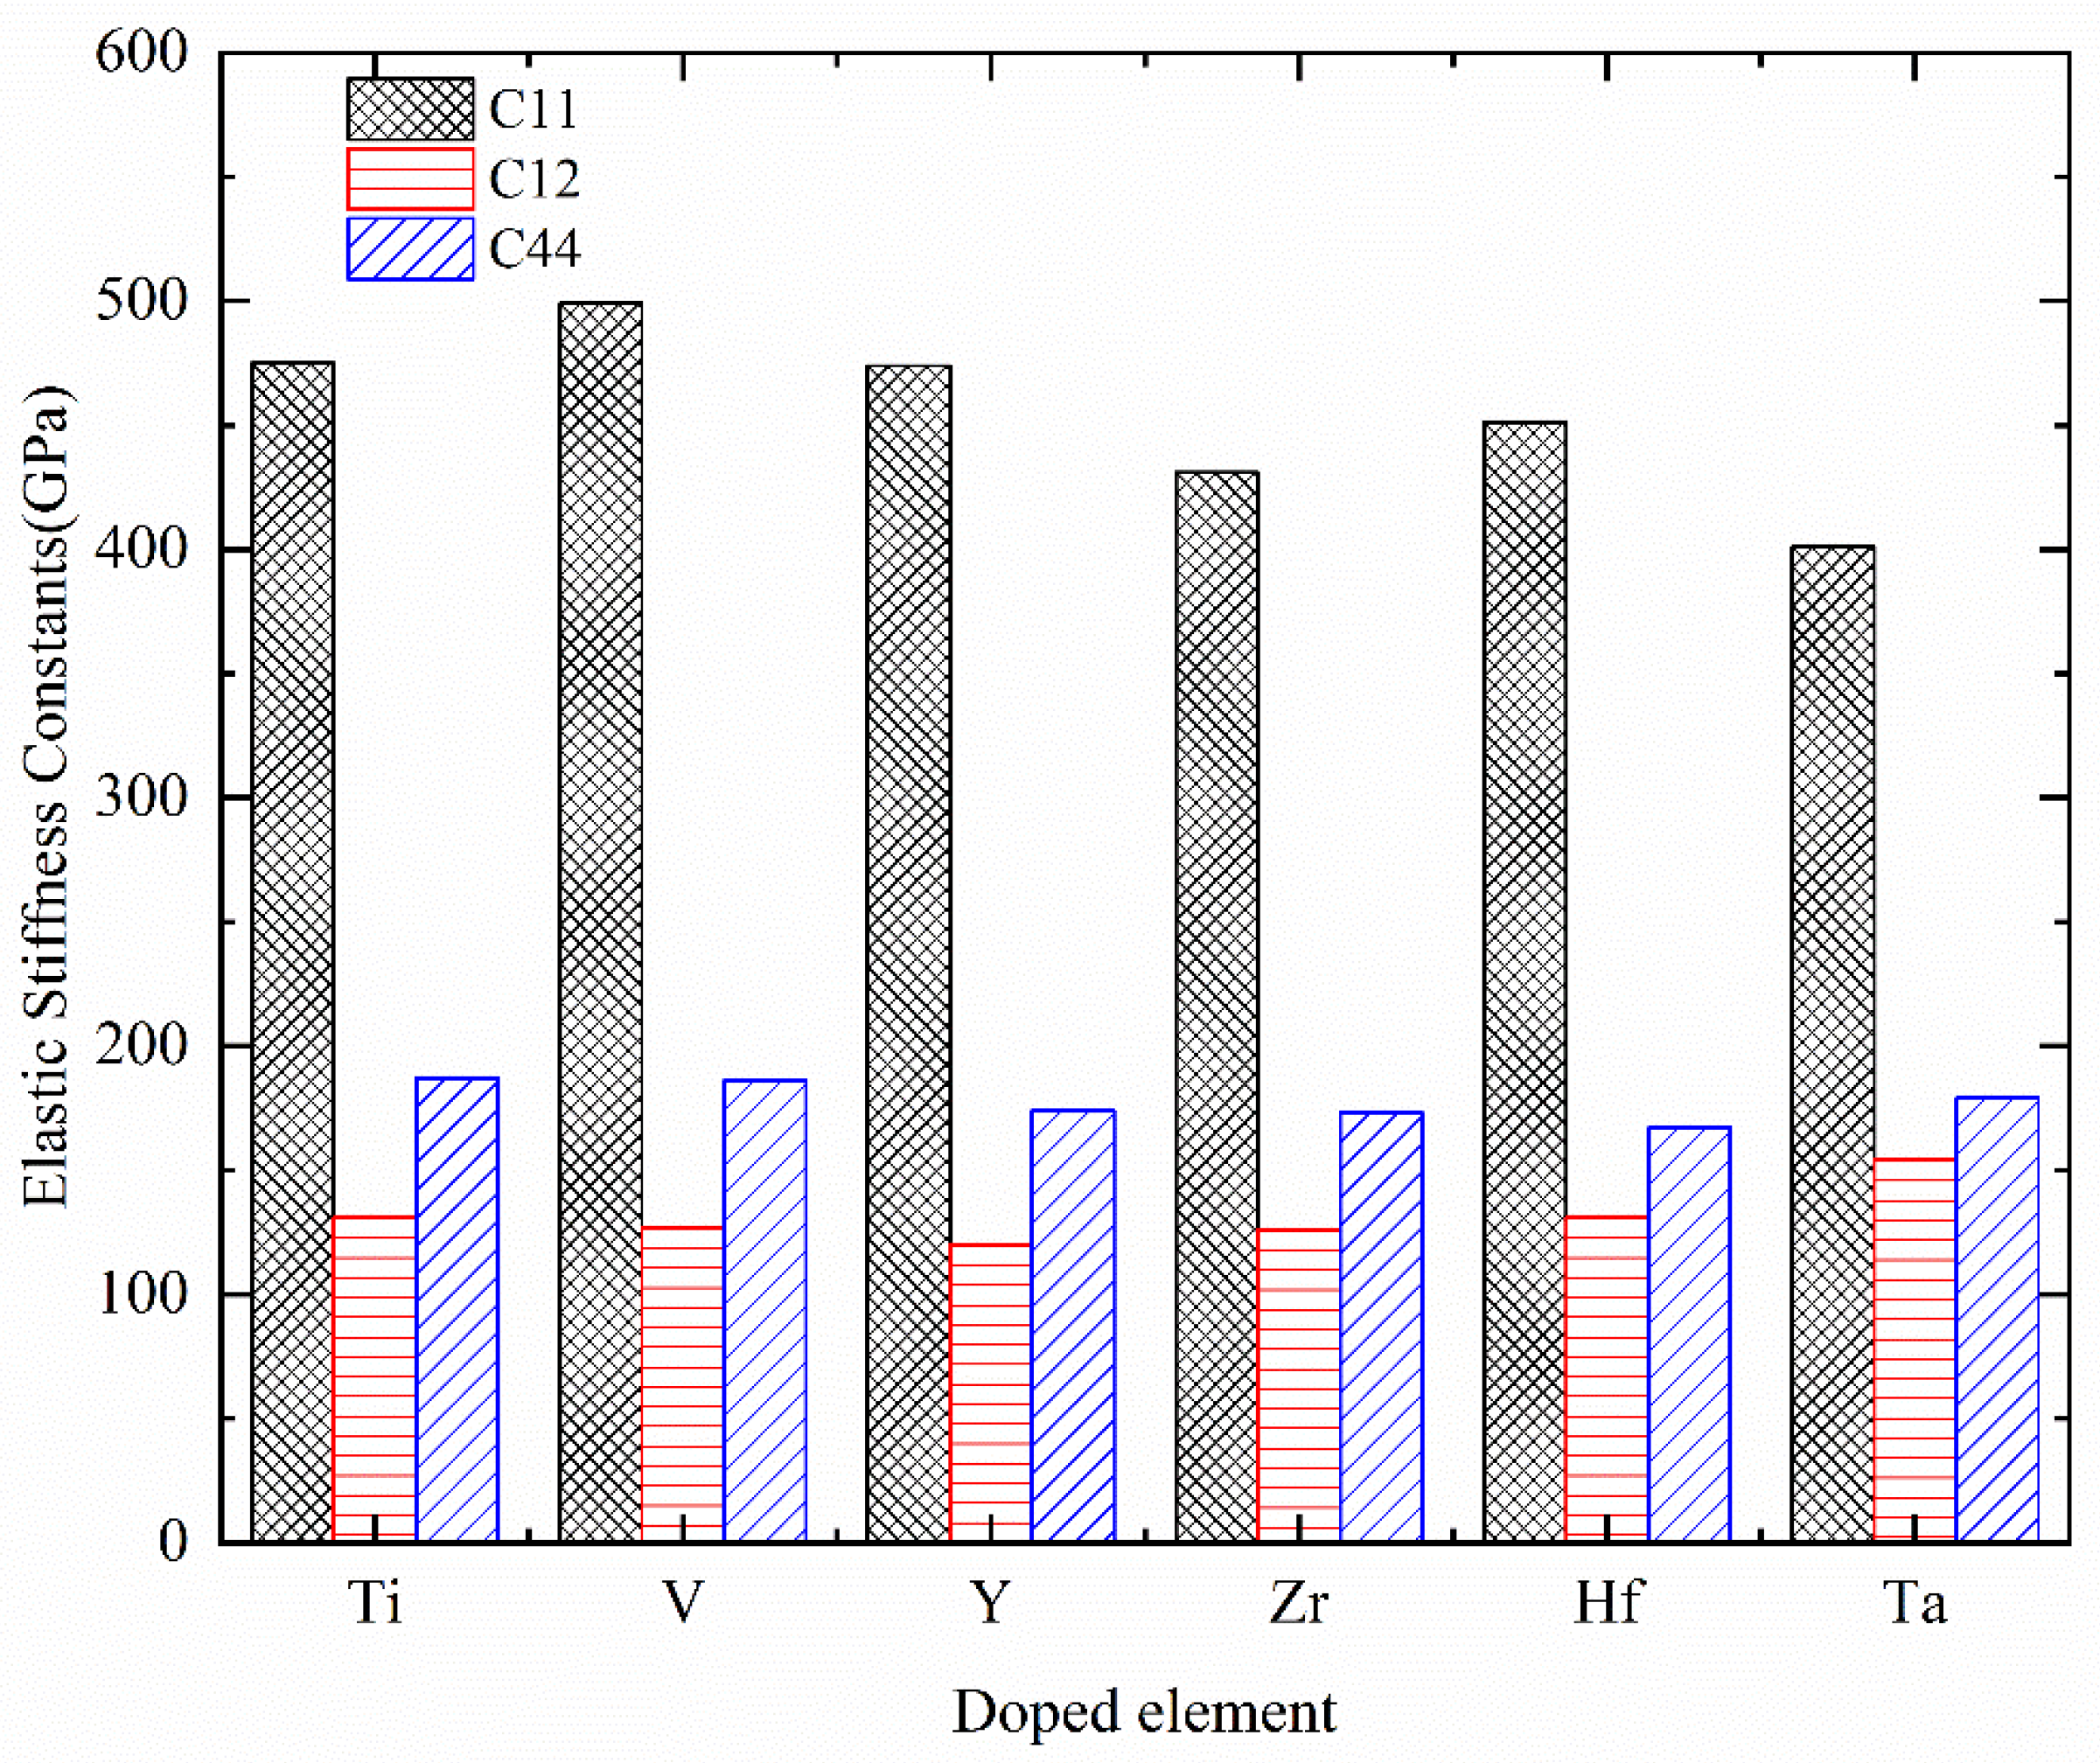
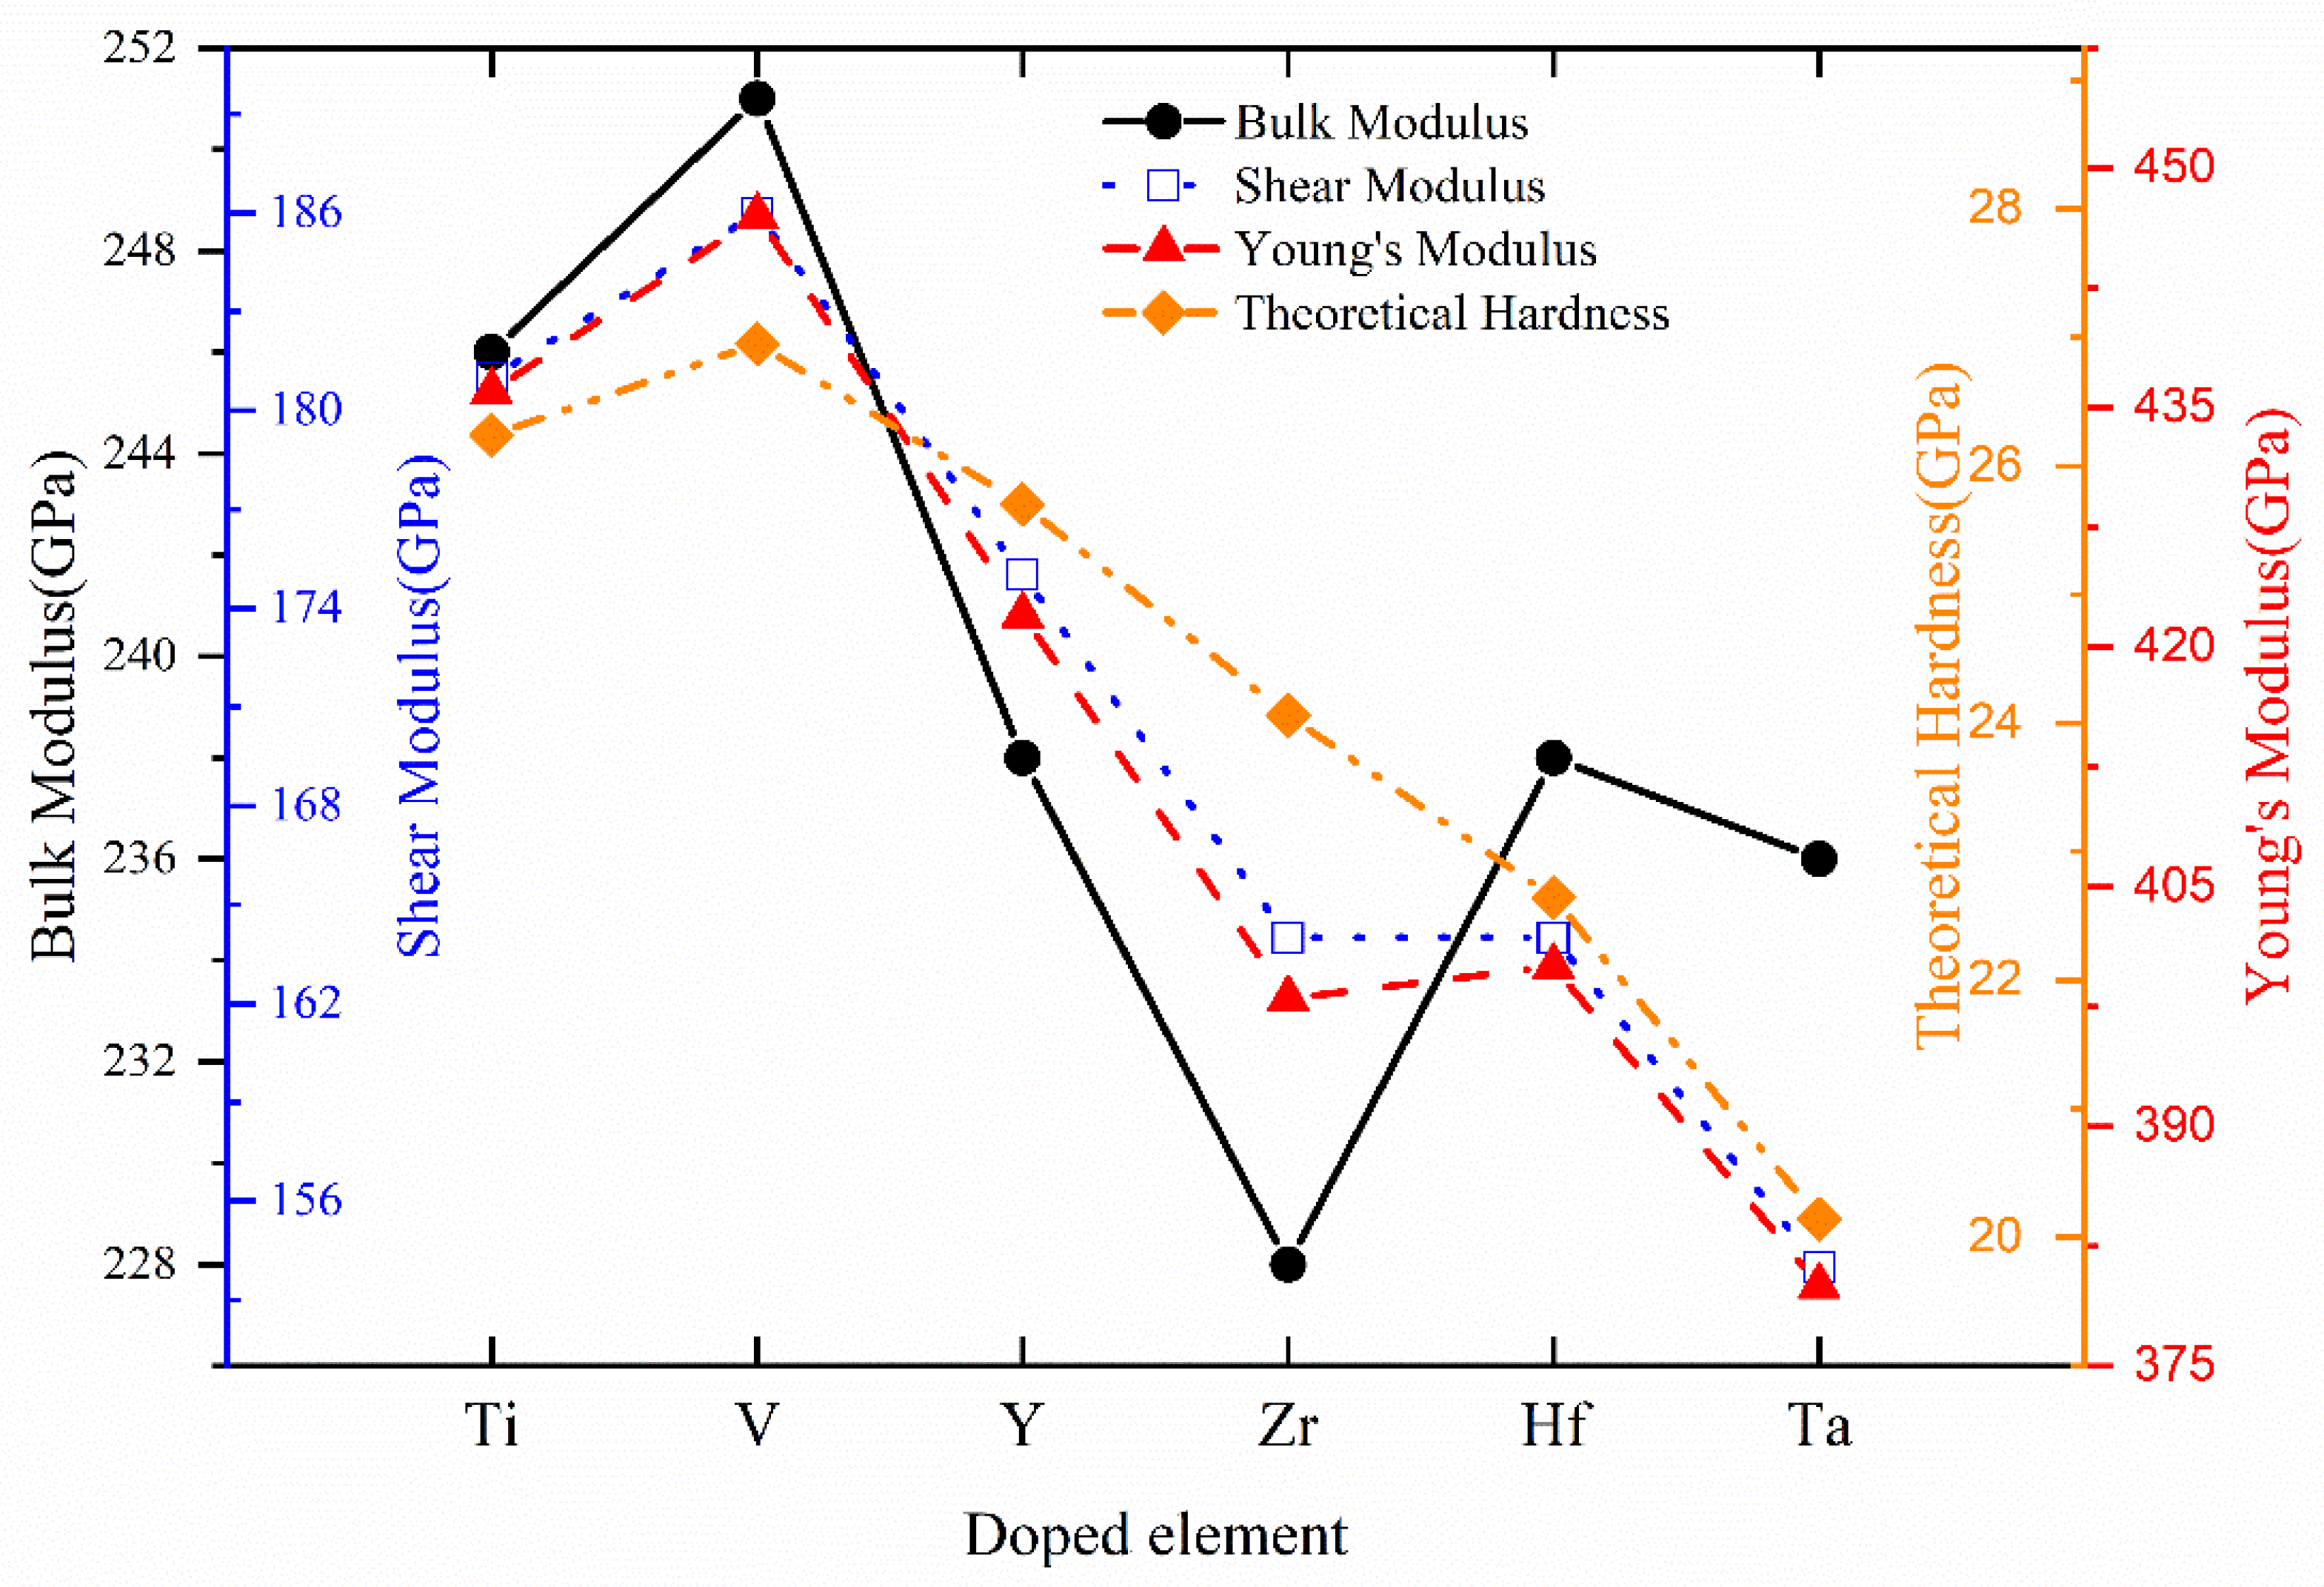
3.2. Elastic Properties
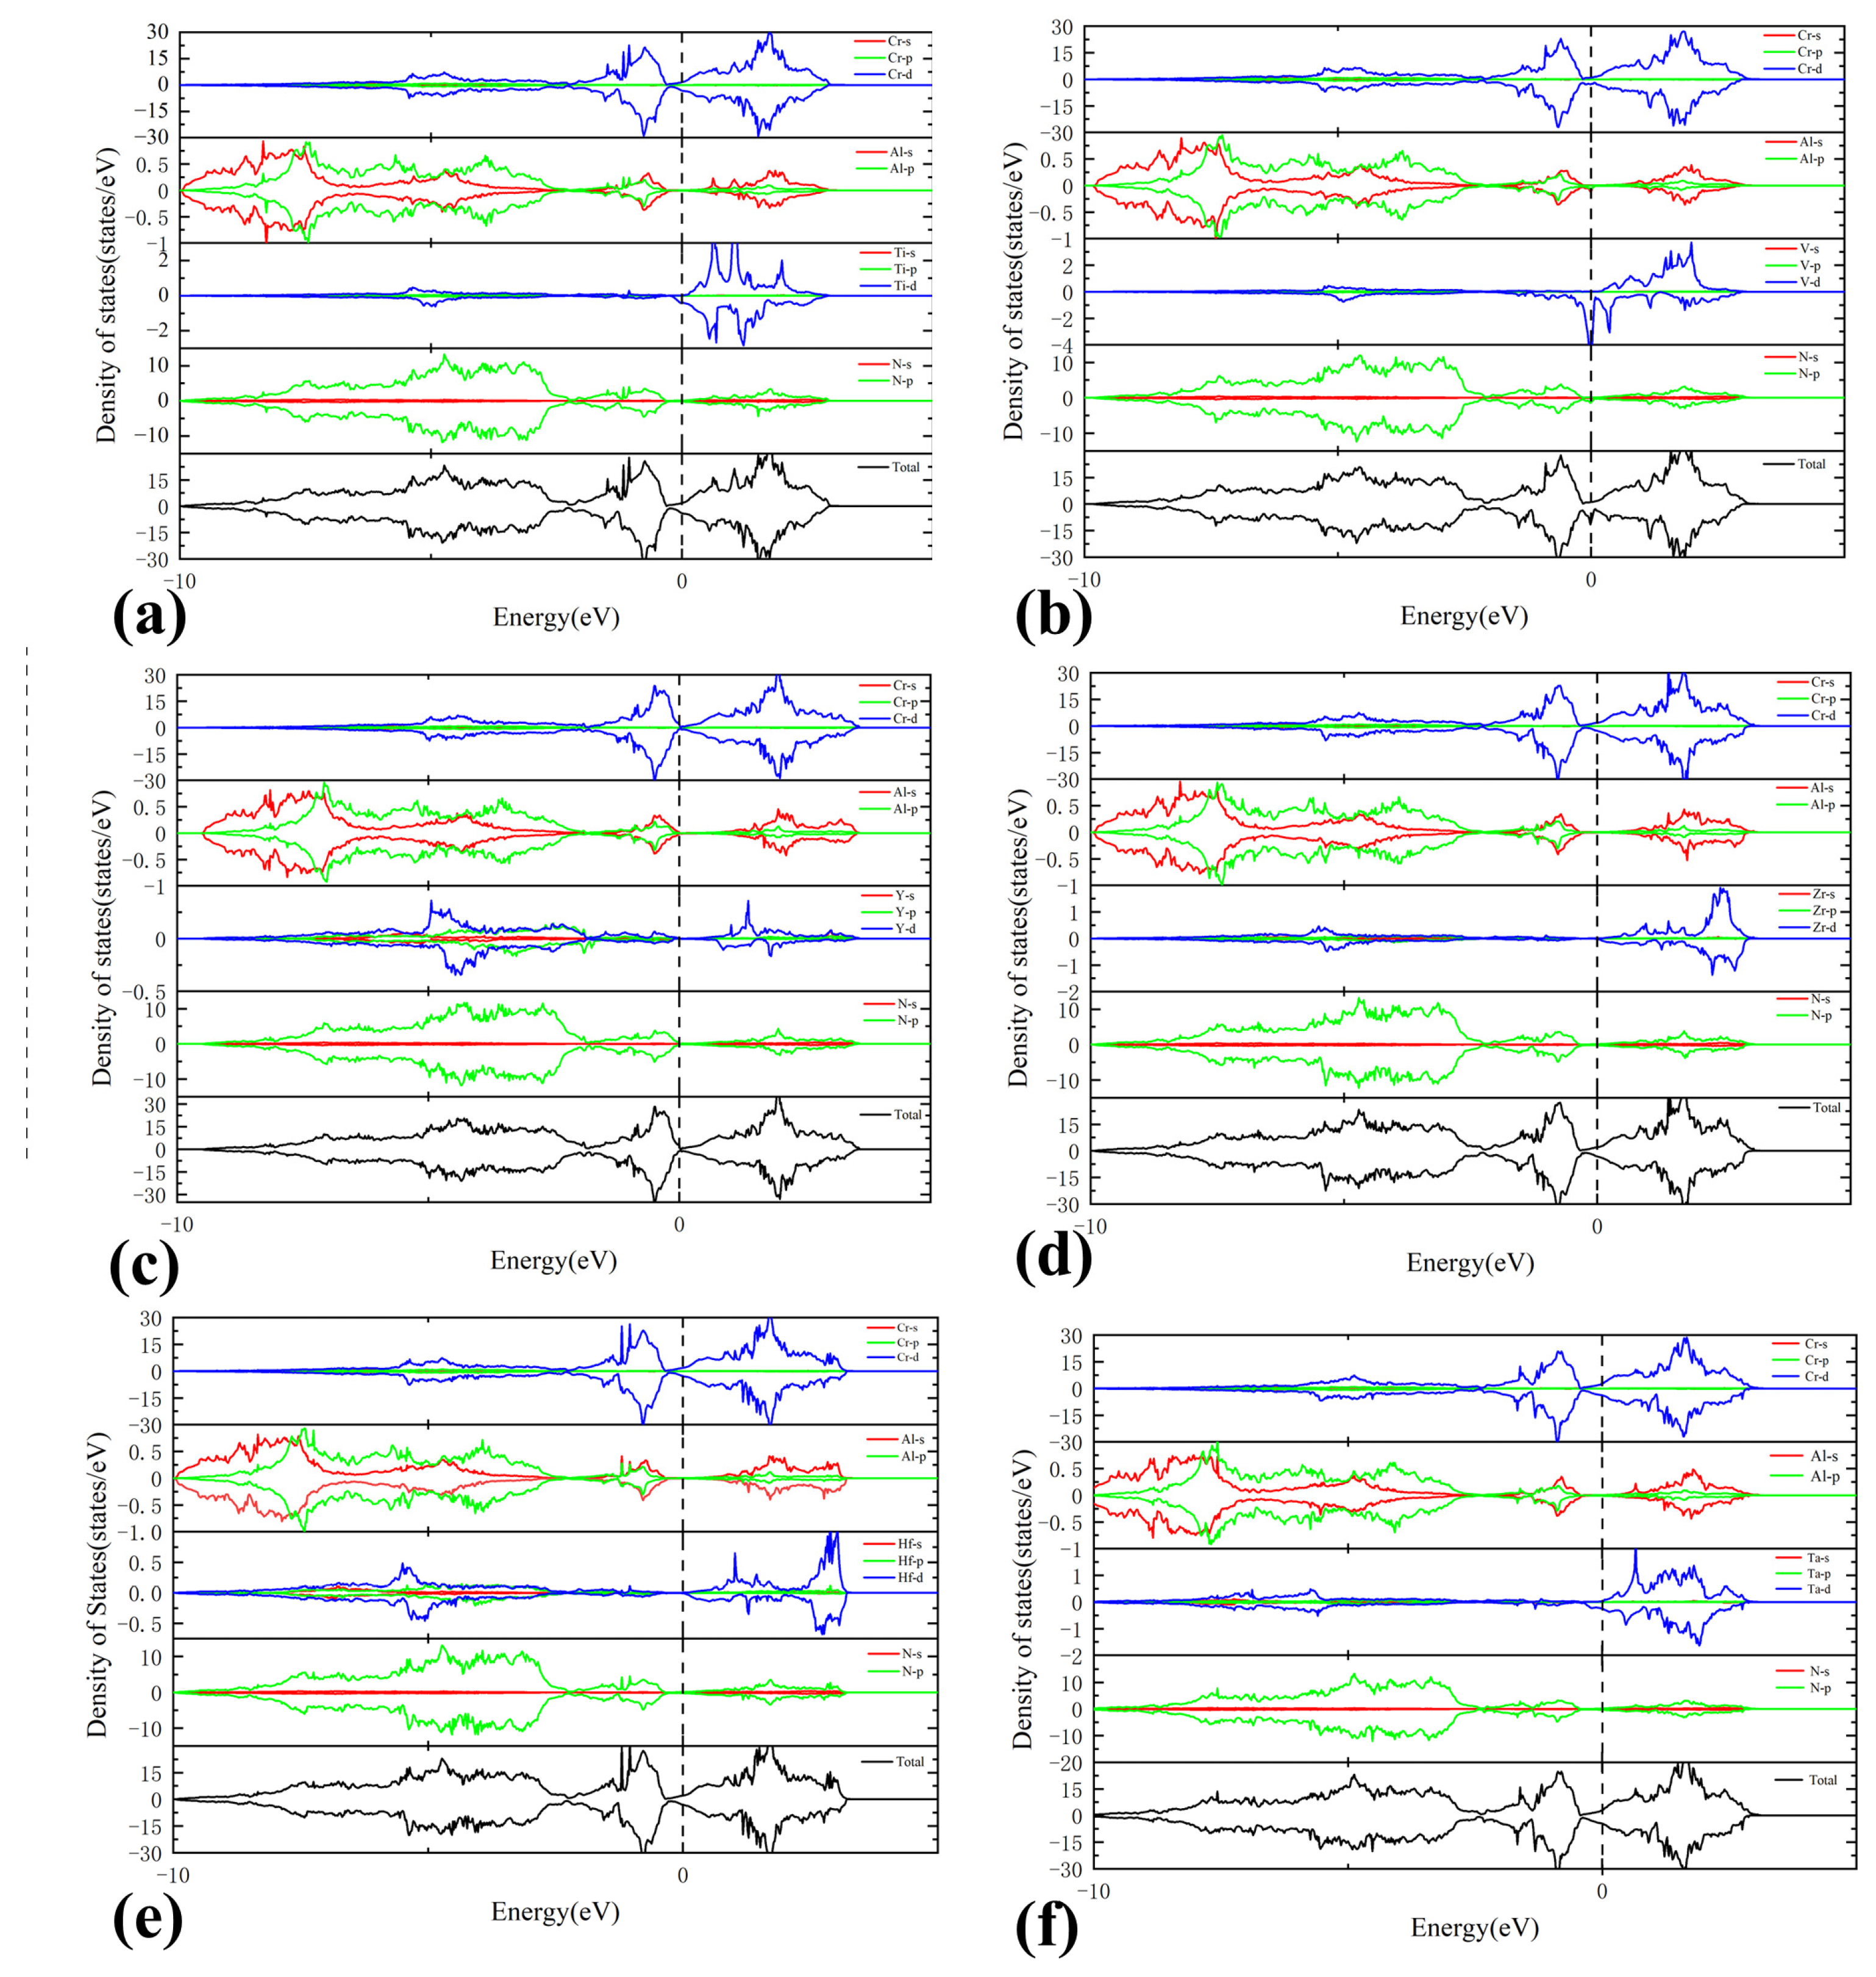
3.3. Electronic Properties
4. Conclusions
Author Contributions
Funding
Institutional Review Board Statement
Informed Consent Statement
Data Availability Statement
Conflicts of Interest
References
- Willmann, H.; Mayrhofer, P.H.; Persson, P.O.Å.; Reiter, A.E.; Hultman, L.; Mitterer, C. Thermal stability of Al–Cr–N hard coatings. Scr. Mater. 2006, 54, 1847–1851. [Google Scholar] [CrossRef]
- Reiter, A.E.; Mitterer, C.; Sartory, B. Oxidation of arc-evaporated Al1−xCrxN coatings. J. Vac. Sci. Technol. A 2007, 25, 711–720. [Google Scholar] [CrossRef]
- Reiter, A.E.; Derflinger, V.H.; Hanselmann, B.; Bachmann, T.; Sartory, B. Investigation of the properties of Al1−xCx Ncoatings prepared by cathodic arc evaporation. Surf. Coat. Technol. 2005, 200, 2114–2122. [Google Scholar] [CrossRef]
- Franz, R.; Neidhardt, J.; Kaindl, R.; Sartory, B.; Tessadri, R.; Lechthaler, M.; Polcik, P.; Mitterer, C. Influence of phase transition on the tribological performance of arc-evaporated AlCrVN hard coatings. Surf. Coat. Technol. 2009, 203, 1101–1105. [Google Scholar] [CrossRef]
- Franz, R.; Neidhardt, J.; Sartory, B.; Kaindl, R.; Tessadri, R.; Polcik, P.; Derflinger, V.H.; Mitterer, C. High-temperature low-friction properties of vanadium-alloyed AlCrN coatings. Tribol. Lett. 2006, 23, 101–107. [Google Scholar] [CrossRef]
- Zhou, J.; Hu, C.; Chen, L. Structure, mechanical properties and thermal stability of CrAlNbN/TiN multilayers. Vacuum 2021, 188, 110182. [Google Scholar] [CrossRef]
- Wang, Y.; Ji, Y. Influence of Mo Doping on the Microstructure, Friction, and Wear Properties of CrAlN Films. J. Mater. Eng. Perform. 2021, 30, 1938–1944. [Google Scholar] [CrossRef]
- Tian, J.L.; Hu, C.; Chen, L.; Lou, Y.M.; Zhao, N.N. mechanical and thermal properties of Y-doped CrAlN coatings. Trans. Nonferrous Met. Soc. China 2021, 31, 2740–2749. [Google Scholar] [CrossRef]
- Wang, Y.-X.; Wu, S.-L.; Pan, J.; Zhang, X. Effect of Y content on the microstructure, tribological and corrosion properties of CrAlYN coatings deposited by magnetron sputtering. Mater. Res. Express 2019, 6, 096402. [Google Scholar] [CrossRef]
- Liu, S.; Ong, B.D.; Guo, J.; Liu, E.; Zeng, X. Wear performance of Y-doped nanolayered CrN/AlN coatings. Surf. Coat. Technol. 2019, 367, 349–357. [Google Scholar] [CrossRef]
- Mikula, M.; Plašienka, D.; Roch, T.; Štyráková, K.; Satrapinskyy, L.; Drienovský, M.; Girman, V.; Grančič, B.; Pleceník, A.; Kúš, P. Structural evolution of TaN-alloyed Cr–Al–Y–N coatings. Surf. Coat. Technol. 2016, 288, 203–210. [Google Scholar] [CrossRef]
- Domínguez-Meister, S.; El Mrabet, S.; Escobar-Galindo, R.; Mariscal, A.; Jiménez de Haro, M.C.; Justo, A.; Brizuela, M.; Rojas, T.C.; Sánchez-López, J.C. Role of Y in the oxidation resistance of CrAlYN coatings. Appl. Surf. Sci. 2015, 353, 504–511. [Google Scholar] [CrossRef]
- Sánchez-López, J.C.; Contreras, A.; Domínguez-Meister, S.; García-Luis, A.; Brizuela, M. Tribological behaviour at high temperature of hard CrAlN coatings doped with Y or Zr. Thin Solid Film. 2014, 550, 413–420. [Google Scholar] [CrossRef]
- Qi, Z.B.; Wu, Z.T.; Wang, Z.C. Improved hardness and oxidation resistance for CrAlN hard coatings with Y addition by magnetron co-sputtering. Surf. Coat. Technol. 2014, 259, 146–151. [Google Scholar] [CrossRef]
- Rojas, T.C.; El Mrabet, S.; Domínguez-Meister, S.; Brizuela, M.; García-Luis, A.; Sánchez-López, J.C. Chemical and microstructural characterization of (Y or Zr)-doped CrAlN coatings. Surf. Coat. Technol. 2012, 211, 104–110. [Google Scholar] [CrossRef]
- Rovere, F.; Music, D.; Schneider, J.M.; Mayrhofer, P.H. Experimental and computational study on the effect of yttrium on the phase stability of sputtered Cr–Al–Y–N hard coatings. Acta Mater. 2010, 58, 2708–2715. [Google Scholar] [CrossRef]
- Braun, R.; Rovere, F.; Mayrhofer, P.H.; Leyens, C. Environmental protection of γ-TiAl based alloy Ti-45Al-8Nb by CrAlYN thin films and thermal barrier coatings. Intermetallics 2010, 18, 479–486. [Google Scholar] [CrossRef]
- Brizuela, M.; García-Luis, A.; Corengia, P.; González-Santamaría, D.; Muñoz, R.; González, J.-J. Microstructural, Mechanical and Tribological Properties of CrAlYN Coatings Deposited by Magnetron Sputtering. Plasma Process. Polym. 2009, 6, S162–S167. [Google Scholar] [CrossRef]
- Rovere, F.; Mayrhofer, P.H. Thermal stability and thermo-mechanical properties of magnetron sputtered Cr-Al-Y-N coatings. J. Vac. Sci. Technol. A 2008, 26, 29–35. [Google Scholar] [CrossRef]
- Rovere, F.; Mayrhofer, P.H.; Reinholdt, A.; Mayer, J.; Schneider, J.M. The effect of yttrium incorporation on the oxidation resistance of Cr–Al–N coatings. Surf. Coat. Technol. 2008, 202, 5870–5875. [Google Scholar] [CrossRef]
- Endrino, J.L.; Derflinger, V. The influence of alloying elements on the phase stability and mechanical properties of AlCrN coatings. Surf. Coat. Technol. 2005, 200, 988–992. [Google Scholar] [CrossRef]
- Wang, Y.-X.; Tang, Y.-J.; Wan, W.; Zhang, X. Effect of Ni doping on the microstructure and toughness of CrAlN coatings deposited by magnetron sputtering. Mater. Res. Express 2020, 7, 026414. [Google Scholar] [CrossRef]
- Hu, C.; Xu, Y.X.; Chen, L.; Pei, F.; Du, Y. Mechanical properties, thermal stability and oxidation resistance of Ta-doped CrAlN coatings. Surf. Coat. Technol. 2019, 368, 25–32. [Google Scholar] [CrossRef]
- Hollerweger, R.; Zhou, L.; Holec, D.; Koller, C.M.; Rachbauer, R.; Polcik, P.; Mayrhofer, P.H. Controlling microstructure, preferred orientation, and mechanical properties of Cr-Al-N by bombardment and alloying with Ta. J. Appl. Phys. 2016, 119, 065304. [Google Scholar] [CrossRef]
- Tillmann, W.; Lopes Dias, N.F.; Stangier, D. Effect of Hf on the microstructure, mechanical properties, and oxidation behavior of sputtered CrAlN films. Vacuum 2018, 154, 208–213. [Google Scholar] [CrossRef]
- Tillmann, W.; Kokalj, D.; Stangier, D.; Paulus, M.; Sternemann, C.; Tolan, M. Investigation on the oxidation behavior of AlCrVxN thin films by means of synchrotron radiation and influence on the high temperature friction. Appl. Surf. Sci. 2018, 427, 511–521. [Google Scholar] [CrossRef]
- Delgado, A.; Garcia-Zarco, O.; Restrepo, J.; Rodil, S.E. AlCrVN coatings deposited by cathodic arc: Friction and wear properties evaluated using reciprocating sliding test. Surf. Coat. Technol. 2022, 442, 128140. [Google Scholar] [CrossRef]
- Xu, Y.X.; Hu, C.; Chen, L.; Pei, F.; Du, Y. Effect of V-addition on the thermal stability and oxidation resistance of CrAlN coatings. Ceram. Int. 2018, 44, 7013–7019. [Google Scholar] [CrossRef]
- Franz, R.; Neidhardt, J.; Sartory, B.; Tessadri, R.; Mitterer, C. Micro- and bonding structure of arc-evaporated AlCrVN hard coatings. Thin Solid Film. 2008, 516, 6151–6157. [Google Scholar] [CrossRef]
- Chen, L.; Liu, Z.Q.; Xu, Y.X.; Du, Y. Influence of Zr on structure, mechanical and thermal properties of Cr–Al–N coatings. Surf. Coat. Technol. 2015, 275, 289–295. [Google Scholar] [CrossRef]
- Li, W.Z.; Chen, Q.Z.; Polcar, T.; Serra, R.; Cavaleiro, A. Influence of Zr alloying on the mechanical properties, thermal stability and oxidation resistance of Cr–Al–N coatings. Appl. Surf. Sci. 2014, 317, 269–277. [Google Scholar] [CrossRef]
- Forsén, R.; Johansson, M.P.; Odén, M.; Ghafoor, N. Effects of Ti alloying of AlCrN coatings on thermal stability and oxidation resistance. Thin Solid Film. 2013, 534, 394–402. [Google Scholar] [CrossRef]
- Tam, P.L.; Zhou, Z.F.; Shum, P.W.; Li, K.Y. Structural, mechanical, and tribological studies of Cr–Ti–Al–N coating with different chemical compositions. Thin Solid Film. 2008, 516, 5725–5731. [Google Scholar] [CrossRef]
- Xu, Y.; Chen, L.; Liu, Z.; Pei, F.; Du, Y. Influence of Ti on the mechanical properties, thermal stability and oxidation resistance of Al–Cr–N coatings. Vacuum 2015, 120, 127–131. [Google Scholar] [CrossRef]
- Lin, J.; Zhang, X.; Ou, Y.; Wei, R. The structure, oxidation resistance, mechanical and tribological properties of CrTiAlN coatings. Surf. Coat. Technol. 2015, 277, 58–66. [Google Scholar] [CrossRef]
- Sun, S.Q.; Ye, Y.W.; Wang, Y.X.; Liu, M.Q.; Liu, X.; Li, J.L.; Wang, L.P. Structure and tribological performances of CrAlSiN coatings with different Si percentages in seawater. Tribol. Int. 2017, 115, 591–599. [Google Scholar] [CrossRef]
- Nguyen, H.C.; Joska, Z.; Pokorný, Z.; Studený, Z.; Sedlák, J.; Majerík, J.; Svoboda, E.; Dobrocký, D.; Procházka, J.; Tran, Q.D. Effect of Boron and Vanadium Addition on Friction-Wear Properties of the Coating AlCrN for Special Applications. Materials 2021, 14, 4651. [Google Scholar] [CrossRef]
- Liu, B.; Zhao, J.; Liu, Y.; Xi, J.; Li, Q.; Xiang, H.; Zhou, Y. Application of high-throughput first-principles calculations in ceramic innovation. J. Mater. Sci. Technol. 2021, 88, 143–157. [Google Scholar] [CrossRef]
- Zhao, S.; Wang, B.; Zhang, Z.; Zhang, X.; He, S.; Yu, H. First-principles computational insights into lithium battery cathode materials. Electrochem. Energy Rev. 2022, 5, 1–31. [Google Scholar] [CrossRef]
- Ou, P.; Wang, J.; Shang, S.; Chen, L.; Du, Y.; Liu, Z.-K.; Zheng, F. A first-principles study of structure, elasticity and thermal decomposition of Ti1-xTMxN alloys (TM = Y, Zr, Nb, Hf, and Ta). Surf. Coat. Technol. 2015, 264, 41–48. [Google Scholar] [CrossRef]
- Zhu, L.P.; Wang, J.; Dong, C.C.; Shang, S.L.; Du, Y.; Liu, Z.-K.; Zhang, S.-Y. Understanding the surface adsorption and oxidation of cubic Cr0.5Al0.5N by first-principles calculations. Comp. Mater. Sci. 2021, 196, 110518. [Google Scholar] [CrossRef]
- Kresse, G.; Hafner, J. Ab initio molecular dynamics for open-shell transition metals. Phys. Rev. B 1993, 48, 13115–13118. [Google Scholar] [CrossRef]
- Kresse, G.; Hafner, J. Ab initio molecular-dynamics simulation of the liquid-metal-amorphous-semiconductor transition in germanium. Phys. Rev. B 1994, 49, 14251–14269. [Google Scholar] [CrossRef]
- Kresse, G.; Joubert, D. From ultrasoft pseudopotentials to the projector augmented-wave method. Phys. Rev. B 1999, 59, 1758–1775. [Google Scholar] [CrossRef]
- Perdew, J.P.; Burke, K.; Ernzerhof, M. Generalized gradient approximation made simple. Phys. Rev. Lett. 1996, 77, 3865. [Google Scholar] [CrossRef] [PubMed]
- Monkhorst, H.J.; Pack, J.D. Special points for Brillouin-zone integrations. Phys. Rev. B 1976, 13, 5188. [Google Scholar] [CrossRef]
- Blöchl, P.E. Projector augmented-wave method. Phys. Rev. B 1994, 50, 17953. [Google Scholar] [CrossRef] [PubMed]
- Birch, F. Finite Elastic Strain of Cubic Crystals. Phys. Rev. 1947, 71, 809–824. [Google Scholar] [CrossRef]
- Birch, F. Finite strain isotherm and velocities for single-crystal and polycrystalline NaCl at high pressures and 300 K. J. Geophys. Res. Solid Earth 1978, 83, 1257–1268. [Google Scholar] [CrossRef]
- Guo, X.; Xu, H. Enthalpies of formation of polyhalite: A mineral relevant to salt repository. J. Chem. Thermodyn. 2017, 114, 44–47. [Google Scholar] [CrossRef]
- Zhang, L.; Chen, H.; Tao, X.; Cai, H.; Liu, J.; Ouyang, Y.; Peng, Q.; Du, Y. Machine learning reveals the importance of the formation enthalpy and atom-size difference in forming phases of high entropy alloys. Mater. Des. 2020, 193, 108835. [Google Scholar] [CrossRef]
- Le Page, Y.; Saxe, P. Symmetry-general least-squares extraction of elastic data for strained materials from ab initio calculations of stress. Phys. Rev. B 2002, 65, 104104. [Google Scholar] [CrossRef]
- Shang, S.; Wang, Y.; Liu, Z.-K. First-principles elastic constants of α-and θ-Al2O3. Appl. Phys. Lett. 2007, 90, 101909. [Google Scholar] [CrossRef]
- Hill, R. The Elastic Behaviour of a Crystalline Aggregate. Proc. Phys. Soc. Sect. A 1952, 65, 349. [Google Scholar] [CrossRef]
- Chen, X.-Q.; Niu, H.; Li, D.; Li, Y. Modeling hardness of polycrystalline materials and bulk metallic glasses. Intermetallics 2011, 19, 1275–1281. [Google Scholar] [CrossRef]
- Nye, J.F. Physical Properties of Crystals: Their Representation by Tensors and Matrices; Oxford University Press: New York, NY, USA, 1985. [Google Scholar]
- Zhou, L.; Holec, D.; Mayrhofer, P.H. First-principles study of elastic properties of cubic Cr1-xAlxN alloys. J. Appl. Phys. 2013, 113, 043511. [Google Scholar] [CrossRef]
- Hao, Z.; Fu, W.; Fan, Y.; Qiu, Y. Theoretical Calculation and Performance Analysis of Four-Element Metal Nitride Coatings Based on First Principles. J. Mater. Eng. Perform. 2022, 31, 8084–8093. [Google Scholar] [CrossRef]
- Cao, Z.; Jin, N.; Ye, J.; Zhuang, D.; Liu, Y. A first principles investigation on the solid solution behavior of transition metal elements (W, Mo, Ta, Cr) in Ti(C,N). Int. J. Refract. Met. Hard Mater. 2021, 99, 105605. [Google Scholar] [CrossRef]
- Anderson, O.L.; Demarest Jr, H.H. Elastic constants of the central force model for cubic structures: Polycrystalline aggregates and instabilities. J. Geophys. Res. 1971, 76, 1349–1369. [Google Scholar] [CrossRef]
- Ravindran, P.; Fast, L.; Korzhavyi, P.A.; Johansson, B.; Wills, J.; Eriksson, O. Density Functional Theory For Calculation Of Elastic Properties Of Orthorhombic Crystals: Application to TiSi2. J. Appl. Phys. 1998, 84, 4891. [Google Scholar] [CrossRef]
- Yoo, M.H. On the theory of anomalous yield behavior of Ni3Al—Effect of elastic anisotropy. Scr. Metall. 1986, 20, 915–920. [Google Scholar] [CrossRef]
- Janesko, B.G. Replacing hybrid density functional theory: Motivation and recent advances. Chem. Soc. Rev. 2021, 50, 8470–8495. [Google Scholar] [CrossRef] [PubMed]
- Shinde, R.; Yamijala, S.S.R.K.C.; Wong, B.M. Improved band gaps and structural properties from Wannier-Fermi-Lowdin self-interaction corrections for periodic systems. J. Phys. Condens. Matter 2021, 33, 115501. [Google Scholar] [CrossRef] [PubMed]


| System | Volume (Å3) | Lattice Constant (Å) | Lattice Expansion (%) | Enthalpy of Formation (kJ/mol) |
|---|---|---|---|---|
| Cr0.5Al0.5N | 562.19 | 8.253 | 0 | −80.42 |
| Cr0.47Al0.5Ti0.03N | 564.06 | 8.262 | 0.11 | −83.72 |
| Cr0.47Al0.5V0.03N | 562.07 | 8.253 | 0 | −81.35 |
| Cr0.47Al0.5Y0.03N | 575.06 | 8.316 | 0.76 | −80.67 |
| Cr0.47Al0.5Zr0.03N | 572.14 | 8.302 | 0.60 | −82.44 |
| Cr0.47Al0.5Hf0.03N | 570.72 | 8.293 | 0.51 | −83.67 |
| Cr0.47Al0.5Ta0.03N | 568.89 | 8.286 | 0.40 | −81.20 |
| Compound | Volume (Å3) | Lattice Constant (Å) | Lattice Expansion (%) | Enthalpy of Formation (kJ/mol) |
|---|---|---|---|---|
| Cr0.5Al0.5N | 562.19 | 8.253 | 0 | −80.42 |
| Cr0.44Al0.5Ti0.06N | 565.49 | 8.269 | 0.19 | −86.69 |
| Cr0.44Al0.5V0.06N | 560.40 | 8.243 | −0.12 | −79.89 |
| Cr0.44Al0.5Y0.06N | 585.45 | 8.366 | 1.37 | −79.96 |
| Cr0.44Al0.5Zr0.06N | 581.51 | 8.347 | 1.14 | −82.76 |
| Cr0.44Al0.5Hf0.06N | 576.07 | 8.321 | 0.82 | −84.12 |
| Cr0.44Al0.5Ta0.06N | 572.57 | 8.304 | 0.62 | −78.50 |
| System | C11 | C12 | C44 | C12–C44 | Mechanical Stability |
|---|---|---|---|---|---|
| Cr0.5Al0.5N | 519 | 120 | 184 | −64 | Stable |
| Cr0.5Al0.5N | 502 | 123 | 175 | −52 | Stable |
| Cr0.5Al0.5N | 522 | 121 | 184 | −63 | Stable |
| Cr0.47Al0.5Ti0.03N | 495 | 125 | 186 | −61 | Stable |
| Cr0.47Al0.5V0.03N | 509 | 124 | 185 | −61 | Stable |
| Cr0.47Al0.5Y0.03N | 497 | 119 | 179 | −60 | Stable |
| Cr0.47Al0.5Zr0.03N | 487 | 129 | 182 | −53 | Stable |
| Cr0.47Al0.5Hf0.03N | 492 | 129 | 184 | −55 | Stable |
| Cr0.47Al0.5Ta0.03N | 477 | 130 | 182 | −52 | Stable |
| System | BV | BR | B | GV | GR | G | E | v | B/G | A | HV |
|---|---|---|---|---|---|---|---|---|---|---|---|
| Cr0.5Al0.5N | 253 | 253 | 253 | 190 | 190 | 190 | 456 | 0.20 | 1.33 | 0.92 | 27.82 |
| Cr0.47Al0.5Ti0.03N | 249 | 249 | 249 | 185 | 185 | 185 | 446 | 0.20 | 1.34 | 1.01 | 27.06 |
| Cr0.47Al0.5V0.03N | 252 | 252 | 252 | 188 | 188 | 188 | 452 | 0.20 | 1.34 | 0.96 | 27.32 |
| Cr0.47Al0.5Y0.03N | 245 | 245 | 245 | 183 | 183 | 183 | 439 | 0.20 | 1.34 | 0.95 | 26.93 |
| Cr0.47Al0.5Zr0.03N | 248 | 248 | 248 | 181 | 181 | 181 | 436 | 0.21 | 1.37 | 1.02 | 25.85 |
| Cr0.47Al0.5Hf0.03N | 250 | 250 | 250 | 183 | 183 | 183 | 441 | 0.20 | 1.37 | 1.01 | 26.24 |
| Cr0.47Al0.5Ta0.03N | 246 | 246 | 246 | 179 | 179 | 179 | 431 | 0.21 | 1.38 | 1.05 | 25.59 |
| System | C11 | C12 | C44 | C12–C44 | Mechanical Stability |
|---|---|---|---|---|---|
| Cr0.5Al0.5N | 519 | 120 | 184 | −64 | Stable |
| Cr0.44Al0.5Ti0.06N | 475 | 131 | 187 | −56 | Stable |
| Cr0.44Al0.5V0.06N | 499 | 127 | 186 | −59 | Stable |
| Cr0.44Al0.5Y0.06N | 474 | 120 | 174 | −54 | Stable |
| Cr0.44Al0.5Zr0.06N | 431 | 126 | 173 | −47 | Stable |
| Cr0.44Al0.5Hf0.06N | 451 | 131 | 167 | −36 | Stable |
| Cr0.44Al0.5Ta0.06N | 401 | 154 | 179 | −25 | Stable |
| System | BV | BR | B | GV | GR | G | E | v | B/G | A | HV |
|---|---|---|---|---|---|---|---|---|---|---|---|
| Cr0.5Al0.5N | 253 | 253 | 253 | 190 | 190 | 190 | 456 | 0.20 | 1.33 | 0.92 | 27.82 |
| Cr0.44Al0.5Ti0.06N | 246 | 246 | 246 | 181 | 181 | 181 | 436 | 0.20 | 1.36 | 1.09 | 26.24 |
| Cr0.44Al0.5V0.06N | 251 | 251 | 251 | 186 | 186 | 186 | 447 | 0.20 | 1.35 | 1.00 | 26.95 |
| Cr0.44Al0.5Y0.06N | 238 | 238 | 238 | 175 | 175 | 175 | 422 | 0.20 | 1.36 | 0.98 | 25.70 |
| Cr0.44Al0.5Zr0.06N | 228 | 228 | 228 | 164 | 165 | 164 | 398 | 0.21 | 1.38 | 1.13 | 24.06 |
| Cr0.44Al0.5Hf0.06N | 238 | 238 | 238 | 164 | 164 | 164 | 400 | 0.22 | 1.45 | 1.04 | 22.64 |
| Cr0.44Al0.5Ta0.06N | 236 | 236 | 236 | 154 | 157 | 152 | 380 | 0.23 | 1.53 | 1.45 | 20.14 |
Disclaimer/Publisher’s Note: The statements, opinions and data contained in all publications are solely those of the individual author(s) and contributor(s) and not of MDPI and/or the editor(s). MDPI and/or the editor(s) disclaim responsibility for any injury to people or property resulting from any ideas, methods, instructions or products referred to in the content. |
© 2024 by the authors. Licensee MDPI, Basel, Switzerland. This article is an open access article distributed under the terms and conditions of the Creative Commons Attribution (CC BY) license (https://creativecommons.org/licenses/by/4.0/).
Share and Cite
Dai, W.; Zou, Y.; Wang, J.; Su, Y.; Zhang, D. A First-Principles Study of Mechanical and Electronic Properties of Cr0.5-xAl0.5TMxN Hard Coatings (TM = Ti, V, Y, Zr, Hf, and Ta). Materials 2024, 17, 1070. https://doi.org/10.3390/ma17051070
Dai W, Zou Y, Wang J, Su Y, Zhang D. A First-Principles Study of Mechanical and Electronic Properties of Cr0.5-xAl0.5TMxN Hard Coatings (TM = Ti, V, Y, Zr, Hf, and Ta). Materials. 2024; 17(5):1070. https://doi.org/10.3390/ma17051070
Chicago/Turabian StyleDai, Weike, You Zou, Jiong Wang, Yue Su, and Donglan Zhang. 2024. "A First-Principles Study of Mechanical and Electronic Properties of Cr0.5-xAl0.5TMxN Hard Coatings (TM = Ti, V, Y, Zr, Hf, and Ta)" Materials 17, no. 5: 1070. https://doi.org/10.3390/ma17051070
APA StyleDai, W., Zou, Y., Wang, J., Su, Y., & Zhang, D. (2024). A First-Principles Study of Mechanical and Electronic Properties of Cr0.5-xAl0.5TMxN Hard Coatings (TM = Ti, V, Y, Zr, Hf, and Ta). Materials, 17(5), 1070. https://doi.org/10.3390/ma17051070