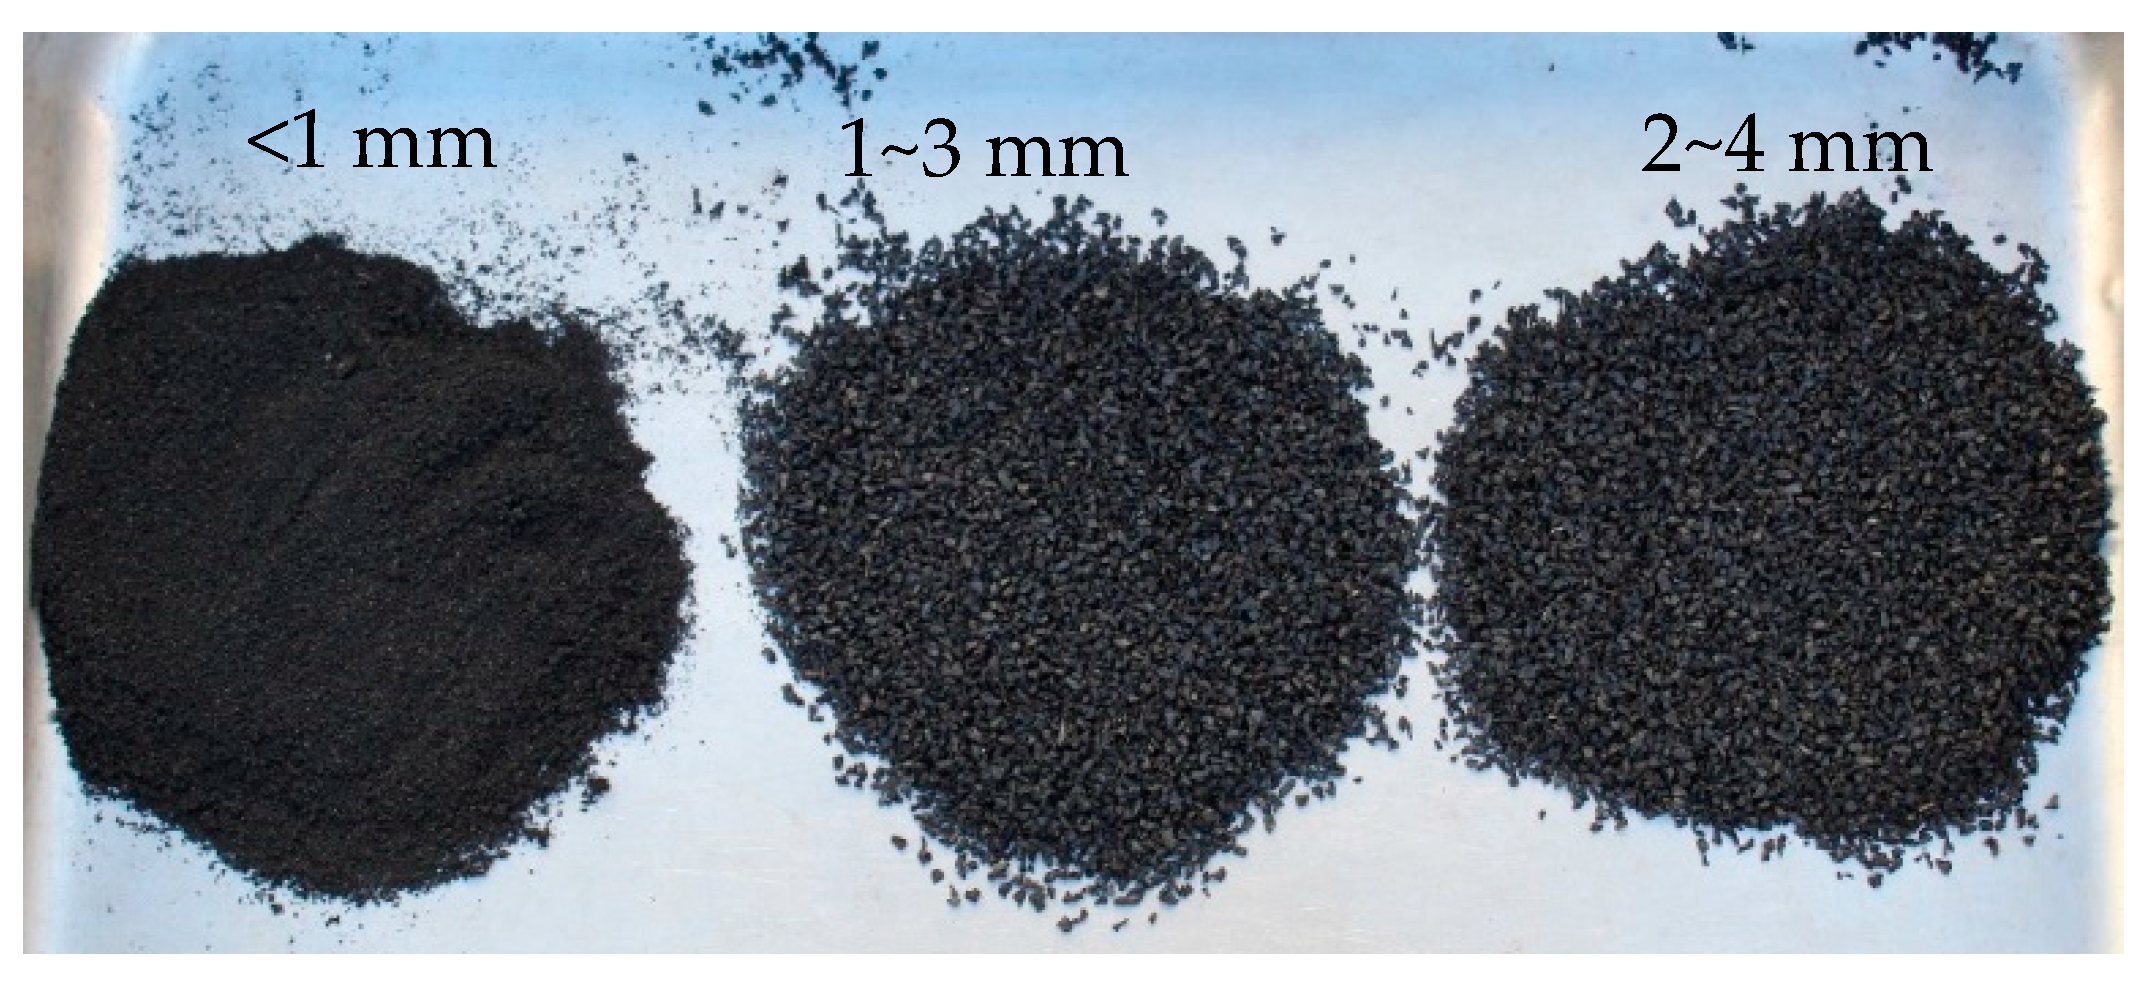
Figure 1.
Particle sizes of crumb rubber.
Figure 1.
Particle sizes of crumb rubber.
Figure 2.
Particle size distribution curve of CR, sand, and allowable limits.
Figure 2.
Particle size distribution curve of CR, sand, and allowable limits.
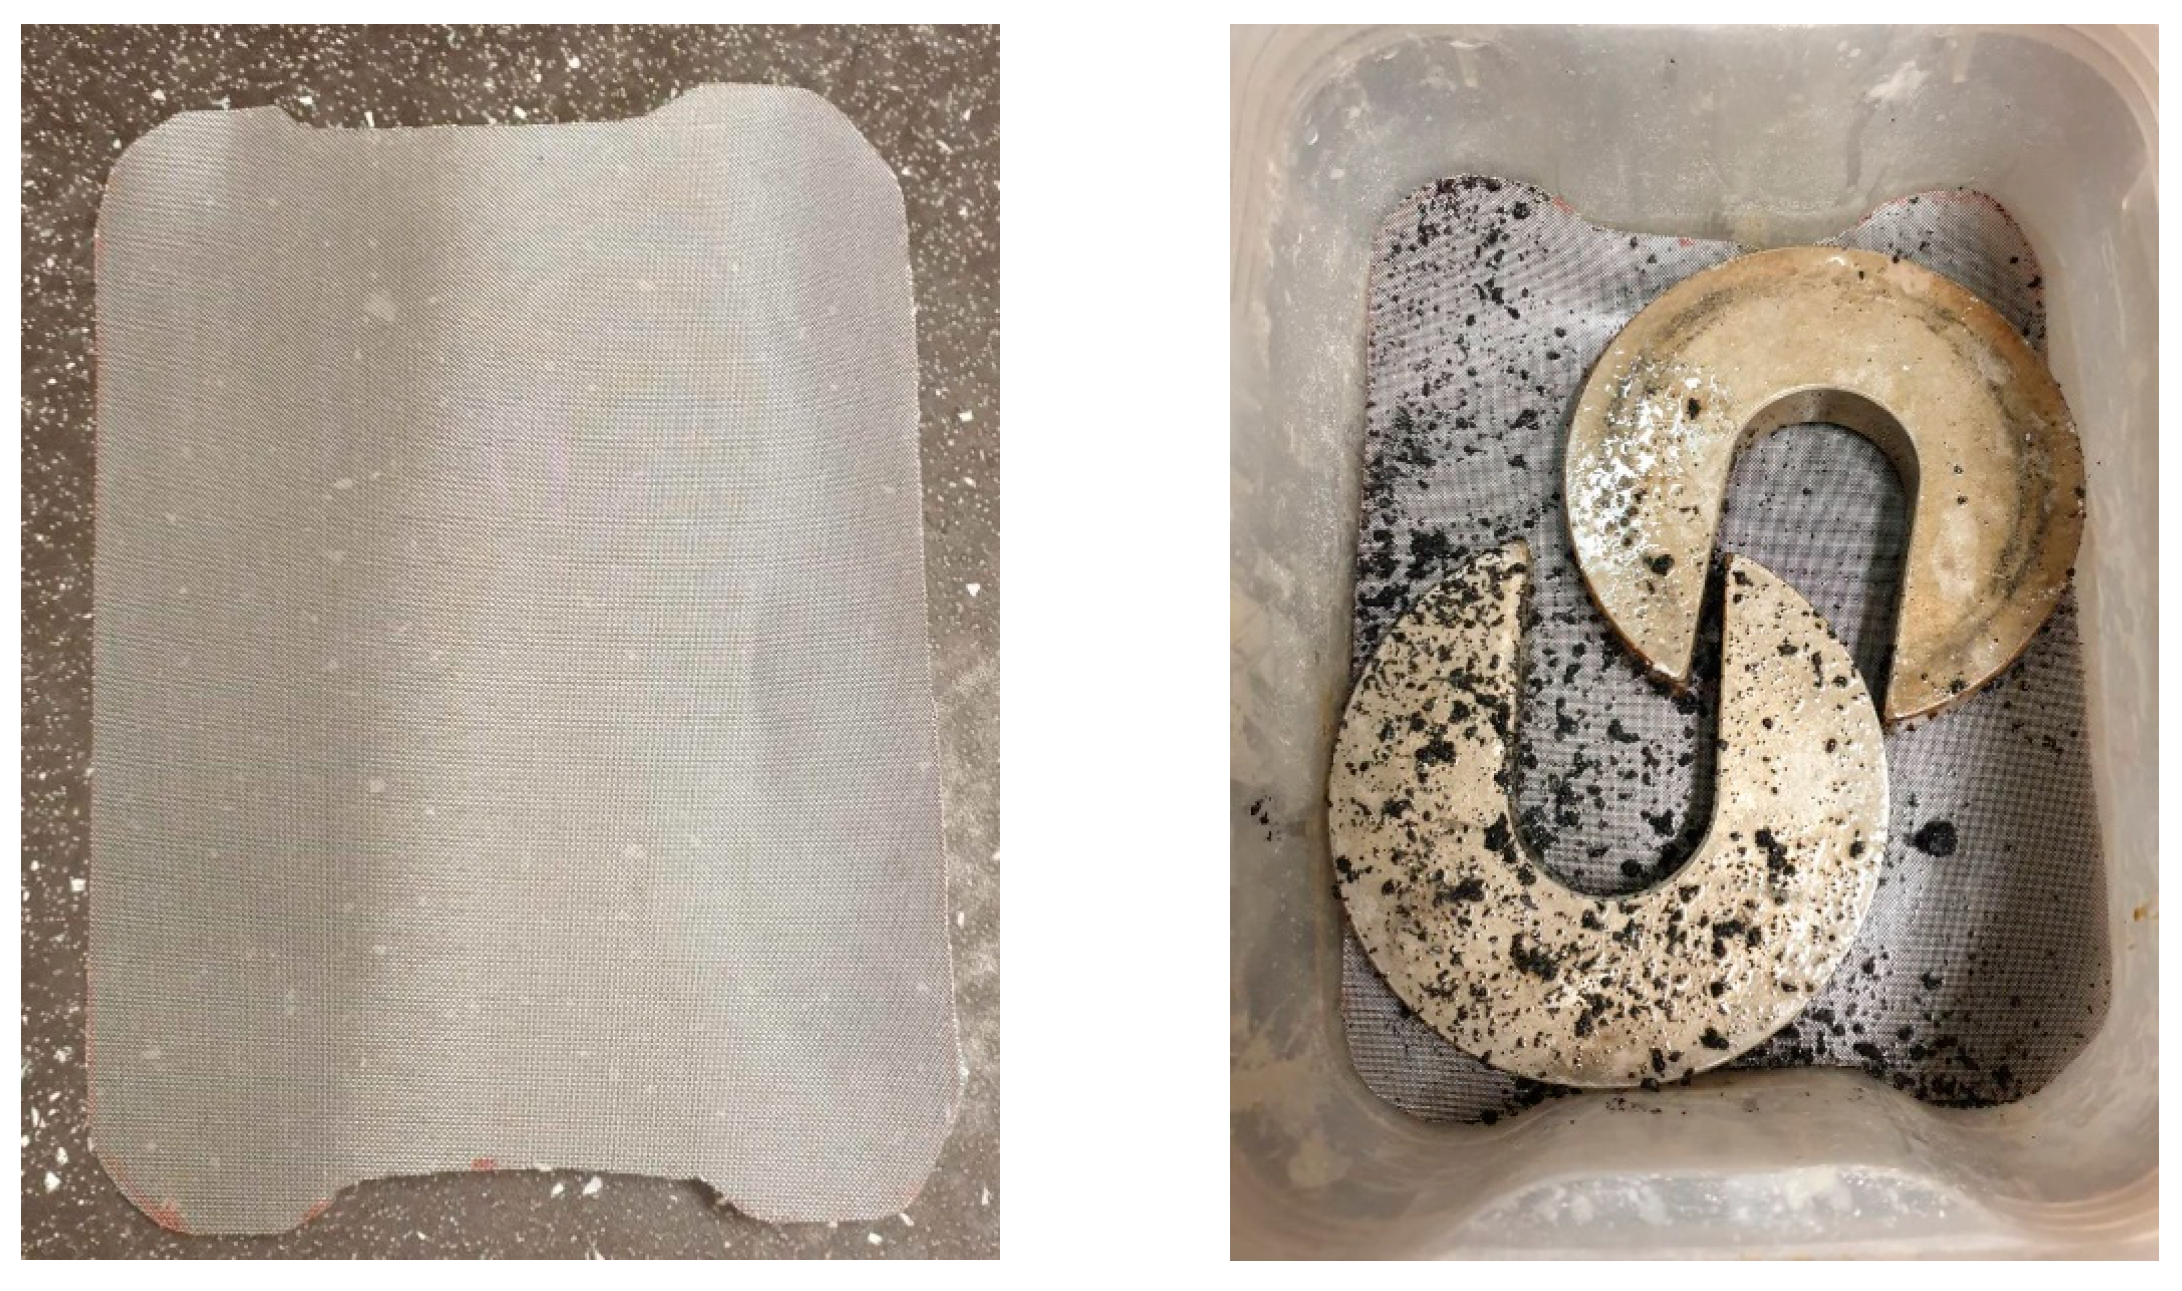
Figure 3.
Crumb rubber pre-treatment with sodium hydroxide using a stainless-steel gauze.
Figure 3.
Crumb rubber pre-treatment with sodium hydroxide using a stainless-steel gauze.
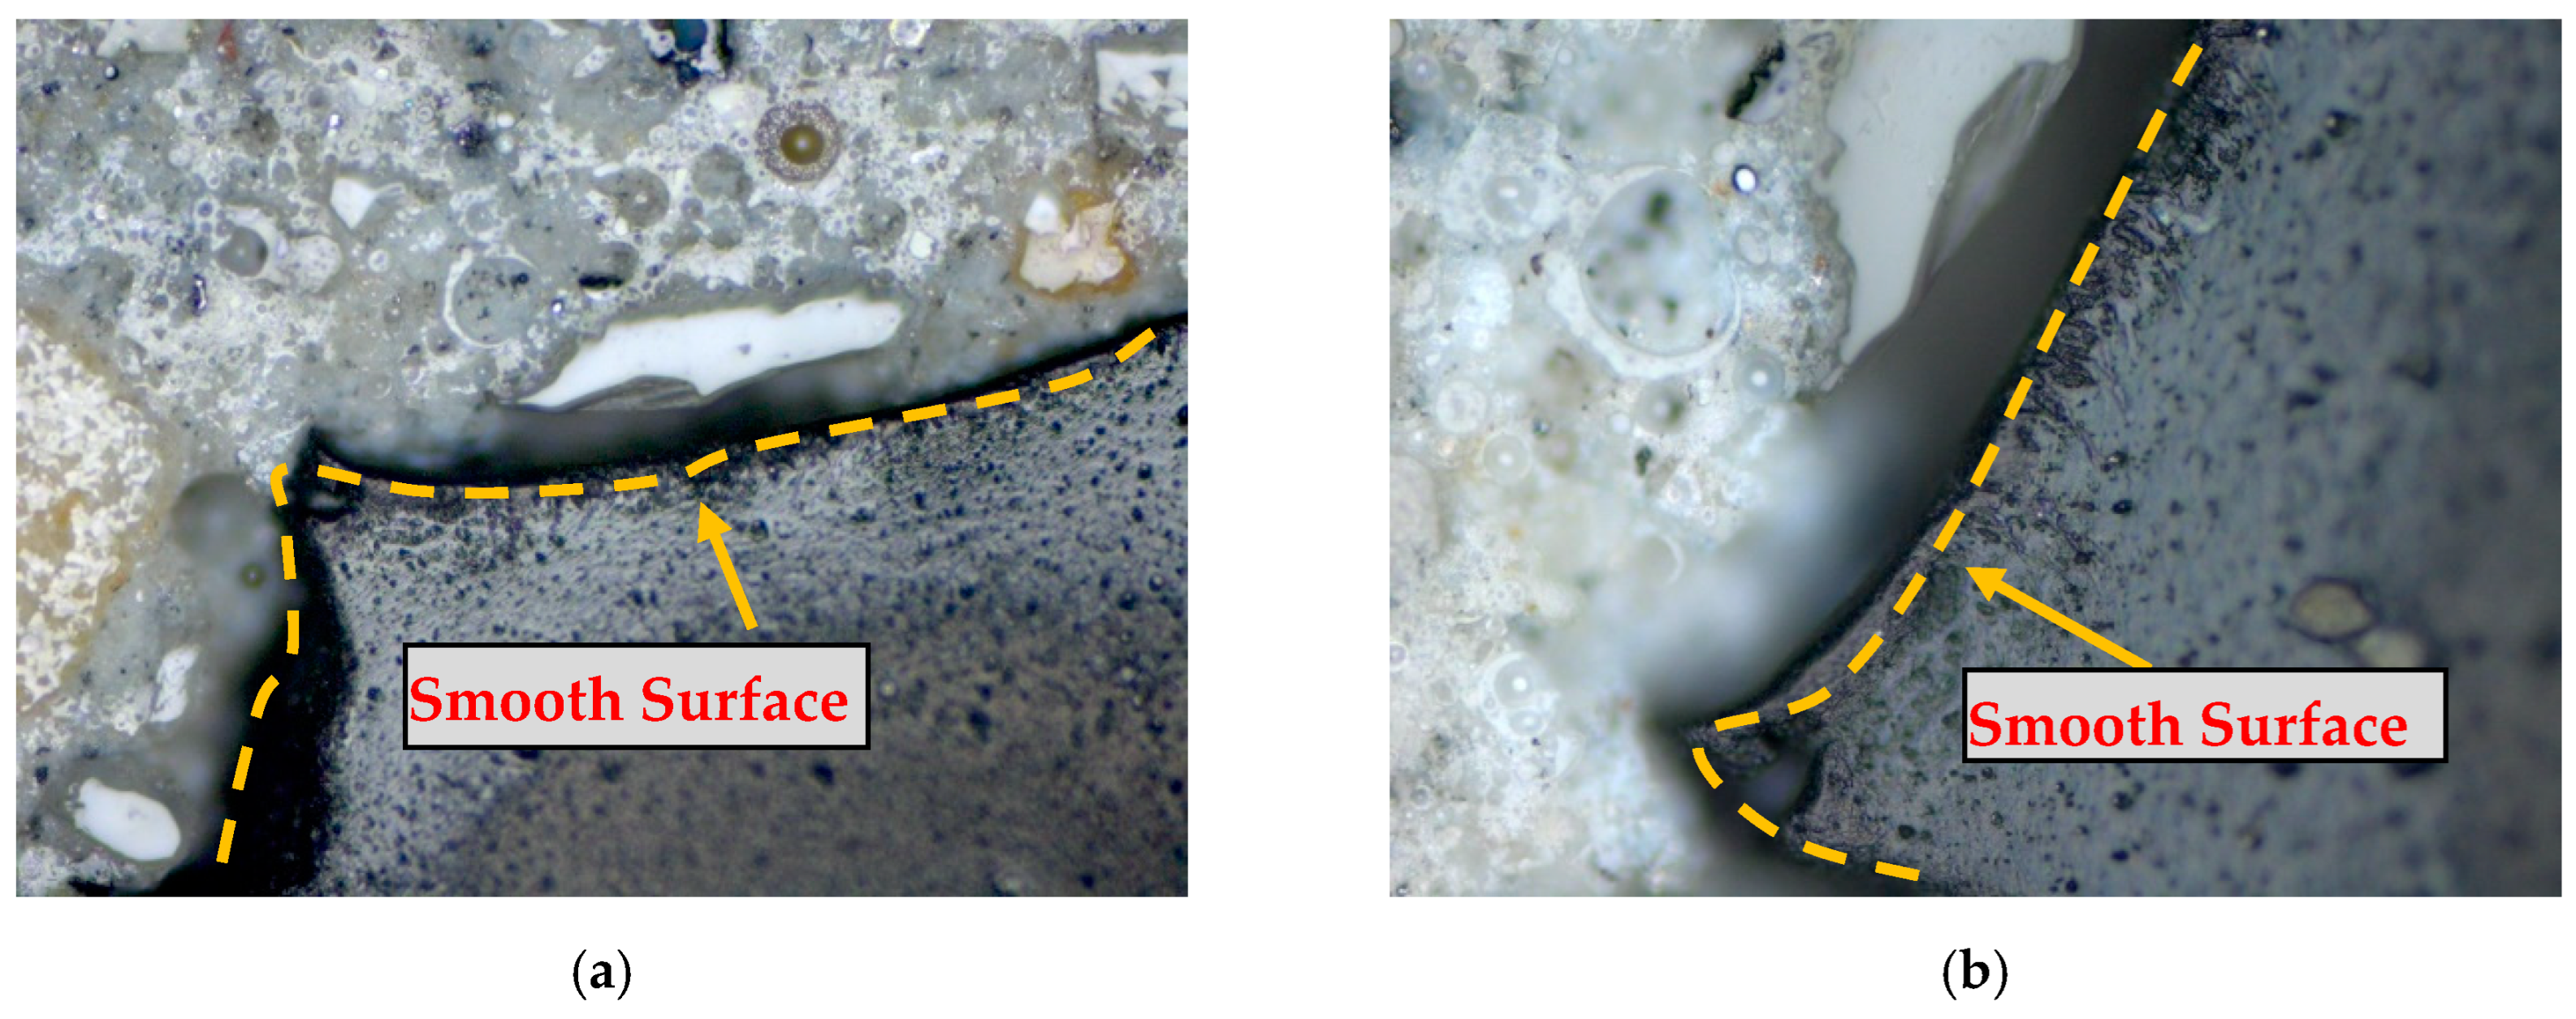
Figure 4.
Microscopic analysis of non-treated CR in concrete. (a) Example 1 (b) Example 2.
Figure 4.
Microscopic analysis of non-treated CR in concrete. (a) Example 1 (b) Example 2.
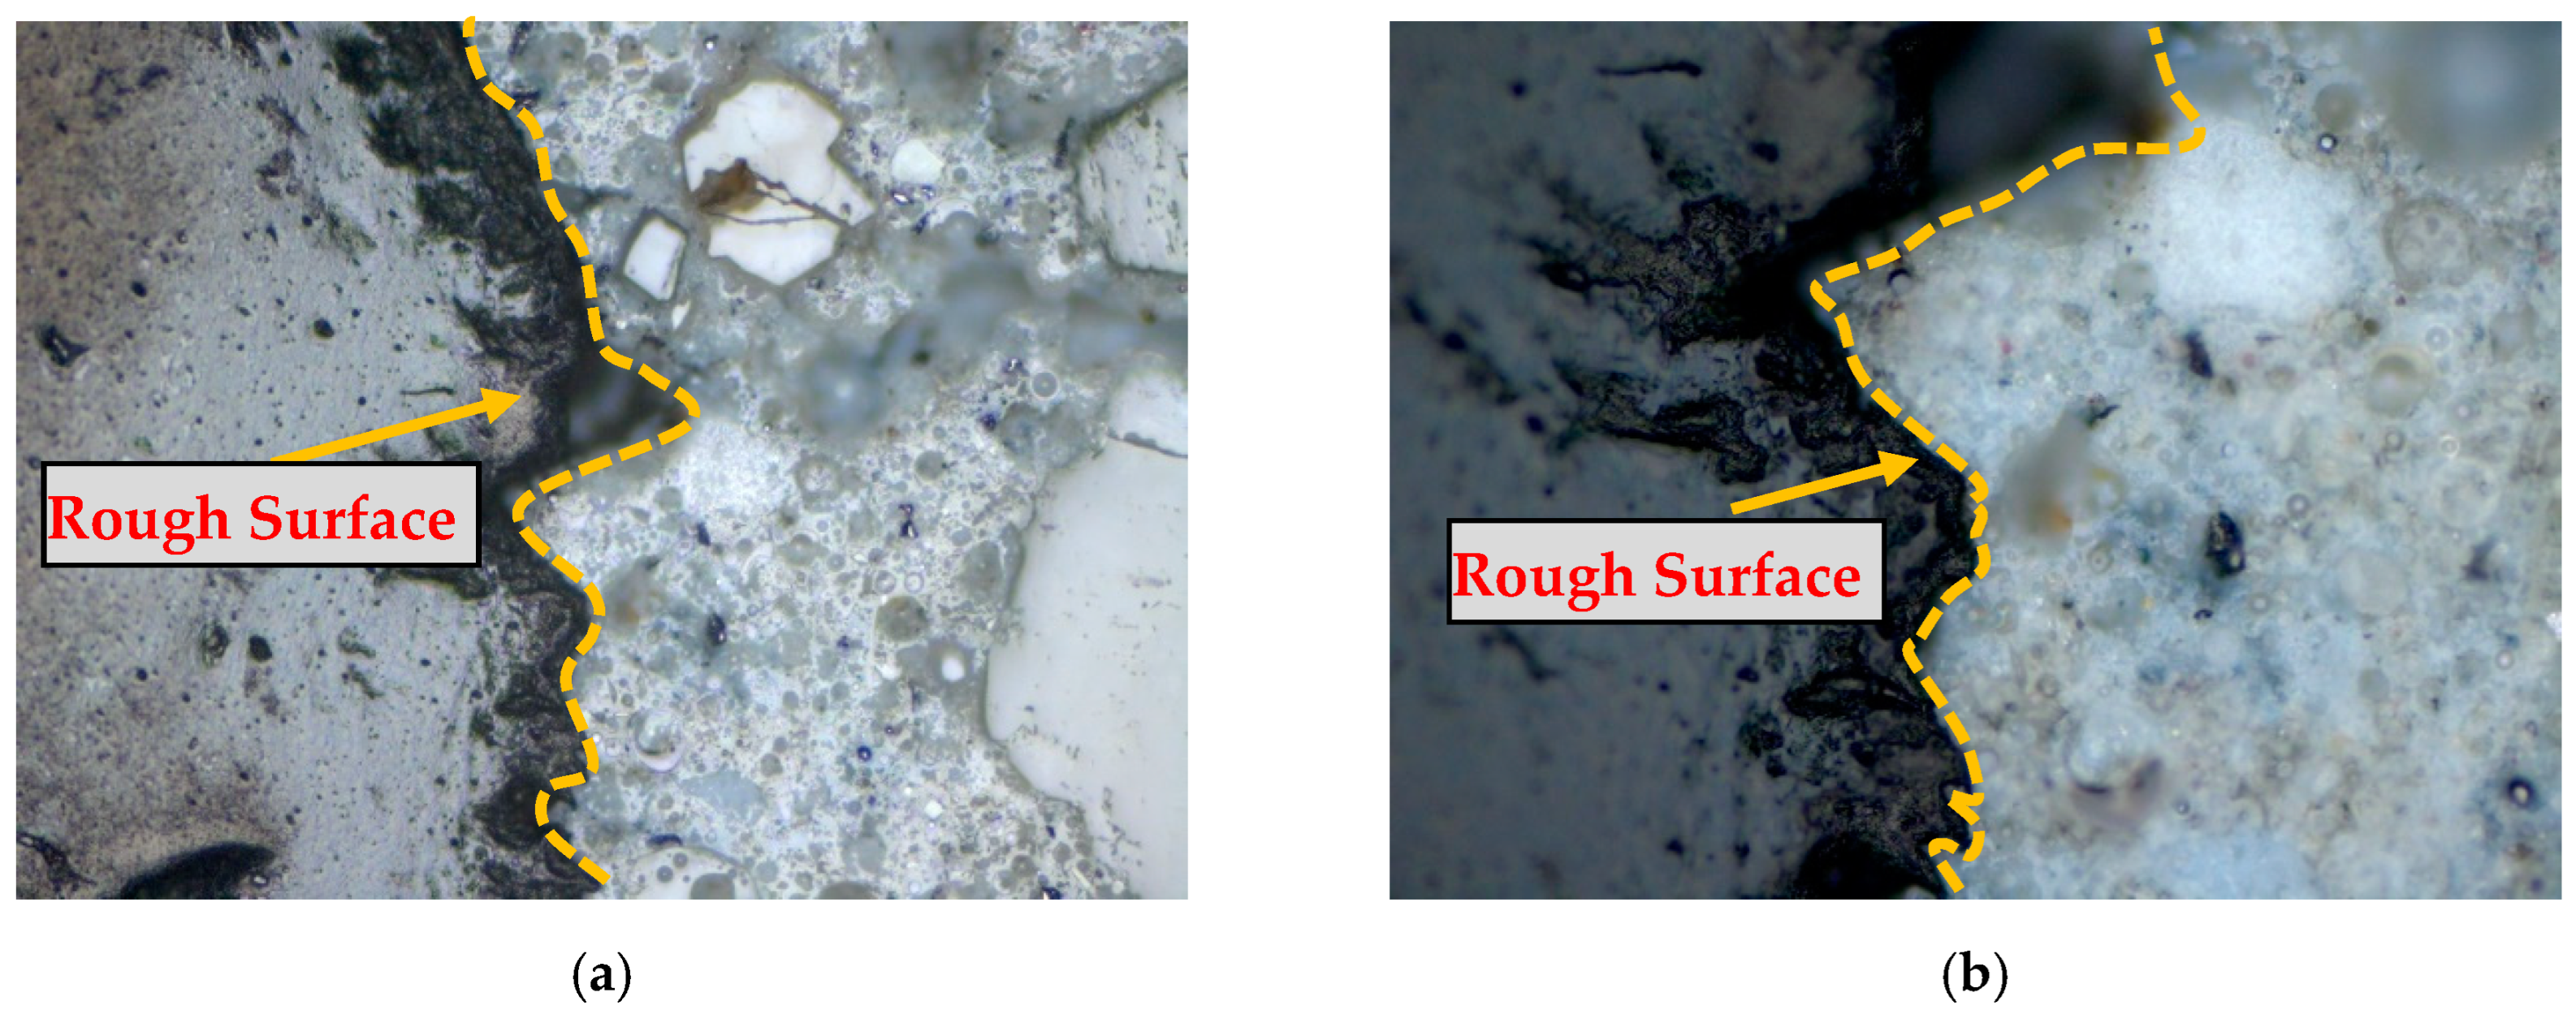
Figure 5.
Microscopic analysis of pre-treated CR in concrete. (a) Example 1; (b) Example 2.
Figure 5.
Microscopic analysis of pre-treated CR in concrete. (a) Example 1; (b) Example 2.
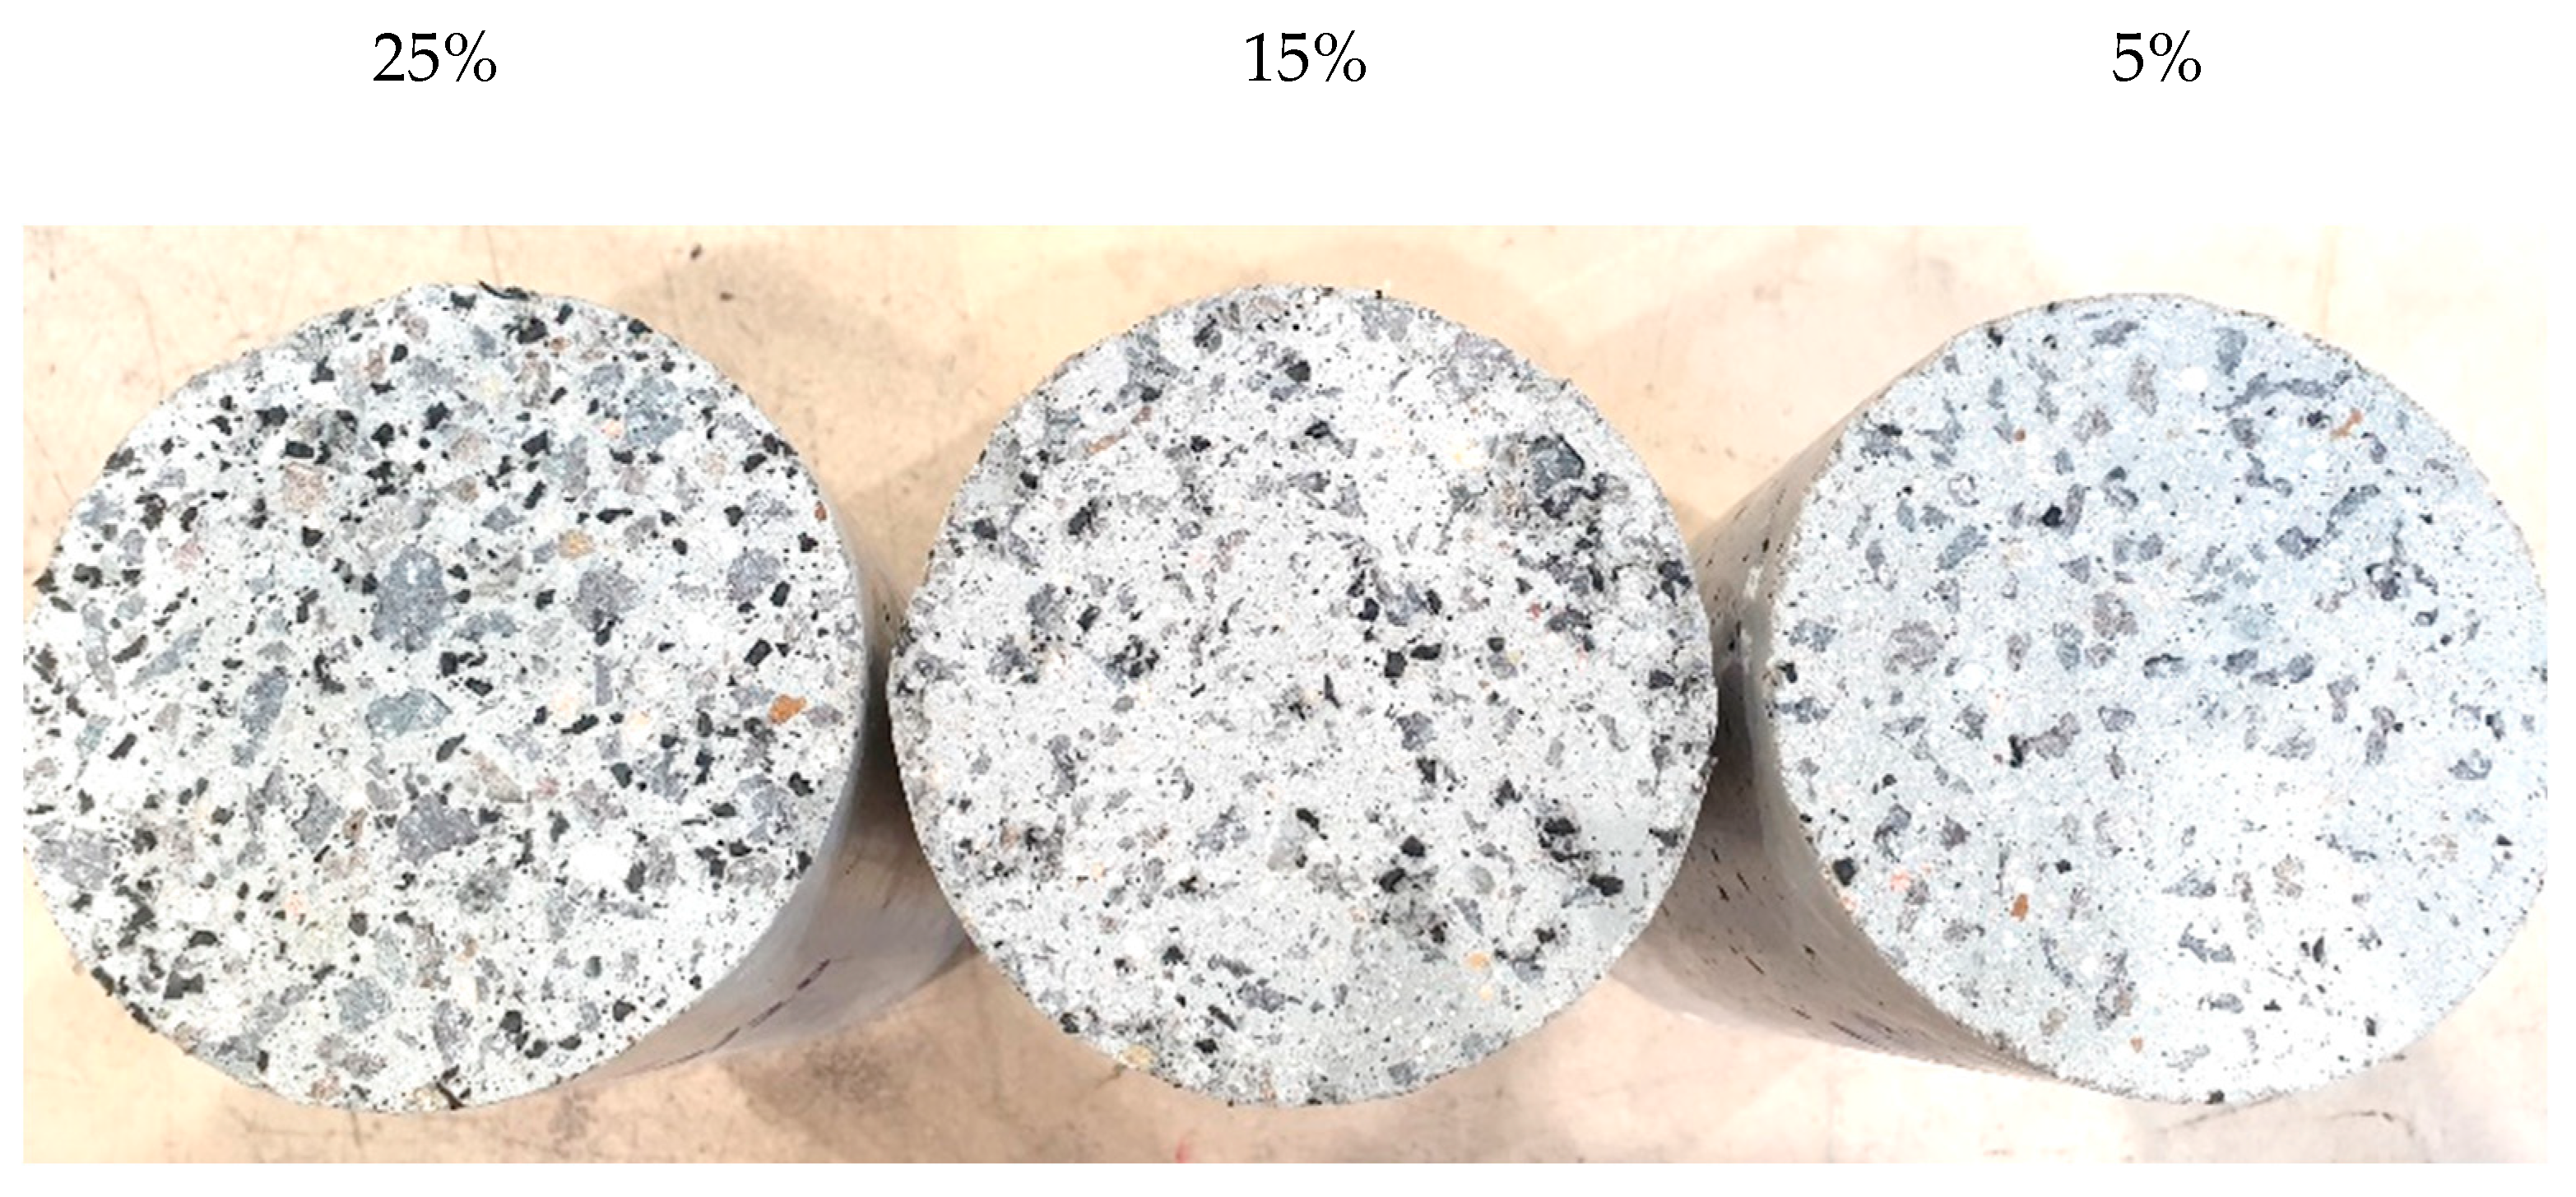
Figure 6.
Different rubber content in cylinder specimens.
Figure 6.
Different rubber content in cylinder specimens.
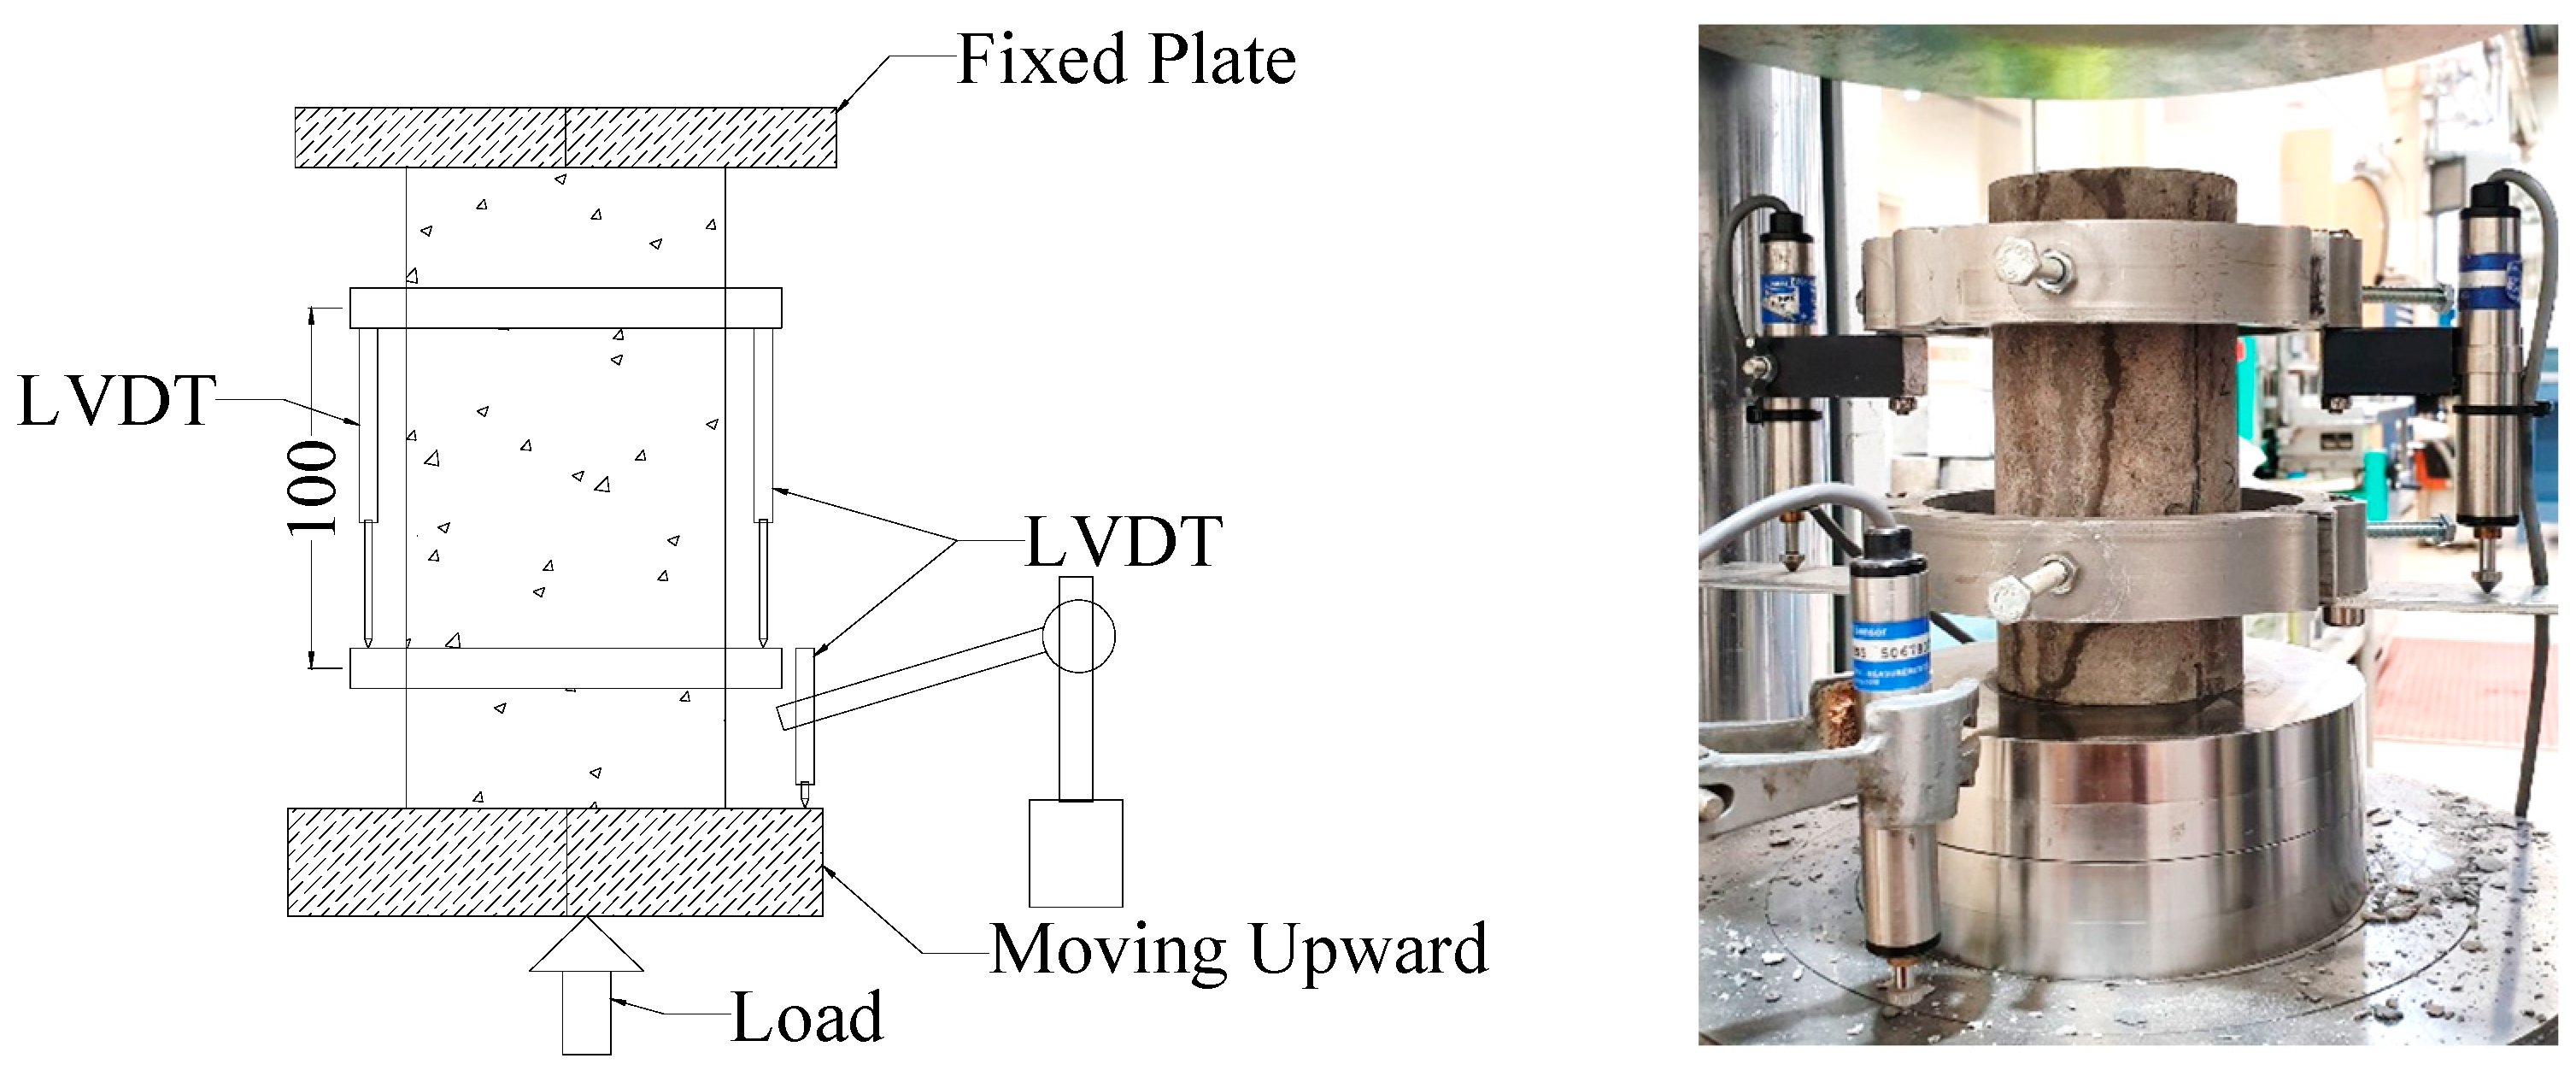
Figure 7.
Experimental setup of the stress–strain measurement.
Figure 7.
Experimental setup of the stress–strain measurement.
Figure 8.
Compressive strengths of Geopolymer concrete Mix 1.
Figure 8.
Compressive strengths of Geopolymer concrete Mix 1.
Figure 9.
Compressive strengths of Geopolymer concrete Mix 2.
Figure 9.
Compressive strengths of Geopolymer concrete Mix 2.
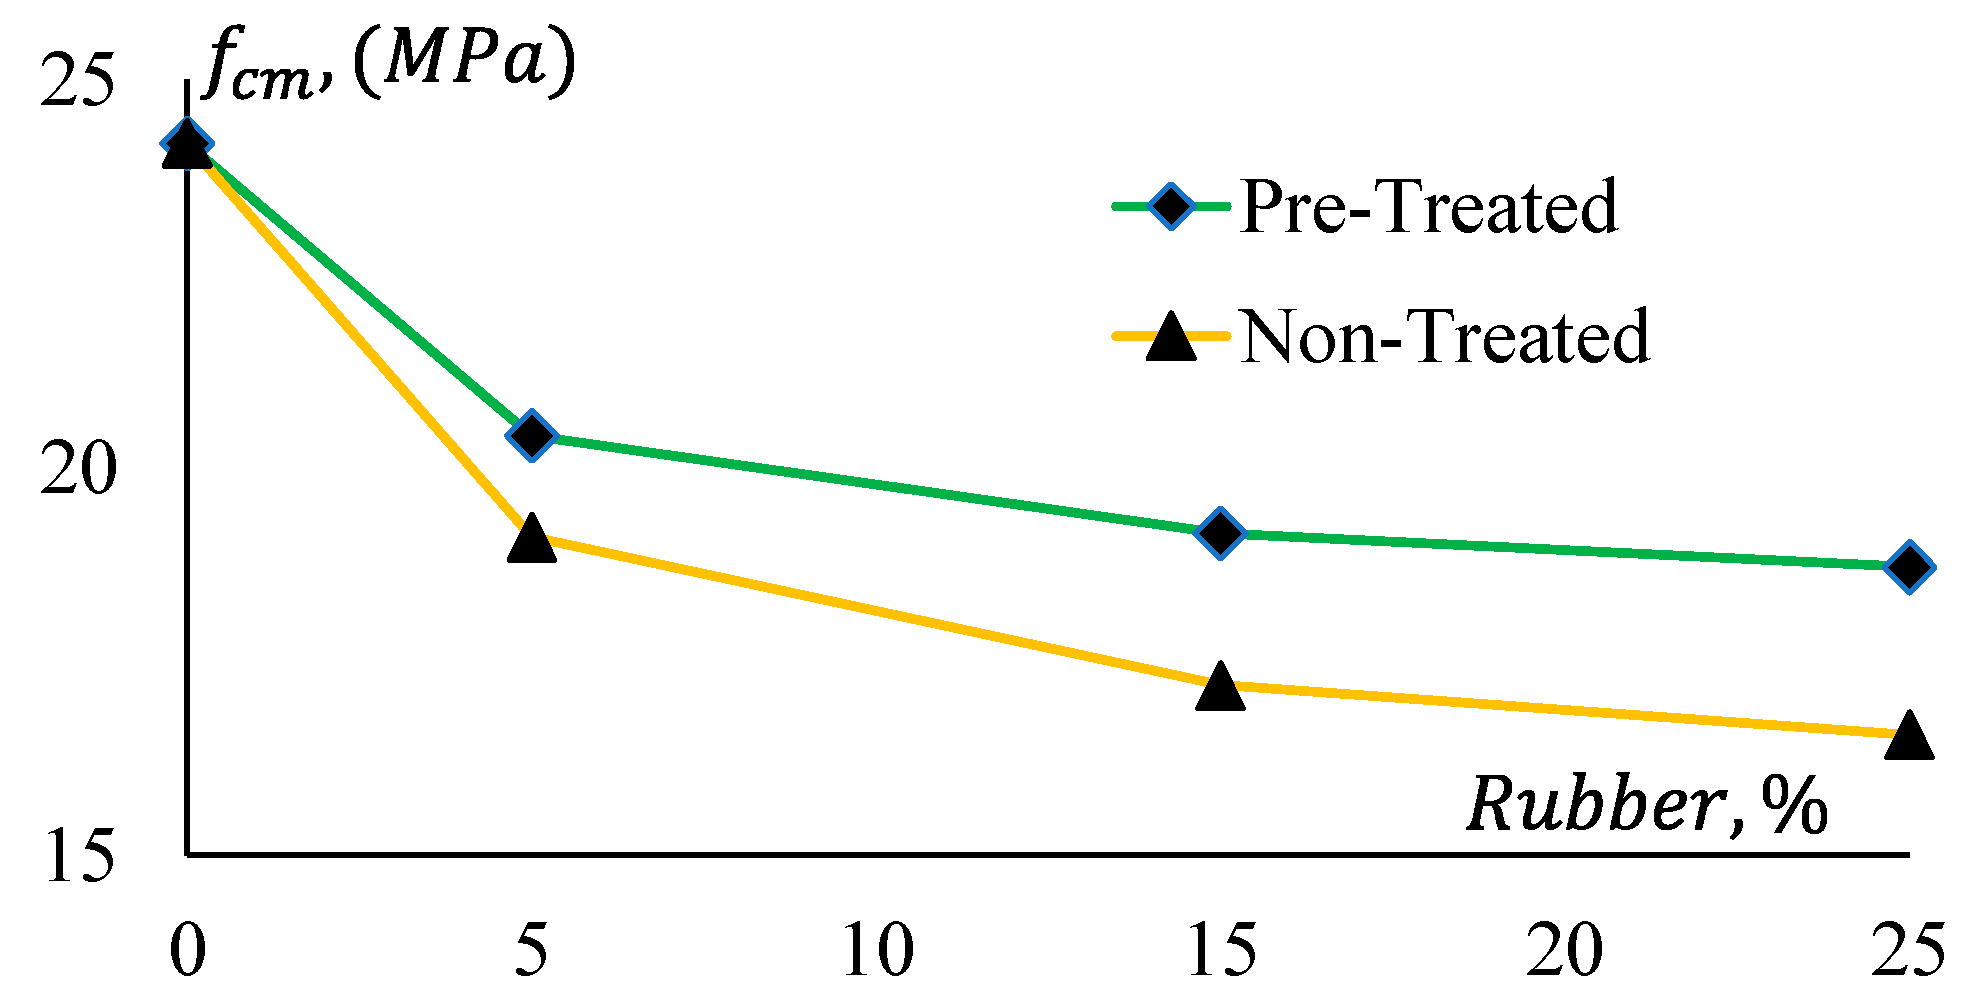
Figure 10.
Compressive strength reduction of GPC Mix 1 and CRGPC mixes.
Figure 10.
Compressive strength reduction of GPC Mix 1 and CRGPC mixes.
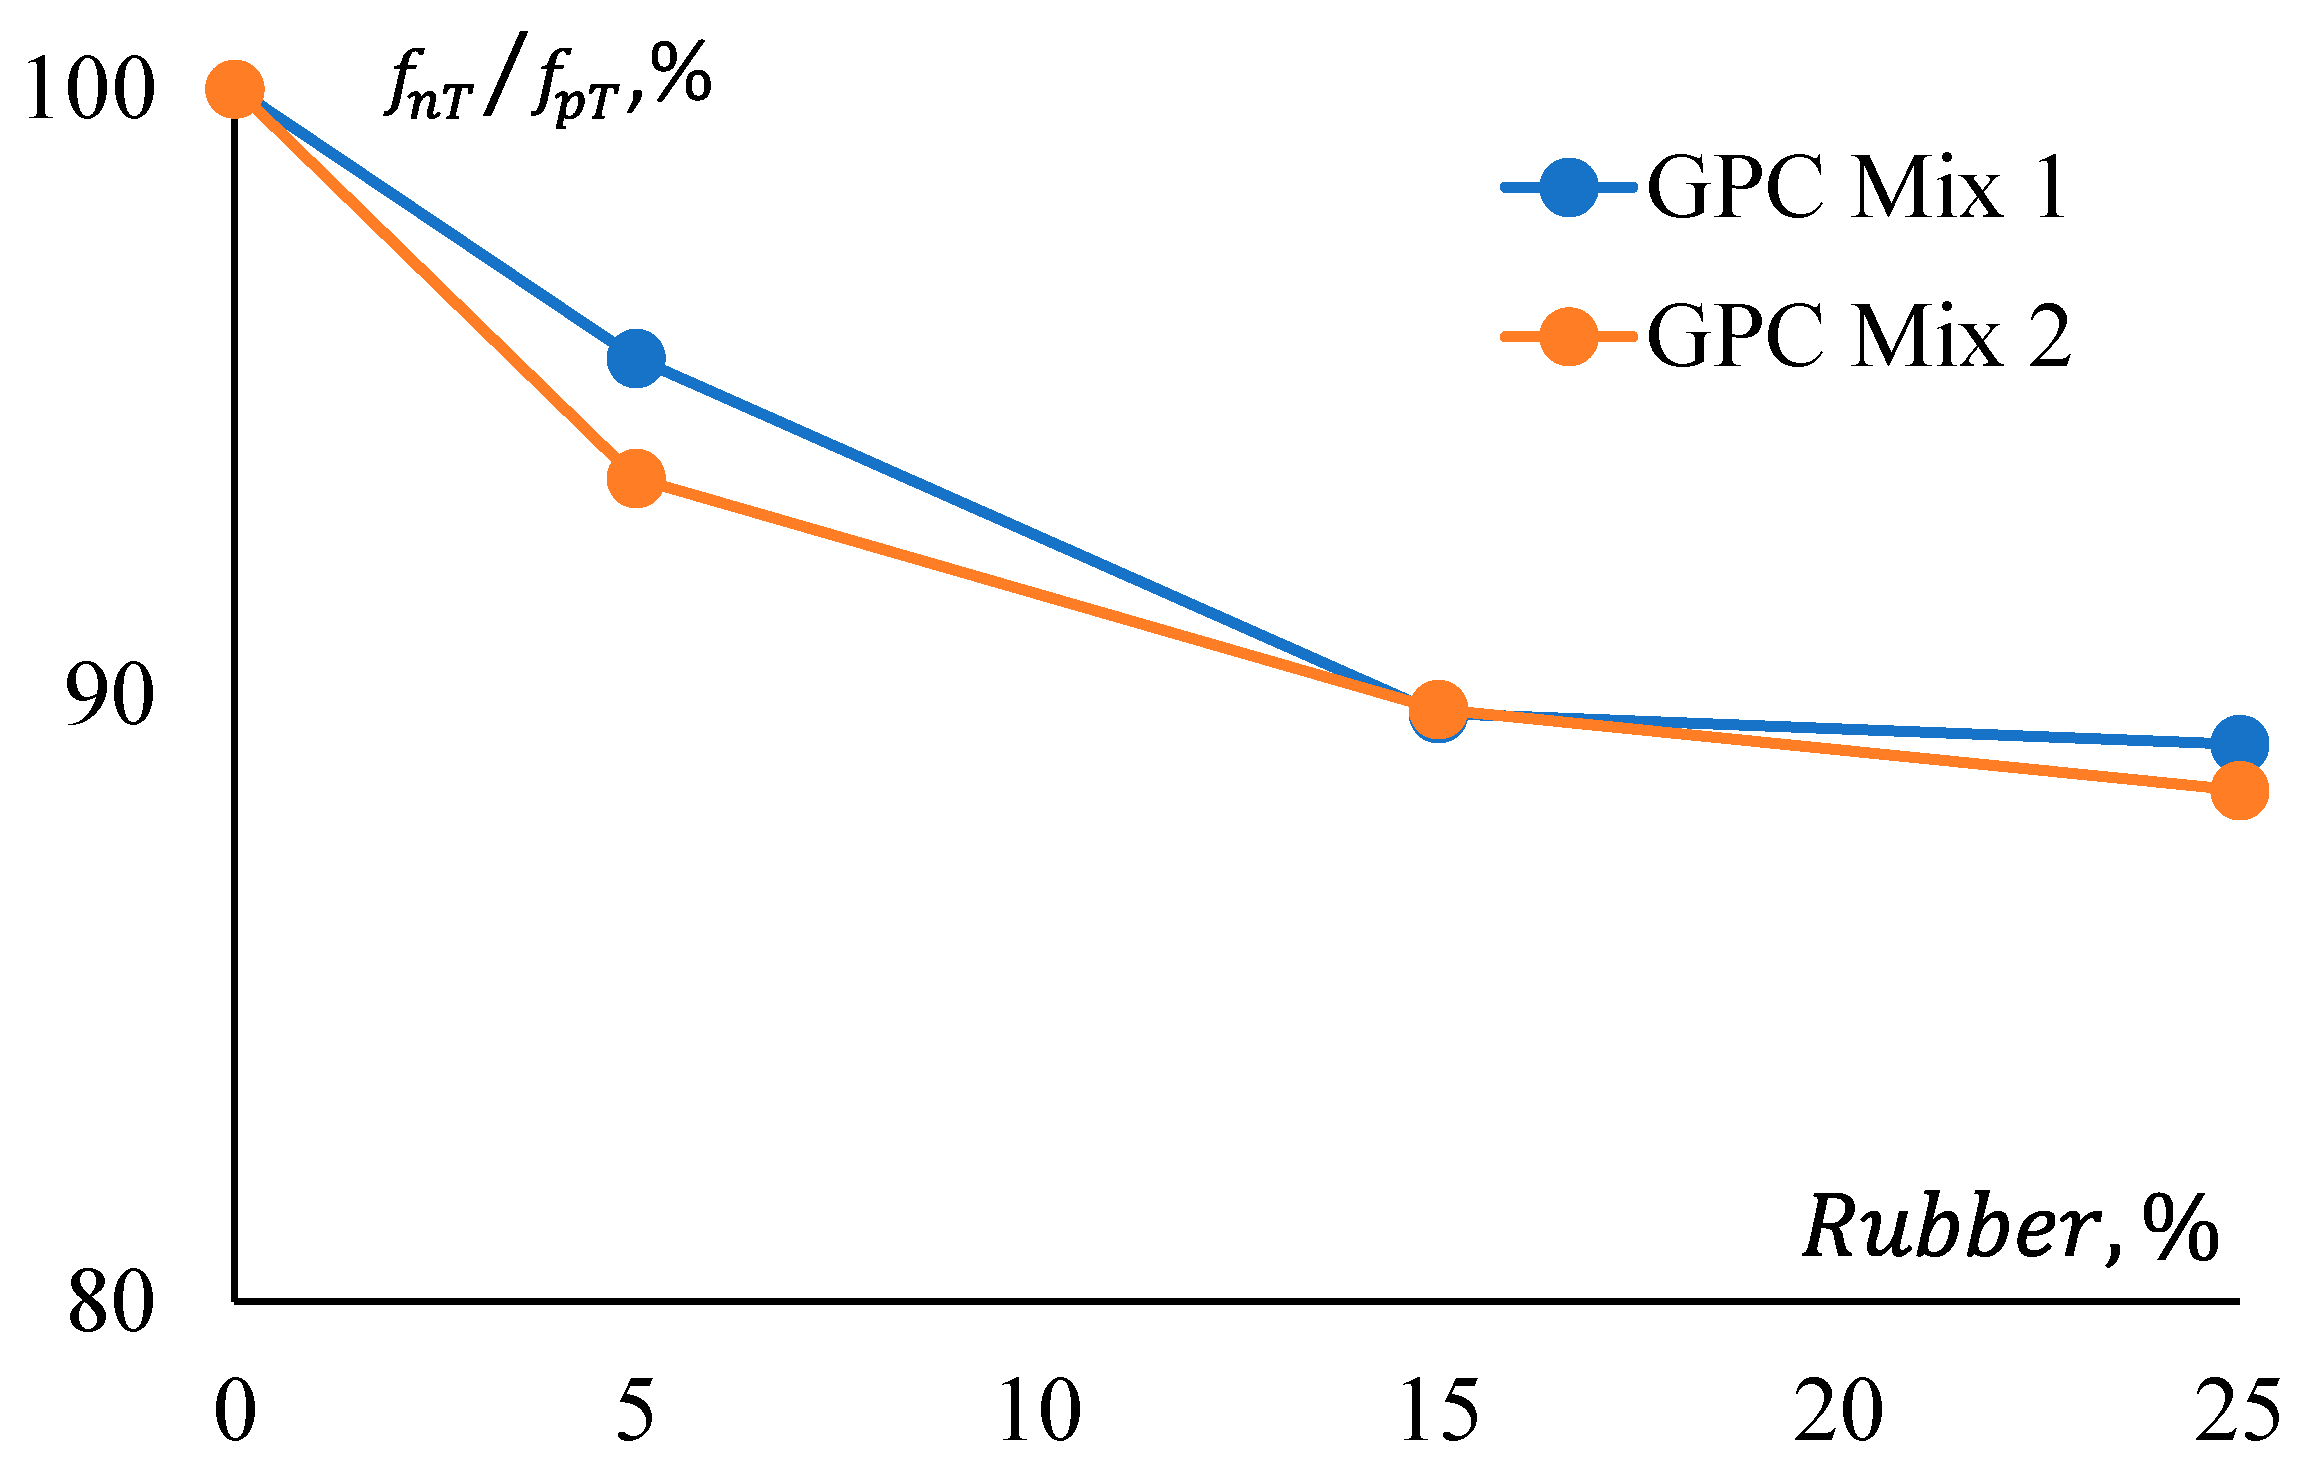
Figure 11.
Strength reduction ratio comparison between GPC mixes for rubber treatment.
Figure 11.
Strength reduction ratio comparison between GPC mixes for rubber treatment.
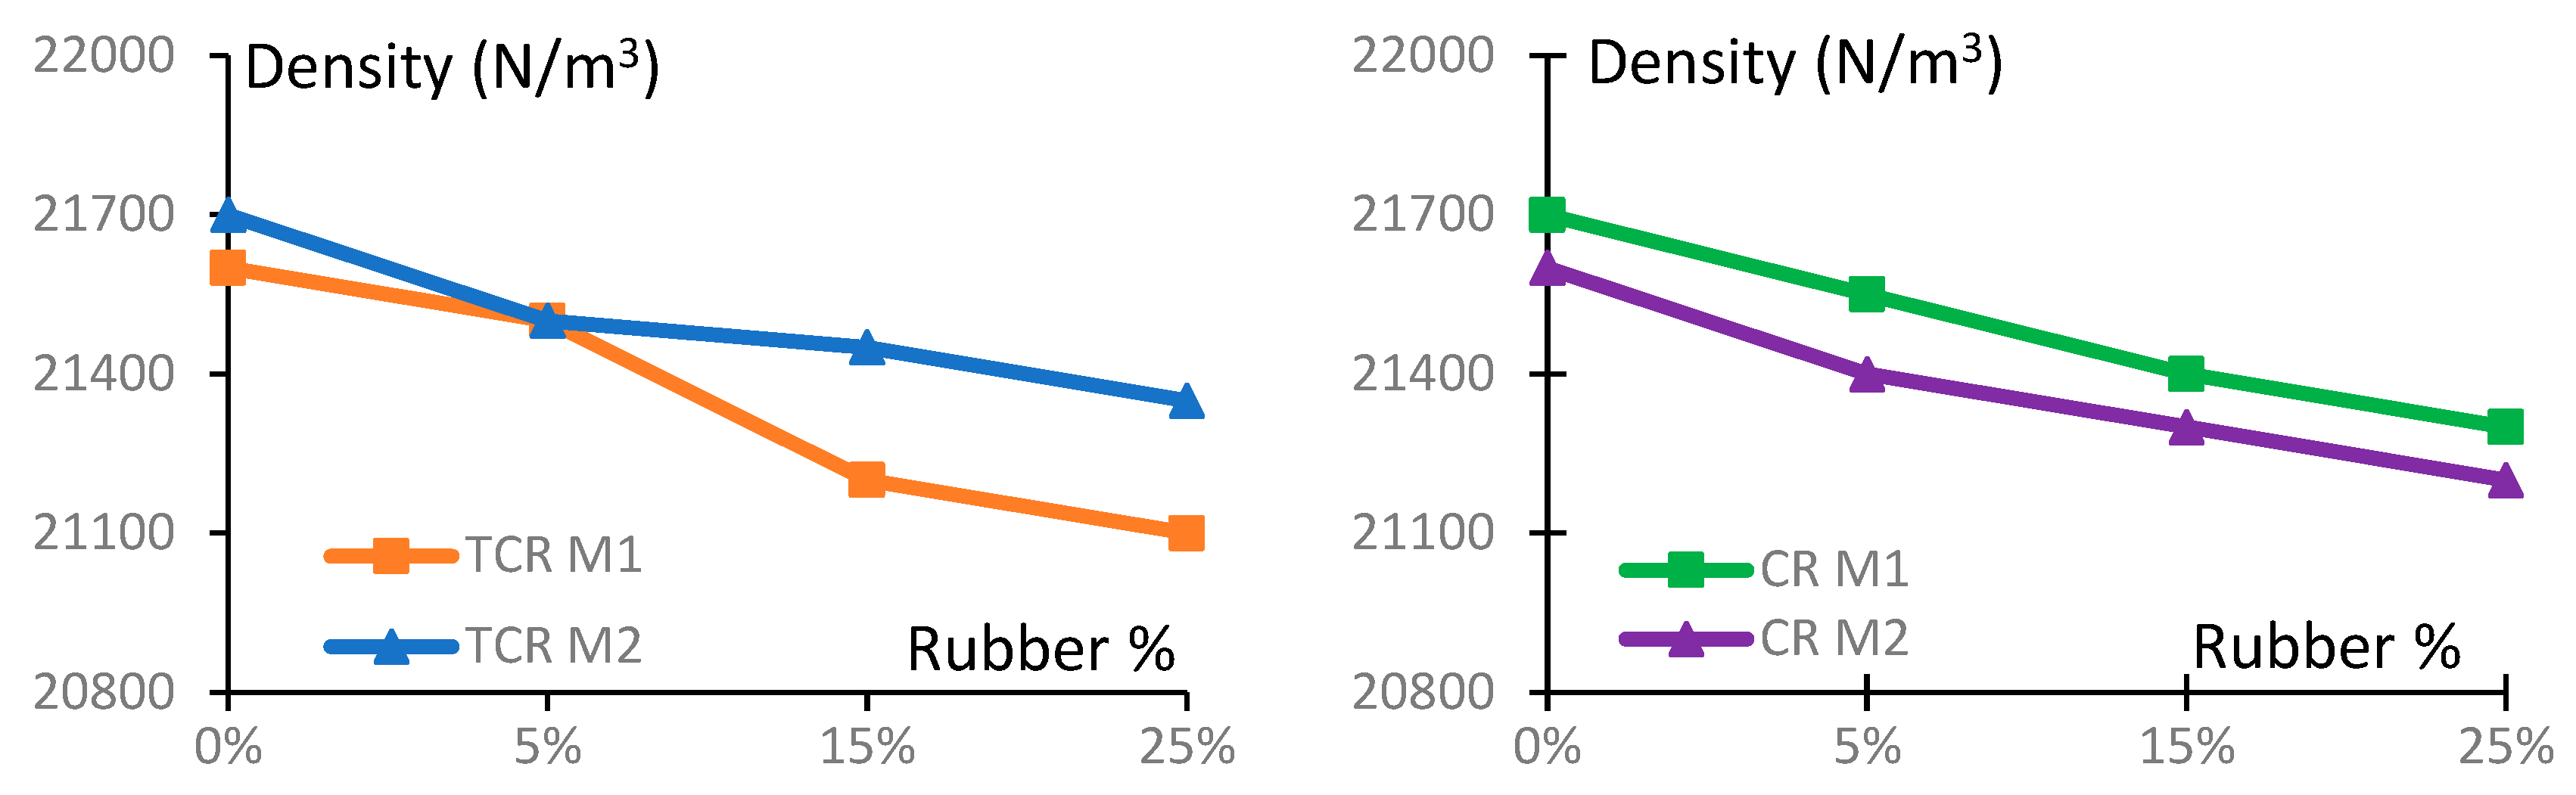
Figure 12.
Density of different GPC and CRGPC mixes.
Figure 12.
Density of different GPC and CRGPC mixes.
Figure 13.
The Modulus of Elasticity of GPC and CRGPC mixes.
Figure 13.
The Modulus of Elasticity of GPC and CRGPC mixes.
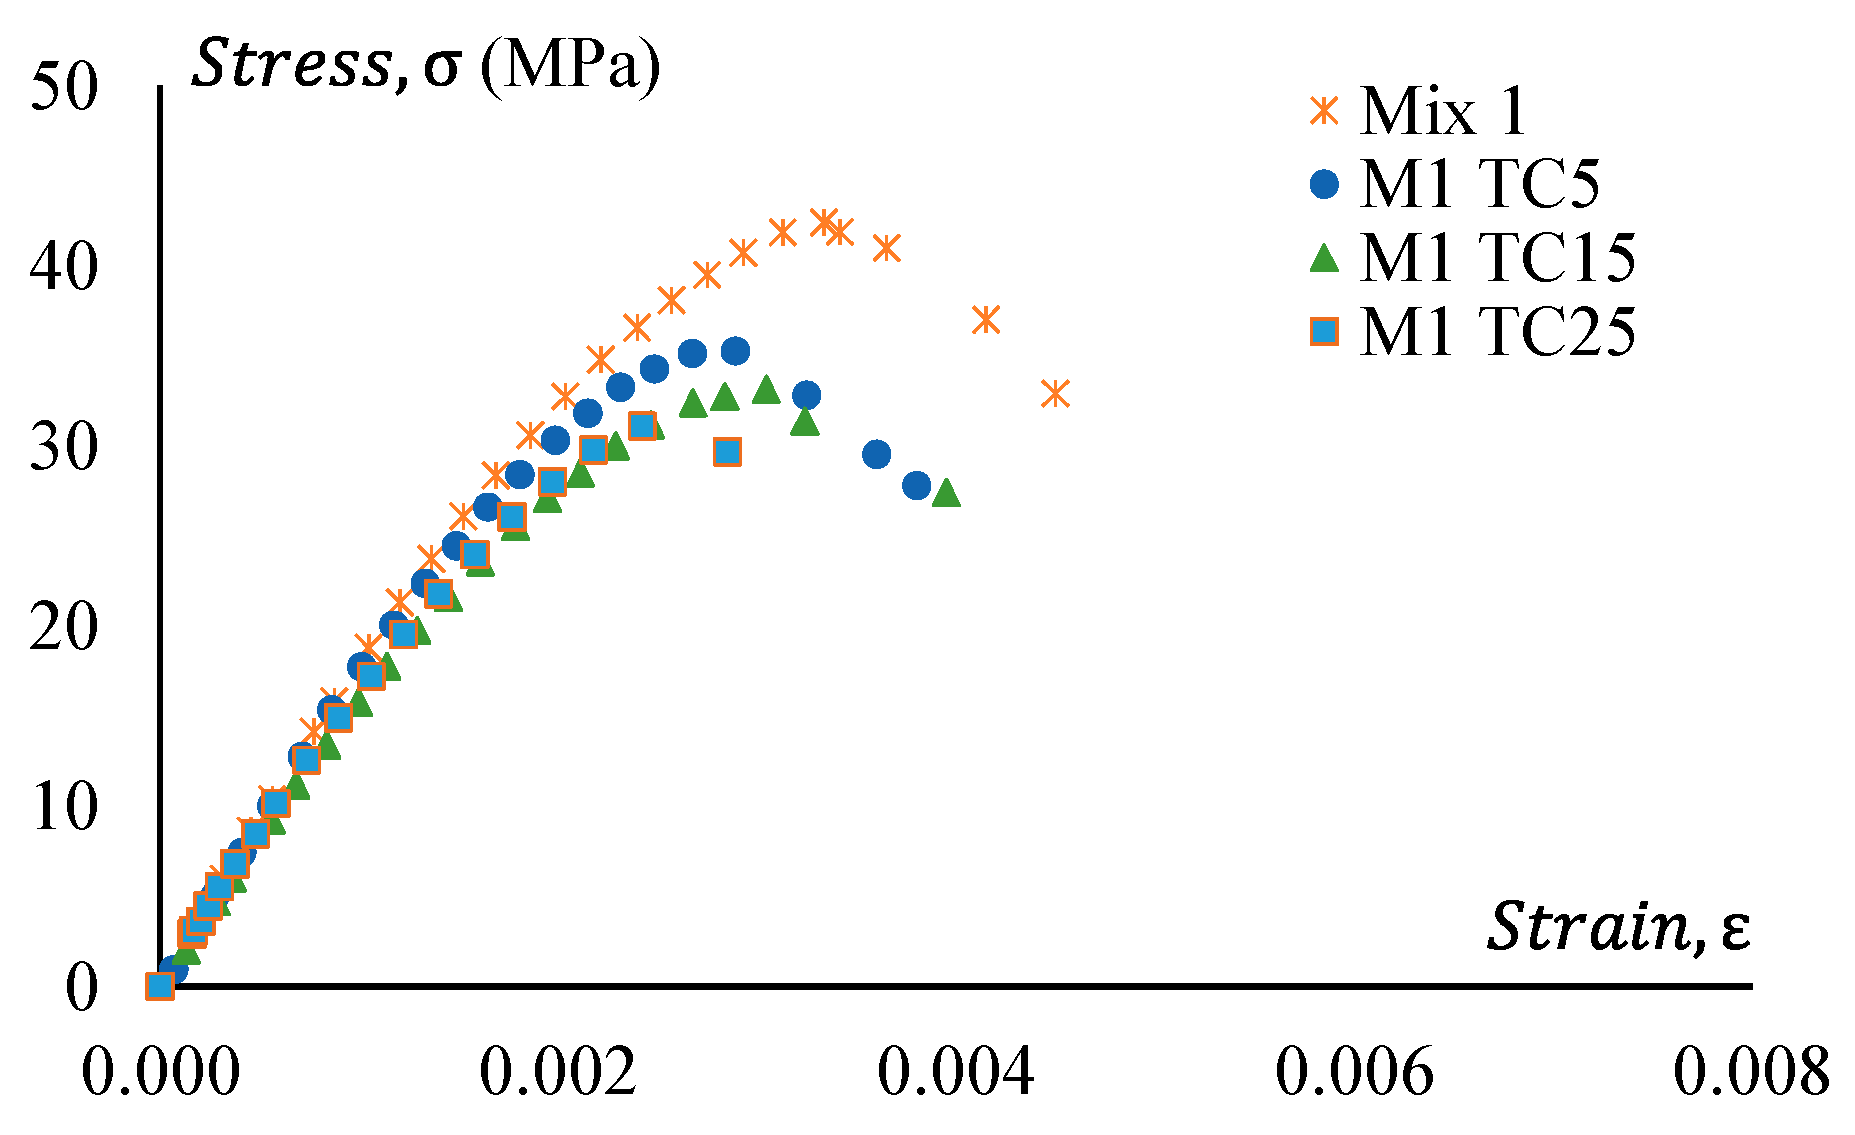
Figure 14.
Stress–strain behaviour of GPC Mix 1 and pre-treated CRGPC.
Figure 14.
Stress–strain behaviour of GPC Mix 1 and pre-treated CRGPC.
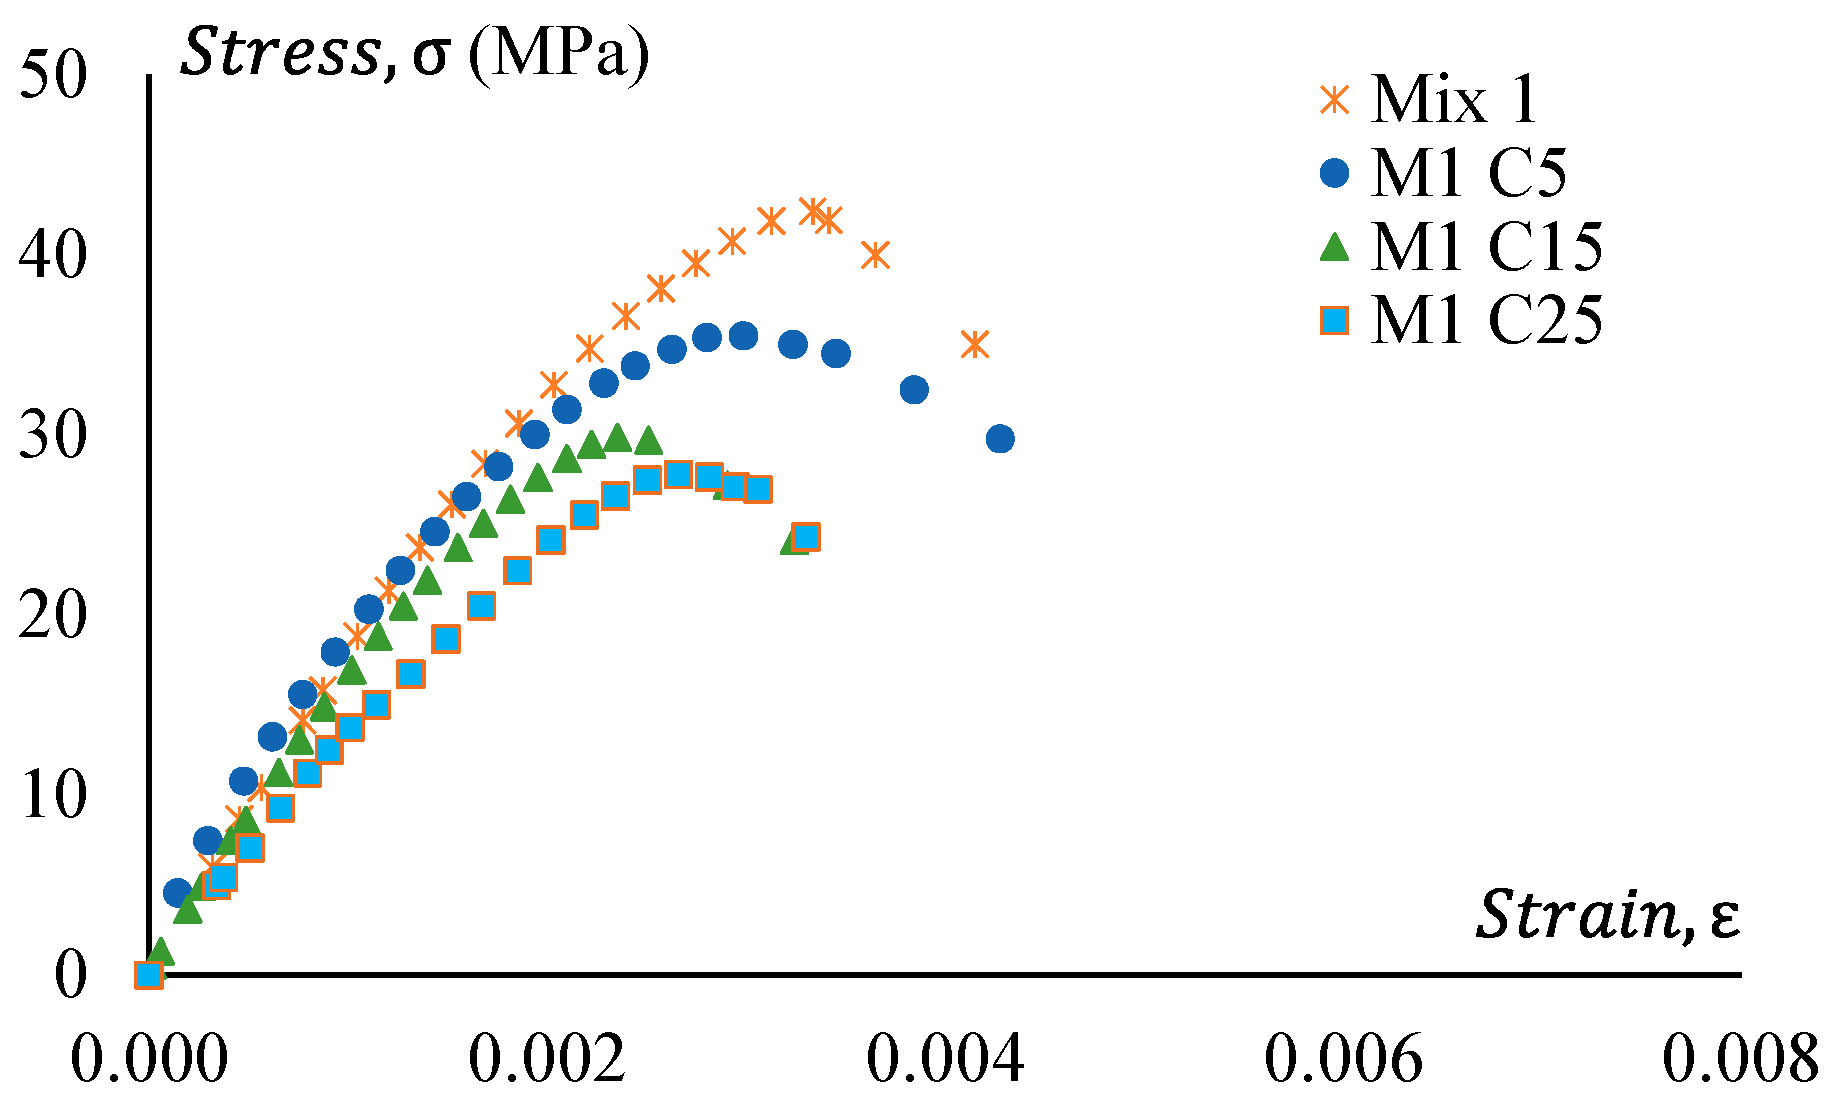
Figure 15.
Stress–strain behaviour of GPC Mix 1 and non-treated CRGPC.
Figure 15.
Stress–strain behaviour of GPC Mix 1 and non-treated CRGPC.
Figure 16.
Stress–strain behaviour of GPC Mix 2 and pre-treated CRGPC.
Figure 16.
Stress–strain behaviour of GPC Mix 2 and pre-treated CRGPC.
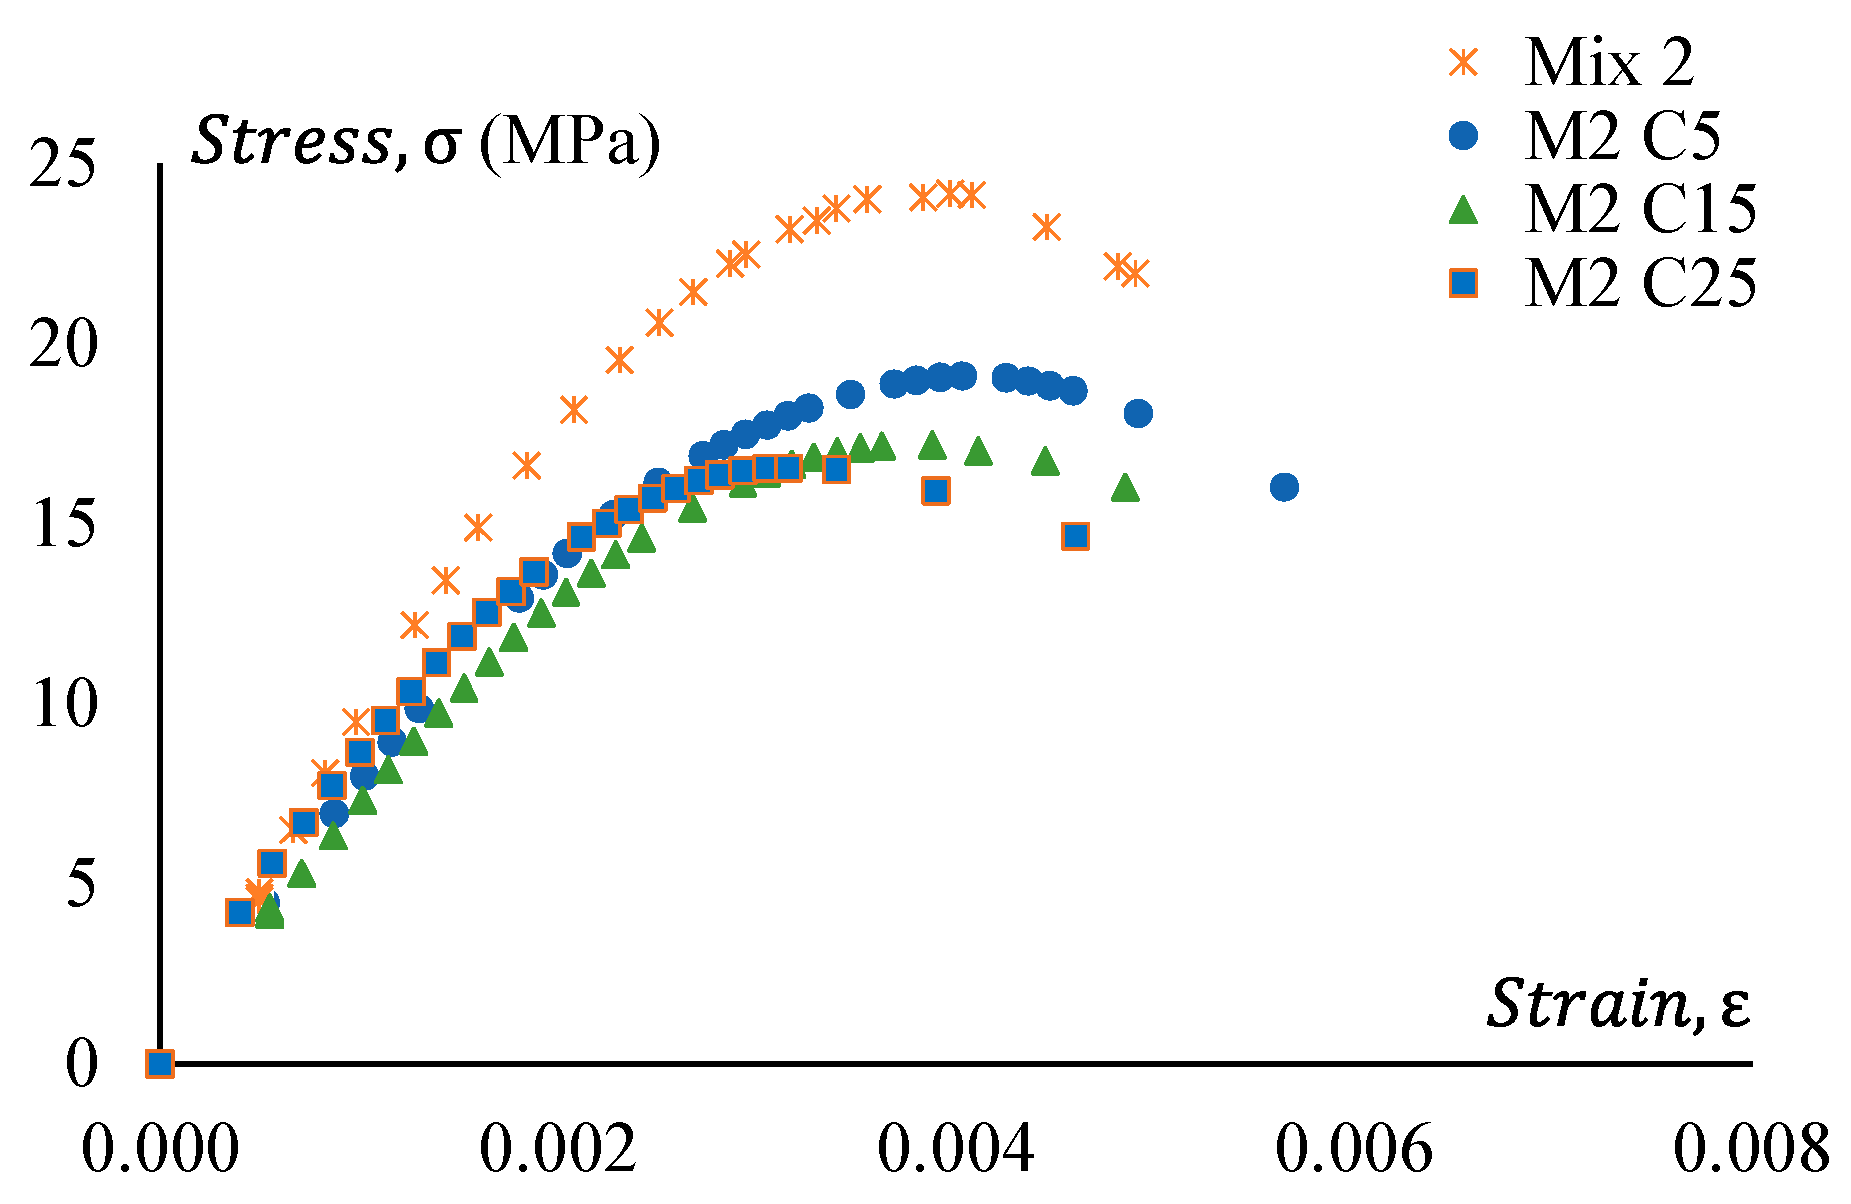
Figure 17.
Stress–strain behaviour of GPC Mix 2 and non-treated CRGPC.
Figure 17.
Stress–strain behaviour of GPC Mix 2 and non-treated CRGPC.
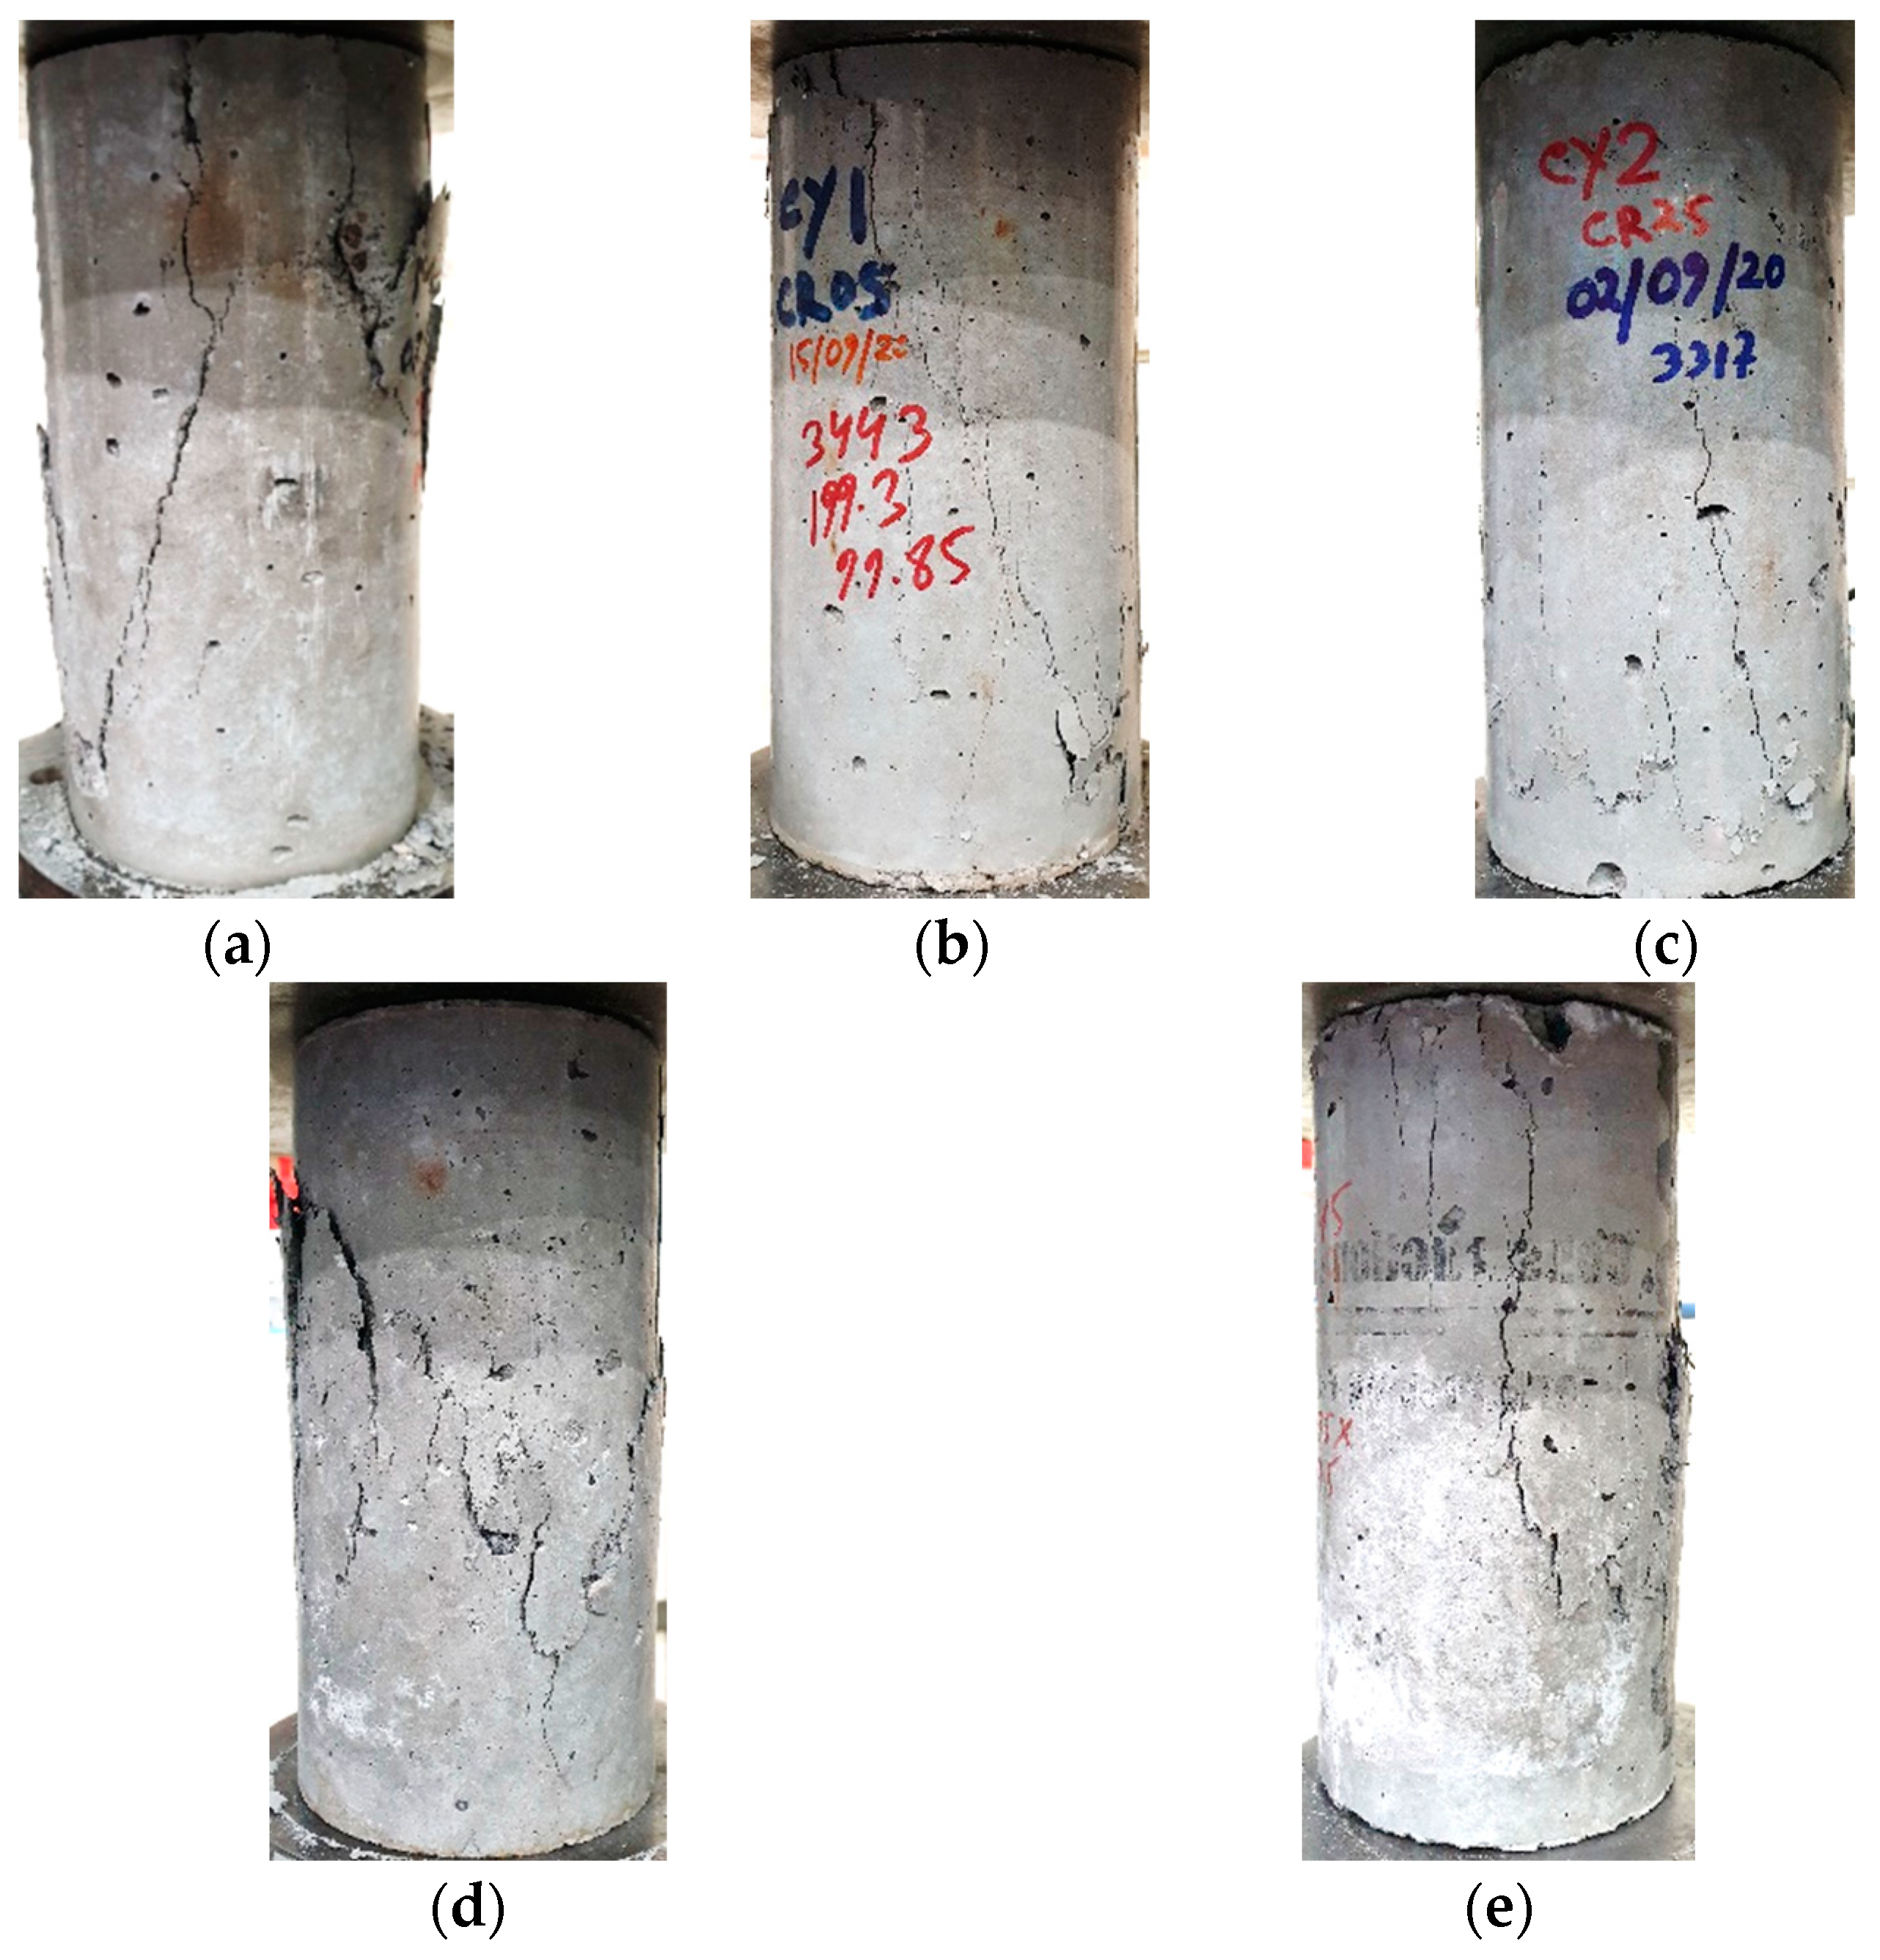
Figure 18.
Cylinder failure patterns of GPC and CRGPC. (a) GPC Mix; (b) CR 05; (c) CR 25; (d) TCR 05; (e) TCR 25.
Figure 18.
Cylinder failure patterns of GPC and CRGPC. (a) GPC Mix; (b) CR 05; (c) CR 25; (d) TCR 05; (e) TCR 25.
Figure 19.
Modulus of Elasticity versus compressive strength of GPC and pre-treated CRGPC [
53,
54,
55,
56].
Figure 19.
Modulus of Elasticity versus compressive strength of GPC and pre-treated CRGPC [
53,
54,
55,
56].
Figure 20.
Modulus of Elasticity versus compressive strength of GPC and non-treated CRGPC [
53,
54,
55,
56].
Figure 20.
Modulus of Elasticity versus compressive strength of GPC and non-treated CRGPC [
53,
54,
55,
56].
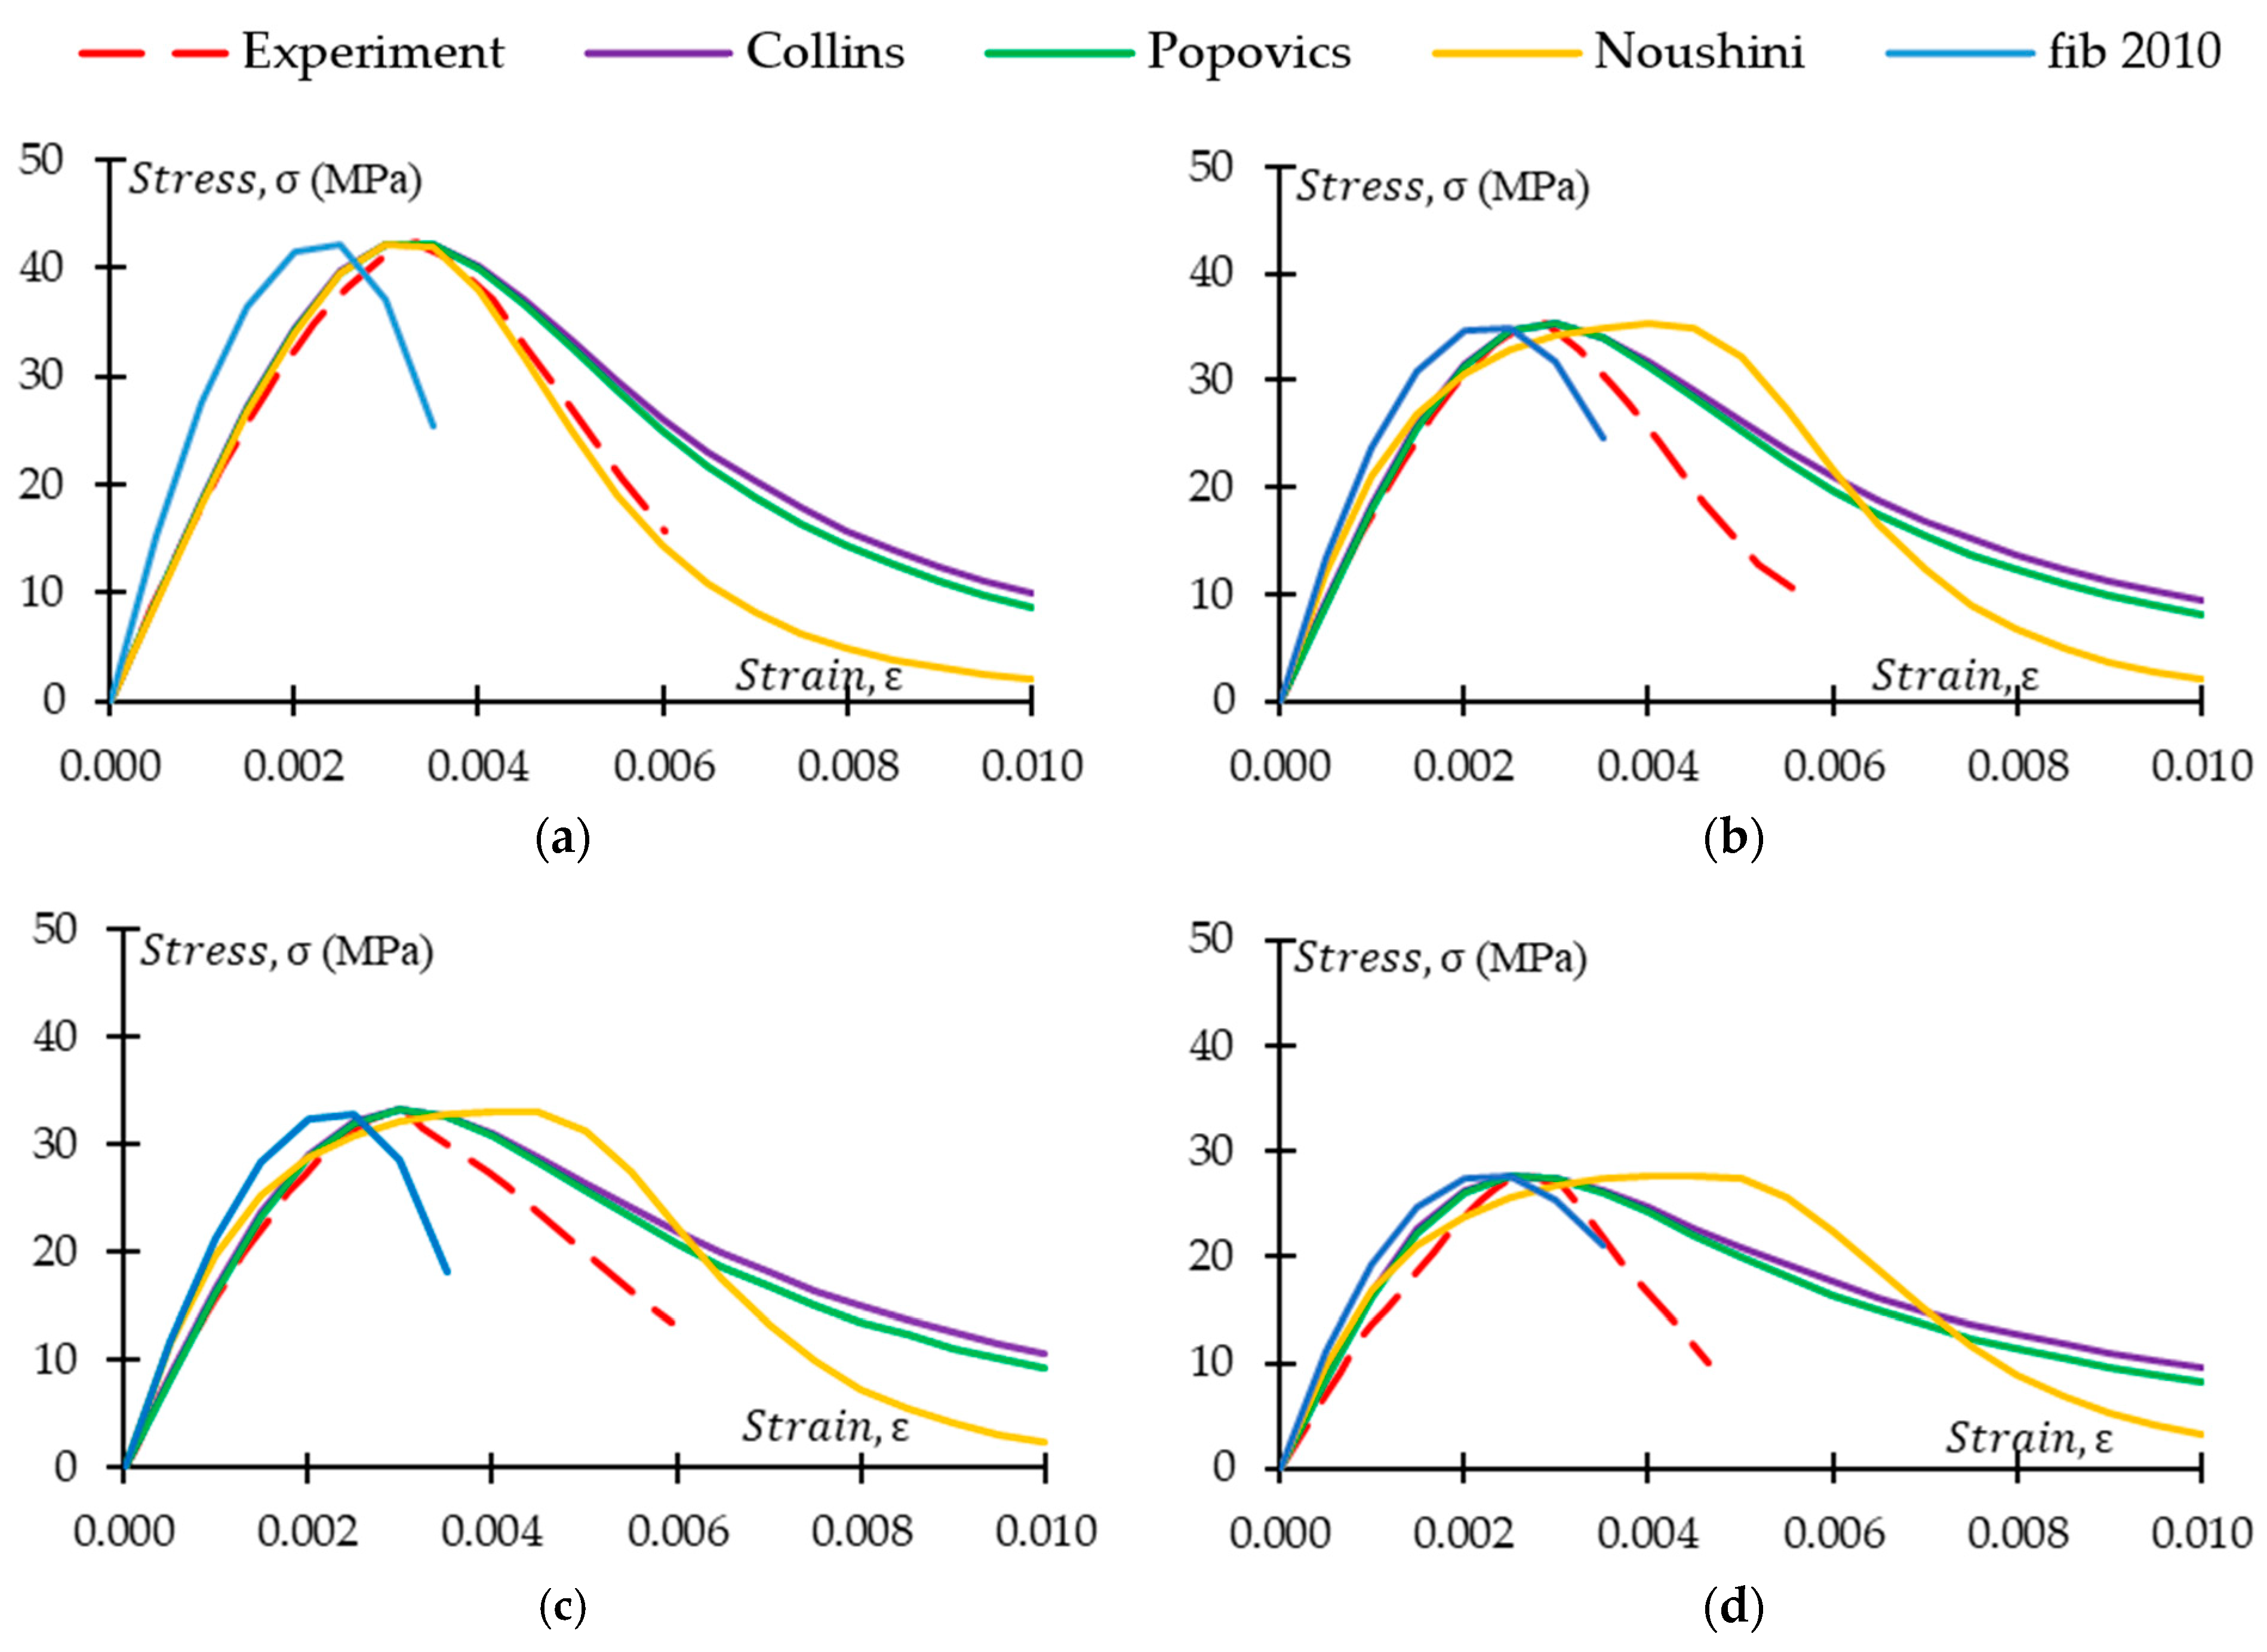
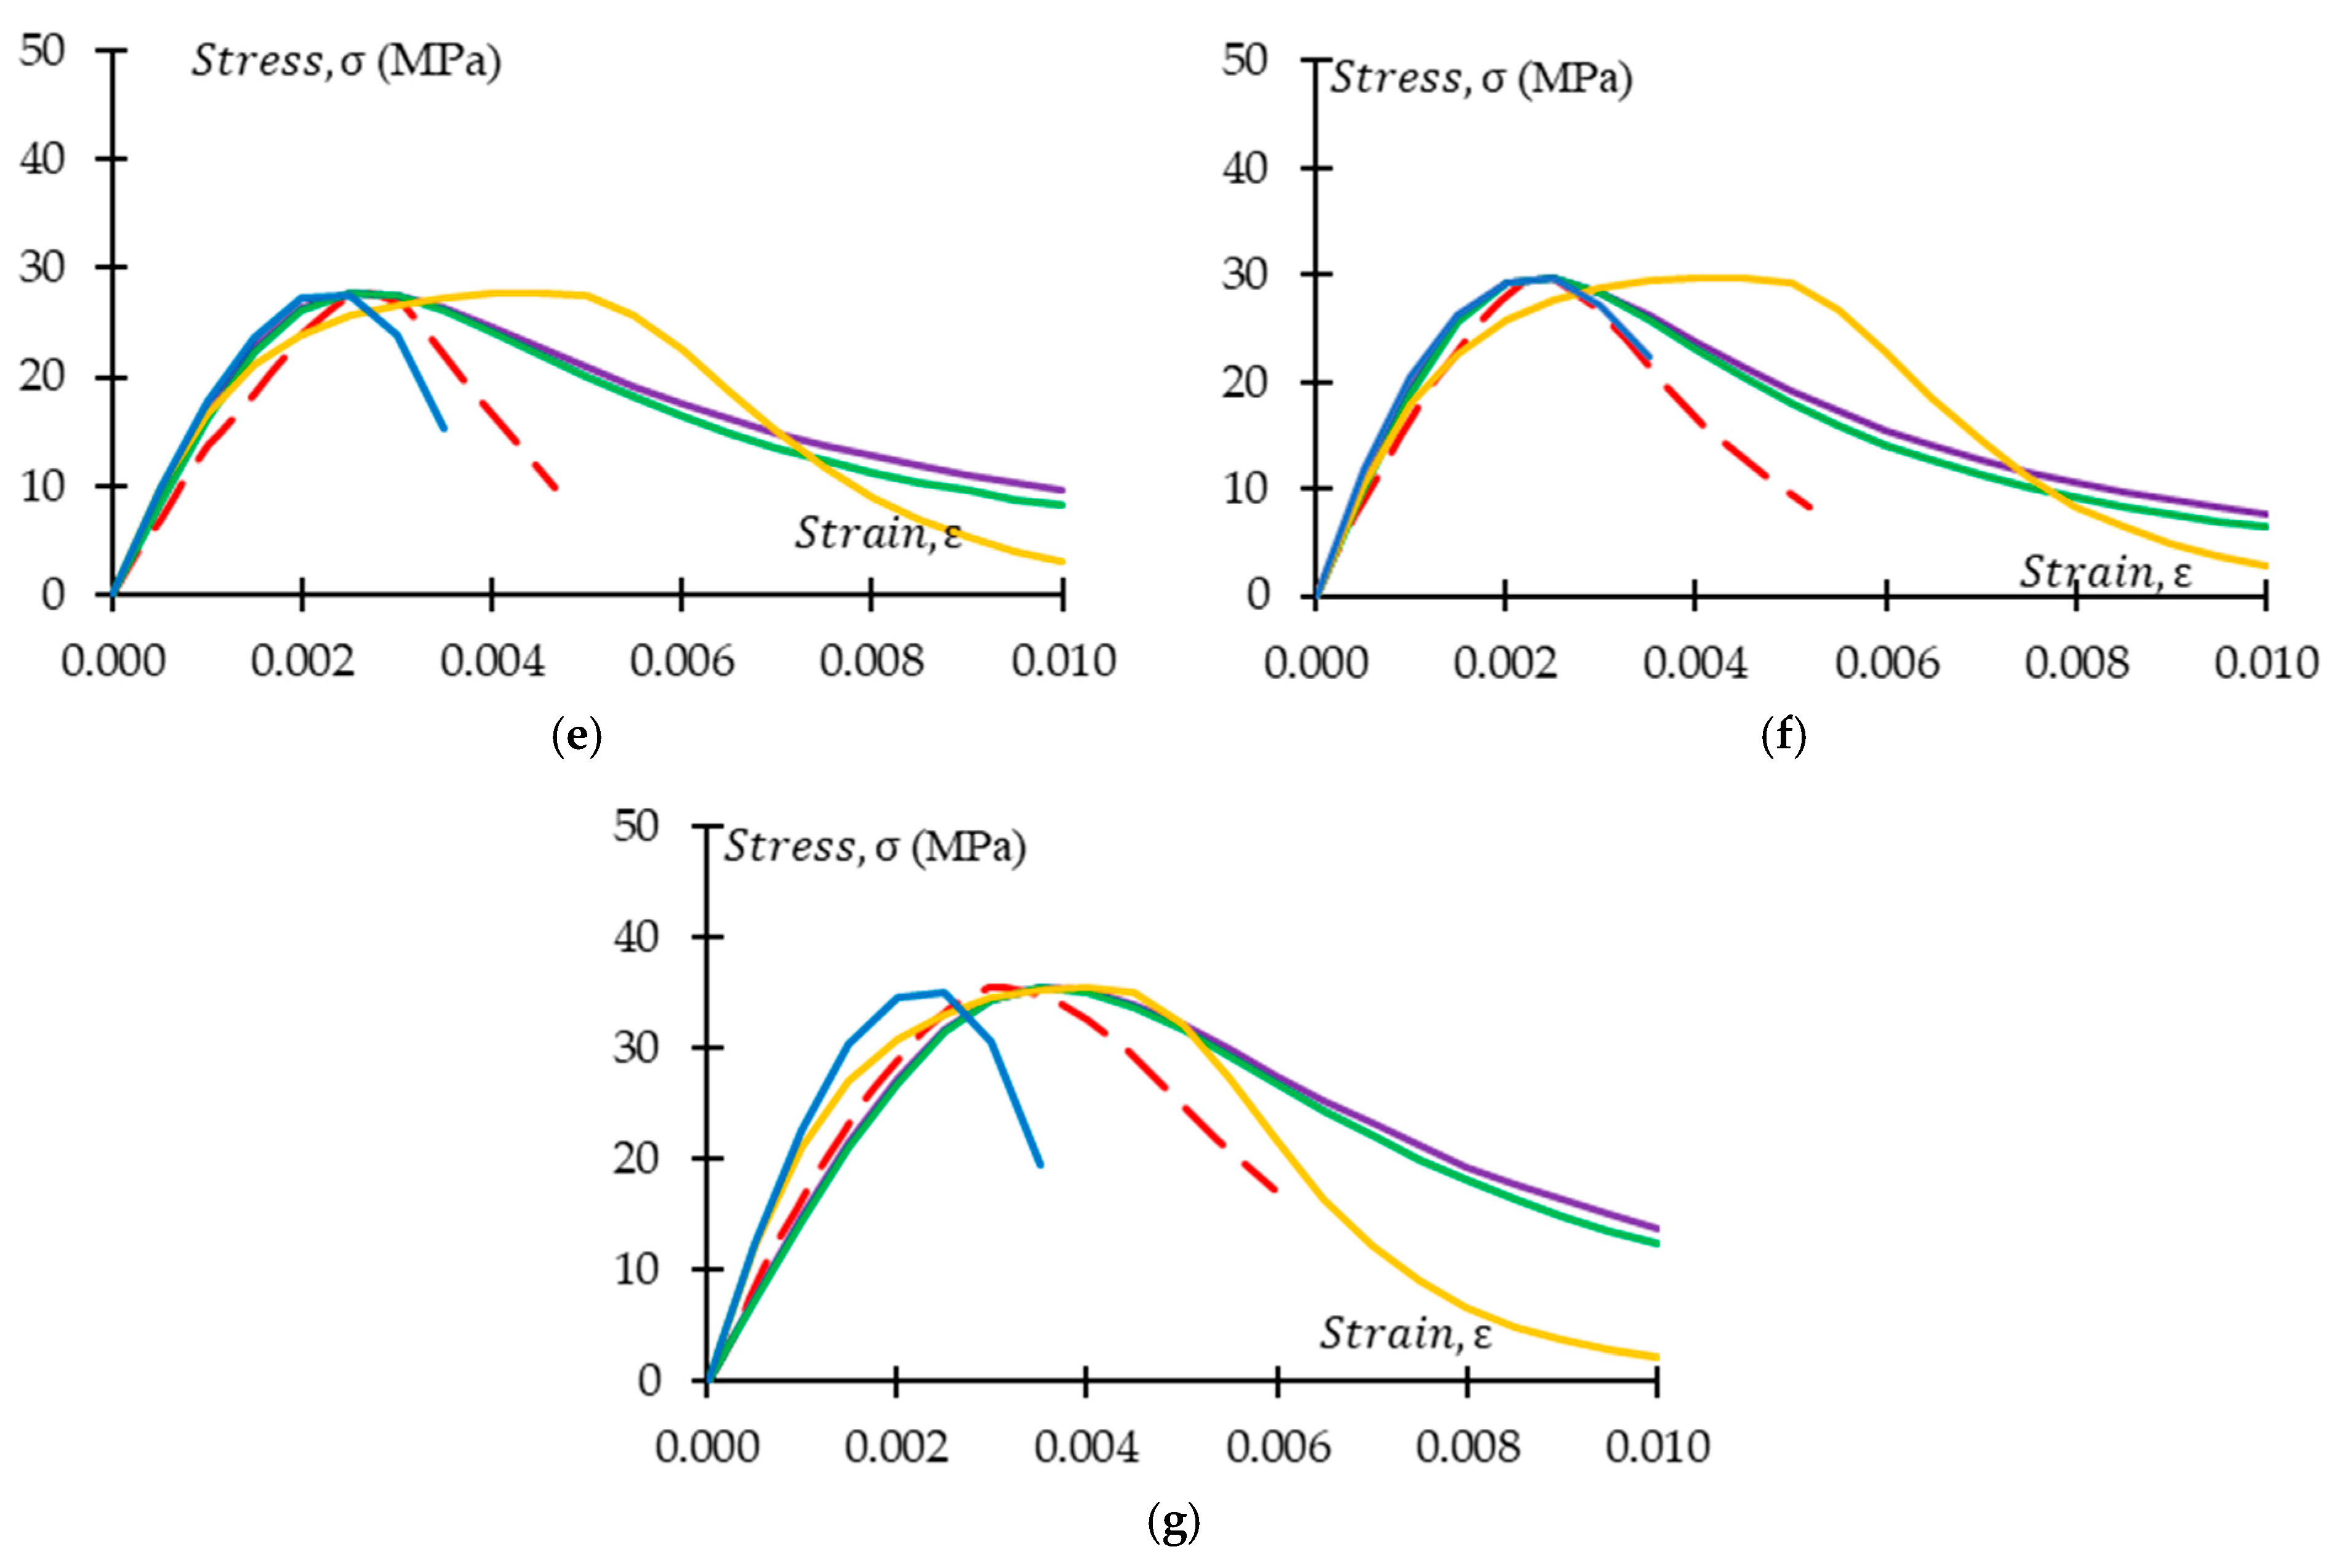
Figure 21.
Stress–strain model comparison for GPC Mix 1 with pre-treated CRGPC and non-treated CRGPC mixes. (a) M1 stress–strain comparison with the model of Collins, Popovics, Noushini, and fib 2010; (b) M1 TC05 stress–strain comparison with the model of Collins, Popovics, Noushini, and fib 2010; (c) M1 TC15 stress–strain comparison with the model of Collins, Popovics, Noushini, and fib 2010; (d) M1 TC25 stress–strain comparison with the model of Collins, Popovics, Noushini, and fib 2010; (e) M1 C25 stress–strain comparison with the model of Collins, Popovics, Noushini, and fib 2010; (f) M1 C15 stress–strain comparison with the model of Collins, Popovics, Noushini, and fib 2010; (g) M1 C05 stress–strain comparison with the model of Collins, Popovics, Noushini, and fib 2010.
Figure 22.
Stress–strain model comparison for GPC Mix 2 with pre-treated CRGPC and non-treated CRGPC mixes. (a) M2 stress–strain comparison with the model of Collins, Popovics, Noushini, and fib 2010; (b) M2 TC05 stress–strain comparison with the model of Collins, Popovics, Noushini, and fib 2010; (c) M2 TC15 stress–strain comparison with the model of Collins, Popovics, Noushini, and fib 2010; (d) M2 TC25 stress–strain comparison with the model of Collins, Popovics, Noushini, and fib 2010; (e) M2 C25 stress–strain comparison with the model of Collins, Popovics, Noushini, and fib 2010; (f) M2 C15 stress–strain comparison with the model of Collins, Popovics, Noushini, and fib 2010; (g) M2 C05 stress–strain comparison with the model of Collins, Popovics, Noushini, and fib 2010.
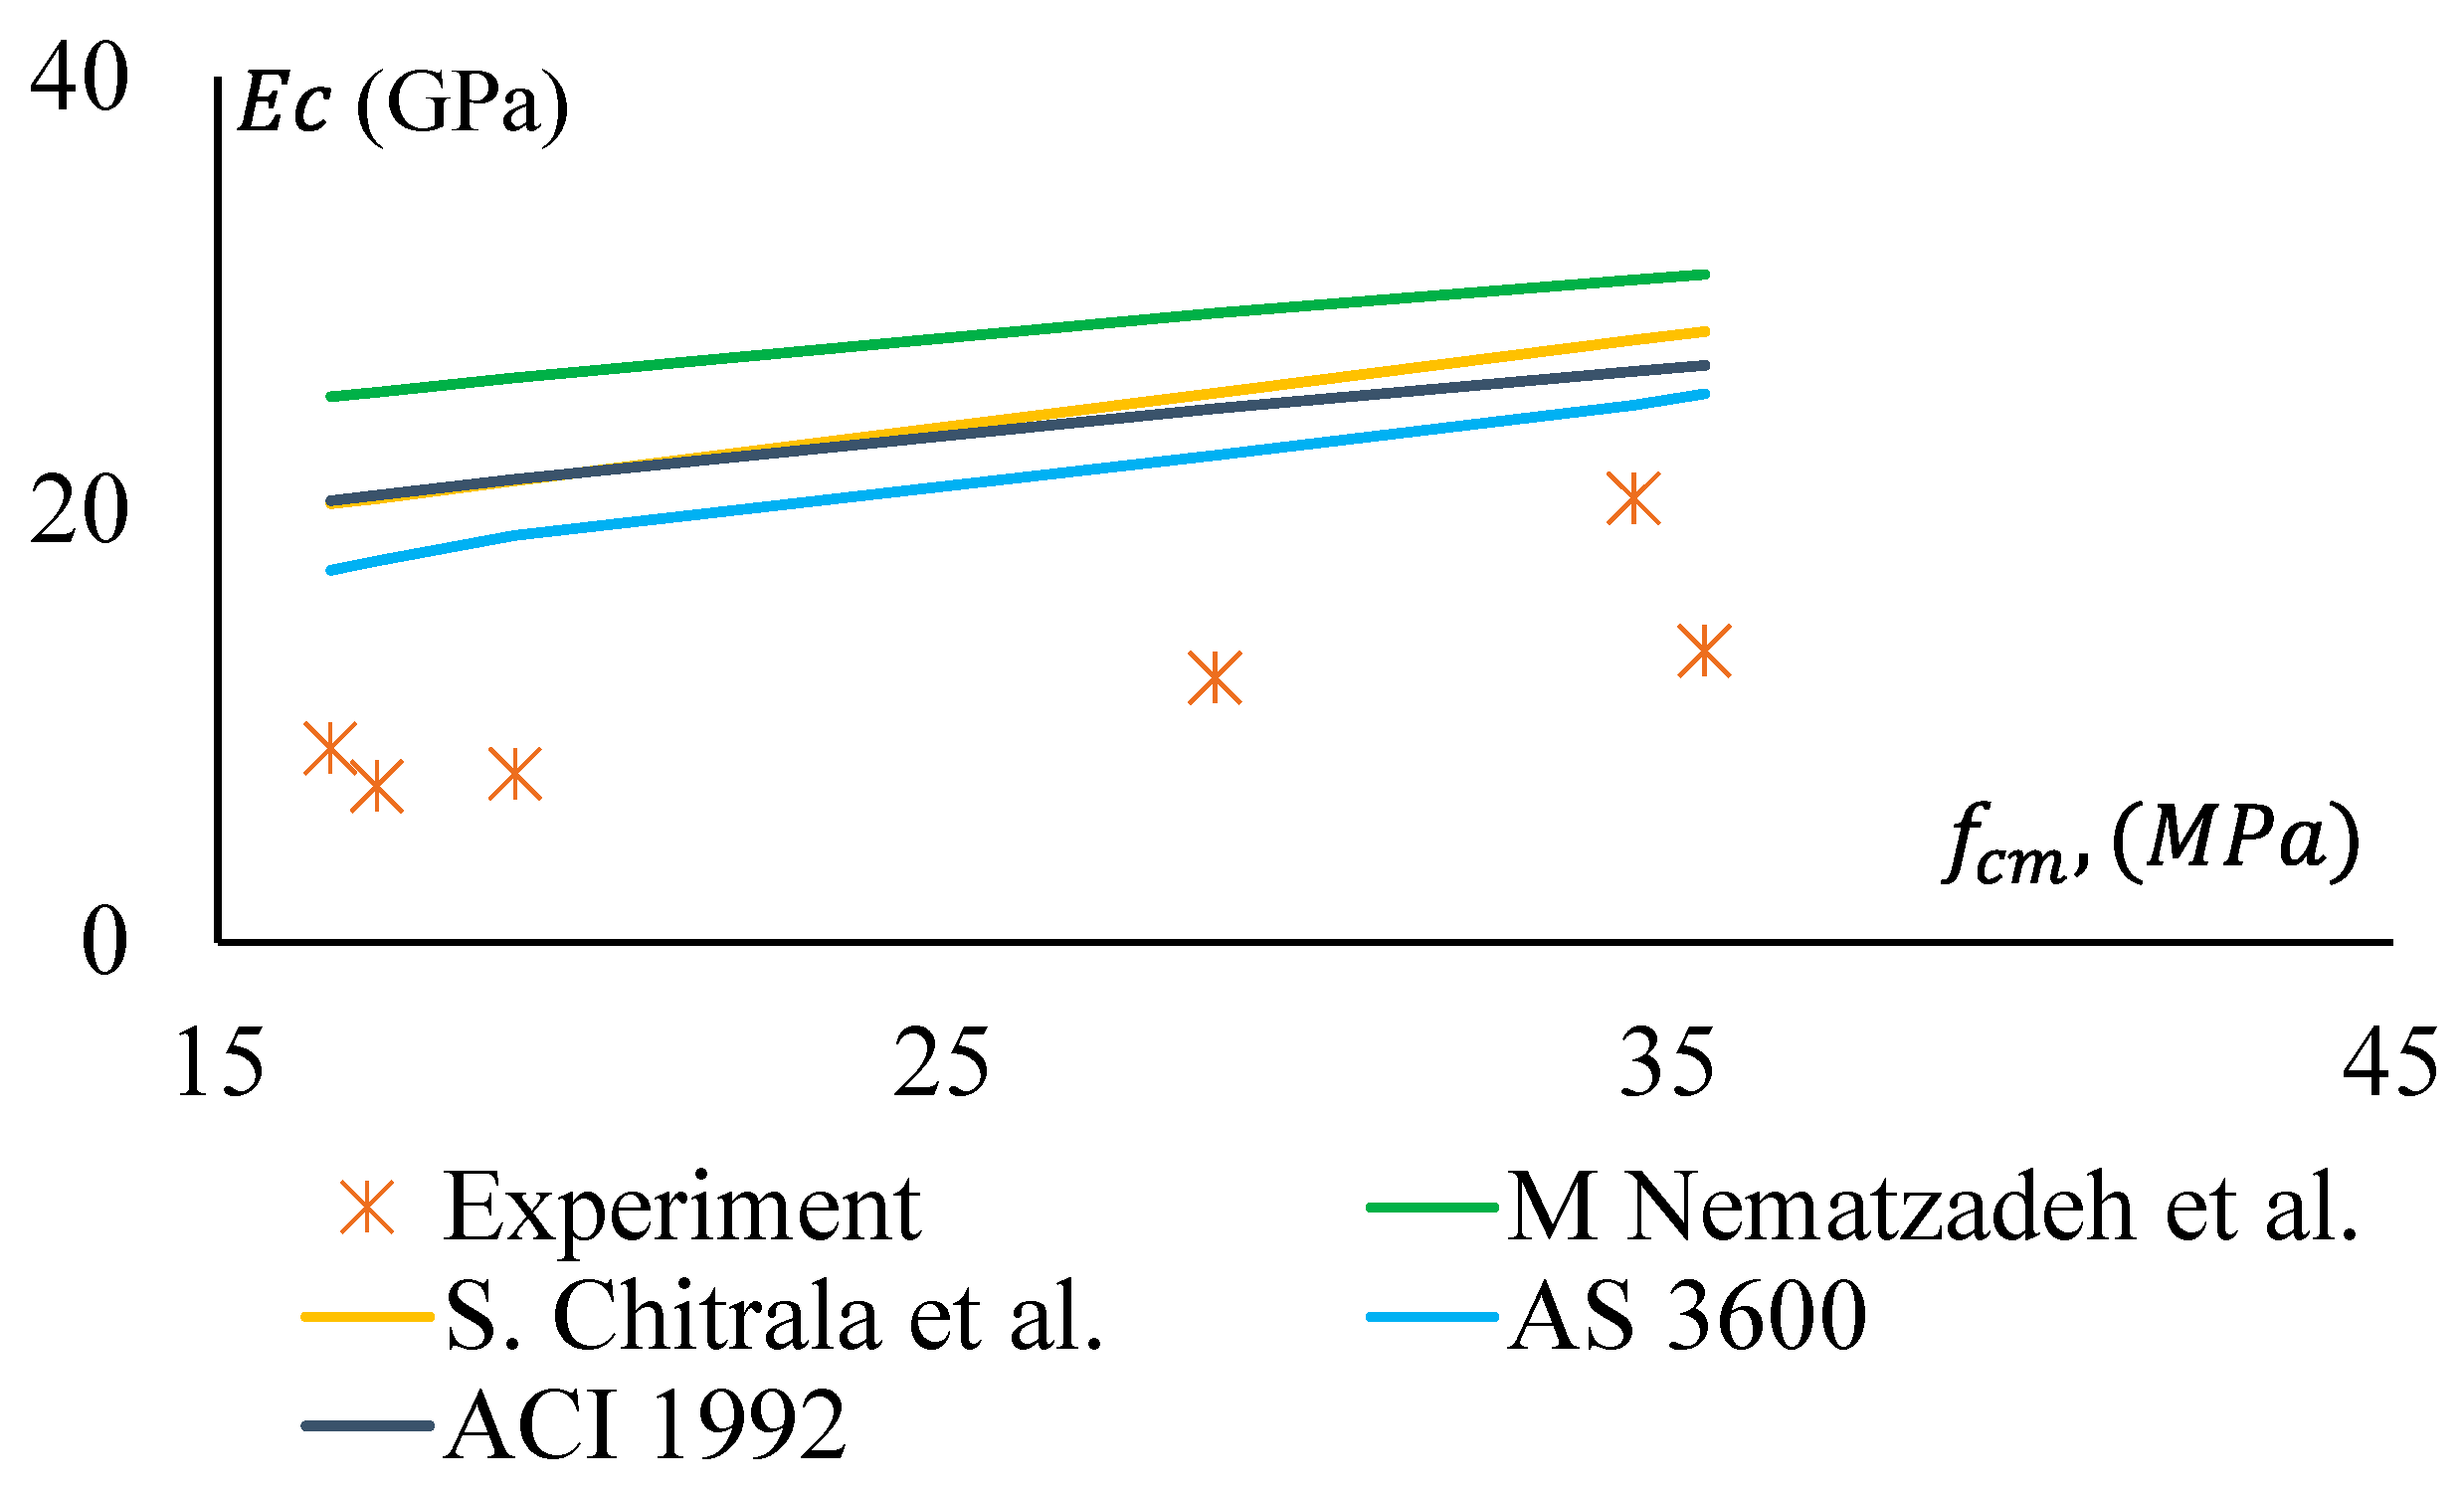
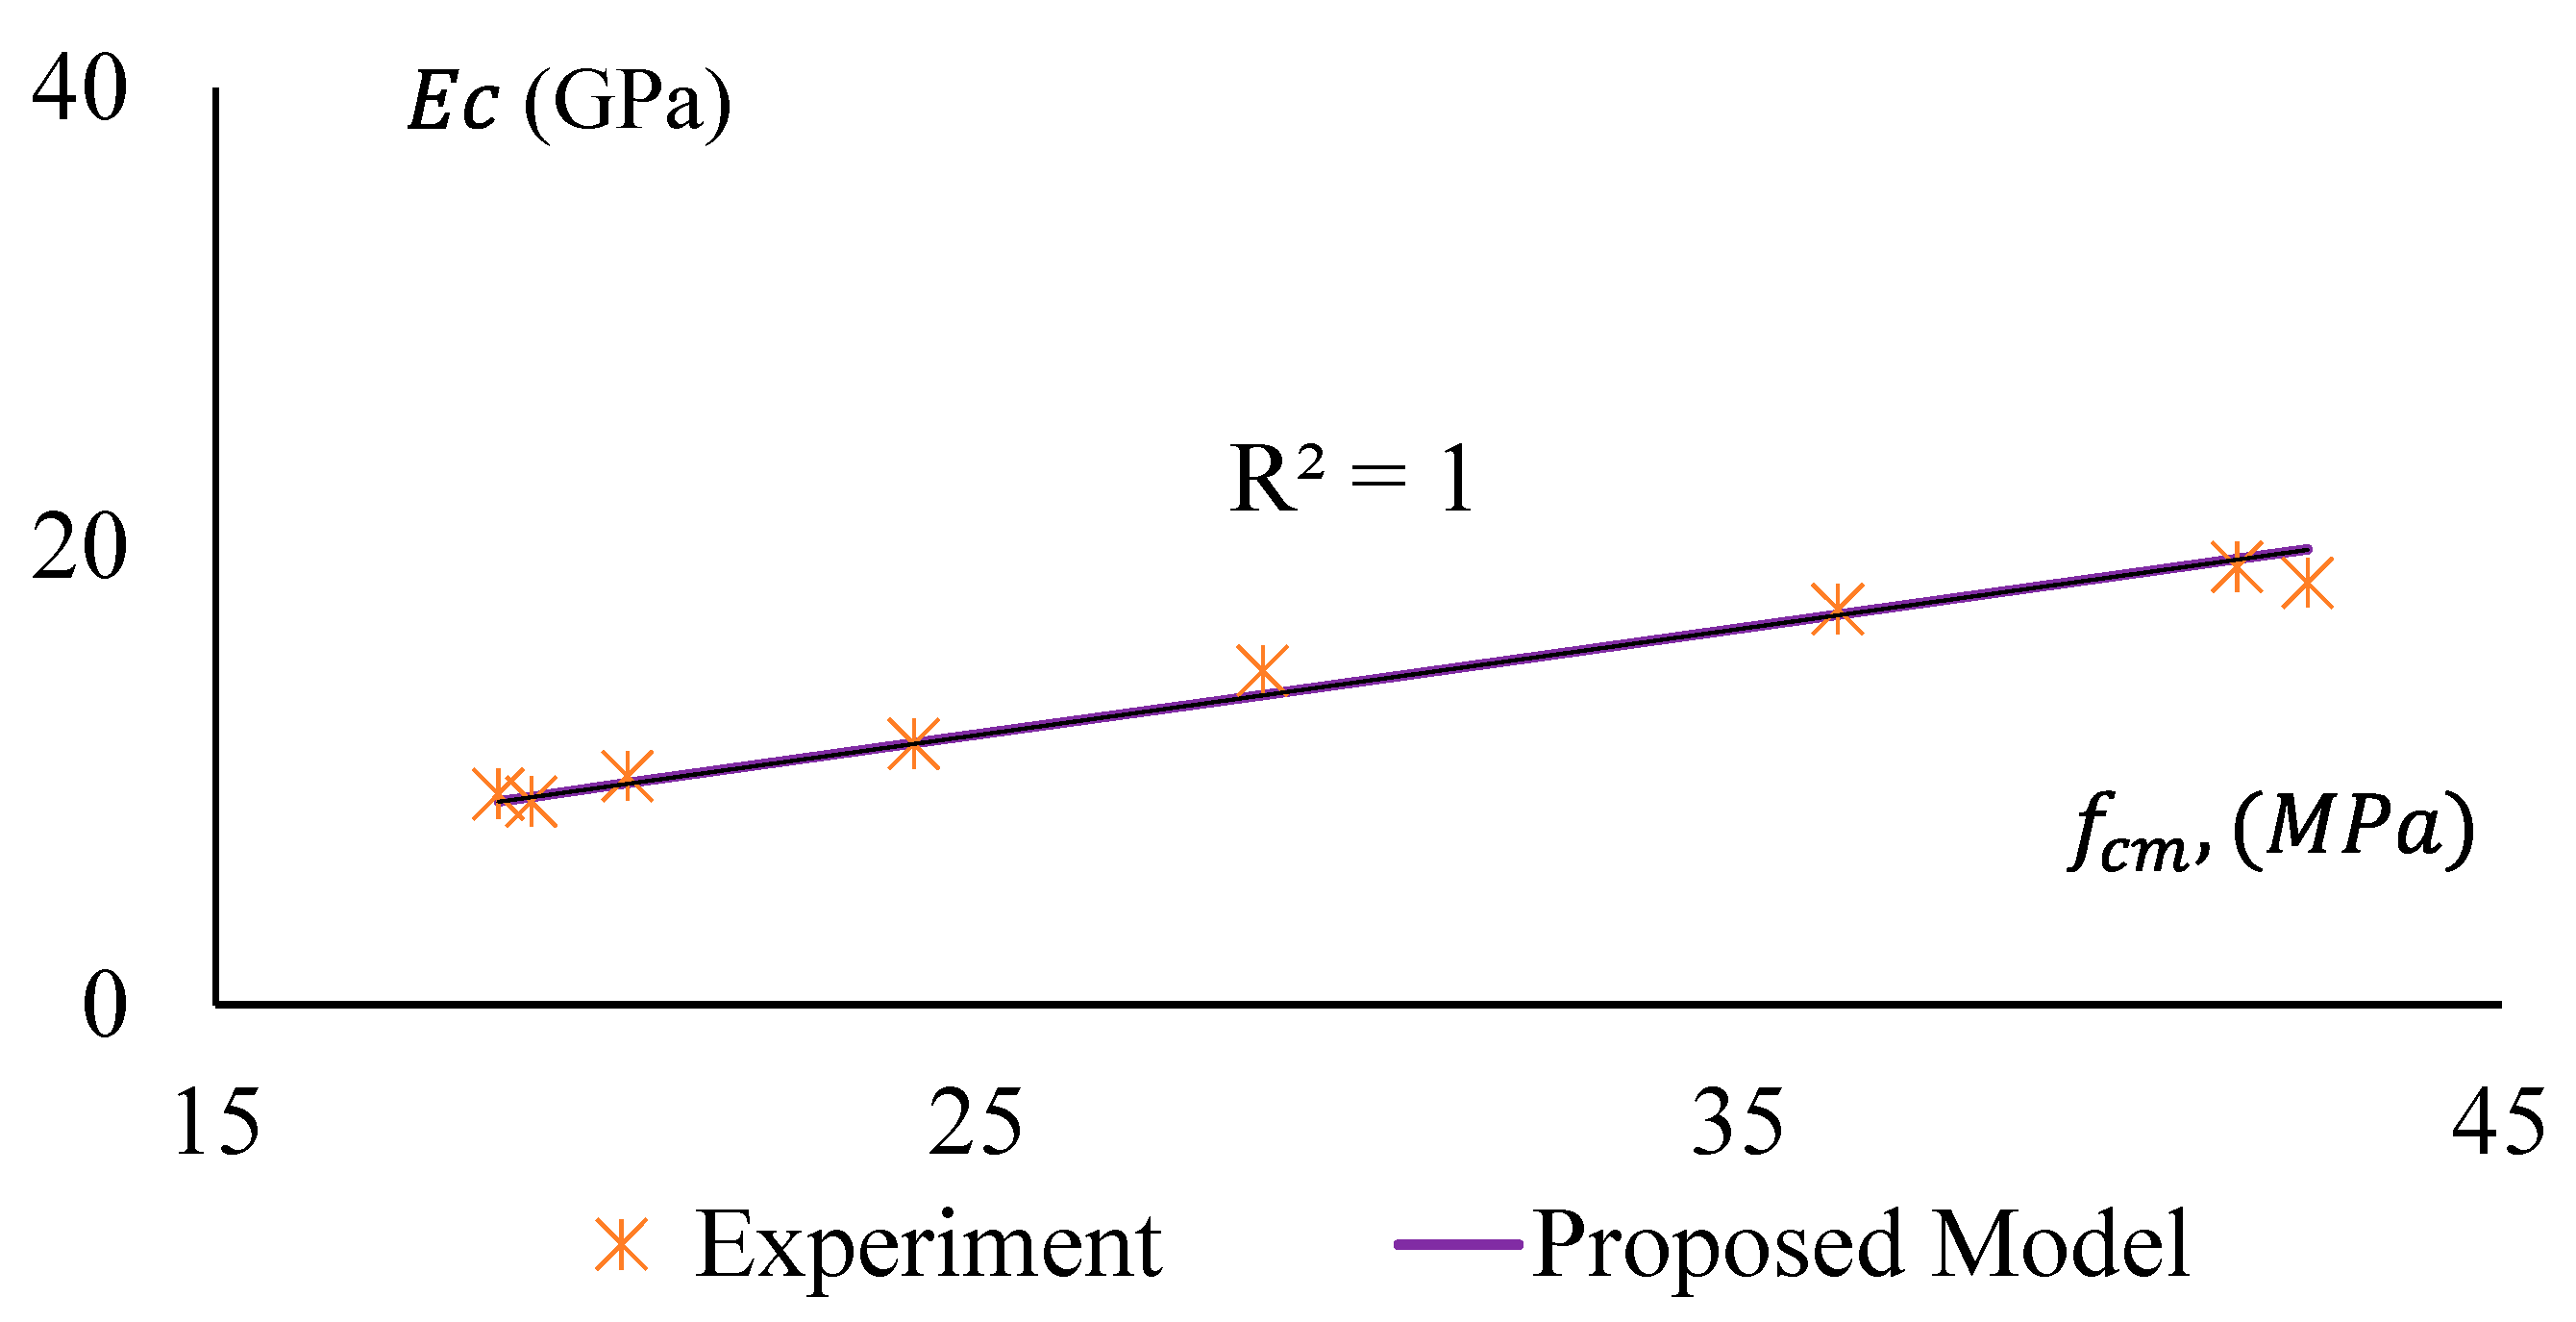
Figure 23.
Modulus of Elasticity versus compressive strength of GPC and pre-treated CRGPC for the proposed model and experimental results.
Figure 23.
Modulus of Elasticity versus compressive strength of GPC and pre-treated CRGPC for the proposed model and experimental results.
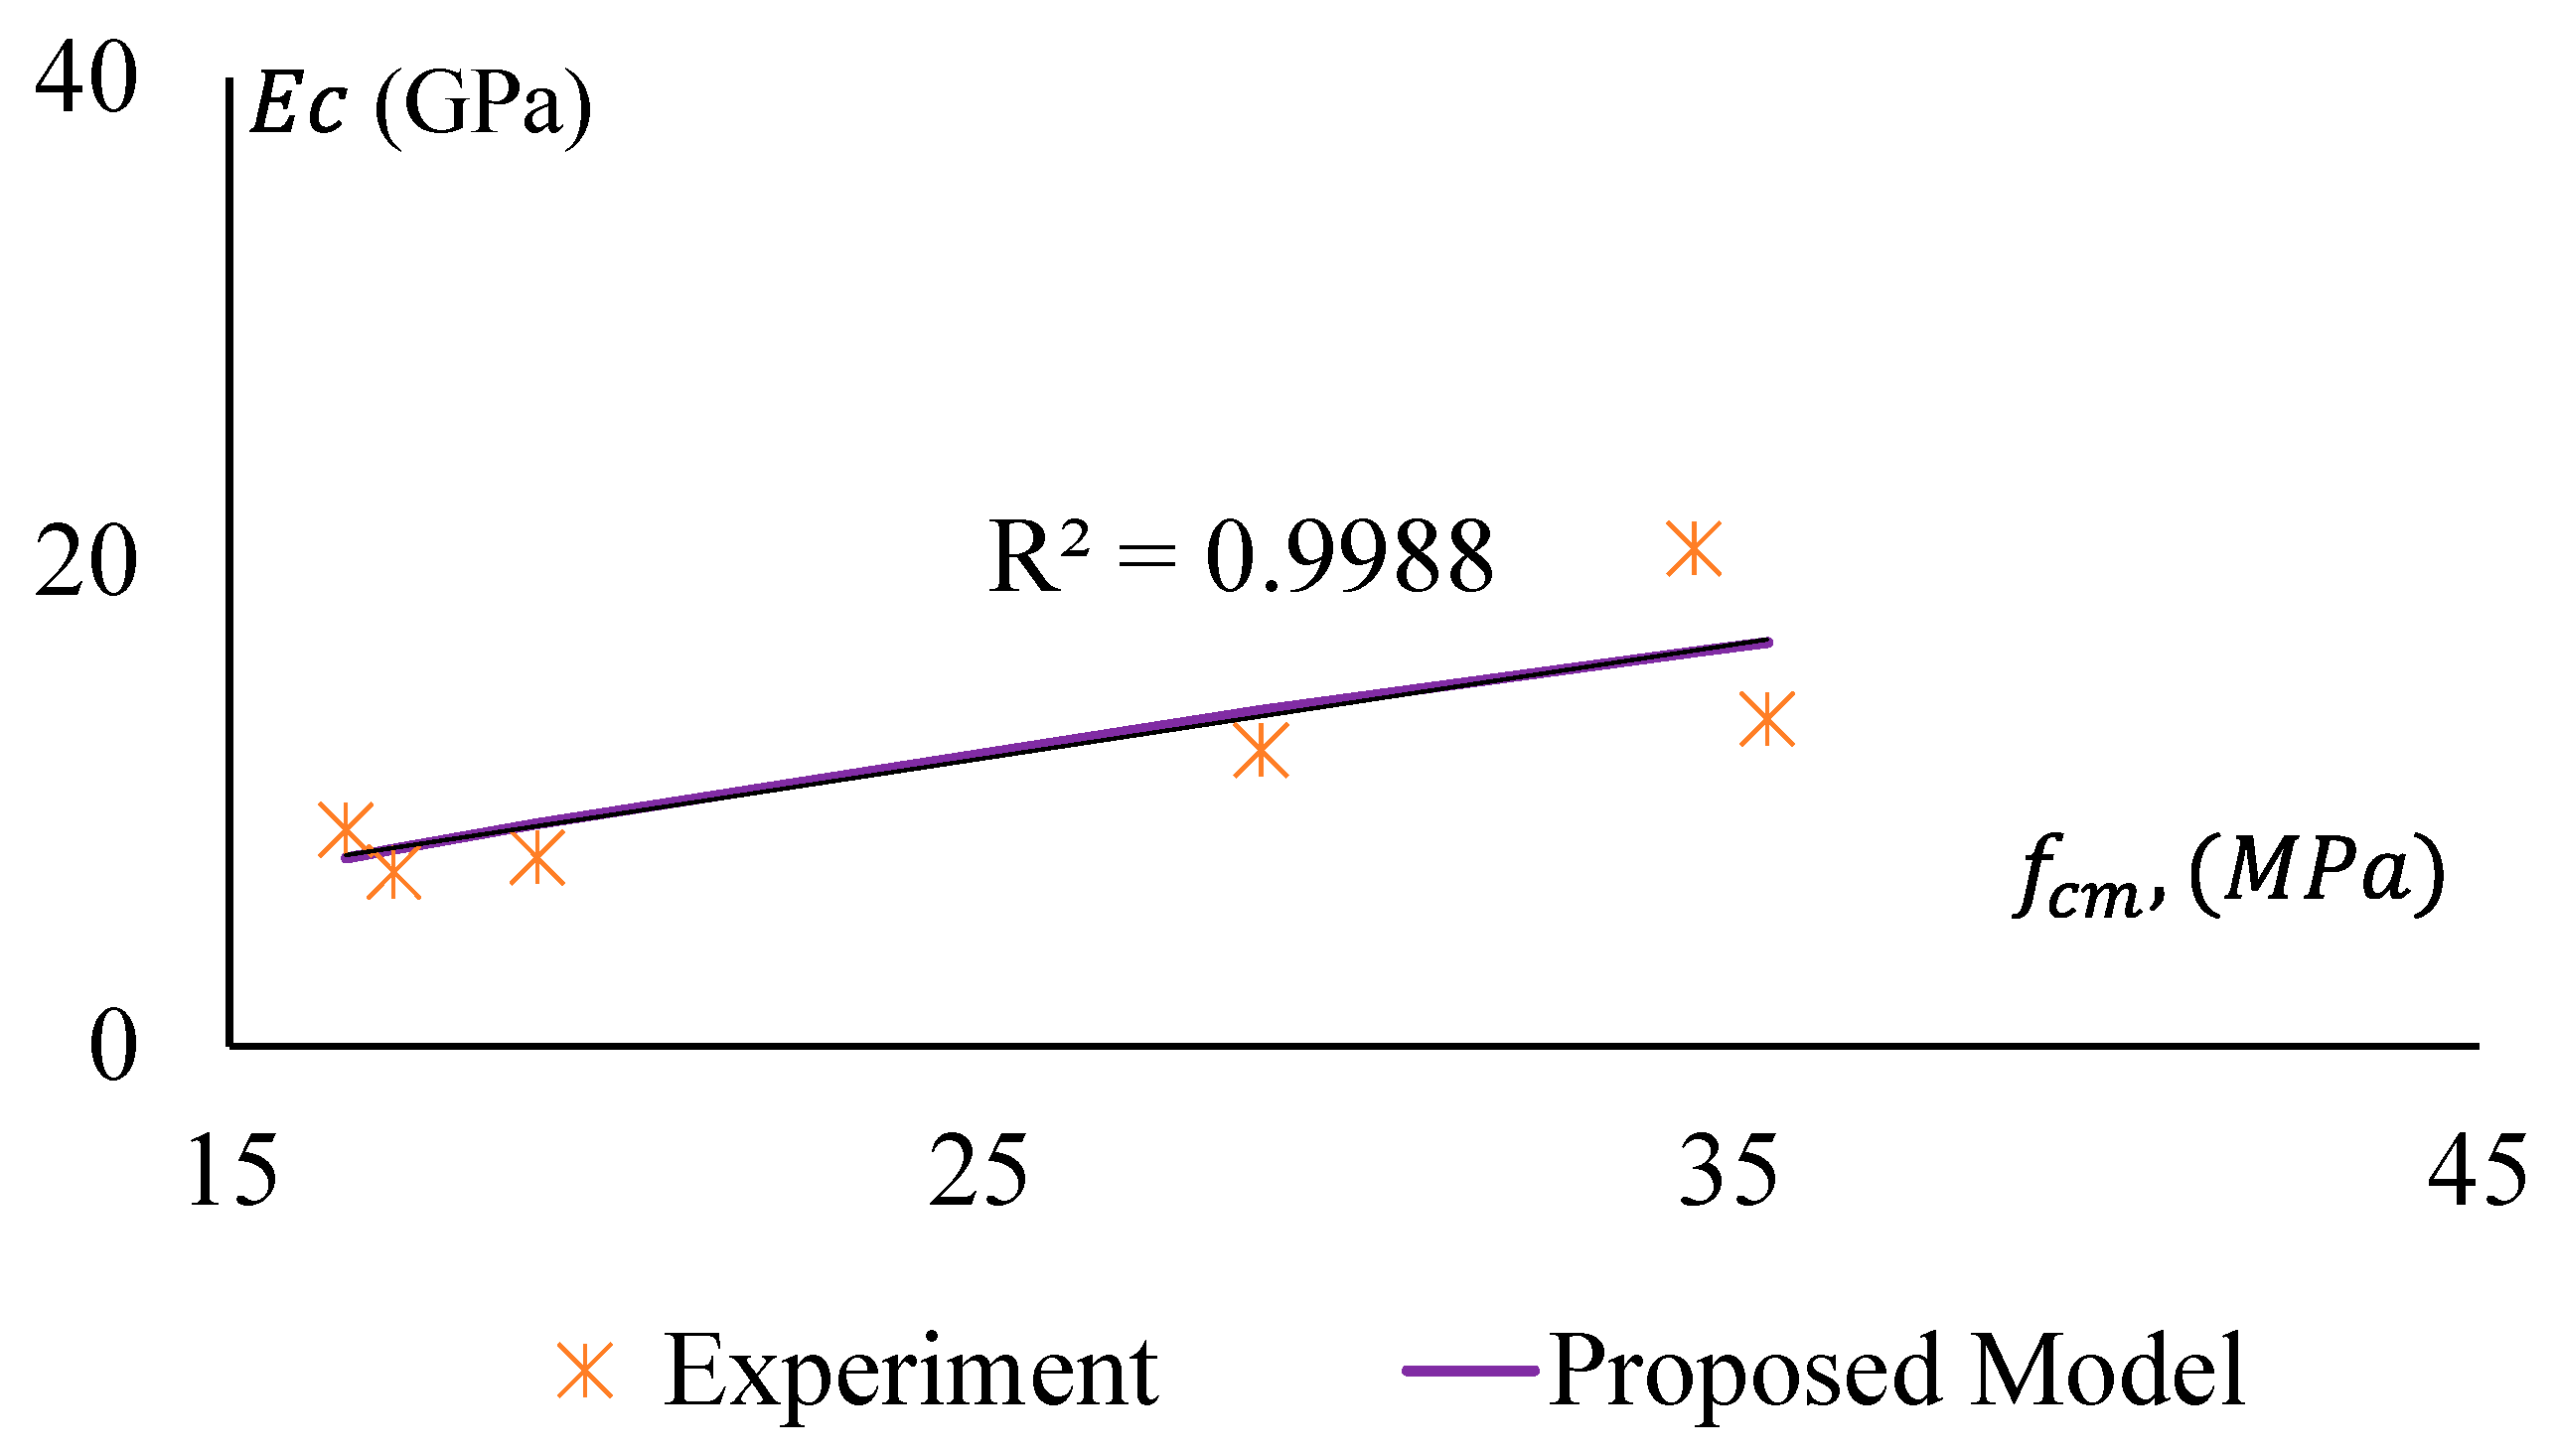
Figure 24.
Modulus of Elasticity versus compressive strength of GPC and non-treated CRGPC for the proposed model and experimental results.
Figure 24.
Modulus of Elasticity versus compressive strength of GPC and non-treated CRGPC for the proposed model and experimental results.
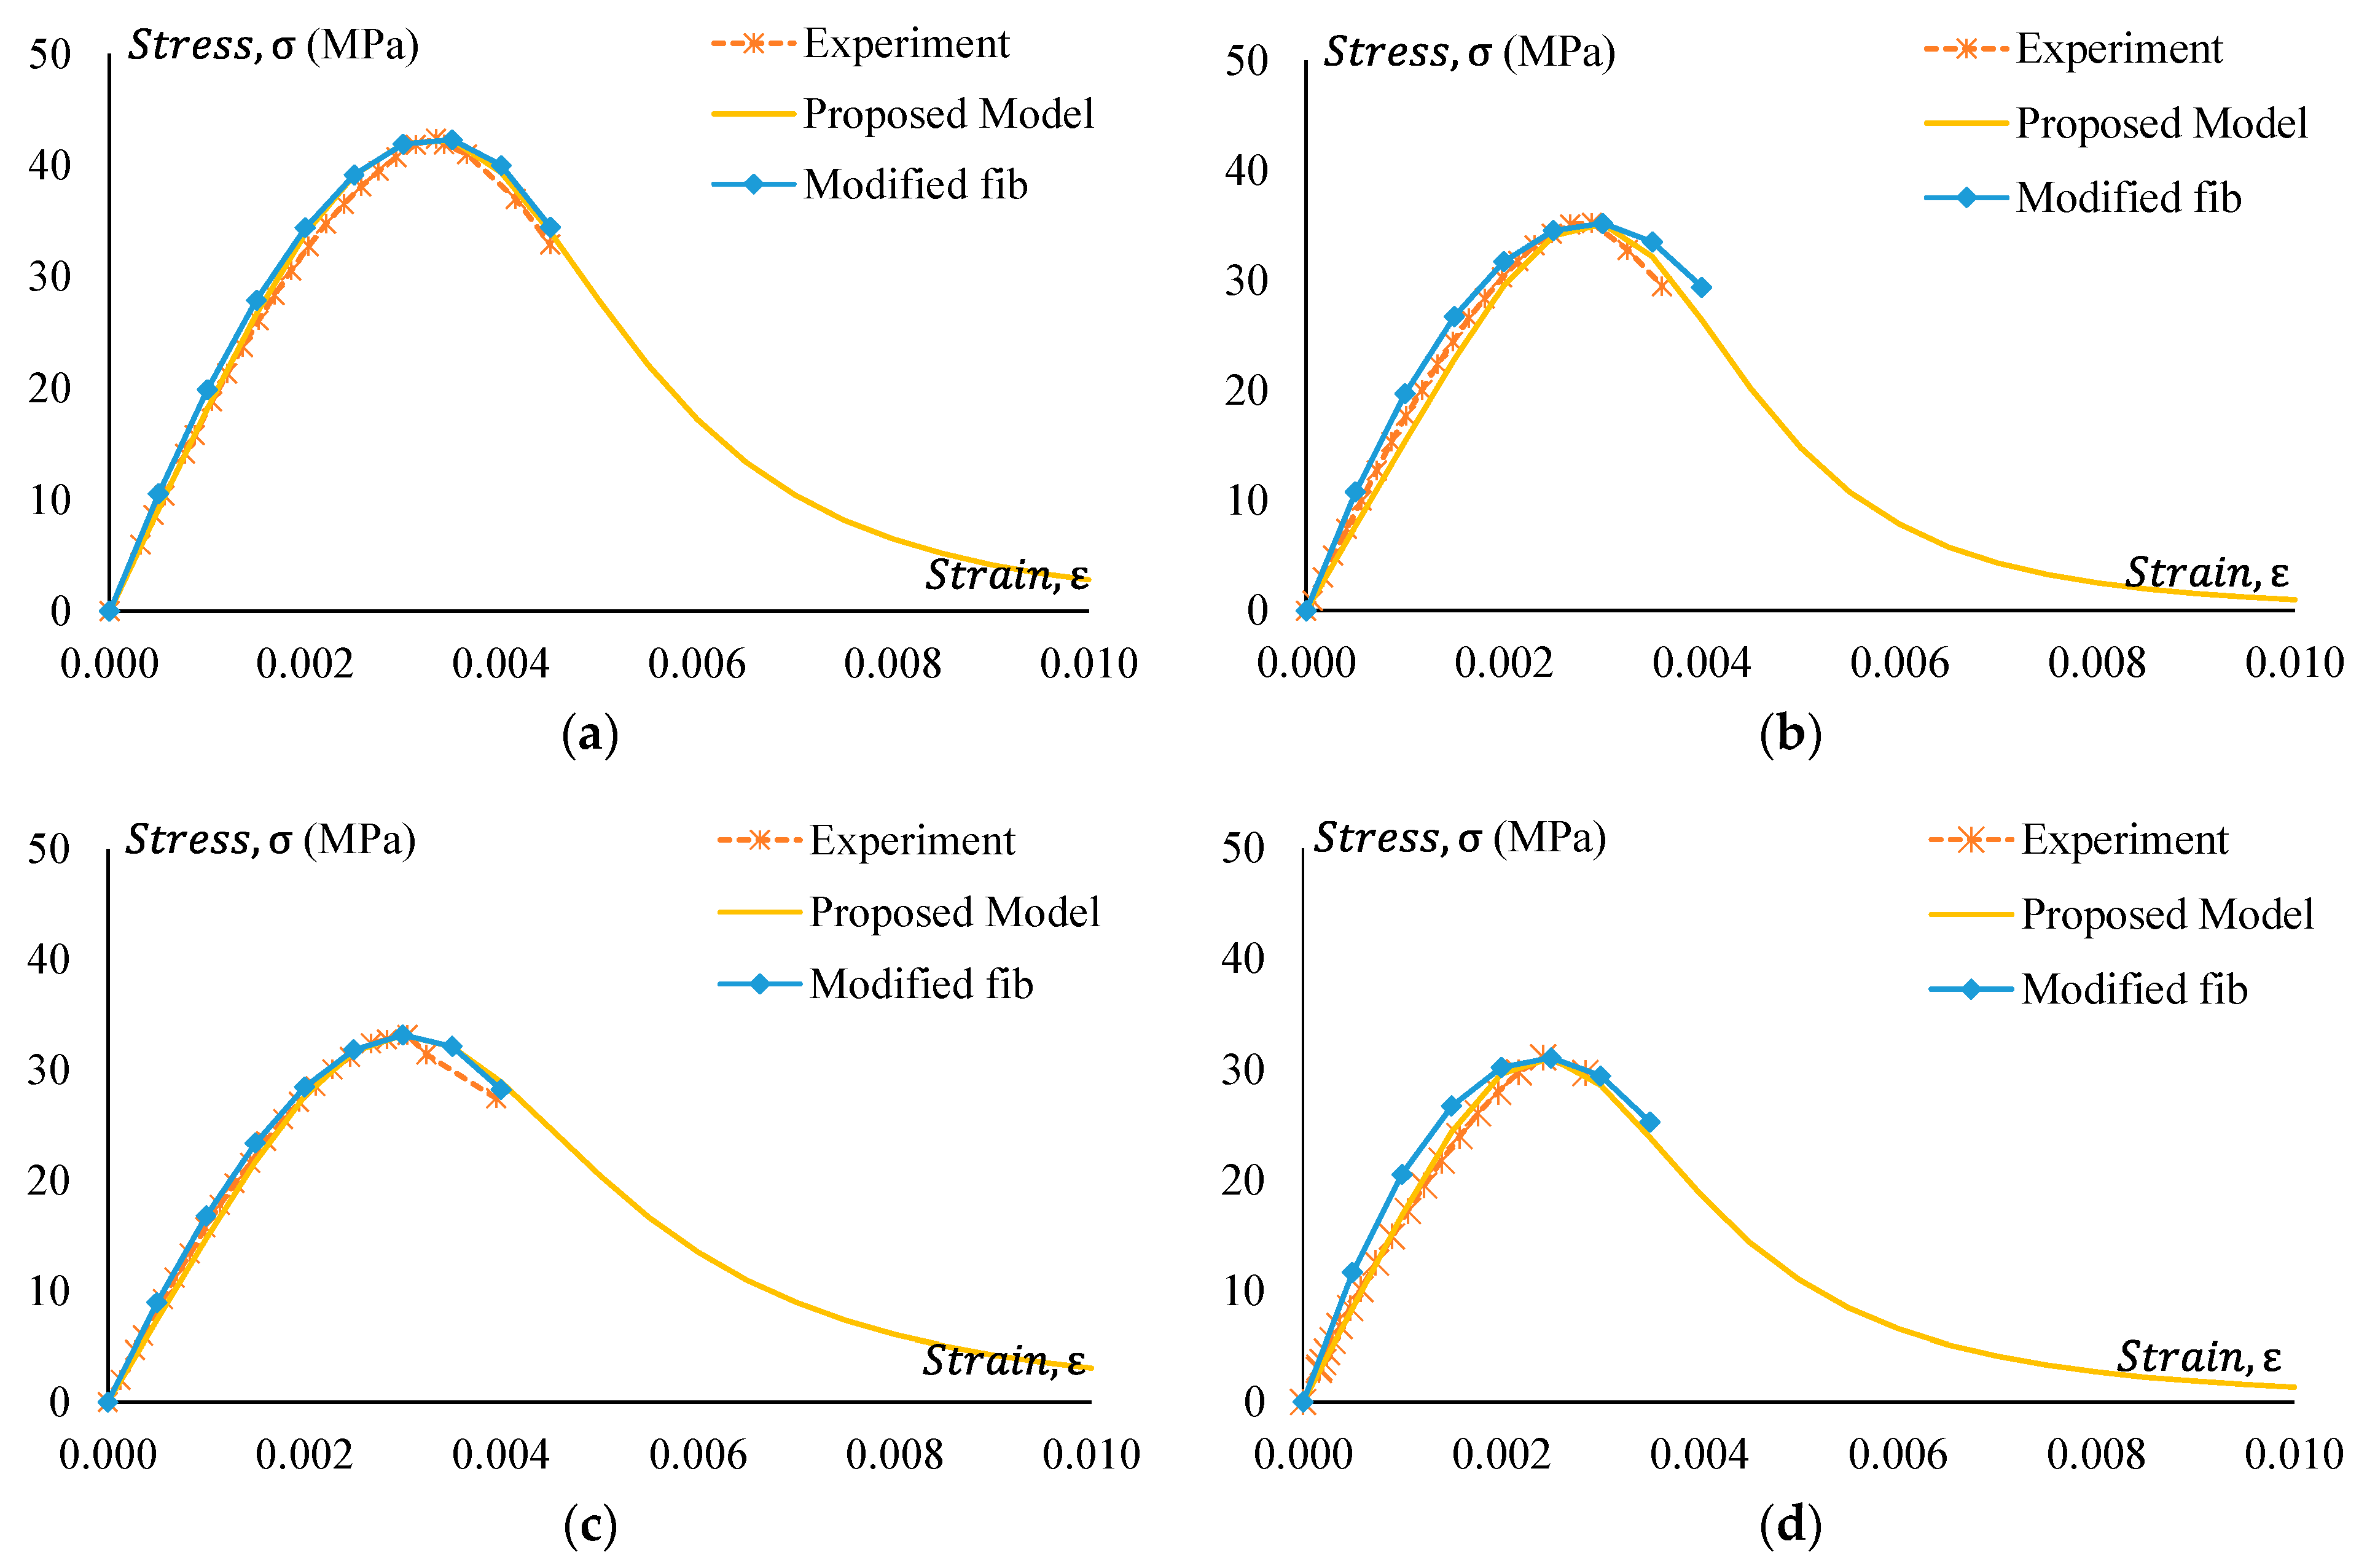
Figure 25.
Experimental stress–strain comparison with the proposed model for GPC Mix 1 and pre-treated CRGPC mixes. (a) M1 stress–strain comparison with proposed model and modified fib; (b) M1 TC05 stress–strain comparison with the proposed model and modified fib; (c) M1 TC15 stress–strain comparison with the proposed model and modified fib; (d) M1 TC25 stress–strain comparison with the proposed model and modified fib.
Figure 26.
Experimental stress–strain comparison with the proposed model for GPC Mix 1 and non-treated CRGPC mixes. (a) M1 stress–strain comparison with proposed model and modified fib; (b) M1 C15 stress–strain comparison with the proposed model and modified fib; (c) M1 C25 stress–strain comparison with the proposed model and modified fib.
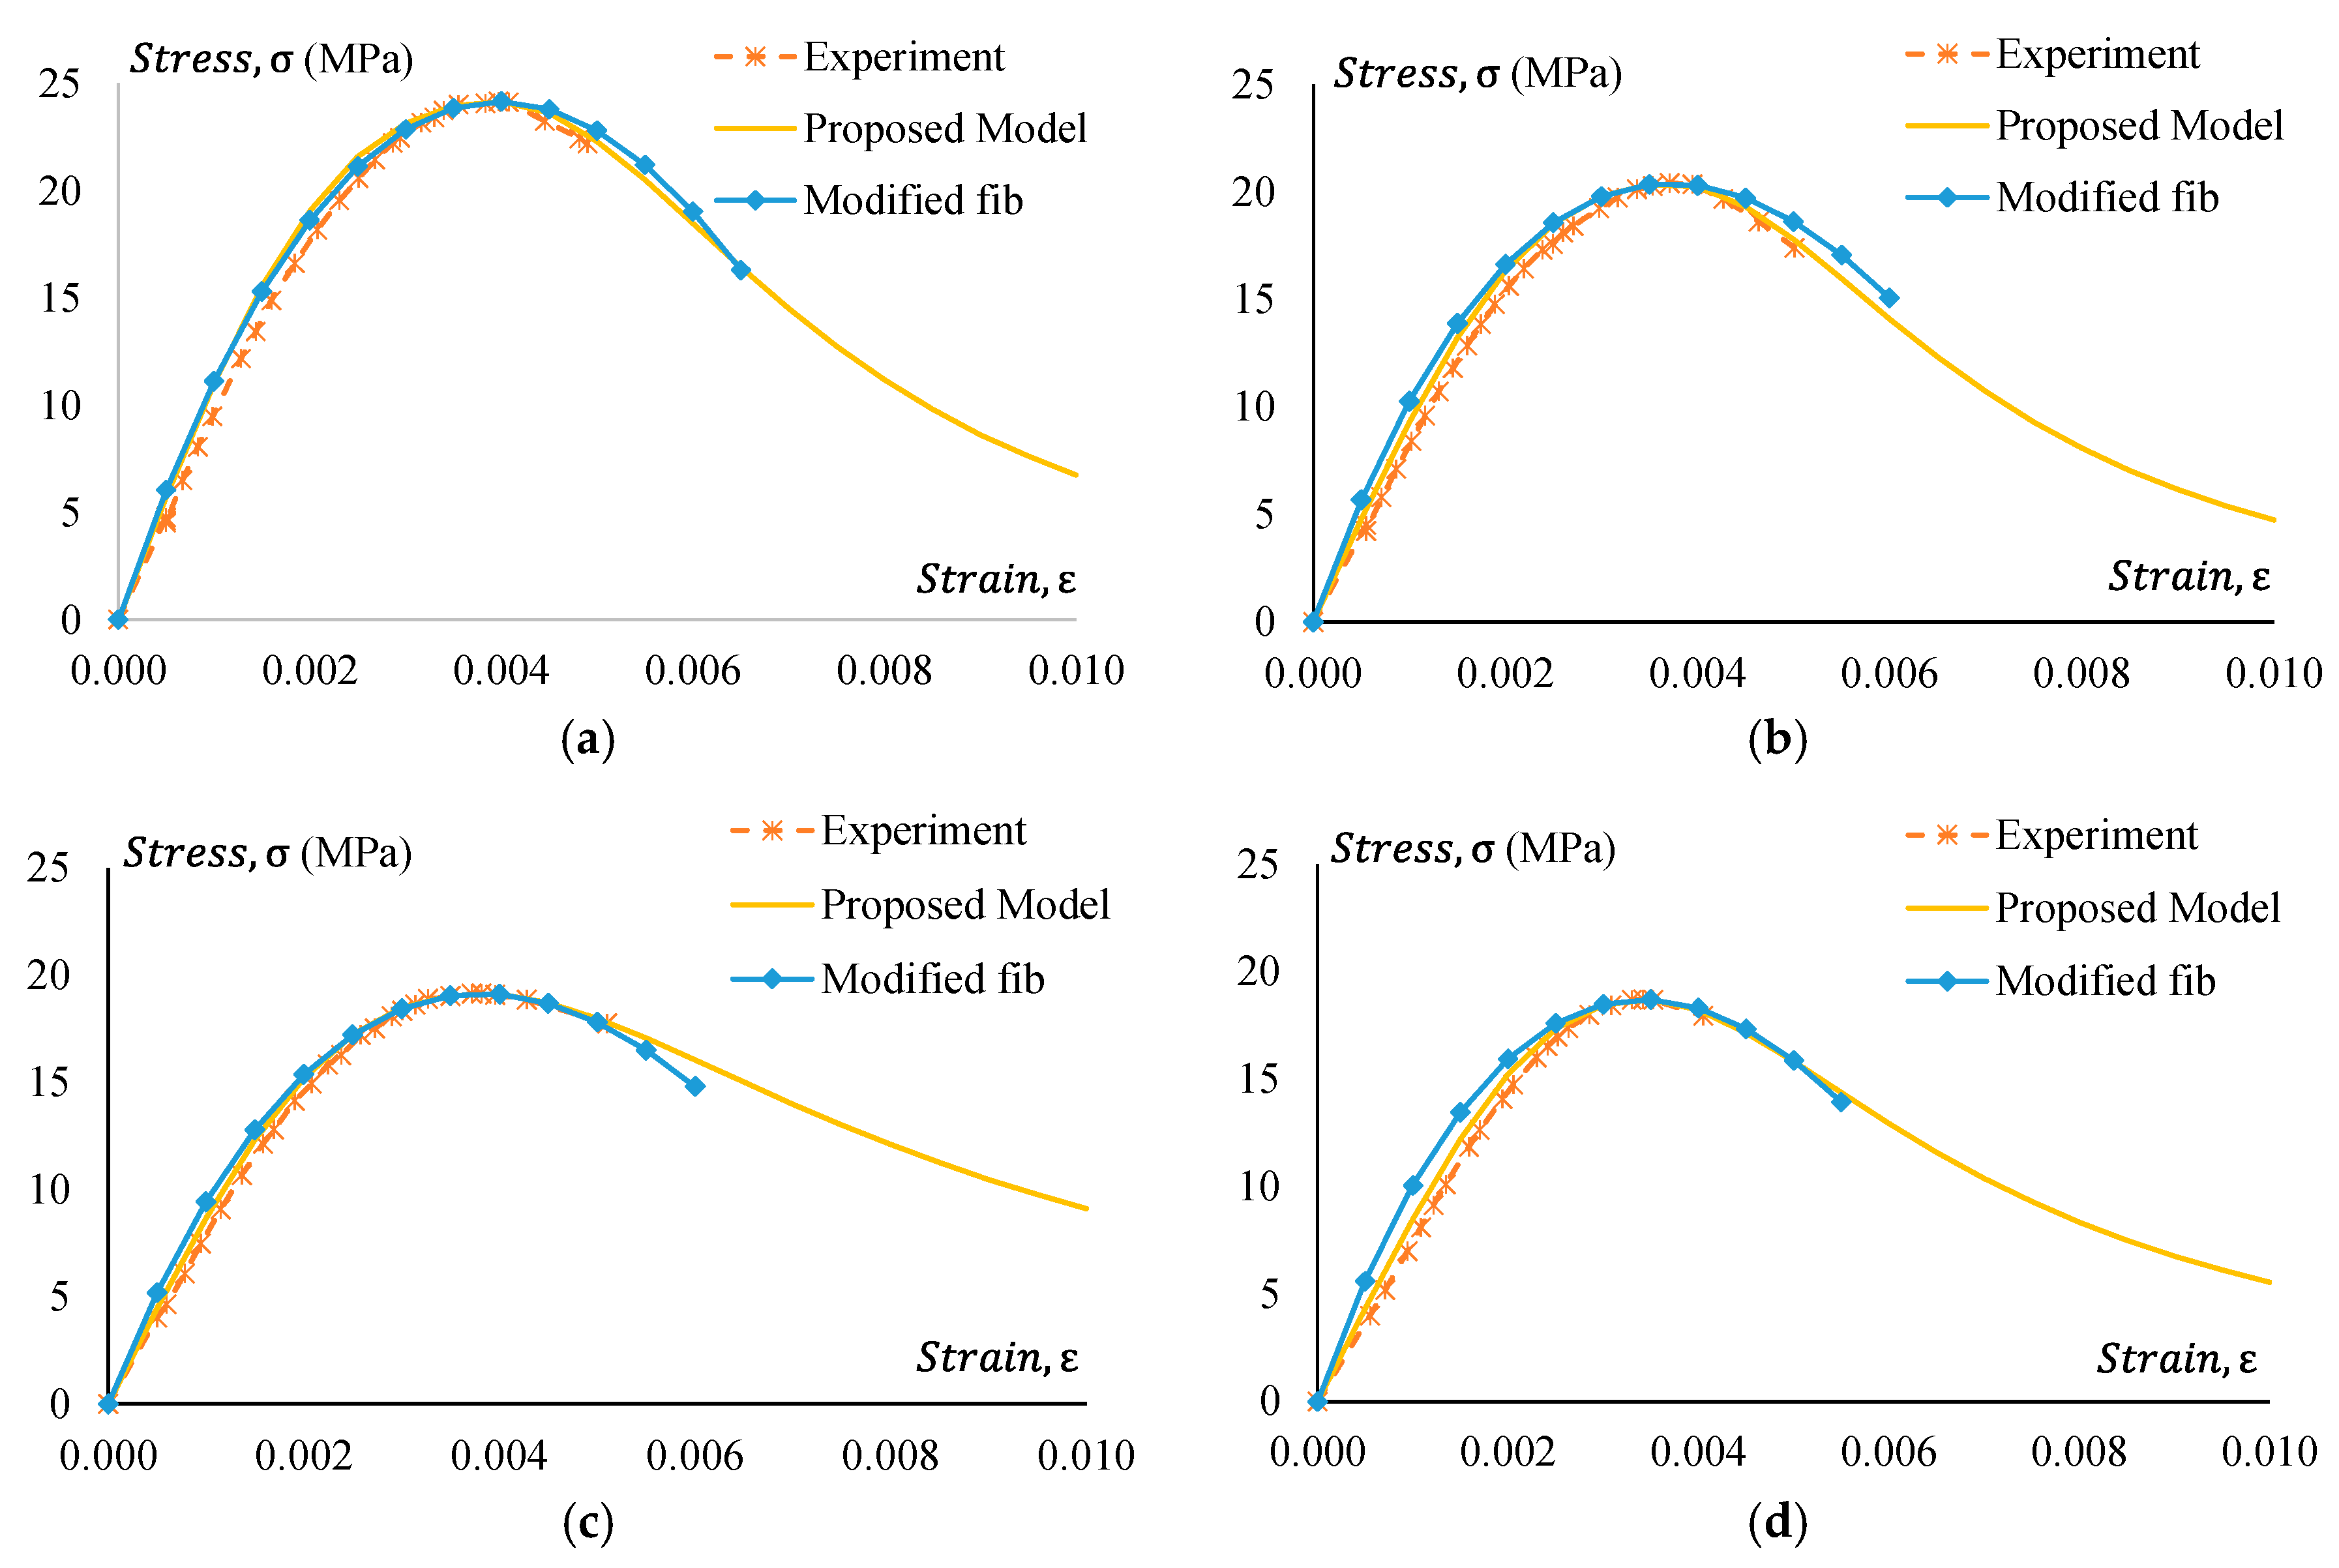
Figure 27.
Experimental stress–strain comparison with the proposed model for GPC Mix 2 and pre-treated CRGPC mixes. (a) M2 stress–strain comparison with the proposed model and modified fib; (b) M2 TC05 stress–strain comparison with the proposed model and modified fib; (c) M2 TC15 stress–strain comparison with the proposed model and modified fib; (d) M2 TC25 stress–strain comparison with the proposed model and modified fib.
Figure 28.
Experimental stress–strain comparison with the proposed model for GPC Mix 2 and non-treated CRGPC mixes. (a) M2 C05 stress–strain comparison with the proposed model and modified fib; (b) M2 C15 stress–strain comparison with the proposed model and modified fib; (c) M2 C25 stress–strain comparison with the proposed model and modified fib.
Table 1.
Specimen details of GPC and CRGPC mixes.
Table 1.
Specimen details of GPC and CRGPC mixes.
| Mix ID | Number of Specimens | Mix ID | Number of Specimens |
|---|
| Mix 1 | 9 | Mix 2 | 9 |
| M1 TC25 | 9 | M2 TC25 | 9 |
| M1 TC15 | 9 | M2 TC15 | 9 |
| M1 TC05 | 9 | M2 TC05 | 9 |
| M1 C25 | 9 | M2 C25 | 9 |
| M1 C15 | 9 | M2 C15 | 9 |
| M1 C05 | 9 | M2 C05 | 9 |
Table 2.
Chemical composition of fly ash.
Table 2.
Chemical composition of fly ash.
| Element | Content (%) |
|---|
| Al2O3 | 24.00 |
| CaO | 1.59 |
| Fe2O3 | 2.87 |
| K2O | 1.44 |
| MgO | 0.42 |
| MnO | 0.06 |
| Na2O | 0.49 |
| P2O5 | 0.19 |
| SiO2 | 65.9 |
| TiO2 | 0.915 |
| LOI | 1.53 |
Table 3.
Mix design of molarity for NaOH [
49].
Table 3.
Mix design of molarity for NaOH [
49].
| NaOH Solution Molarity | Weight of NaOH Flakes (g/kg) |
|---|
| 8 | 262 |
| 10 | 314 |
| 12 | 361 |
| 16 | 444 |
Table 4.
Mix design of GPC Mix 1.
Table 4.
Mix design of GPC Mix 1.
| Mix Design of Mix 1 (kg/m3) |
|---|
| Materials | Detail | M1 | M1-R25 | M1-R15 | M1-R05 |
|---|
| Fly Ash | | 365.00 | 365.00 | 365.00 | 365.00 |
| Sodium Hydroxide | | 49.00 | 49.00 | 49.00 | 49.00 |
| Sodium Silicate | | 122.50 | 122.50 | 122.50 | 122.50 |
| Water | | 50.38 | 50.38 | 50.38 | 50.38 |
| Fine aggregate | Sand | 535.00 | 401.25 | 454.75 | 508.25 |
| | Rubber | 0.00 | 59.16 | 35.50 | 11.83 |
| Coarse aggregate | 7 mm | 245.00 | 245.00 | 245.00 | 245.00 |
| | 10 mm | 430.00 | 430.00 | 430.00 | 430.00 |
| | 14 mm | 555.00 | 555.00 | 555.00 | 555.00 |
| GGBFS | | 40.00 | 40.00 | 40.00 | 40.00 |
| Super Plasticiser | | 3.80 | 3.80 | 3.80 | 3.80 |
Table 5.
Mix design of GPC Mix 2.
Table 5.
Mix design of GPC Mix 2.
| Mix Design of Mix 2 (kg/m3) |
|---|
| Materials | Detail | M2 | M2-R25 | M2-R15 | M2-R05 |
|---|
| Fly Ash | | 445.76 | 445.76 | 445.76 | 445.76 |
| Sodium Hydroxide | | 63.68 | 63.68 | 63.68 | 63.68 |
| Sodium Silicate | | 159.20 | 159.20 | 159.20 | 159.20 |
| Water | | 48.28 | 48.28 | 48.28 | 48.28 |
| Fine aggregate | Sand | 571.18 | 428.39 | 485.50 | 542.62 |
| | Rubber | 0.00 | 63.16 | 37.90 | 12.63 |
| Coarse Aggregate | 10 mm | 1243.10 | 1243.10 | 1243.10 | 1243.10 |
| Super Plasticiser | | 6.73 | 6.73 | 6.73 | 6.73 |
Table 6.
Compressive strengths of GPC and CRGPC mixes.
Table 6.
Compressive strengths of GPC and CRGPC mixes.
| Mix ID | Strength (MPa) | Batch Strength (MPa) | Mix ID | Strength (MPa) | Batch Strength (MPa) |
|---|
| Mix 1 | 41.53 | 41.91 | Mix 2 | 25.06 | 24.18 |
| 41.51 | 23.47 |
| 42.69 | 24.01 |
| M1 TC05 | 36.05 | 35.09 | M2 TC05 | 20.95 | 20.41 |
| 34.07 | 20.97 |
| 35.15 | 19.31 |
| M1 TC15 | 32.92 | 33.2 | M2 TC15 | 19.73 | 19.15 |
| 31.51 | 19.16 |
| 32.17 | 18.56 |
| M1 TC25 | 31.49 | 31.08 | M2 TC25 | 18.66 | 18.72 |
| 30.9 | 17.58 |
| 30.85 | 19.92 |
| M1 C05 | 33.42 | 33.53 | M2 C05 | 20.01 | 19.1 |
| 33.66 | 18.28 |
| 33.51 | 19.02 |
| M1 C15 | 28.98 | 29.78 | M2 C15 | 16.53 | 17.19 |
| 29.77 | 17.91 |
| 30.58 | 17.12 |
| M1 C25 | 26.67 | 27.72 | M2 C25 | 16.57 | 16.55 |
| 28.93 | 16.51 |
| 27.56 | 16.58 |
Table 7.
Density of concrete GPC and CRGPC.
Table 7.
Density of concrete GPC and CRGPC.
| Mix ID | Density (N/m3) | Mix ID | Density (N/m3) |
|---|
| M1 | 21,600 | M2 | 21,700 |
| M1 TC05 | 21,500 | M2 TC05 | 21,500 |
| M1 TC15 | 21,200 | M2 TC15 | 21,450 |
| M1 TC25 | 21,100 | M2 TC25 | 21,350 |
| M1 C05 | 21,400 | M2 C05 | 21,550 |
| M1 C15 | 21,300 | M2 C15 | 21,400 |
| M1 C25 | 21,200 | M2 C25 | 21,300 |
Table 8.
The Modulus of Elasticity of GPC and CRGPC mixes.
Table 8.
The Modulus of Elasticity of GPC and CRGPC mixes.
| Mix ID | MoE (GPa) | Batch MoE (GPa) | Mix ID | MoE (GPa) | Batch MoE (GPa) |
|---|
| Mix 1 | 18.44 | 18.40 | Mix 2 | 11.42 | 11.37 |
| 18.75 | 11.67 |
| 18.01 | 11.03 |
| M1 TC05 | 18.54 | 19.09 | M2 TC05 | 9.9 | 9.95 |
| 19.69 | 9.42 |
| 19.03 | 10.52 |
| M1 TC15 | 17.28 | 17.24 | M2 TC15 | 8.96 | 8.85 |
| 17.79 | 9.19 |
| 16.65 | 8.41 |
| M1 TC25 | 14.69 | 14.55 | M2 TC25 | 9.24 | 9.16 |
| 14.37 | 8.85 |
| 14.59 | 9.38 |
| M1 C05 | 17.33 | 17.84 | M2 C05 | 7.53 | 7.78 |
| 17.94 | 7.52 |
| 18.24 | 8.28 |
| M1 C15 | 21.27 | 20.55 | M2 C15 | 7.13 | 7.21 |
| 20.16 | 7.48 |
| 20.22 | 7.01 |
| M1 C25 | 11.94 | 12.22 | M2 C25 | 9.32 | 8.95 |
| 12.48 | 8.47 |
| 11.88 | 9.07 |
Table 9.
Strain at peak stress of GPC Mix 1 and CRGPC mixes.
Table 9.
Strain at peak stress of GPC Mix 1 and CRGPC mixes.
| Mix ID | Strain at Peak Stress, (ε) |
|---|
| Mix 1 | 0.00333 |
| M1 TC05 | 0.00289 |
| M1 TC15 | 0.00305 |
| M1 TC25 | 0.00242 |
| M1 C05 | 0.00363 |
| M1 C15 | 0.00235 |
| M1 C25 | 0.00266 |
Table 10.
Strain at peak stress of GPC Mix 2 and CRGPC mixes.
Table 10.
Strain at peak stress of GPC Mix 2 and CRGPC mixes.
| Mix ID | Strain at Peak Stress, (ε) |
|---|
| Mix 2 | 0.00397 |
| M2 TC05 | 0.00371 |
| M2 TC15 | 0.00382 |
| M2 TC25 | 0.00342 |
| M2 C05 | 0.00403 |
| M2 C15 | 0.00388 |
| M2 C25 | 0.00330 |
Table 11.
Experimental results of strain at peak stress comparison with the model of Noushini et al. and fib 2010.
Table 11.
Experimental results of strain at peak stress comparison with the model of Noushini et al. and fib 2010.
| Mix ID | Noushini et al. | Fib 2010 |
|---|
| % Higher | % Lower |
|---|
| M1 | 4.99 | 25.00 |
| M1 TC05 | 38.38 | 13.51 |
| M1 TC15 | 31.34 | 17.91 |
| M1 TC25 | 85.84 | 3.25 |
| M1 C05 | 26.74 | 36.63 |
| M1 C15 | 91.41 | 14.93 |
| M1 C25 | 69.11 | 24.84 |
| M2 | 25.90 | 49.64 |
| M2 TC05 | 34.66 | 46.14 |
| M2 TC15 | 30.96 | 47.62 |
| M2 TC25 | 46.26 | 41.49 |
| M2 C05 | 23.41 | 50.64 |
| M2 C15 | 28.88 | 48.45 |
| M2 C25 | 51.15 | 39.54 |
Table 12.
Elastic modulus of GPC and CRGPC as of the model.
Table 12.
Elastic modulus of GPC and CRGPC as of the model.
| Mix ID | Experiment | Proposed Model | Mix ID | Experiment | Proposed Model |
|---|
| (GPa) | (GPa) | (GPa) | (GPa) |
|---|
| Mix 1 | 18.40 | 19.84 | | | |
| M1 TC05 | 19.09 | 19.41 | M1 C05 | 13.50 | 16.63 |
| M1 TC15 | 17.24 | 16.99 | M1 C15 | 20.55 | 16.18 |
| M1 TC25 | 14.55 | 13.50 | M1 C25 | 12.23 | 13.50 |
| Mix 2 | 11.37 | 11.38 | | | |
| M2 TC05 | 9.95 | 9.64 | M2 C05 | 7.78 | 9.03 |
| M2 TC15 | 8.85 | 9.05 | M2 C15 | 7.21 | 8.15 |
| M2 TC25 | 9.16 | 8.85 | M2 C25 | 8.96 | 7.85 |


