
Thermal Conductivity in Concrete Samples with Natural and Synthetic Fibers


 , ,
, ,  ,
,
Abstract
1. Introduction
Concrete Thermal Conductivity Measurement Methods
2. Materials and Methods
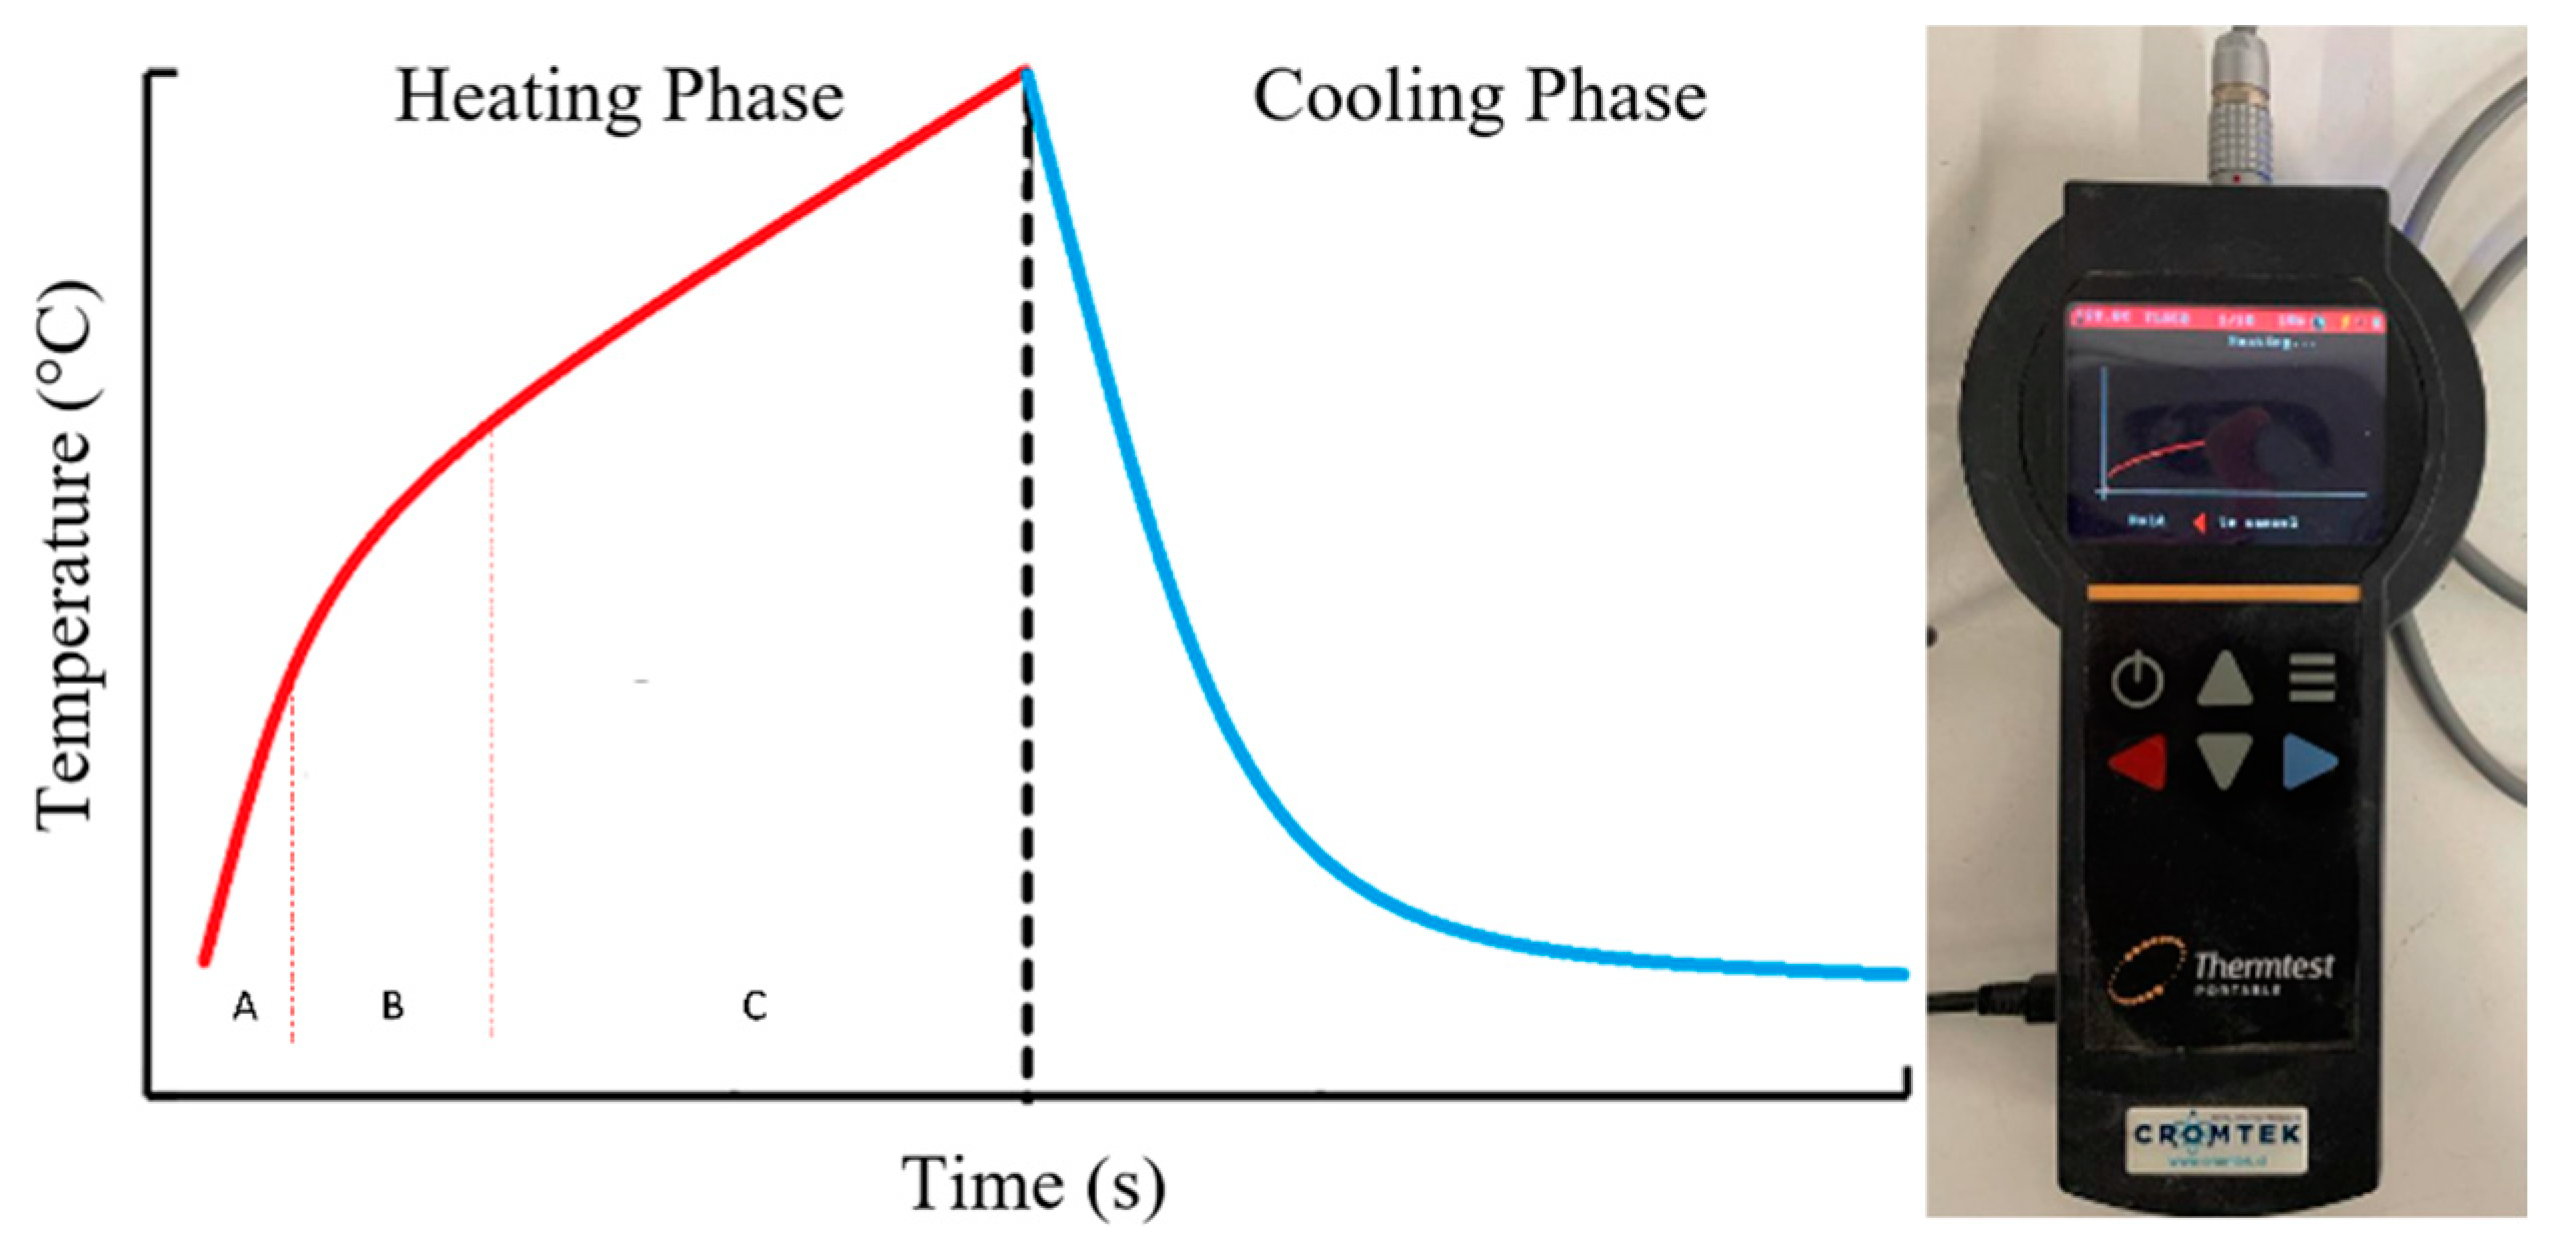
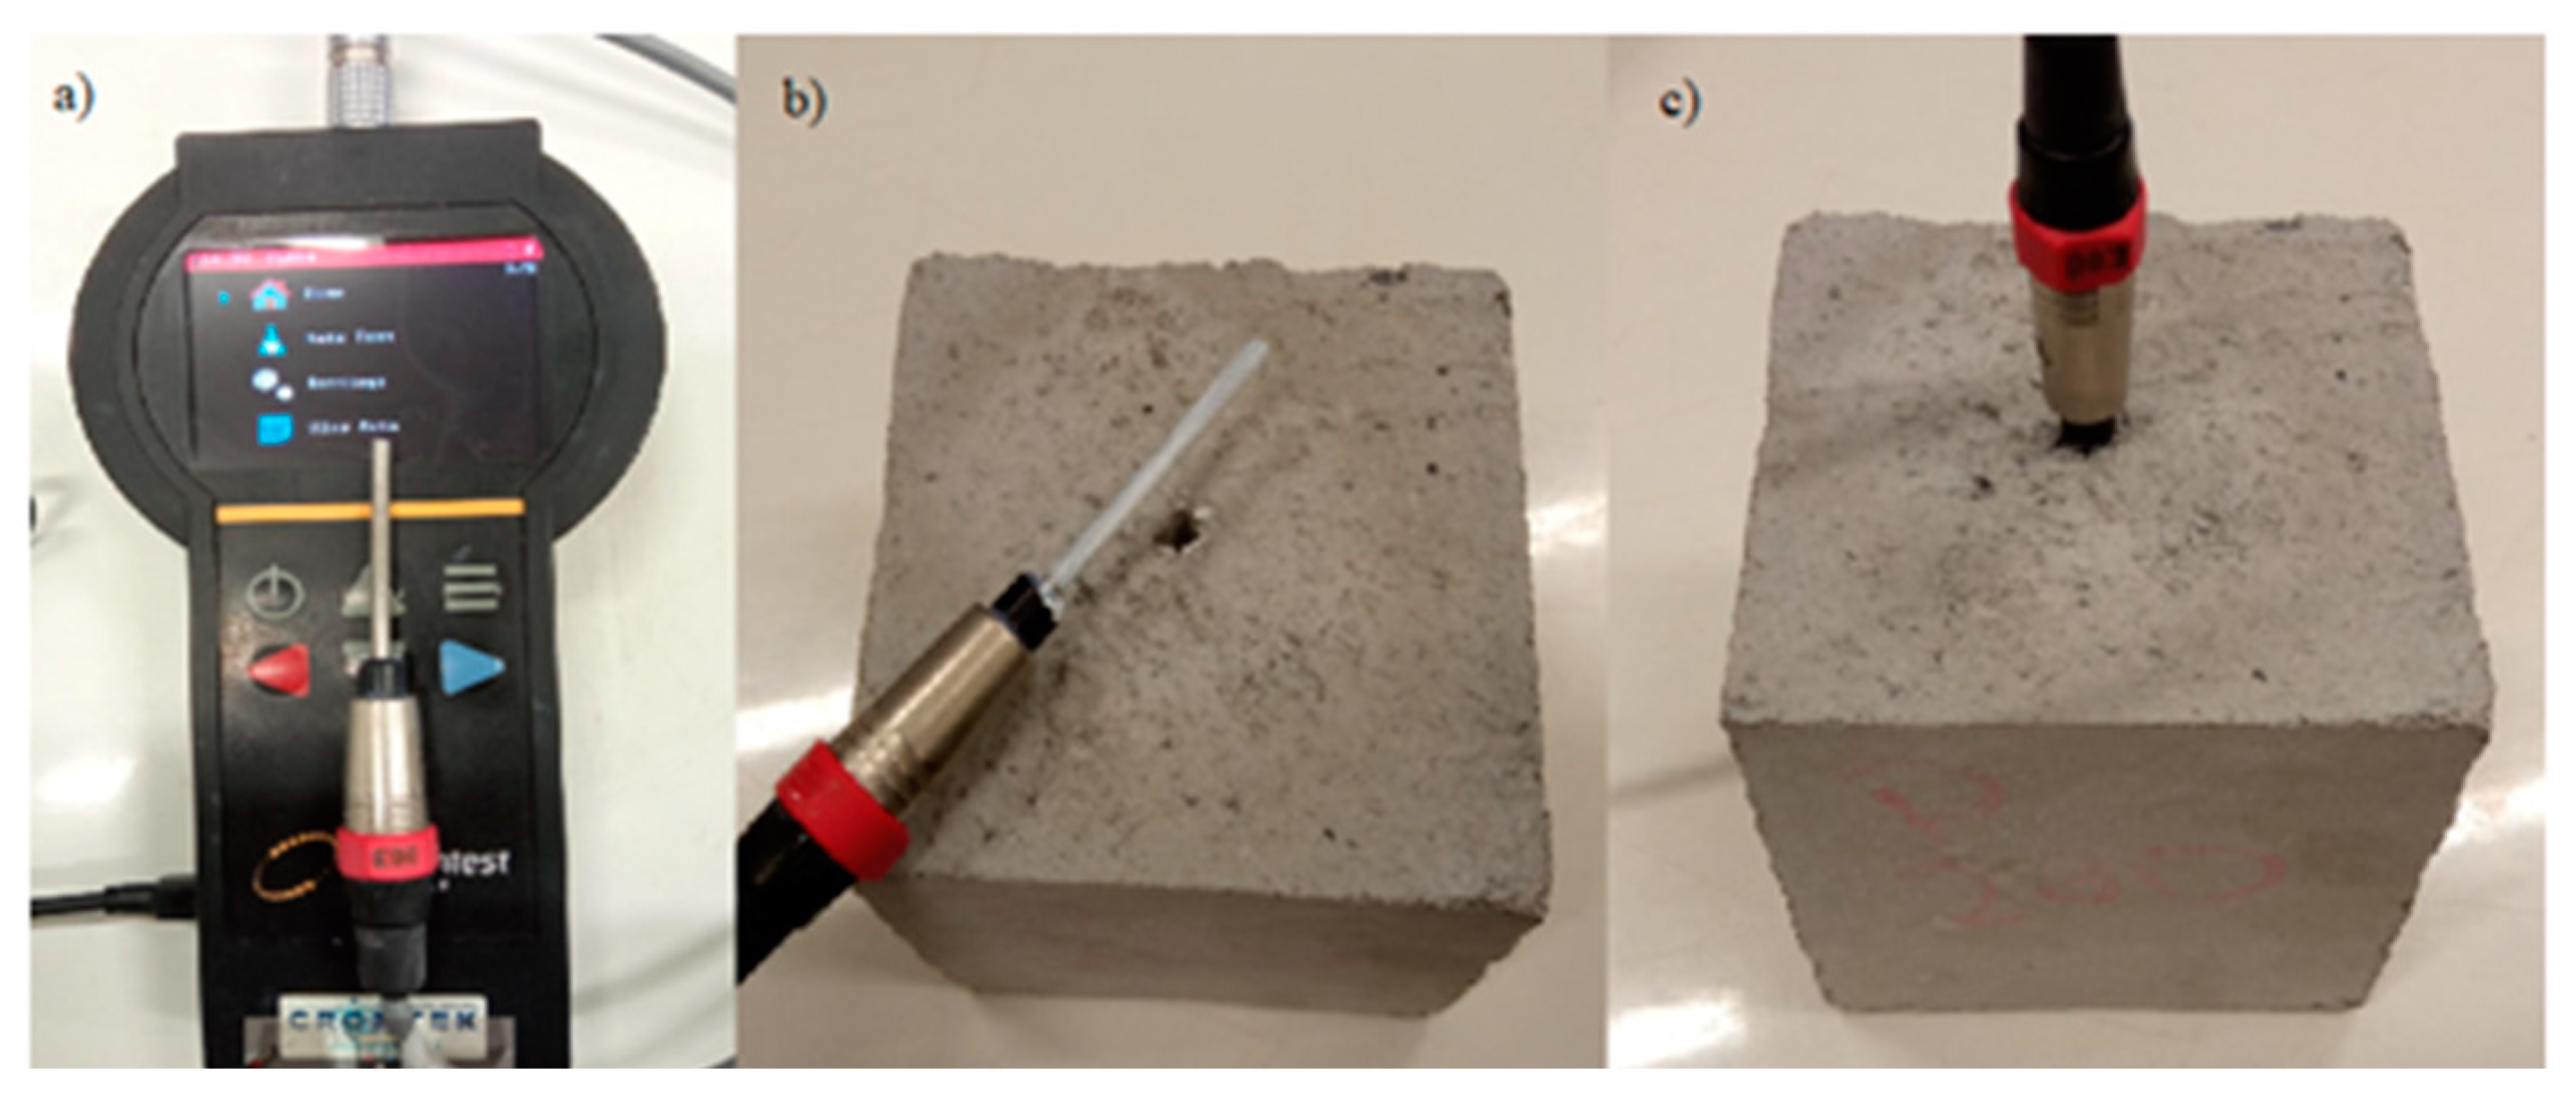
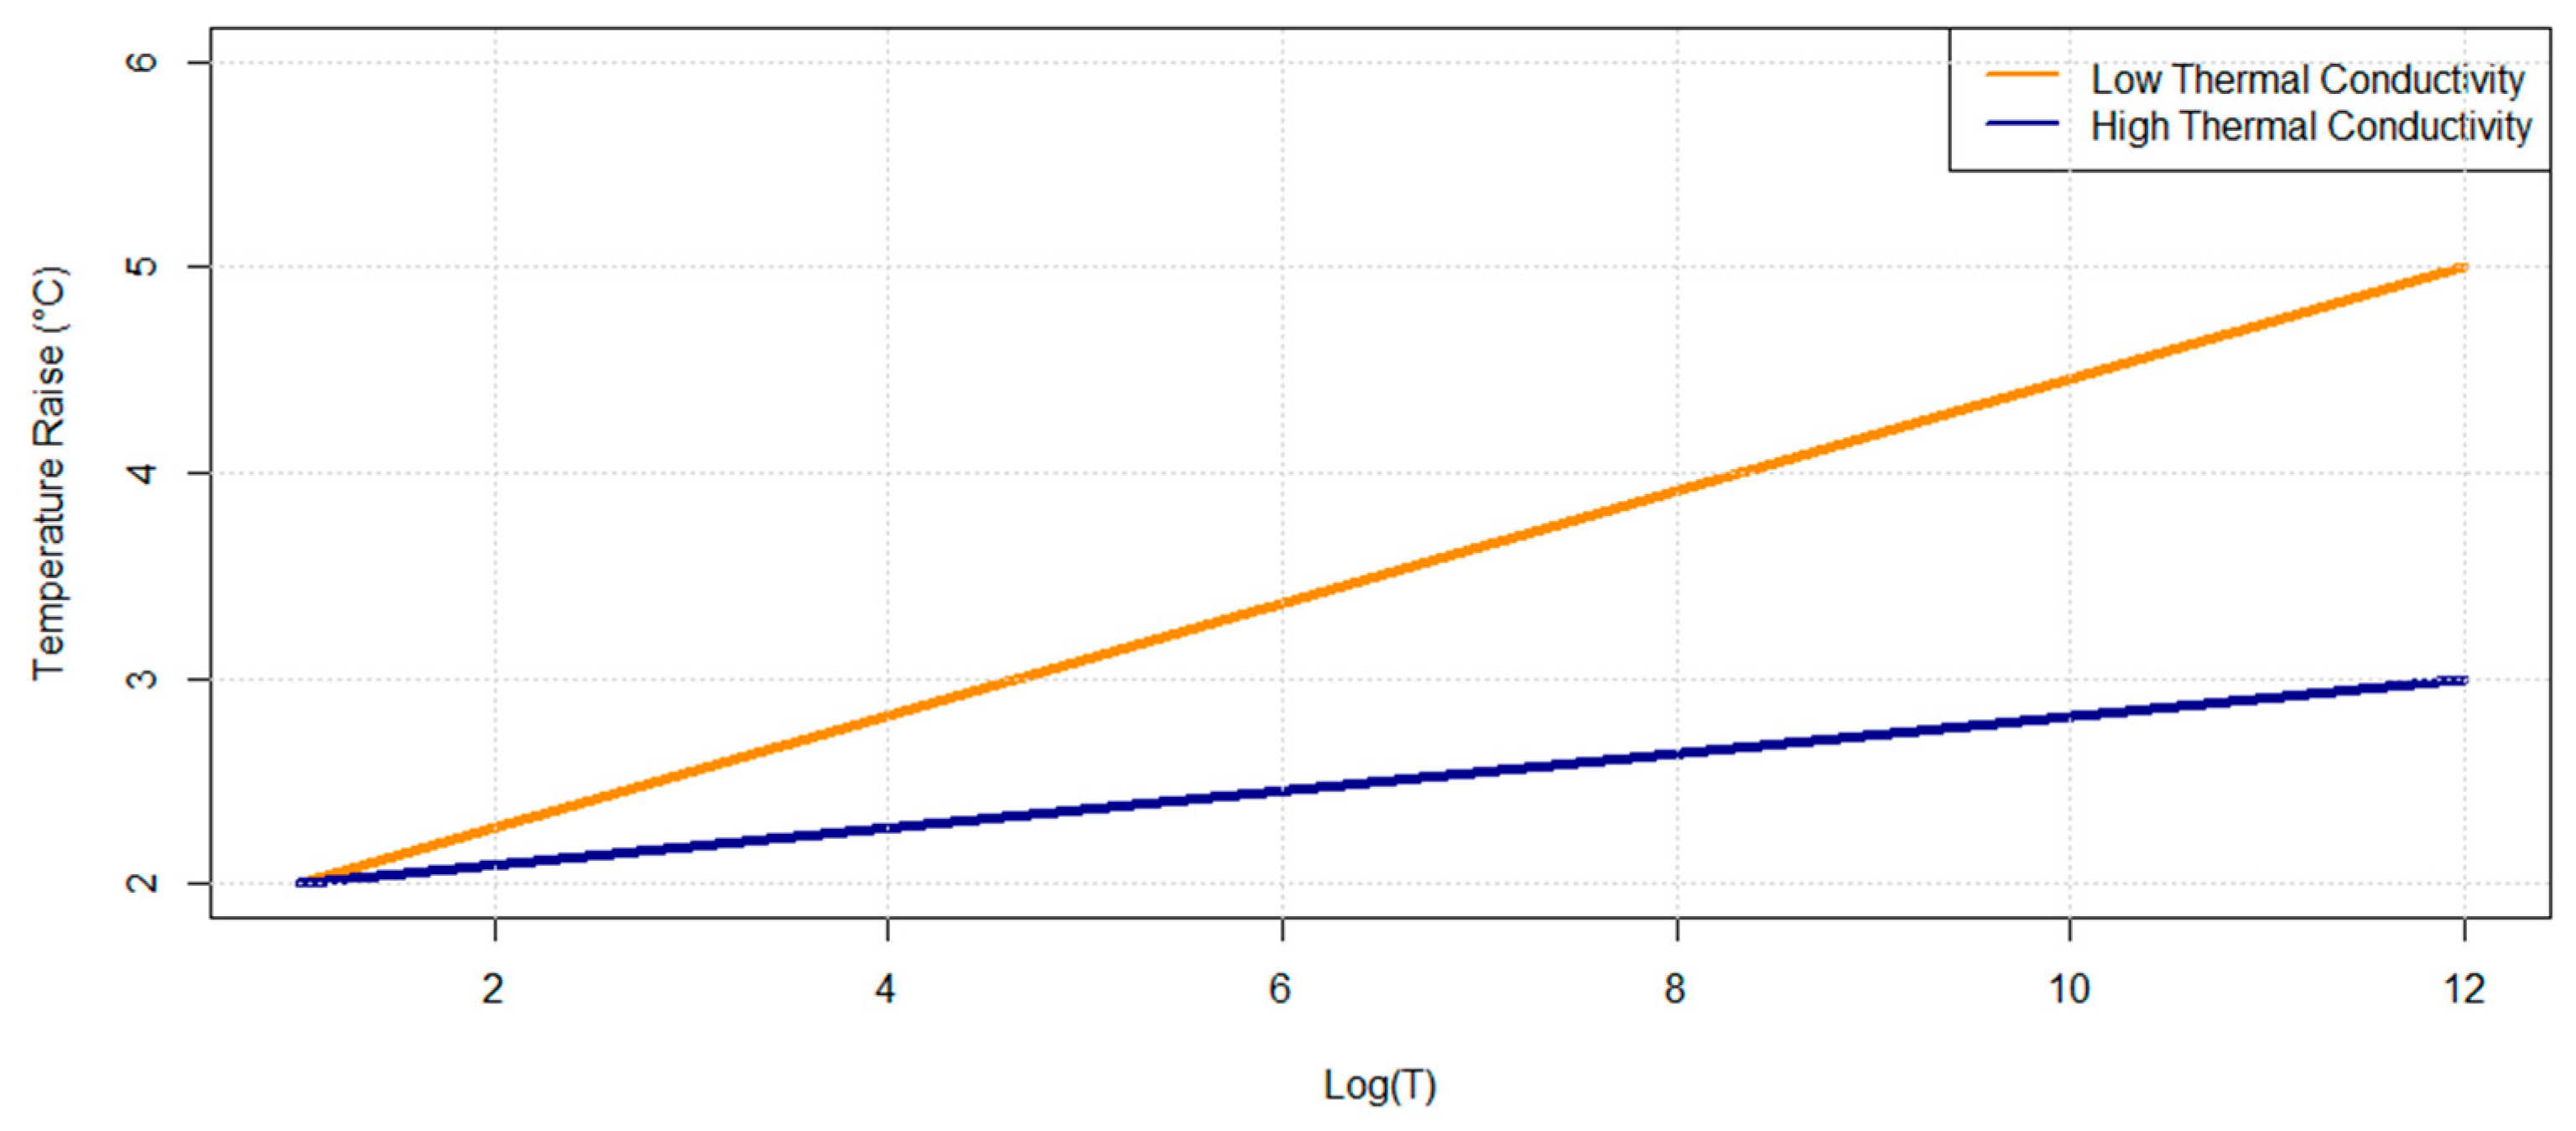
2.1. Methods and Equipment
2.2. Materials
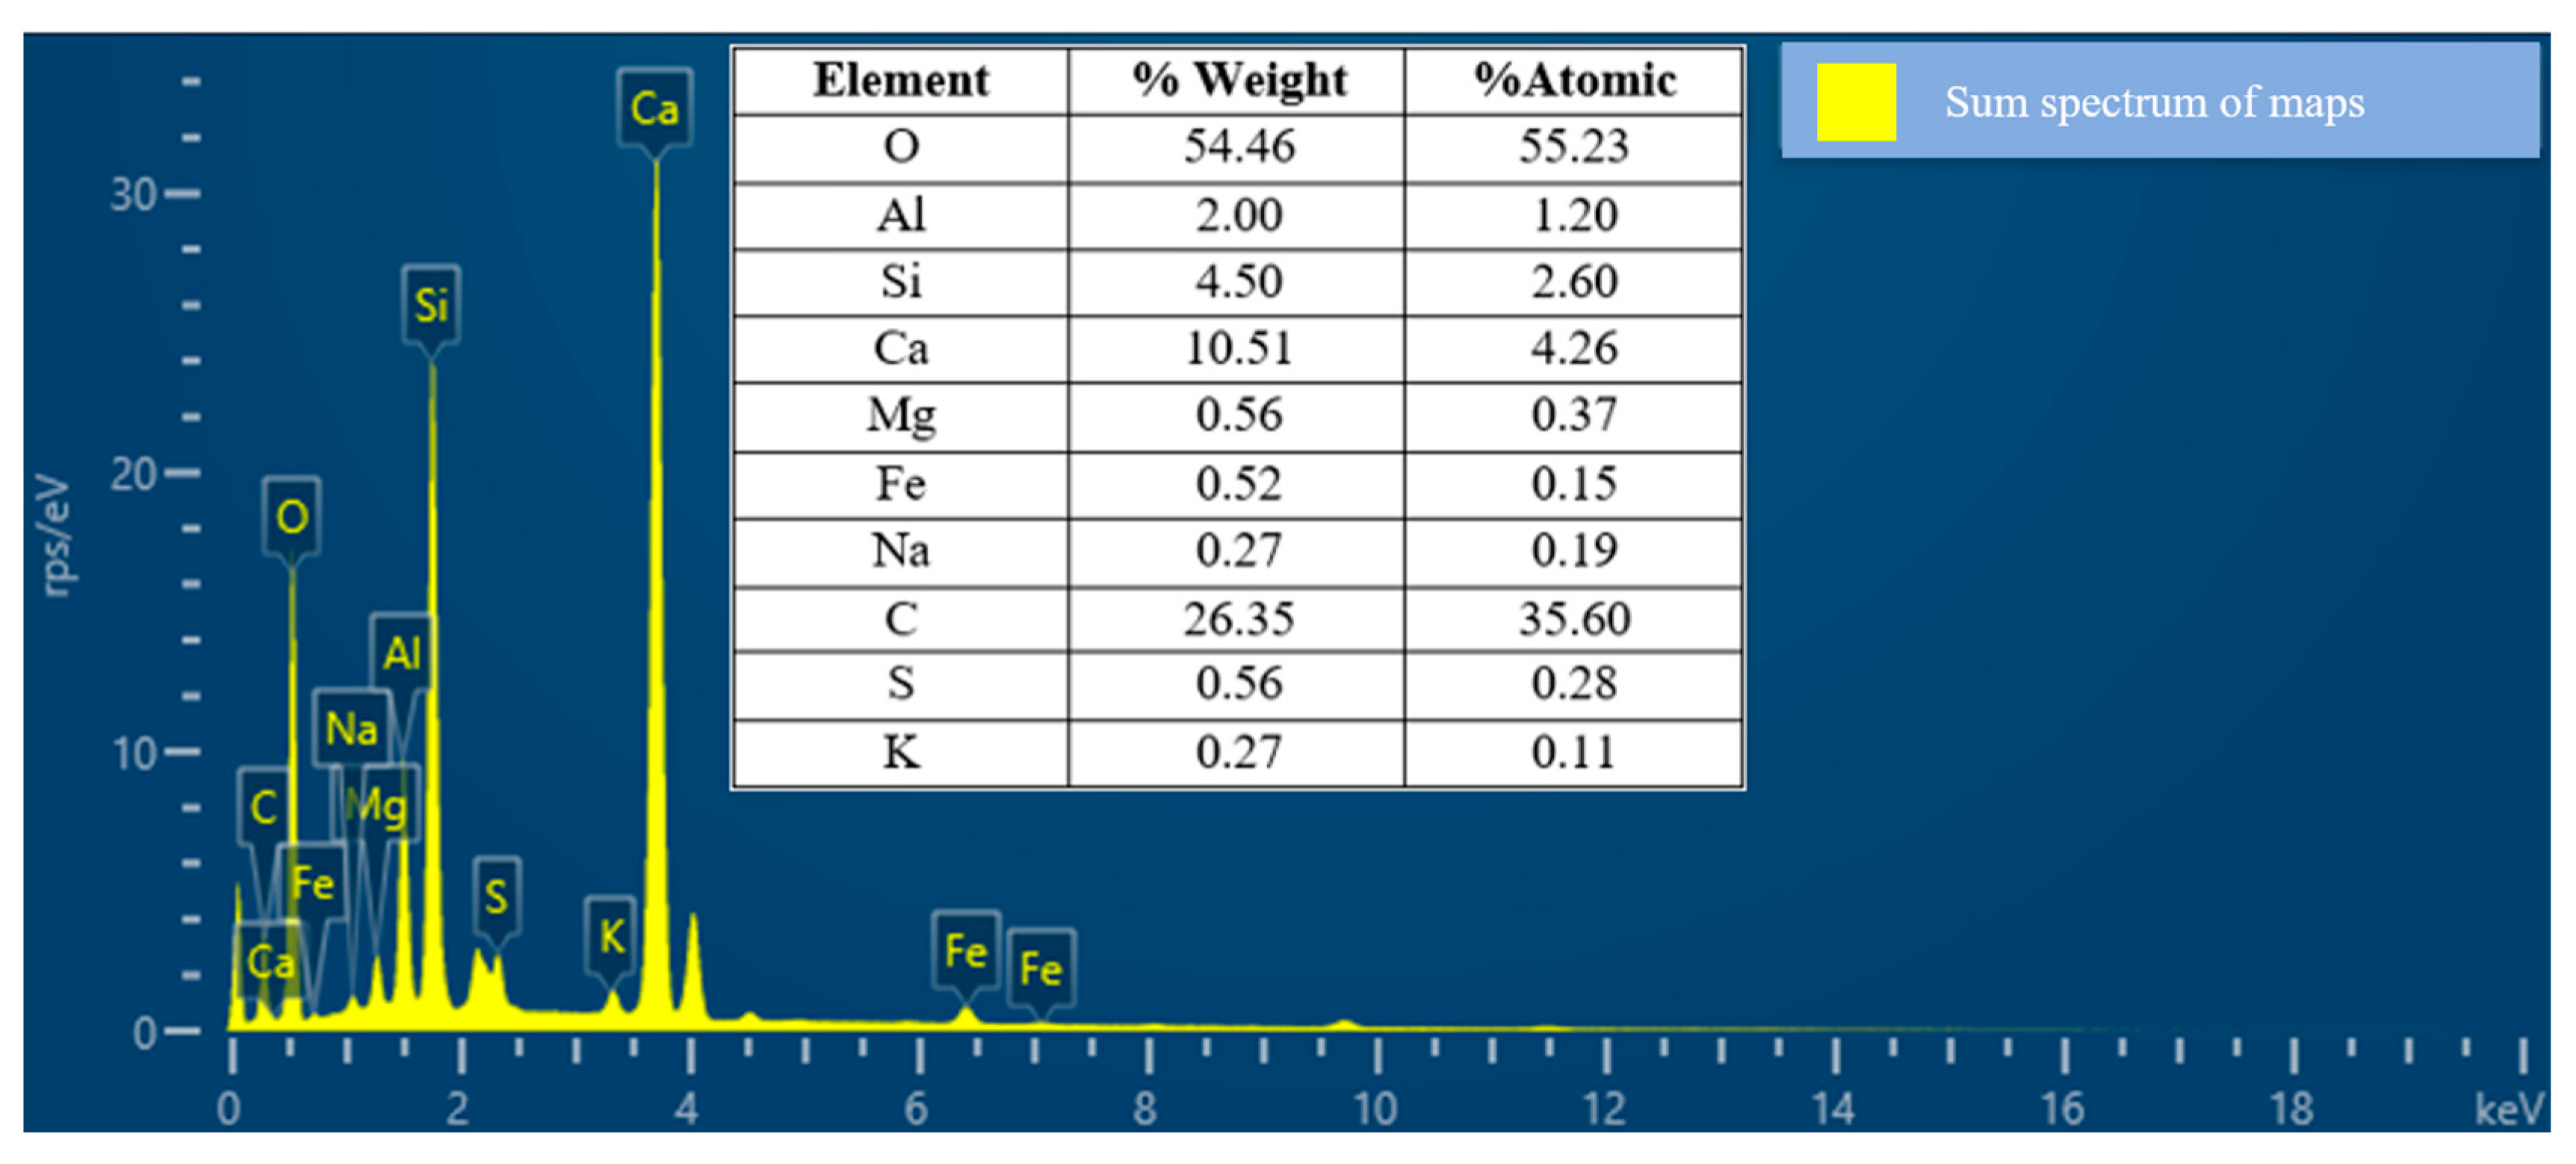
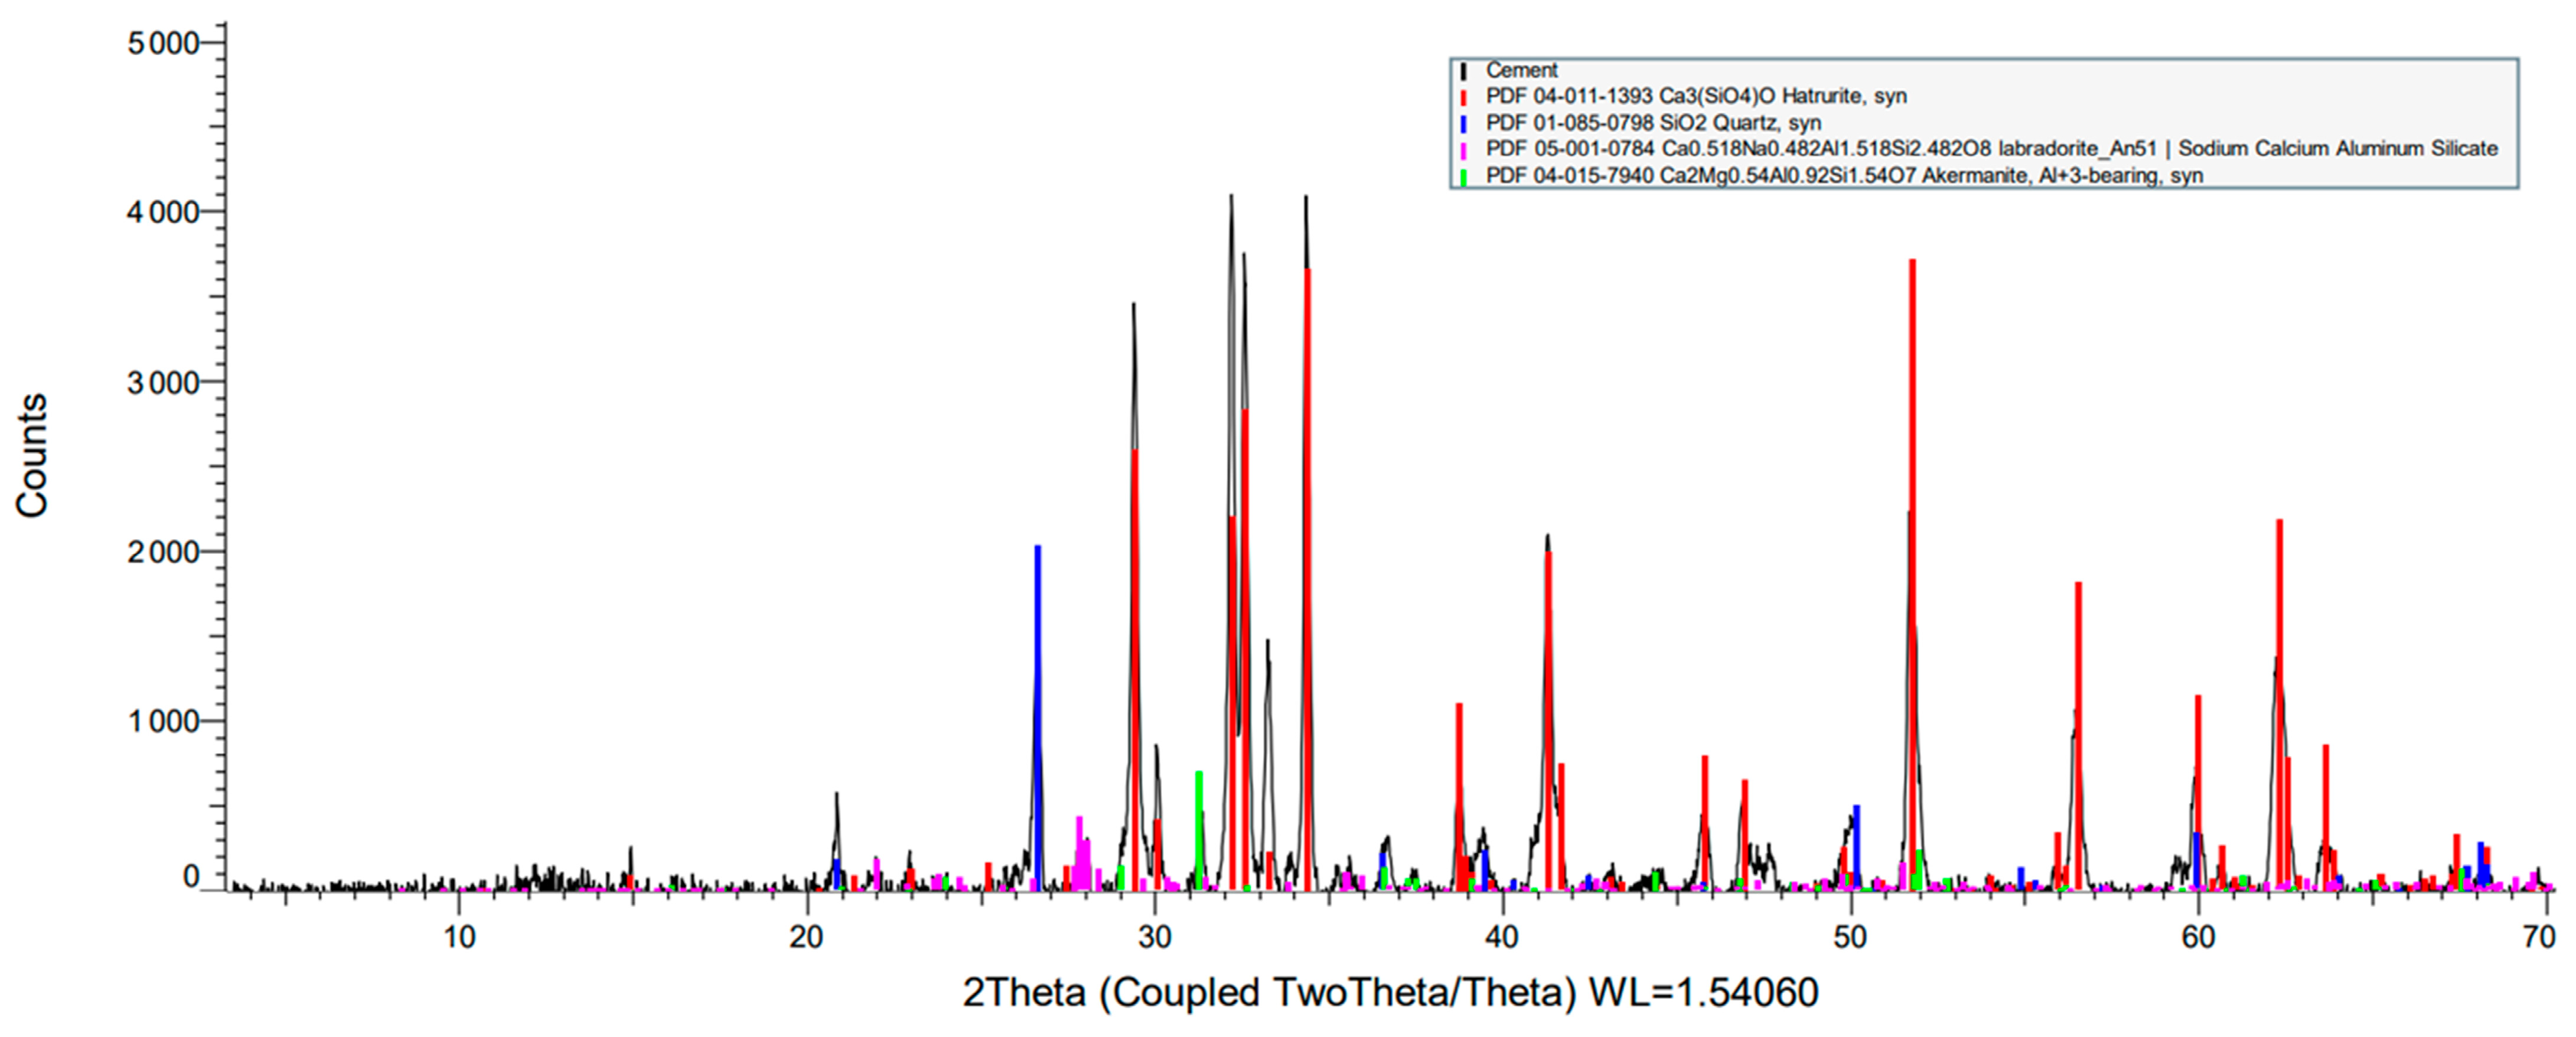
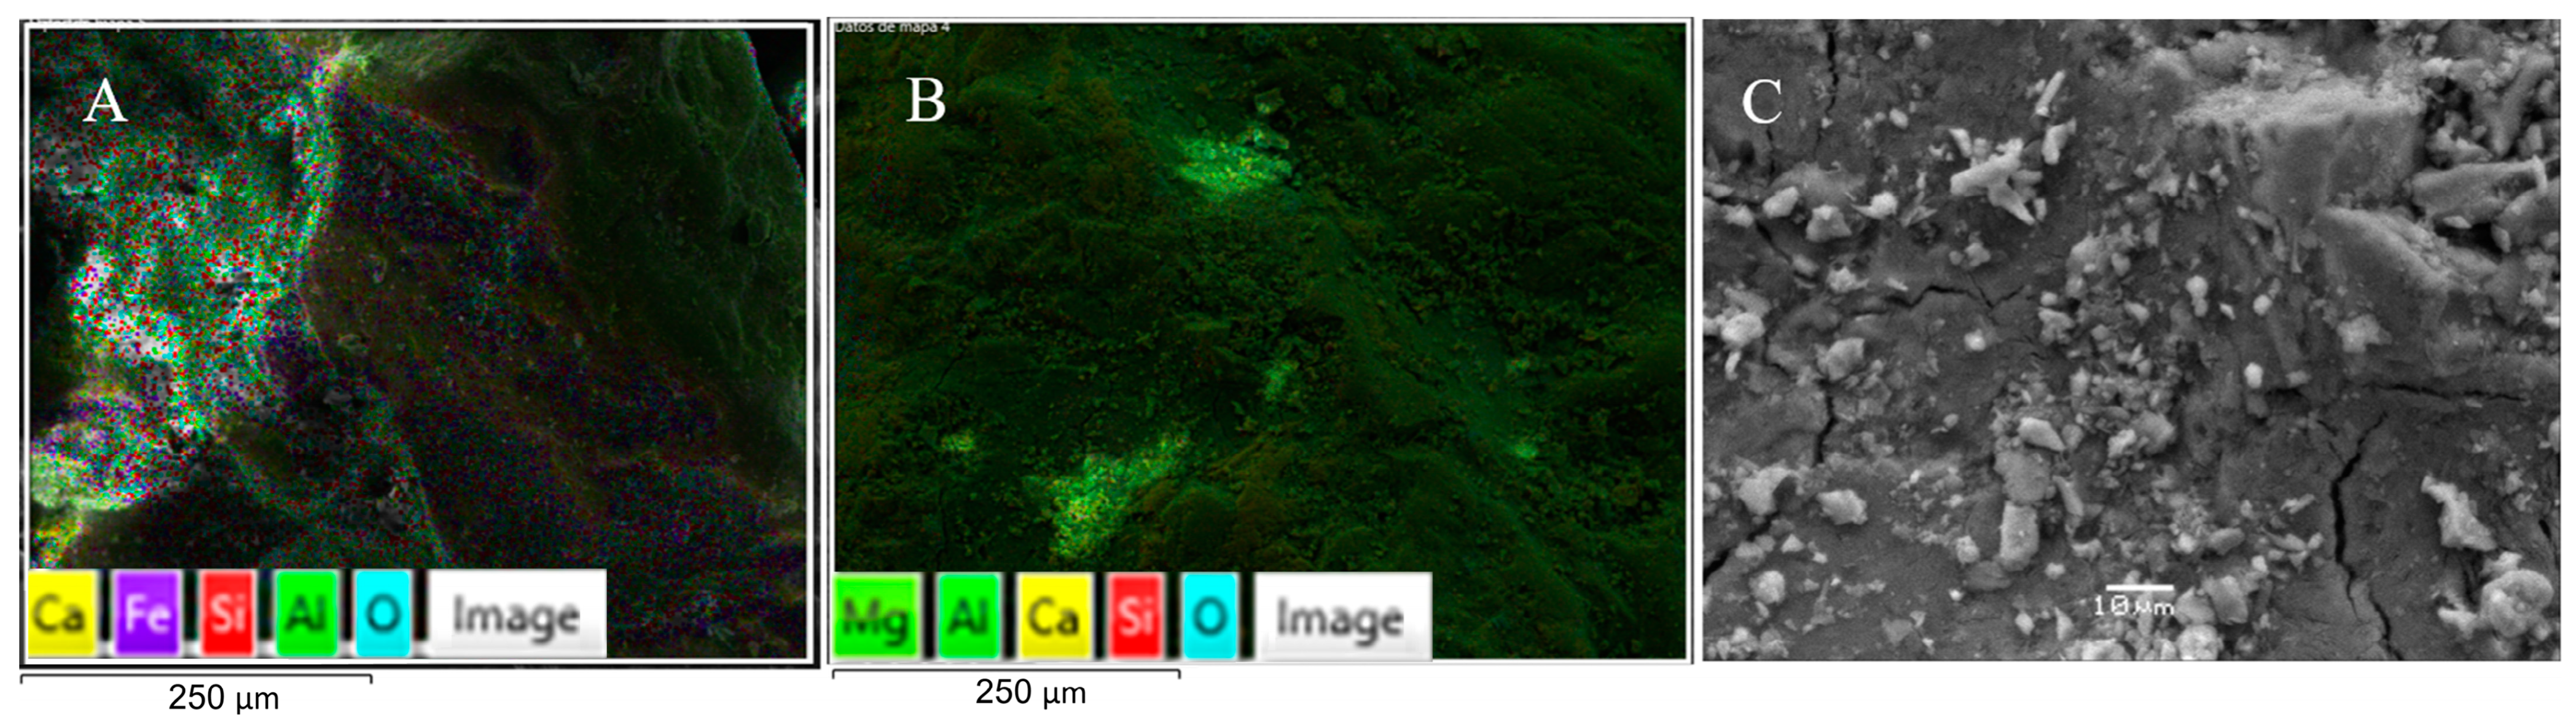
2.2.1. Cement
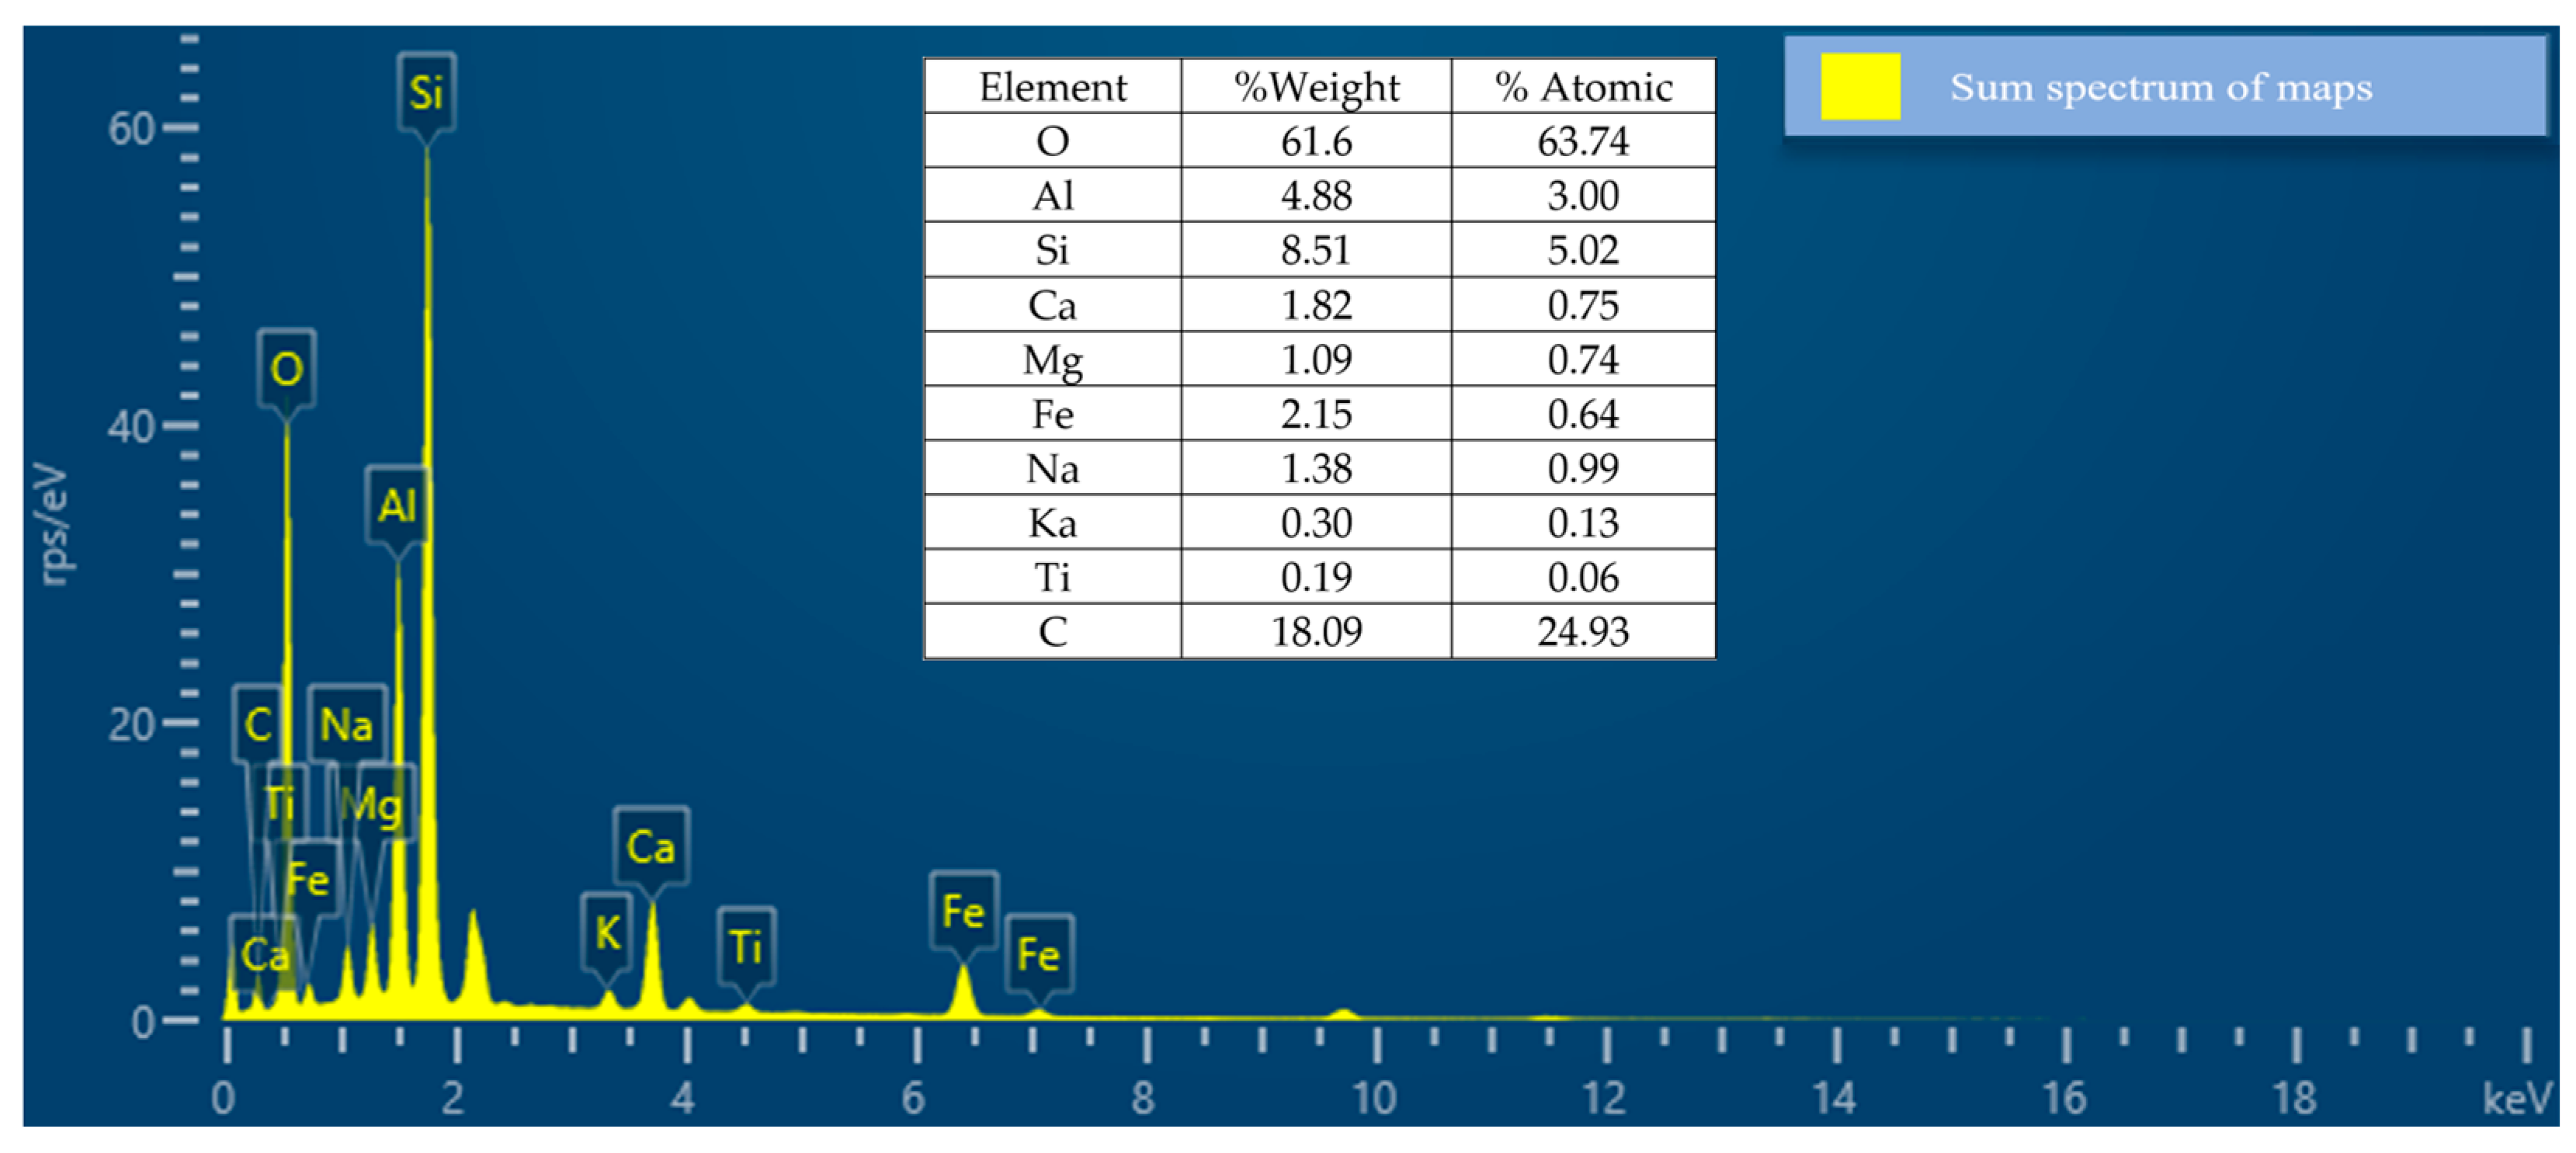
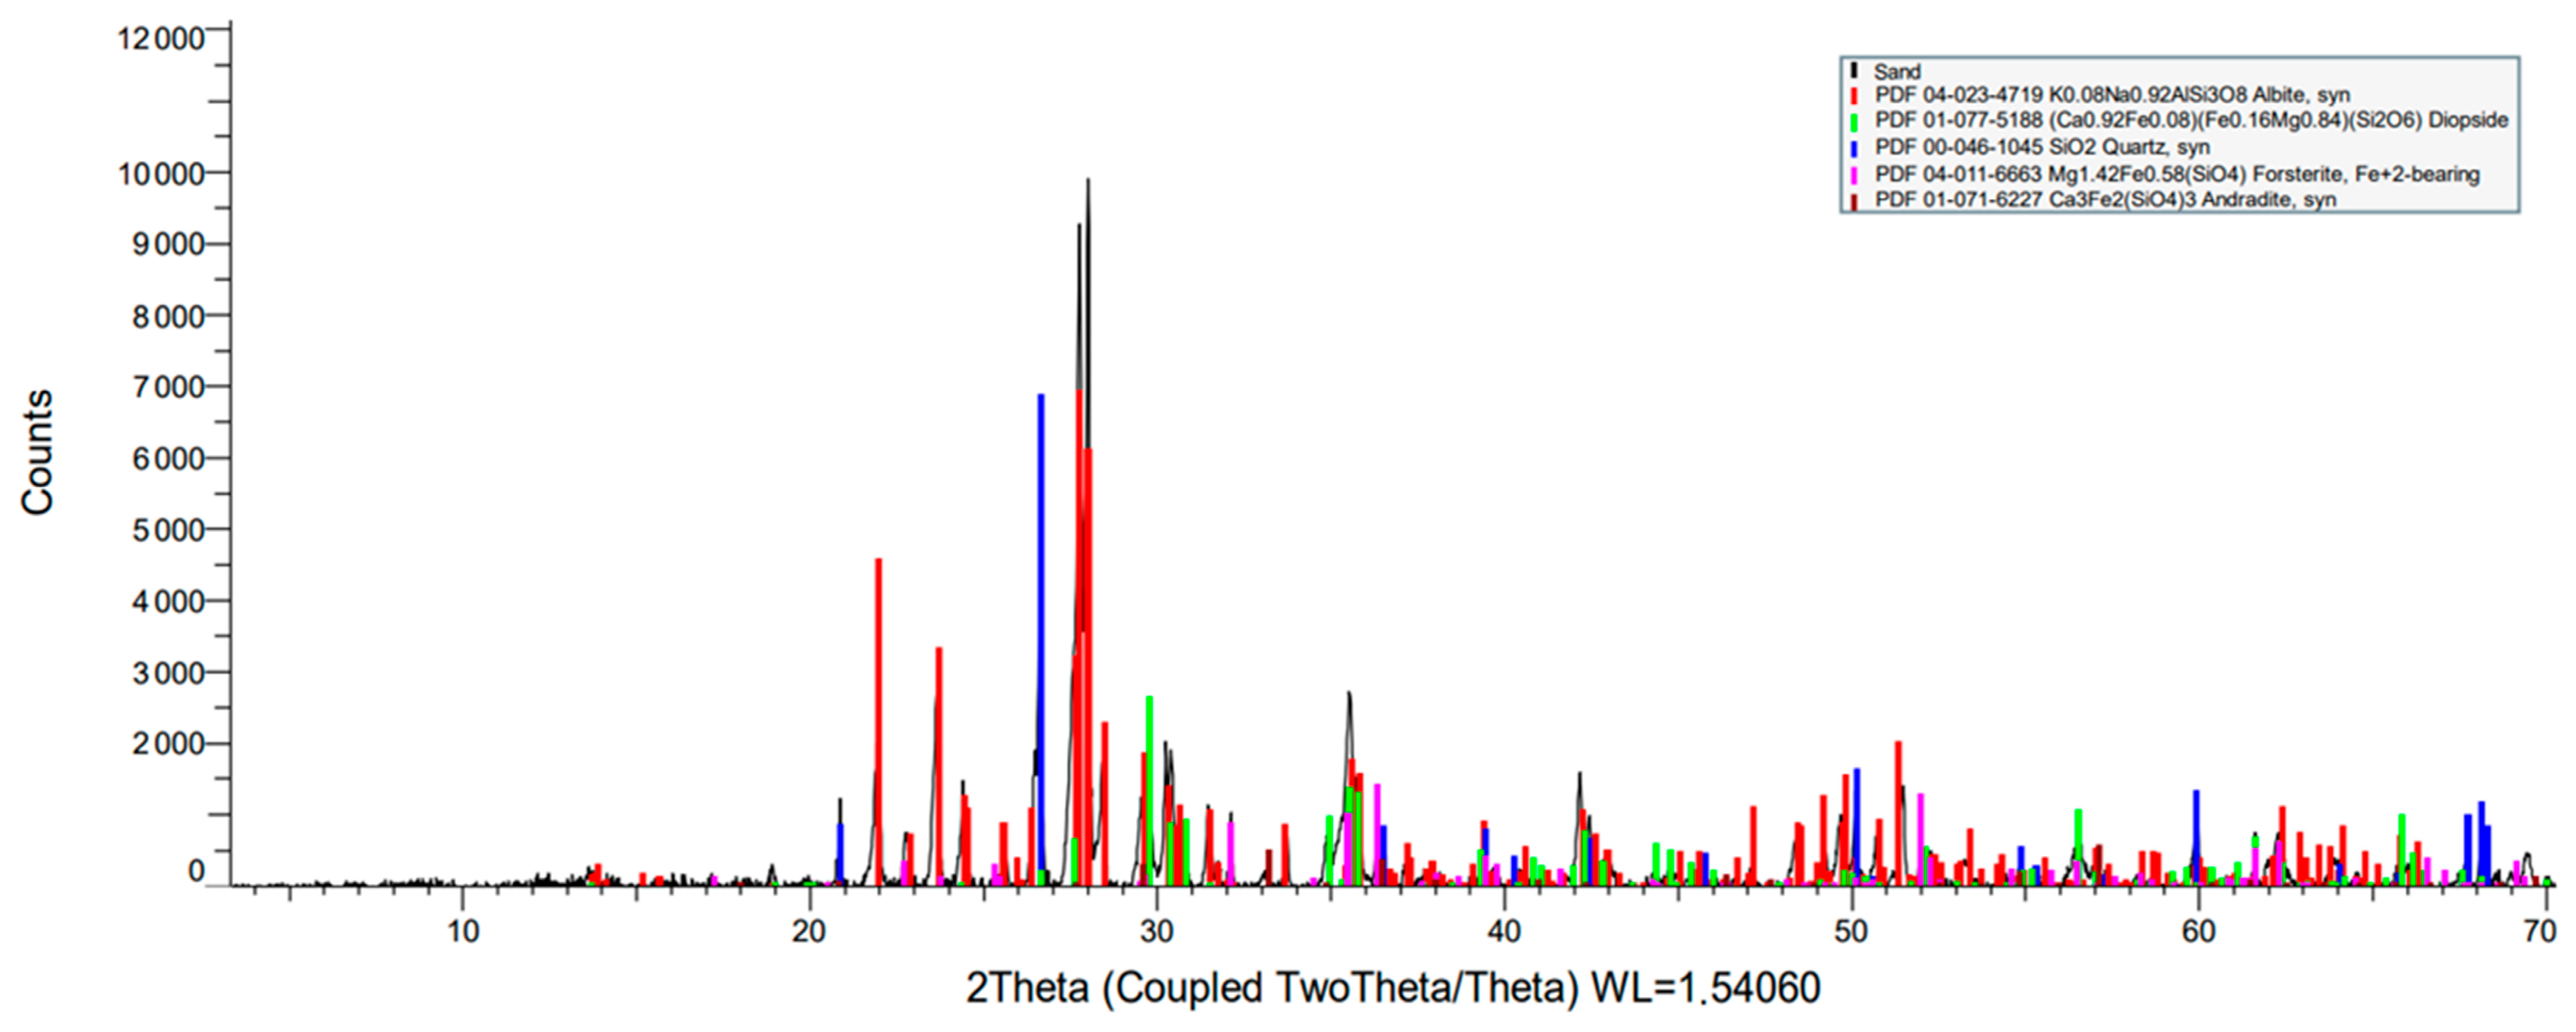
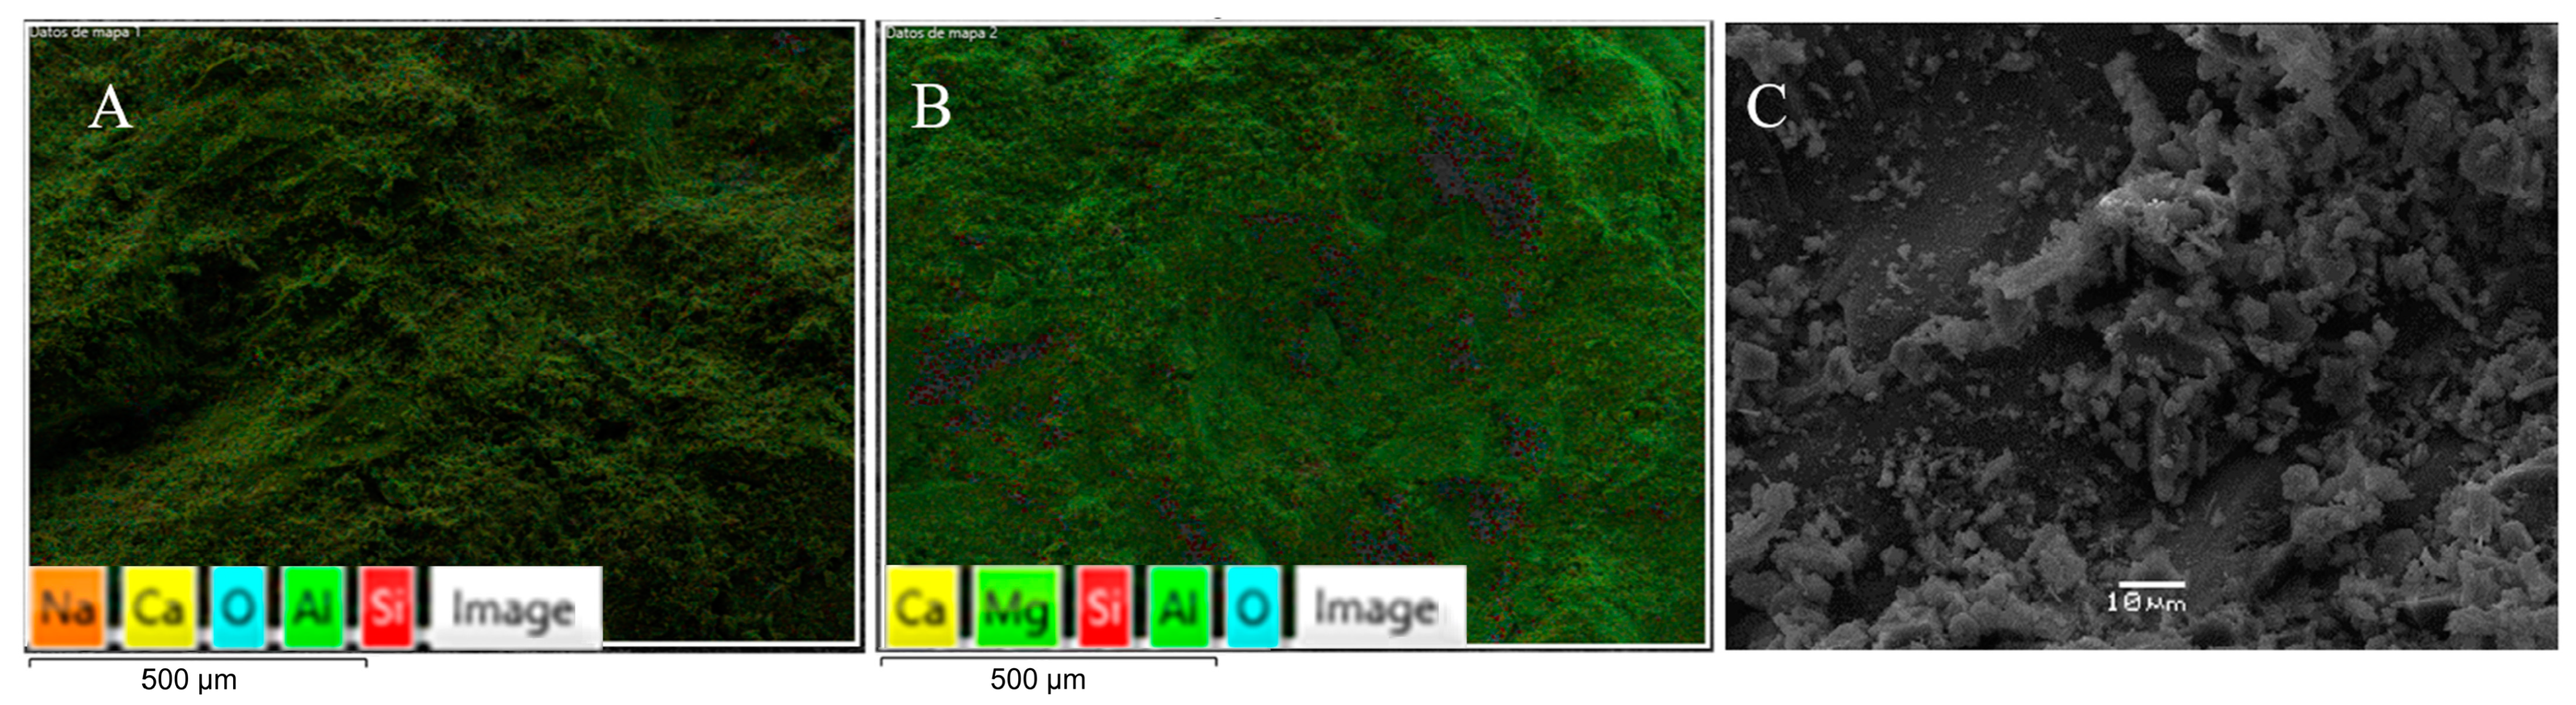
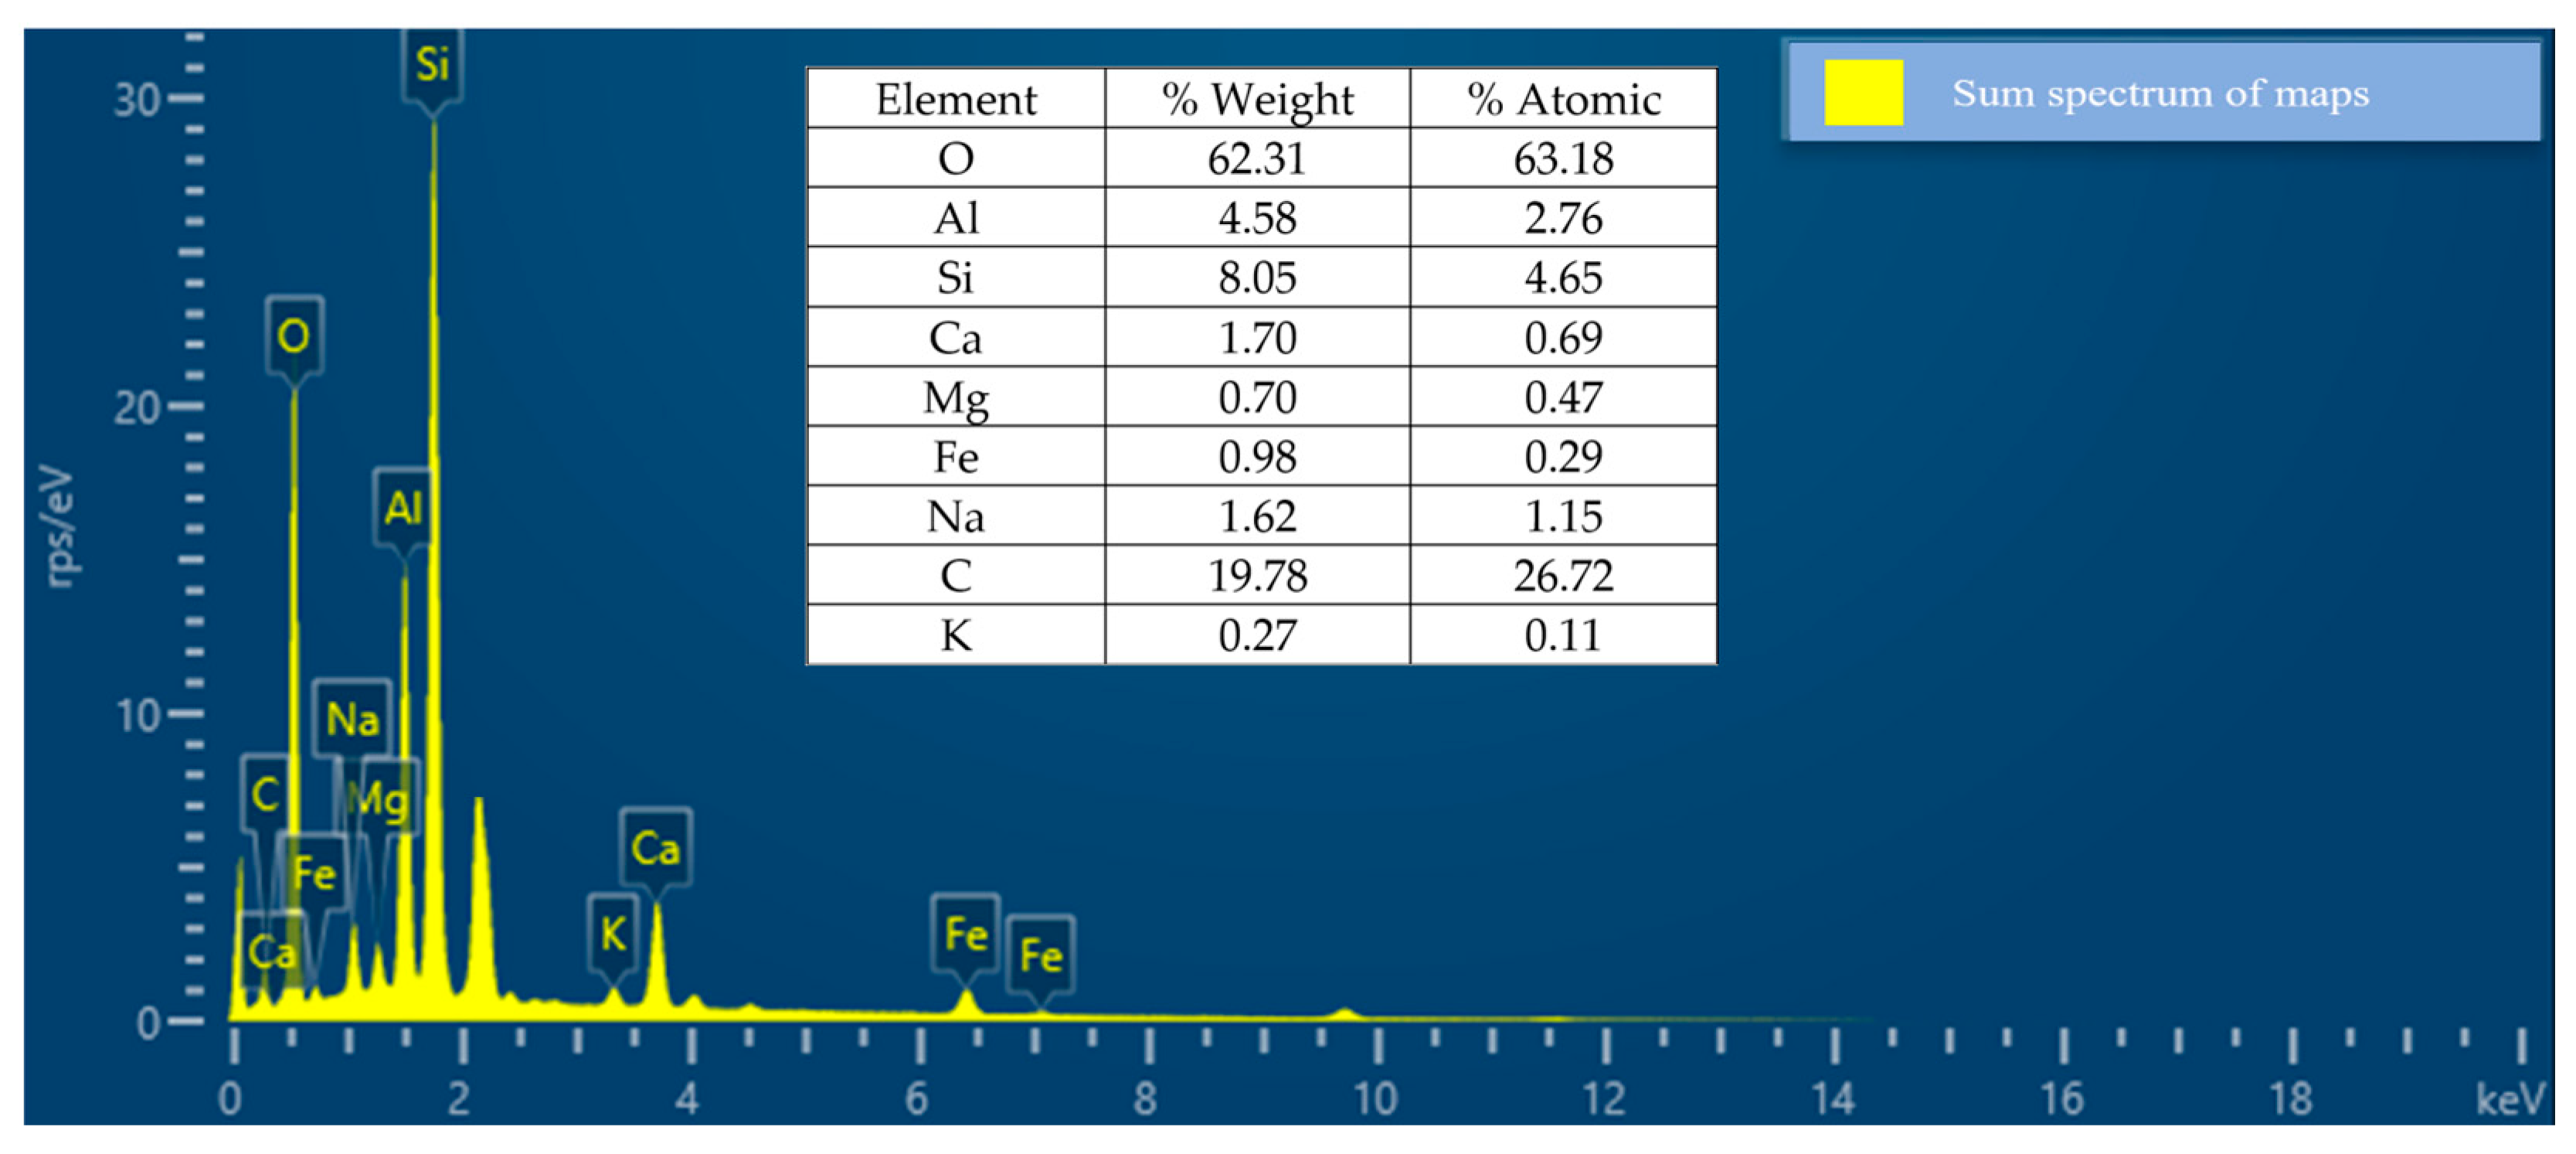
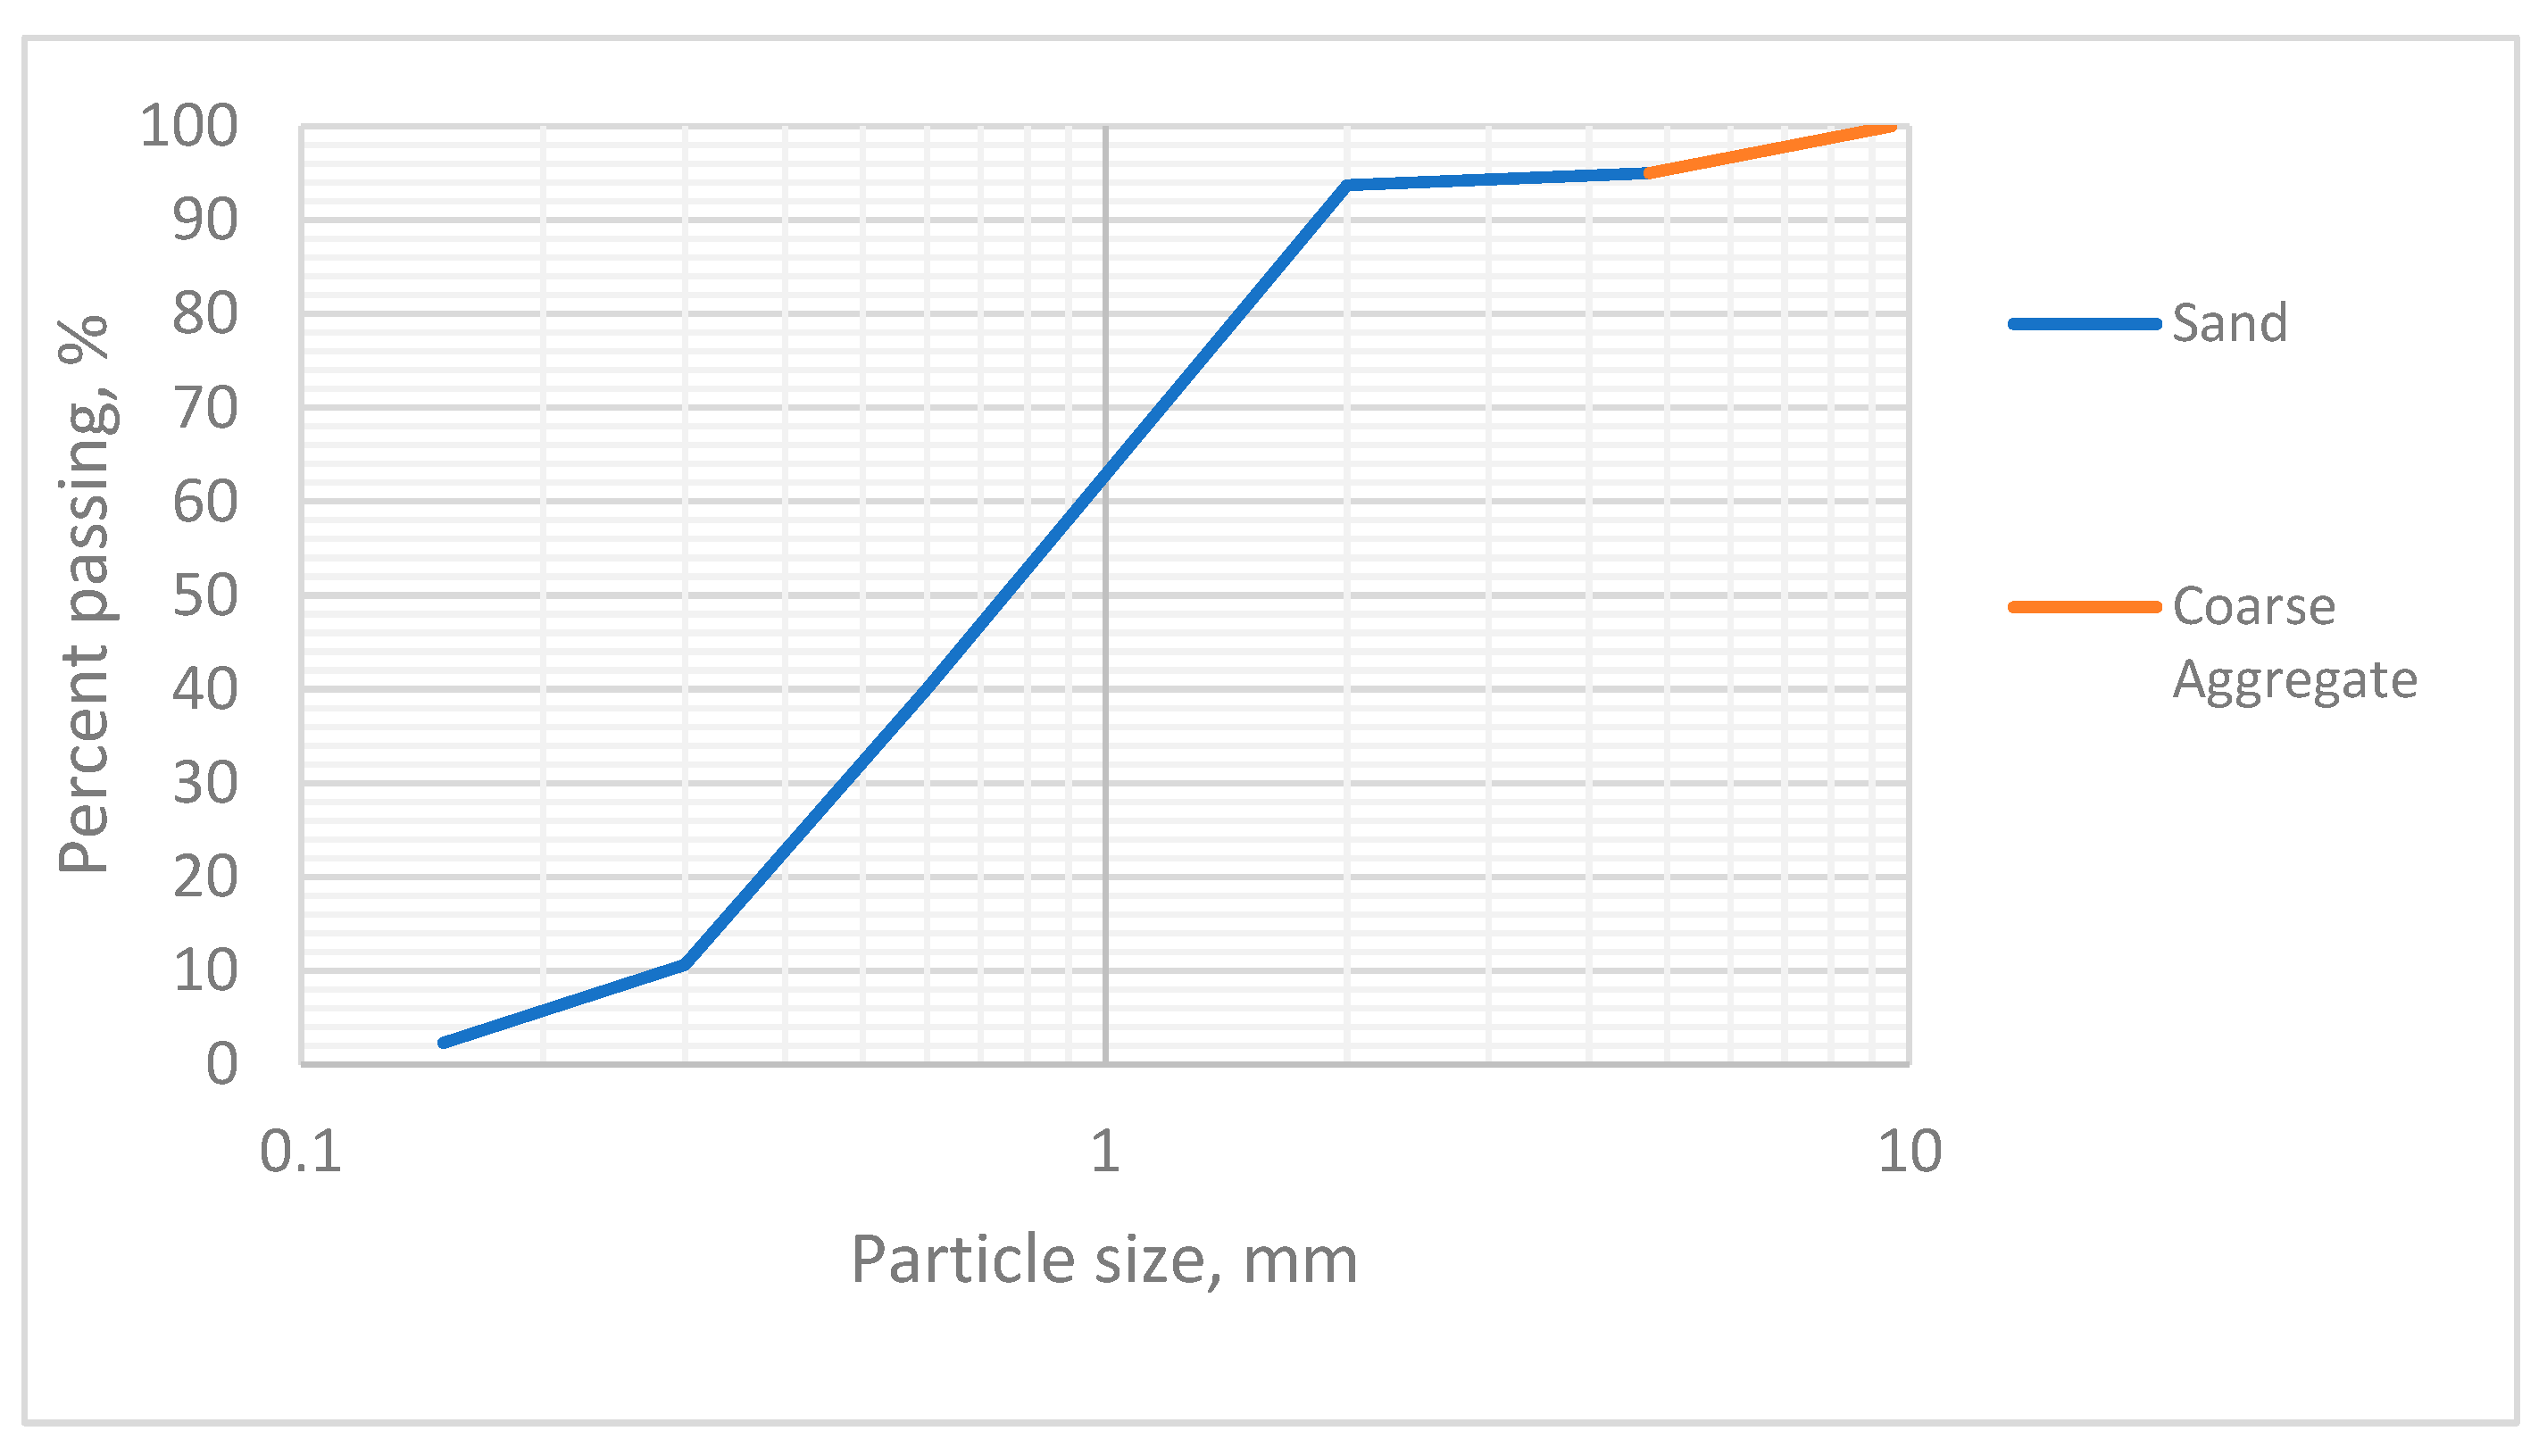
2.2.2. Aggregates
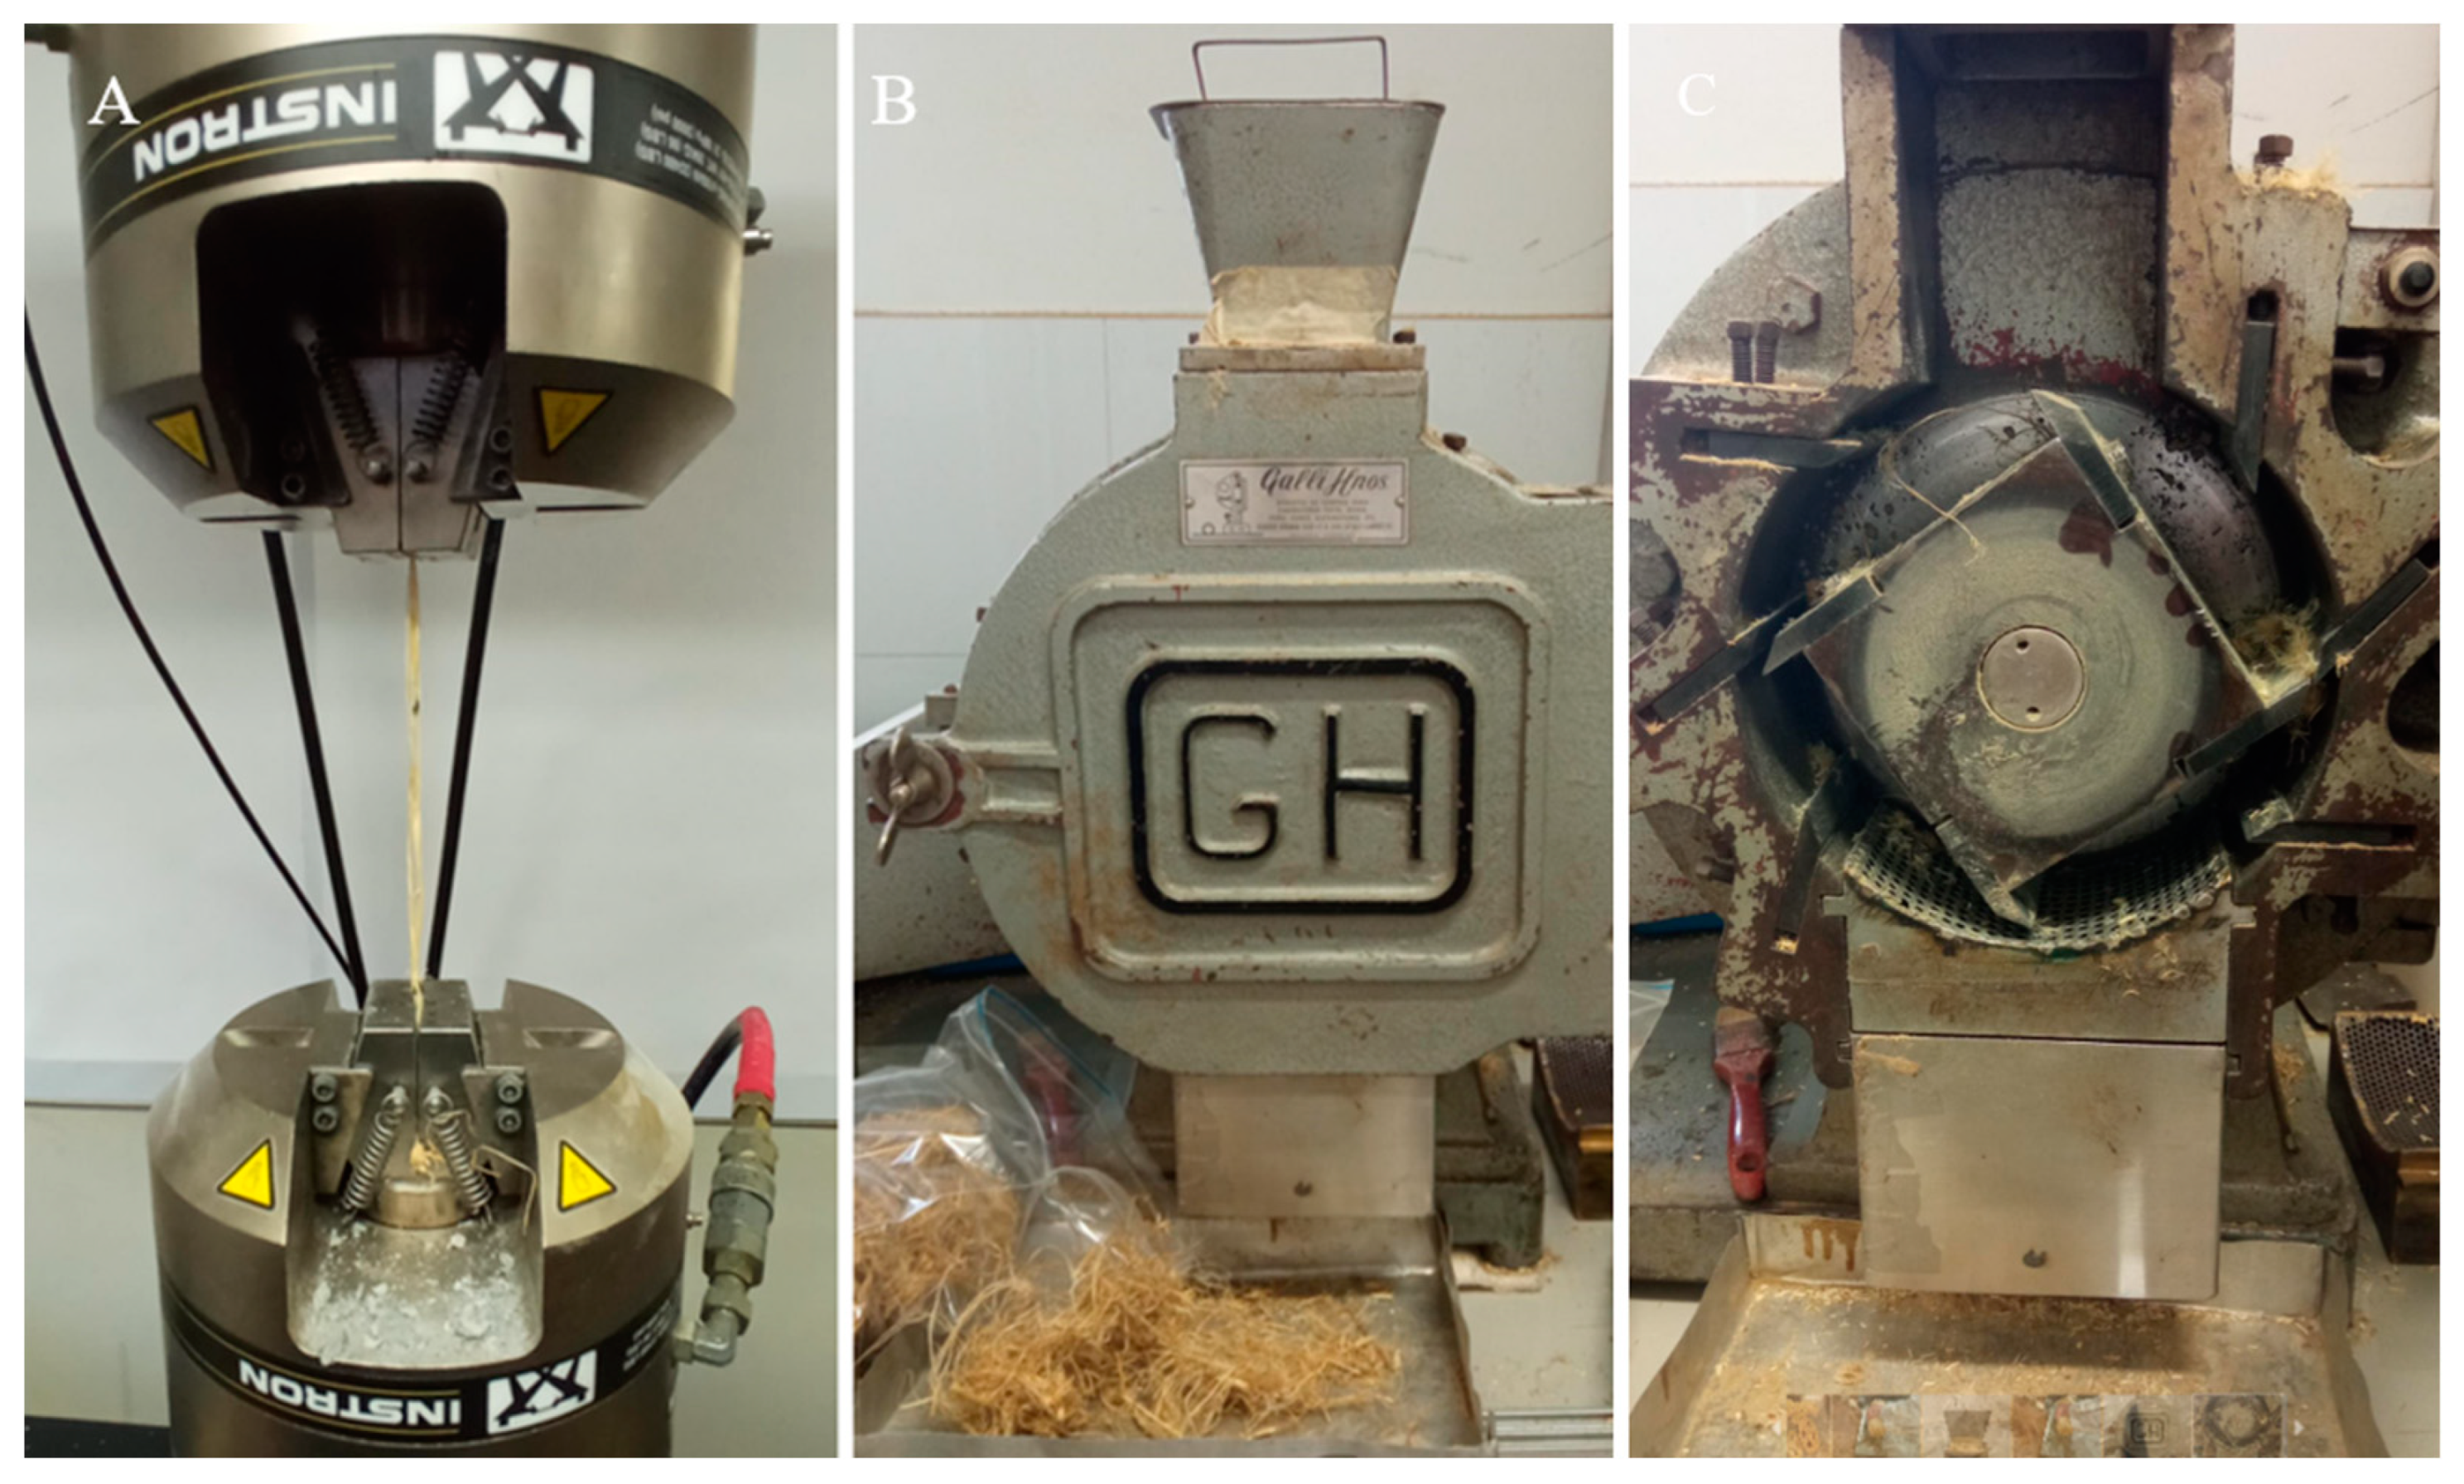
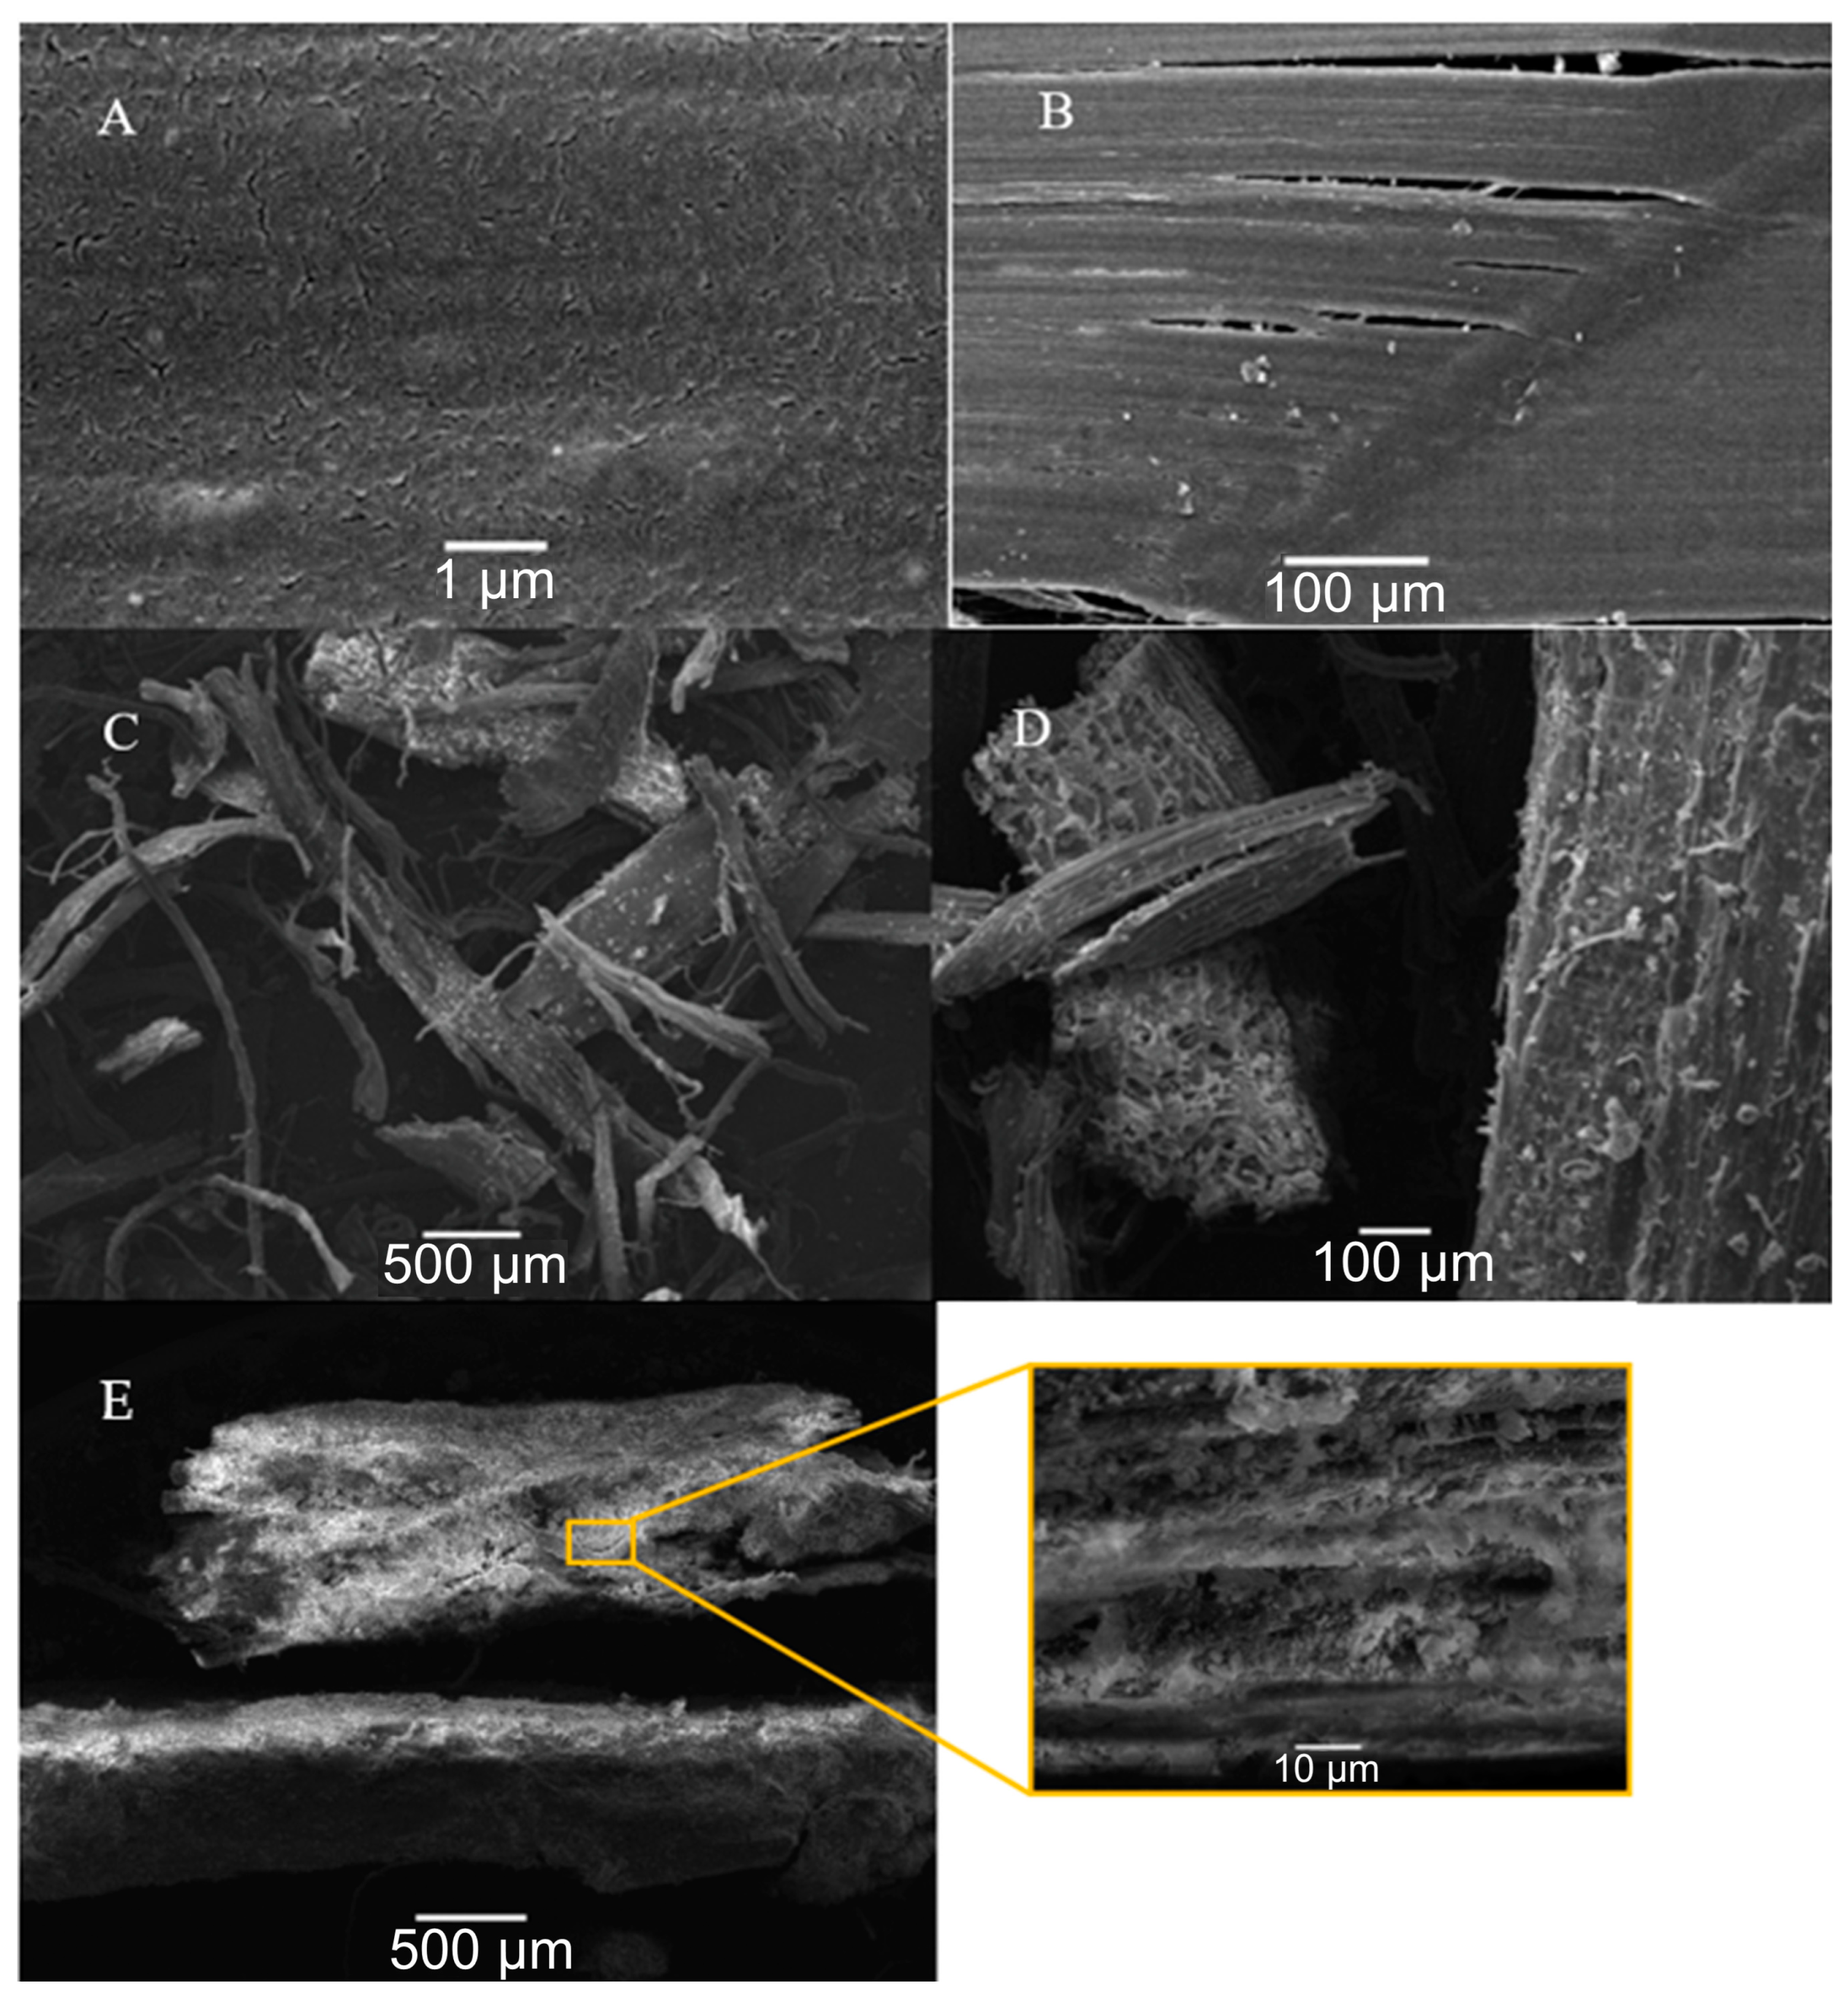
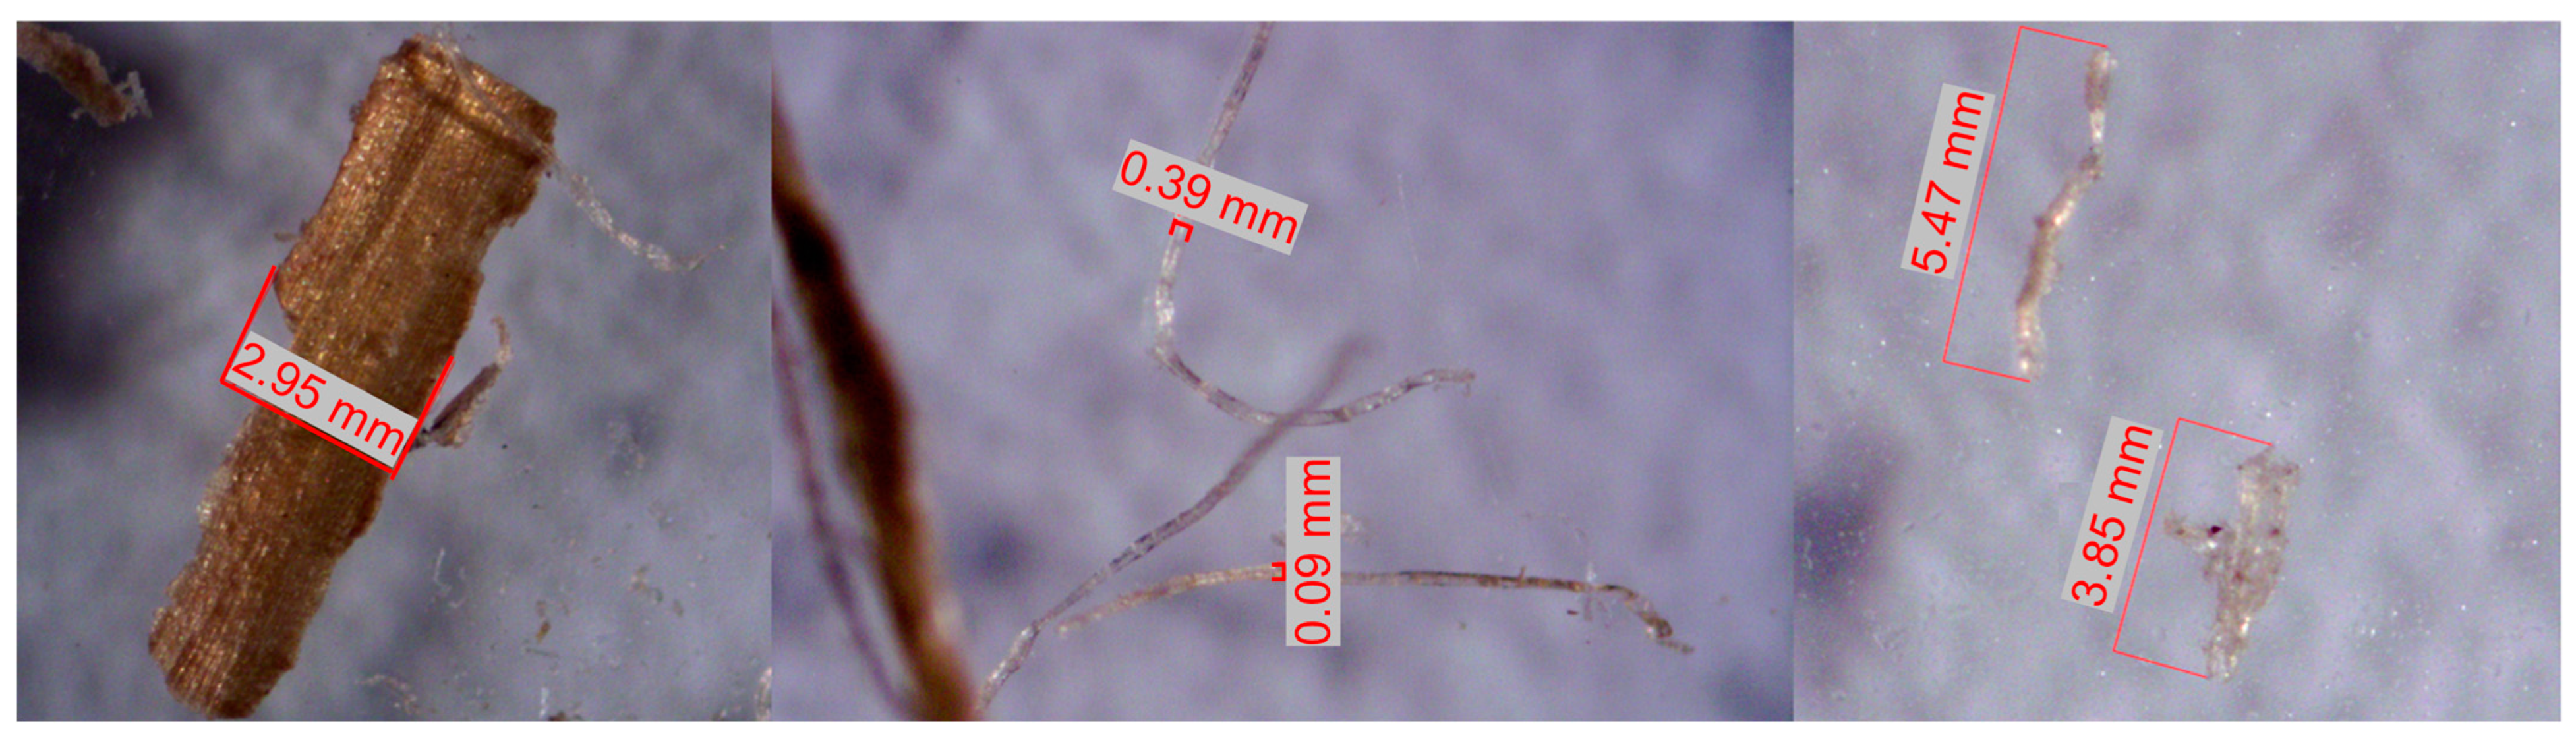
2.2.3. Fibers
2.3. Sample Preparation and Testing Procedures
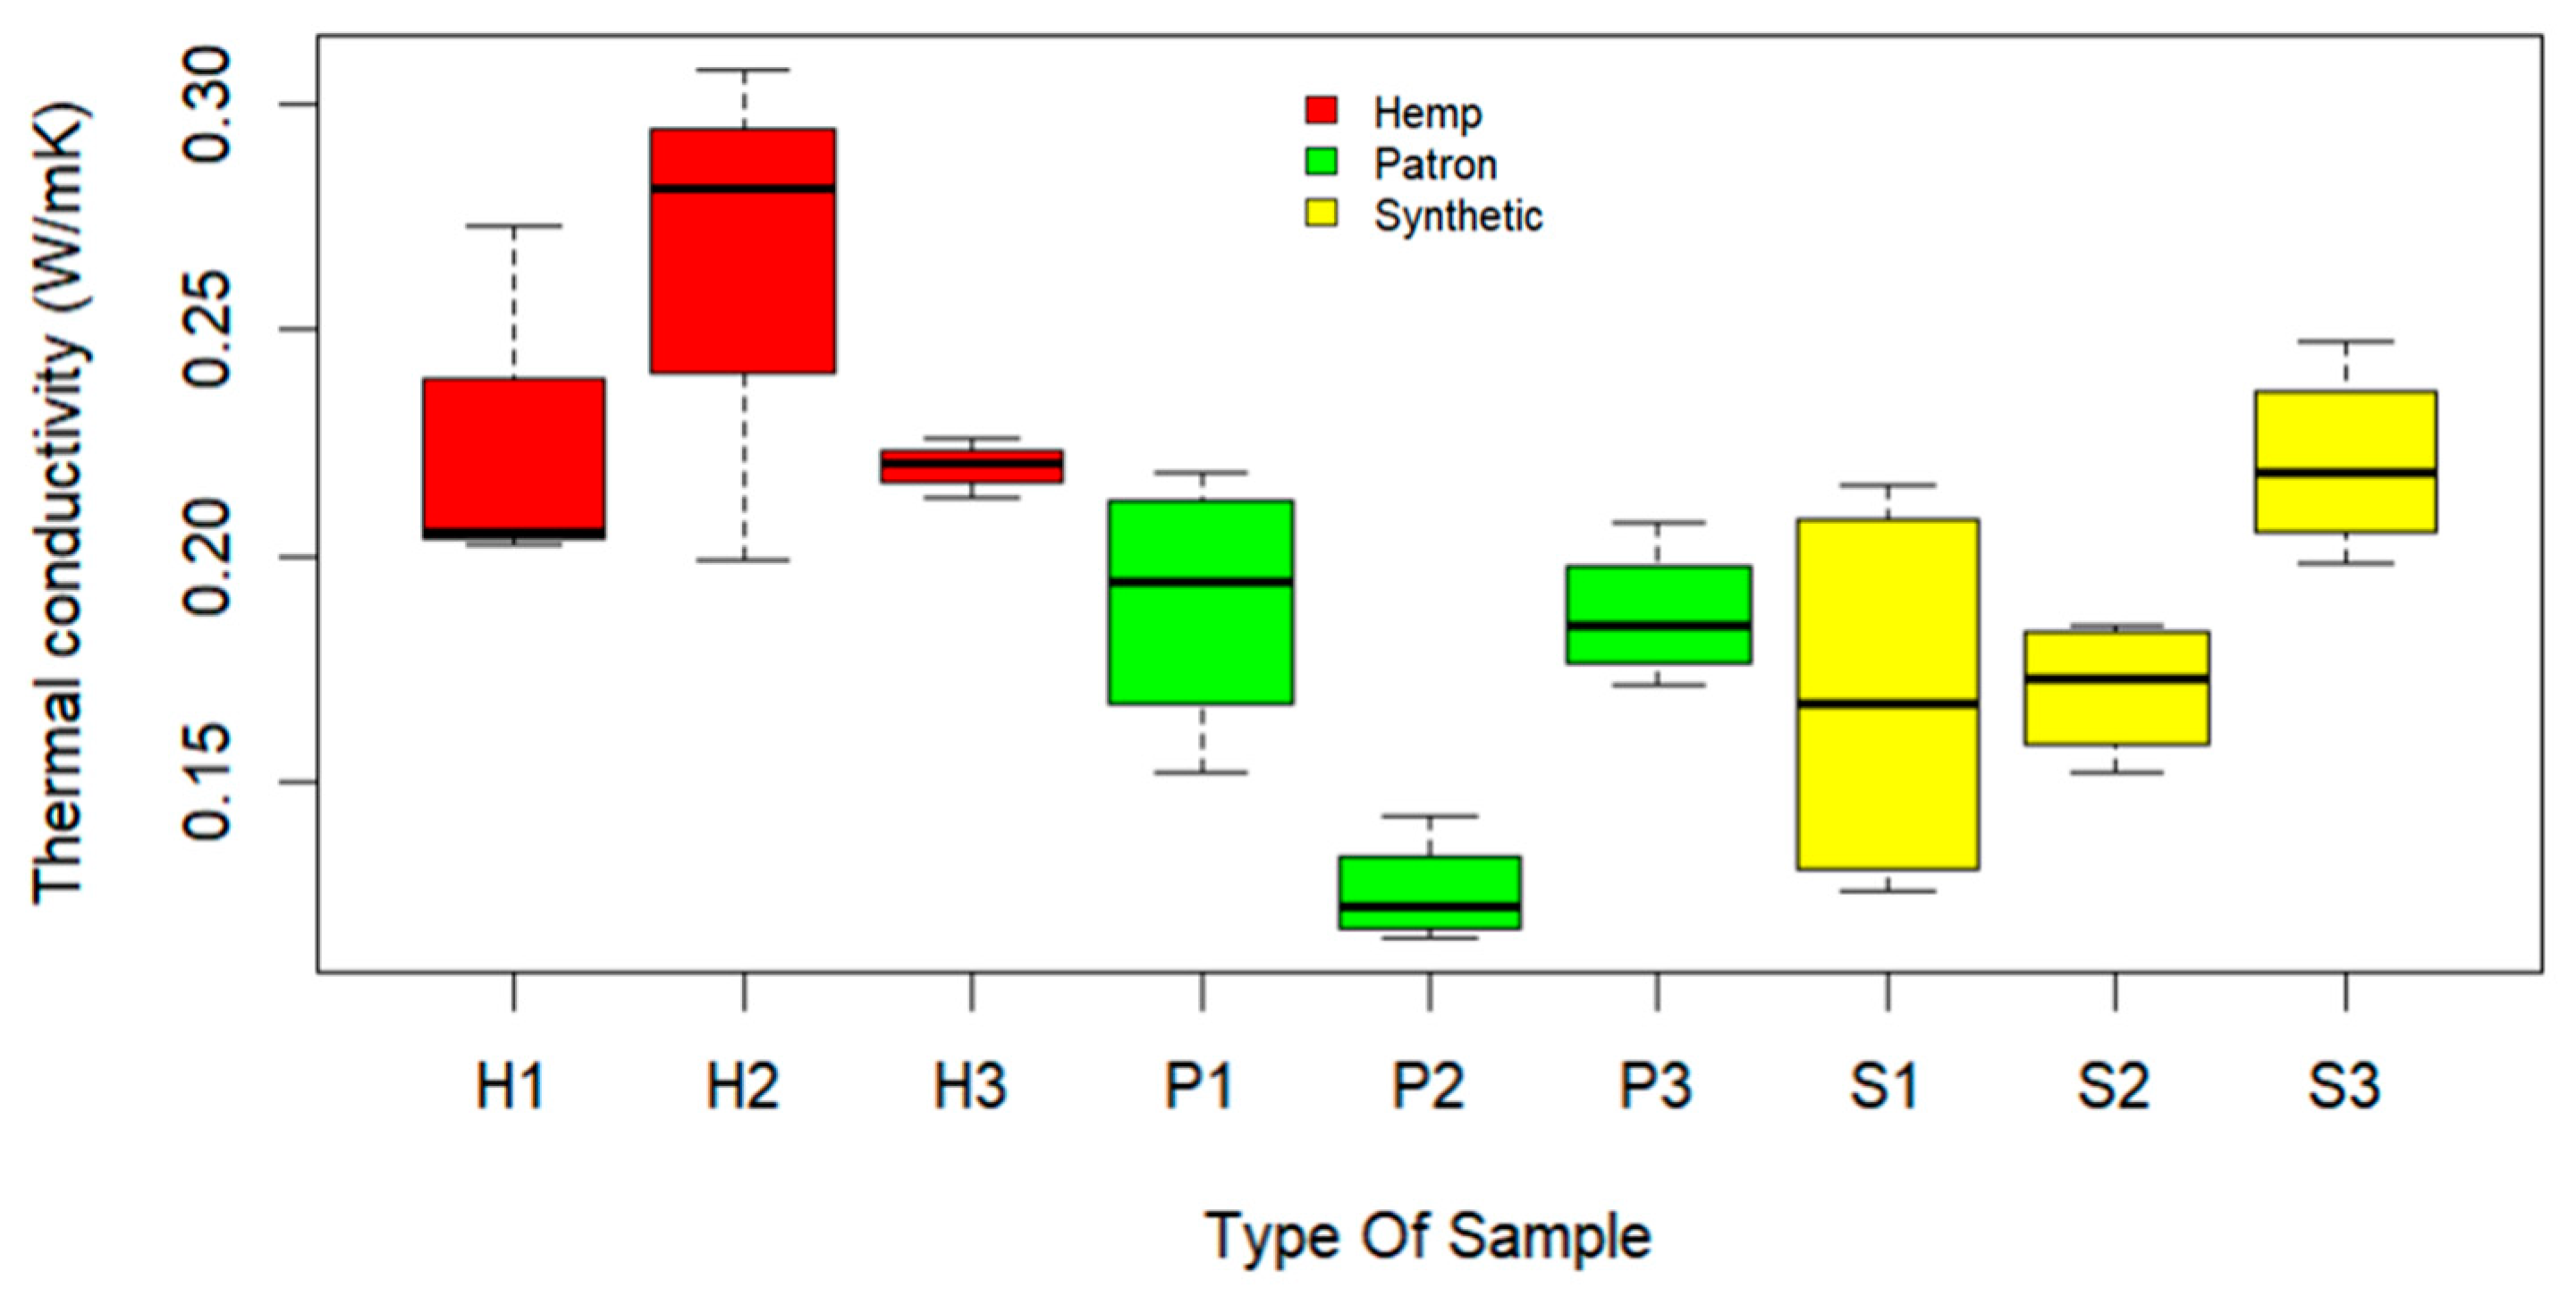
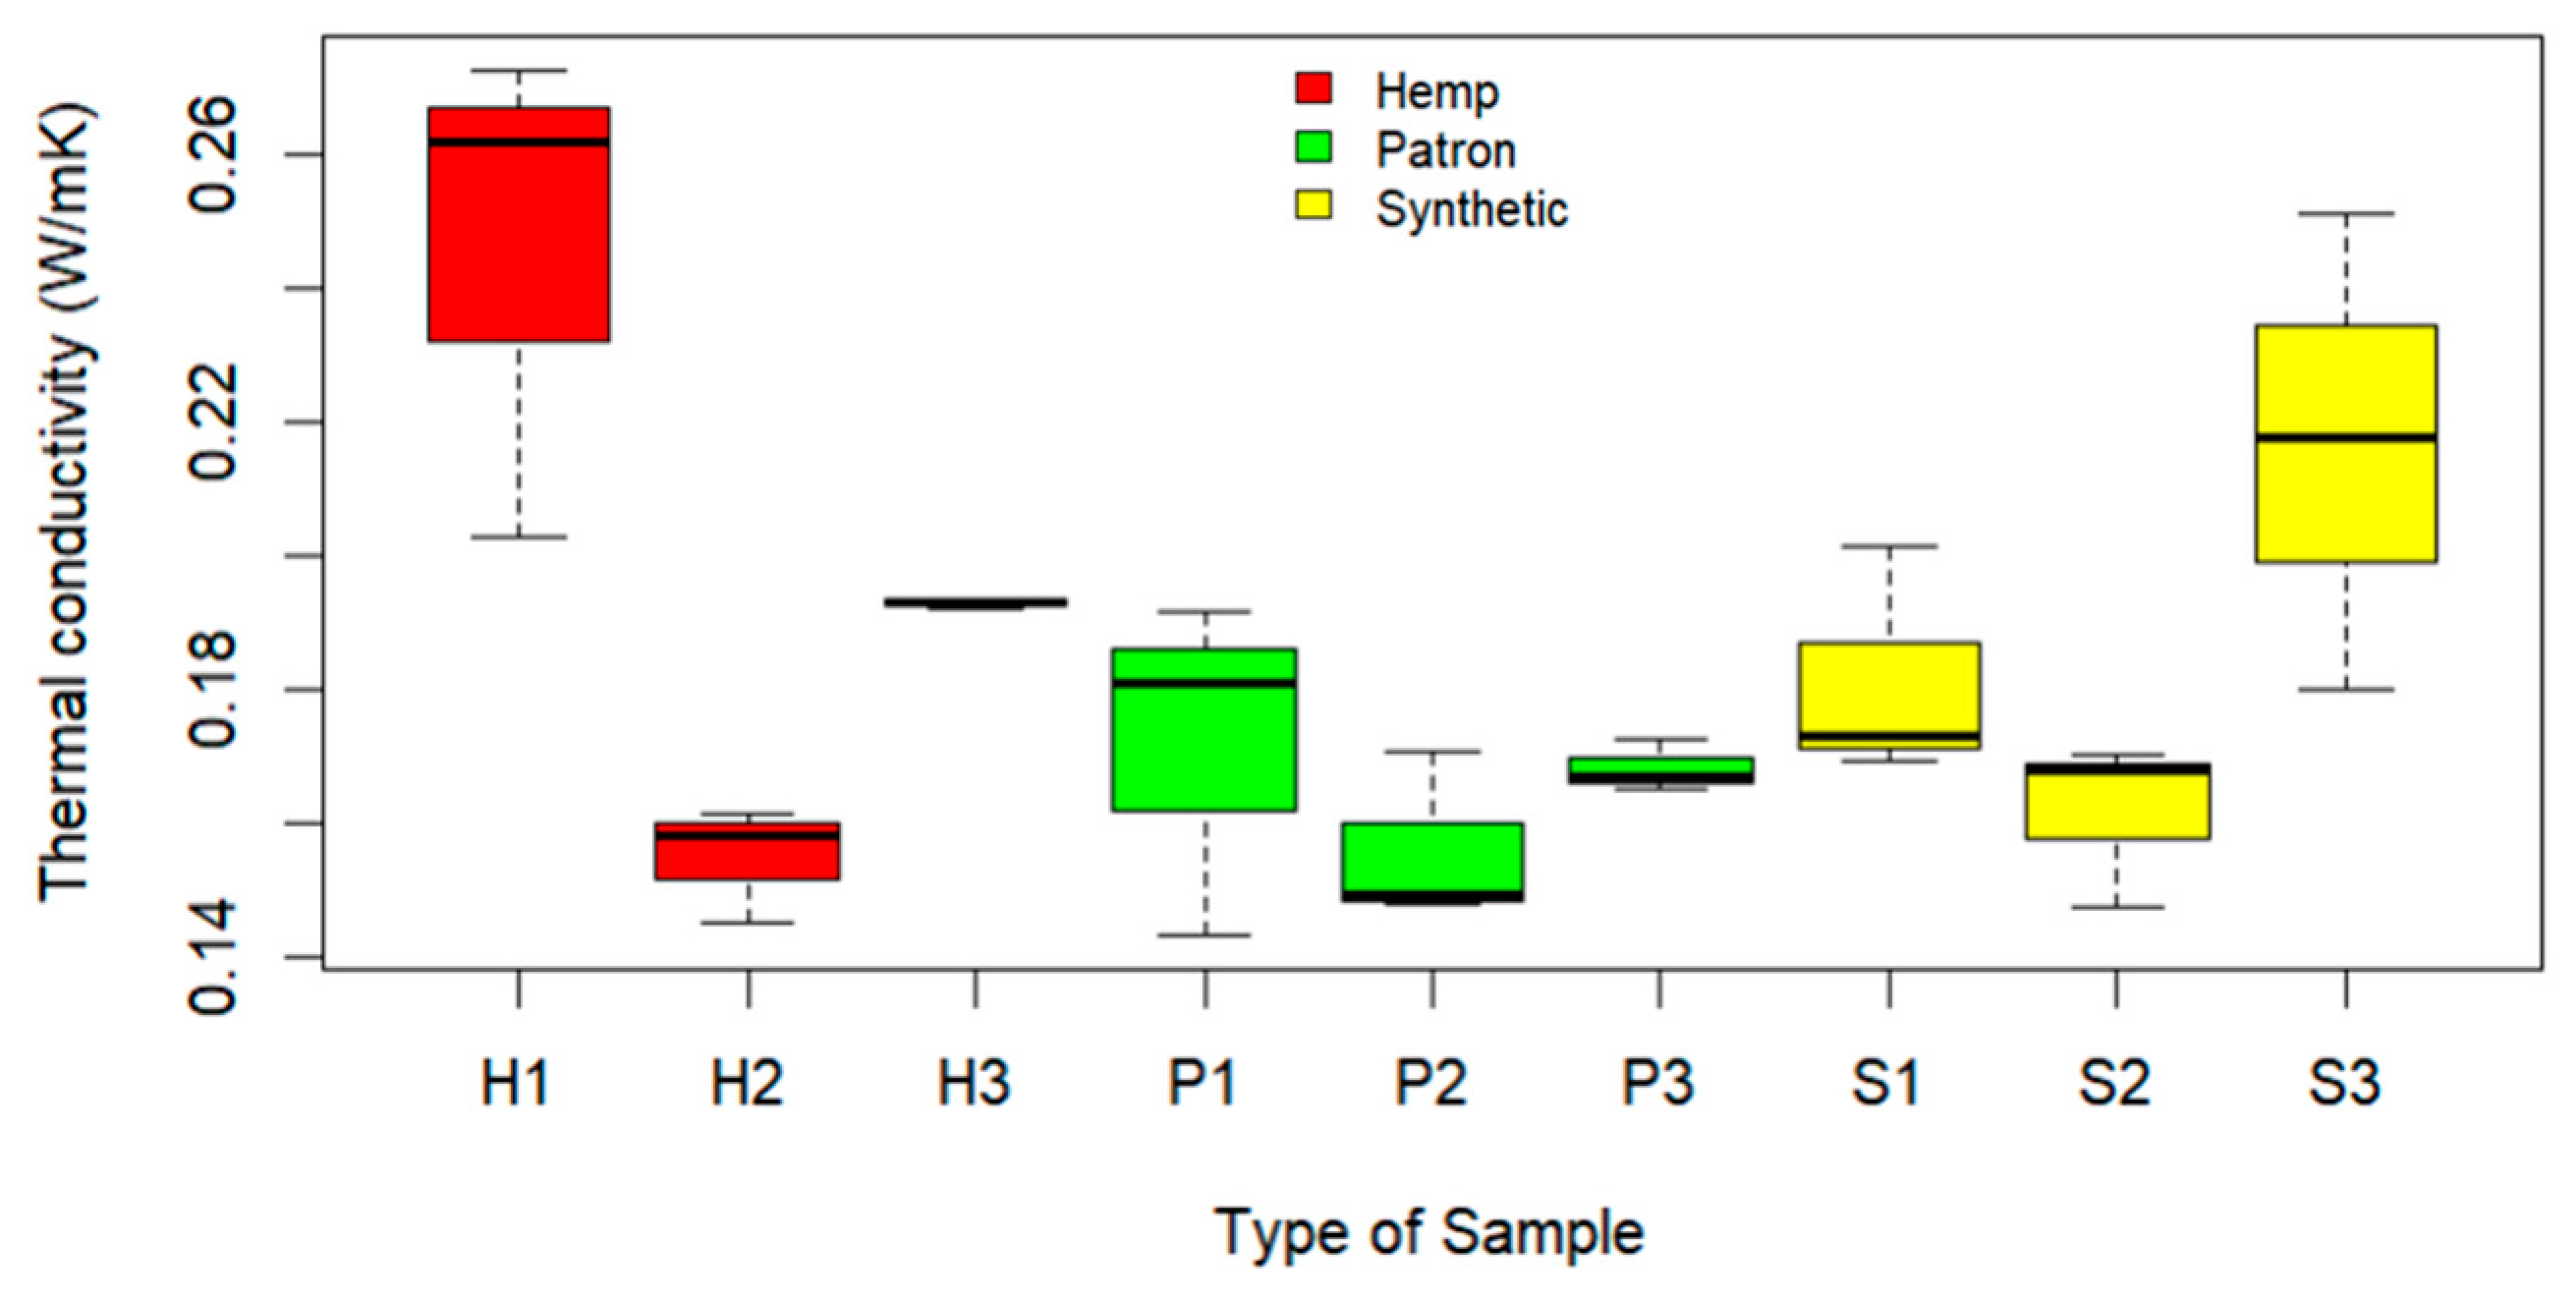
3. Results
4. Discussion
5. Conclusions
Author Contributions
Funding
Institutional Review Board Statement
Informed Consent Statement
Data Availability Statement
Conflicts of Interest
References
- Meyer, C. The greening of the concrete industry. Cem. Concr. Compos. 2009, 31, 601–605. [Google Scholar] [CrossRef]
- Bhattacharjee, B.; Krishnamoorthy, S. Permeable Porosity and Thermal Conductivity of Construction Materials. J. Mater. Civ. Eng. 2004, 16, 322–330. [Google Scholar] [CrossRef]
- Ustaoglu, A.; Kurtoglu, K.; Gencel, O.; Kocyigit, F. Impact of a low thermal conductive lightweight concrete in building: Energy and fuel performance evaluation for different climate region. J. Environ. Manag. 2020, 268, 110732. [Google Scholar] [CrossRef]
- Sani, A.K.; Singh, R.M.; Amis, T.; Cavarretta, I. A review on the performance of geothermal energy pile foundation, its design process and applications. Renew. Sustain. Energy Rev. 2019, 106, 54–78. [Google Scholar] [CrossRef]
- Faizal, M.; Bouazza, A.; Singh, R.M. Heat transfer enhancement of geothermal energy piles. Renew. Sustain. Energy Rev. 2016, 57, 16–33. [Google Scholar] [CrossRef]
- Kim, K.-H.; Jeon, S.-E.; Kim, J.-K.; Yang, S. An experimental study on thermal conductivity of concrete. Cem. Concr. Res. 2003, 33, 363–371. [Google Scholar] [CrossRef]
- Chung, S.-Y.; Han, T.-S.; Kim, S.-Y.; Kim, J.-H.; Youm, K.; Lim, J.-H. Evaluation of effect of glass beads on thermal conductivity of insulating concrete using micro CT images and probability functions. Cem. Concr. Compos. 2015, 65, 150–162. [Google Scholar] [CrossRef]
- Zhang, W.; Min, H.; Gu, X.; Xi, Y.; Xing, Y. Mesoscale model for thermal conductivity of concrete. Constr. Build. Mater. 2015, 98, 8–16. [Google Scholar] [CrossRef]
- Khan, M.I. Factors affecting the thermal properties of concrete and applicability of its prediction models. Build. Environ. 2002, 37, 607–614. [Google Scholar] [CrossRef]
- Sengul, O.; Azizi, S.; Karaosmanoğlu, F.; Tasdemir, M. Effect of expanded perlite on the mechanical properties and thermal conductivity of lightweight concrete. Energy Build. 2011, 43, 671–676. [Google Scholar] [CrossRef]
- Real, S.; Gomes, M.; Rodrigues, A.; Bogas, J. Contribution of structural lightweight aggregate concrete to the reduction of thermal bridging effect in buildings. Constr. Build. Mater. 2016, 121, 460–470. [Google Scholar] [CrossRef]
- Ahmed, S.N.; Sor, N.H.; Ahmed, M.A.; Qaidi, S. Thermal conductivity and hardened behavior of eco-friendly concrete incorporating waste polypropylene as fine aggregate. Mater. Today Proc. 2022, 57, 818–823. [Google Scholar] [CrossRef]
- Qaidi, S.; Al-Kamaki, Y.; Hakeem, I.; Dulaimi, A.; Özkilic, Y.; Sabri, M.; Sergeev, V. Investigation of the physical-mechanical properties and durability of high-strength concrete with recycled PET as a partial replacement for fine aggregates. Front. Mater. 2023, 10, 1101146. [Google Scholar] [CrossRef]
- Collet, F.; Pretot, S. Thermal conductivity of hemp concretes: Variation with formulation, density and water content. Constr. Build. Mater. 2014, 65, 612–619. [Google Scholar] [CrossRef]
- Yang, Y.; Cao, J. Interfacial heat transfer behavior of graphene-based filler and calcium-silicate-hydrate in cement composites. Int. J. Heat Mass Transf. 2021, 176, 121165. [Google Scholar] [CrossRef]
- Donnet, J.B.; Bansal, R.C. Carbon Fibers; CRC Press: Boca Raton, FL, USA, 1998. [Google Scholar]
- Allred, R.E. Carbon-reinforced composite recycling: Process and business development. In Proceedings of the Intertech Conferences, San Diego, CA, USA; 2005. [Google Scholar]
- Hajduk, F. Carbon fibres overview; global outlook for carbon fibres. In Proceedings of the Intertech Conferences, San Diego, CA, USA; 2005. [Google Scholar]
- Carolin, A. Carbon Fibre Reinforced Polymers for Strengthening of Structural Elements. Ph.D. Thesis, Luleå Tekniska Universitet, Luleå, Sweden, 2003. [Google Scholar]
- Loh, L.; Yew, M.K.; Yew, M.; Torbjorn, M.; Lee, F.W.; Lim, S.K.; Kwong, K. Mechanical and Thermal Properties of Synthetic Polypropylene Fiber-Reinforced Renewable Oil Palm Shell Lightweight Concrete. Materials 2021, 14, 2337. [Google Scholar] [CrossRef]
- Jhatial, A.; Goh, W.I.; Mohamad, N.; Alengaram, U.J.; Mo, K.H. Effect of Polypropylene Fibres on the Thermal Conductivity of Lightweight Foamed Concrete. MATEC Web Conf. 2018, 150, 03008. [Google Scholar] [CrossRef]
- Tran Le, A.D.; Maalouf, C.; Mai, T.; Wurtz, E.; Collet, F. Transient hygrothermal behaviour of a hemp concrete building envelope. Energy Build. 2010, 42, 1797–1806. [Google Scholar] [CrossRef]
- Piot, A.; Bejat, T.; Jay, A.; Bessette, L.; Wurtz, E.; Barnes-Davin, L. Study of a hempcrete wall exposed to outdoor climate: Effects of the coating. Constr. Build. Mater. 2017, 135, 540–550. [Google Scholar] [CrossRef]
- Gustafsson, S.E. Transient plane source techniques for thermal conductivity and thermal diffusivity measurements of solid materials. Rev. Sci. Instrum. 1991, 62, 797–804. [Google Scholar] [CrossRef]
- Jorand, R.; Vogt, C.; Marquart, G.; Clauser, C. Effective thermal conductivity of heterogeneous rocks from laboratory experiments and numerical modeling. J. Geophys. Res. Solid Earth 2013, 118, 5225–5235. [Google Scholar] [CrossRef]
- Zhang, N.; Wang, Z. Review of soil thermal conductivity and predictive models. Int. J. Therm. Sci. 2017, 117, 172–183. [Google Scholar] [CrossRef]
- Bindiganavile, V.; Batool, F. Effect of fly ash on thermal properties of cement based foams evaluated by transient plane heat source. Indian Concr. J. 2012, 86, 7–14. [Google Scholar]
- Asadi, I.; Shafigh, P.; Bin Abu Hassan, Z.F.; Mahyuddin, N.B. Thermal conductivity of concrete—A review. J. Build. Eng. 2018, 20, 81–93. [Google Scholar] [CrossRef]
- Gandage, A.; Ram, V.V.; Arunachalam, V.; Sivakumar, M.; Malagavelli, V.; Yaswanth, A. Effect of Perlite on Thermal Conductivity of Self Compacting Concrete. Energy Build. 2013, 104, 671–676. [Google Scholar] [CrossRef]
- Cezairliyan, A.; Maglic, K.D.; Peletsky, V.E. Compendium of Thermophysical Property Measurement Methods: Volume 2 Recommended Measurement Techniques and Pratices; Springer Science & Business Media: Berlin/Heidelberg, Germany, 2012. [Google Scholar]
- Demirboga, R.; Türkmen, I.; Karakoc, M. Thermo-mechanical properties of concrete containing high-volume mineral admixtures. Build. Environ. 2007, 42, 349–354. [Google Scholar] [CrossRef]
- Wongkeo, W.; Thongsanitgarn, P.; Pimraksa, K.; Chaipanich, A. Compressive strength, flexural strength and thermal conductivity of autoclaved concrete block made using bottom ash as cement replacement materials. Mater. Des. 2012, 35, 434–439. [Google Scholar] [CrossRef]
- Wong, J.M.; Glasser, F.; Imbabi, M. Evaluation of thermal conductivity in air permeable concrete for dynamic breathing wall construction. Cem. Concr. Compos. 2007, 29, 647–655. [Google Scholar] [CrossRef]
- Demirboga, R.; Kan, A. Thermal conductivity and shrinkage properties of modified waste polystyrene aggregate concretes. Constr. Build. Mater. 2012, 35, 730–734. [Google Scholar] [CrossRef]
- Demirboga, R.; Gül, R. Thermal conductivity and compressive strength of expanded perlite aggregate concrete with mineral admixtures. Energy Build. 2003, 35, 1155–1159. [Google Scholar] [CrossRef]
- Demirboga, R. Thermal conductivity and compressive strength of concrete incorporation with mineral admixtures. Build. Environ. 2007, 42, 2467–2471. [Google Scholar] [CrossRef]
- Topçu, İ.; Uygunoğlu, T. Properties of autoclaved lightweight aggregate concrete. Build. Environ. 2007, 42, 4108–4116. [Google Scholar] [CrossRef]
- Ünal, O.; Uygunoğlu, T.; Yildiz, A. Investigation of properties of low-strength lightweight concrete for thermal insulation. Build. Environ. 2007, 42, 584–590. [Google Scholar] [CrossRef]
- Demirboga, R. Influence of mineral admixtures on thermal conductivity and compressive strength of mortar. Energy Build. 2003, 35, 189–192. [Google Scholar] [CrossRef]
- Klarsfeld, S. Guarded hot plate method for thermal conductivity measurements. Compend. Thermophys. Prop. Meas. Methods Surv. Meas. Tech. 1984, 1, 169. [Google Scholar]
- Alengaram, U.J.; Al Muhit, B.A.; Jumaat, Z.; Liu, M. A comparison of the thermal conductivity of oil palm shell foamed concrete with conventional materials. Mater. Des. 2013, 51, 522–529. [Google Scholar] [CrossRef]
- Liu, M.; Alengaram, U.J.; Jumaat, Z.; Mo, K.H. Evaluation of thermal conductivity, mechanical and transport properties of lightweight aggregate foamed geopolymer concrete. Energy Build. 2013, 72, 238–245. [Google Scholar] [CrossRef]
- Ng, S.-C.; Sai, L. Thermal conductivity of newspaper sandwiched aerated lightweight concrete panel. Lancet 2010, 42, 2452–2456. [Google Scholar] [CrossRef]
- Krishnamoorthy, R.; Zujip, J.A. Thermal Conductivity and Microstructure of Concrete Using Recycle Glass as a Fine Aggregate Replacement. 2013. Available online: https://api.semanticscholar.org/CorpusID:3474587 (accessed on 15 December 2023).
- Sayadi, A.; Tapia, J.; Neitzert, T.; Clifton, G. Effects of expanded polystyrene (EPS) particles on fire resistance, thermal conductivity and compressive strength of foamed concrete. Constr. Build. Mater. 2016, 112, 716–724. [Google Scholar] [CrossRef]
- Pomianowski, M.; Heiselberg, P.; Jensen, R.; Cheng, R.; Zhang, Y. A new experimental method to determine specific heat capacity of inhomogeneous concrete material with incorporated microencapsulated-PCM. Cem. Concr. Res. 2014, 55, 22–34. [Google Scholar] [CrossRef]
- Maqsood, S.E.G.A.; Amin, N.; Maqsood, M.; Shabbir, G.; Mahmood, A. Simultaneous measurements of thermal conductivity and thermal diffusivity of insulators, fluids and conductors using the transient plane source (TPS) technique. Int. J. Energy Res. 1994, 18, 777–782. [Google Scholar] [CrossRef]
- Al-Ajlan, S. Measurements of thermal properties of insulation materials by using transient plane source technique. Appl. Therm. Eng. 2006, 26, 2184–2191. [Google Scholar] [CrossRef]
- Taoukil, D.; El Bouardi, A.; Sick, F.; MIMET, A.; Ezbakhe, H.; Ajzoul, T. Moisture content influence on the thermal conductivity and diffusivity of wood–concrete composite. Constr. Build. Mater. 2013, 48, 104–115. [Google Scholar] [CrossRef]
- Belkharchouche, D.; Chaker, A. Effects of moisture on thermal conductivity of the lightened construction material. Int. J. Hydrogen Energy 2016, 41, 7119–7125. [Google Scholar] [CrossRef]
- Kodide, U. Thermal Conductivity and Its Effects on the Performance of Pcc Pavements in Mepdg. Master’s Thesis, Louisiana State University and Agricultural & Mechanical College, Baton Rouge, LA, USA, 2010. [Google Scholar]
- Burger, N.; Laachachi, A.; Ferriol, M.; Lutz, M.; Toniazzo, V.; Ruch, D. Review of thermal conductivity in composites: Mechanisms, parameters and theory. Prog. Polym. Sci. 2016, 61, 1–28. [Google Scholar] [CrossRef]
- de Wilde, P.; Griffiths, R.; Goodhew, S. Validation of data analysis routines for a thermal probe apparatus using numerical data sets. Build. Simul. 2008, 1, 36–45. [Google Scholar] [CrossRef]
- Batty, W.J.; Probert, S.D.; Ball, M.; O’Callaghan, P.W. Use of the thermal-probe technique for the measurement of the apparent thermal conductivities of moist materials. Appl. Energy 1984, 18, 301–317. [Google Scholar] [CrossRef]
- Redgrove, J.; Kubicar, L.; Lockmuller, N. Measurement of thermal conductivity with the needle probe. High Temp. Press. 2004, 36, 127–138. [Google Scholar] [CrossRef]
- ASTM D5334; Standard Test Method for Determination of Thermal Conductivity of Soil and Rock by Thermal Needle Probe Procedure. ASTM: West Conshohocken, PA, USA, 2014; pp. 1–8. [CrossRef]
- Conductors, I.; Society, E. IEEE Guide for Thermal Resistivity Measurements of Soils and Backfill Materials; IEEE: Piscataway, NJ, USA, 2018. [Google Scholar] [CrossRef]
- Thermtest Instrument- Latin America. Fuente de Línea Transitoria Home Page. Available online: https://thermtest.com/latinamerica/tls-100 (accessed on 18 May 2023).
- Ministerio de Obras Públicas. NCh148. Cemento—Terminología, Clasificación y Especificaciones Generales. NORMA CHILENA OFICIAL NCh148.Of68. 1968. Available online: https://www.academia.edu/34880431/I_NORMA_CHILENA_OFICIAL_NCh148_Of68 (accessed on 15 December 2023).
- SIEMENS. Product Data Sheet Product Data Sheet DEPMPO. Radiat. Curing 2006, 9, 1–2. [Google Scholar]
- IS:3812; Pulverized Fuel Ash—Specification. Part 1: For Use as Pozzolana in Cement, Cement Mortar and Concrete (Second Revision). Bureau of Indian Standards: New Delhi, India, 2013; pp. 1–14.
- Ministerio de Obras Públicas. “NCh163—Aridos Para Morteros y Hormigones—Requisitos Generales. Norma Chil. Of. 1979, pp. 2–6. Available online: https://es.scribd.com/doc/253299687/Nch-163-of-79-Aridos-Para-Morteros-y-Hormigones-Requisitos-Generales (accessed on 15 December 2023).
- EN 14889; Fibres for Concrete. European Commission: Brussels, Belgium, 2006.
- ASTM C1116; Standard Specification for Fiber-Reinforced Concrete. Available online: https://www.astm.org/c1116_c1116m-10ar15.html (accessed on 19 September 2023).
- Fan, M. Characterization and performance of elementary hemp fibres: Factors influencing tensile strength. Bioresources 2010, 5, 2307–2322. [Google Scholar] [CrossRef]
- Li, Z.; Wang, L.; Wang, X. Compressive and flexural properties of hemp fiber reinforced concrete. Fibers Polym. 2004, 5, 187–197. [Google Scholar] [CrossRef]
- Ramaswamy, H.S.; Ahuja, B.M.; Krishnamoorthy, S. Behaviour of concrete reinforced with jute, coir and bamboo fibres. Int. J. Cem. Compos. Light. Concr. 1983, 5, 3–13. [Google Scholar] [CrossRef]
- Comak, B.; Bideci, A.; Bideci, O.S. Effects of hemp fibers on characteristics of cement based mortar. Constr. Build. Mater. 2018, 169, 794–799. [Google Scholar] [CrossRef]
- Real, S.; Bogas, J.; Gomes, M.; Ferrer, B. Thermal conductivity of structural lightweight aggregate concrete. Mag. Concr. Res. 2016, 68, 798–808. [Google Scholar] [CrossRef]
- Yun, T.; Jeong, Y.J.; Han, T.-S.; Youm, K. Evaluation of thermal conductivity for thermally insulated concretes. Energy Build. 2013, 61, 125–132. [Google Scholar] [CrossRef]
- Newman, J.; Owens, P. Properties of lightweight concrete. Adv. Concr. Technol. Set. 2003, 3, 1–29. [Google Scholar] [CrossRef]
- Holm, T.; Bremner, T. State-of-the-Art Report on High-Strength, High-Durability Structural Low-Density Concrete for Applications in Severe Marine Environments; US Army Corps of Engineers, Engineer Research and Development Center: Washington, DC, USA, 2000. [Google Scholar]
- Fraternali, F.; Ciancia, V.; Chechile, R.; Rizzano, G.; Feo, L.; Incarnato, L. Experimental study of the thermo-mechanical properties of recycled PET fiber reinforced concrete. Compos. Struct. 2011, 93, 2368–2374. [Google Scholar] [CrossRef]
- Tasdemir, C.; Sengul, O.; Tasdemir, M. A comparative study on the thermal conductivities and mechanical properties of lightweight concretes. Energy Build. 2017, 151, 469–475. [Google Scholar] [CrossRef]
- Pacheco-Torgal, F.; Ding, Y.; Jalali, S. Properties and durability of concrete containing polymeric wastes (tyre rubber and polyethylene terephthalate bottles): An overview. Constr. Build. Mater. 2012, 30, 714–724. [Google Scholar] [CrossRef]
- Modro, N.L.R.; Modro, N.R.; Modro, N.R.; Oliveira, A.P.N. Avaliação de concreto de cimento Portland contendo resíduos de PET. Matéria 2009, 14, 725–736. [Google Scholar] [CrossRef]
- Poonyakan, A.; Rachakornkij, M.; Wecharatana, M.; Smittakorn, W. Potential use of plastic wastes for low thermal conductivity concrete. Materials 2018, 11, 1938. [Google Scholar] [CrossRef] [PubMed]
- Sargam, Y.; Wang, K.; Alleman, J.E. Effects of Modern Concrete Materials on Thermal Conductivity. J. Mater. Civ. Eng. 2020, 32, 1–11. [Google Scholar] [CrossRef]
- Wang, R.; Meyer, C. Performance of cement mortar made with recycled high impact polystyrene. Cem. Concr. Compos. 2012, 34, 975–981. [Google Scholar] [CrossRef]
- Bederina, M.; Marmoret, L.; Mezreb, K.; Khenfer, M.M.; Bali, A.; Quéneudec, M. Effect of the addition of wood shavings on thermal conductivity of sand concretes: Experimental study and modelling. Constr. Build. Mater. 2007, 21, 662–668. [Google Scholar] [CrossRef]
- Öztürk, T.; Bayrakl, M. The Possibilities of Using Tobacco Wastes in Producing Lightweight Concrete. Agric. Eng. Int. 2005, 7, 1–9. [Google Scholar]
- Wadsö, L.; Karlsson, J.; Tammo, K. Thermal properties of concrete with various aggregates. Cem. Concr. Res. 2012, 25. [Google Scholar]


| Materials | Concrete, Rocks, and Polymers |
|---|---|
| Measuring Capacity | Bulk Properties |
| Thermal Conductivity | 0.3 to 5 W/m°K |
| Thermal Resistivity | 0.2 to 3.3 m°K/W |
| Measuring Time | 1 to 90 Minutes |
| Reproducibility | ±2% |
| Precision | ±5% |
| Temperature Range | −40 to 100 °C |
| Minimum Sample Size | large 50 mm, diameter 50 mm |
| Semi-Quantitative Mineralogy | ||||
|---|---|---|---|---|
| Sample | Plagioclase | Quartz | Hatrurite | Akermanite |
| Cement (%) | 10.2 | 14.5 | 68.7 | 6.6 |
| Semi-Quantitative Mineralogy | |||||
|---|---|---|---|---|---|
| Sample | Plagioclase | Pyroxene | Quartz | Olivine | Garnet |
| Cement (%) | 64.9 | 13.1 | 11.8 | 8.5 | 1.7 |
| Parameter | Synthetic | Hemp |
|---|---|---|
| Tensile strength, MPa | 640 | 0.052 ± 0.0046 |
| Fiber length, mm | 54 | 2.45 ± 1.25 |
| Fiber diameter, mm | 0.70 | 0.1 ± 0.06 |
| Materials (%) | 7-Day Density (g/cm3) | 28-Day Density (g/cm3) | ||||||
|---|---|---|---|---|---|---|---|---|
| Sample | Sand | Cement | Coarse Aggregate | Fiber | Wet | Dry | Wet | Dry |
| Patron (P) | 64.55 | 32.27 | 3.18 | 0.00 | 2.43 | 2.26 | 2.37 | 2.25 |
| Synthetic (S) | 64.30 | 32.15 | 3.16 | 0.39 | 2.34 | 2.18 | 2.31 | 2.18 |
| Hemp (H) | 64.30 | 32.15 | 3.16 | 0.39 | 2.41 | 2.23 | 2.38 | 2.25 |
| Type Sample | w/c | Dry Density (kg/m3) | (W/m°K) | References |
|---|---|---|---|---|
| Concrete with recycled coarse aggregate | 0.35 | 2112 | 0.98–0.99 | [78] |
| 0.45 | 2087 | 0.88–0.89 | ||
| 0.5 | 2075 | 0.76–0.77 | ||
| 0.55 | 2069 | 0.69–0.70 | ||
| Concrete with rock aggregate | - | - | 1.163–8.6 | [9] |
| Lightweight concrete | - | - | 0.2–1.9 | [11,70,71,72] |
| Normal weight concrete | - | - | 0.6–3.3 | |
| Structural lightweight aggregate concrete | - | 1850 | 0.58–0.86 | [72] |
| - | 1400–1800 | 0.85–1.05 | ||
| Cement mortar with 10%, 20%, 50% of recycled high-impact polystyrene as a sand substitute | - | - | 0.53 | [79] |
| - | - | 0.42 | ||
| - | - | 0.27 | ||
| Dune sand concrete | - | 2100 | 1.2 | [80] |
| Dune sand concrete with wood shavings aggregate | - | 1400 | 0.55 | |
| Lightweight concrete made of tobacco waste | - | - | 0.19–0.22 | [81] |
| Reference concrete | 0.5 | 2240 | 2.24 | [82] |
| Magnetite concrete | - | 3650 | 2.57 | |
| Graphite concrete | 0.59 | 1890 | 3.52 | |
| Graphite and magnetite concrete | 0.6 | 2810 | 3.85 | |
| Steel fiber concrete | - | 2330 | 2.57 | |
| Steel fiber concrete with high concentration of fibers | - | 2441 | 2.95 | |
| Concrete with brass shavings | - | 2520 | 2.71 | |
| Concrete with copper wires | - | 2438 | 3.63 | |
| Concrete with PCM pellets | 0.5 | 1790 | 1.23 | |
| Concrete with micro PCM | - | 1570 | 0.97 | |
| Concrete with PCM dispersion | - | 1900 | 1.31 | |
| Sprayed hemp concrete | - | 374–450 | 0.116–0.145 | [22] |
| Reference (patron) concrete (28 curing days) | 0.5 | 2250 | 0.143–0.192 | This study |
| Concrete with hemp fibers (28 curing days) | 2250 | 0.145–0.273 | ||
| Concrete with synthetic fibers (28 curing days) | 2180 | 0.148- 0.251 |
Disclaimer/Publisher’s Note: The statements, opinions and data contained in all publications are solely those of the individual author(s) and contributor(s) and not of MDPI and/or the editor(s). MDPI and/or the editor(s) disclaim responsibility for any injury to people or property resulting from any ideas, methods, instructions or products referred to in the content. |
© 2024 by the authors. Licensee MDPI, Basel, Switzerland. This article is an open access article distributed under the terms and conditions of the Creative Commons Attribution (CC BY) license (https://creativecommons.org/licenses/by/4.0/).
Share and Cite
Daza-Badilla, L.; Gómez, R.; Díaz-Noriega, R.; Avudaiappan, S.; Skrzypkowski, K.; Saavedra-Flores, E.I.; Korzeniowski, W. Thermal Conductivity in Concrete Samples with Natural and Synthetic Fibers. Materials 2024, 17, 817. https://doi.org/10.3390/ma17040817
Daza-Badilla L, Gómez R, Díaz-Noriega R, Avudaiappan S, Skrzypkowski K, Saavedra-Flores EI, Korzeniowski W. Thermal Conductivity in Concrete Samples with Natural and Synthetic Fibers. Materials. 2024; 17(4):817. https://doi.org/10.3390/ma17040817
Chicago/Turabian StyleDaza-Badilla, Lucas, René Gómez, Ramón Díaz-Noriega, Siva Avudaiappan, Krzysztof Skrzypkowski, Erick I. Saavedra-Flores, and Waldemar Korzeniowski. 2024. "Thermal Conductivity in Concrete Samples with Natural and Synthetic Fibers" Materials 17, no. 4: 817. https://doi.org/10.3390/ma17040817
APA StyleDaza-Badilla, L., Gómez, R., Díaz-Noriega, R., Avudaiappan, S., Skrzypkowski, K., Saavedra-Flores, E. I., & Korzeniowski, W. (2024). Thermal Conductivity in Concrete Samples with Natural and Synthetic Fibers. Materials, 17(4), 817. https://doi.org/10.3390/ma17040817