Abstract
From an engineering point of view, it is important to know the factors influencing the frost resistance of rocks with porosity above 2% due to their different frost resistance. The article focused on frost durability research using the thermoporometry method (TMP) and the assessment of water phase transition in the pore spaces of selected rocks. For this purpose, the differential scanning calorimetry method (DSC) was used with the adoption of an original algorithm for eliminating the thermal inertia of the measurement system. The results of the DSC method were supplemented with the results of pore size distribution using the mercury intrusion porosimetry method (MIP) and standard rock frost resistance tests. Based on the research carried out using the thermoporometry method, it was confirmed that the ability of water to freeze in the temperature range from −5 °C to −20 °C was important, as well as the ability of rocks to increase the degree of water saturation during freeze–thaw cycles. Based on calorimetric tests combined with thermoporometry, in the case of non-frost-resistant rocks, a significant (dominant) share of pores with a radius of under 10 nm (amounting to over 0.008 cm3/cm3) was found. Pore connections in the water freezing process do not influence the investigated rocks’ frost resistance.
1. Introduction
Stone materials are one of the oldest raw materials used in construction. They have great potential as building stones, road stones, or raw materials for the production of building materials. Rocks are used as building cladding elements, pavement slabs, street curbs, substructures, concrete aggregate, etc. In historic buildings, these materials may be one of the main structural elements [1,2]. When this material comes into contact with water and is exposed to temperatures below 0 °C, information about its frost resistance becomes important. The frost resistance of rocks is primarily dependent on its pore space characteristics: pore volume, surface area, and pore size distribution [3]. The pore space characteristics determine the amount of water and the temperature at which phase transition takes place. One should bear in mind that rock materials are characterized by numerous varieties with individual physical and mechanical properties. They may differ significantly in the properties of their pore spaces, due to significant differences in the diagenesis process among not only one rock type but also rocks from one quarry [4,5,6]. For this reason, the possibility of using rocks from a given deposit should always be considered.
The water freezing process is controlled by two processes:
- The first of them is spontaneous nucleation. When the temperature is lowered below the phase transition temperature, liquid water does not immediately undergo a phase change. In supercooled water, small clusters of water molecules appear, forming the basis for crystal-initiating nuclei (homogenous nucleation) [7]. The spontaneous phase transition begins when the nuclei of the new phase reach a critical size “r*” [8,9]. In a water-filled pore, ice can only appear if the critical diameters of the nuclei are not larger than the pore diameter.
The critical size of the nuclei decreases as the temperature decreases. As the temperature decreases below the phase transition temperature, the difference between the free energy of liquid water and ice (ΔG) based on bulk conditions (ignoring surface free energy) increases providing an ever-higher driving force for the transition. The probability of the appearance of ice in super cooled water is more likely the larger are the volume of free water and the lower the temperature compared to 0 °C. As Kozłowski [10] showed, the temperature of the spontaneous nucleation is a random phenomenon, unique even for the same system of physical and material factors.
- The second mechanism controlling the freezing process is derived by penetration of the ice front in pore spaces [11]. By removing energy from the system, an increasing volume of water gradually freezes. The freezing process of pore liquid after spontaneous nucleation is dependent on the liquid–ice interface and ice–gas interface [12,13,14]. When there is only liquid and solid water in the pores, the following equation can be used:where: rK is the solid–liquid surface curvature; M is the molar mass of the liquid; Θ is the contact angle; ΔHfus is the heat of fusion; ρl is the density of liquid; T is the temperature of phase transition; and T0 is the phase transition temperature of the bulk liquid.
The freezing of water in pores is determined by pore interconnections and pore sizes [15,16]. This statement is in agreement with the research results of Morishige et al. [17], who studied the freezing and melting of water in mesoporous silica. They performed tests on two types of samples. In the first case, when pores of 10 nm and 17 nm were connected by interconnections with a diameter of approx. 4 nm, water freezing in pores larger than 4 nm occurred at approx. −41 °C. However, for the second case, when solidification and melting were studied in samples whose interconnections had diameters larger than 4 nm, exothermic effects occurred in a wider temperature range. For both cases, ice melting occurred in the temperature range from −13 °C to −7 °C and was independent of the radii of interconnections between pores and depended only on the internal radii of the pores [17].
A commonly used standard method for assessing the frost resistance of rocks is to subject them to freeze–thaw cycles and assess changes in their compressive strength, mass loss, and linear changes [18,19,20]. Important information on pore size distribution is also provided by the MIP method, supplemented by water absorption and capillary rise tests. In the case of the frost degradation process, methods based on weight loss, dynamic elastic modulus (by measuring the fundamental resonance frequency), compressive strength, visual inspection, and absorption measurements are primarily used. According to the standards [18,19,20] (slabs, setts, and curbs of natural stone for external paving), the absorption by weight for rocks should not exceed 3%, with a recommended absorption criterion of less than 0.5% [21,22]. The Polish standard [23] for external plinth slabs specifies the maximum permissible water absorption values by weight as 0.5% for granites, 1% for syenites, and 2% for sandstones. Standard guidelines [18,19,20,23] are based on limiting water absorption or specifying the maximum value of the decrease in mechanical properties in cyclic freeze–thaw tests; they do not take into account methods based on the phase change process. The recommended determination of frost resistance by performing 56 freeze–thaw cycles [18,19,20] may be not sufficient. As research by Martínez-Martínez et al. [24] shows, it may be necessary to perform more cycles than 56 to demonstrate differences in the frost resistance of rocks. Investigations in the case of rocks with above 10% open porosity values demonstrate that these rocks show a non-linear decay pattern, with long periods of apparent stability followed by rapid and catastrophic decay [24]. As Wessman [25] shows, for sandstones with porosity above 15%, destruction processes are observed already in the first freeze–thaw cycles. However, in the case of limestone and granite with porosity up to 4%, no damage was observed after 56 cycles [25]. As shown by the studies [26,27] for samples with porosity higher than 8.6%, there were significant changes in the mechanical properties and pore size distribution after the first few freeze–thaw cycles. Research by Nicholson et al. [28] shows that porosity under 2% can guarantee sufficient frost resistance. However, in the case of samples with porosities greater than 6%, there were those with good and poor frost resistance [28]. Research by Momeni et al. [29] shows that samples with porosity not exceeding 2% are characterized by a slight decrease in mechanical properties even after 300 freeze–thaw cycles. Benavente et al. [30] in their research on samples with porosity between 13 and 22% observed better frost resistance for rocks with greater water permeability, larger pore diameter, and smaller specific surface area.
Phase transition testing can be the basis for determining the frost resistance of rocks [4,31]. As Rusin et al. [32] show, rocks with capillary absorption above 1.5% are not frost resistant. In the case of rocks with absorption between 0.6 and 1.5%, the capability of water to freeze down to −10 °C takes a crucial role.
Additionally, the phase transition can be studied using dilatometric methods, and nuclear magnetic resonance (NMR) techniques [33,34,35].
An alternative to the above tests is the differential scanning calorimetry method and its use in thermoporometry research (TMP) [12,36,37]. Based on thermograms of heat released/supplied to the system, not only the ice content at specific temperatures can be calculated, but also the pore size distribution. The relationship between the temperature of phase transition and the pore radius in which the transition takes place is studied in several publications [12,17,36]. Differential scanning calorimetry was used in a variety of investigations for pastes or mortars [15,38,39,40], but it is not a typical method for testing rocks.
Despite general agreement on the high frost resistance of rocks with low porosity and water absorption, questions remain as to the factors influencing frost decay, especially in the porosity range between 2 and 12%. Therefore, in this paper the freezing and melting processes were examined for 7 rock specimens with porosity above 2% and three rocks with porosity below 2% (for comparison). The research in this article focused on using the thermoporometry method (TMP) and the designation and assessment of water phase transition in the pore space of selected rocks. Importantly, the calculations additionally took into account the inertia of the system. The algorithm described in the paper [41] was used to analyze the thermograms. This algorithm makes it possible to take into account the influence of the thermal inertia of the differential scanning calorimetry measurement system (DSC) on the recorded signals, for the part related to the melting of ice. The pore size distributions determined by the mercury intrusion porosimetry method (MIP) and the thermoporometry method (TMP) were compared. The pore size distributions obtained in this way from the MIP and TMP techniques were compared with the results of cyclic freeze–thaw tests, which enabled a more complete analysis and assessment of the frost resistance of the tested rocks. The article draws attention to the possibility of a broader analysis of phase changes in rocks based on the results of research using the DSC and TMP methods.
2. Materials and Methods
2.1. Materials
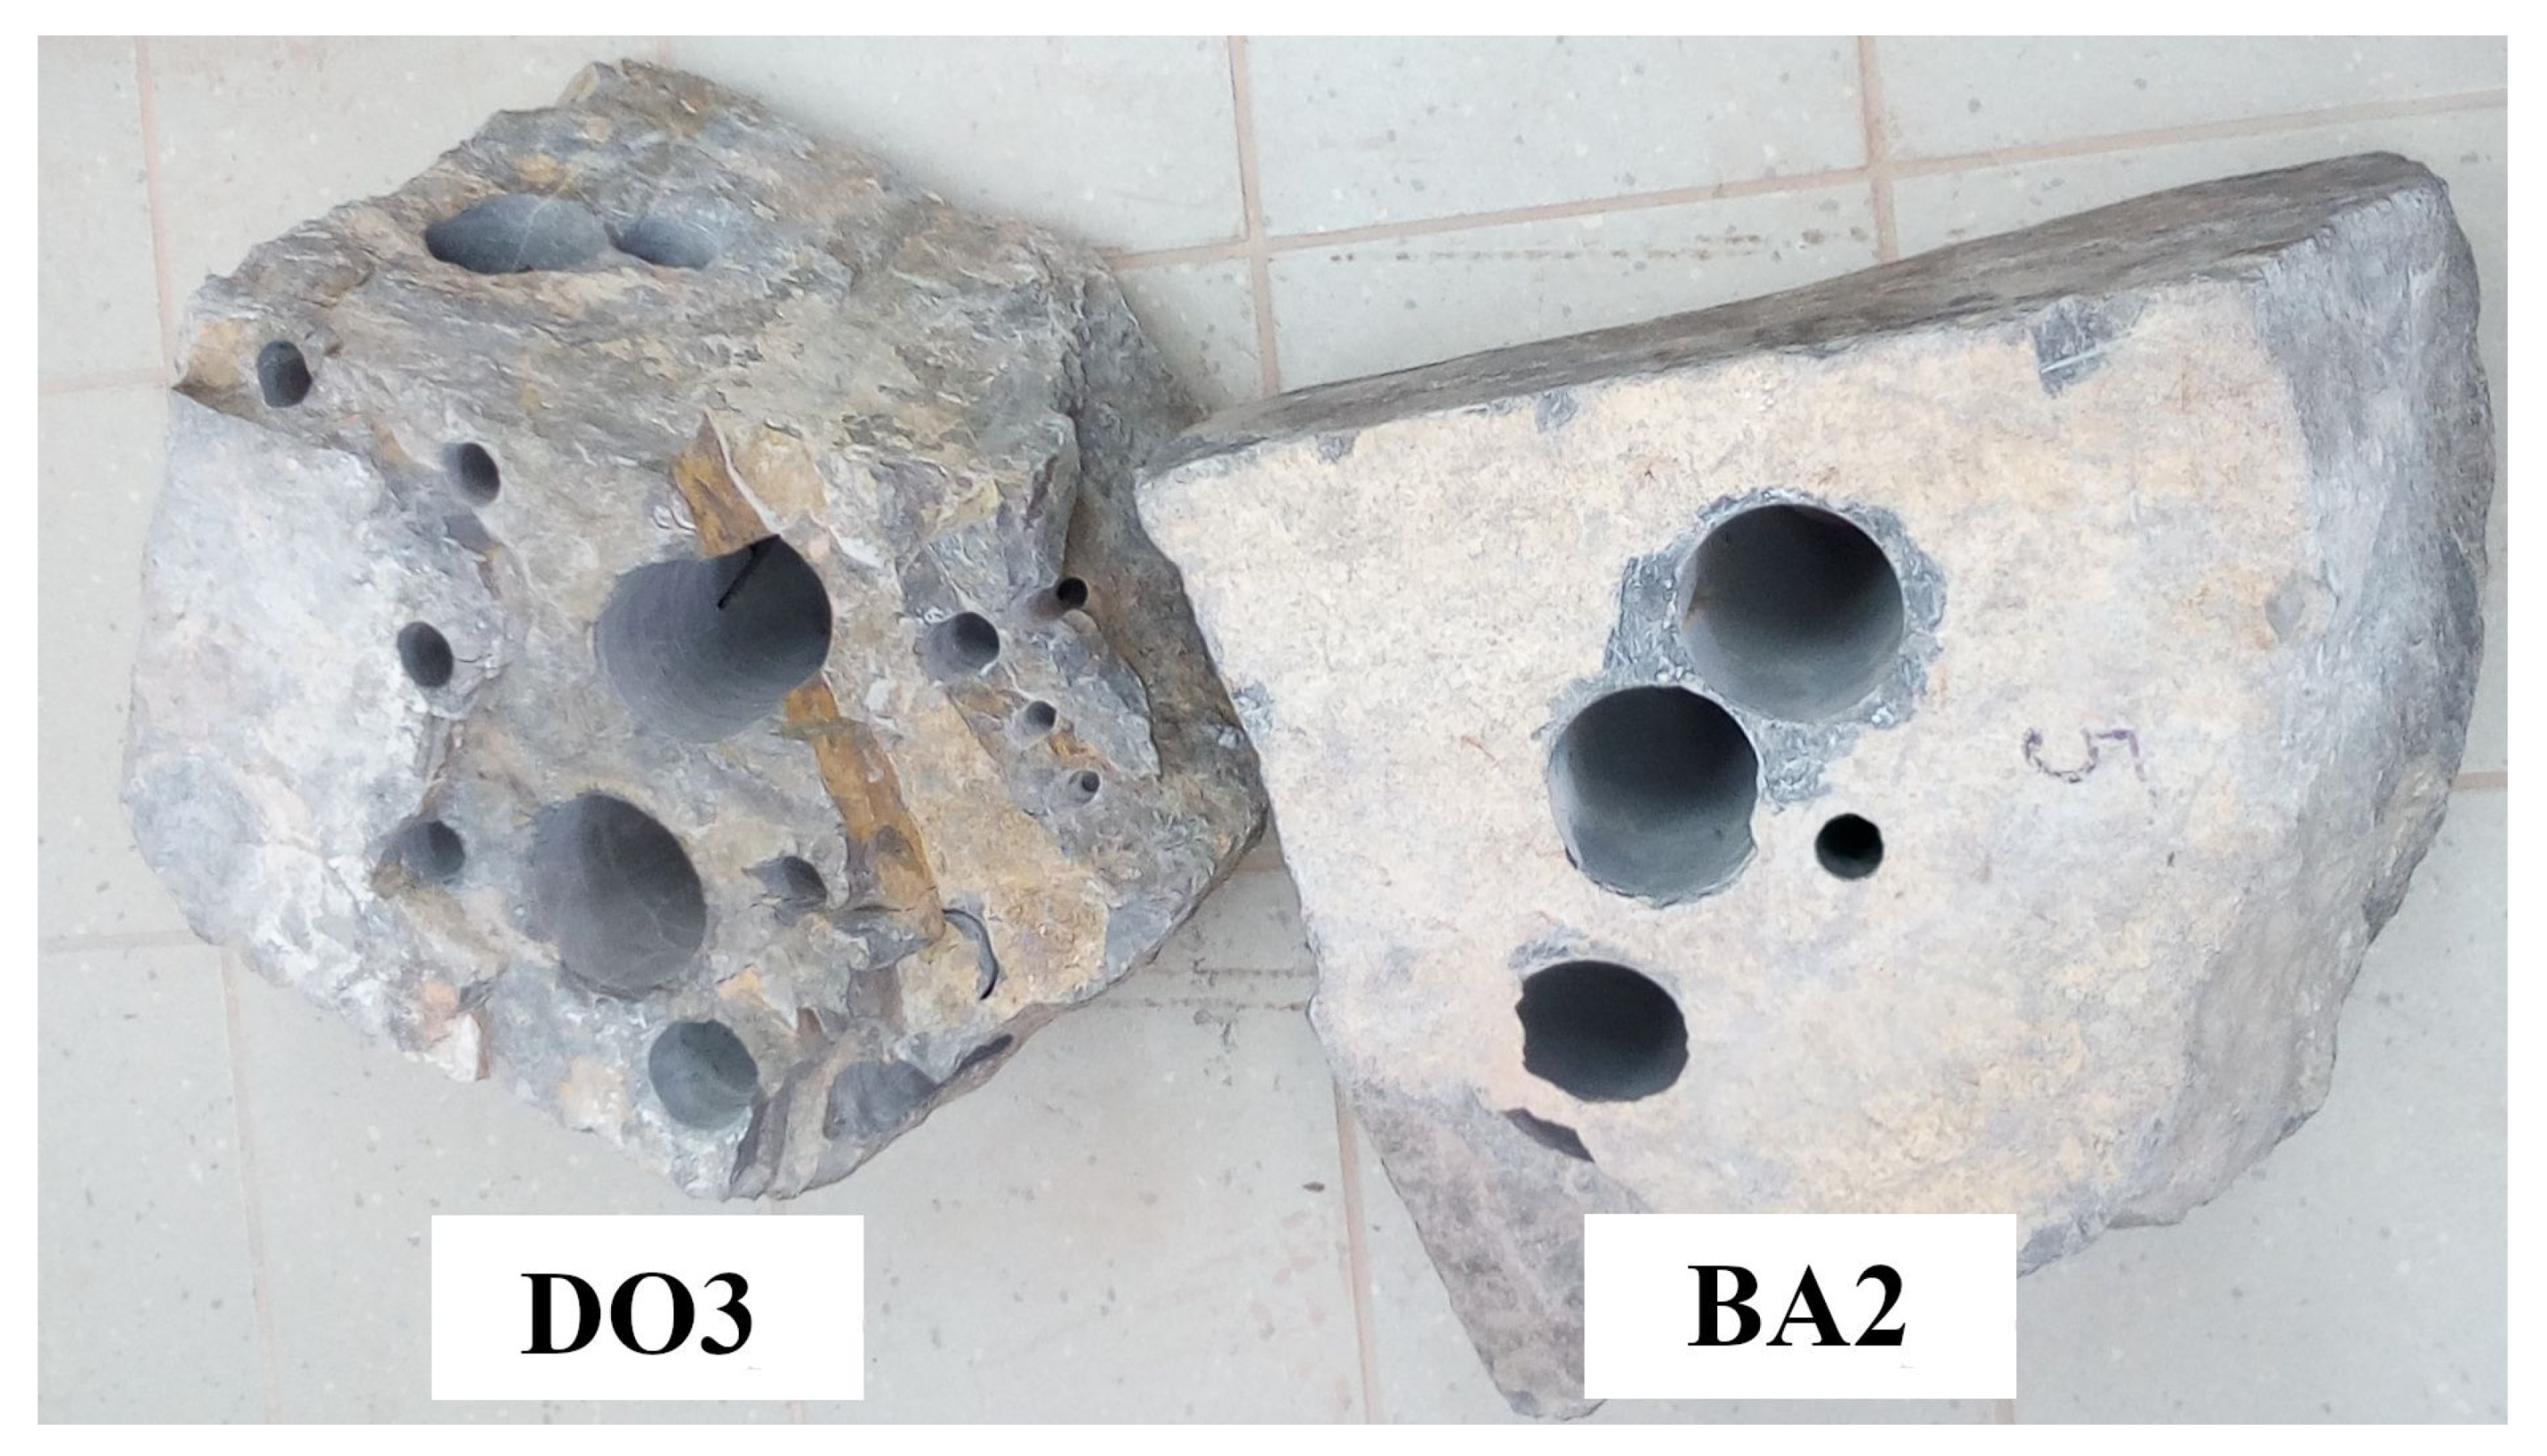
The research was performed on 10 rocks from different quarries. The designation and type of rocks are given in Table 1. The samples were drilled from one piece of rock, which eliminated the influence of differences in rock parameters from one deposit (see Figure 1).

Table 1.
Types of rocks.
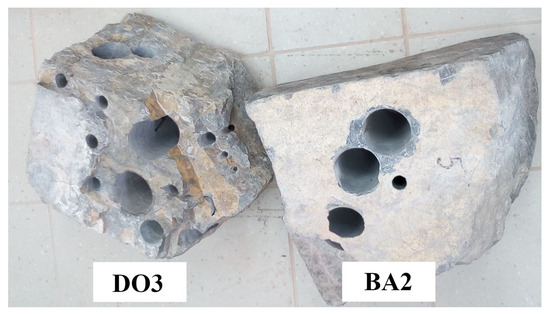
Figure 1.
View of sample DO3 and BA2.
Sample LIM1 comes from the Paleozoic core of the Świętokrzyskie Mountains (Poland), which formed in the Devonian period, while samples LIM2, LIM3, and LIM4 come from the southern and southwestern Mesozoic fringe of the Świętokrzyskie Mountains from the Jurassic period. The dolostones come from the Devonian period (Świętokrzyskie Mountains); DO1—the northwestern edge of the mountains, DO2 and DO4—the southwestern edge of the mountains, and DO3—the eastern edge of the mountains. The basalts (BA1 and BA2) come from the Fore Sudetic Block (Lower Silesia, Poland).
2.2. Differential Scanning Calorimetry (DSC)
Samples were core-drilled from rock specimens. The tests were conducted on cylindrical samples 13.5 mm in diameter and 70 mm in height. Before testing, the samples were dried at a temperature of 105 °C and saturated using the vacuum method with degassed distilled water. Thermal signals during cooling and heating were recorded using a BT 2.15 CS differential scanning calorimeter (SETARAM). The scanning program included cooling the sample from +20 °C to −80 °C, then after half an hour of stabilization at −80 °C, the sample was heated again to +20 °C. The scanning rate was 0.09 °C/min.
2.3. Mercury Intrusion Porosimetry (MIP)
After DSC tests, the samples were used for mercury intrusion porosimetry research (sample dimensions: 2.0 cm long, 1.4 cm diameter). Before testing, the samples were dried to a constant weight at 105 °C. The samples were then cooled to 20 °C in a desiccator. Pore size distribution, porosity, density, and bulk density were tested in an AutoPore IV model 9500 mercury porosimeter. Before testing, the samples were weighed and placed in the low-pressure port. The test included: (1) creating a vacuum in the penetrometer with the sample to the level of 2.6 Pa (20 μm Hg); (2) pouring mercury into the sample; (3) gradually increasing the pressure to 414 MPa while the apparatus measures the amount of mercury pressed; (4) gradually reducing the pressure to ambient values while the apparatus measures the amount of mercury exiting. For the calculations, the contact angle for mercury ϴ equal to 130° and the surface tension γi equal to 0.485 N/m were assumed.
2.4. Frost Resistance Test
Rock samples for direct frost resistance tests with a diameter of 50 mm and a height of 160 mm were cut from one block of rock. Depending on the availability of rock samples, two or three samples were prepared for each rock. Samples were vacuum saturated with degassed distilled water. Specimens were subjected to 100 freeze–thaw cycles. A chamber with a programmable cycle was used for the tests. A single cycle included: cooling in air from +20 °C to –20 °C for 5 h, then heating in water at +20 °C for 3 h (the temperature sensor was located between the samples). After each block of 10 cycles, the sample mass and length change were measured, and visual damage was evaluated. Before weighing, the samples were removed from the water and wiped with a damp rubber. Length changes were determined by the Graf–Kaufman apparatus (each sample was equipped with measuring pins). The visual assessment of the samples was to determine any cracks, scratches, and damage.
3. Results and Discussion
3.1. Results of Differential Scanning Calorimetry Research and Thermoporometry Method
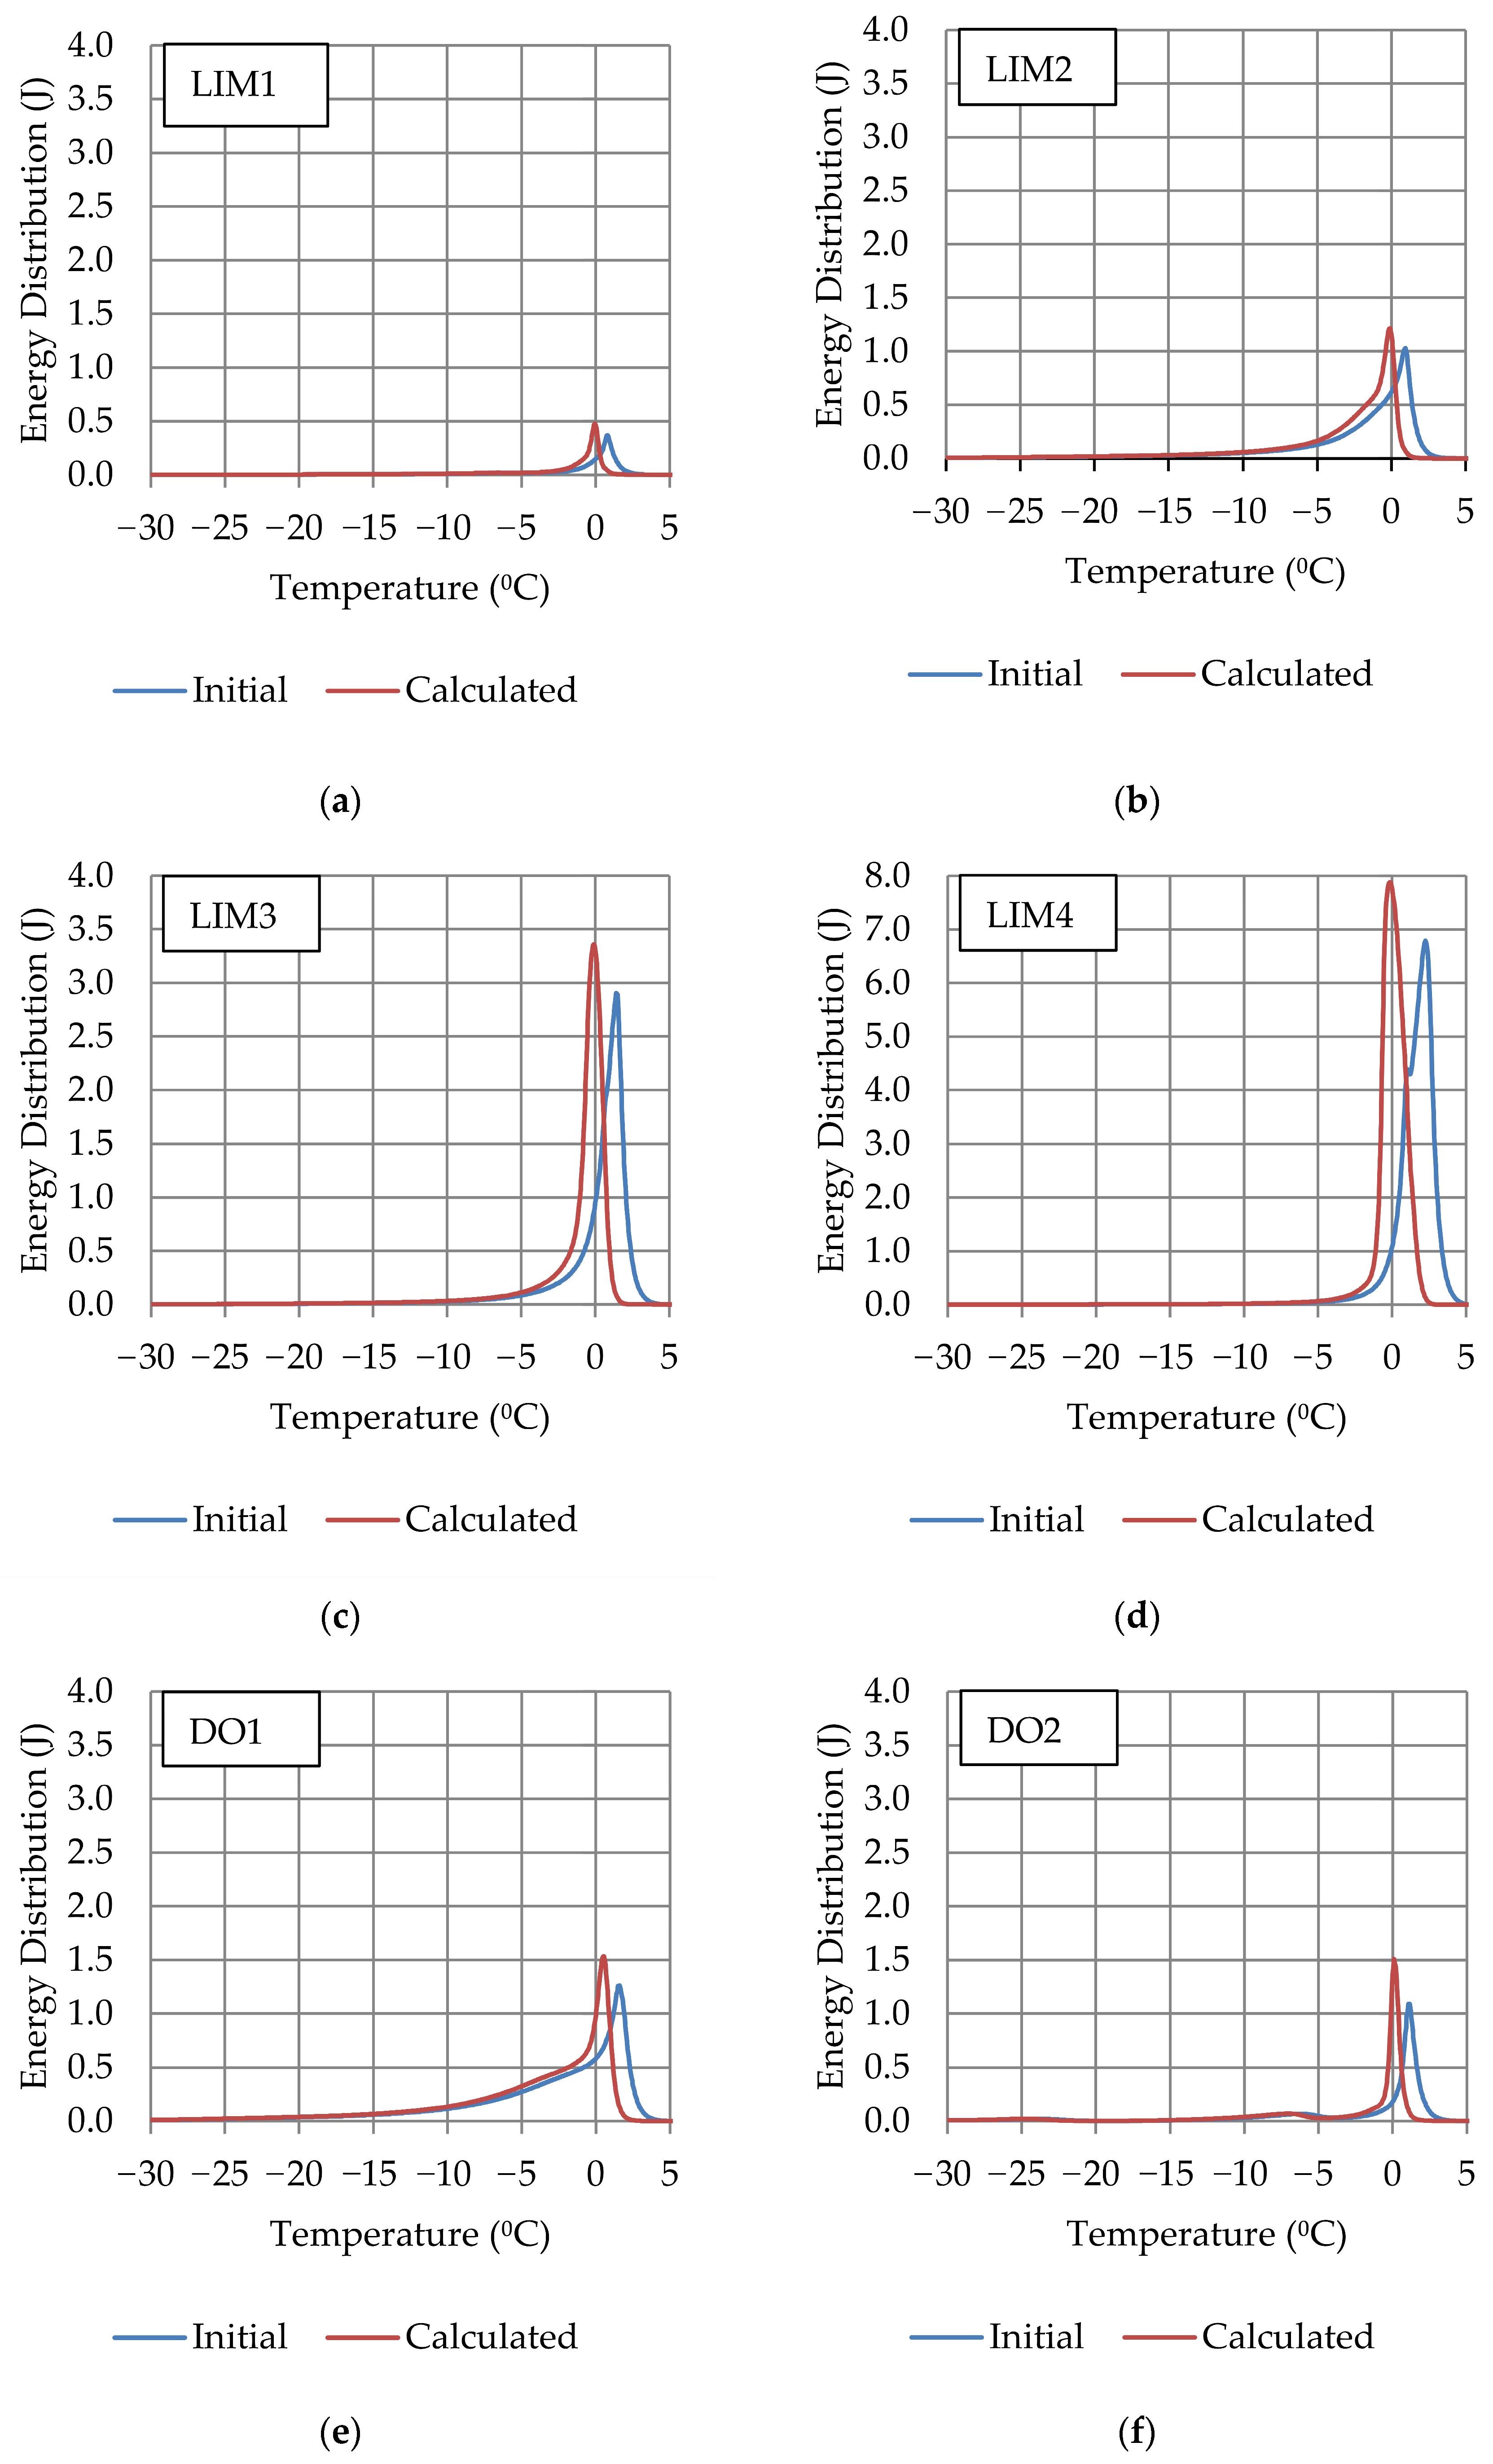
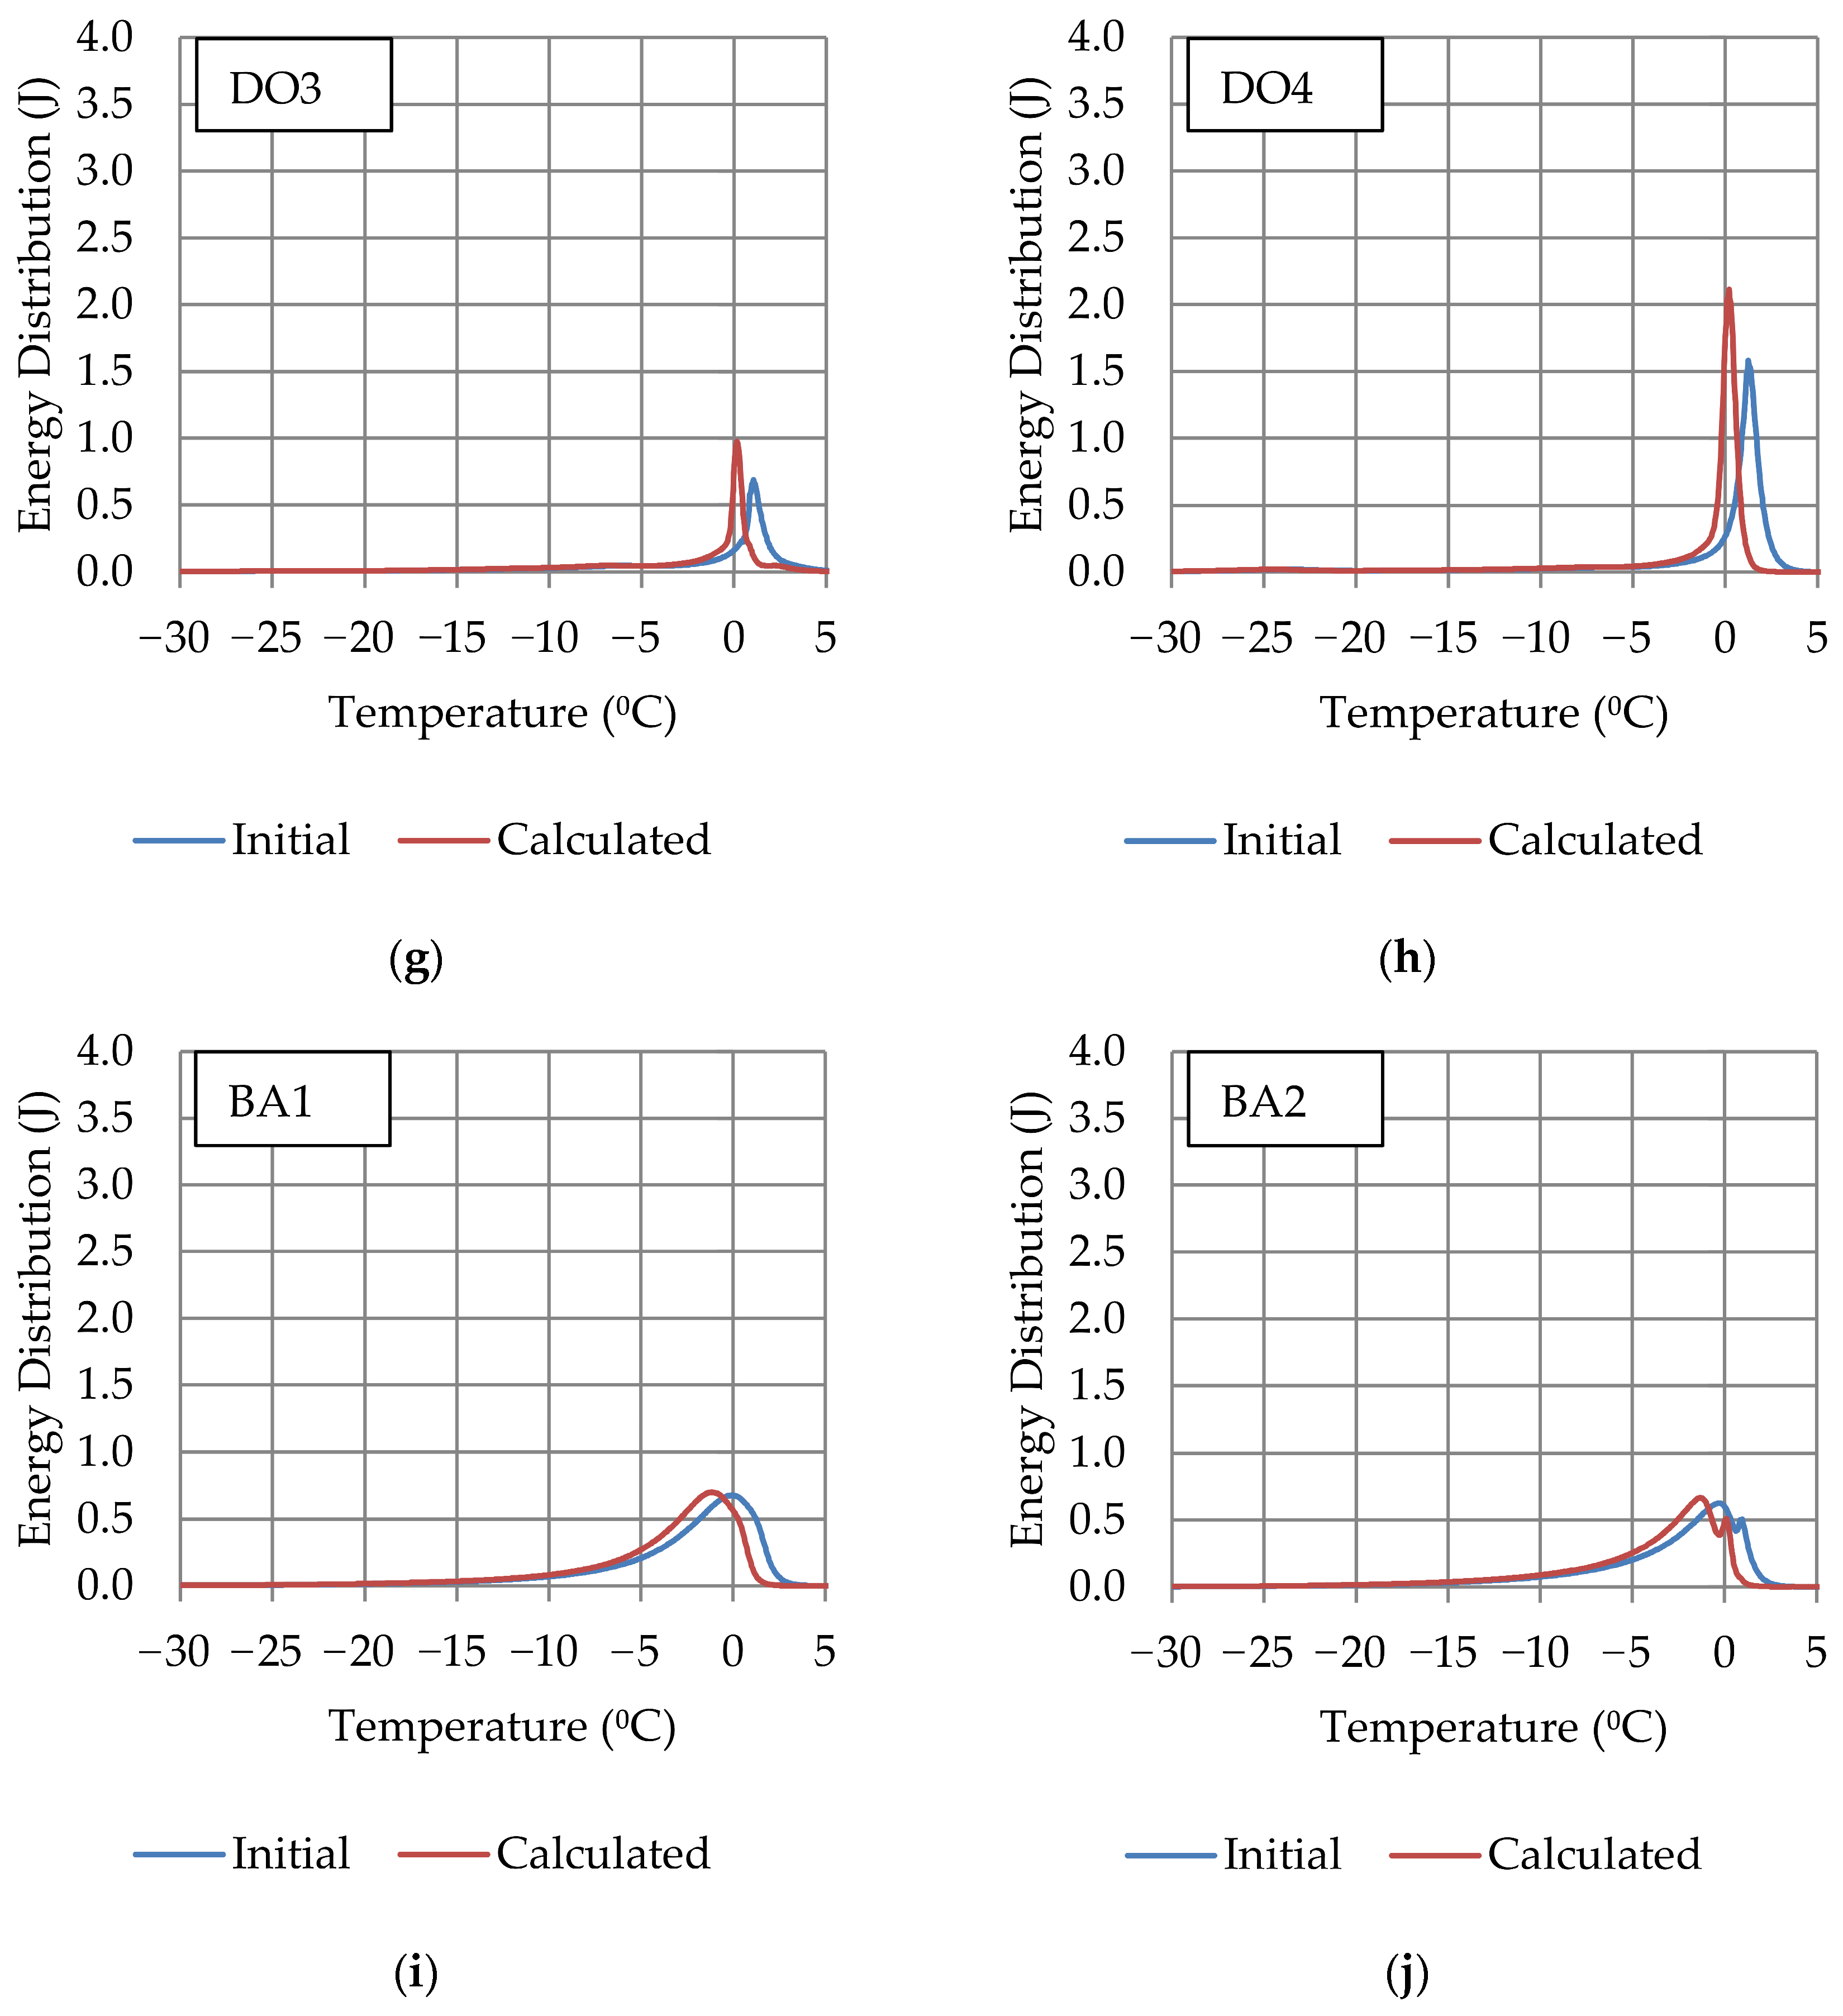
The phase change of water was examined using a differential scanning calorimeter. Of the obtained heat fluxes, the part related to the phase change of water and ice was separated. The recorded exothermic (during water freezing) and endothermic (related to ice melting) thermal effects were shifted due to the calorimetric measurement system’s inertia. For the endothermic part of the phase change energy distribution (related to the ice melting for the heating stage), the thermal inertia of the apparatus was taken into account using the algorithm described in the paper [41]. The exothermic part of the heat flows was left unchanged due to the initial stage of freezing. The energy distributions calculated by the above method are presented in Figure 2 (blue curve “initial”—energy distribution obtained directly from calorimetric measurements; red curve “calculated”—energy distribution obtained with algorithm taking account system thermal inertia).
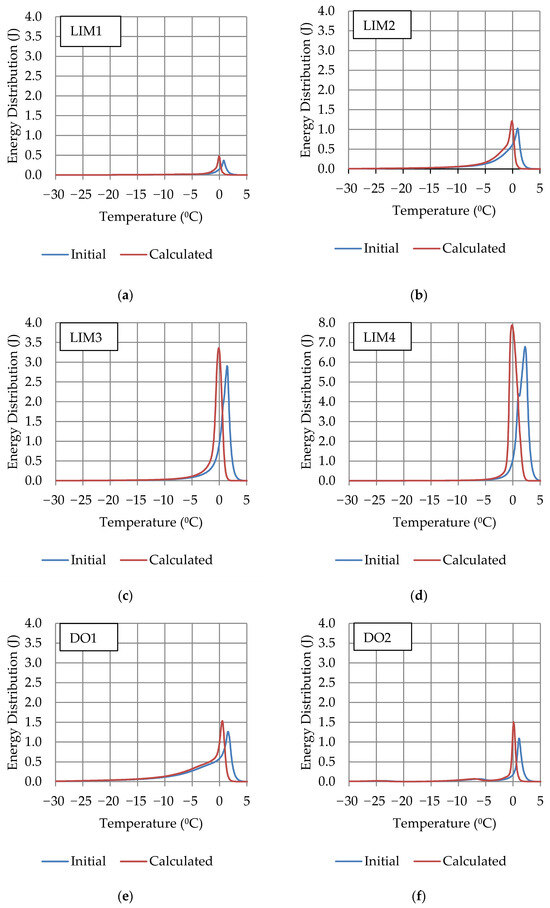
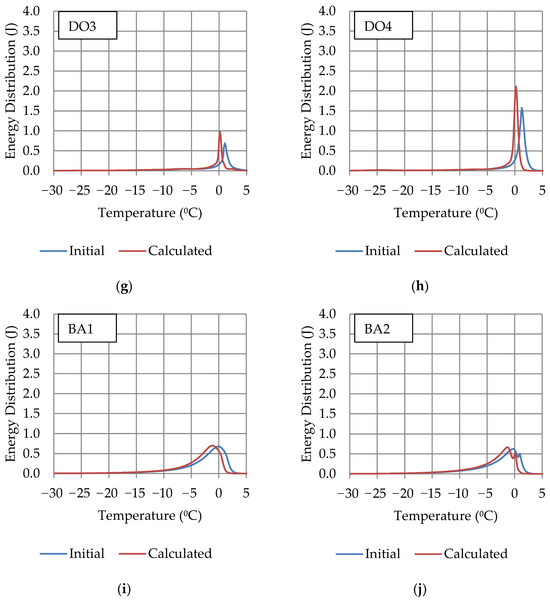
Figure 2.
Energy distribution of samples: (a) LIM1; (b) LIM2; (c) LIM3; (d) LIM4; (e) DO1; (f) DO2; (g) DO3; (h) DO4; (i) BA1; and (j) BA2.
Taking into account the inertia of the system (red line), we can better assign the phase transition energy to the temperatures at which it occurred. As a result, it is possible to estimate the pore size distribution in the tested material more precisely, which is a valuable justification and supplementation of knowledge about the frost resistance of rocks.
For further analysis, the energy distributions for the endothermic and exothermic parts were divided as follows (see Figure 3):
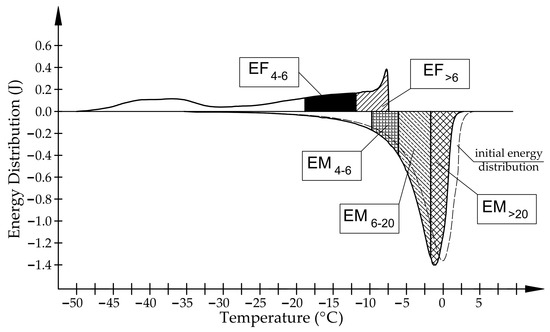
Figure 3.
Energy distribution of phase transition for the BA1 sample.
EF>6 is the total energy corresponding to the freezing of water in pores with a radius above 6 nm, according to Equation (1).
EF4–6 is the total energy corresponding to the freezing of water in pores with a radius of 4 to 6 nm, according to Equation (1).
EM4–6 is the total energy corresponding to the melting of ice in pores with a radius of 4 to 6 nm, according to Equation (2).
EM6–20 is the total energy corresponding to the melting of ice in pores with a radius of 4 to 6 nm, according to Equation (2).
EM>20 is the total energy corresponding to the melting of ice in pores with radii above 20 nm, according to Equation (2).
For the relationship between the phase transition temperature and the radius of the pore (rp) in which this transition occurs, we applied the equation determined by Brun et al. [12].
where ΔT is the phase change temperature shift (ΔT = T − T0); T is the temperature of phase transition; and T0 is the phase transition temperature of bulk liquid (T0 = 0 °C).
The energies divided in this way are shown in Figure 4.
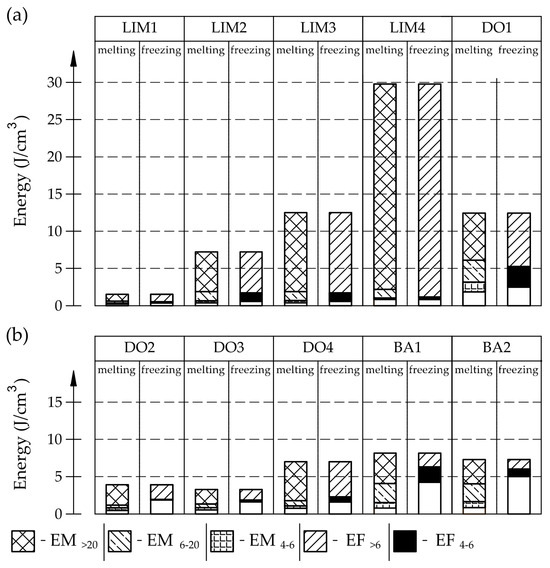
Figure 4.
Energy values in particular intervals expressed per 1 cm3 of the sample mass: (a) dates for LIM1–LIM4 samples; (b) dates for DO1–DO4, BA1, and BA2 samples.
In the case of basalts, the phase transition occurs in a much different way in comparison to the investigated carbonate rocks. There are significant shifts of the recorded signals related to water freezing to temperatures below −20 °C, potentially caused by the influence of interconnections on the freezing process.
3.2. Comparison Results of Differential Scanning Calorimetry Method and Thermoporometry with Results of Mercury Intrusion Porosimetry Method and Frost Resistance Test
Physical properties (bulk density, density, and porosity) of tested samples determined based on MIP are provided in Table 2. The bulk density of samples was in the range from 2.44 g/cm3 to 2.81 g/cm3, and density in the range from 2.70 g/cm3 to 2.94 g/cm3. The porosity of three rocks was below 2%; for others it was at least 2.59%.
Table 2.
Results of bulk density, density, and porosity tests of rocks based on MIP tests.
Based on the tests conducted, it can be observed (see Figure 3 and Figure 4) that in the case of the examined igneous rocks (BA1, BA2), the way of freezing was significantly different from the way of water freezing in the pore space of carbonate rocks (LIM1–LIM4, DO1–DO4). More than 50% of water does not undergo the freezing phase change when the temperature decreases to −18 °C. Based on the pore size distribution from the MIP study and the endothermic part of the ice melt signals, at least 80% percent of the water should freeze (for the studied igneous rocks). In the case of limestone, the recorded amount of energy corresponding to the phase transitions of water at freezing in the pores bigger than 6 nm is similar to the amount of energy corresponding to the melting of ice (see Figure 3).
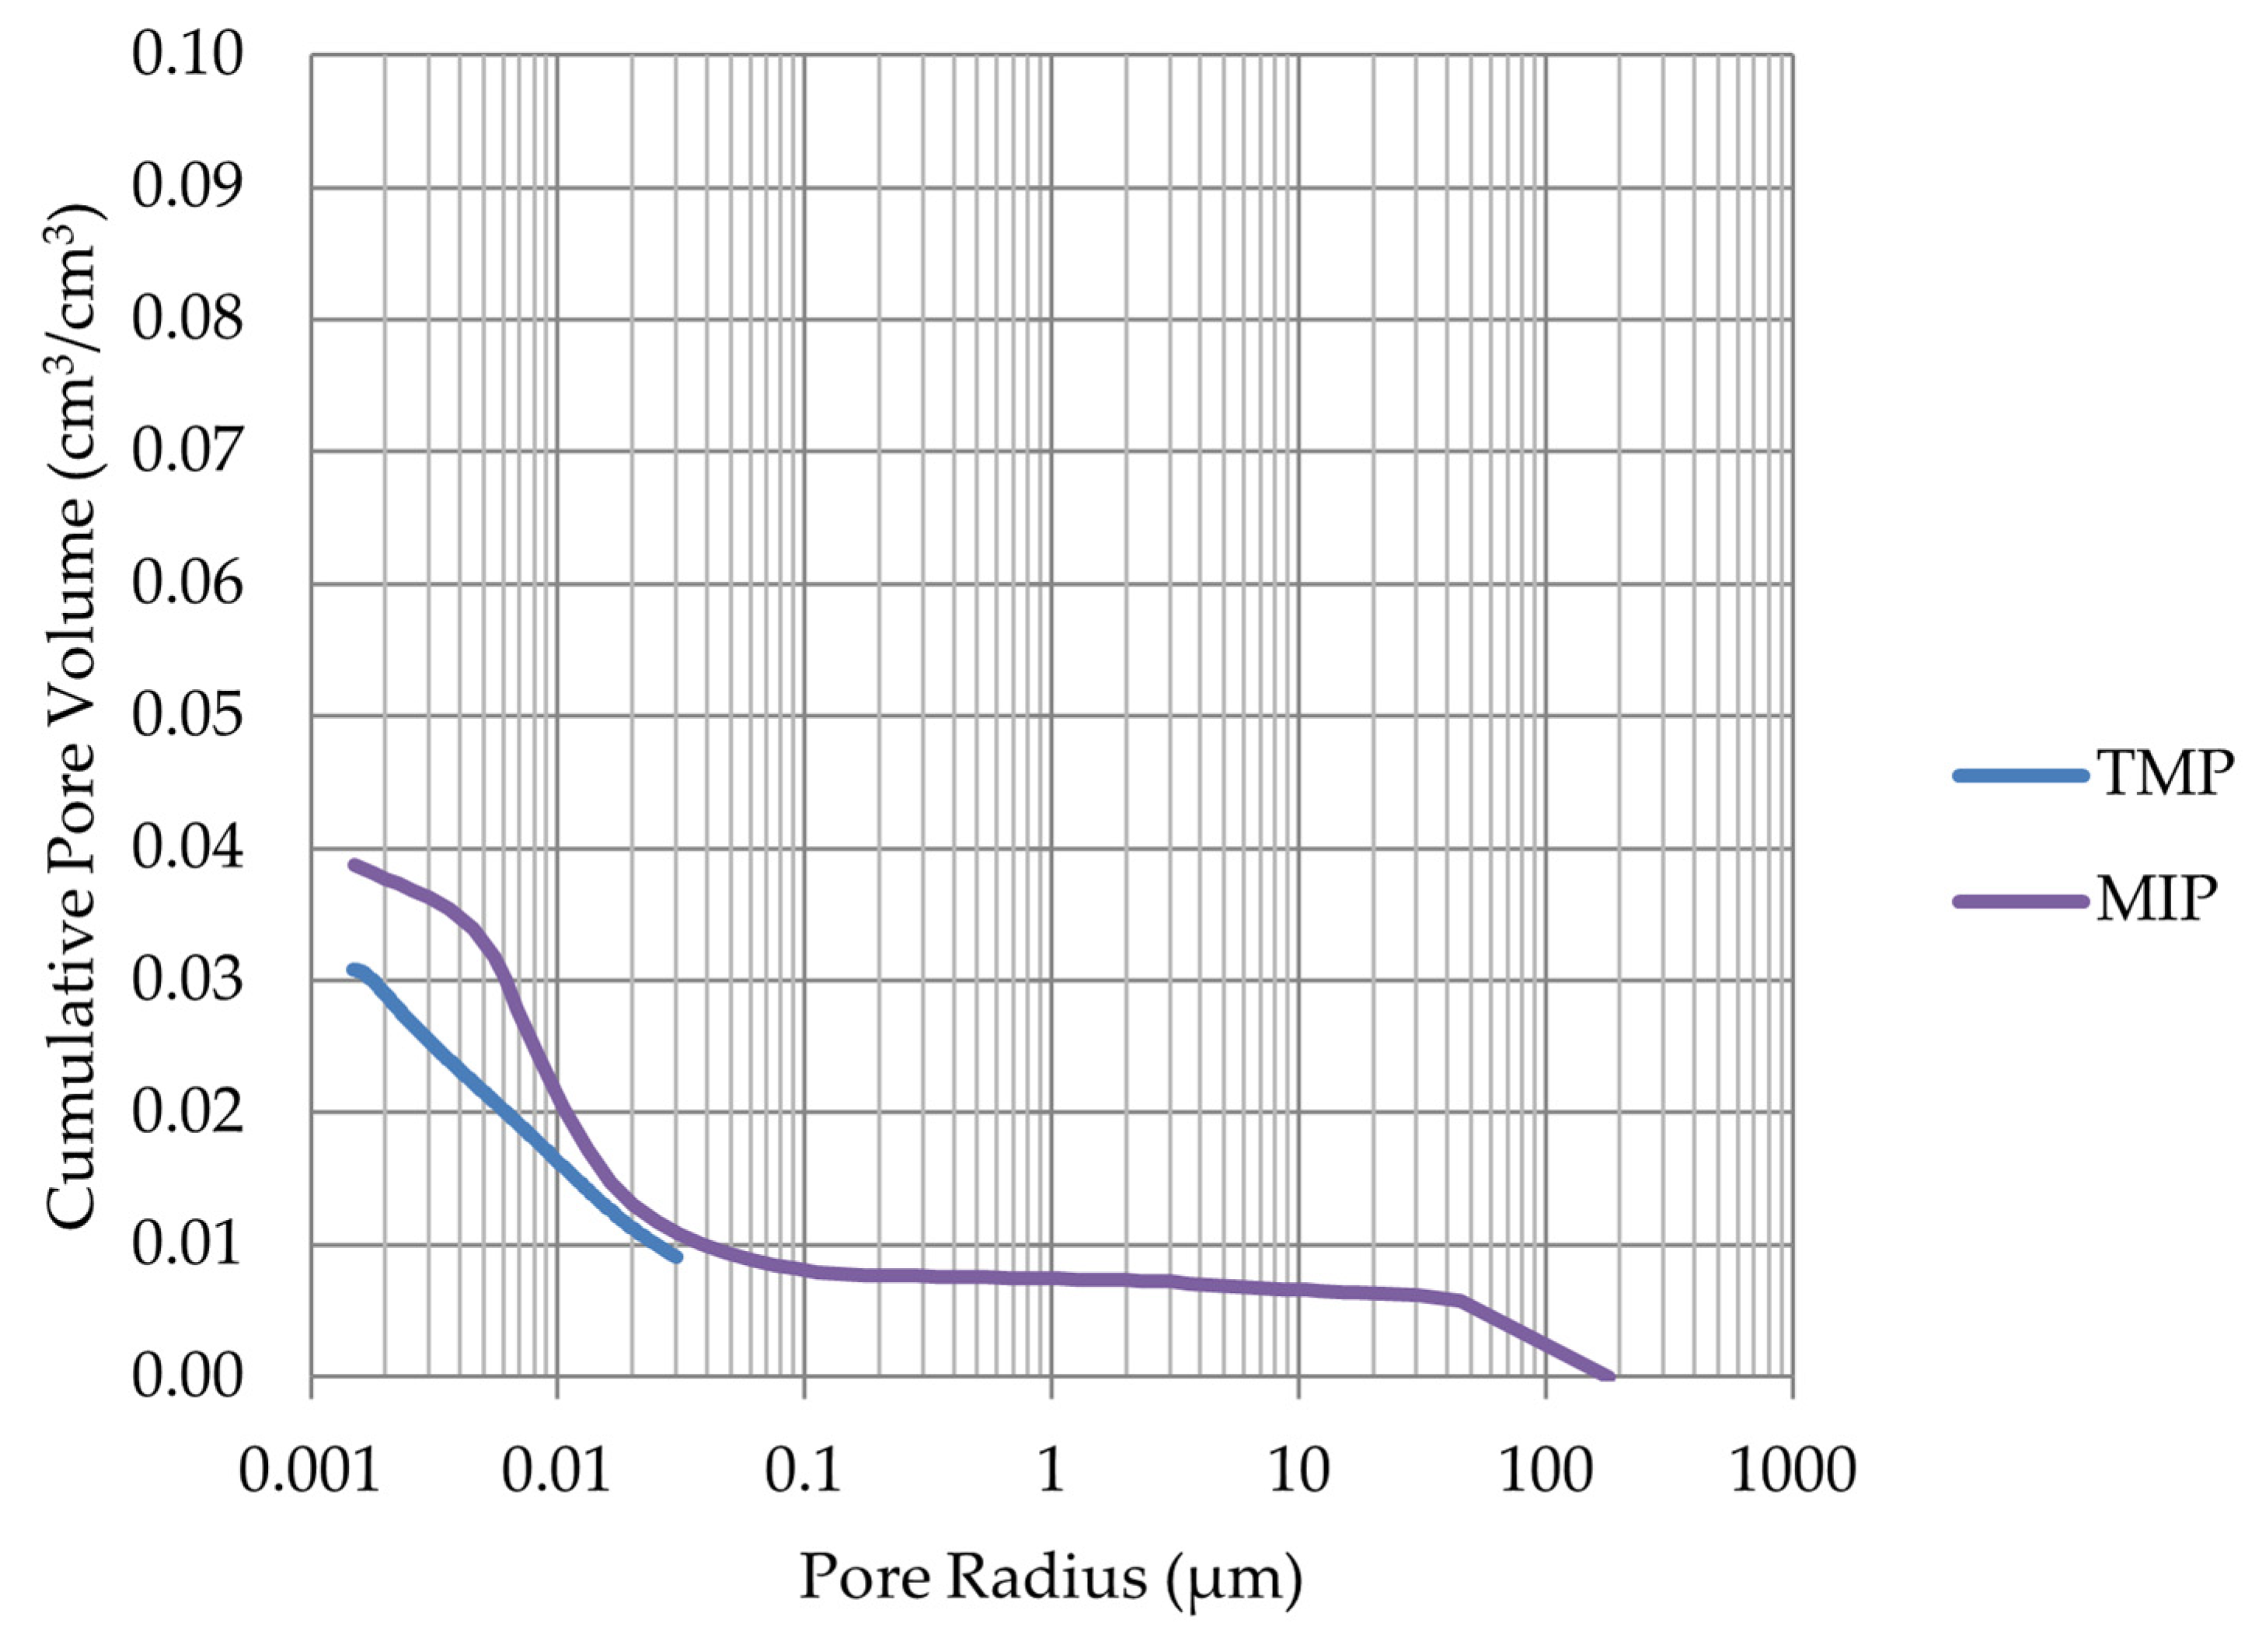
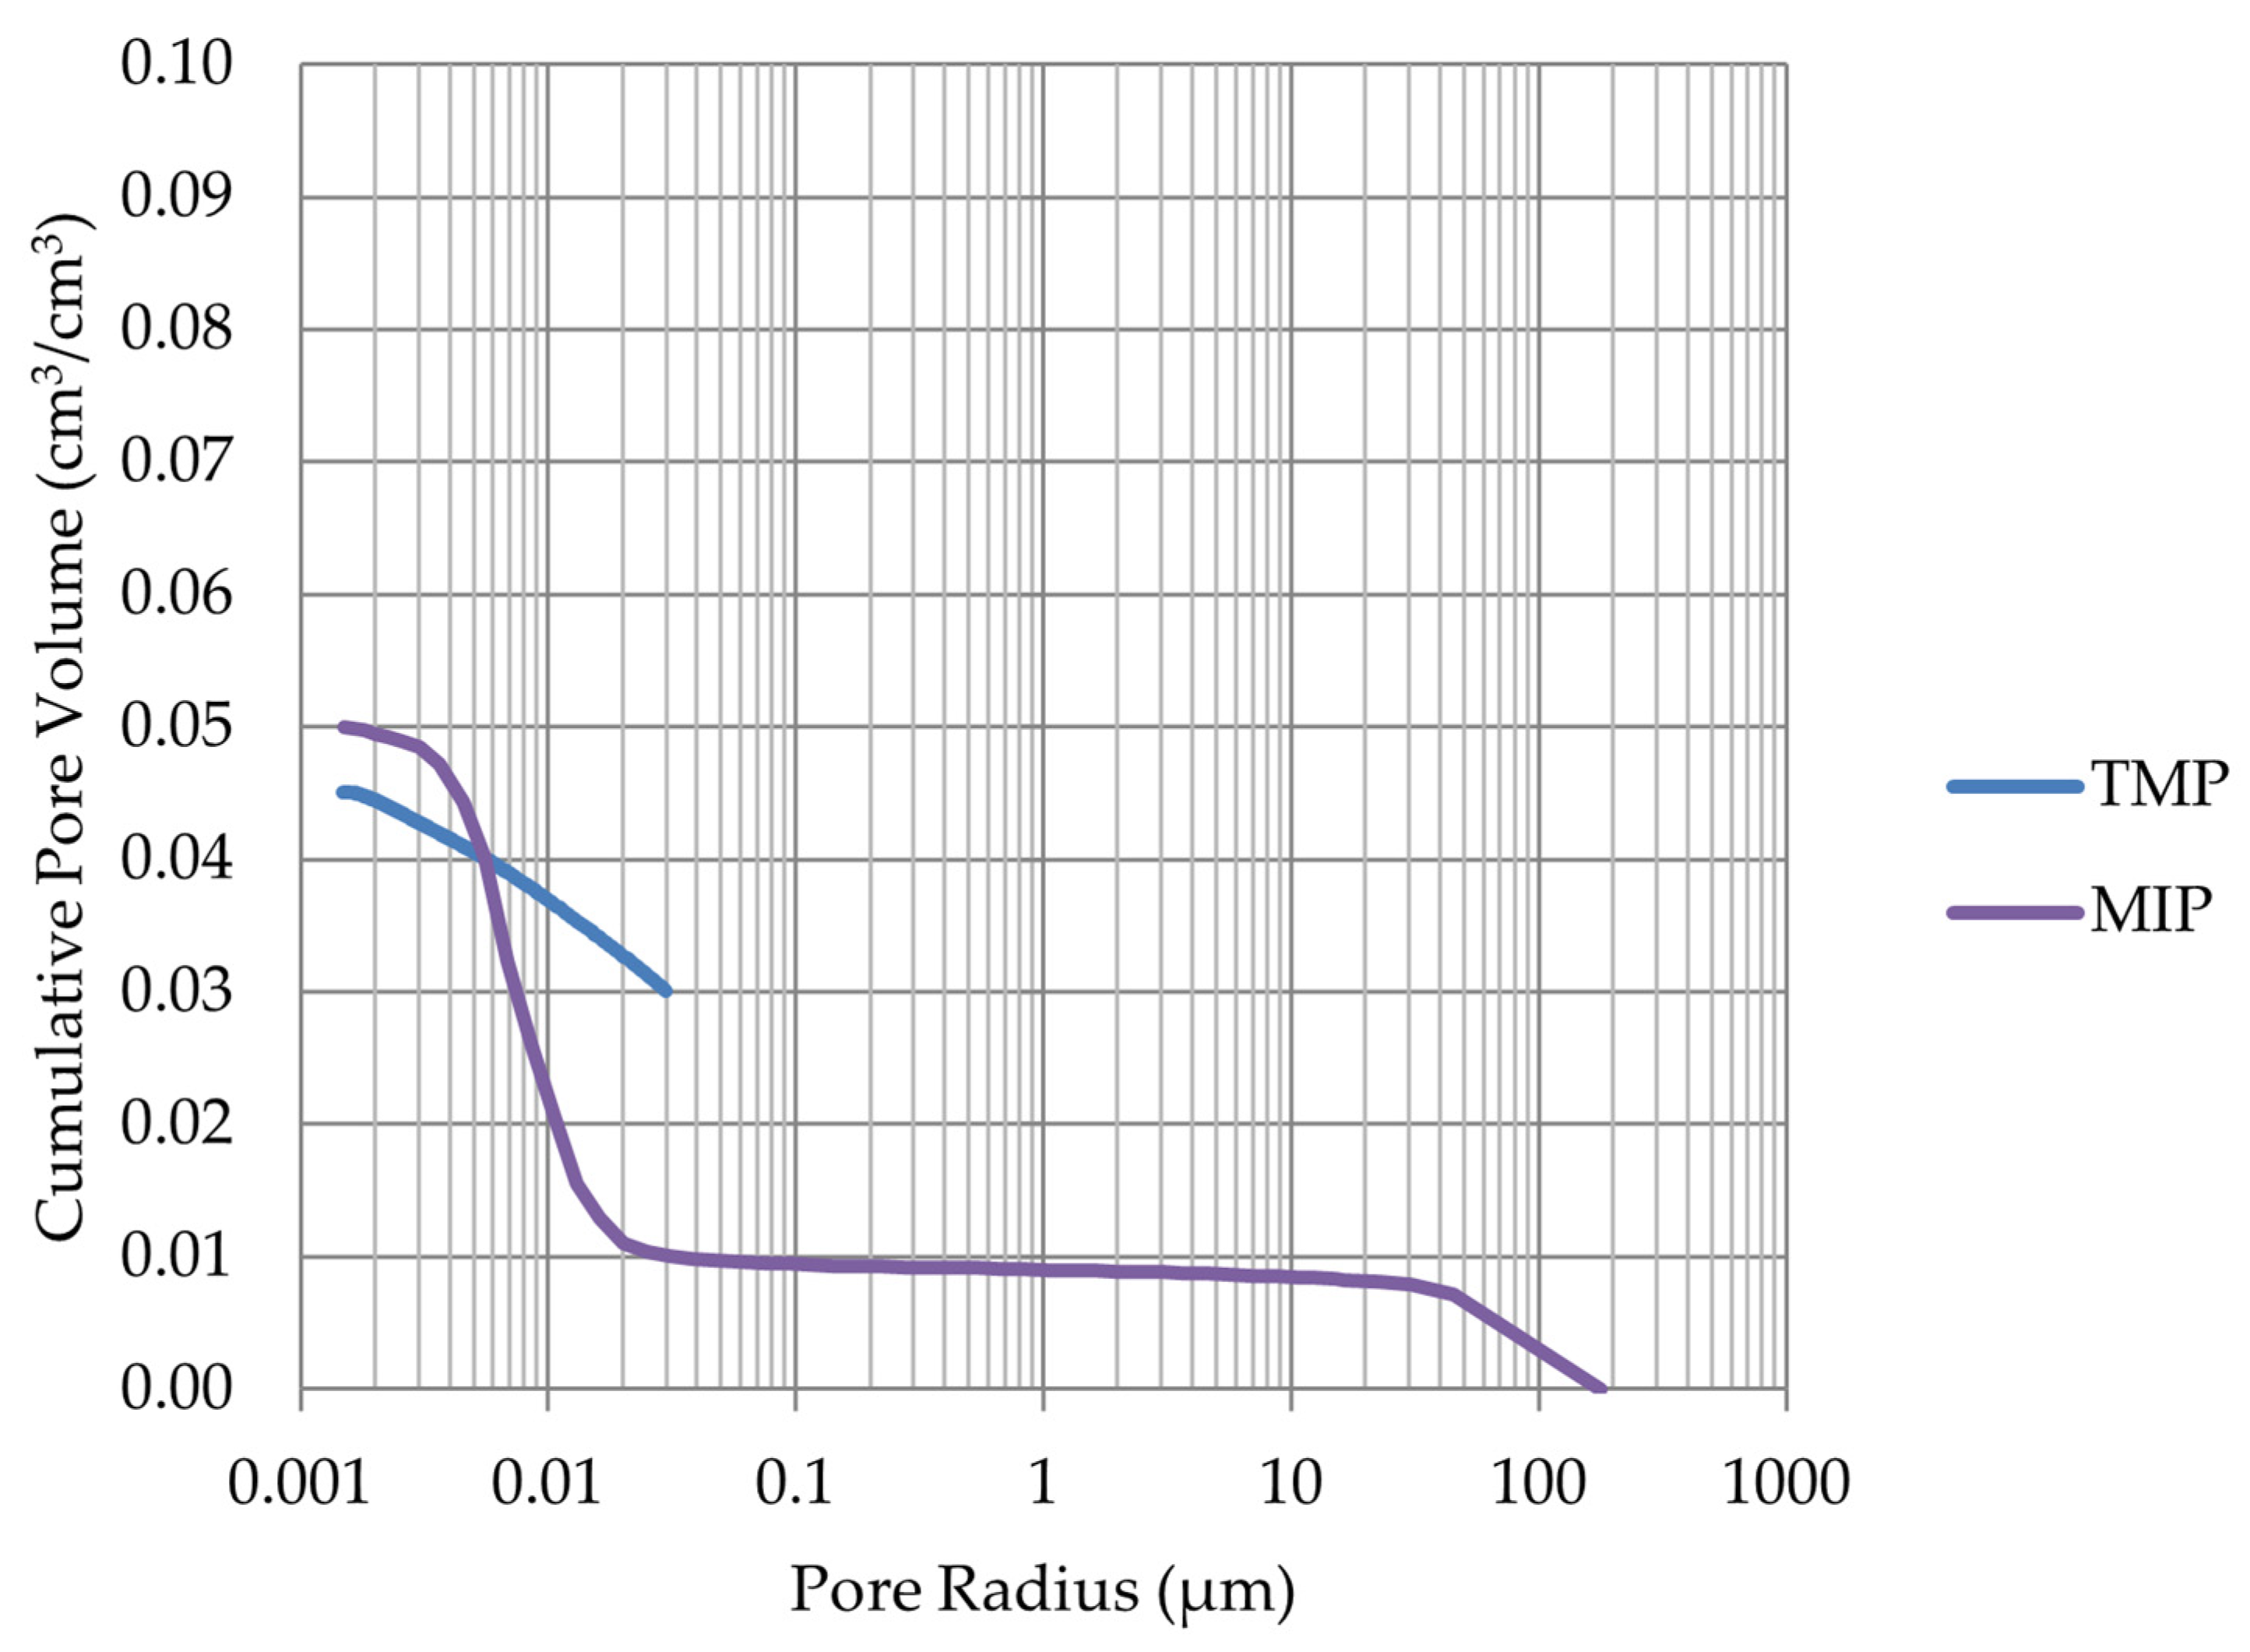
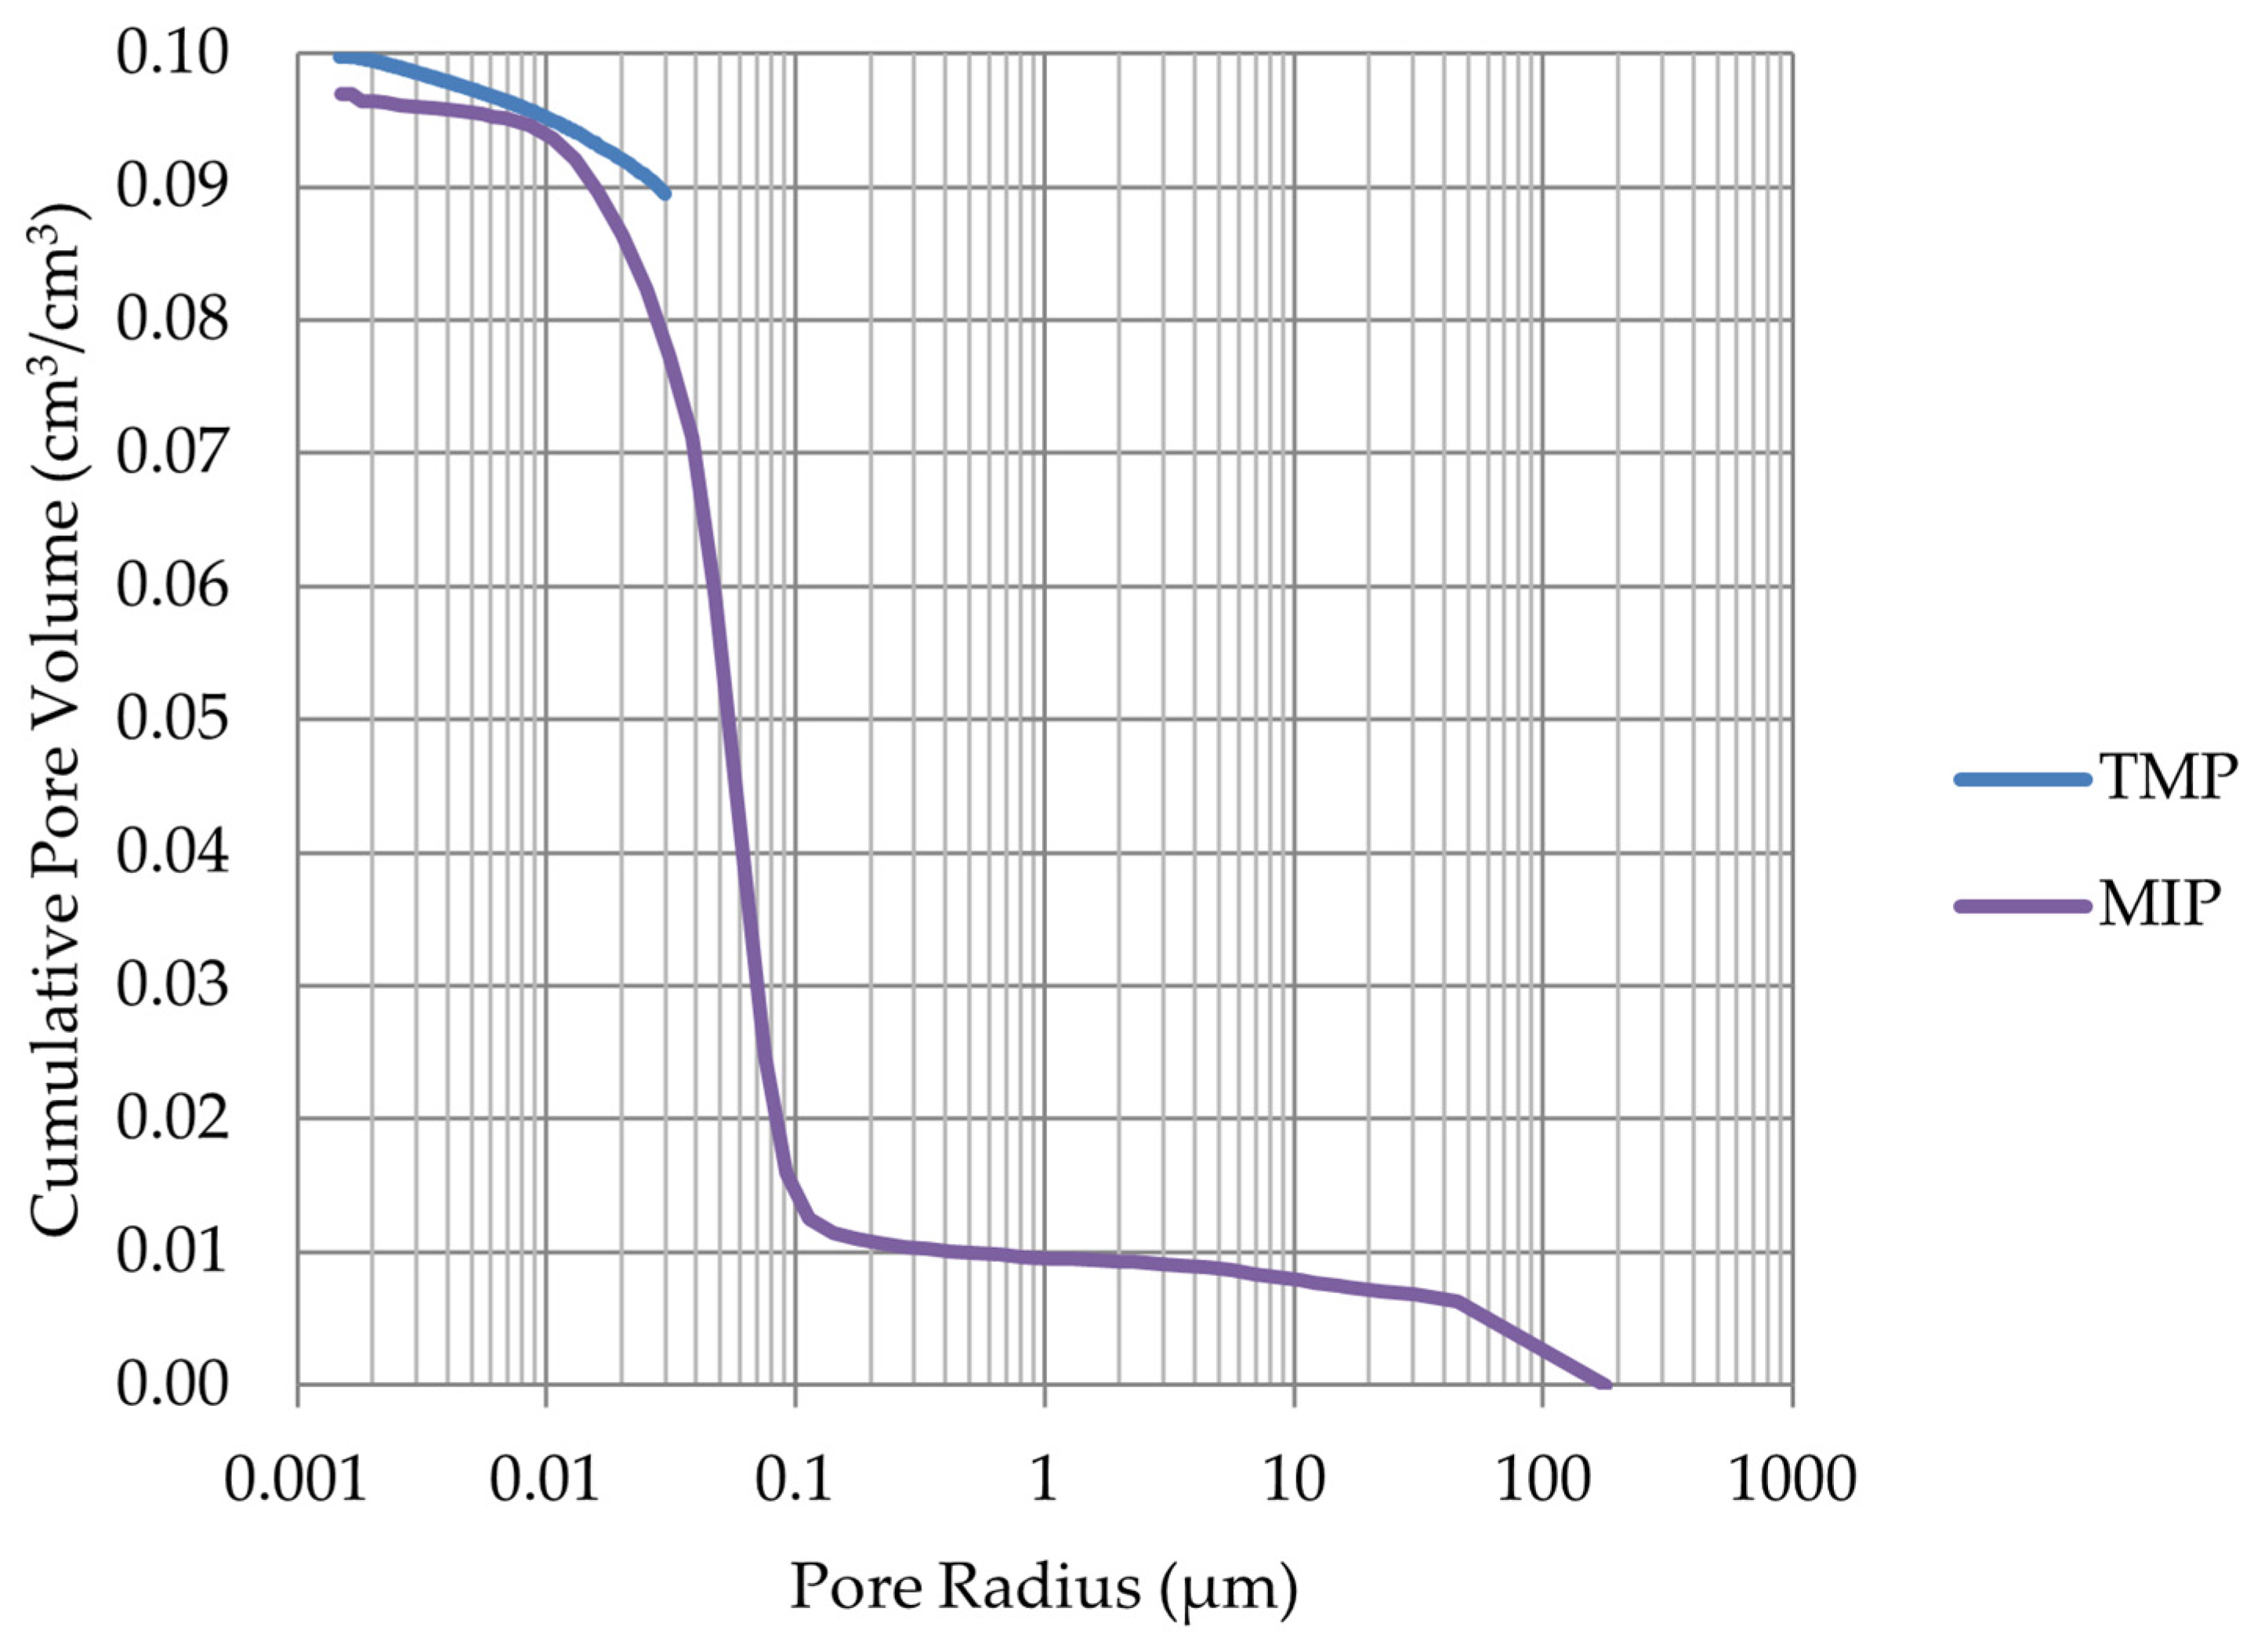
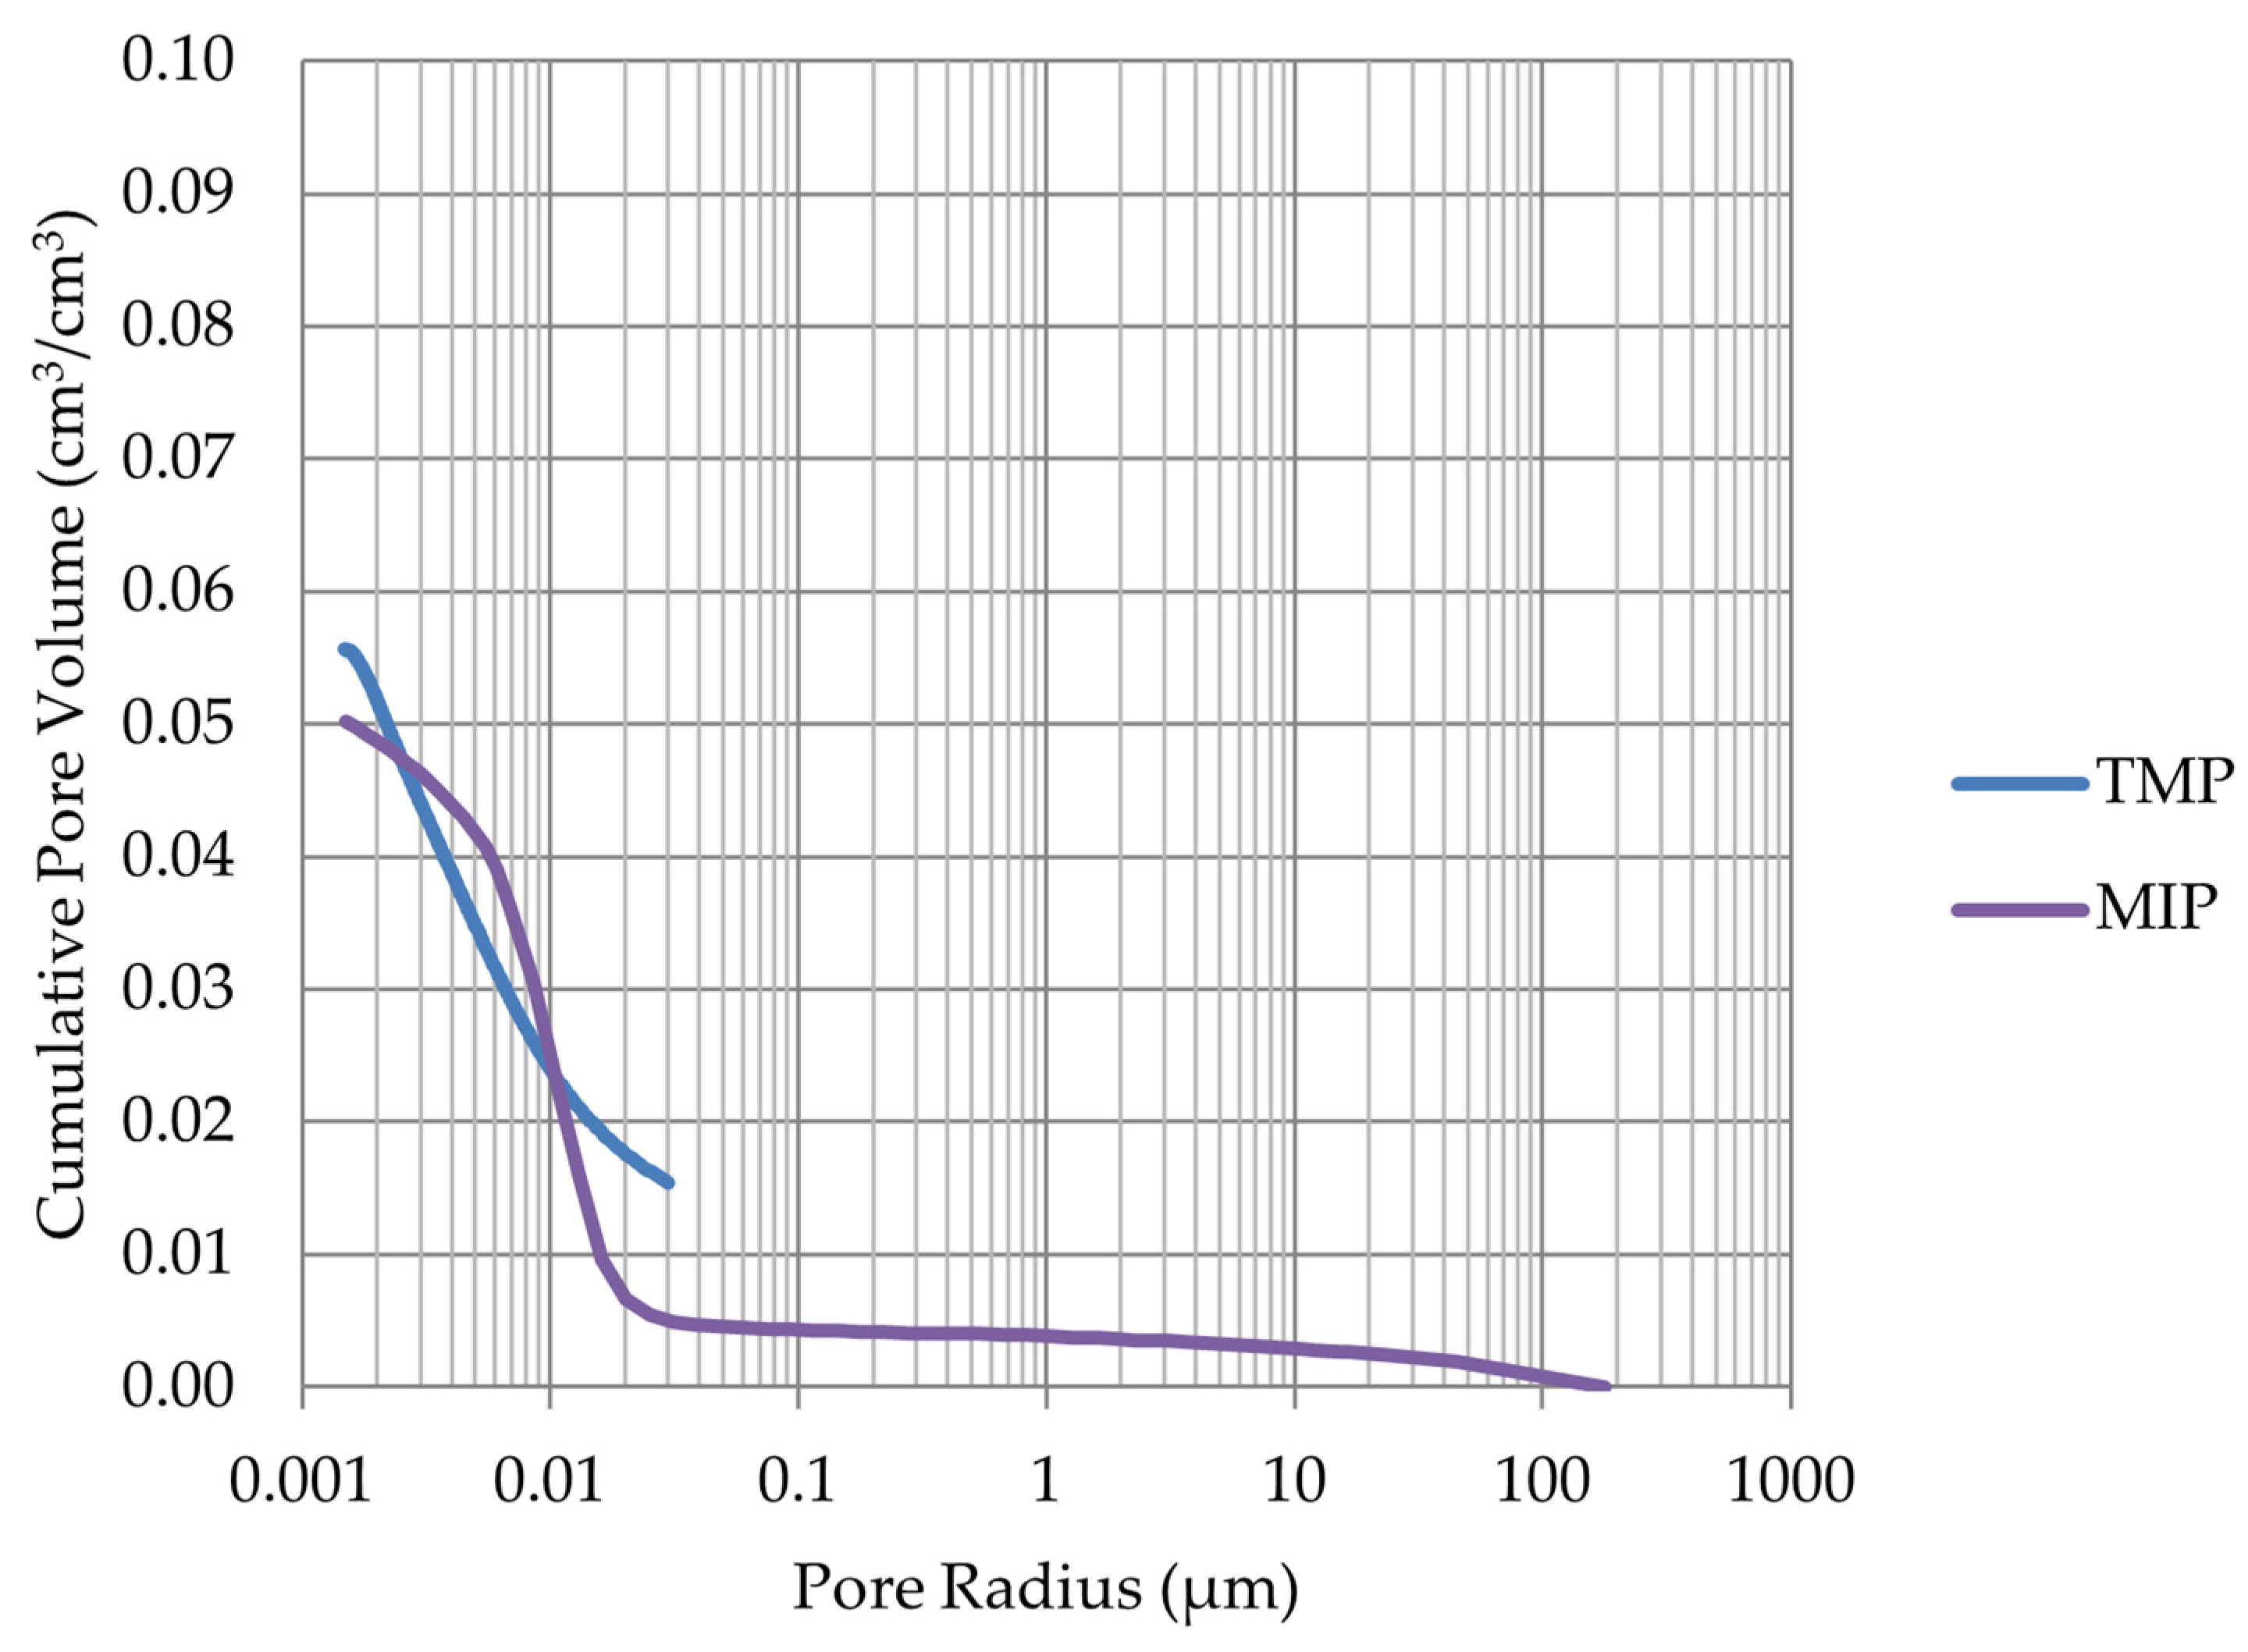
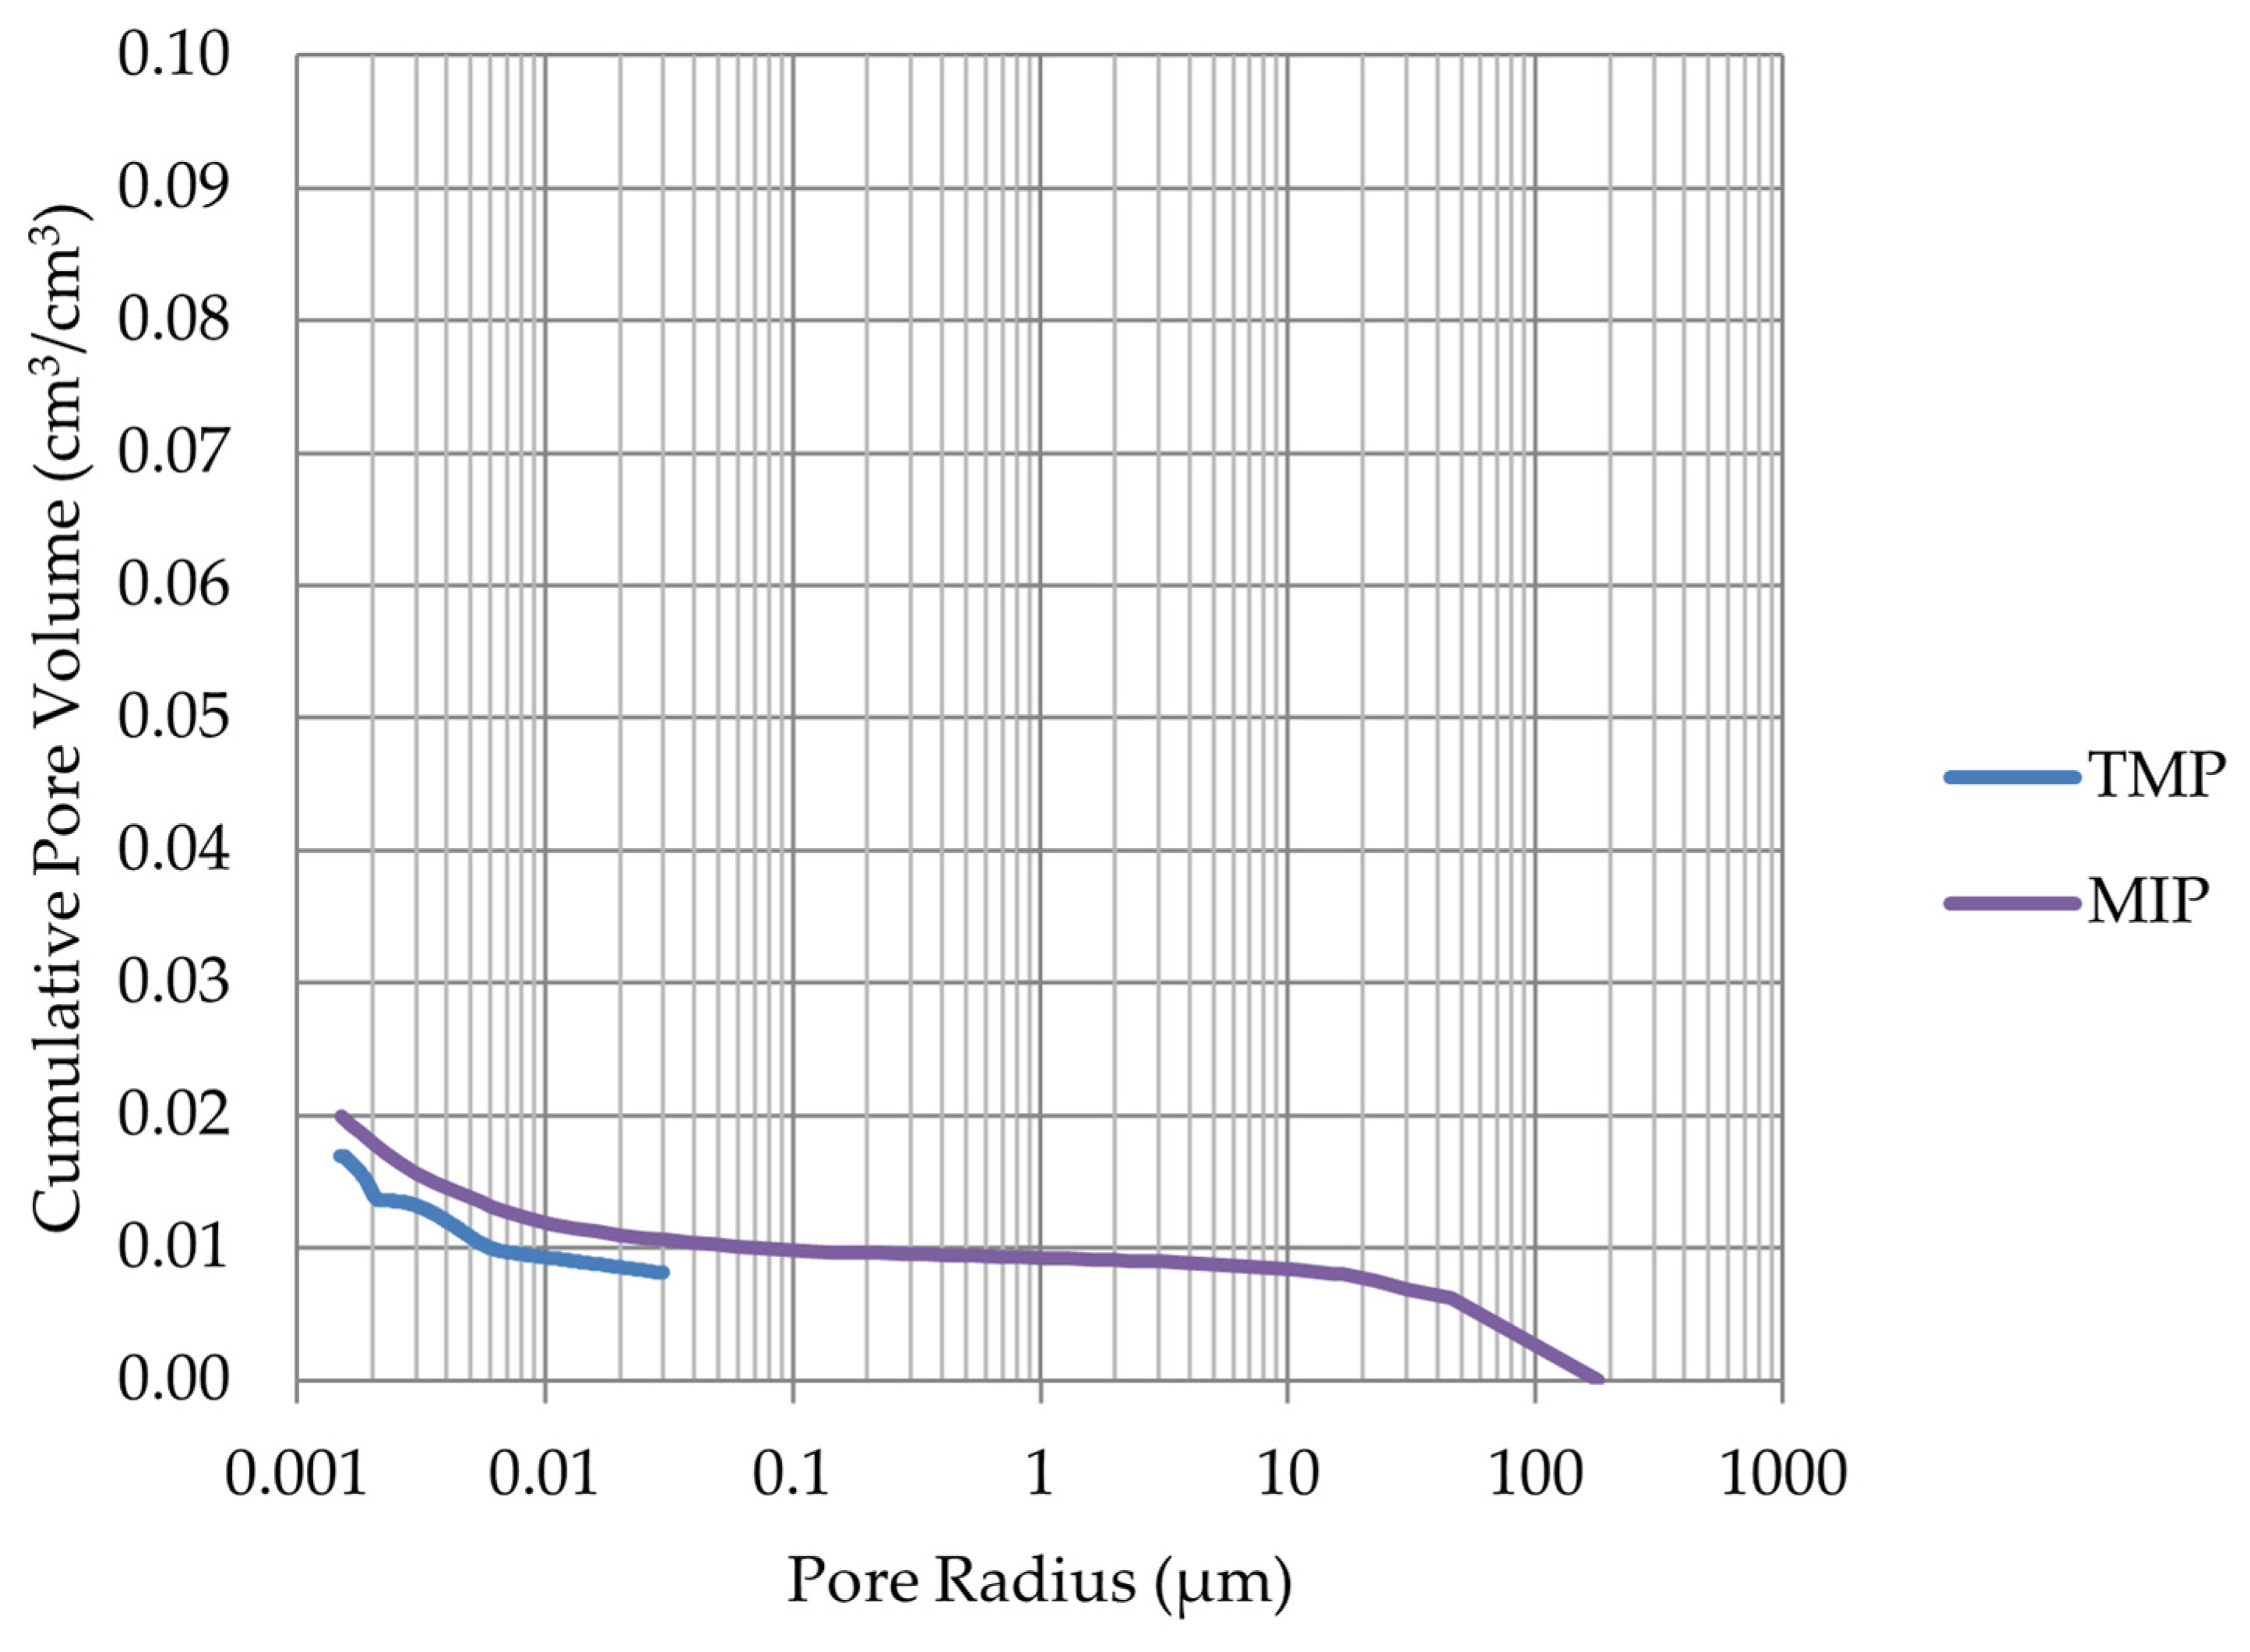
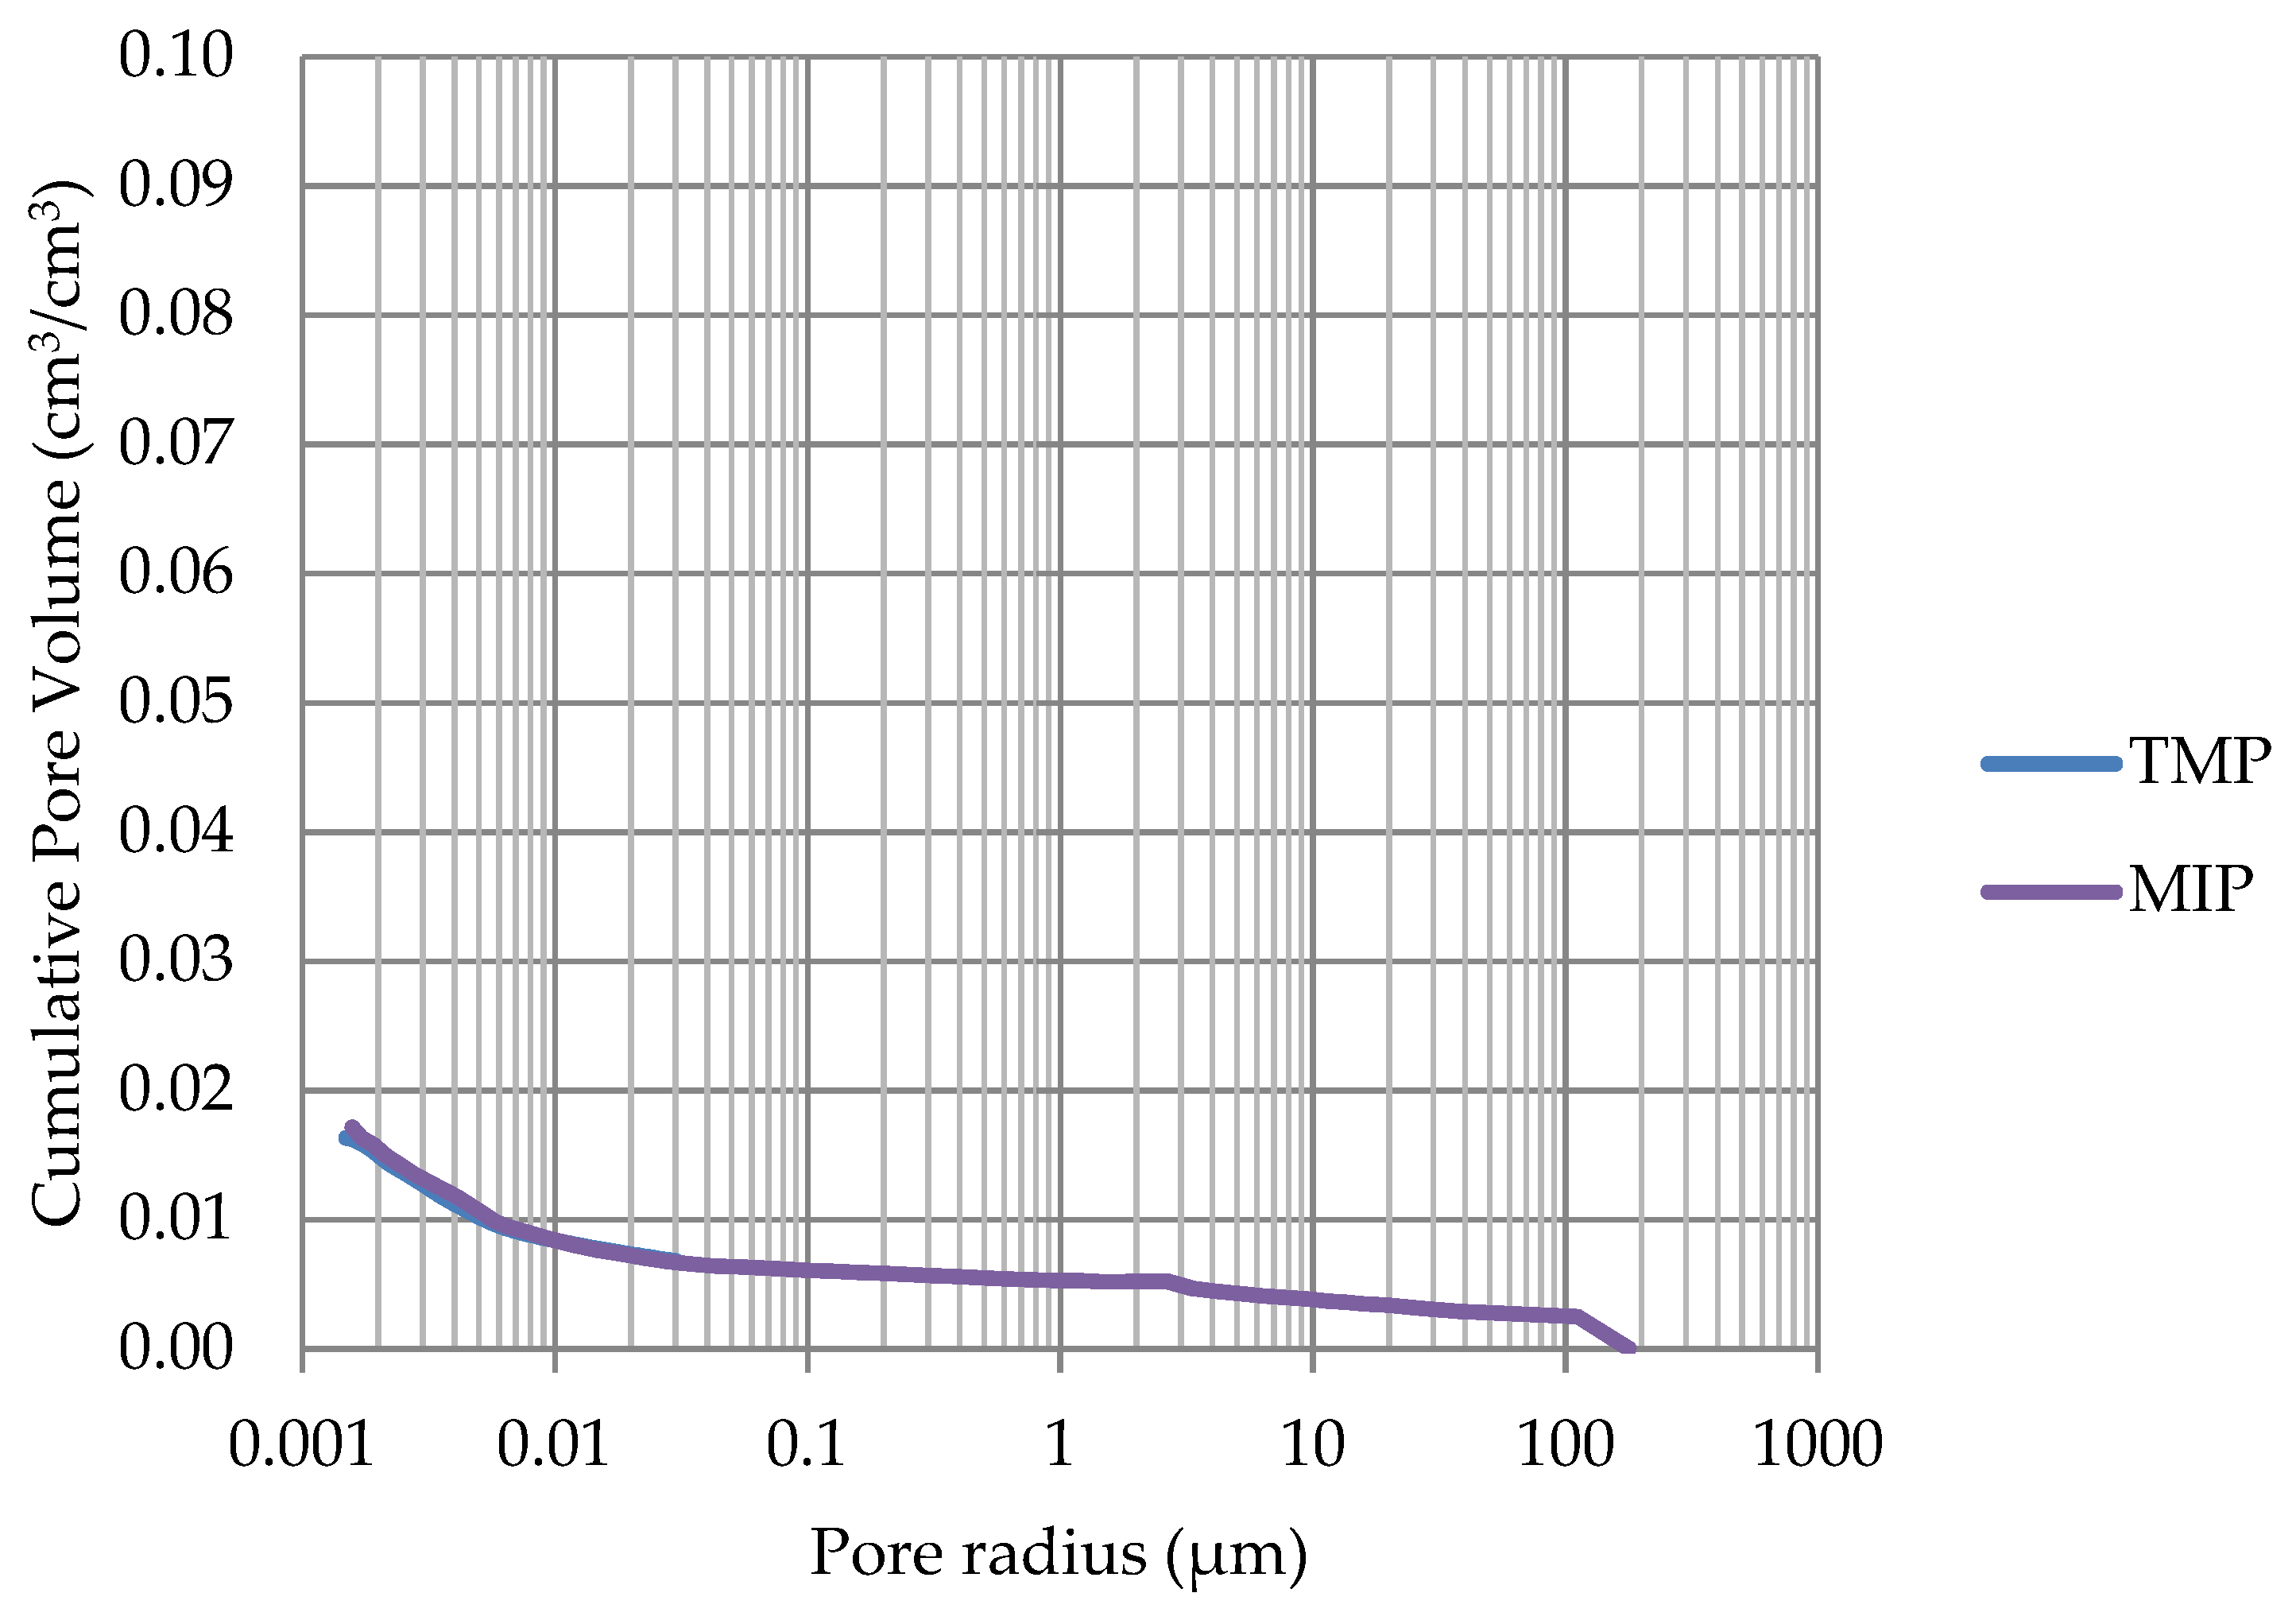
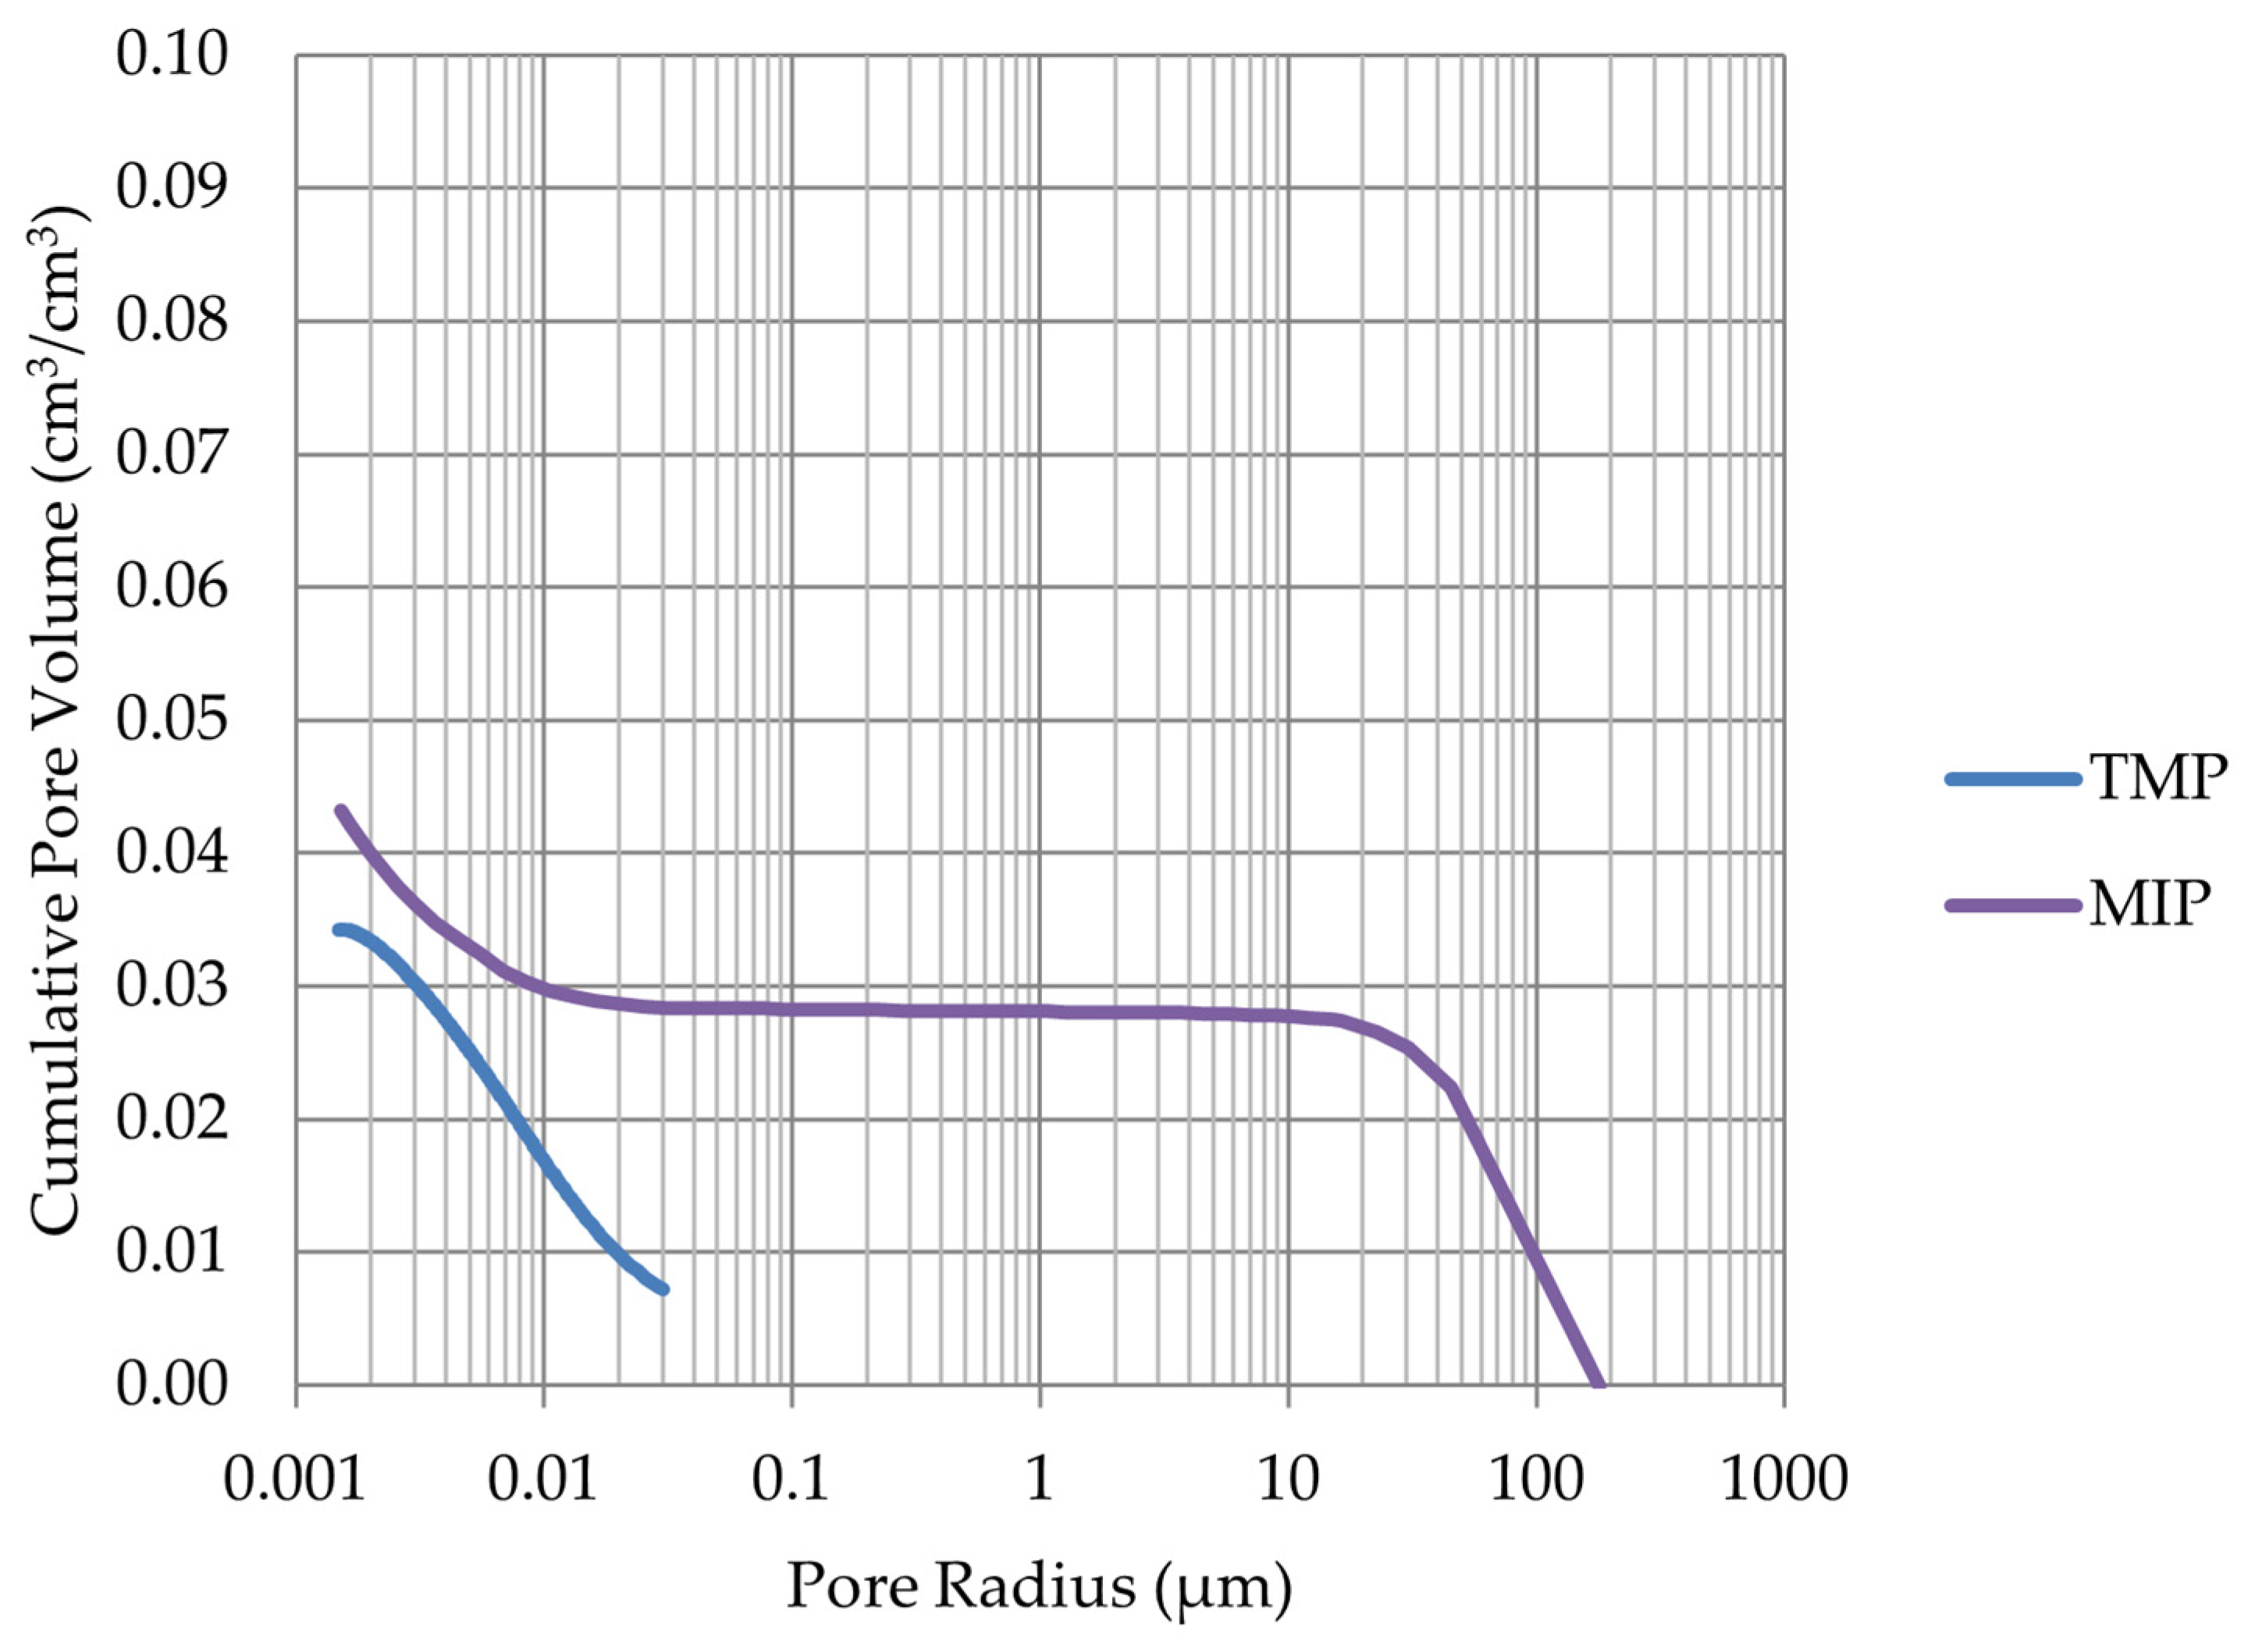
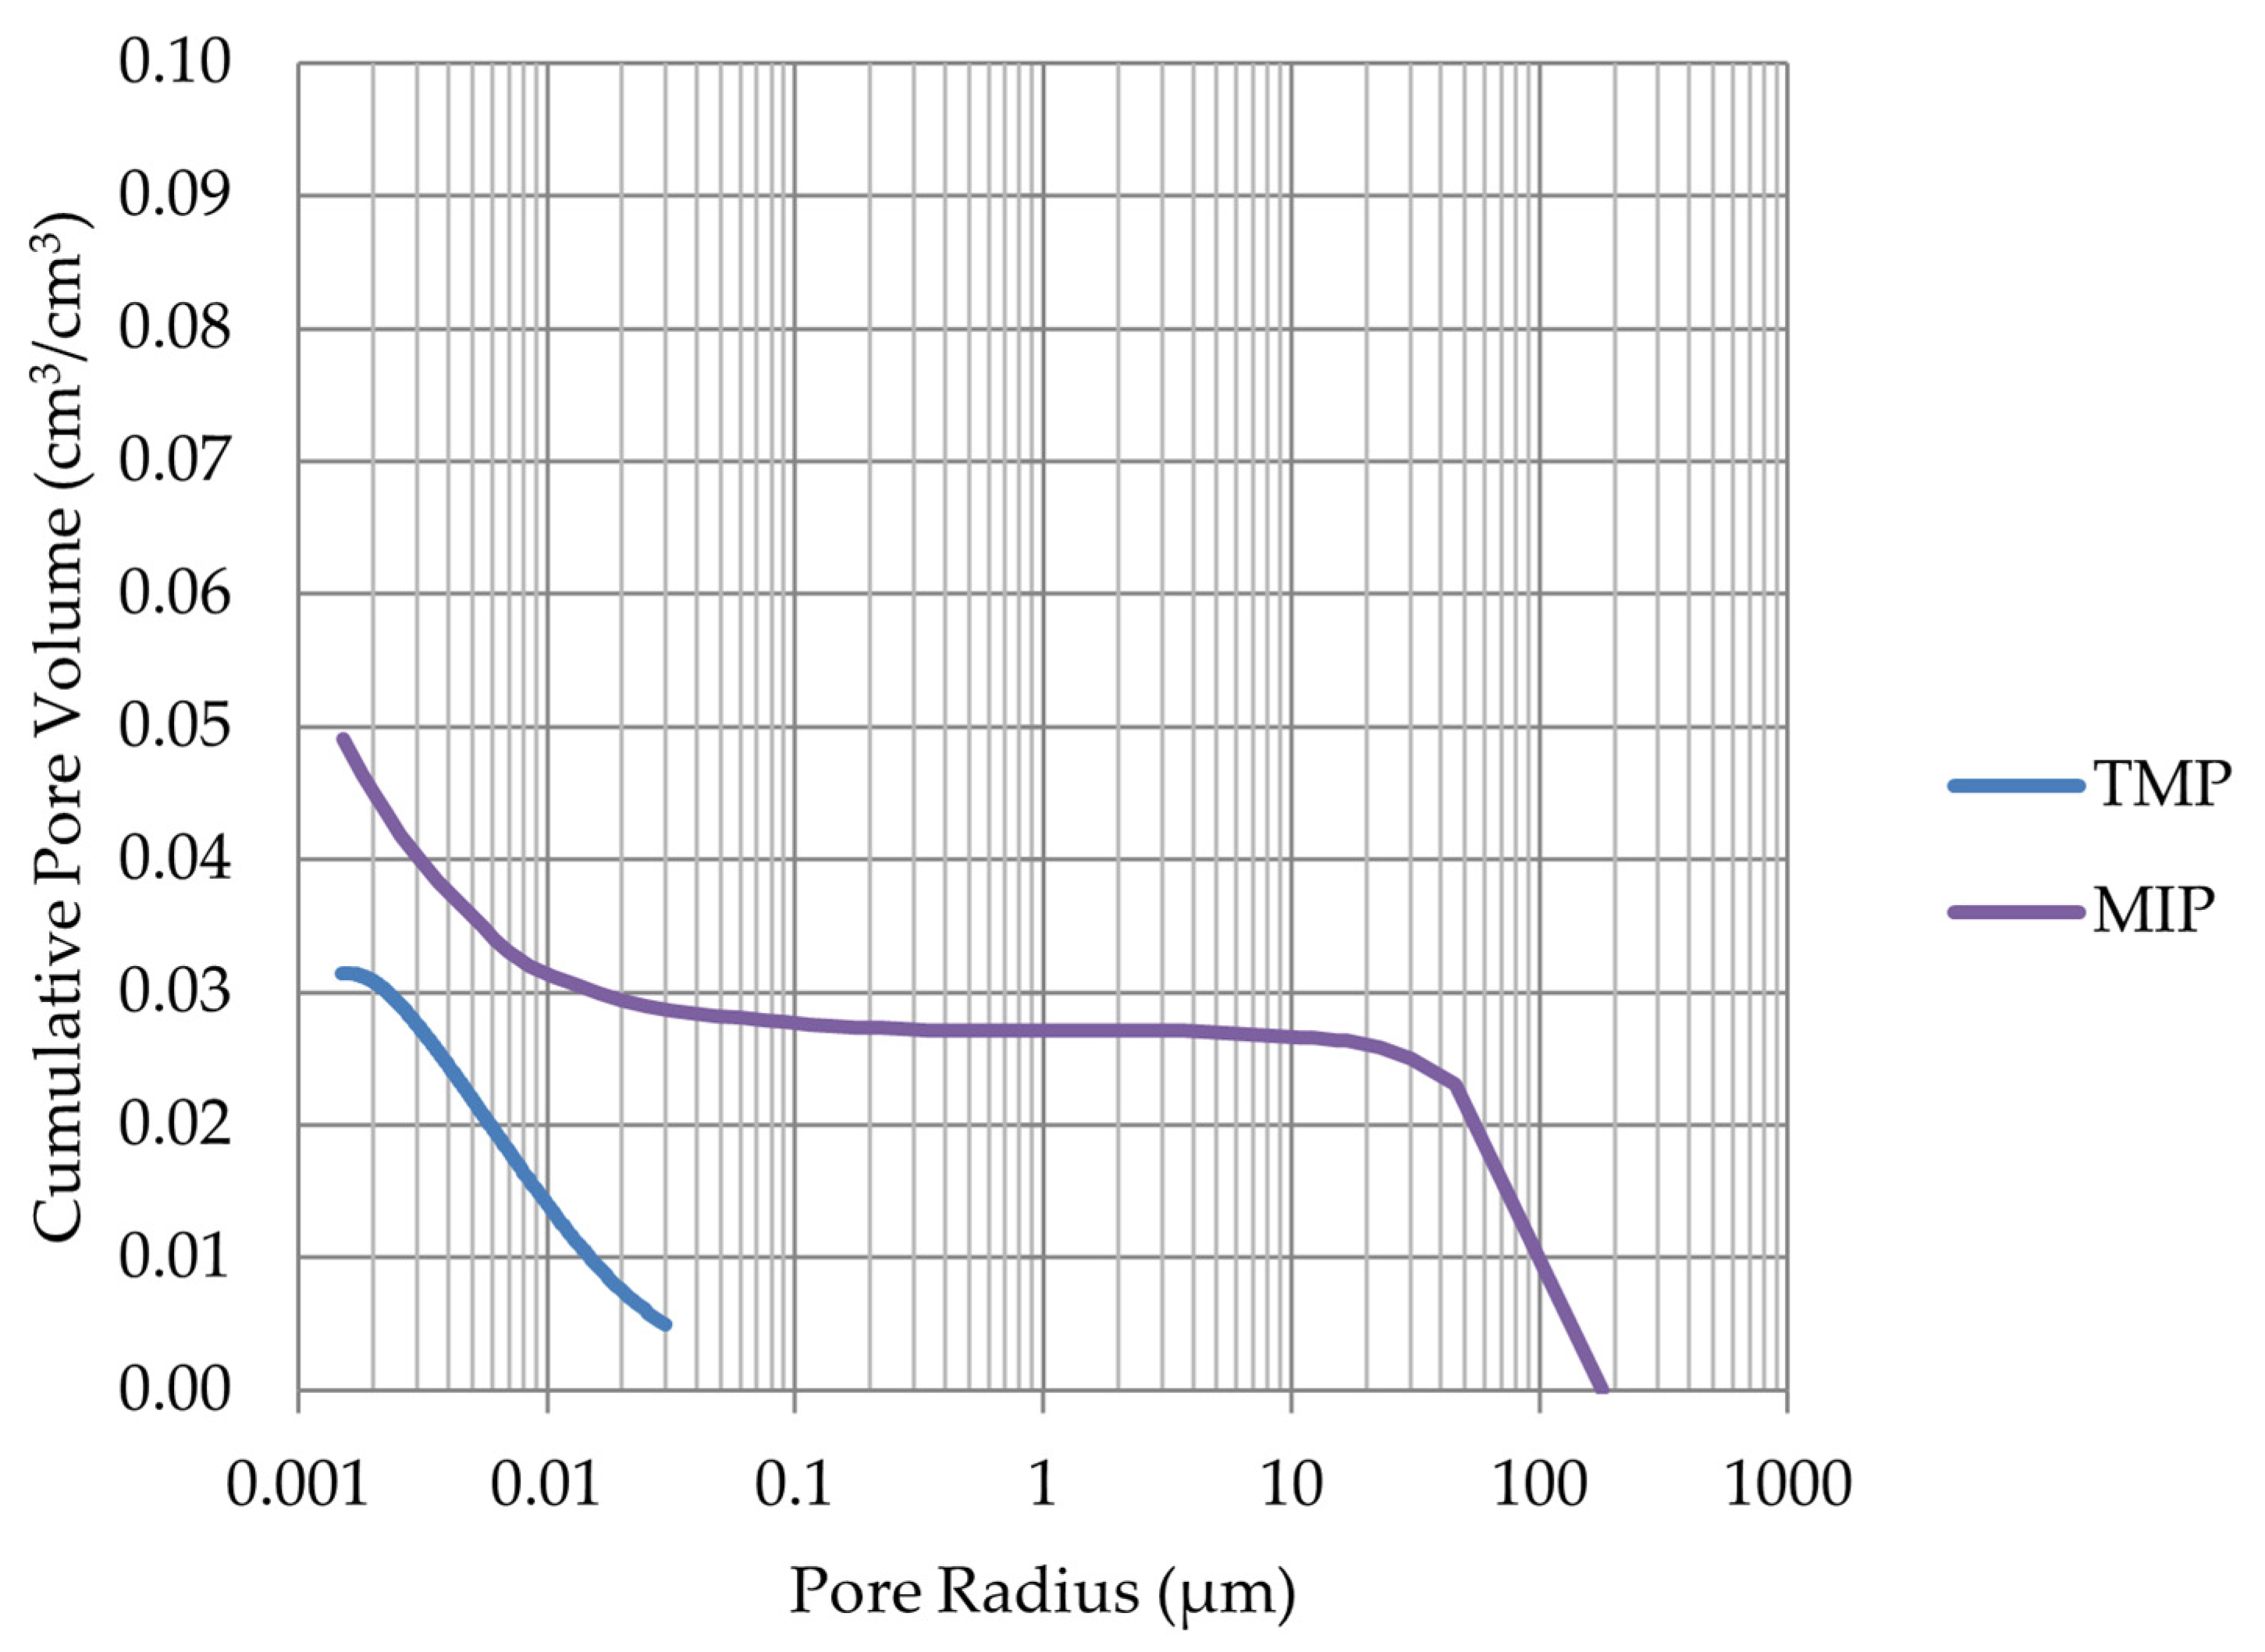
Based on the endothermic part of the energy distribution, the pore size distribution in which the phase transition occurred was determined. The accumulated pore volume obtained in this way, together with the accumulated pore volume obtained from the MIP test, are presented in Figure 5, Figure 6, Figure 7, Figure 8, Figure 9, Figure 10, Figure 11, Figure 12, Figure 13 and Figure 14.
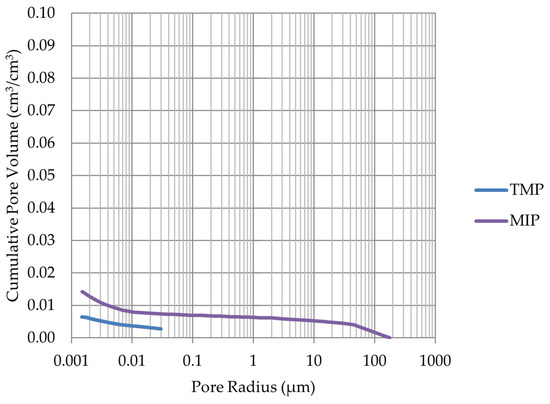
Figure 5.
Cumulative pore volume—sample LIM1.
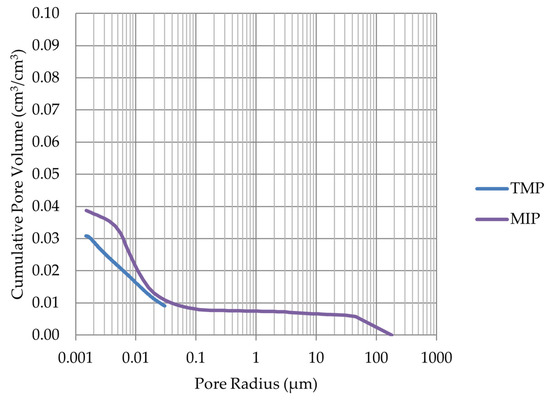
Figure 6.
Cumulative pore volume—sample LIM2.
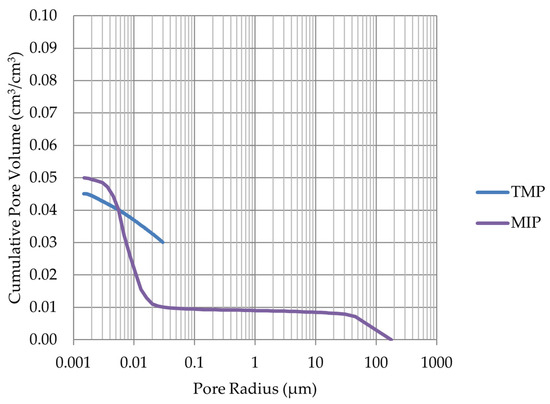
Figure 7.
Cumulative pore volume—sample LIM3.
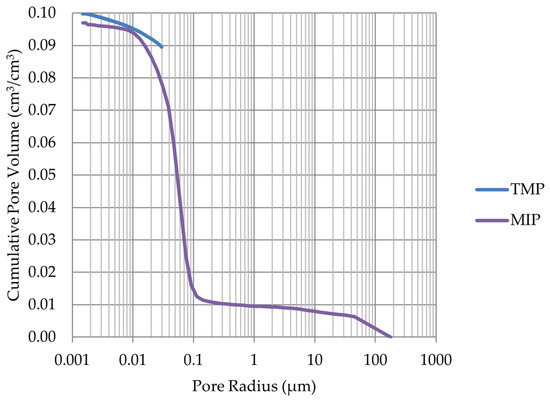
Figure 8.
Cumulative pore volume—sample LIM4.
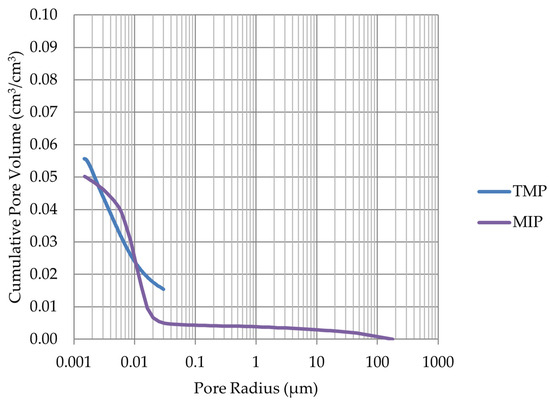
Figure 9.
Cumulative pore volume—sample DO1.
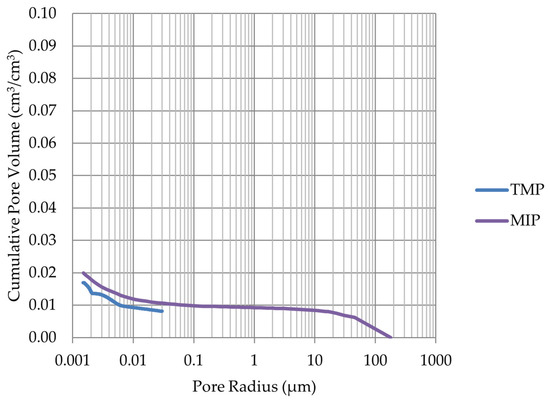
Figure 10.
Cumulative pore volume—sample DO2.
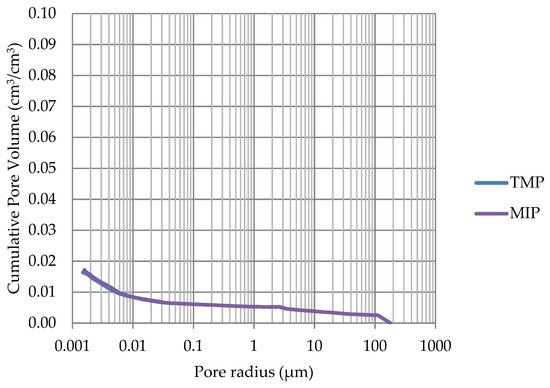
Figure 11.
Cumulative pore volume—sample DO3.
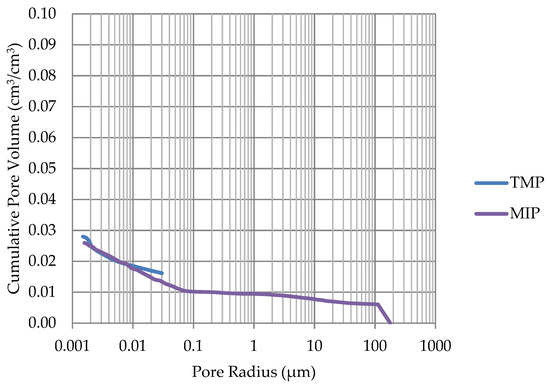
Figure 12.
Cumulative pore volume—sample DO4.
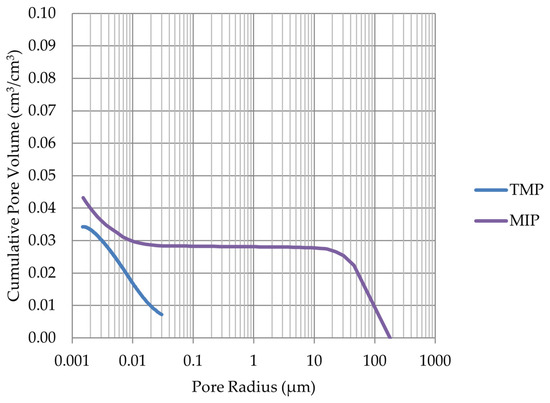
Figure 13.
Cumulative pore volume—sample BA1.
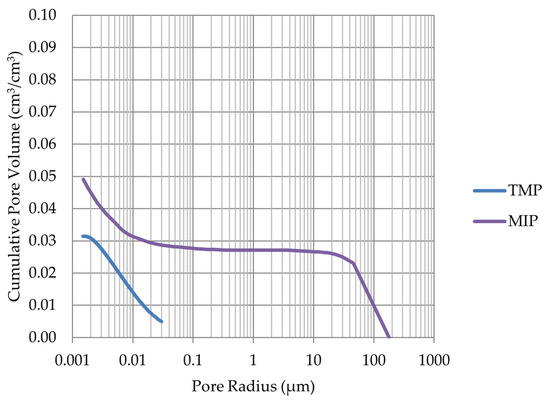
Figure 14.
Cumulative pore volume—sample BA2.
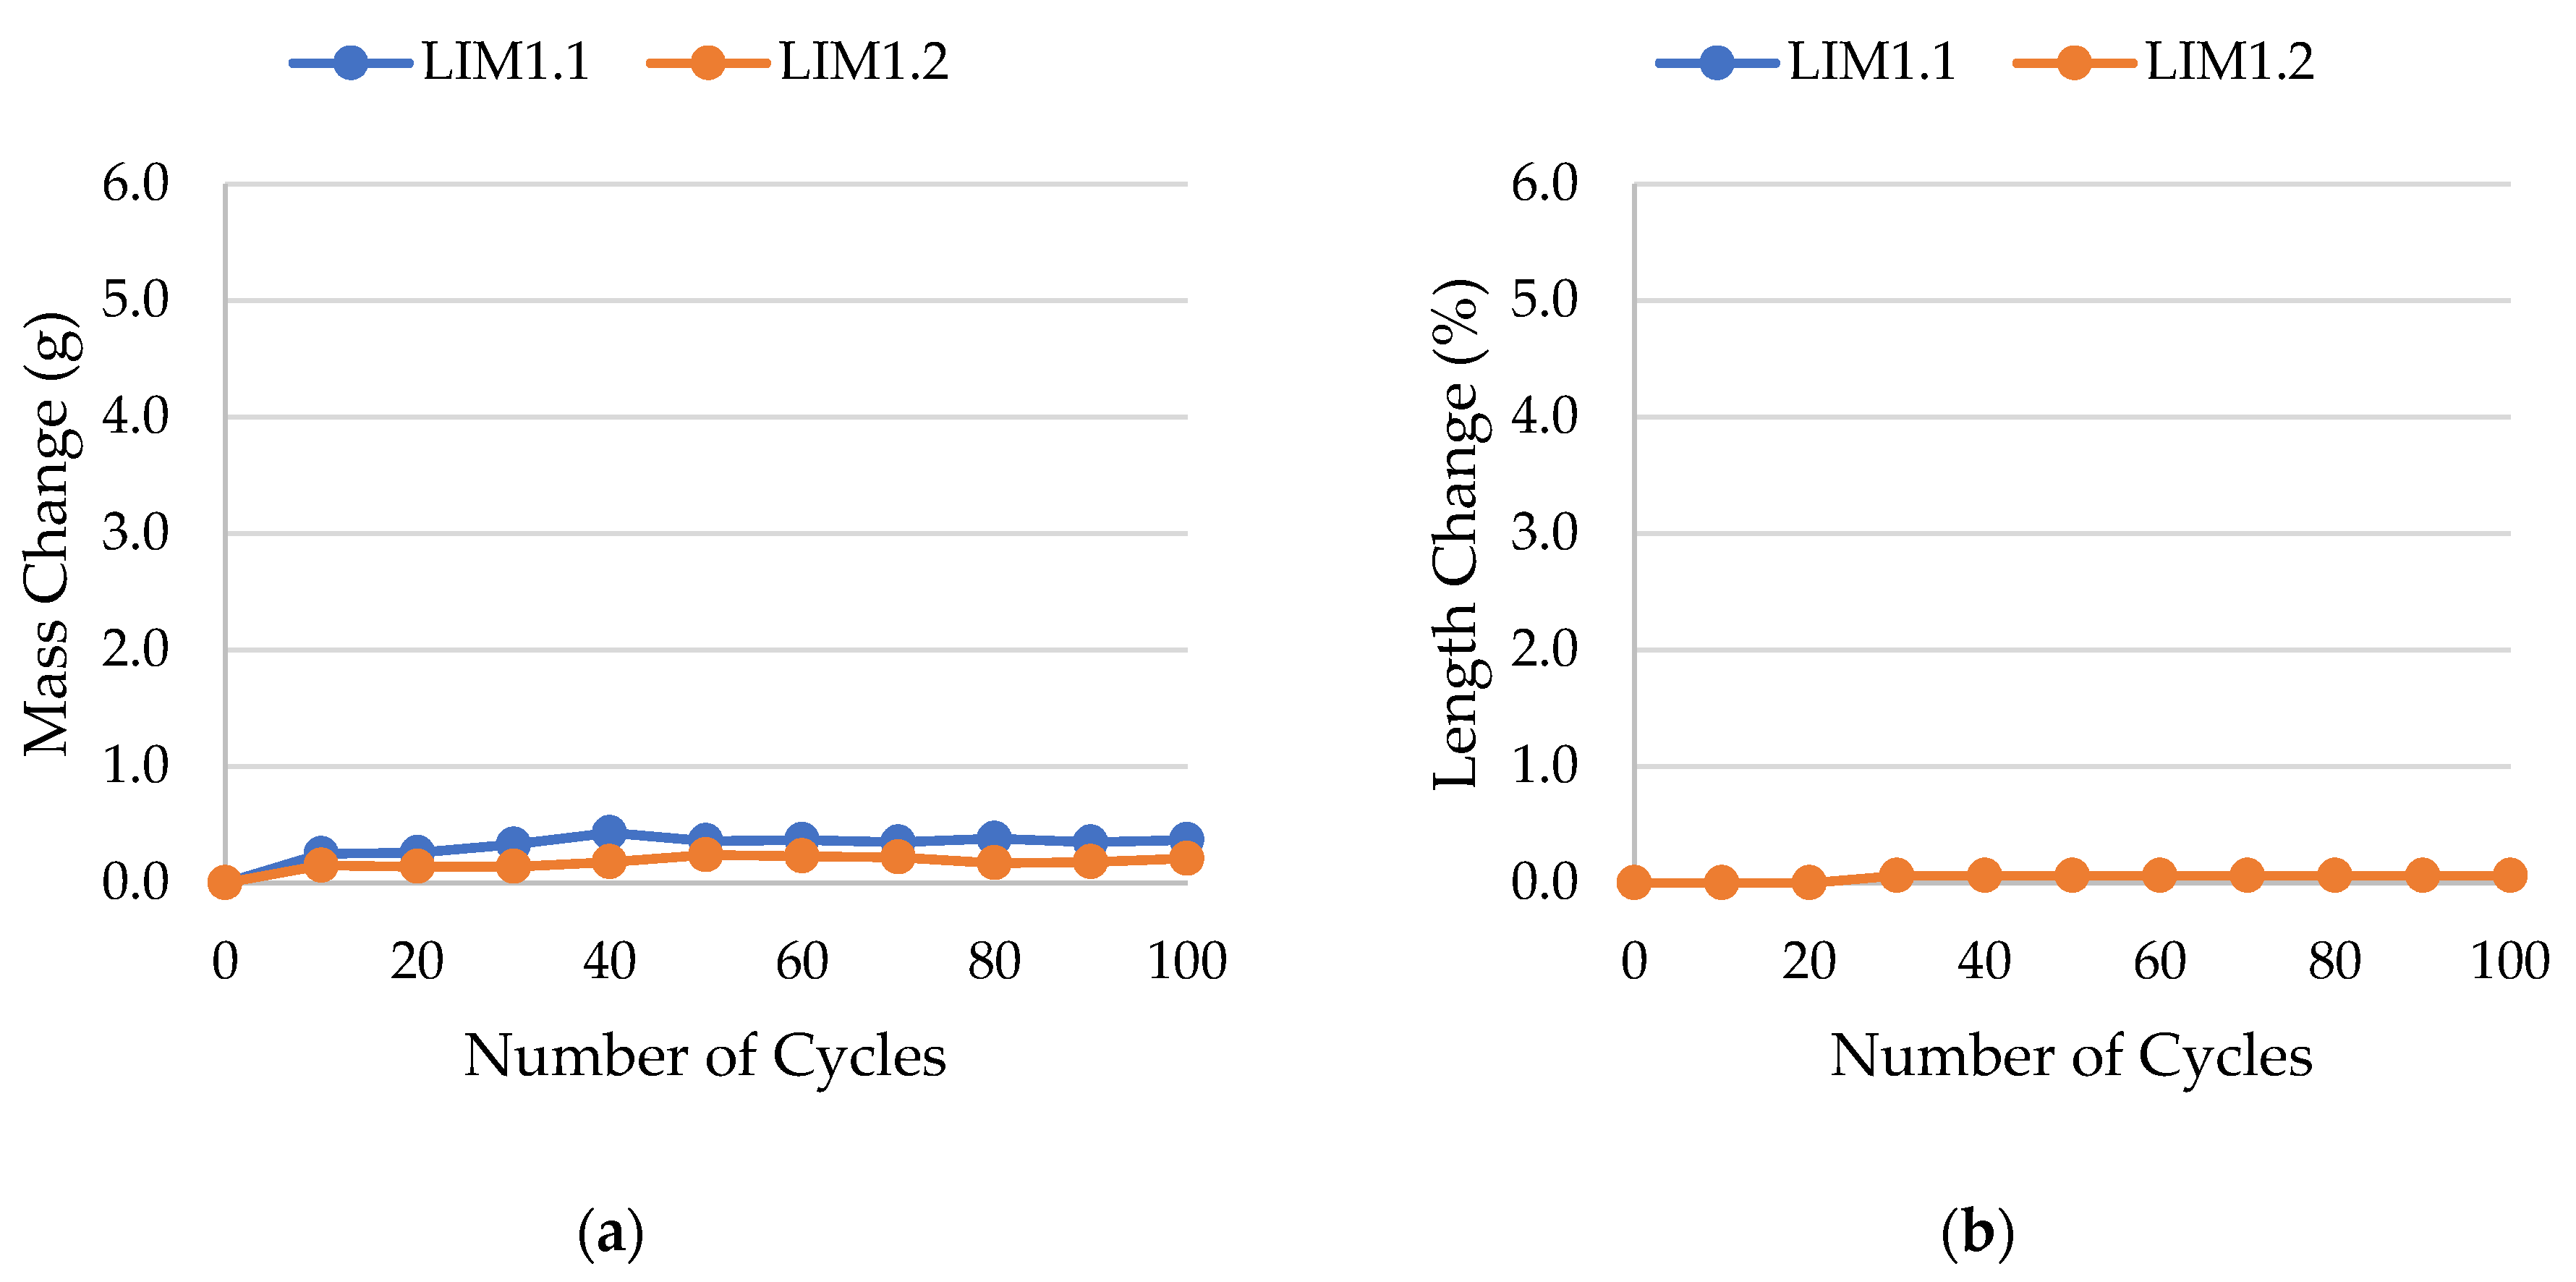
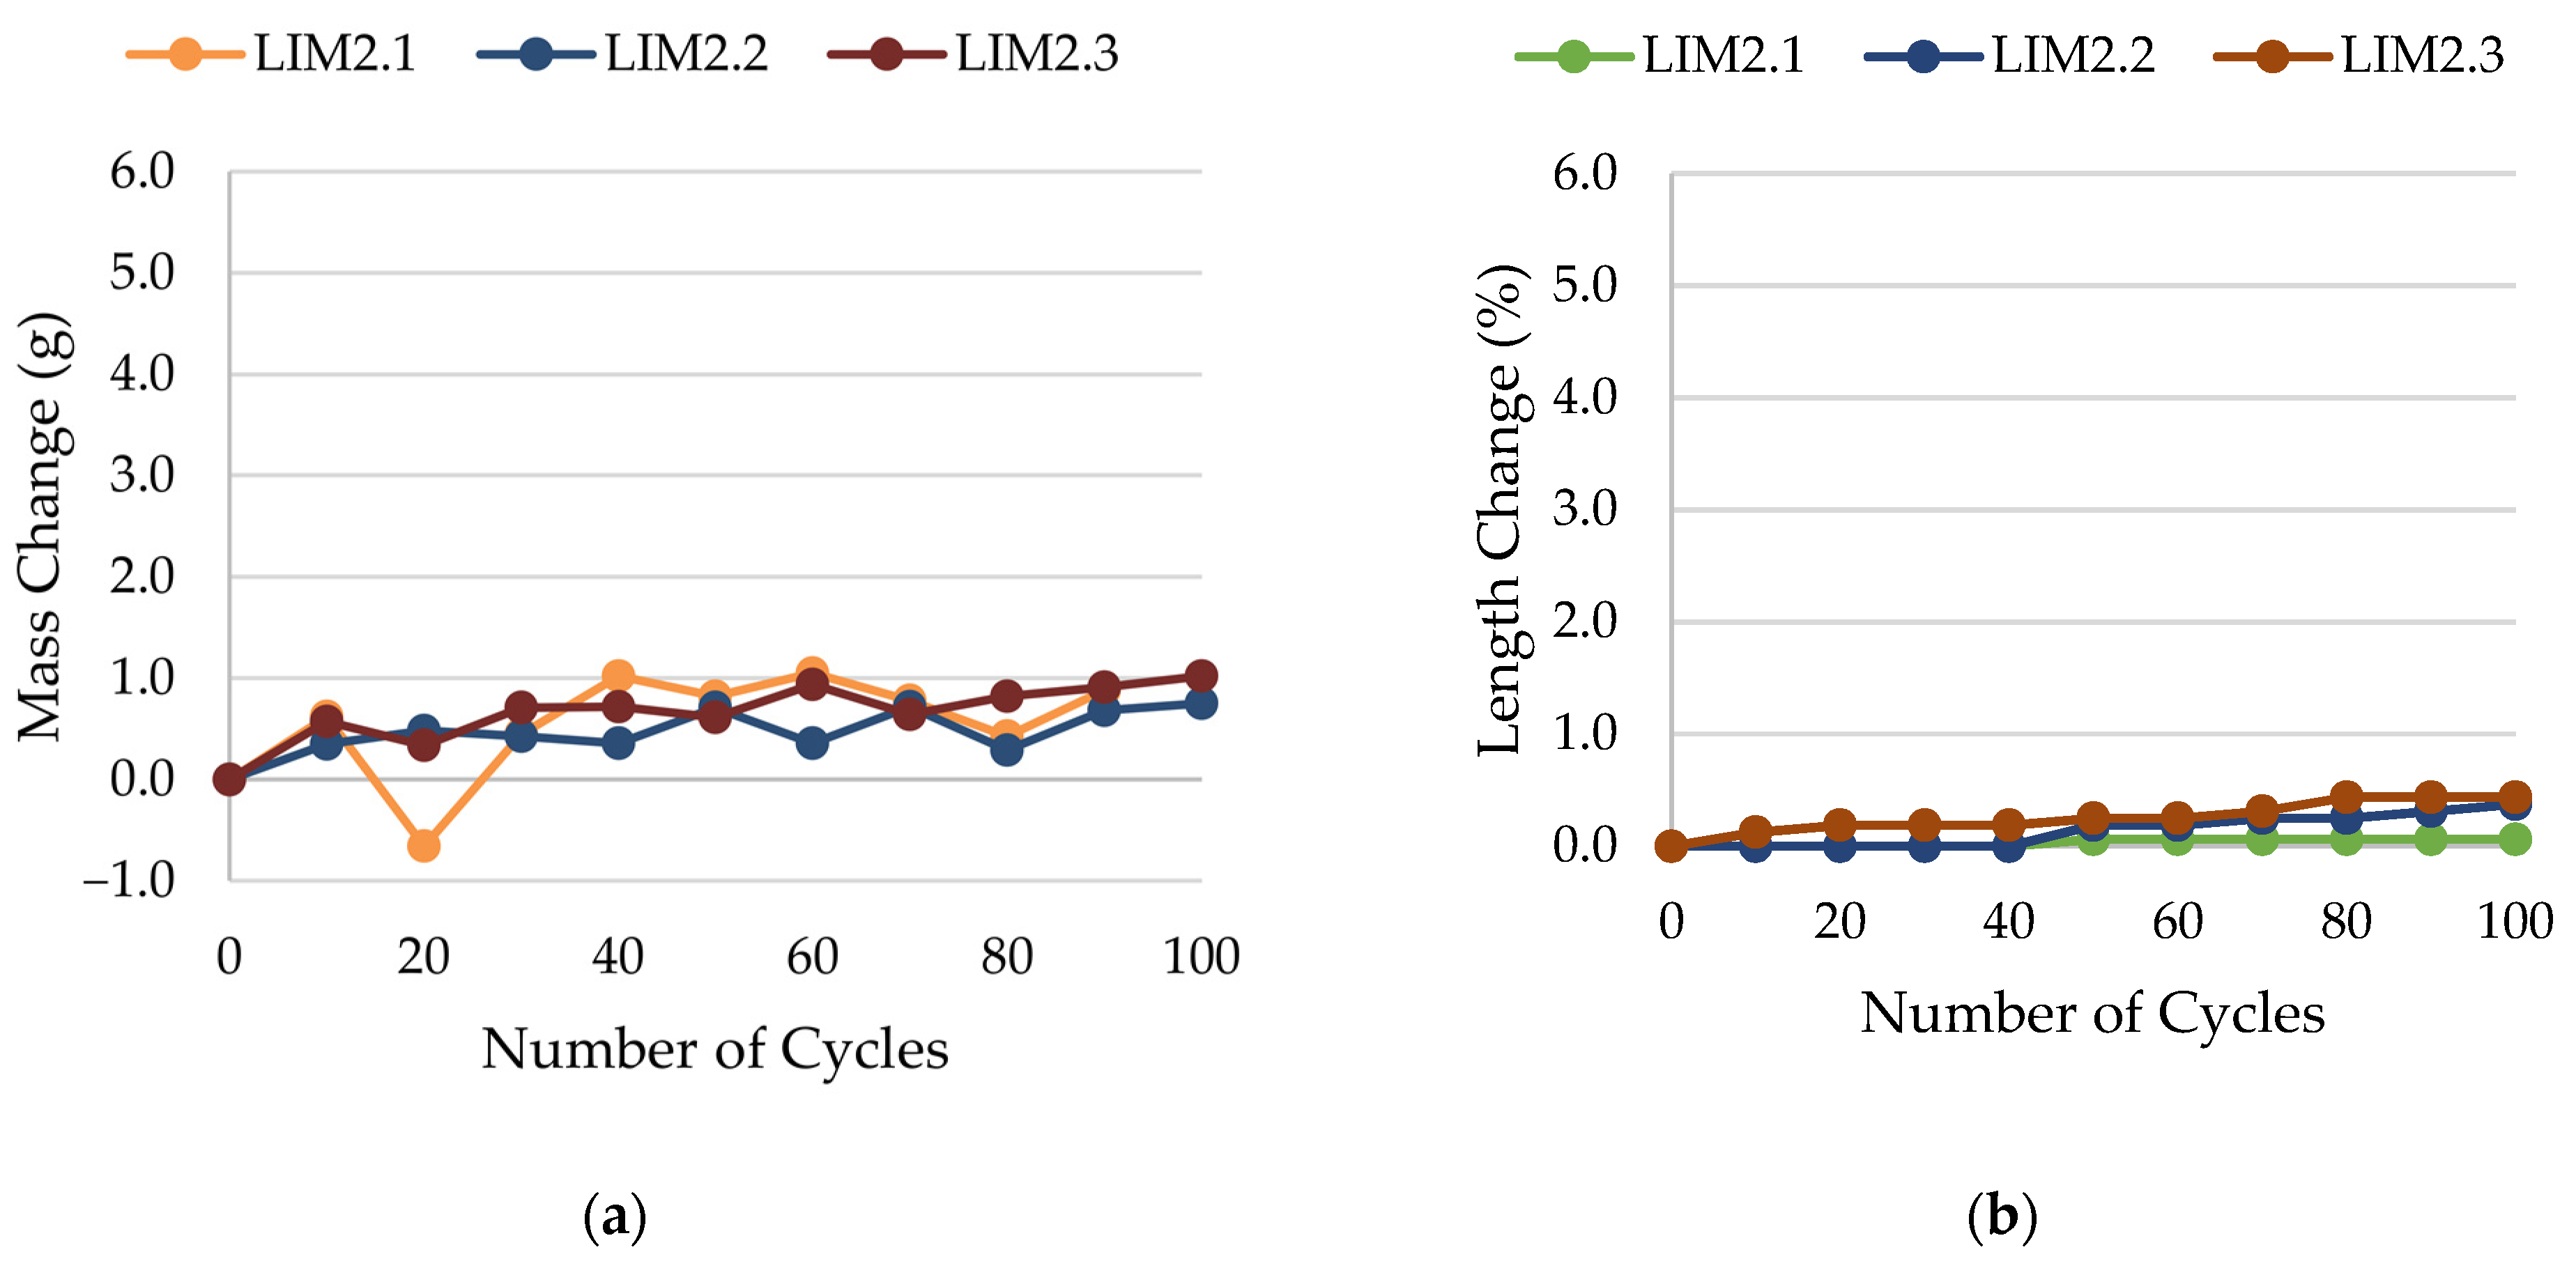
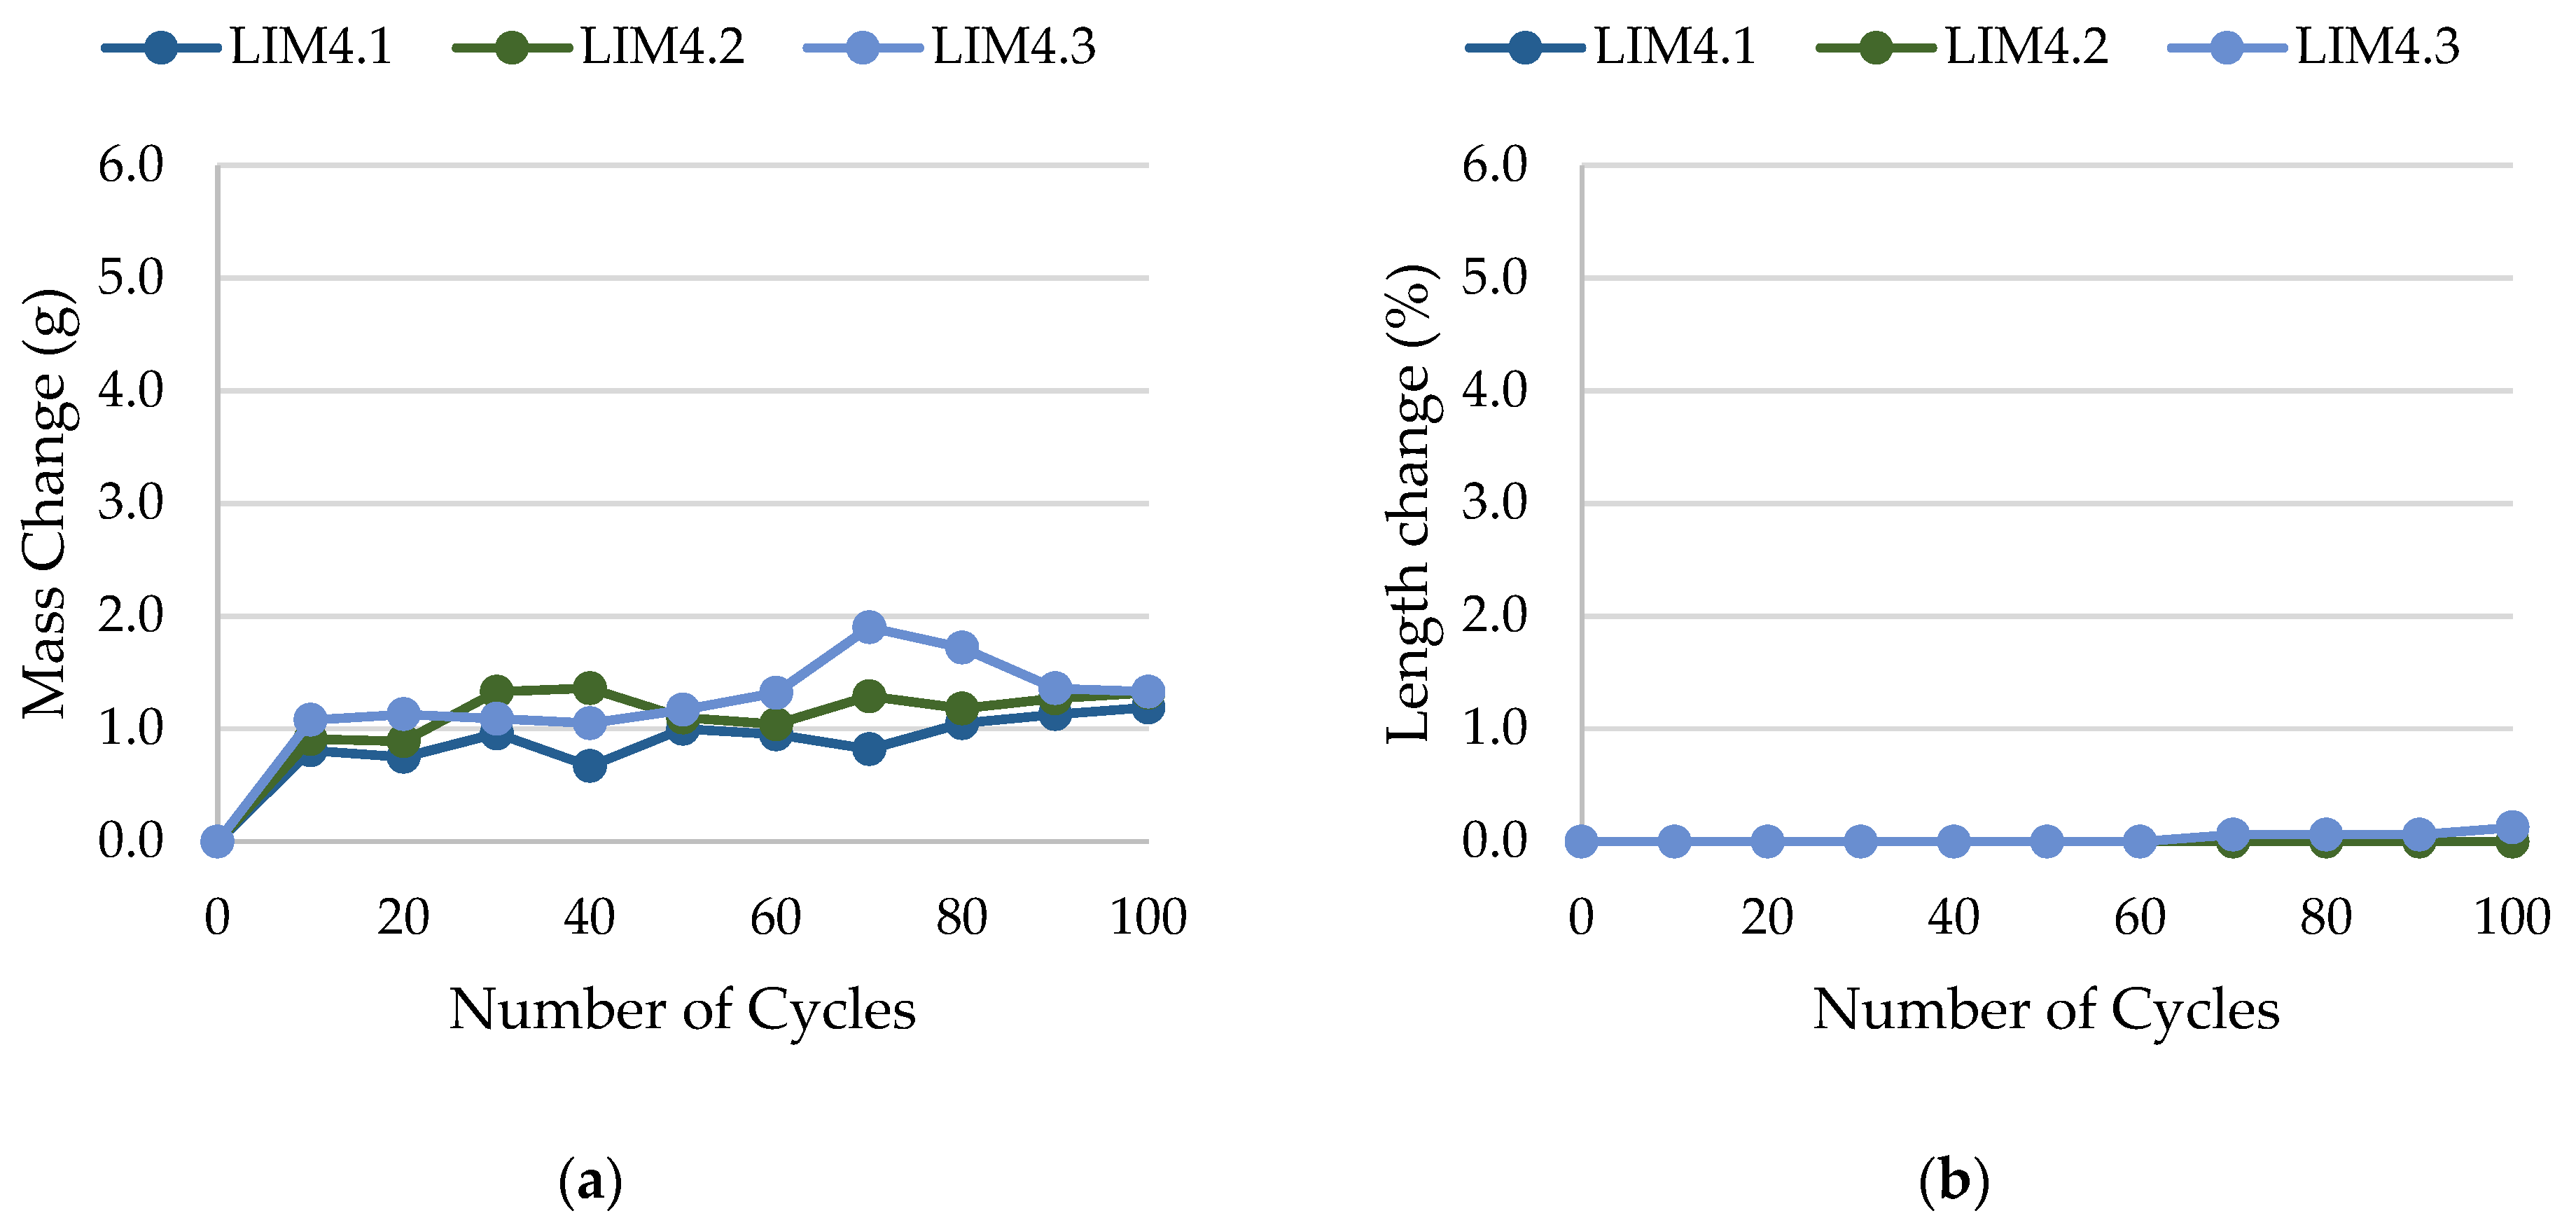
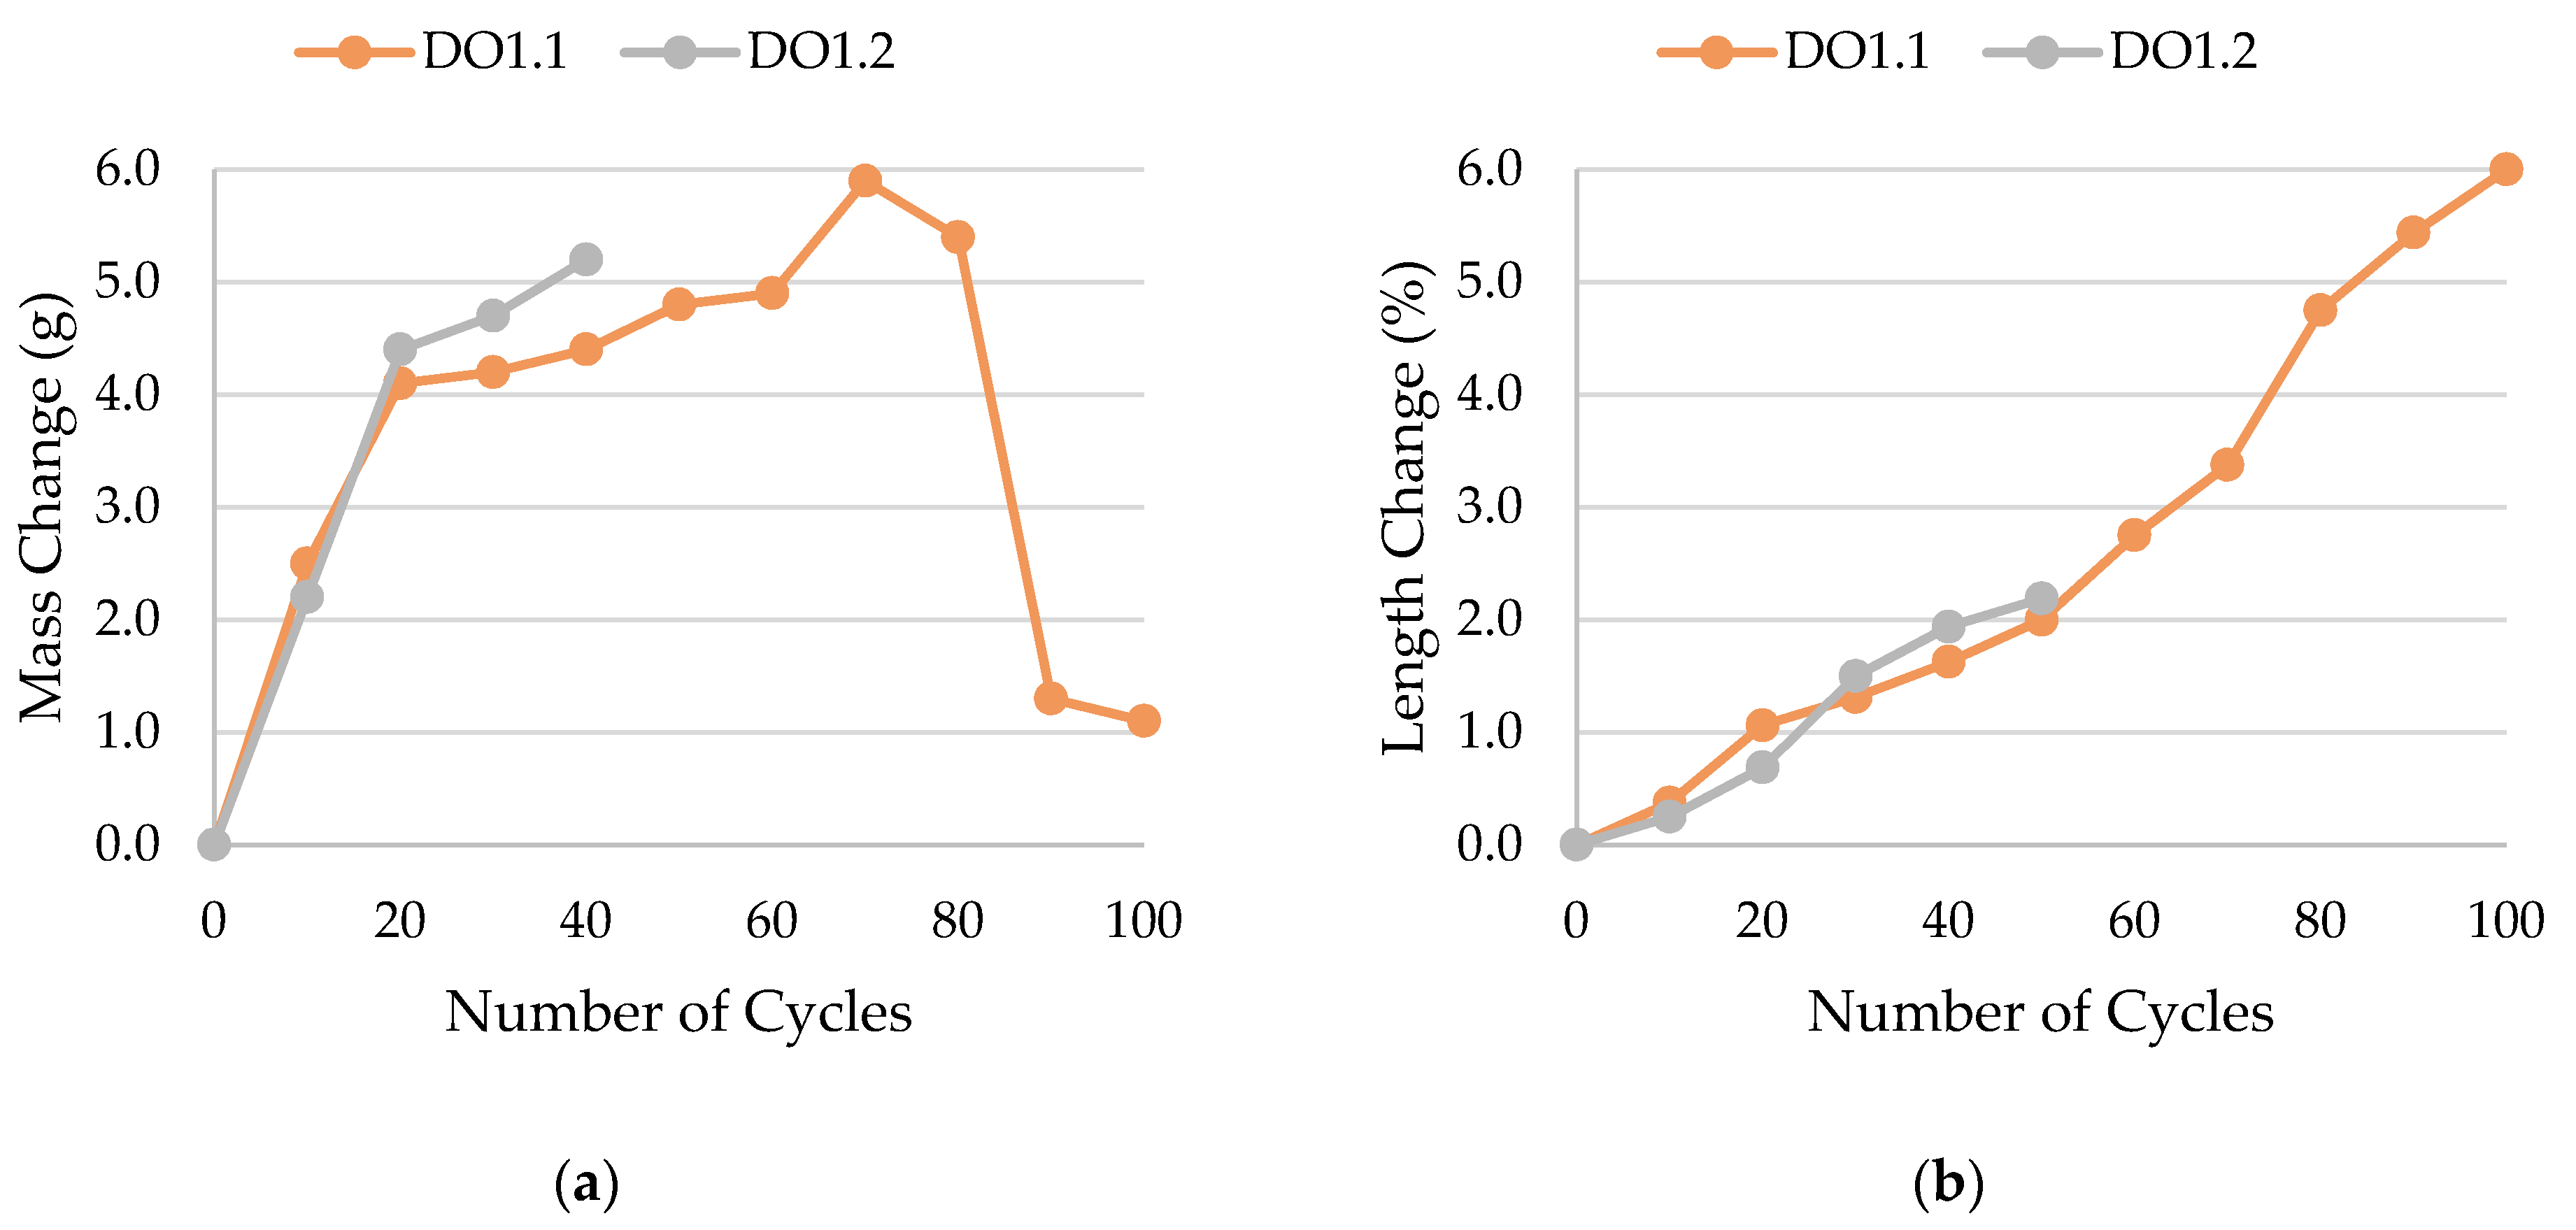
The results of rock frost resistance tests, such as mass changes and length changes checked after subsequent freeze–thaw cycles, are presented in Figure 15, Figure 16, Figure 17, Figure 18, Figure 19, Figure 20, Figure 21, Figure 22, Figure 23 and Figure 24.

Figure 15.
Result of the freeze–thaw test of sample LIM1: (a) mass change; (b) length change.
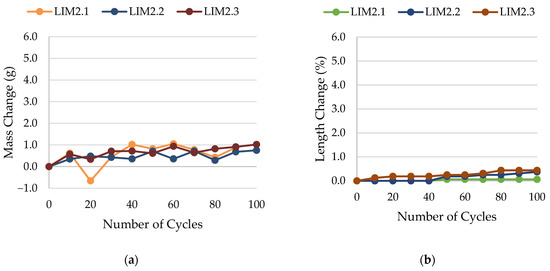
Figure 16.
Result of the freeze–thaw test of sample LIM2: (a) mass change; (b) length change.
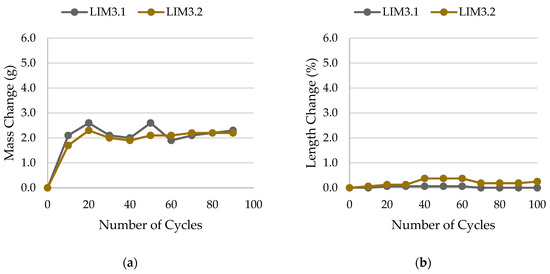
Figure 17.
Result of the freeze–thaw test of sample LIM3: (a) mass change; (b) length change.
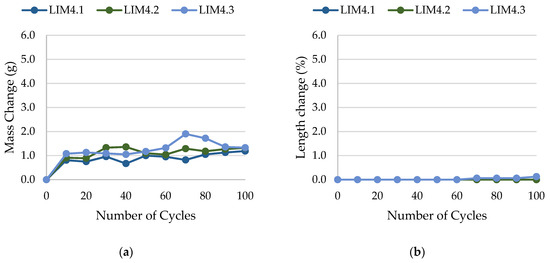
Figure 18.
Result of the freeze–thaw test of sample LIM4: (a) mass change; (b) length change.
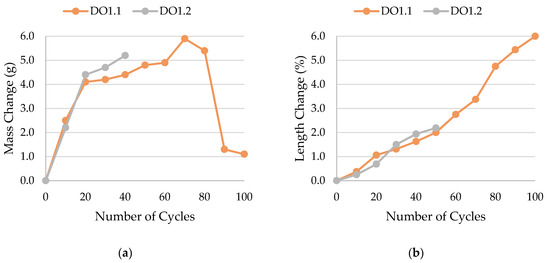
Figure 19.
Result of the freeze–thaw test of sample DO1: (a) mass change; (b) length change.

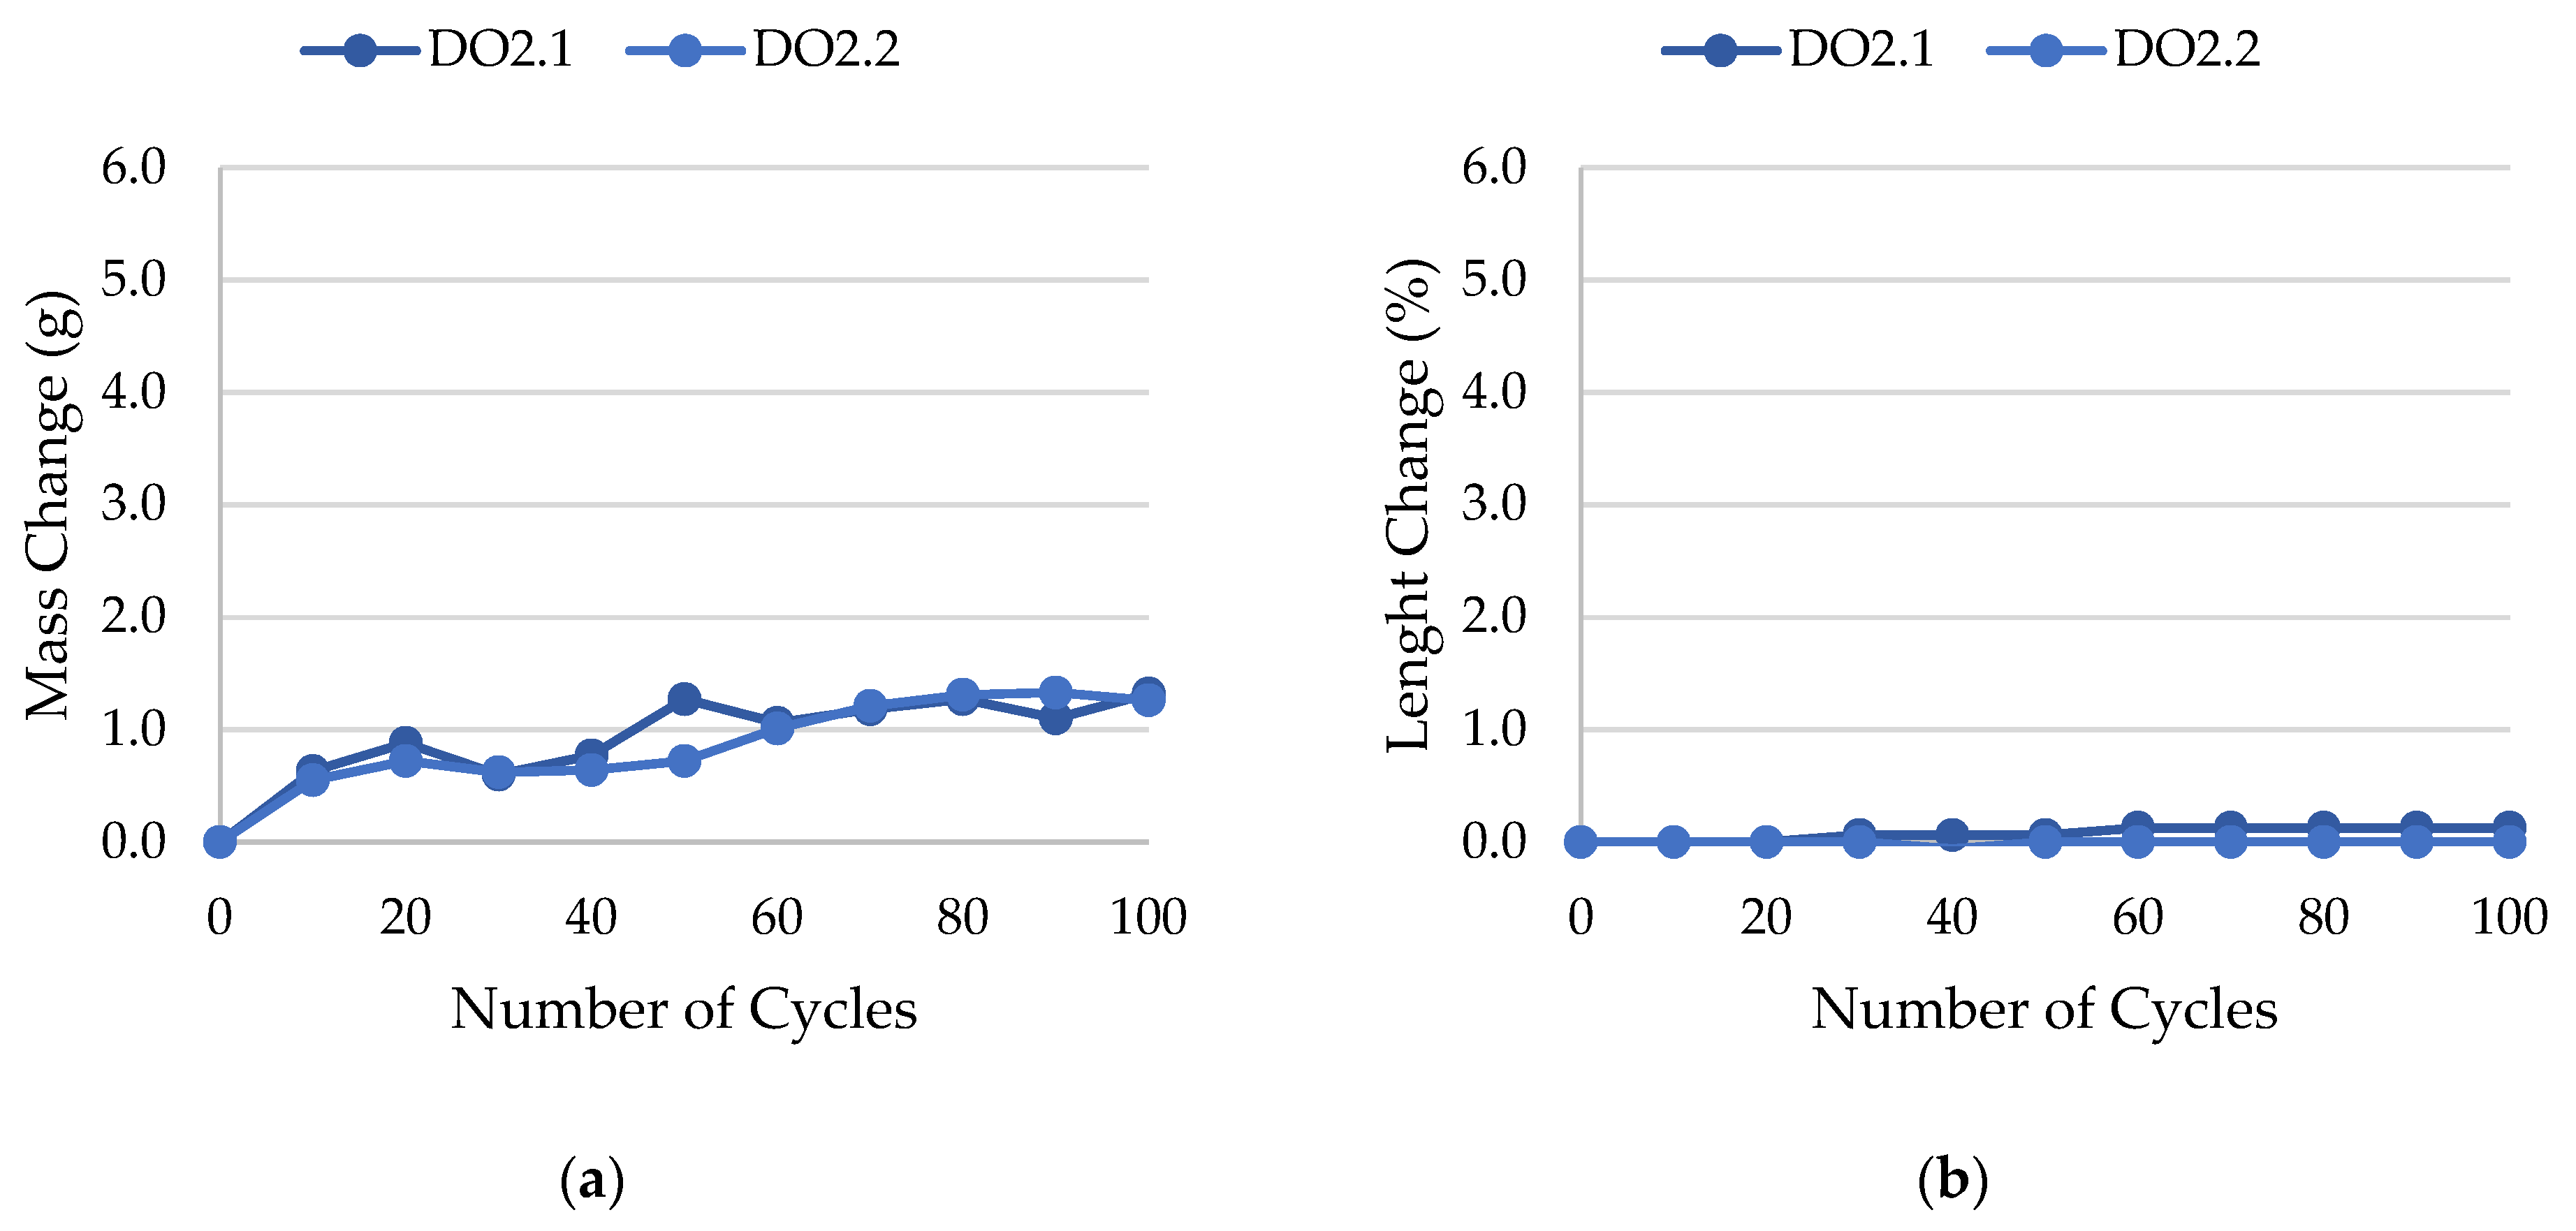
Figure 20.
Result of the freeze–thaw test of sample DO2: (a) mass change; (b) length change.

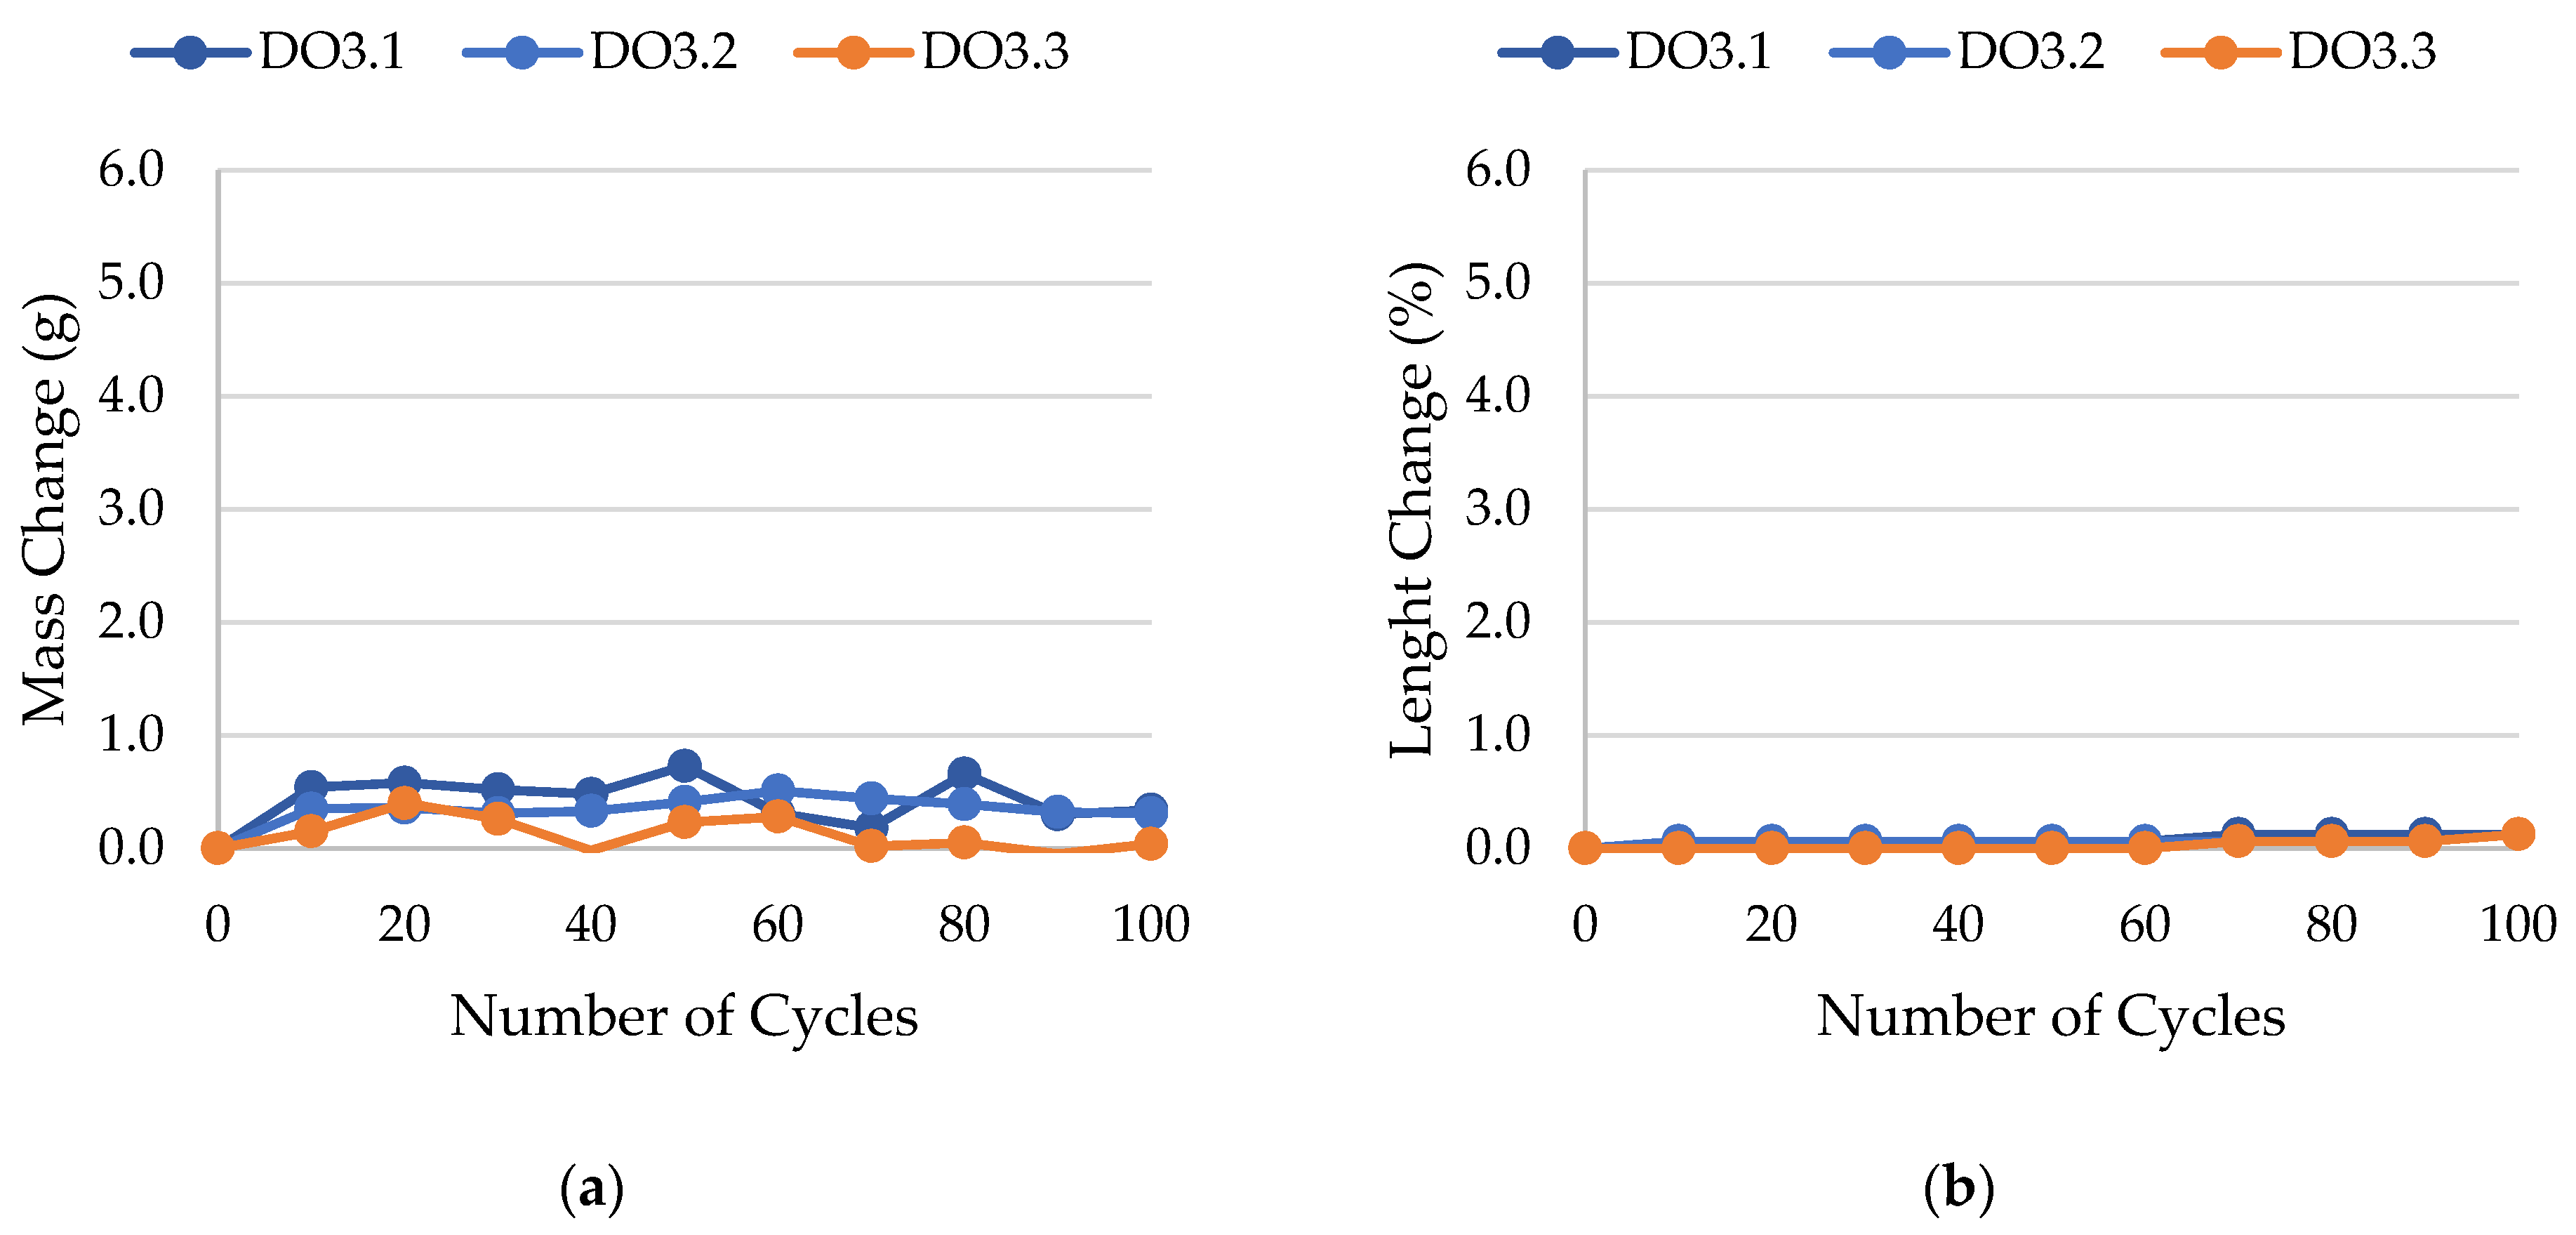
Figure 21.
Result of the freeze–thaw test of sample DO3: (a) mass change; (b) length change.
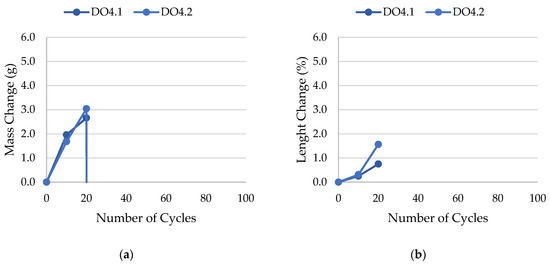
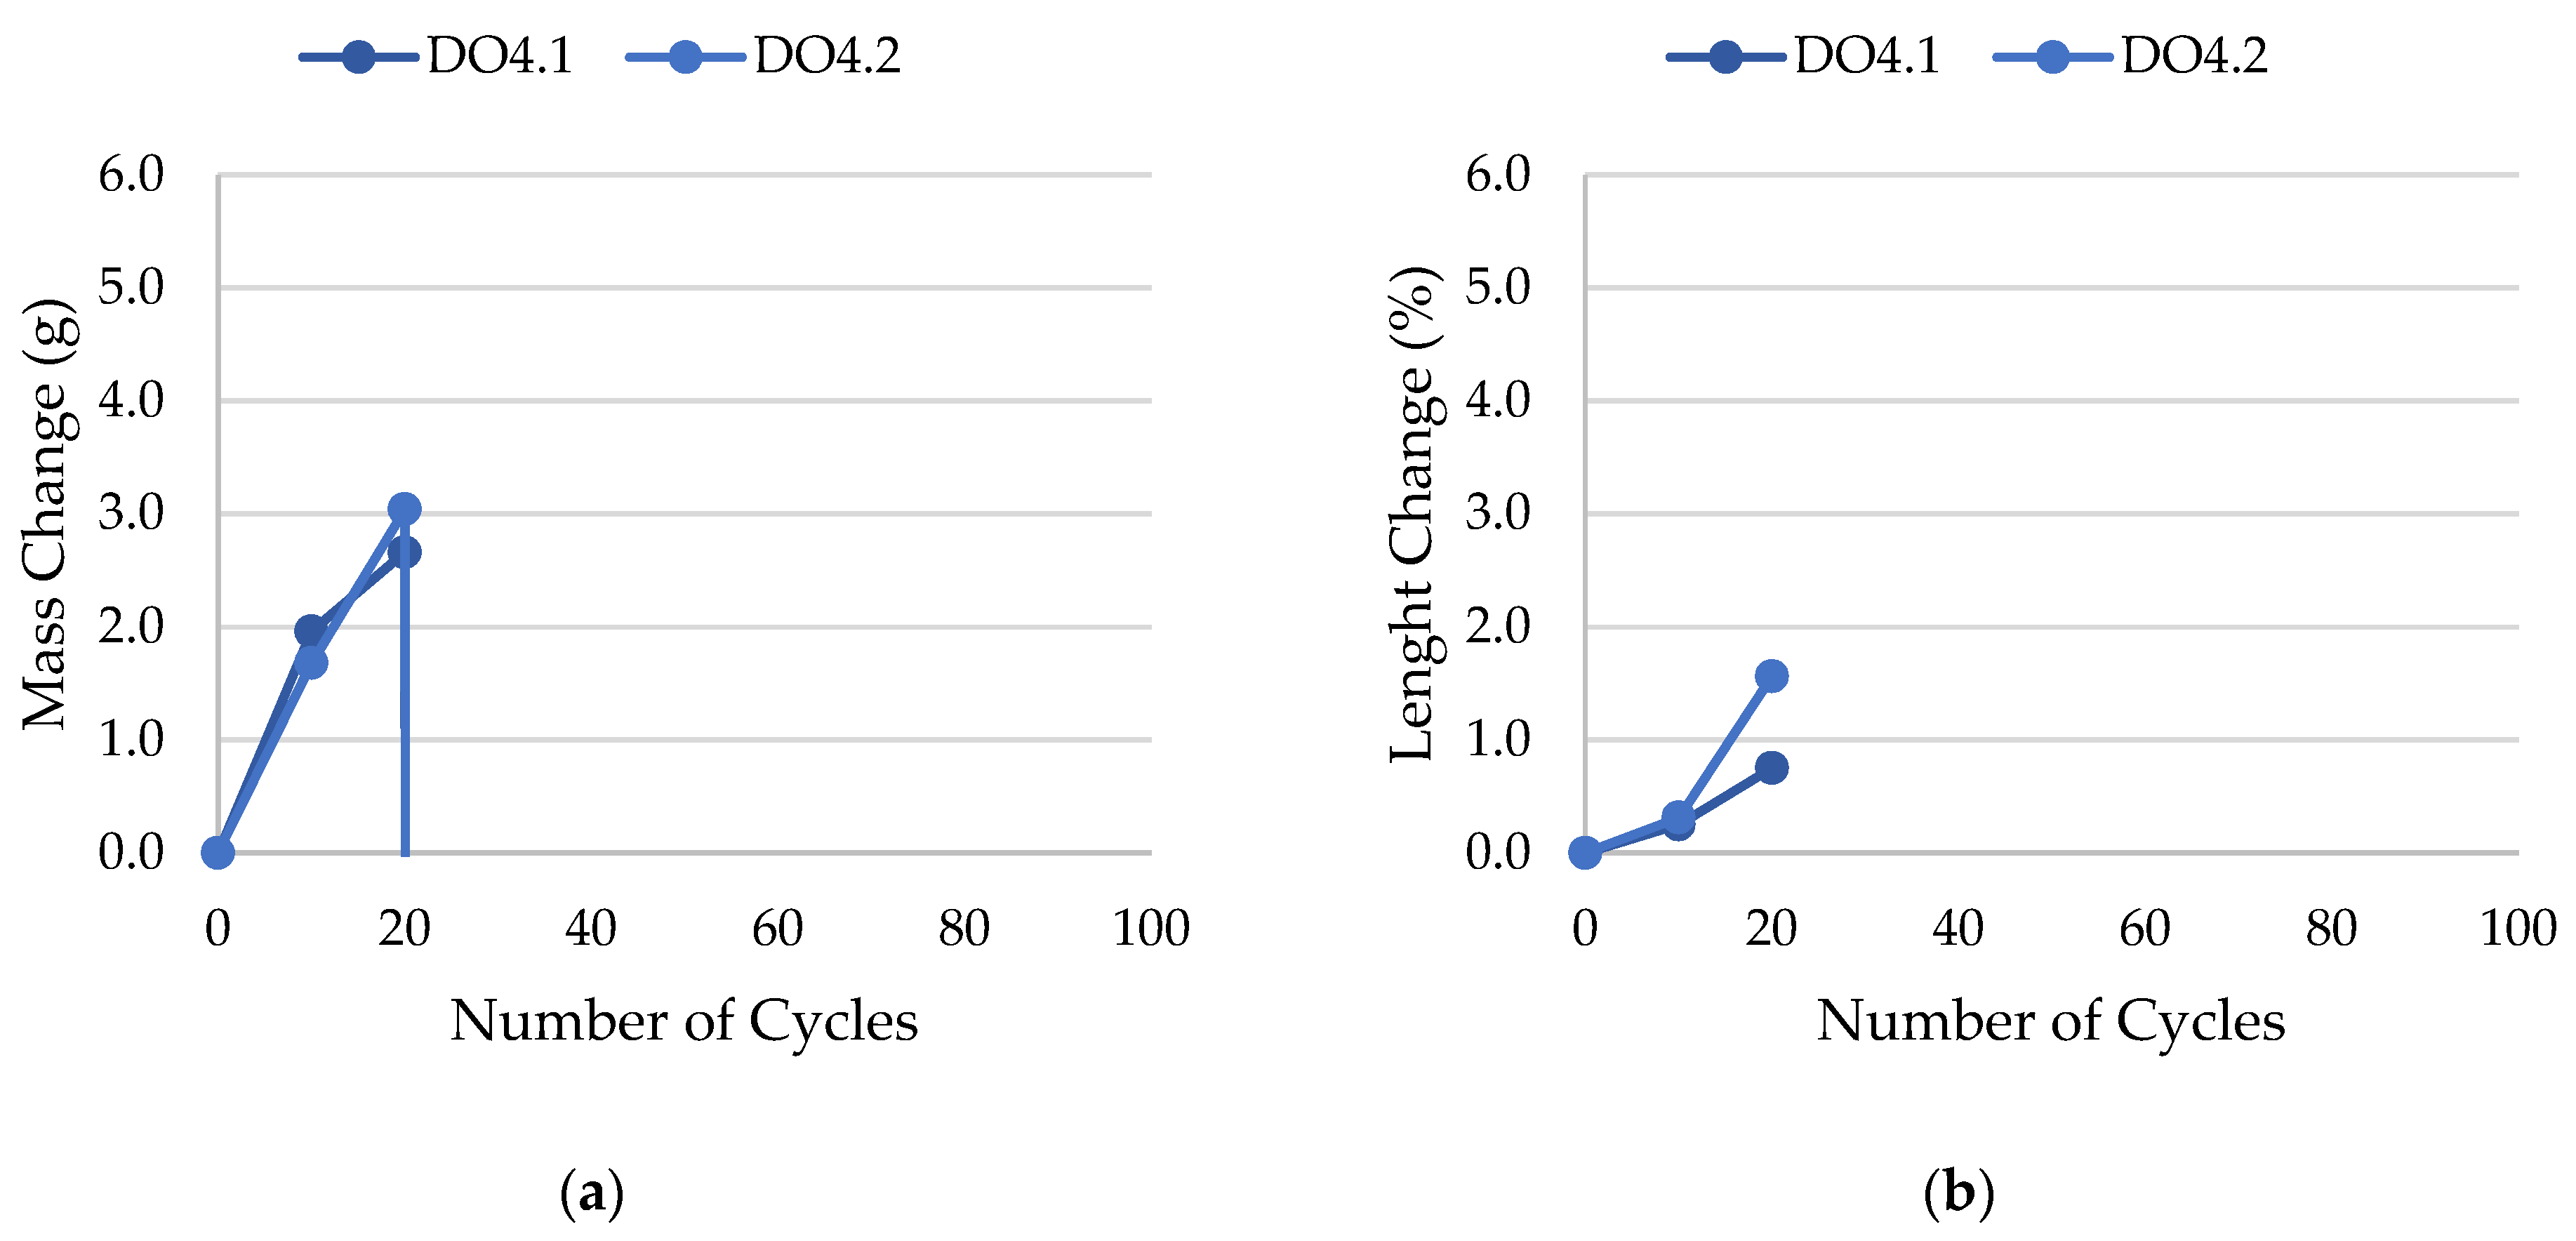
Figure 22.
Result of the freeze–thaw test of sample DO4: (a) mass change; (b) length change.

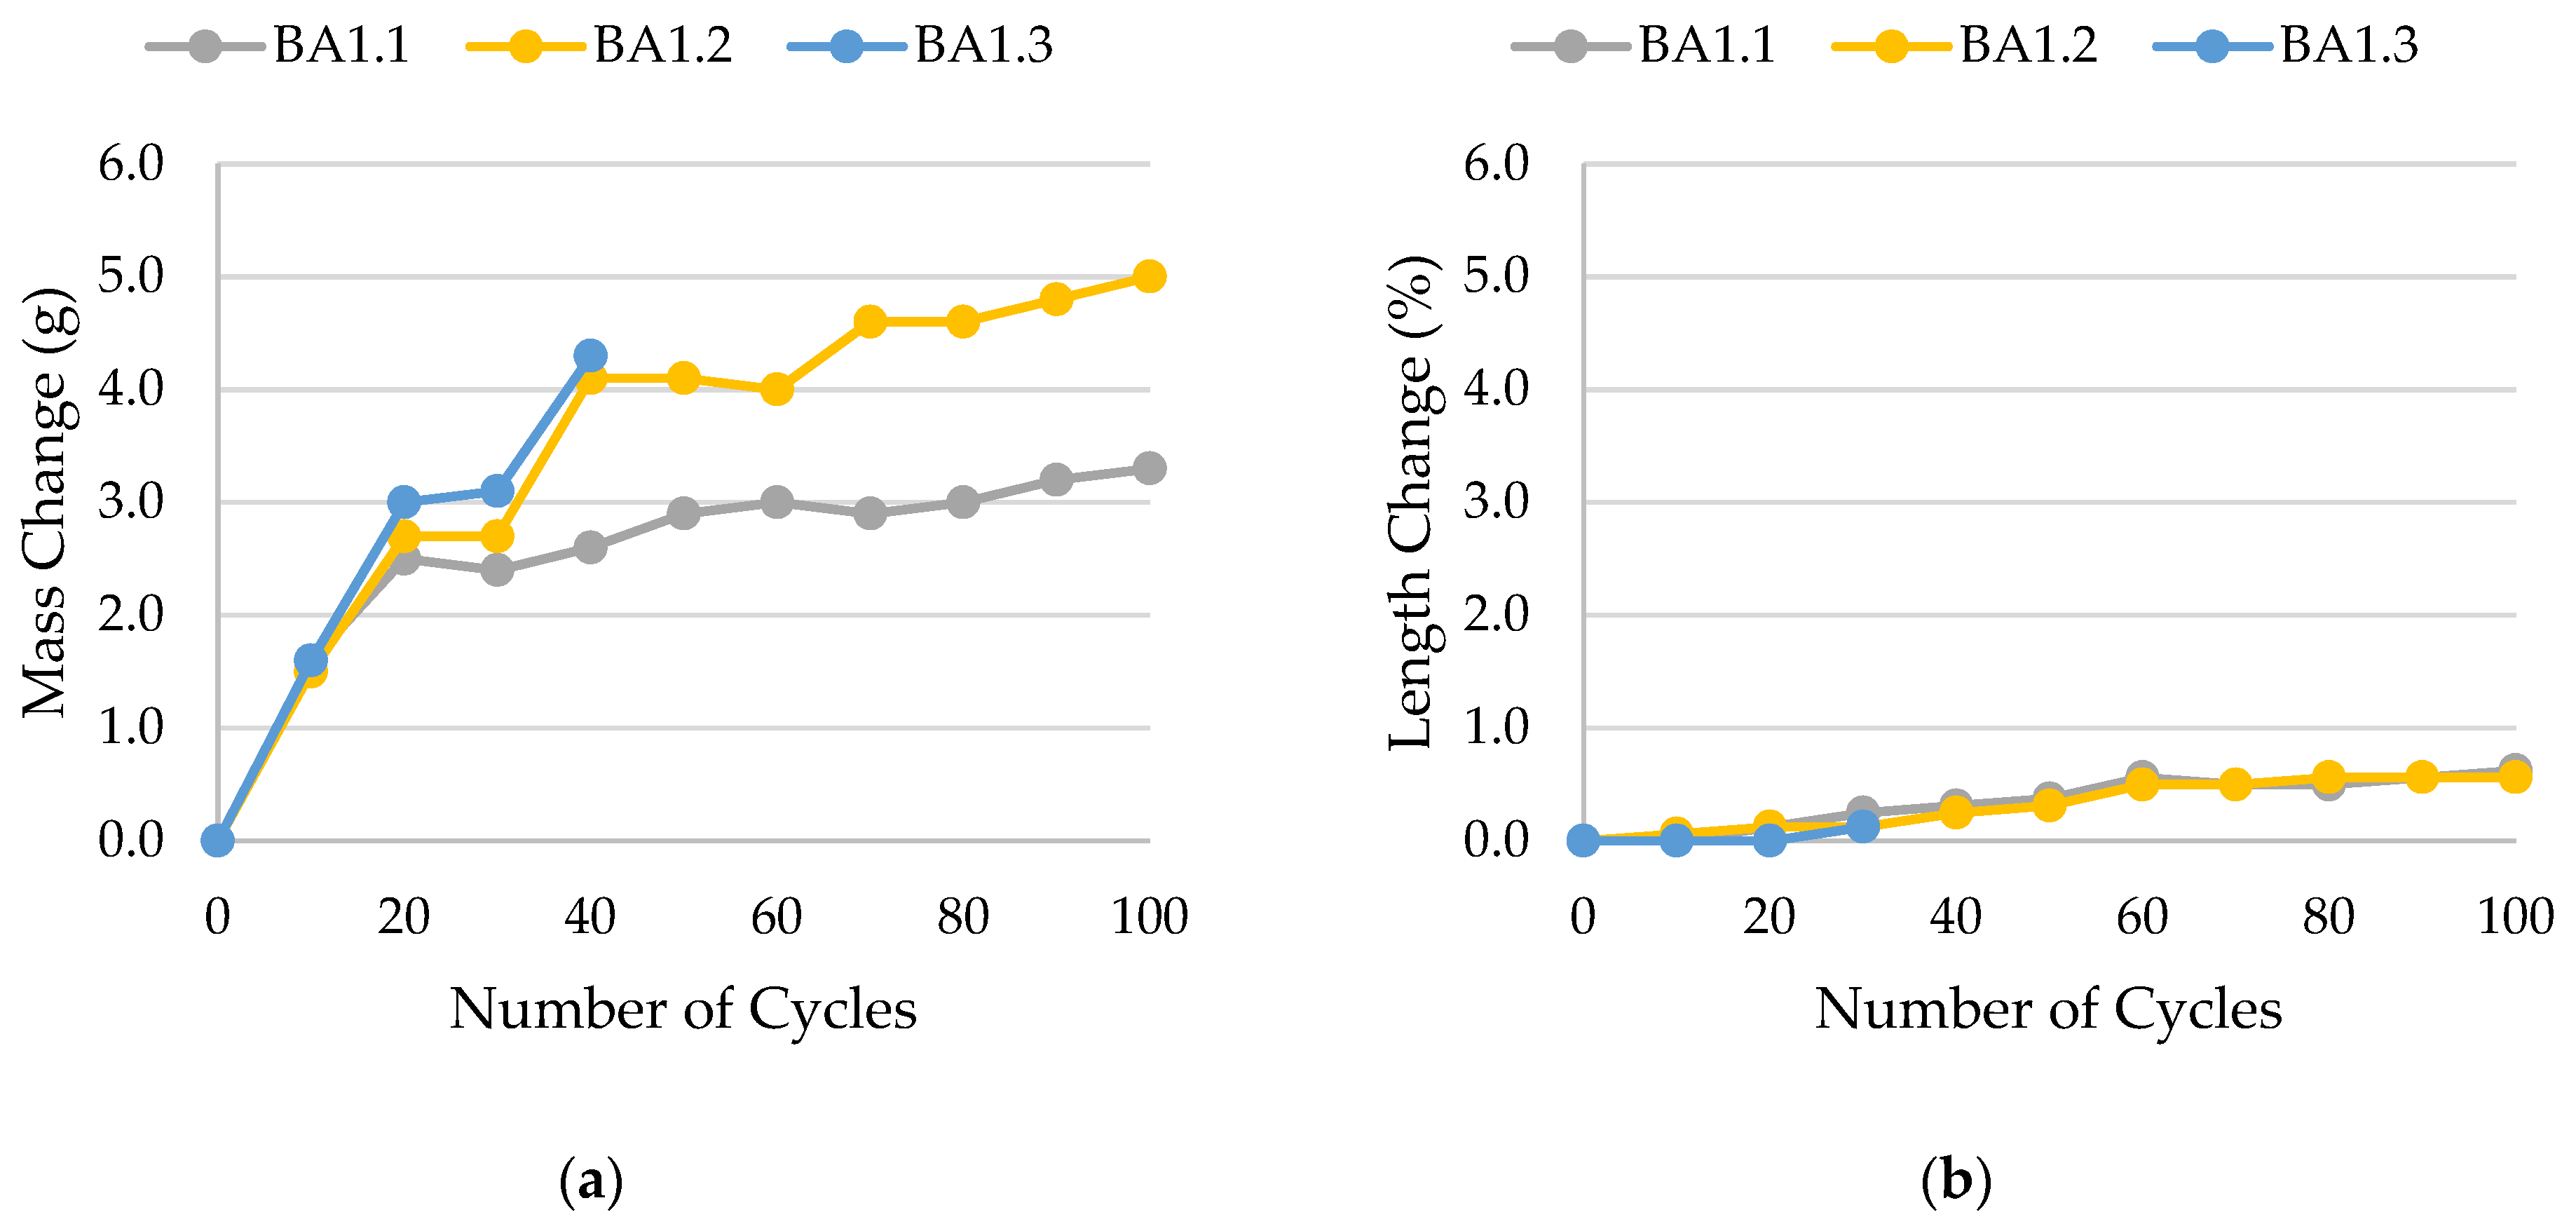
Figure 23.
Result of the freeze–thaw test of sample BA1: (a) mass change; (b) length change.
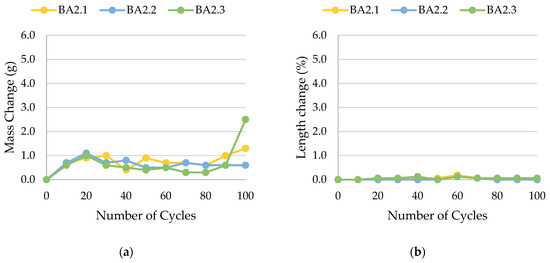
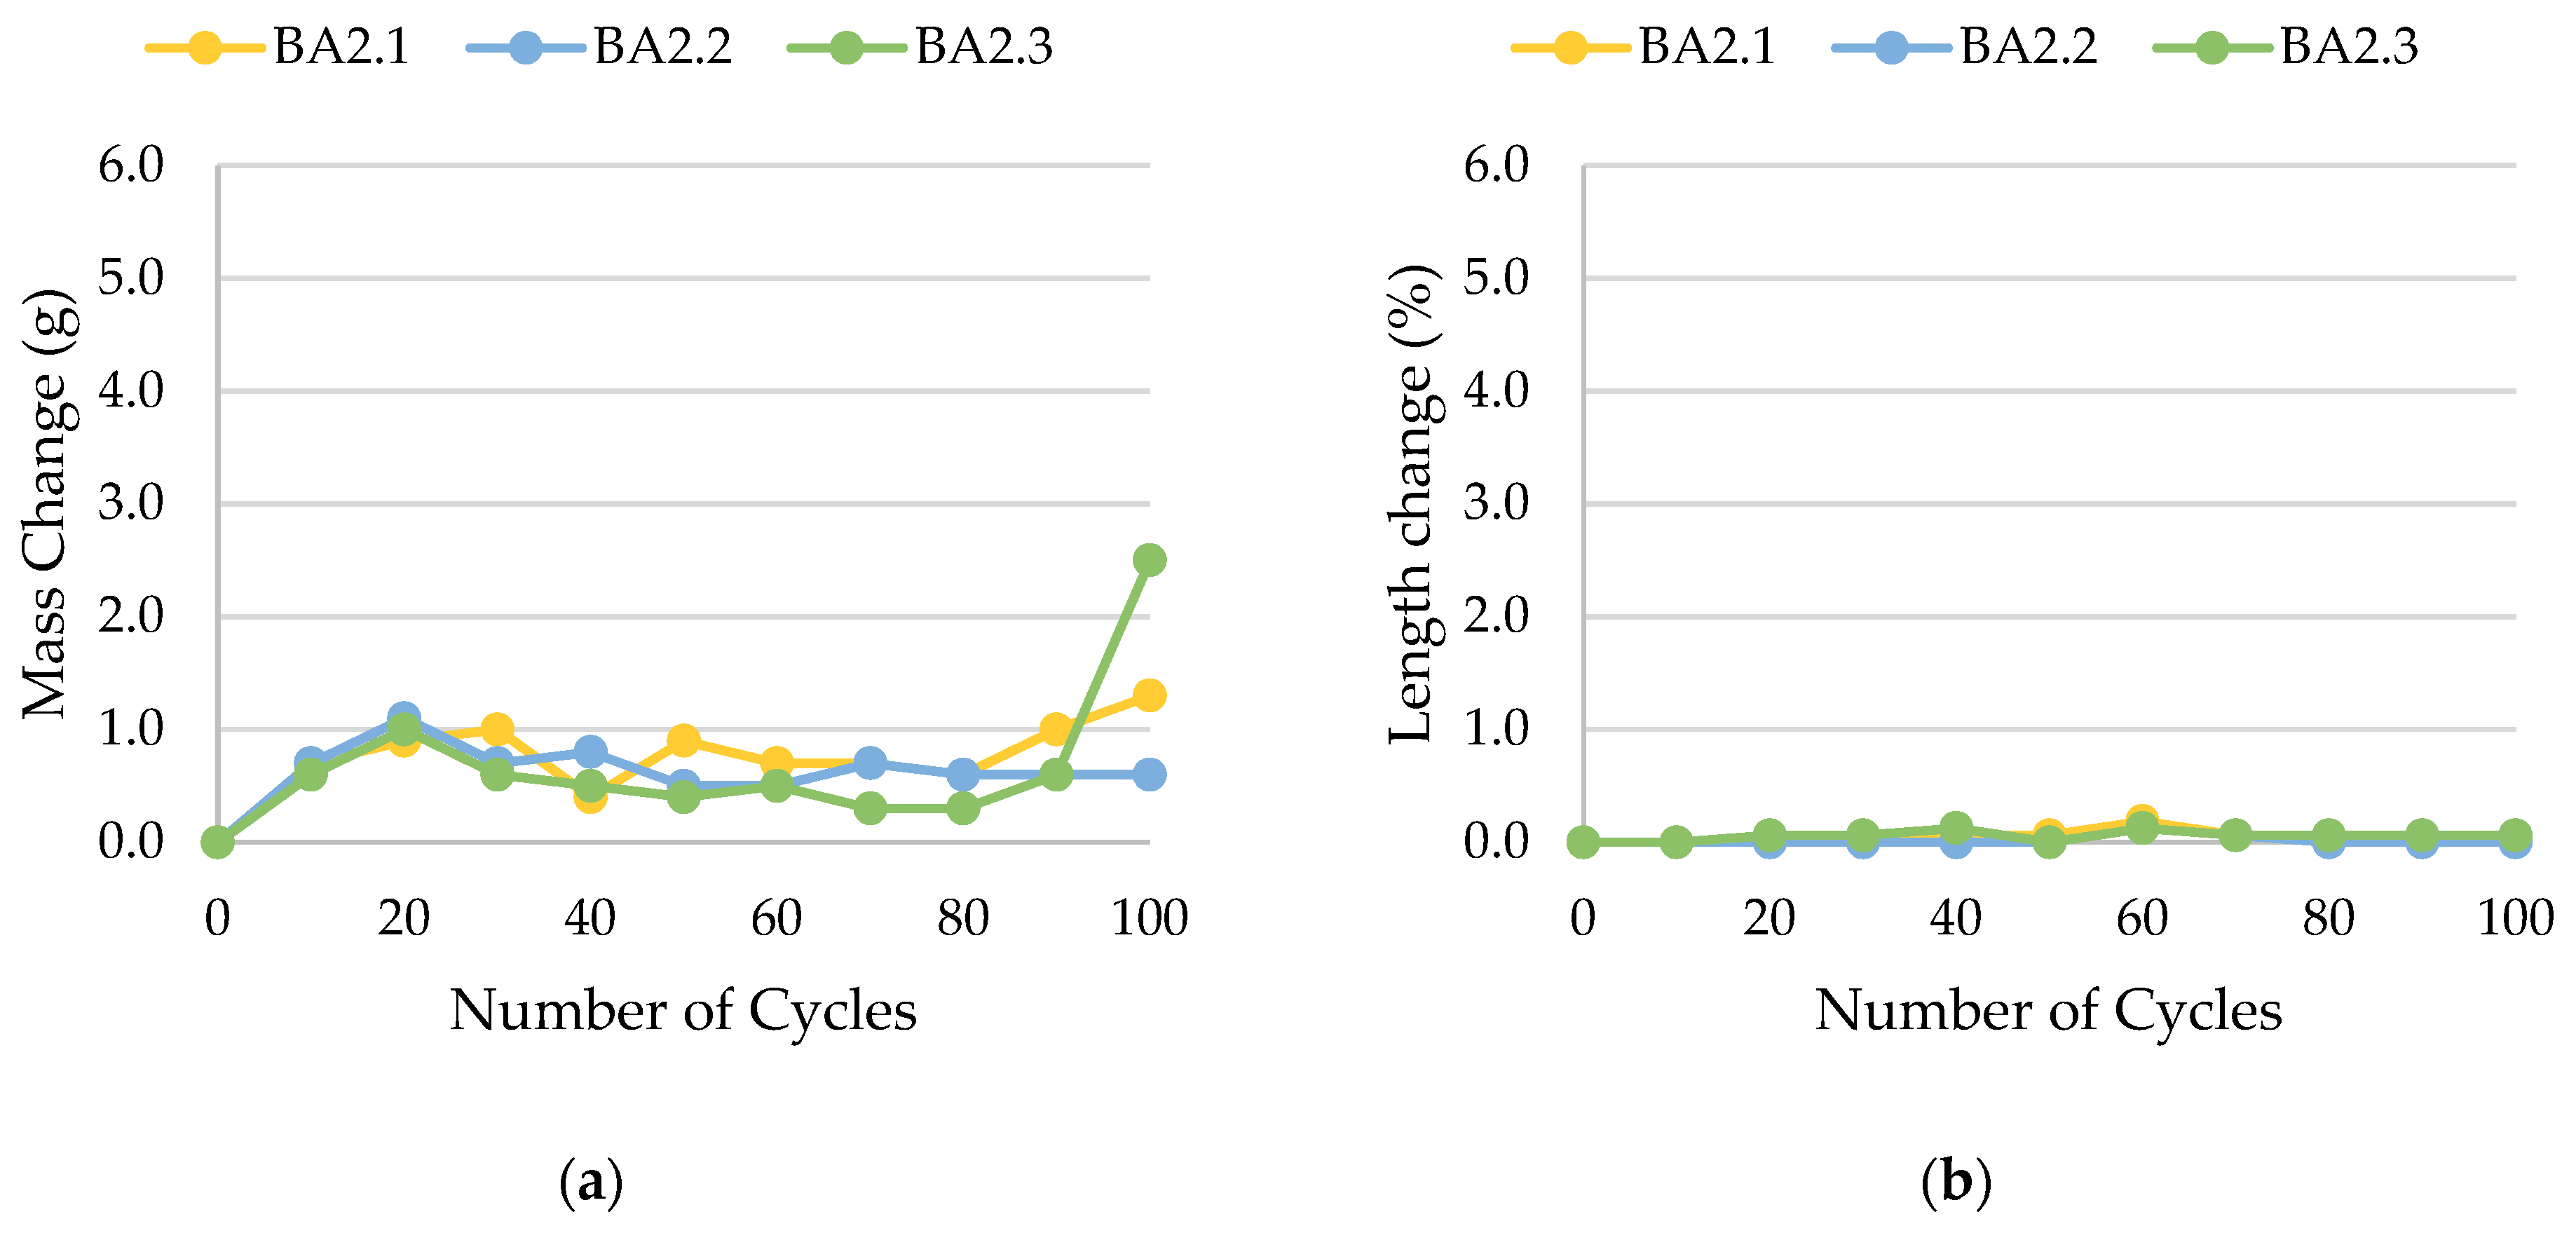
Figure 24.
Result of the freeze–thaw test of sample BA2: (a) mass change; (b) length change.
The LIM1, LIM4, DO2, and DO3 rocks (with a porosity of 1.34%, 9.70%, 1.99%, and 1.72%, respectively) were characterized by good frost resistance (based on the frost resistance test). In the case of the LIM2, LIM3, and BA2, rapid deterioration was observed after 90 freeze–thaw cycles. In the case of rocks BA1, DO1, and DO4, an increase in sample mass accompanied by gradual deterioration was observed. LIM4 was characterized by la ow increase of mass in relation to its porosity. The DO1 dolostone samples were damaged in the frost resistance test. This is potentially due to an additional significant amount of water freezing in the temperature range of −10 to −20 °C. The same applies to the studied basalts. For these samples, a slight increase in weight is recorded during subsequent freeze–thaw cycles. In the case of the LIM3 limestone, for which damage was recorded on the outer surface of the samples, there was a gradual increase in mass in cyclic freezing tests. In both the LIM3 limestone and the LIM2 and LIM4 limestones, the majority of the water freezes to a temperature of −20 °C. In the case of the LIM3 rock, a significant difference is observed in the cumulative pore volume obtained in the MIP and TMP tests. This may indicate that the pore space in this material is composed mostly of pores with radii larger than 40 nm, which are connected by constrictions with radii of approximately 10 nm.
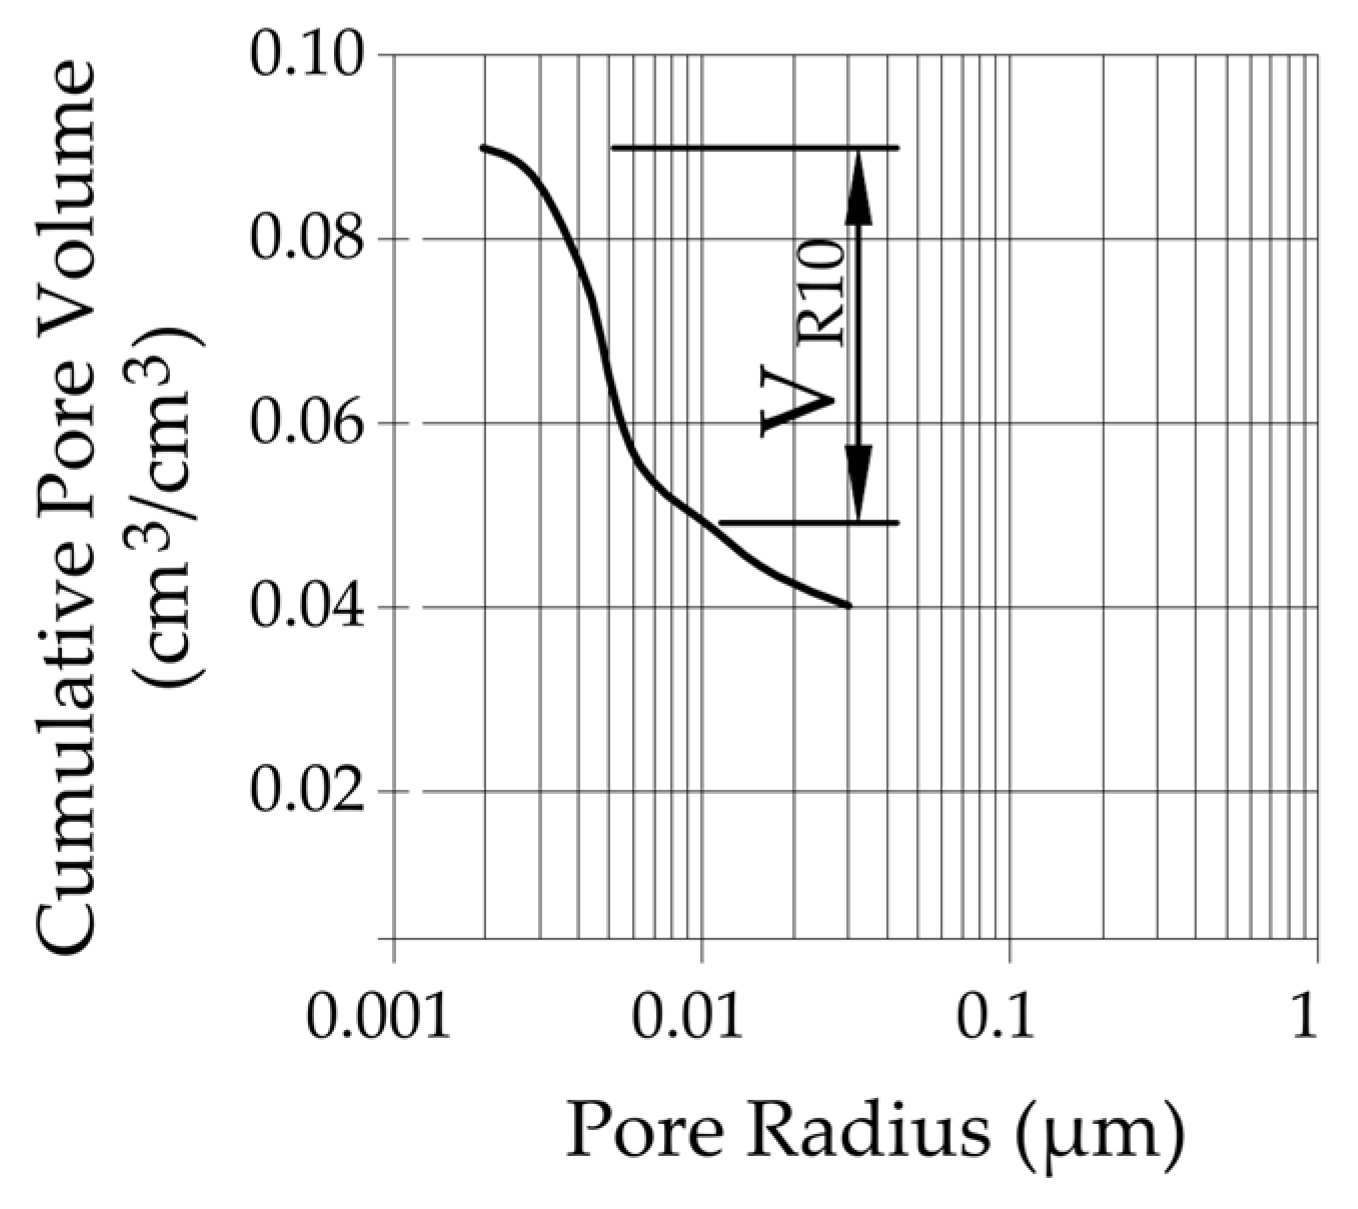
To distinguish between frost-durable and not frost-durable rocks, we used the volume of pores with a radius below 10 nm calculated by the thermoporometry method (VR10 parameter). Figure 25 shows the graphical interpretation of the VR10 parameter.
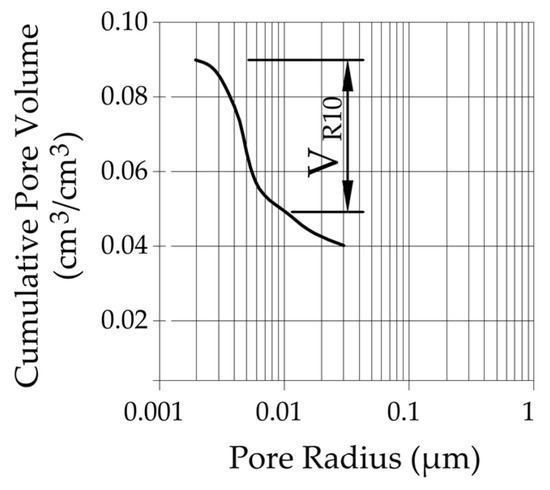
Figure 25.
Graphical interpretation of the VR10 parameter.
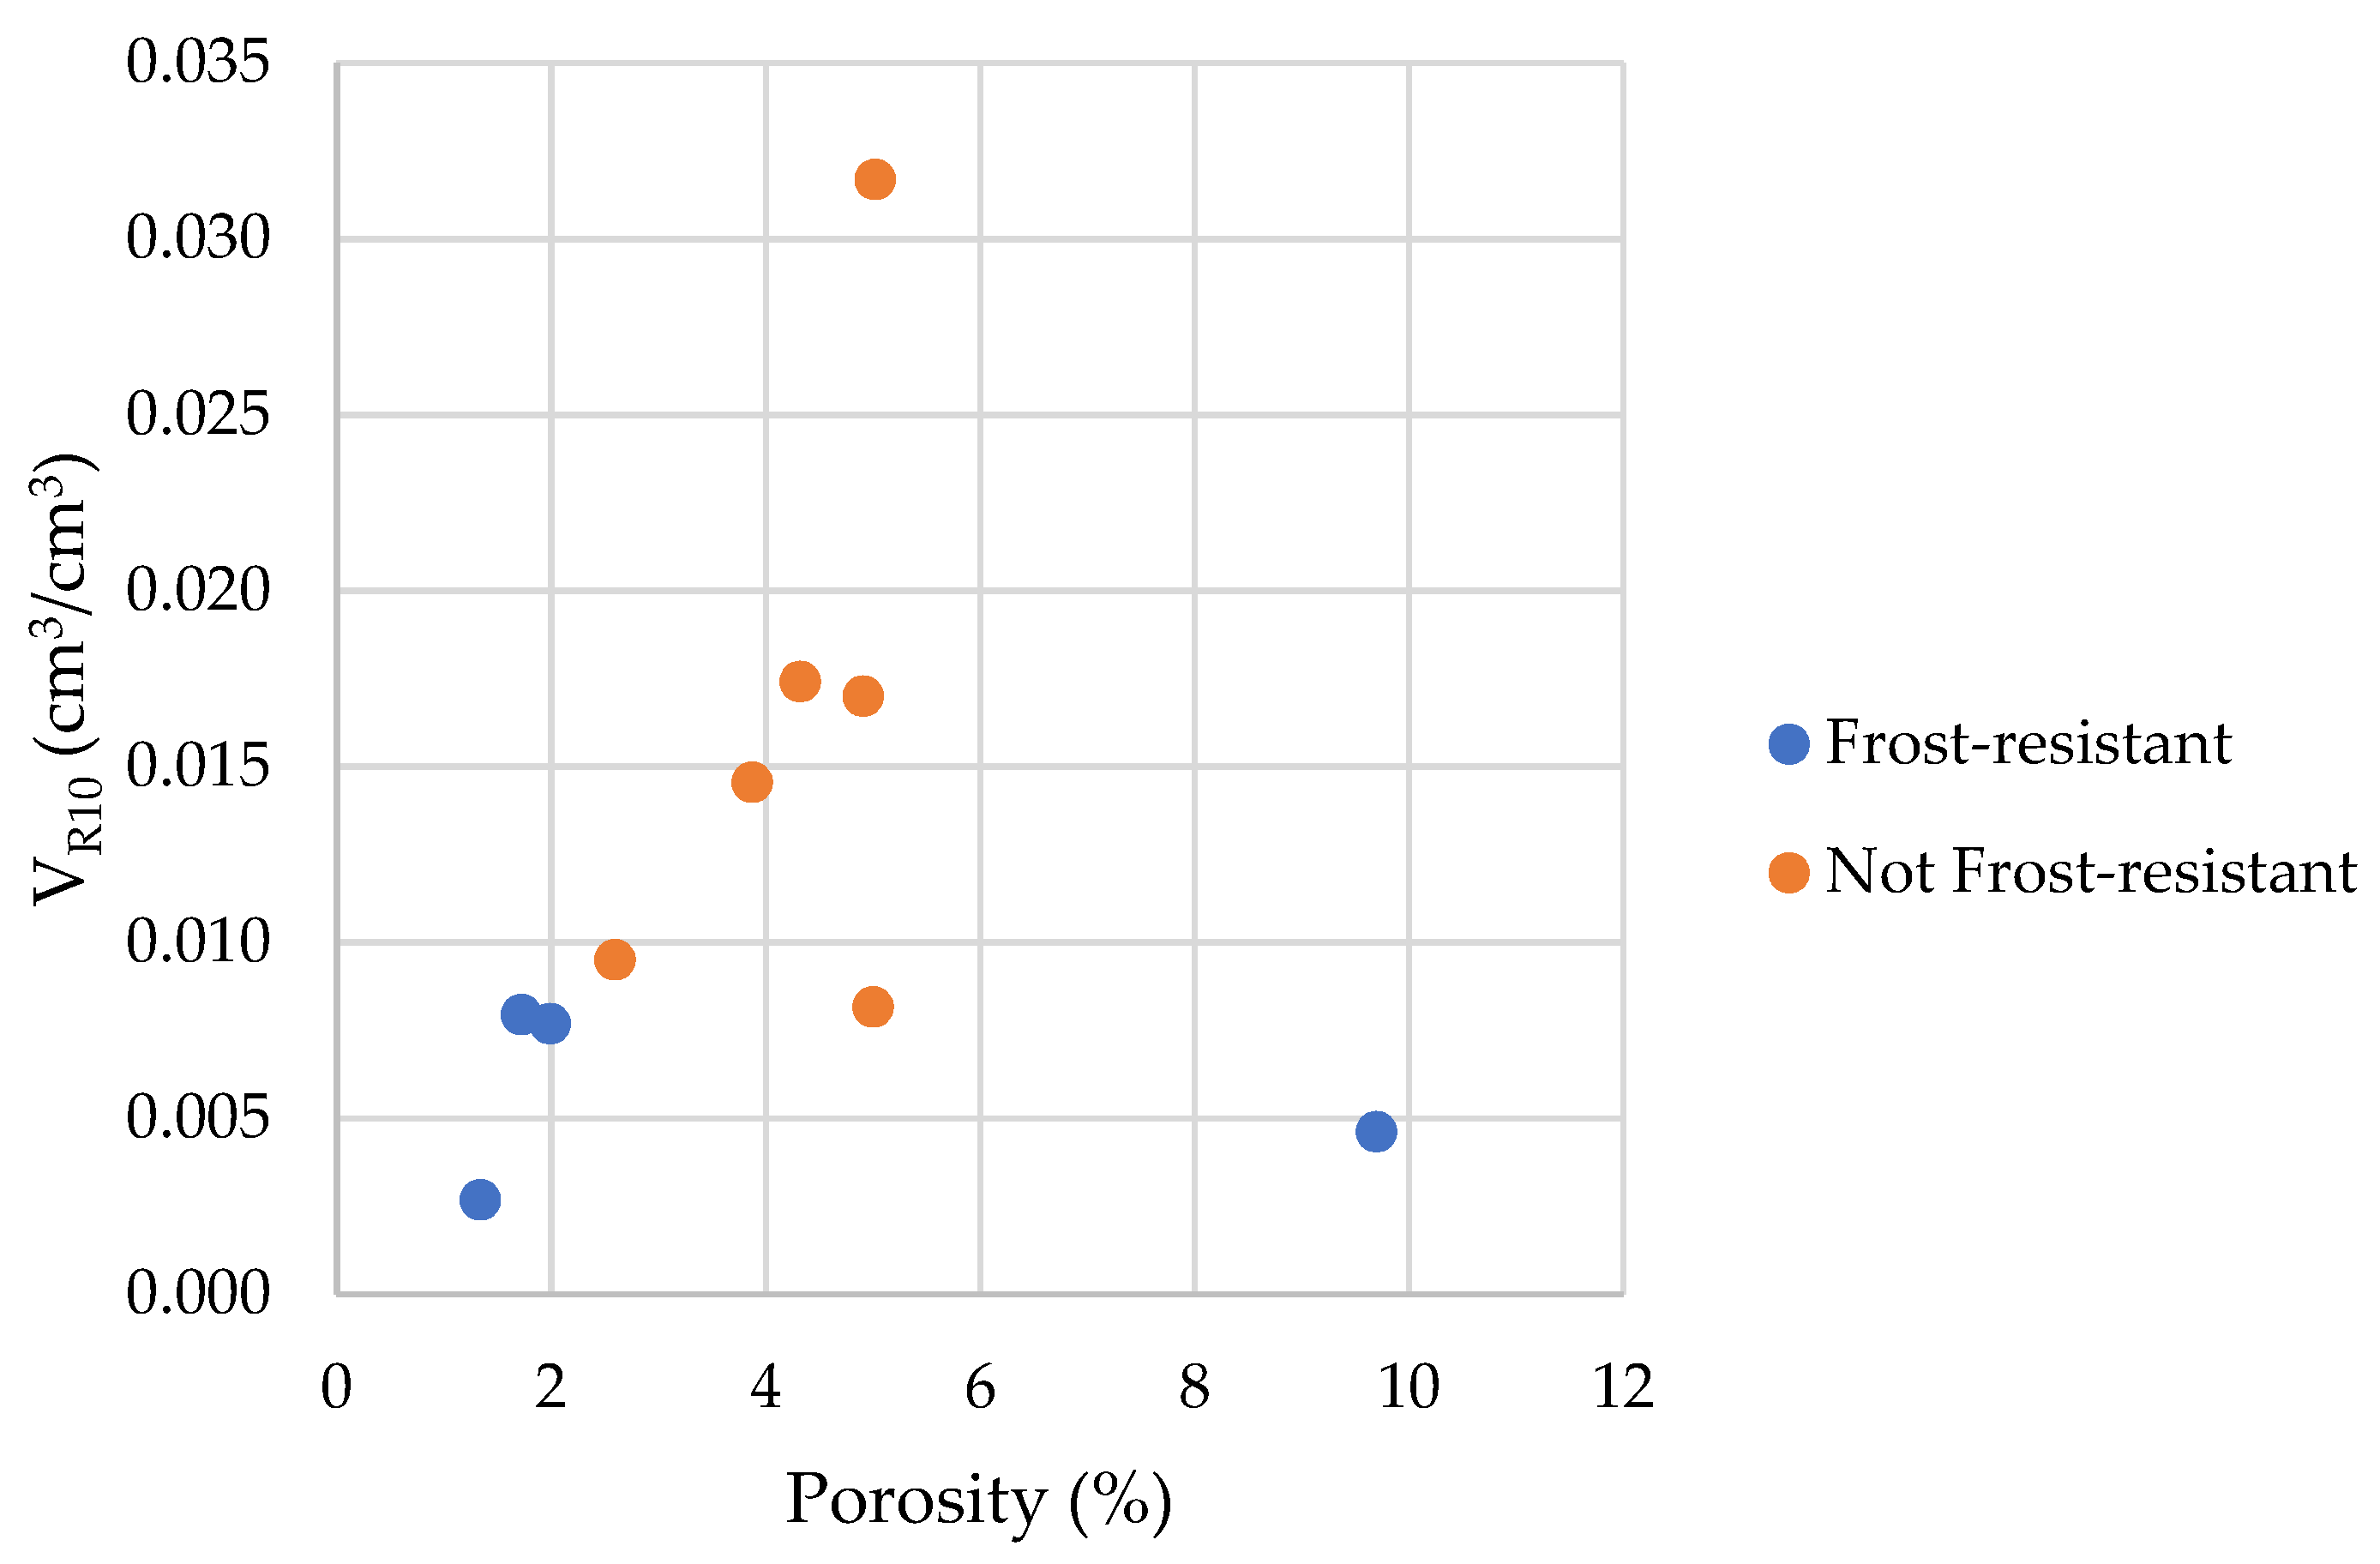
In the case of frost-resistant rocks, the share of pores below 10 nm in which the phase transition of water occurred is less than 0.008 cm3/cm3 (see Figure 26). To determine the exact VR10 value that would distinguish rocks that do not show significant damage on the outer surface after 100 freezing cycles, tests should be conducted on a larger population, which will be the subject of future research.
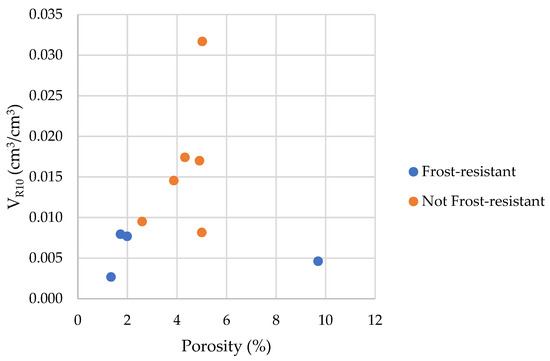
Figure 26.
A comparison of the VR10 parameter with the porosity of tested rocks.
Results of the cumulative pore volume VR10 and the information about the frost resistance of the tested rocks are introduced in Table 3.
Table 3.
Results of the cumulative pore volume and the determination of frost resistance of rocks.
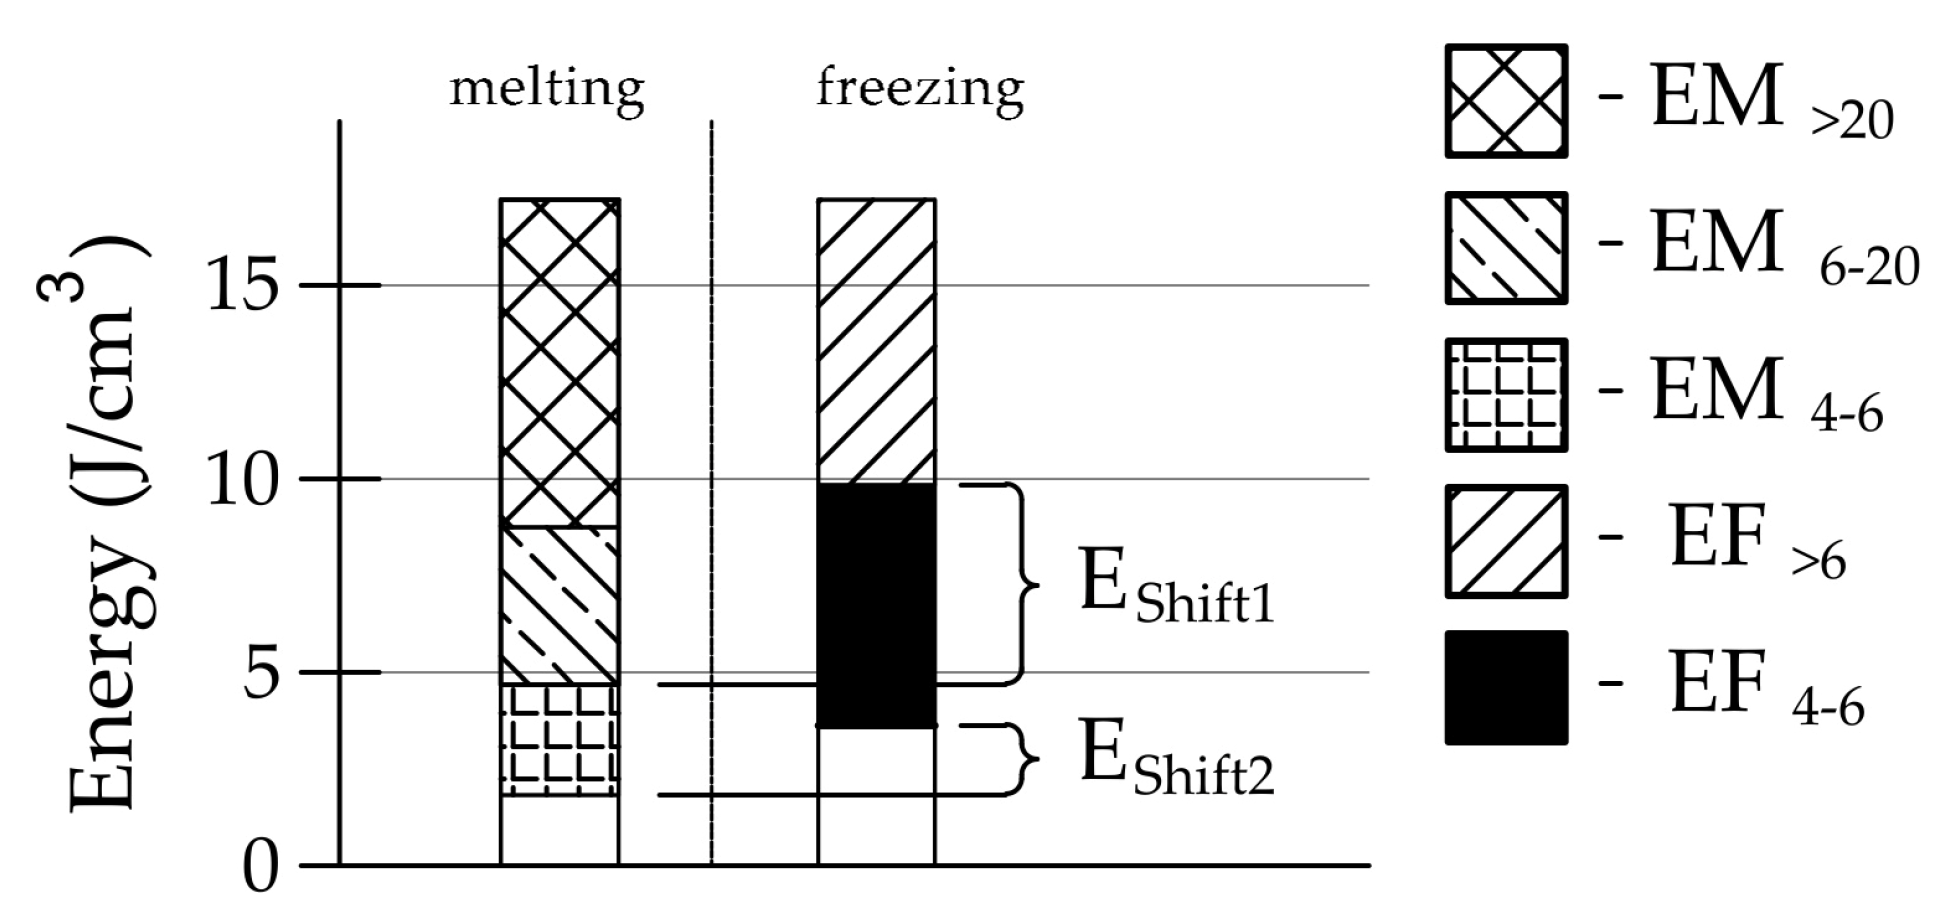
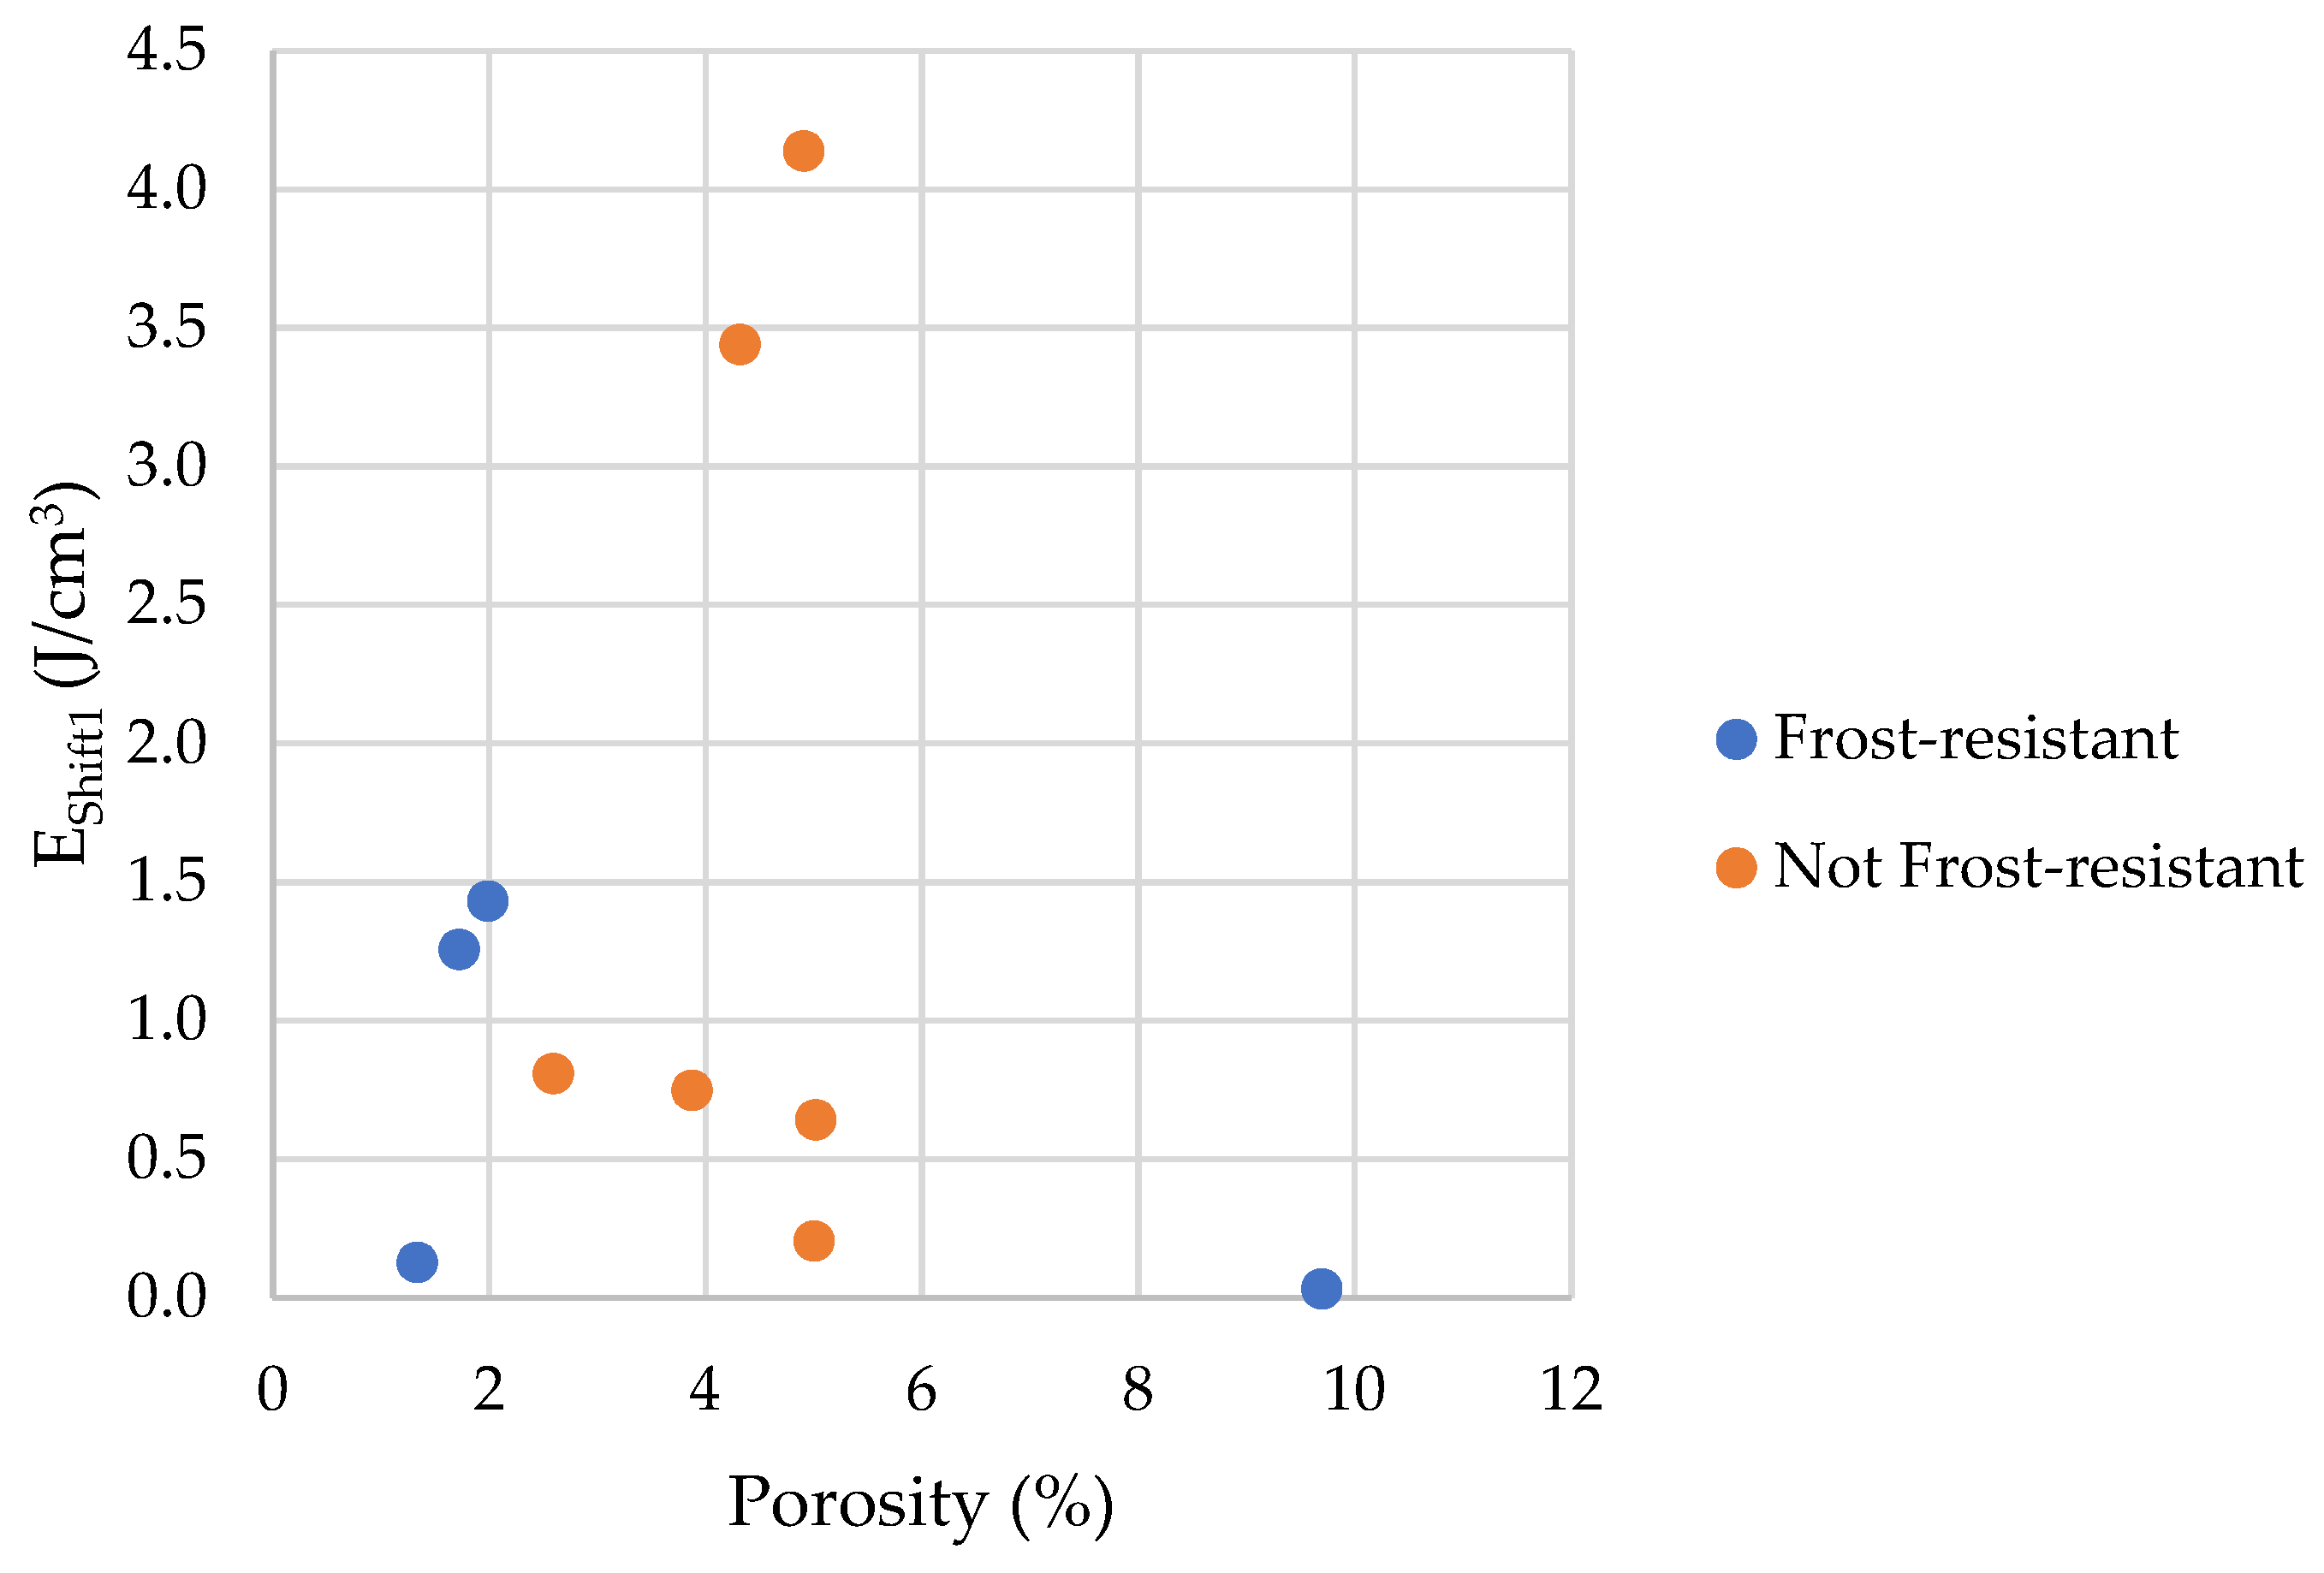
As described in the introduction, the occurrence of freezing effects can be attributed to two effects, pore connections or the presence of pore diameters corresponding to the freezing temperature according to Equation (2). To determine the influence of pore connections, it is possible to compare the process of water freezing and ice melting. For this purpose, we propose two factors EShift1 and EShift2 (Equations (5) and (6), see Figure 27).
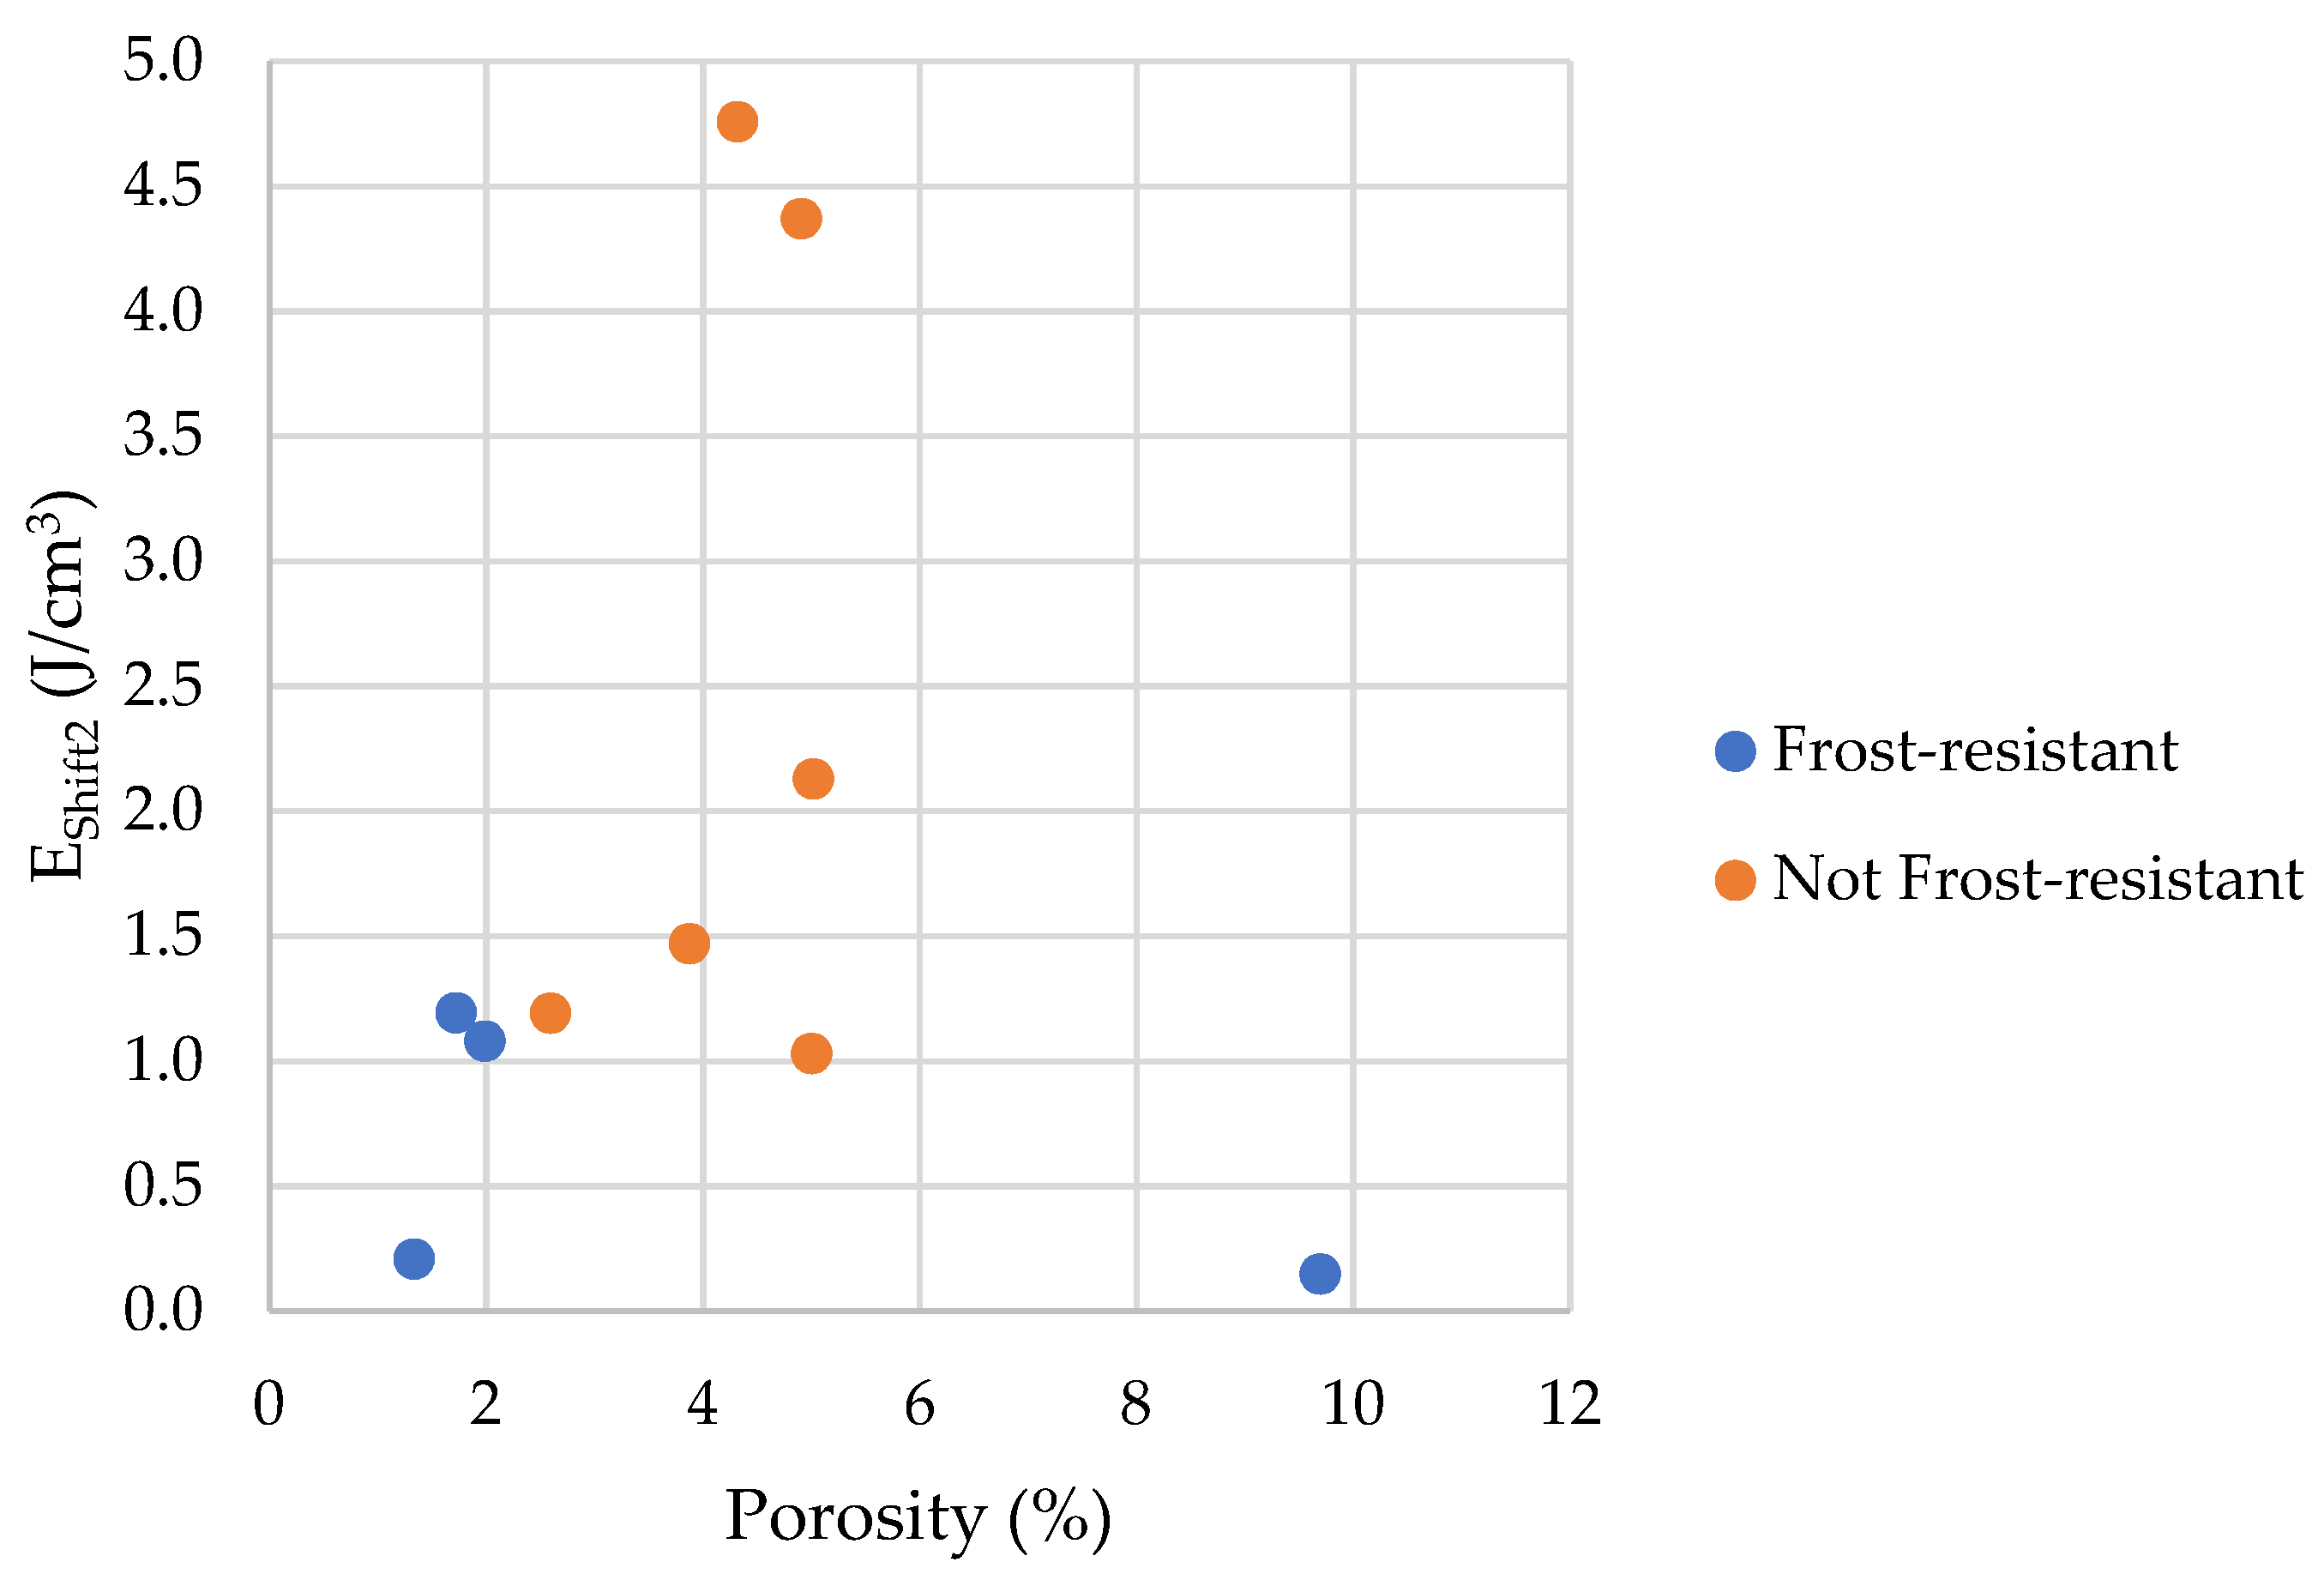
where EShift1 is the index of the influence of pore connections with a radius above 6 nm, and EShift2 is the index of the influence of pore connections with a radius above 4 nm.

Figure 27.
Graphical interpretation of the EShift1 and Eshift2 parameters.
The bigger the values of EShift1 and EShift2, the more prominent the influence of pore connections on the freezing process.
The Figure 28 and Figure 29 shows that the share of pores below 10 nm, in which phase transition can occur, has no significant impact on frost resistance. The frost resistance of a rock does not depend on the total amount of water that undergoes a phase change (Cumulative Energy—ESUM, see Figure 30). The influence of interconnections between pores on the frost resistance of rocks remained an open question. Based on the values of the EShift1 and EShift2 indicators one can conclude that the influence of pore connection does not have a significant impact on their frost resistance.
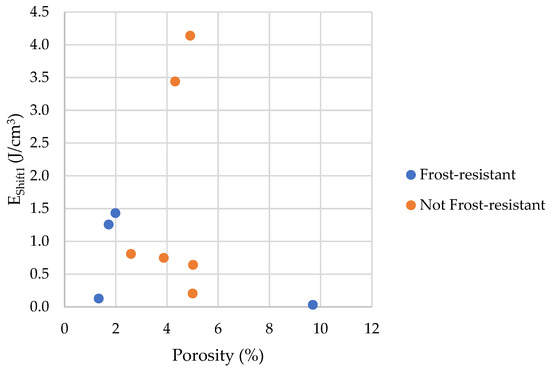
Figure 28.
A comparison of the EShift1 parameter with the porosity of tested rocks.

Figure 29.
A comparison of the EShift2 parameter with the porosity of tested rocks.
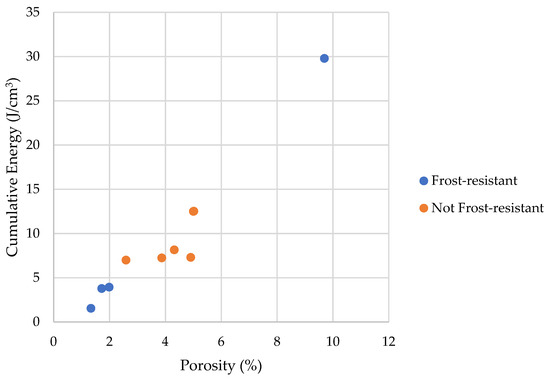
Figure 30.
A comparison of cumulative energy with the porosity of tested rocks.
No significant trend was observed between VR10, EShift1, and EShift2, the degree of pore filling, and porosity with the rate at which non-frost-resistant samples were damaged. From the above, it can be concluded that increasing the number of cycles to 100 as proposed in the literature seems reasonable to distinguish between frost-resistant and non-frost-resistant samples [21,24].
4. Conclusions
This paper focused on using the differential scanning calorimetry and the thermoporometry method for the assessment of water phase transition in the pore spaces of ten types of tested rocks. This analysis was supplemented with the results of pore size distribution using the mercury intrusion porosimetry method and the standard rock frost resistance research. The main conclusions of the study are as follows:
- Frost resistance research of rocks was conducted on cylindrical samples subjected to 100 freeze–thaw cycles. In the case of samples LIM2, LIM3, BA1, BA2, DO1, and DO4, visible cracks and damage on the samples were observed during frost resistance tests. For the DO1 and BA1 samples, this is expected to be due to a significant amount of water freezing in the temperature range from –9 °C to –20 °C (Figure 4, EF4–6 value). The EF4–6 value for all non-frost durable samples was higher than 0.68 J/cm3.
- The investigation confirms good frost resistance for rocks with porosity below 2% (LIM1, DO2, DO3). In the case of non-frost-resistant rocks, based on the analysis of test results from the differential scanning calorimetry and thermoporometry methods, a significant share of pores with a radius of less than 10 nm was found, with a larger value than 0.008 cm3/cm3. The LIM4 sample with a porosity of 9.70% has good frost resistance, which can be explained by it having a VR10 smaller than 0.008 cm3/cm3 and an insignificant amount of absorbed water during freeze–thaw cycles.
- The use of algorithms taking into account the thermal inertia of the DSC measuring system may be a useful tool for assessing the pore space of rocks and interpreting the obtained results. The scanning calorimetry method (DSC) and thermoporometry method (TMP) are valuable supplements to information about the frost resistance of rocks determined by commonly used methods. The use of these methods allowed us to expand our knowledge about the frost resistance of rocks, especially those with porosity in the range of 2–12%. The usefulness of the DSC and TMP methods in assessing the phase transitions of the tested materials was indicated.
It is planned to focus on extending the research to a wider range of rocks.
Author Contributions
Conceptualization, P.S. and E.S.; methodology, P.S.; software, P.S.; validation, P.S. and E.S.; formal analysis, P.S.; investigation, P.S.; data curation, P.S.; writing—original draft preparation, P.S.; writing—review and editing, E.S.; visualization, P.S.; supervision, P.S.; funding acquisition, P.S and E.S. All authors have read and agreed to the published version of the manuscript.
Funding
This work was supported by The National Centre of Research and Development (Poland) within project N R04 006 10.
Institutional Review Board Statement
Not applicable.
Informed Consent Statement
Not applicable.
Data Availability Statement
Data are contained within the article and supplementary materials.
Conflicts of Interest
The authors declare no conflict of interest.
Abbreviations
| DSC | differential scanning calorimetry method |
| EShift1 | the index of the influence of pore connections with a radius above 6 nm |
| EShift2 | the index of the influence of pore connections with a radius above 4 nm |
| ESUM | the total amount of water that undergoes a phase change in the DSC research |
| EF>6 | the total energy corresponding to the contamination of water in pores with a radius above 6 nm |
| EF4–6 | the total energy corresponding to the contamination of water in pores with a radius of 4 to 6 nm |
| EM4–6 | the total energy corresponding to the melting of ice in pores with a radius of 4 to 6 nm |
| EM6–20 | the total energy corresponding to the melting of ice in pores with a radius of 4 to 6 nm |
| EM>20 | the total energy corresponding to the melting of ice in pores with radii above 20 nm |
| M | molar mass of the liquid |
| MIP | mercury intrusion porosimetry method |
| NMR | nuclear magnetic resonance techniques |
| r* | critical size of the nuclei |
| rK | solid–liquid surface curvature |
| rp | pore radius |
| T | temperature of phase change |
| T0 | freezing temperature of bulk liquid |
| TMP | thermoporometry method |
| VR10 | cumulative pore volume of pores with radii under 10 nm |
| γlc | solid–liquid surface curvature |
| ΔG | thermodynamic potential |
| ΔHfus | heat of fusion |
| Θ | contact angle |
| ρl | density of liquid |
References
- Nasri, F.; Boumezbeur, A.; Benavente, D. Influence of the petrophysical and durability properties of carbonate rocks on the deterioration of historic constructions in Tebessa (northeastern Algeria). Bull. Eng. Geol. Environ. 2019, 78, 3969–3981. [Google Scholar] [CrossRef]
- Fico, D.; Rizzo, D.; Casciaro, R.; Esposito Corcione, C. Historically accurate reconstruction of the materials and conservation technologies used on the facades of the artistic buildings in Lecce (Apulia, Italy). Materials 2022, 15, 3658. [Google Scholar] [CrossRef] [PubMed]
- Benavente, D. Why pore size is important in the deterioration of porous stones used in the built heritage. Macla 2011, 15, 41–42. Available online: https://rua.ua.es/dspace/handle/10045/19869 (accessed on 13 December 2023).
- Stelmaszczyk, G.; Świercz, P. Evaluation of calcareous aggregate usability for frost resistance concretes. Struct. Environ. 2009, 1, 5–10. [Google Scholar]
- Yates, T.; Mauko, A. Freeze thaw susceptibility of natural stone—Characterization of the mechanical strength and microstructure during frost cycling. In Proceedings of the DBMC International Conference on Durability of Building Materials and Components, Istanbul, Turkey, 11–14 May 2008. [Google Scholar]
- Skowera, K. Analysis of frost resistance and physical properties of devonian compact limestones deriving from one deposit. Struct. Environ. 2016, 8, 31–36. [Google Scholar]
- Karel, M.; Lund, D.B. Physical Principles of Food Preservation: Revised and Expanded, 2nd ed.; CRC Press: Boca Raton, FL, USA, 2003. [Google Scholar] [CrossRef]
- Klemm, P.; Przyrowska, A. Przejście fazowe woda-lód w materiałach kapilarno-porowatych przy ponadsorbcyjnym zawilgoceniu. In Proceedings of the XXVIII Konferencja Naukowa Komitetu Inżynierii Lądowej i Wodnej i Komitetu Nauki PZITB, Warsaw, Poland, 17–22 September 1982; pp. 79–83. (In Polish). [Google Scholar]
- Vali, G. Repeatability and randomness in heterogeneous freezing nucleation. Atmos. Chem. Phys. 2008, 8, 5017–5031. [Google Scholar] [CrossRef]
- Kozłowski, T. Some factors affecting supercooling and the equilibrium freezing point in soil-water systems. Cold Reg. Sci. Technol. 2009, 59, 25–33. [Google Scholar] [CrossRef]
- Khokhlov, A.; Valiullin, R.; Kärger, J.; Steinbach, F.; Feldhoff, A. Freezing and melting transitions of liquids in mesopores with ink-bottle geometry. New J. Phys. 2007, 9, 272. [Google Scholar] [CrossRef]
- Brun, M.; Lallemand, A.; Quinson, J.-F.; Eyraud, C. A new method for the simultaneous determination of the size and shape of pores: The thermoporometry. Thermochim. Acta 1977, 21, 59–88. [Google Scholar] [CrossRef]
- Clausse, D.; Wardhono, E.Y.; Lanoiselle, J.-L. Formation and determination of the ice formed in water dispersed in various materials. Colloids Surf. A Physiochem. Eng. Asp. 2014, 460, 519–526. [Google Scholar] [CrossRef]
- Fagerlund, G. Determination of pore-size distribution from freezing-point depression. Mater. Struct. 1973, 6, 215–225. [Google Scholar] [CrossRef]
- Wu, M.; Johannesson, B. Impact of sample saturation on the detected porosity of hardened concrete using low temperature calorimetry. Thermochim. Acta 2014, 580, 66–78. [Google Scholar] [CrossRef]
- Yamamoto, T.; Endo, A.; Inagi, Y.; Ohmori, T.; Nakaiwa, M. Evaluation of thermoporometry for characterization of mesoporous materials. J. Colloid Interface Sci. 2005, 284, 614–620. [Google Scholar] [CrossRef]
- Morishige, K.; Yasunaga, H.; Denoyel, R.; Wernert, V. Pore-blocking-controlled freezing of water in cagelike pores of KIT-5. J. Phys. Chem. C 2007, 111, 9488–9495. [Google Scholar] [CrossRef]
- PN-EN 1341:2013-05; Slabs and Natural Stone for External Paving—Requirements and Test Methods. Polish Committee for Standardization: Warsaw, Poland, 2013. (In Polish)
- PN-EN 1342:2013-05; Setts of Natural Stone for External Paving—Requirements and Test Methods. Polish Committee for Standardization: Warsaw, Poland, 2013. (In Polish)
- PN-EN 1343:2013-05; Kerbs of Natural Stone for External Paving—Requirements and Test Methods. Polish Committee for Standardization: Warsaw, Poland, 2013. (In Polish)
- Rusin, Z.; Owsiak, Z.; Stelmaszczyk, G.; Świercz, P. The Use of Differential Analysis of Deformations in the Diagnosis of Aggregates and Stones for Frost Durability; Development project N R04 006 10; Kielce University of Technology: Kielce, Poland, 2014. [Google Scholar]
- Rusin, Z.; Świercz, P.; Owsiak, Z. Effect of microstructure on frost durability of rock in the context of diagnostic needs. Proc. Eng. 2015, 108, 177–184. [Google Scholar] [CrossRef]
- PN-B-11204:1996; Stone Materials. Stone Elements—External Stud Slabs. Polish Committee for Standardization: Warsaw, Poland, 1996. (In Polish)
- Martínez-Martínez, J.; Benavente, D.; Gomez-Heras, M.; Marco-Castaño, L.; García-del-Cura, M.A. Non-linear decay of building stones during freeze-thaw weathering processes. Constr. Build. Mat. 2013, 38, 443–454. [Google Scholar] [CrossRef]
- Wessman, L. Studies on the Frost Resistance of Natural Stone. Ph.D. Thesis, Lund University, Lund, Sweden, 1997. [Google Scholar]
- Fan, L.; Fan, Y.; Xi, Y.; Gao, J. Spatially distributed damage in sandstone under stress-freeze-thaw coupling conditions. J. Rock Mech. Geotech. Eng. 2022, 14, 1910–1922. [Google Scholar] [CrossRef]
- Li, B.; Zhang, G.; Ma, W.; Liu, M.; Li, A. Damage mechanism of sandstones subjected to cycling freeze-thaw (FT) actions based on high-resolution computed tomography (CT). Bull. Eng. Geol. Environ. 2022, 81, 374. [Google Scholar] [CrossRef]
- Nicholson, D.T.; Nicholson, F.H. Physical deterioration of sedimentary rocks subjected to experimental freeze-thaw weathering. Earth Surf. Process. Landf. 2000, 25, 1295–1307. [Google Scholar] [CrossRef]
- Momeni, A.; Abdilor, Y.; Khanlari, G.R.; Heidari, M.; Sepahi, A.A. The effect of freeze-thaw cycles on physical and mechanical properties of granitoid hard rocks. Bull. Eng. Geol. Environ. 2016, 75, 1649–1656. [Google Scholar] [CrossRef]
- Benavente, D.; Martínez-Martínez, J.; Algozzini, G.; García del Cura, M.A. Influence of water transport and pore structure on the durability of porous building stones. In Proceedings of the Proceedings 10th IAEG International Congress, Nottingham, UK, 6–10 September 2006; IAEG2006 paper number 233. The Geological Society of London: London, UK, 2006. [Google Scholar]
- Skowera, K.; Rusin, Z. Differential analysis of volumetric strain method characterization in the context of phase change of water in carbonate rocks. Materials 2022, 15, 308. [Google Scholar] [CrossRef] [PubMed]
- Rusin, Z.; Świercz, P. Frost resistance of rock materials. Constr. Build. Mater. 2017, 148, 704–714. [Google Scholar] [CrossRef]
- Nartowska, E.; Kozłowski, T. The effect of the concentration of copper ions on the unfrozen water content in bentonites measured with the use of DSC method. Minerals 2022, 12, 632. [Google Scholar] [CrossRef]
- Ishikiriyama, K.; Todoki, M. Pore size distribution measurements of silica gels by means of differential scanning calorimetry. J. Coll. Interf. Sci. 1995, 171, 103–111. [Google Scholar] [CrossRef]
- Rasmussen, D.H.; MacKenzie, A.P. Clustering in supercooled water. J. Chem. Phys. 1973, 59, 5003–5013. [Google Scholar] [CrossRef]
- Landry, M.R. Thermoporometry by differential scanning calorimetry: Experimental consideration and applications. Thermochim. Acta 2005, 433, 27–55. [Google Scholar] [CrossRef]
- Beurroies, I.; Denoyel, R.; Llewellyn, P.; Rouquerol, J. A comparison between melting-solidification and capillary condensation hysteresis in mesoporous materials: Application to the interpretation of thermoporometry data. Thermochim. Acta 2004, 421, 11–18. [Google Scholar] [CrossRef]
- Bager, D.H.; Sellevold, E.J. Ice formation in hardened cement paste, Part I—Room temperature cured pastes with variable moisture contents. Cem. Concr. Res. 1986, 16, 709–720. [Google Scholar] [CrossRef]
- Jacobsen, S.; Sellevold, E.J.; Matala, S. Frost durability of high strength concrete: Effect of internal cracking on ice formation. Cem. Concr. Res. 1996, 6, 919–931. [Google Scholar] [CrossRef]
- Sun, Z.; Scherer, G.W. Pore size and shape in mortar by thermoporometry. Cem. Concr. Res. 2010, 40, 740–751. [Google Scholar] [CrossRef]
- Stępień, P.; Rusin, Z.; Skowera, K. Cement mortar porosity by modified analysis of differential scanning calorimetry records. Materials 2020, 13, 1080. [Google Scholar] [CrossRef] [PubMed]


Disclaimer/Publisher’s Note: The statements, opinions and data contained in all publications are solely those of the individual author(s) and contributor(s) and not of MDPI and/or the editor(s). MDPI and/or the editor(s) disclaim responsibility for any injury to people or property resulting from any ideas, methods, instructions or products referred to in the content. |
© 2024 by the authors. Licensee MDPI, Basel, Switzerland. This article is an open access article distributed under the terms and conditions of the Creative Commons Attribution (CC BY) license (https://creativecommons.org/licenses/by/4.0/).