
Experimental and Theoretical Studies on the Shear Performance of Concrete Beams Reinforced with Fiber-Reinforced Polymer Stirrups


Abstract
1. Introduction
- (1)
- The shear resistance of uncracked concrete compression zone;
- (2)
- Aggregate interlock;
- (3)
- The dowel action of the longitudinal reinforcement;
- (4)
- Arching action;
- (5)
- Residual tensile stresses across cracks;
- (6)
- Shear carried by the shear reinforcement.
2. Experimental Program
2.1. Beam Specimen Design
2.2. Materials
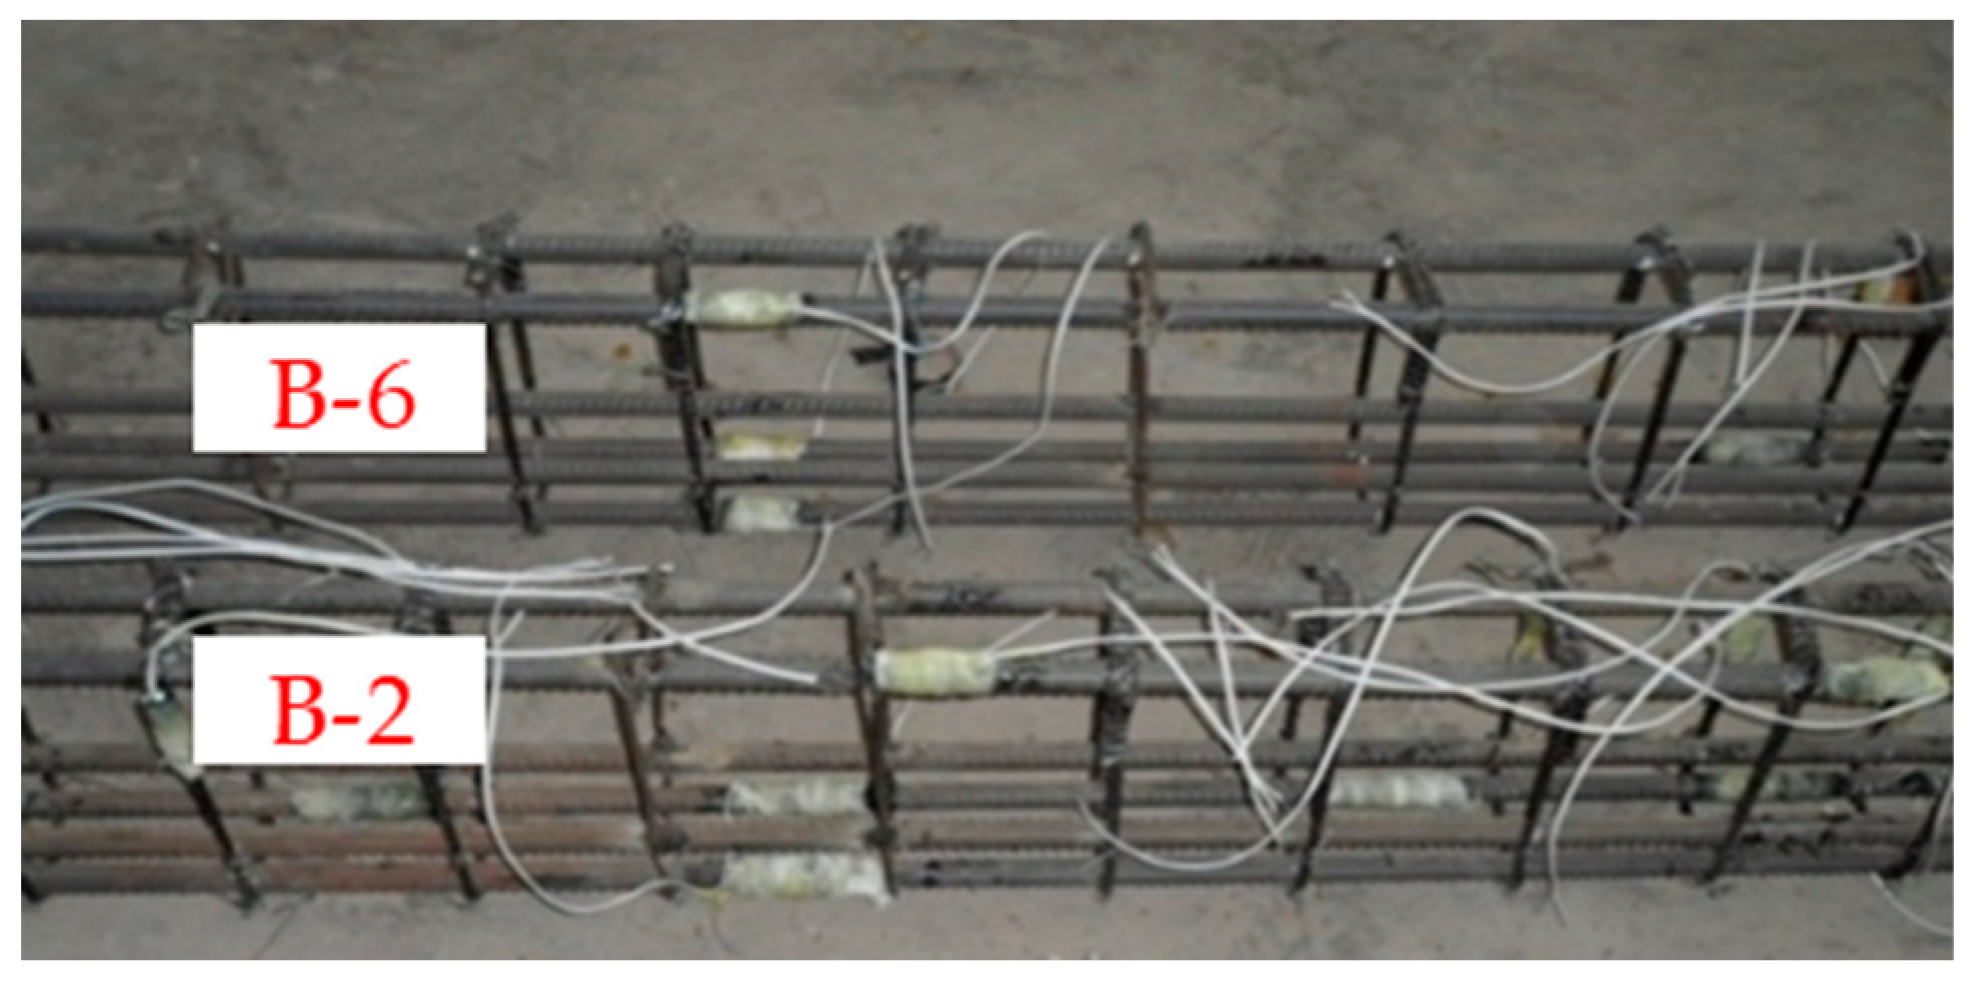
2.3. Beam Specimen Preparation
2.4. Test Set-Up and Loading Program
- (1)
- At the beginning, the load level of each level was 10 kN and maintained for 10 min.
- (2)
- When the load was close to the cracking of concrete, the load level was changed to 5 kN per level. When the first crack appeared in flexural zone of beam between two loading points, the load value was recorded as the first crack load Vcr.
- (3)
- The load level was restored to 10 kN per level after the first crack appeared. When the first oblique crack appeared in the flexural compression zone, the load value was recorded as the first diagonal shear crack Vscr.
- (4)
- When the maximum crack expands to 1.5 mm, the load value of the beam specimen was recorded as the shear capacity of experiment Vexp.
3. Results and Discussions
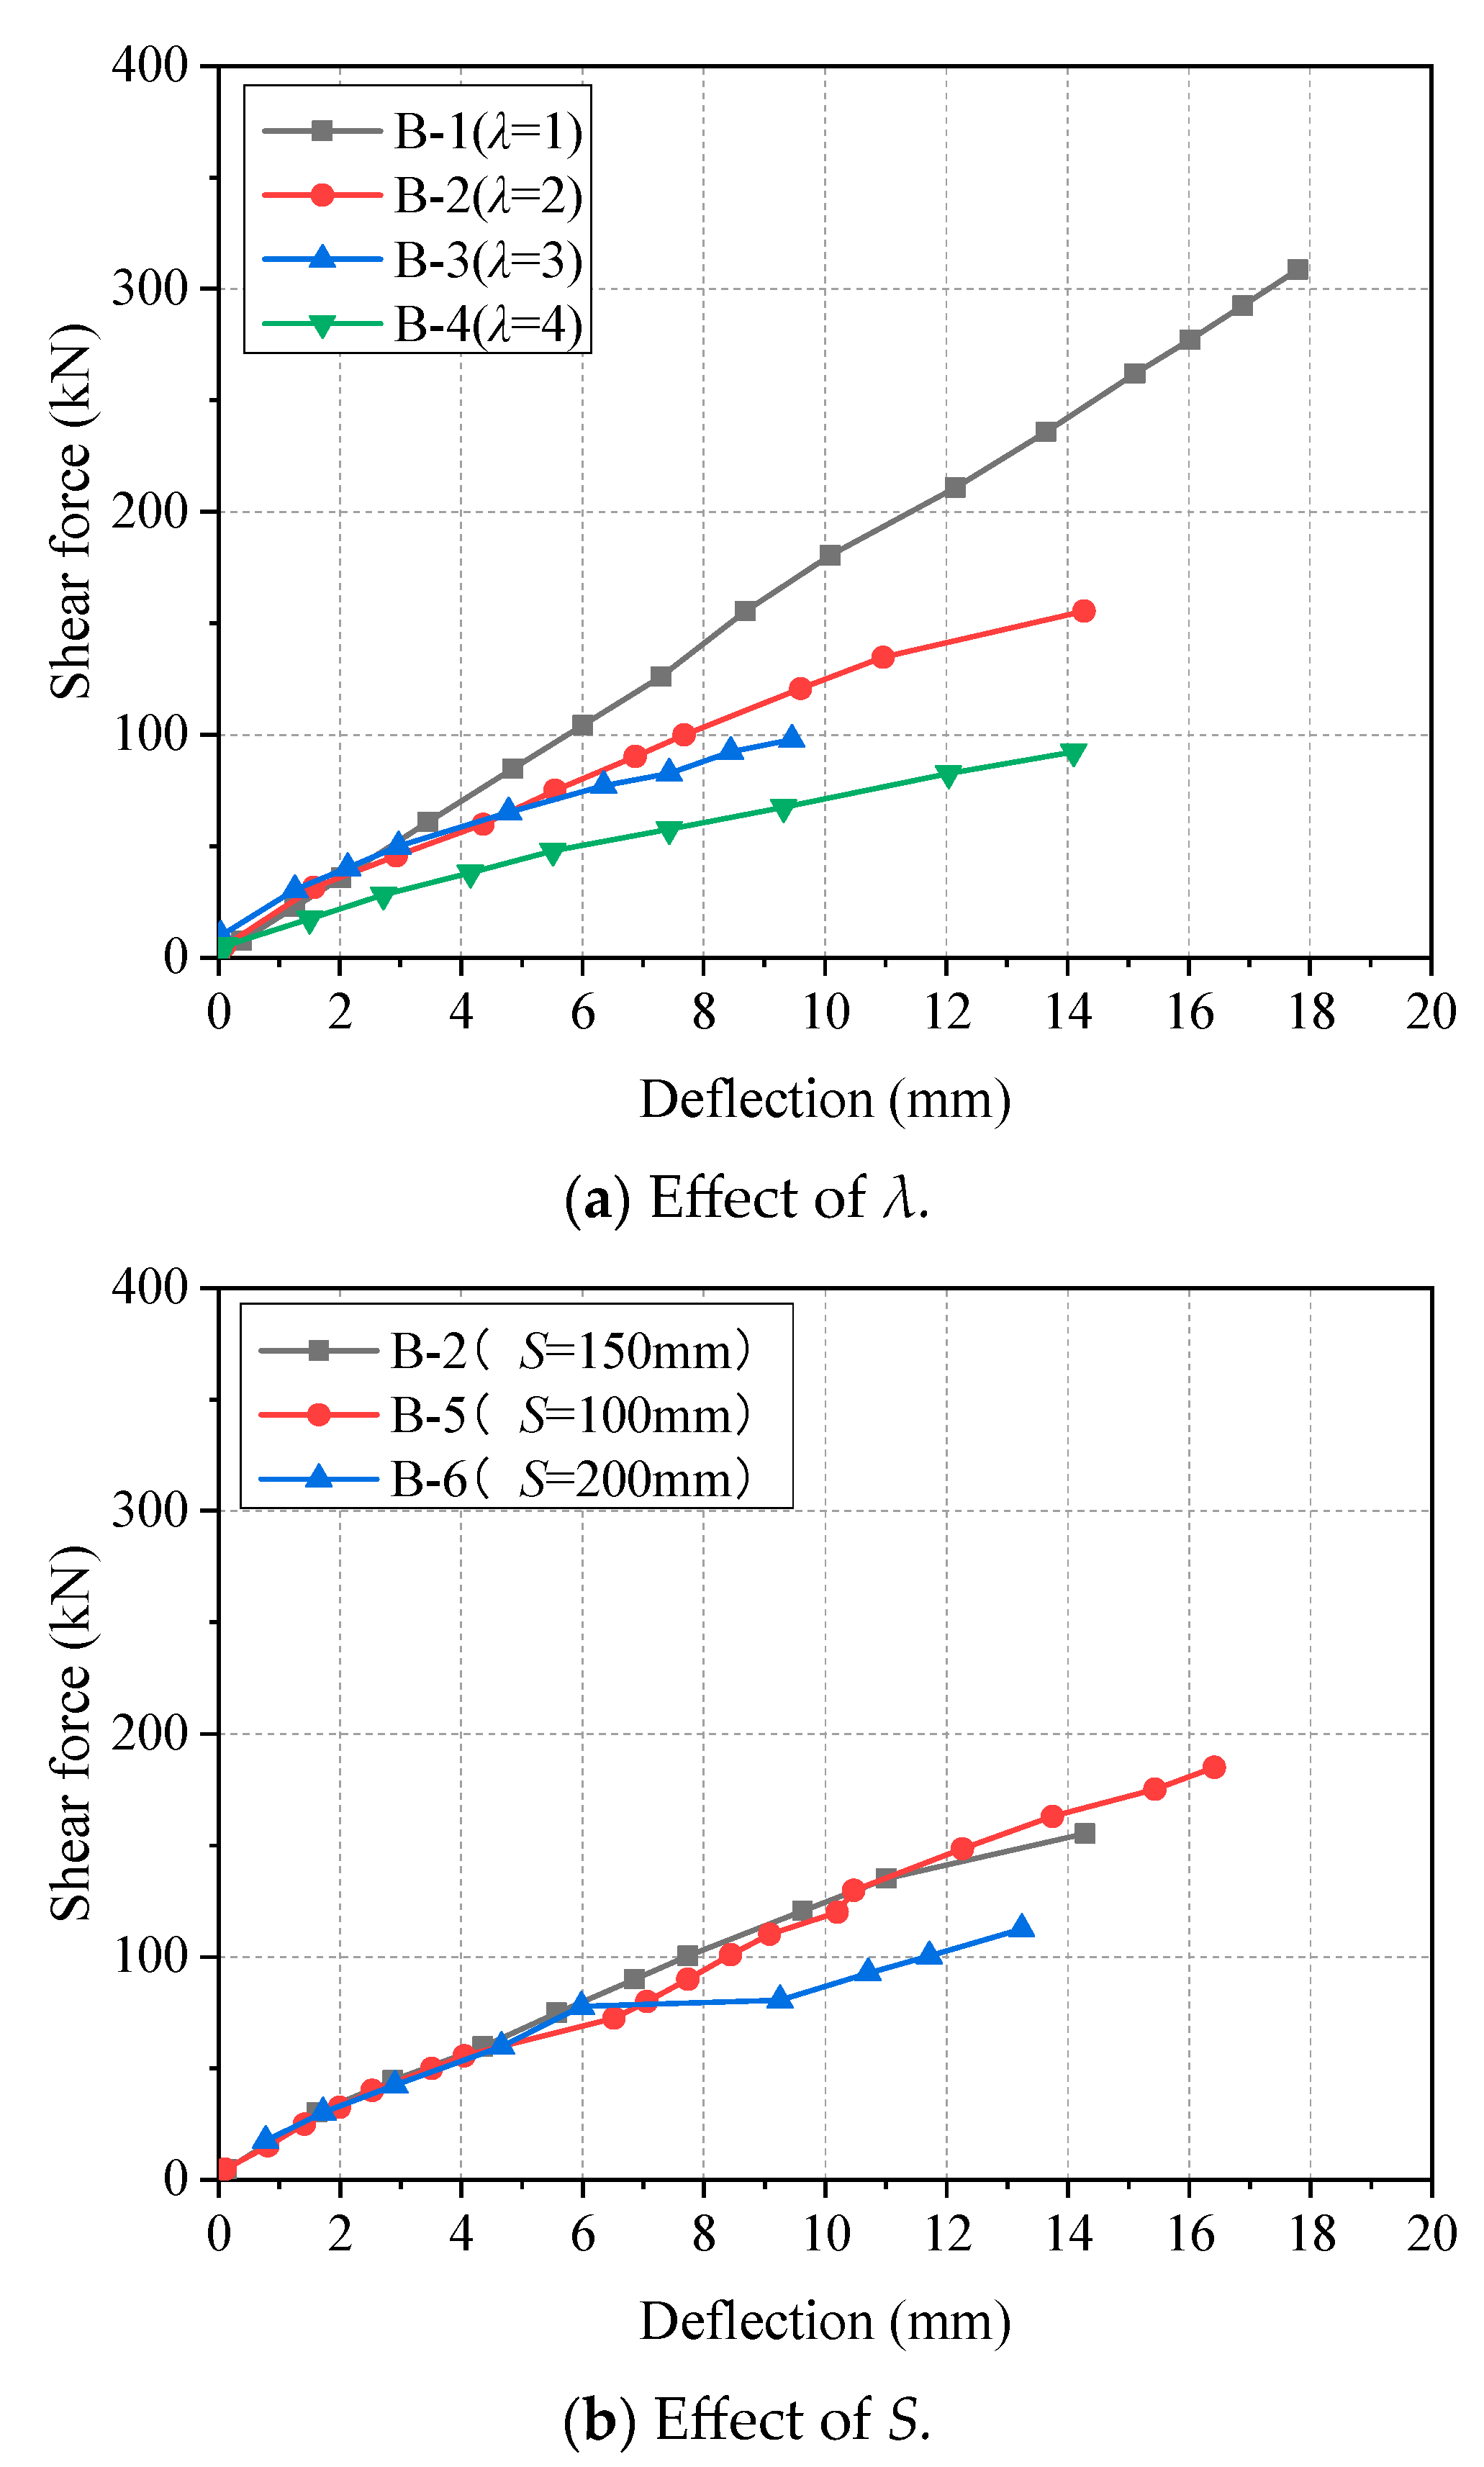
3.1. Shear Force–Deflection Response
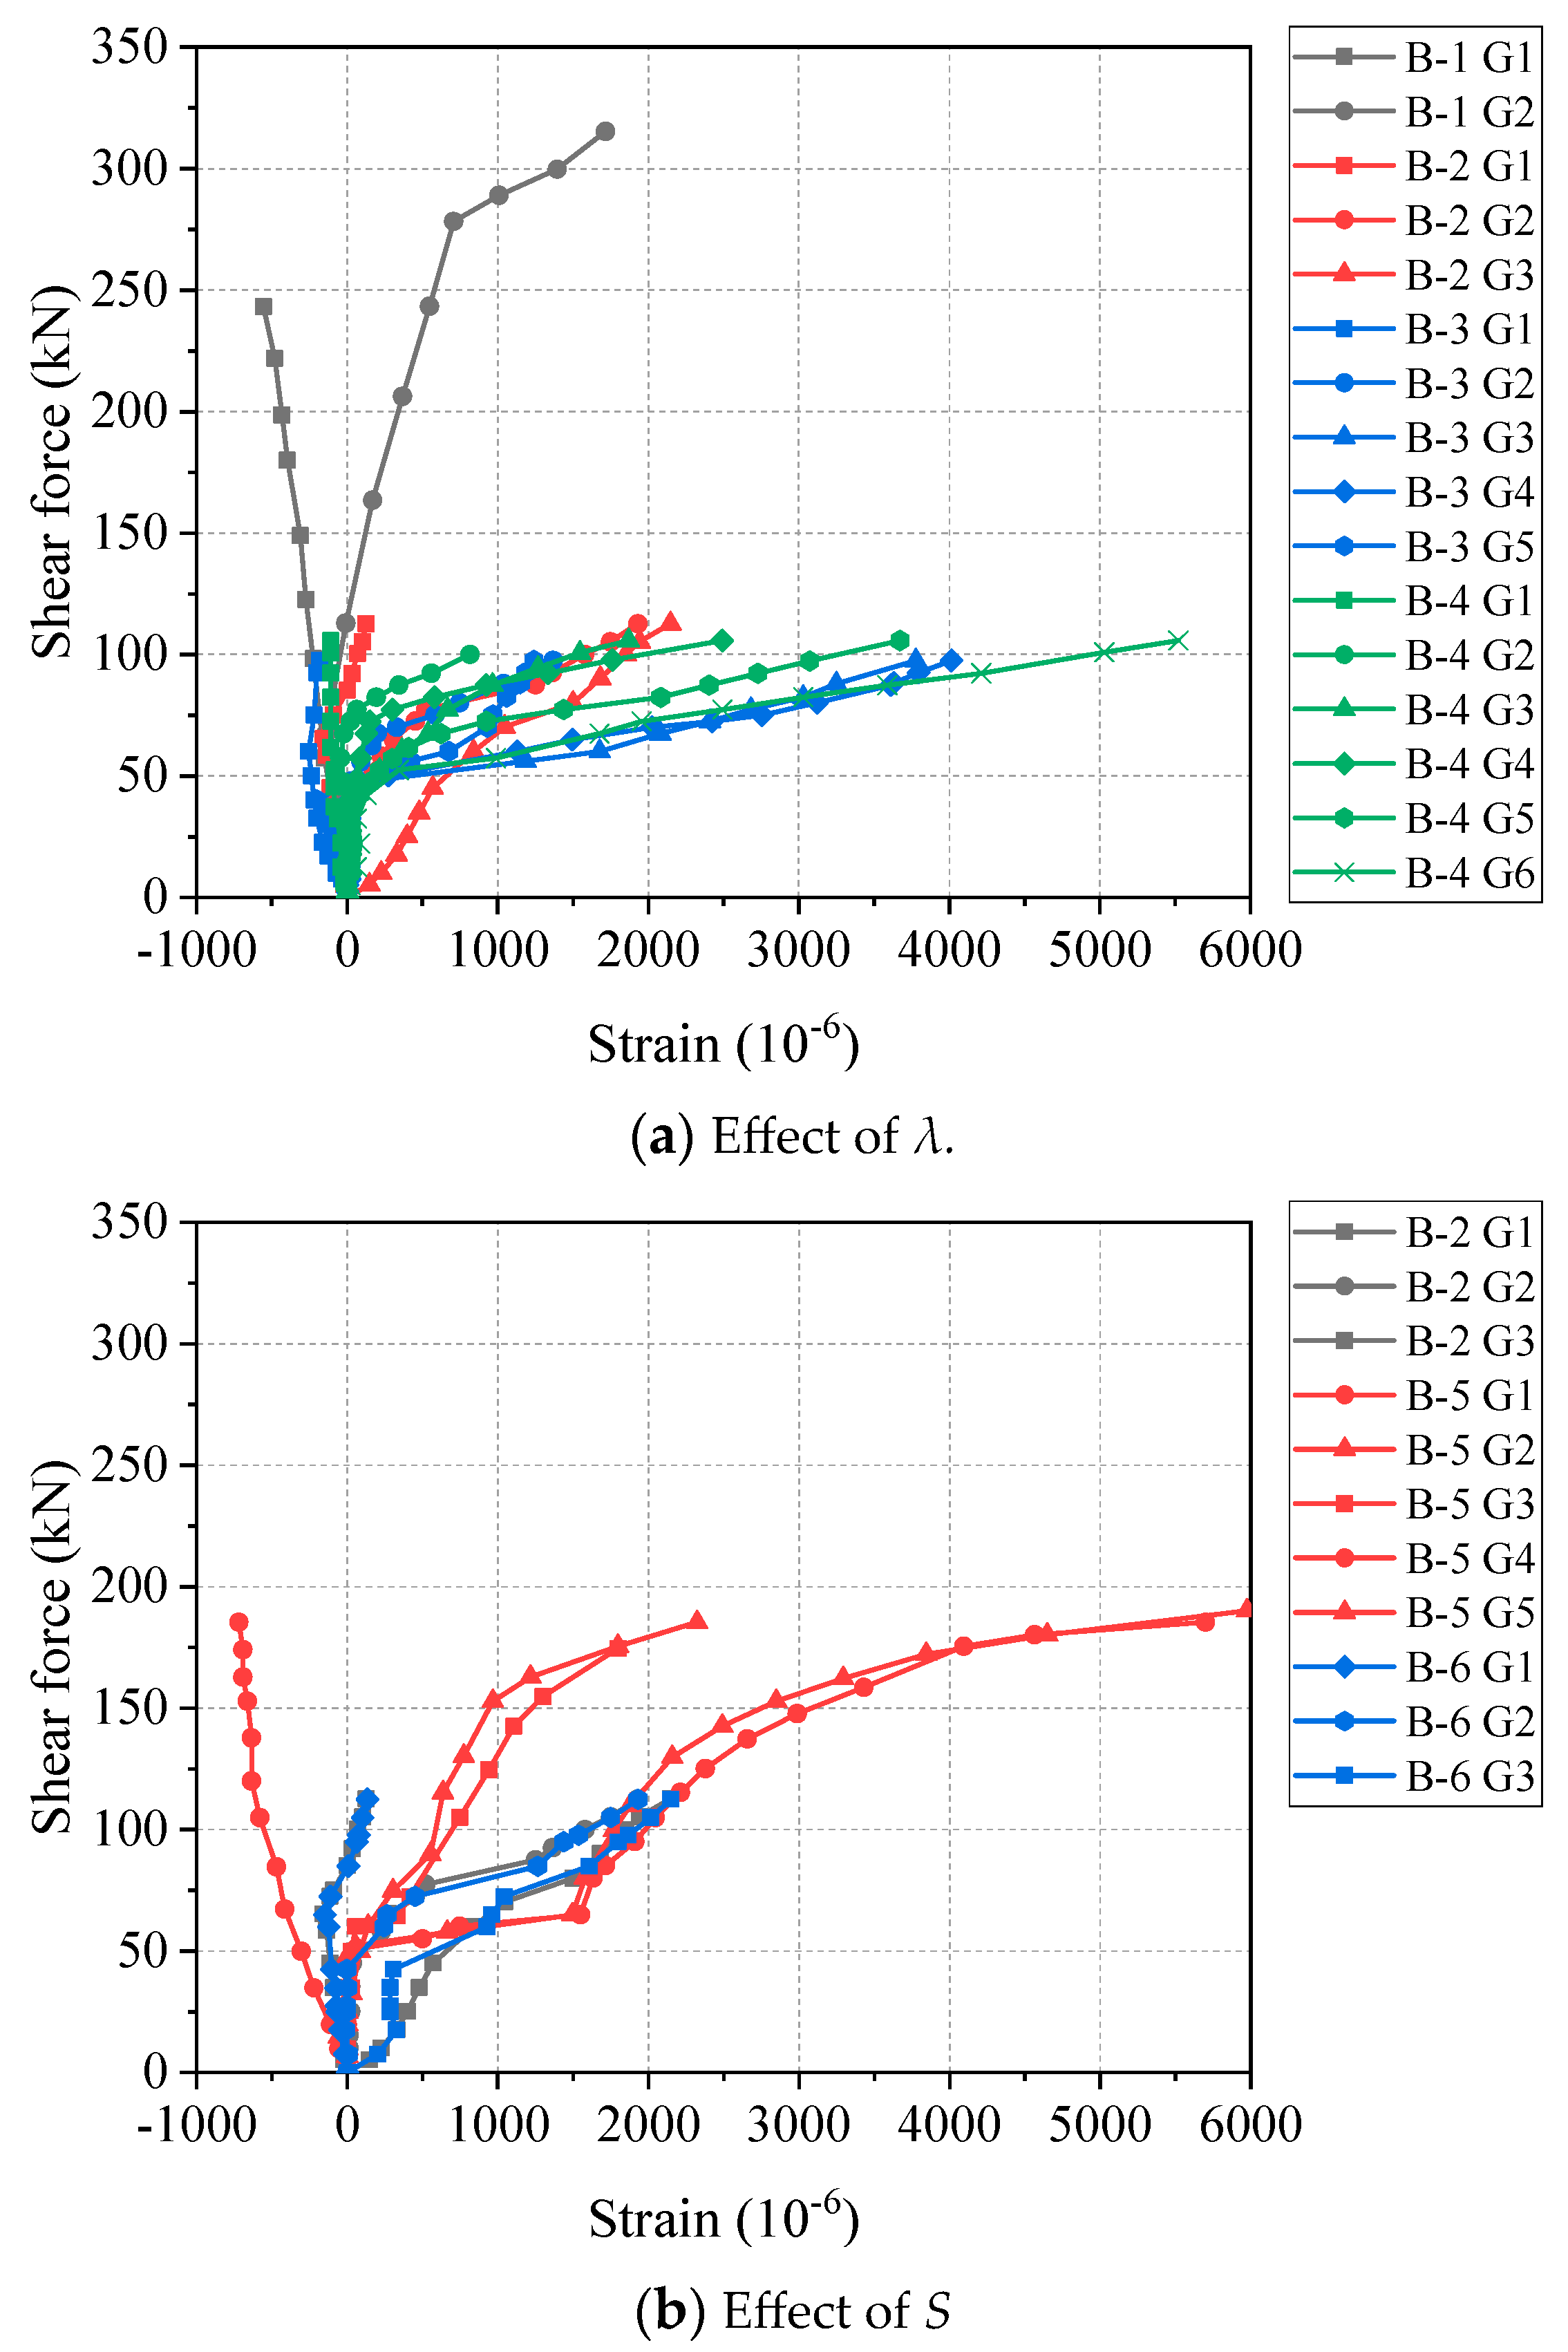
3.2. Shear Force–strain Response
3.3. Shear Capacity
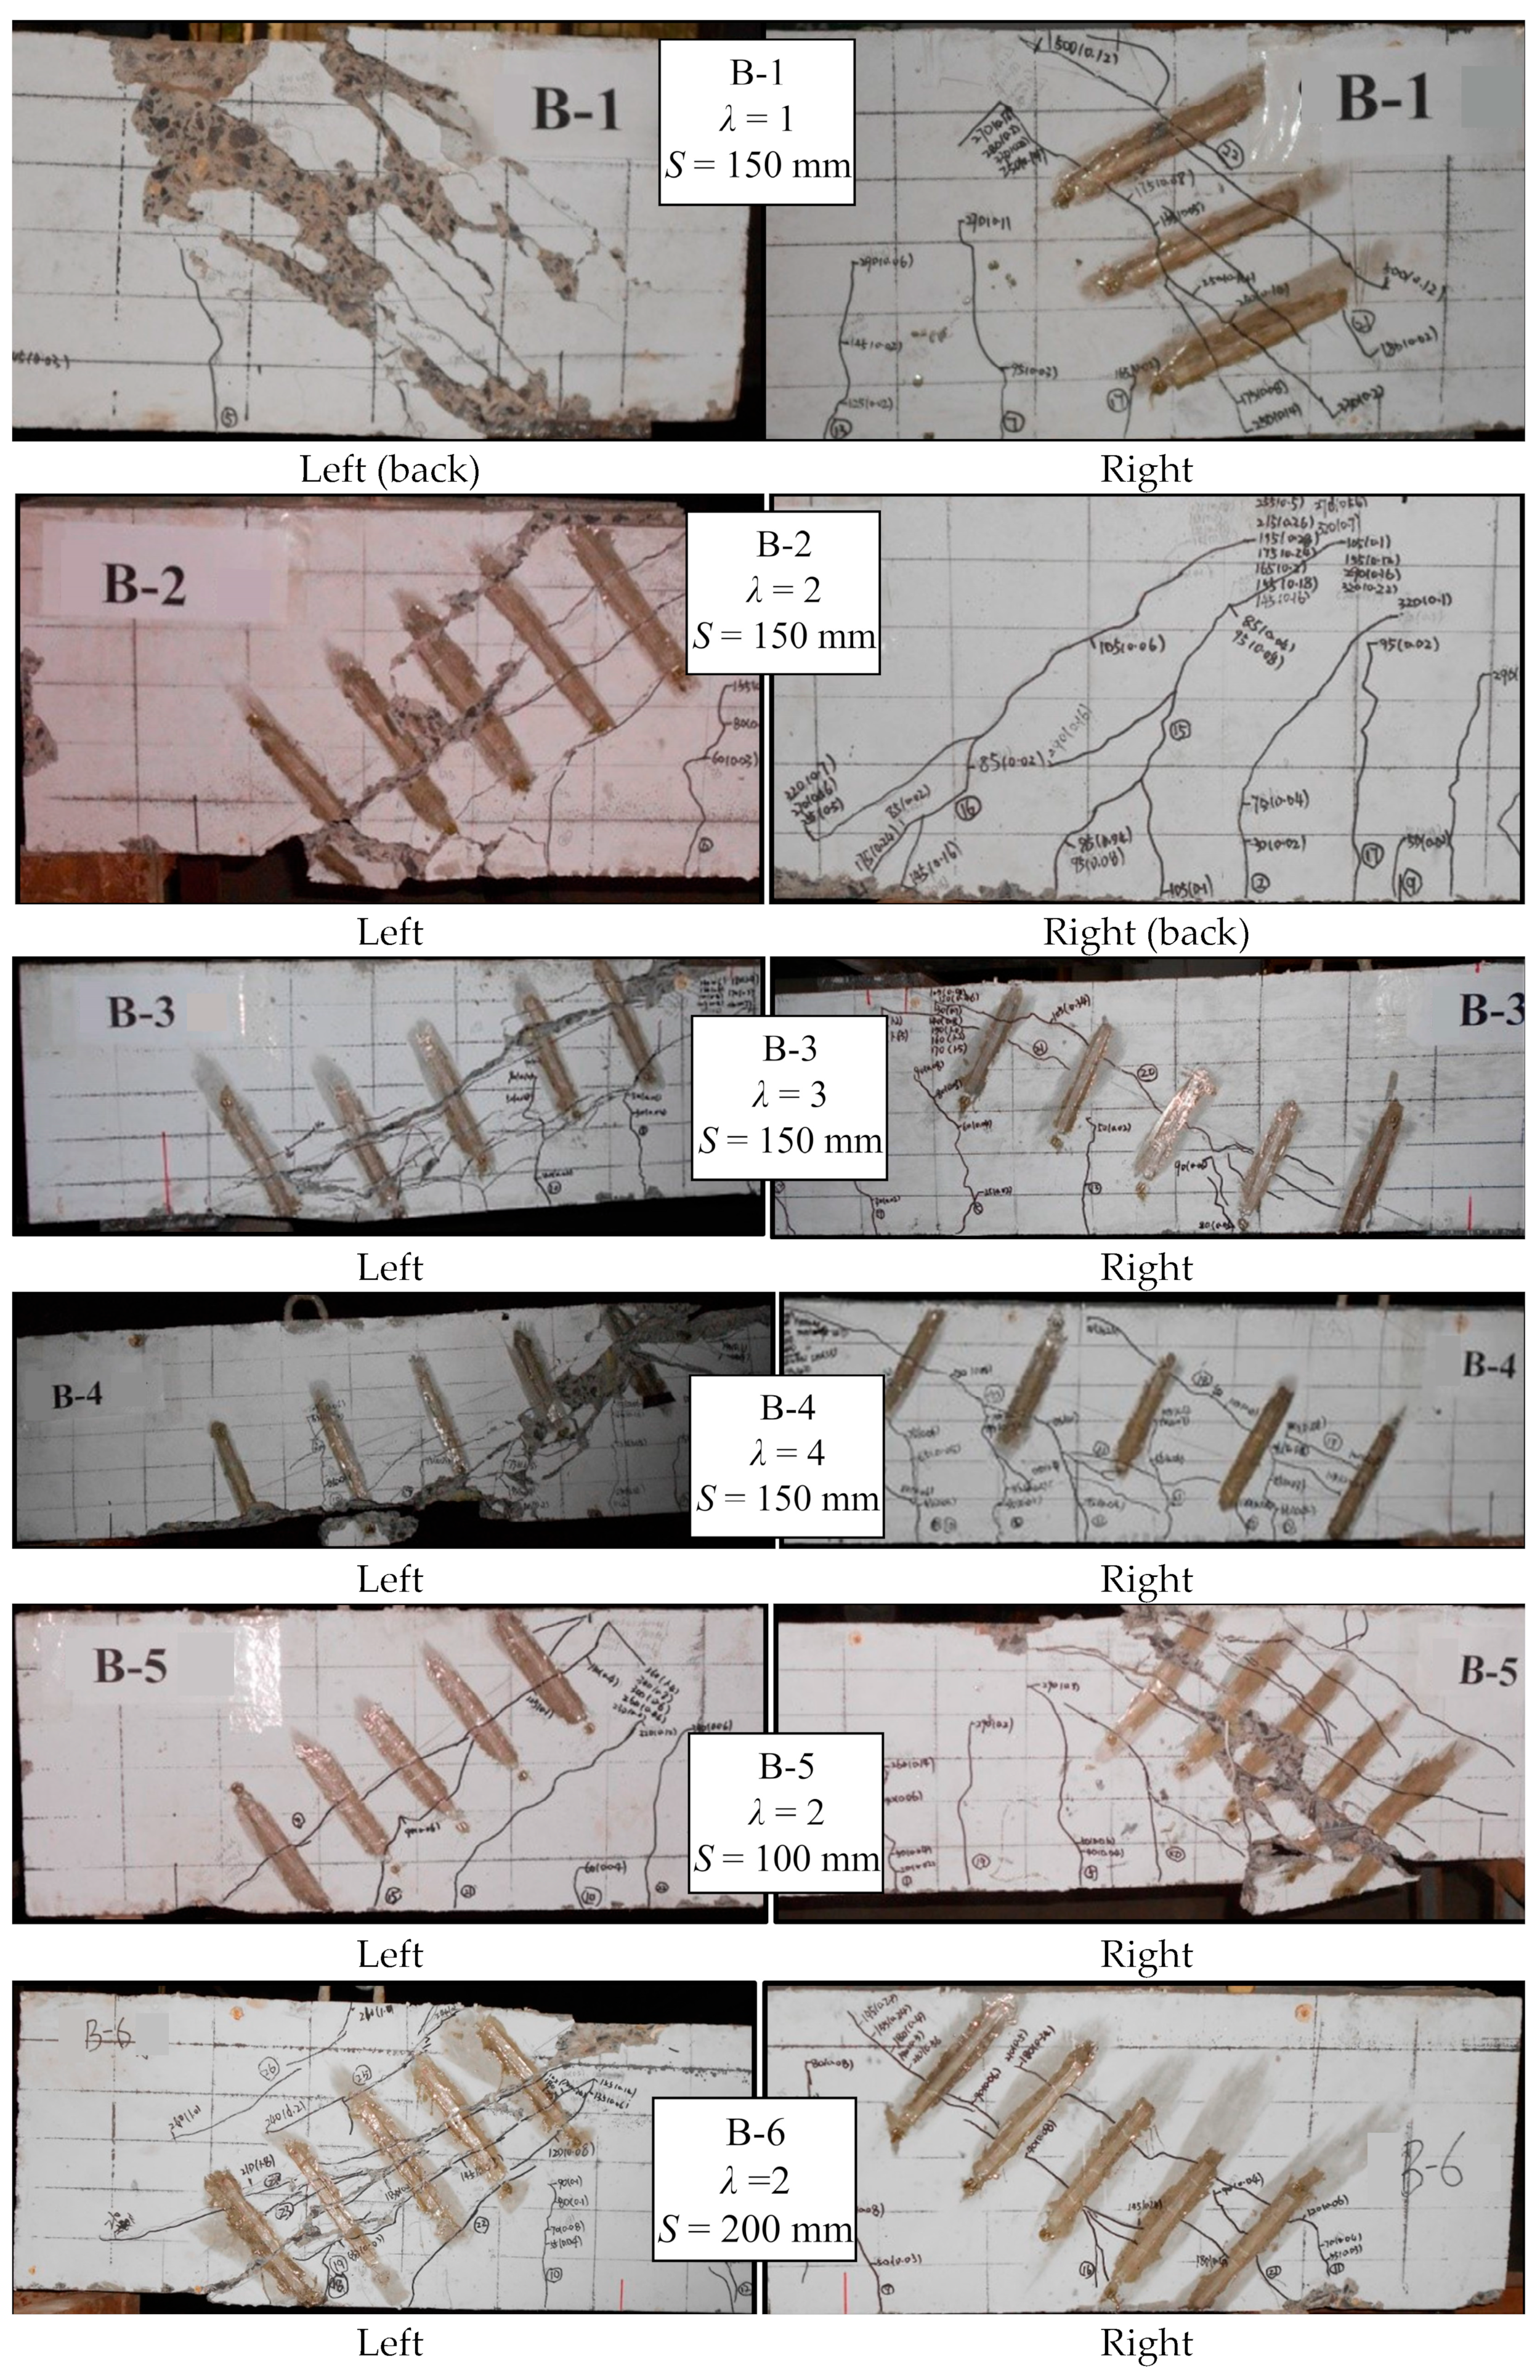
3.4. Crack Patterns
3.5. Failure Mode
4. Calculation Model of the Shear Capacities of Concrete Beams Reinforced with FRP Stirrups
4.1. Model Establishment
4.2. Shear Capacity of Concrete Beams without Web Reinforcement: V1
4.2.1. Equilibrium Equation
4.2.2. Constitutive Equation
4.2.3. Compatibility Condition
4.2.4. Parameter w
- (1)
- As shown in Figure 14, w at support point A can be expressed as follows:
- (2)
- As shown in Figure 17, w at load point C can be expressed as follows:
4.2.5. Calculation Process
- (1)
- The shear capacity provided by the top of strut is Vt.
- (2)
- The shear capacity provided by the bottom of strut is Vb.
4.3. Shear Capacity Provided by Stirrups: V2
4.4. Calculation Results and Discussion
5. Conclusions
- (1)
- There is a positive linear relationship between the shear force and the mid-span deflection. The shear span to depth ratio λ has a significant effect on the shear–deflection response of beam specimens, and the increase in λ reduced the stiffness of the specimen. Compared with λ, stirrup spacing S has less influence on the ultimate load of the specimen, and when the stirrup spacing is large (S = 200 mm), the stiffness of the specimen decreased in the later stage of loading.
- (2)
- The shear span to depth ratio λ is an important factor affecting the shear capacity and failure mode of beam specimens. When λ increases from 1 to 2, 3, and 4, the ultimate shear capacity of the specimen beam decreases by 50.5%, 67.7%, and 69.2%, respectively. When λ increases from 1 to 2 and 3, and the failure mode was changed from baroclinic failure to shear compression failure and diagonal tension failure.
- (3)
- The shear capacity of RC concrete beams without stirrups was calculated through the strut-and-tie model, then the FRP stirrups’ influence was taken into account. Finally, a new model for calculating the shear capacity of concrete beams with FRP stirrups is established.
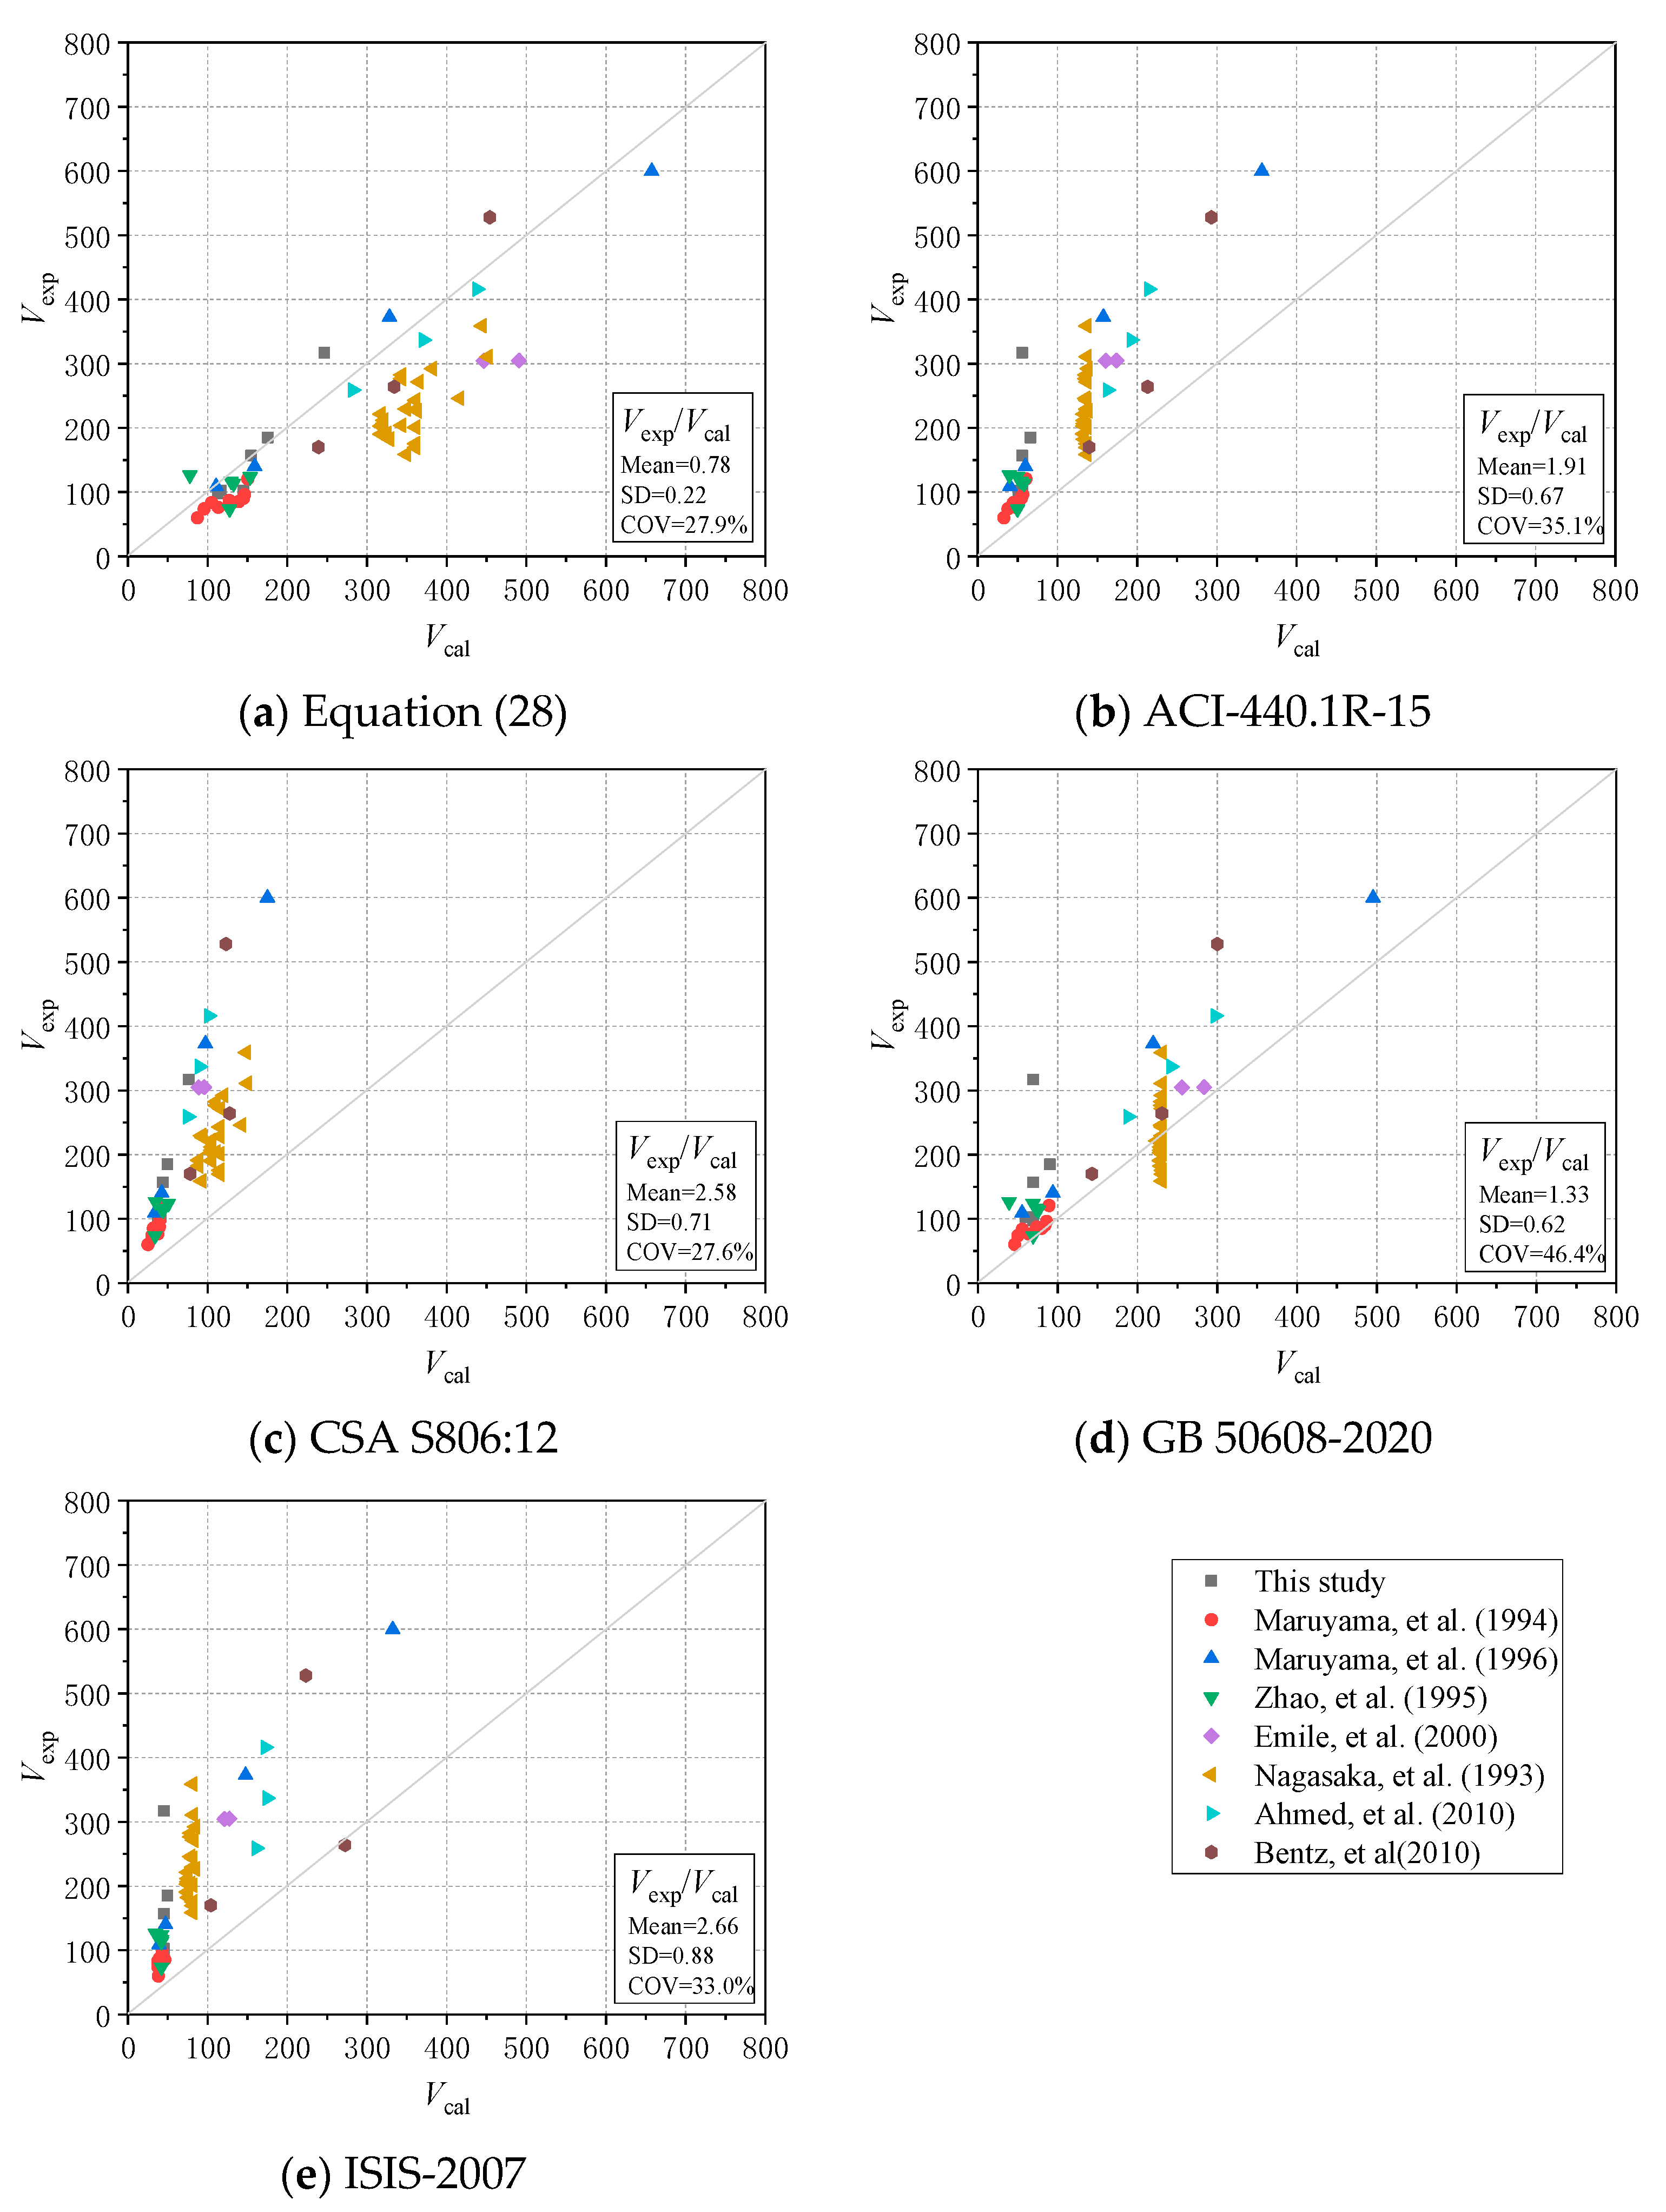
- (4)
- By comparing the actual shear capacity of a large number of beams with the predicted capacity based on ACI-440.1R-15, CSA S806:12, GB 50608-2020, ISIS-2007 and Equation (28) proposed in this article, it was concluded that overall, Equation (28) is more accurate for these results than other codes, and its mean and COV values are 0.77 and 27.4%, respectively.
Author Contributions
Funding
Institutional Review Board Statement
Informed Consent Statement
Data Availability Statement
Conflicts of Interest
Nomenclature
| a | Horizontal distance from loading point to supporting point (mm) |
| λ | Shear span to depth ratio |
| S | Stirrup spacing (mm) |
| ρsv | Stirrup reinforcement ratio (%) |
| ρ | Longitudinal reinforcement ratio (%) |
| Vcr | First crack load (kN) |
| Vscr | First diagonal shear crack (kN) |
| Vexp | Shear capacity of experiment (kN) |
| ωmax | Maximum diagonal crack width of beam (mm) |
| Δmax | Maximum deflection (mm) |
| V1 | Shear capacity of concrete beams without web reinforcement (kN) |
| θ | Angle between strut and beam transverse axis (in degree) |
| D | Compression capacity of strut (kN) |
| f2max | Compressive stress of strut (kN) |
| fcu | Standard value of the cubic compressive strength of concrete |
| fc′ | Specified compressive strength of concrete (MPa) |
| β | Softening effect coefficient of the compressive strength of cracked concrete |
| ε0 | Maximum compressive strain of softened concrete |
| εc | Compressive strain of softened concrete |
| σc | Compressive stress of softened concrete (MPa) |
| ε1 | Principal tensile strain of concrete in the direction perpendicular to strut |
| ε2 | Principal compressive strain of strut |
| εx | Longitudinal strain of element |
| εt | Transverse strain of element |
| γxt | Shear strain of element |
| w | Height of strut cross-section (mm) |
| h | Height of beam cross-section (mm) |
| ha | Height of tie cross-section (mm) |
| d | Distance from the extreme compression fibre to the centroid of longitudinal tension force (mm) |
| lb | Width of base plate at support point (mm) |
| ab | Width of base plate at load point (mm) |
| da | Height of concrete horizontal compression bar between nodes C and D (mm) |
| k | Height coefficient of concrete compression area |
| n | Ratio of elastic modulus of longitudinal reinforcement to elastic modulus of concrete |
| Es | Elastic modulus of longitudinal reinforcement (MPa) |
| Ec | Elastic modulus of concrete (MPa) |
| Vt | Shear capacity provided by the top of strut (kN) |
| Vb | Shear capacity provided by the bottom of strut (kN) |
| V2 | Shear capacity provided by stirrups (kN) |
| fsv | Effective stress of FRP stirrup (MPa) |
| Esv | Elastic modulus of FRP stirrup (MPa) |
| Vcal | Shear capacity of calculation (kN) |
References
- Amir, P. 2-Corrosion of Steel in Concrete Structures; Woodhead Publishing: Oxford, UK, 2016; pp. 19–33. [Google Scholar] [CrossRef]
- Xian, G.; Guo, R.; Li, C. Combined effects of sustained bending loading, water immersion and fiber hybrid mode on the mechanical properties of carbon/glass fiber reinforced polymer composite. Compos. Struct. 2022, 281, 115060. [Google Scholar] [CrossRef]
- Xian, G.; Guo, R.; Li, C.; Wang, Y. Mechanical performance evolution and life prediction of prestressed CFRP plate exposed to hygrothermal and freeze-thaw environments. Compos. Struct. 2022, 293, 115719. [Google Scholar] [CrossRef]
- Benmokrane, B.; Zhang, B.; Chennouf, A. Tensile properties and pullout behaviour of AFRP and CFRP rods for grouted anchor applications. Constr. Build. Mater. 2000, 14, 157–170. [Google Scholar] [CrossRef]
- Liu, Y.; Zwingmann, B.; Schlaich, M. Carbon Fiber Reinforced Polymer for Cable Structures A Review. Polymers 2015, 10, 2078–2099. [Google Scholar] [CrossRef]
- Pan, Y.; Yan, D. Study on the durability of GFRP bars and carbon/glass hybrid fiber reinforced polymer (HFRP) bars aged in alkaline solution. Compos. Struct. 2021, 261, 113285. [Google Scholar] [CrossRef]
- Saleh, Z.; Sheikh, M.N.; Remennikov, A.M.; Basu, A. Numerical investigations on the flexural behavior of GFRP-RC beams under monotonic loads. Structures 2019, 20, 255–267. [Google Scholar] [CrossRef]
- Kang, M.R.; Xue, W.C. Research Progress on shear behavior of concrete beams with FRP stirrups. J. North China Univ. Water Resour. Electr. Power (Nat. Sci. Ed.) 2015, 36, 15–20. (In Chinese) [Google Scholar]
- Maranan, G.B.; Manalo, A.C.; Benmokrane, B.; Karunasena, W.; Mendis, P.; Nguyen, T.Q. Shear behaviour of geopolymer-concrete beams transversely reinforced with continuous rectangular GFRP composite spirals. Compos. Struct. 2018, 187, 454–465. [Google Scholar] [CrossRef]
- Maranan, G.B.; Manalo, A.C.; Benmokrane, B.; Karunasena, W.; Mendis, P.; Nguyen, T.Q. Flexural behavior of geopolymer-concrete beams longitudinally reinforced with GFRP and steel hybrid reinforcements. Eng. Struct. 2019, 182, 141–152. [Google Scholar] [CrossRef]
- Bentz, E.C.; Massam, L.; Collins, M.P. Shear Strength of Large Concrete Members with FRP Reinforcement. J. Compos. Constr. 2010, 14, 637–646. [Google Scholar] [CrossRef]
- Liang, X.; Peng, J.; Ren, R. A state-of-the-art review: Shear performance of the concrete beams reinforced with FRP bars. Constr. Build. Mater. 2023, 364, 129996. [Google Scholar] [CrossRef]
- Grace, N.F. Behavior and Ductility of Simple and Continuous FRP Reinforced Beams. Compos. Constr. J. 1998, 2, 186–194. [Google Scholar] [CrossRef]
- Mousavi, S.R.; Esfahani, M.R. Effective moment of inertia prediction of FRP-reinforced concrete beams based on experimental results. Compos. Constr. J. 2012, 16, 490–498. [Google Scholar] [CrossRef]
- Said, M.; Adam, M.A.; Mahmoud, A.A.; Shanour, A.S. Experimental and analytical shear evaluation of concrete beams reinforced with glass fiber reinforced polymers bars. Constr. Build. Mater. 2016, 102, 574–591. [Google Scholar] [CrossRef]
- Ahmed, E.A.; El-Salakawy, E.F.; Benmokrane, B. Shear Performance of RC Bridge Girders Reinforced with Carbon FRP Stirrups. Bridge Eng. J. 2010, 15, 44–54. [Google Scholar] [CrossRef]
- Hegger, J.; Kurth, M. Shear capacity of concrete beams with FRP reinforcement. Proc. Fib Int. Phd Symp. Civ. 2011, 275, 1–14. [Google Scholar] [CrossRef]
- ACI 440.1R-15; Guide for the Design and Construction of Concrete Reinforced with FRP Bars. American Concrete Institute: Farmington Hills, MI, USA, 2015.
- CSA S806:12 (reaffirmed 2021); Design and Construction of Building Structures with Fibre-Reinforced Polymers. Canadian Standards Association (CSA): Toronto, ON, Canada, 2021.
- GB 50608-2010; Technical Code for Infrastructure Application of FRP Composites. China Planning Press: Beijing, China, 2010. (In Chinese)
- Reinforcing Concrete Structures with Fibre Reinforced Polymers, Intelligent Sensing for Innovative Structures (ISIS); SIMTReC: Winnipeg, MB, Canada, 2007.
- Razaqpur, A.G.; Spadea, S. Shear Strength of FRP Reinforced Concrete Members with Stirrups. Compos. Constr. J. 2015, 19, 0401402.1–04014025.15. [Google Scholar] [CrossRef]
- Razaqpur, A.G.; Isgor, B.O.; Greenaway, S.; Selley, A. Concrete Contribution to the Shear Resistance of Fiber Reinforced Polymer Reinforced Concrete Members. Compos. Constr. J. 2004, 8, 452–460. [Google Scholar] [CrossRef]
- Wang, Z.H.; Du, X.L.; Zhan, J.D.; Deng, Z.C. Research Progress on shear behavior of FRP reinforced concrete beams. Compos. Sci. Eng. 2010, 1, 82–85. (In Chinese) [Google Scholar]
- Nehdi, M.; Chabib, H.E.; Said, A.A. Proposed shear design equations for FRP-Reinforced concrete beams based on genetic algorithms approach. Mater. Civ. Eng. J. 2007, 19, 1033–1042. [Google Scholar] [CrossRef]
- Whitehead, P.A.; Ibell, T.J. Rational approach to shear design in fiber-reinforced polymer-prestressed concrete structures. Compos. Constr. J. 2005, 9, 90–100. [Google Scholar] [CrossRef]
- He, H.W. Experimental Study on the Shear Capacity of Concrete Beams with FRP Stirrups. Master’s Dissertation, Zhengzhou University, Zhengzhou, China, 2013. (In Chinese). [Google Scholar]
- D7205/D7205M-06; Standard Test Method for Tensile Properties of Fiber Reinforced Polymer Matrix Composite Bars. ASTM International: West Conshohocken, PA, USA, 2016.
- GB 50152-92; Standard Methods for Testing of Concrete Structures. China Construction Industry Press: Beijing, China, 1992. (In Chinese)
- Hamrani, A.; Alnahhal, W. Shear behavior of basalt FRC beams reinforced with basalt FRP bars and glass FRP stirrups: Experimental and analytical investigations. Eng. Struct. 2021, 242, 112612. [Google Scholar] [CrossRef]
- Fan, X.; Zhou, Z.; Tu, W.; Zhang, M. Shear behaviour of inorganic polymer concrete beams reinforced with basalt FRP bars and stirrups. Compos. Struct. 2021, 255, 112901. [Google Scholar] [CrossRef]
- Andermatt, M.F. Concrete Deep Beams Reinforced with Internal FRP; University of Alberta: Edmonton, AB, Canada, 2010. [Google Scholar] [CrossRef]
- Xiong, J.G.; Fu, G.P. Softened truss model for shear capacity calculation of reinforced concrete short beams without web reinforcement. J. Nanchang Univ. (Eng. Technol.) 2004, 49–53. (In Chinese) [Google Scholar] [CrossRef]
- Xu, X.Z. Theoretical Analysis of the Shear Capacity of Concrete Beams with FRP Stirrups. Master’s Dissertation, Zhengzhou University, Zhengzhou, China, 2015. (In Chinese). [Google Scholar]
- ASCE-ACI Committee 445 on Shear and Torsion. Recent Approaches to Shear Design of Structural concrete. Struct. Eng. J. 1998, 124, 1357–1417. [Google Scholar] [CrossRef]
- Collins, M.P. Prestressed Concrete Structures; Prentice Hall: Englewood Cliffs, NJ, USA, 1991. [Google Scholar]
- 318-02 and 318R-02; Building Code Requirements for Structural Concrete (ACI 318-02) and Commentary (ACI 318R-02). American Concrete Institute: Farmington Hills, MI, USA, 2002.
- Vecchio, F. Stress-strain characteristics of reinforced concrete in pure shear, Final report. In IABSE Colloquium on Advanced Mechanics of Reinforced Concrete; International Association for Bridge and Structural Engineering: Zurich, Switzerland, 1981; pp. 211–225. [Google Scholar]
- Vecchio, F.J.; Collins, M.P. The Modified Compression-field Theory for Reinforced-concrete Elements Subjected to Shear. Am. Concr. J. Inst. 1986, 83, 219–231. [Google Scholar]
- Schlaich, J. Design and detailing of structural concrete using strut-and-tie models. Struct. Eng. 1991, 69, 113–125. [Google Scholar]
- Maruyama, K.; Zhao, W.J. Flexural and shear behaviour of concrete beams reinforced with FRP rods. Corros. Corros. Prot. Steel Concr. 1994, 1330–1339. [Google Scholar]
- Maruyama, K.; Zhao, W.J. Size effect in shear behavior of FRP reinforced concrete beams, and International Conference on Advanced Composite Materials in Bridges and Structures. CSCE 1996, 227–234. [Google Scholar]
- Zhao, W.; Maruyama, K.; Suzuki, H. Shear behavior of concrete beams reinforced by FRP rods as longitudinal and shear reinforcement. In RILEM Proceedings; Chapman & Hall: Boca Raton, FL, USA, 1995; p. 152. [Google Scholar]
- Emile, S.; Ryan, M.; Sami, R. Fibre reinforced polymer shear reinforcement for concrete members: Behaviour and design guidelines. Can. J. Civil Eng. 2000, 27, 859–872. [Google Scholar] [CrossRef]
- Nagasaka, T.; Fukuyama, H.; Tanigaki, M. Shear performance of concrete beams reinforced with FRP stirrups. ACI Spec. Publ. 1993, 138, 789–812. [Google Scholar]
- Ahmed, E.A.; El-Sayed, A.K.; El-Salakawy, E.; Benmokrane, B. Bend strength of FRP stirrups: Comparison and evaluation of testing methods. Compos. Constr. J. 2010, 14, 3–10. [Google Scholar] [CrossRef]


| Beam Specimen | Longitudinal Reinforcement | GFRP Stirrup | a (mm) | λ | |||
|---|---|---|---|---|---|---|---|
| Top | Bottom | Diameter (mm) | S (mm) | ρsv (%) | |||
| B-1 | 2 ϕ 20 | 4 ϕ 20 | 6 | 150 | 0.25 | 240 | 1 |
| B-2 | 2 ϕ 20 | 4 ϕ 20 | 6 | 150 | 0.25 | 480 | 2 |
| B-3 | 2 ϕ 20 | 4 ϕ 20 | 6 | 150 | 0.25 | 720 | 3 |
| B-4 | 2 ϕ 20 | 4 ϕ 20 | 6 | 150 | 0.25 | 960 | 4 |
| B-5 | 2 ϕ 20 | 4 ϕ 20 | 6 | 100 | 0.38 | 480 | 2 |
| B-6 | 2 ϕ 20 | 4 ϕ 20 | 6 | 200 | 0.19 | 480 | 2 |
| Specimen No. | Maximum Tensile Force (kN) | Ultimate Tensile Strength (MPa) | Elastic Modulus (GPa) | Elongation at Break (%) |
|---|---|---|---|---|
| 1 | 21.1 | 749.0 | 57.2 | 1.3 |
| 2 | 19.9 | 702.1 | 56.2 | 1.2 |
| 3 | 19.1 | 676.9 | 58.1 | 1.2 |
| 4 | 21.9 | 774.5 | 52.5 | 1.5 |
| 5 | 19.2 | 679.0 | 54.1 | 1.3 |
| Mean | 20.2 | 716.3 | 55.6 | 1.3 |
| Beam Specimen | Δmax (mm) | Vcr (kN) | Vscr (kN) | Vexp (kN) | Failure Type |
|---|---|---|---|---|---|
| B-1 | 17.8 | 35 | 175 | 317.0 | DC |
| B-2 | 14.3 | 20 | 85 | 157.0 | SC |
| B-3 | 9.4 | 25 | 60 | 102.5 | DT |
| B-4 | 14.1 | 15 | 35 | 97.5 | DT |
| B-5 | 16.4 | 20 | 110 | 185.0 | SC |
| B-6 | 13.2 | 27 | 70 | 102.5 | SC |
| The Design Code or Guideline | Concrete Contribution (Vc) | FRP Stirrup Contribution (VFRP) |
|---|---|---|
| ACI-440.1R-15 [18] | ||
| CSA S806:12 (reaffirmed 2021) [19] | ||
| GB 50608-2020 [20] | ||
| ISIS-2007 [21] |
| Resource | Specimen ID | Geometrical Characteristics | Concrete | Long. Reinforcement | Shear Reinforcement | Vexp (kN) | Vcal (kN) | Vexp/Vcal | ||||||||||||||||
|---|---|---|---|---|---|---|---|---|---|---|---|---|---|---|---|---|---|---|---|---|---|---|---|---|
| λ | h (mm) | d (mm) | b (mm) | fc′ (MPa) | Type | ρs (%) | Es (GPa) | Type | s (mm) | ρsv (%) | Esv (GPa) | Equation (28) | ACI | CSA | GB | ISIS | Equation (28) | ACI | CSA | GB | ISIS | |||
| This article | B-1 | 1.0 | 300 | 240 | 150 | 26.07 | Steel | 2.79 | 200 | GFRP | 150 | 0.25 | 55.6 | 317 | 247 | 56 | 77 | 69 | 45 | 1.29 | 5.68 | 4.14 | 4.57 | 7.01 |
| B-2 | 2.0 | 300 | 240 | 150 | 26.07 | Steel | 2.79 | 200 | GFRP | 150 | 0.25 | 55.6 | 157 | 155 | 56 | 44 | 69 | 45 | 1.02 | 2.81 | 3.58 | 2.26 | 3.47 | |
| B-3 | 3.0 | 300 | 240 | 150 | 26.07 | Steel | 2.79 | 200 | GFRP | 150 | 0.25 | 55.6 | 102.5 | 116 | 56 | 37 | 69 | 45 | 0.88 | 1.84 | 2.75 | 1.48 | 2.27 | |
| B-4 | 4.0 | 300 | 240 | 150 | 26.07 | Steel | 2.79 | 200 | GFRP | 150 | 0.25 | 55.6 | 97.5 | 113 | 56 | 37 | 69 | 45 | 0.86 | 1.75 | 2.63 | 1.40 | 2.16 | |
| B-5 | 2.0 | 300 | 240 | 150 | 26.07 | Steel | 2.79 | 200 | GFRP | 100 | 0.38 | 55.6 | 185 | 175 | 66 | 50 | 90 | 50 | 1.06 | 2.79 | 3.73 | 2.05 | 3.73 | |
| B-6 | 2.0 | 300 | 240 | 150 | 26.07 | Steel | 2.79 | 200 | GFRP | 200 | 0.19 | 55.6 | 102.5 | 145 | 51 | 41 | 60 | 43 | 0.71 | 2.01 | 2.48 | 1.71 | 2.37 | |
| Maruyama et al. (1994) [41] | FF1-20 | 3.0 | 300 | 250 | 150 | 36.2 | CFRP | 0.55 | 94 | CFRP | 200 | 0.12 | 94 | 60.3 | 87 | 33 | 25 | 46 | 38 | 0.69 | 1.85 | 2.39 | 1.31 | 1.58 |
| FF2-10 | 3.0 | 300 | 250 | 150 | 33.1 | CFRP | 1.1 | 94 | CFRP | 100 | 0.24 | 94 | 90.3 | 145 | 55 | 38 | 84 | 44 | 0.62 | 1.65 | 2.40 | 1.07 | 2.06 | |
| FF1-10 | 3.0 | 300 | 250 | 150 | 38.3 | CFRP | 0.55 | 94 | CFRP | 100 | 0.24 | 94 | 85.3 | 139 | 50 | 32 | 80 | 46 | 0.61 | 1.72 | 2.69 | 1.07 | 1.85 | |
| FF3-10 | 3.0 | 300 | 250 | 150 | 31.3 | CFRP | 1.39 | 94 | CFRP | 100 | 0.24 | 94 | 96.3 | 146 | 56 | 39 | 86 | 43 | 0.66 | 1.71 | 2.44 | 1.12 | 2.24 | |
| FF1-20 | 3.0 | 300 | 250 | 150 | 35 | CFRP | 1.06 | 94 | CFRP | 200 | 0.12 | 94 | 74.1 | 95 | 38 | 30 | 50 | 38 | 0.78 | 1.97 | 2.46 | 1.48 | 1.97 | |
| FF4-10 | 3.0 | 300 | 250 | 150 | 30.5 | CFRP | 2.11 | 94 | CFRP | 100 | 0.24 | 94 | 120.8 | 150 | 60 | 43 | 89 | 43 | 0.80 | 2.00 | 2.78 | 1.35 | 2.83 | |
| FF4-10 | 3.0 | 300 | 250 | 150 | 30.5 | CFRP | 2.11 | 94 | CFRP | 130 | 0.18 | 94 | 87.3 | 127 | 53 | 40 | 74 | 39 | 0.69 | 1.66 | 2.20 | 1.19 | 2.22 | |
| FF4-16 | 3.0 | 300 | 250 | 150 | 31.3 | CFRP | 2.11 | 94 | CFRP | 160 | 0.15 | 94 | 76.3 | 113 | 48 | 37 | 64 | 38 | 0.67 | 1.59 | 2.04 | 1.19 | 2.02 | |
| FF4-20 | 3.0 | 300 | 250 | 150 | 34.9 | CFRP | 2.11 | 94 | CFRP | 200 | 0.12 | 94 | 83.8 | 105 | 45 | 36 | 56 | 38 | 0.80 | 1.88 | 2.31 | 1.51 | 2.23 | |
| Maruyama et al. (1996) [42] | #25/26 | 2.5 | 300 | 250 | 150 | 34 | CFRP | 1.04 | 100 | GFRP | 120 | 0.43 | 30 | 109.2 | 111 | 40 | 34 | 55 | 39 | 0.99 | 2.71 | 3.24 | 1.97 | 2.79 |
| #27/28 | 2.5 | 300 | 250 | 150 | 34 | CFRP | 1.04 | 100 | GFRP | 60 | 0.86 | 30 | 140.2 | 159 | 60 | 42 | 94 | 47 | 0.88 | 2.35 | 3.31 | 1.49 | 2.97 | |
| #30 | 2.5 | 550 | 500 | 300 | 29.5 | CFRP | 1.04 | 100 | GFRP | 240 | 0.43 | 30 | 372.8 | 328 | 157 | 97 | 220 | 148 | 1.14 | 2.37 | 3.84 | 1.70 | 2.52 | |
| #32 | 2.5 | 800 | 750 | 450 | 29.5 | CFRP | 1.07 | 100 | GFRP | 360 | 0.43 | 30 | 599.3 | 657 | 356 | 175 | 495 | 332 | 0.91 | 1.68 | 3.43 | 1.21 | 1.80 | |
| Zhao et al. [43] | #10 | 3.0 | 300 | 250 | 150 | 34.3 | CFRP | 3.03 | 105 | GFRP | 90 | 0.42 | 39 | 113.7 | 133 | 58 | 44 | 76 | 42 | 0.86 | 1.97 | 2.58 | 1.50 | 2.69 |
| #14 | 3.0 | 300 | 250 | 150 | 34.3 | CFRP | 3.03 | 105 | CFRP | 90 | 0.42 | 10 | 126.6 | 78 | 40 | 35 | 39 | 34 | 1.63 | 3.20 | 3.65 | 3.24 | 3.67 | |
| #16 | 3.0 | 300 | 250 | 150 | 34.3 | CFRP | 2.27 | 105 | GFRP | 90 | 0.42 | 39 | 116.9 | 129 | 54 | 42 | 73 | 42 | 0.90 | 2.16 | 2.80 | 1.61 | 2.77 | |
| #18 | 2.0 | 300 | 250 | 150 | 34.3 | CFRP | 1.51 | 105 | GFRP | 90 | 0.42 | 39 | 124 | 154 | 50 | 51 | 69 | 42 | 0.81 | 2.50 | 2.45 | 1.79 | 2.94 | |
| #19 | 4.0 | 300 | 250 | 150 | 34.3 | CFRP | 1.51 | 105 | GFRP | 90 | 0.42 | 39 | 73.8 | 127 | 50 | 34 | 69 | 42 | 0.58 | 1.49 | 2.17 | 1.07 | 1.75 | |
| Emile et al. [44] | CC-3 | 3.2 | 560 | 470 | 135 | 50 | CFRP | 1.25 | 137 | CFRP | 157 | 0.36 | 137 | 305 | 491 | 174 | 96 | 283 | 127 | 0.62 | 1.75 | 3.19 | 1.08 | 2.40 |
| CG-3 | 3.2 | 560 | 470 | 135 | 50 | CFRP | 1.25 | 137 | GFRP | 157 | 1.07 | 41 | 304.5 | 446 | 160 | 89 | 256 | 121 | 0.68 | 1.90 | 3.44 | 1.19 | 2.51 | |
| Nagasaka et al. [45] | AC0560M | 1.2 | 300 | 253 | 250 | 28.9 | AFRP | 1.9 | 56 | CFRP | 80 | 0.5 | 80 | 246.2 | 416 | 135 | 142 | 230 | 79 | 0.59 | 1.82 | 1.73 | 1.07 | 3.13 |
| AC1060M | 1.2 | 300 | 253 | 250 | 34 | AFRP | 1.9 | 56 | CFRP | 40 | 1 | 40 | 311 | 452 | 137 | 150 | 231 | 82 | 0.69 | 2.27 | 2.08 | 1.35 | 3.81 | |
| AC1560M | 1.2 | 300 | 253 | 250 | 32.9 | AFRP | 1.9 | 56 | CFRP | 27 | 1.48 | 27 | 359 | 444 | 137 | 148 | 231 | 81 | 0.81 | 2.63 | 2.42 | 1.56 | 4.43 | |
| AC0590M | 1.8 | 300 | 253 | 250 | 28.9 | AFRP | 1.9 | 56 | CFRP | 80 | 0.5 | 80 | 204 | 343 | 135 | 111 | 230 | 79 | 0.59 | 1.51 | 1.84 | 0.89 | 2.59 | |
| AC1090M | 1.8 | 300 | 253 | 250 | 28.9 | AFRP | 1.9 | 56 | CFRP | 40 | 1 | 40 | 276.6 | 343 | 135 | 111 | 230 | 79 | 0.81 | 2.04 | 2.50 | 1.20 | 3.52 | |
| AC1590M | 1.8 | 300 | 253 | 250 | 28.9 | AFRP | 1.9 | 56 | CFRP | 27 | 1.48 | 27 | 282.5 | 343 | 135 | 111 | 230 | 79 | 0.82 | 2.09 | 2.55 | 1.23 | 3.59 | |
| AC0512M | 2.4 | 300 | 253 | 250 | 32.9 | AFRP | 1.9 | 56 | CFRP | 80 | 0.5 | 80 | 158.9 | 349 | 137 | 92 | 231 | 81 | 0.46 | 1.16 | 1.72 | 0.69 | 1.96 | |
| AC1012M | 2.4 | 300 | 253 | 250 | 32.9 | AFRP | 1.9 | 56 | CFRP | 40 | 1 | 40 | 229.6 | 349 | 137 | 92 | 231 | 81 | 0.66 | 1.68 | 2.49 | 1.00 | 2.83 | |
| AA0590M | 1.8 | 300 | 253 | 250 | 33.5 | AFRP | 1.9 | 56 | AFRP | 80 | 0.5 | 80 | 201.1 | 361 | 137 | 115 | 231 | 81 | 0.56 | 1.47 | 1.75 | 0.87 | 2.47 | |
| AA1090M | 1.8 | 300 | 253 | 250 | 34.7 | AFRP | 1.9 | 56 | AFRP | 40 | 1 | 40 | 271.7 | 365 | 137 | 116 | 231 | 82 | 0.74 | 1.98 | 2.34 | 1.18 | 3.31 | |
| AH0590M | 1.8 | 300 | 253 | 250 | 33.5 | AFRP | 1.9 | 56 | G/CFRP | 80 | 0.5 | 80 | 169.7 | 361 | 137 | 115 | 231 | 81 | 0.47 | 1.24 | 1.48 | 0.73 | 2.08 | |
| AH1090M | 1.8 | 300 | 253 | 250 | 33.5 | AFRP | 1.9 | 56 | G/CFRP | 40 | 1 | 40 | 243.3 | 361 | 137 | 115 | 231 | 81 | 0.67 | 1.78 | 2.12 | 1.05 | 2.99 | |
| AG0590M | 1.8 | 300 | 253 | 250 | 33.5 | AFRP | 1.9 | 56 | G/CFRP | 80 | 0.5 | 80 | 175.6 | 361 | 137 | 115 | 231 | 81 | 0.49 | 1.28 | 1.53 | 0.76 | 2.16 | |
| AG1090M | 1.8 | 300 | 253 | 250 | 33.5 | AFRP | 1.9 | 56 | G/CFRP | 40 | 1 | 40 | 228.6 | 361 | 137 | 115 | 231 | 81 | 0.63 | 1.67 | 1.99 | 0.99 | 2.81 | |
| AC1090L | 1.8 | 300 | 253 | 250 | 23.5 | AFRP | 1.9 | 56 | CFRP | 40 | 1 | 40 | 207 | 321 | 133 | 105 | 229 | 75 | 0.64 | 1.55 | 1.97 | 0.90 | 2.75 | |
| AC1590L | 1.8 | 300 | 253 | 250 | 22.6 | AFRP | 1.9 | 56 | CFRP | 27 | 1.48 | 27 | 221.7 | 317 | 133 | 104 | 224 | 75 | 0.70 | 1.67 | 2.13 | 0.99 | 2.98 | |
| AC1012L | 2.4 | 300 | 253 | 250 | 24.3 | AFRP | 1.9 | 56 | CFRP | 40 | 1 | 40 | 182.5 | 328 | 134 | 89 | 229 | 76 | 0.56 | 1.37 | 2.05 | 0.80 | 2.41 | |
| AC1512L | 2.4 | 300 | 253 | 250 | 23 | AFRP | 1.9 | 56 | CFRP | 27 | 1.48 | 27 | 191.3 | 325 | 133 | 88 | 229 | 75 | 0.59 | 1.44 | 2.17 | 0.84 | 2.56 | |
| AA1090L | 1.8 | 300 | 253 | 250 | 22.6 | AFRP | 1.9 | 56 | AFRP | 40 | 1 | 40 | 190.3 | 317 | 133 | 104 | 229 | 75 | 0.60 | 1.43 | 1.82 | 0.83 | 2.55 | |
| AA1590L | 1.8 | 300 | 253 | 250 | 22.6 | AFRP | 1.9 | 56 | AFRP | 27 | 1.48 | 27 | 203.1 | 317 | 133 | 104 | 229 | 75 | 0.64 | 1.53 | 1.95 | 0.89 | 2.73 | |
| AH1090L | 1.8 | 300 | 253 | 250 | 23.5 | AFRP | 1.9 | 56 | G/CFRP | 40 | 1 | 40 | 190.3 | 321 | 133 | 105 | 229 | 75 | 0.59 | 1.43 | 1.81 | 0.83 | 2.53 | |
| AH1590L | 1.8 | 300 | 253 | 250 | 23.5 | AFRP | 1.9 | 56 | G/CFRP | 27 | 1.48 | 27 | 211.9 | 321 | 133 | 105 | 229 | 75 | 0.66 | 1.59 | 2.01 | 0.93 | 2.82 | |
| AC1590M′ | 1.8 | 300 | 253 | 250 | 39.5 | AFRP | 1.9 | 56 | CFRP | 27 | 1.48 | 27 | 292.3 | 382 | 138 | 120 | 231 | 85 | 0.76 | 2.11 | 2.44 | 1.27 | 3.45 | |
| AC1512M′ | 2.4 | 300 | 253 | 250 | 39.2 | AFRP | 1.9 | 56 | CFRP | 27 | 1.48 | 27 | 226.6 | 363 | 138 | 94 | 231 | 85 | 0.62 | 1.64 | 2.40 | 0.98 | 2.68 | |
| Ahmed et al. [46] | SG-9.5-2 | 3.3 | 700 | 615 | 180 | 39.5 | STEEL | 1.51 | 200 | GFRP | 300 | 0.262 | 45 | 259 | 282 | 163 | 75 | 188 | 161 | 0.92 | 1.59 | 3.45 | 1.38 | 1.61 |
| SG-9.5-3 | 3.3 | 700 | 615 | 180 | 41 | STEEL | 1.51 | 200 | GFRP | 200 | 0.394 | 45 | 337 | 371 | 192 | 90 | 242 | 175 | 0.91 | 1.75 | 3.75 | 1.39 | 1.93 | |
| SG-9.5-4 | 3.3 | 700 | 615 | 180 | 33.5 | STEEL | 1.51 | 200 | GFRP | 150 | 0.526 | 45 | 416 | 438 | 215 | 101 | 298 | 172 | 0.95 | 1.94 | 4.11 | 1.40 | 2.41 | |
| Bentz et al. [11] | L05-1 | 3.3 | 1000 | 937 | 450 | 46 | GFRP | 0.51 | 37 | GFRP | 400 | 0.09 | 41 | 264 | 334 | 213 | 128 | 231 | 272 | 0.79 | 1.24 | 2.07 | 1.14 | 0.97 |
| L20-1 | 3.6 | 1000 | 857 | 450 | 36 | GFRP | 2.23 | 37 | GFRP | 400 | 0.09 | 41 | 527.9 | 454 | 293 | 123 | 300 | 223 | 1.16 | 1.80 | 4.29 | 1.76 | 2.37 | |
| M20-1 | 7.5 | 500 | 405 | 450 | 35 | GFRP | 2.36 | 37 | GFRP | 400 | 0.09 | 41 | 170.3 | 239 | 140 | 78 | 143 | 104 | 0.71 | 1.22 | 2.18 | 1.19 | 1.64 | |
| Mean | - | - | - | - | - | - | - | - | - | - | - | - | - | - | - | - | - | - | - | 0.77 | 1.91 | 2.58 | 1.33 | 2.66 |
| SD | - | - | - | - | - | - | - | - | - | - | - | - | - | - | - | - | - | - | - | 0.21 | 0.67 | 0.71 | 0.62 | 0.88 |
| COV (%) | - | - | - | - | - | - | - | - | - | - | - | - | - | - | - | - | - | - | - | 27.4 | 35.1 | 27.6 | 46.4 | 33.0 |
Disclaimer/Publisher’s Note: The statements, opinions and data contained in all publications are solely those of the individual author(s) and contributor(s) and not of MDPI and/or the editor(s). MDPI and/or the editor(s) disclaim responsibility for any injury to people or property resulting from any ideas, methods, instructions or products referred to in the content. |
© 2024 by the authors. Licensee MDPI, Basel, Switzerland. This article is an open access article distributed under the terms and conditions of the Creative Commons Attribution (CC BY) license (https://creativecommons.org/licenses/by/4.0/).
Share and Cite
Zhao, J.; Bao, X.; Yang, S.; Wang, Z.; He, H.; Xu, X. Experimental and Theoretical Studies on the Shear Performance of Concrete Beams Reinforced with Fiber-Reinforced Polymer Stirrups. Materials 2024, 17, 593. https://doi.org/10.3390/ma17030593
Zhao J, Bao X, Yang S, Wang Z, He H, Xu X. Experimental and Theoretical Studies on the Shear Performance of Concrete Beams Reinforced with Fiber-Reinforced Polymer Stirrups. Materials. 2024; 17(3):593. https://doi.org/10.3390/ma17030593
Chicago/Turabian StyleZhao, Jun, Xiaohu Bao, Shoudi Yang, Zike Wang, Hongwei He, and Xiazheng Xu. 2024. "Experimental and Theoretical Studies on the Shear Performance of Concrete Beams Reinforced with Fiber-Reinforced Polymer Stirrups" Materials 17, no. 3: 593. https://doi.org/10.3390/ma17030593
APA StyleZhao, J., Bao, X., Yang, S., Wang, Z., He, H., & Xu, X. (2024). Experimental and Theoretical Studies on the Shear Performance of Concrete Beams Reinforced with Fiber-Reinforced Polymer Stirrups. Materials, 17(3), 593. https://doi.org/10.3390/ma17030593