Article

Effect of Cooling Rate on α Variant Selection and Microstructure Evolution in TB17 Titanium Alloy

by
Guoqiang Shang
1,2,
Xueping Gan
1,*,
Xinnan Wang
2,
Jinyang Ge
1,
Chao Li
3,
Zhishou Zhu
2,
Xiaoyong Zhang
1,* and
Kechao Zhou
1
1
State Key Laboratory of Powder Metallurgy, Central South University, Changsha 410083, China
2
Key Laboratory of Advanced Titanium Alloys, AECC Beijing Institute of Aeronautical Materials, Beijing 100095, China
3
Hunan Engineering Technology Research Center in Special Titanium Alloys for High-end Equipment, Hunan Goldsky Titanium Industry Technology Co., Ltd., Changde 415001, China
*
Authors to whom correspondence should be addressed.
Materials 2024, 17(20), 5010; https://doi.org/10.3390/ma17205010
Submission received: 7 September 2024 / Revised: 10 October 2024 / Accepted: 11 October 2024 / Published: 13 October 2024
(This article belongs to the Special Issue Research on Performance Improvement of Advanced Alloys)

Abstract

The α variant selection and microstructure evolution in a new metastable β titanium alloy TB17 were studied in depth by DTA, microhardness, XRD, SEM, and EBSD characterization methods. Under the rapid cooling rate conditions (150 °C/min–400 °C/min), only a very small amount of granular αWM (α Widmanstatten precipitates within the grains) precipitated within the grains. The secondary α phase precipitated in the alloy changed from granular to fine needle-like at moderate cooling rates (15 °C/min–20 °C/min). When continuing to slow down the cooling rates (10 °C/min and 1 °C/min), the αGB (α precipitates along the β grain boundaries), αWGB (α Widmanstatten precipitates that developed from β grain boundaries or αGB) and αWM grew rapidly. Moreover, the continuous cooling transformation (CCT) diagram illustrated the effect of cooling rate on the β/α phase transition. EBSD analysis revealed that the variants selection of α near the original β grain boundary is mainly divided into three categories. (i) The double-BOR (Burgers orientation relationship) αWGB colonies within neighboring β grains grow in different directions but have the same crystallographic orientation. (ii) The double-BOR αWGB colonies within neighboring β grains have different growth directions and different crystallographic orientations. (iii) The double-BOR αWGB colonies within the same grain have the same growth direction, but different crystallographic directions. And these double-BOR αWGB colonies correspond to two variants of the given {0001}α//{110}β.

1. Introduction

Metastable β-type titanium alloy has become the key direction of the development and application research of new titanium alloy, due to its good plasticity, high strength, high fracture toughness [1,2,3,4,5]. Among them, using as a new type of military advanced material, the ultra-high strength and toughness titanium alloy has been focused on and given priority to development at home and abroad [6,7,8]. Recently, a new metastable β titanium alloy with independent intellectual property rights for aircraft structure, TB17 alloy, has been developed by the Beijing Institute of Aeronautical Materials (BIAM). By adjusting the heat treatment process, the matching of ultra-high strength (Rm ≥ 1350 MPa) -plasticity (A ≥ 6%)and -toughness (KIC ≥ 50 MPa·m1/2) can be realized [9,10,11], which can be applied to the load-bearing components or load-bearing bolt fasteners with high weight loss, high load and high life requirements of the new generation of aircraft.
Generally, the mechanical properties of alloys are closely related to the changes in microstructure. The microstructure of metastable β-type titanium alloy is determined by its processing and heat treatment state [12]. The mechanical properties of alloys can be modified over a wide range by changing the heat treatment process, such as solid solution temperature, cooling rate, and aging process, to achieve the matching of different strength, plasticity, and toughness levels [13,14,15]. Among them, the cooling process after solution treatment is one of the most important links of metastable β-type titanium alloy [16,17]. With the different cooling rates of solution treatment, β phase may directly precipitate α phase, or maybe decompose into the intermediate transition phase such as the ω phase [18], β′ phase [19], and α″ phase [20]. Therefore, in the case of a certain alloy composition, the phase transformation of titanium alloy during the cooling process mainly depends on the cooling rate. It determines the morphology, distribution, size, and type of phases in the titanium alloy structure at room temperature. For example, Angelier [21] has investigated the phase transition process of β-CEZ during continuous cooling after β-solution treatment. The results indicate that different cooling rates lead to the α/β structure showing two different morphologies: the basket structure at high cooling rates and the colony structure at low cooling rates. At intermediate cooling rates, both morphologies coexist. Many researchers have investigated the precipitation order and phase transition kinetics of different kinds of α precipitates, i.e., αGB, αWGB, and αWM. However, it is not fully clarified how the different types of α affect the microstructure. In addition, the α variant selection during the cooling process is also an important component of the microstructural changes in alloys. Xu et al. [22] investigated the precipitation behavior and evolution mechanism of grain boundary α (αGB) and α side plates (αSP) of TB-17 titanium alloy, the results showed that the αGB can change the morphology of β grain boundary, and the deformation degree of αGB increases with the increasing λ (The λ, which denotes the minimum value of misorientations between 12 α variants of βnBOR and αGB). The α phase usually exists as a strengthening phase in titanium alloys. Due to the different orientation relationships between the α and β phases, the difficulty of dislocations passing through the interface between the two phases varies, resulting in different strengthening effects and plasticity differences. Therefore, a deep understanding of the α phase variant selection in titanium alloys is of great significance for achieving the control of alloy mechanical properties.
The main objective of this study is to determine the microstructural evolution of the new titanium alloy-TB17 and the preferred selection of its α variants, during the cooling process from the β single-phase region at different cooling rates. This present study would provide a better understanding of the process and mechanism of β→α microstructural transformation in metastable titanium alloys and provide technical guidance for realizing precise microstructural tailoring of new metastable β alloys.

2. Materials and Experimental Section

2.1. Materials

The TB17 titanium alloy ingot was melted by multiple vacuum arc melting (VAR; Physcience Opto-electronics Co., Ltd., Beijing, China) three times to ensure uniformity of chemical composition, and then the open die was forged to 210 mm in diameter. The β→α transition temperature was 845 °C as measured by metallography. The chemical composition of TB17 titanium alloy is shown in Table 1 and the microstructure is shown in Figure 1. The microstructure is a typical basketweave structure. During the air cooling process, with a cooling rate of 15 °C/min after quasi-β forging, the lamellar α phase with different lengths is precipitated in the forging billet. The thickness of the lamellar α phase is between 50–100 nm, which is woven and evenly distributed on the matrix.

2.2. Heat Treatment

Cylindrical specimens of 3mm in diameter and 10 mm in length were machined from the TB17 titanium alloy forging stock using a wire-electrode cutting saw(Kunshan Ruijun Machinery Equit Co., Ltd., Kunshan, China) for continuous cooling tests at various cooling rates. To ensure the accuracy and representativeness of the experimental results, three samples were tested in each group of experiments. Various heat treatments with heating and cooling cycles were carried out using a thermal dilatometer (Linseis (Shanghai) Scientific Instrument Co., Ltd., Shanghai, China), which provides precise temperature control in a protective atmosphere. The specimens were initially heated to 900 °C and isothermally held for 30 min, then cooled continuously to room temperature at cooling rates of 1 °C/min, 10 °C/min, 15 °C/min, 20 °C/min, 50 °C/min, 100 °C/min, 150 °C/min, 200 °C/min, and 400 °C/min, respectively.

2.3. Microstructure Characterization

Microstructure observations were conducted on a Sigma 300 scan electron microscope (SEM; Zeiss, Germany). The samples were polished with an automatic polishing machine (Trojan (Suzhou) Materials Technology Co., Ltd., Suzhou, China) and then etched in a corrosive solution (10% HF + 7% HNO3 + 83% H2O). Meanwhile, the microstructure was quantitatively investigated using Image-Pro Plus image 6.0 analysis software. The phase composition of the alloy at different cooling rates was determined by a D/Max 2500 X-ray diffractometer with a Cu Ka source (XRD; Rigaku, Tokyo, Japan). Moreover, the microstructure and crystallographic orientation of the α phase were observed using a JSM-7900F scanning electron microscope (SEM; Jeol, Tokyo, Japan) equipped with a Symmetry S2 electron backscatter diffraction detector (EBSD; Oxford Instrument Technology (Shanghai) Co., Ltd., Shanghai, China) and orientation imaging microscopy software Channel 5 (Oxford Instrument Technology (Shanghai) Co., Ltd., Shanghai, China). The microhardness of the alloy at different cooling rates was determined by the FMARS9000 Vickers hardness tester (FUTURE-TECH, Taiwan Nakazawa, Taiwan, China).

3. Results and Discussion

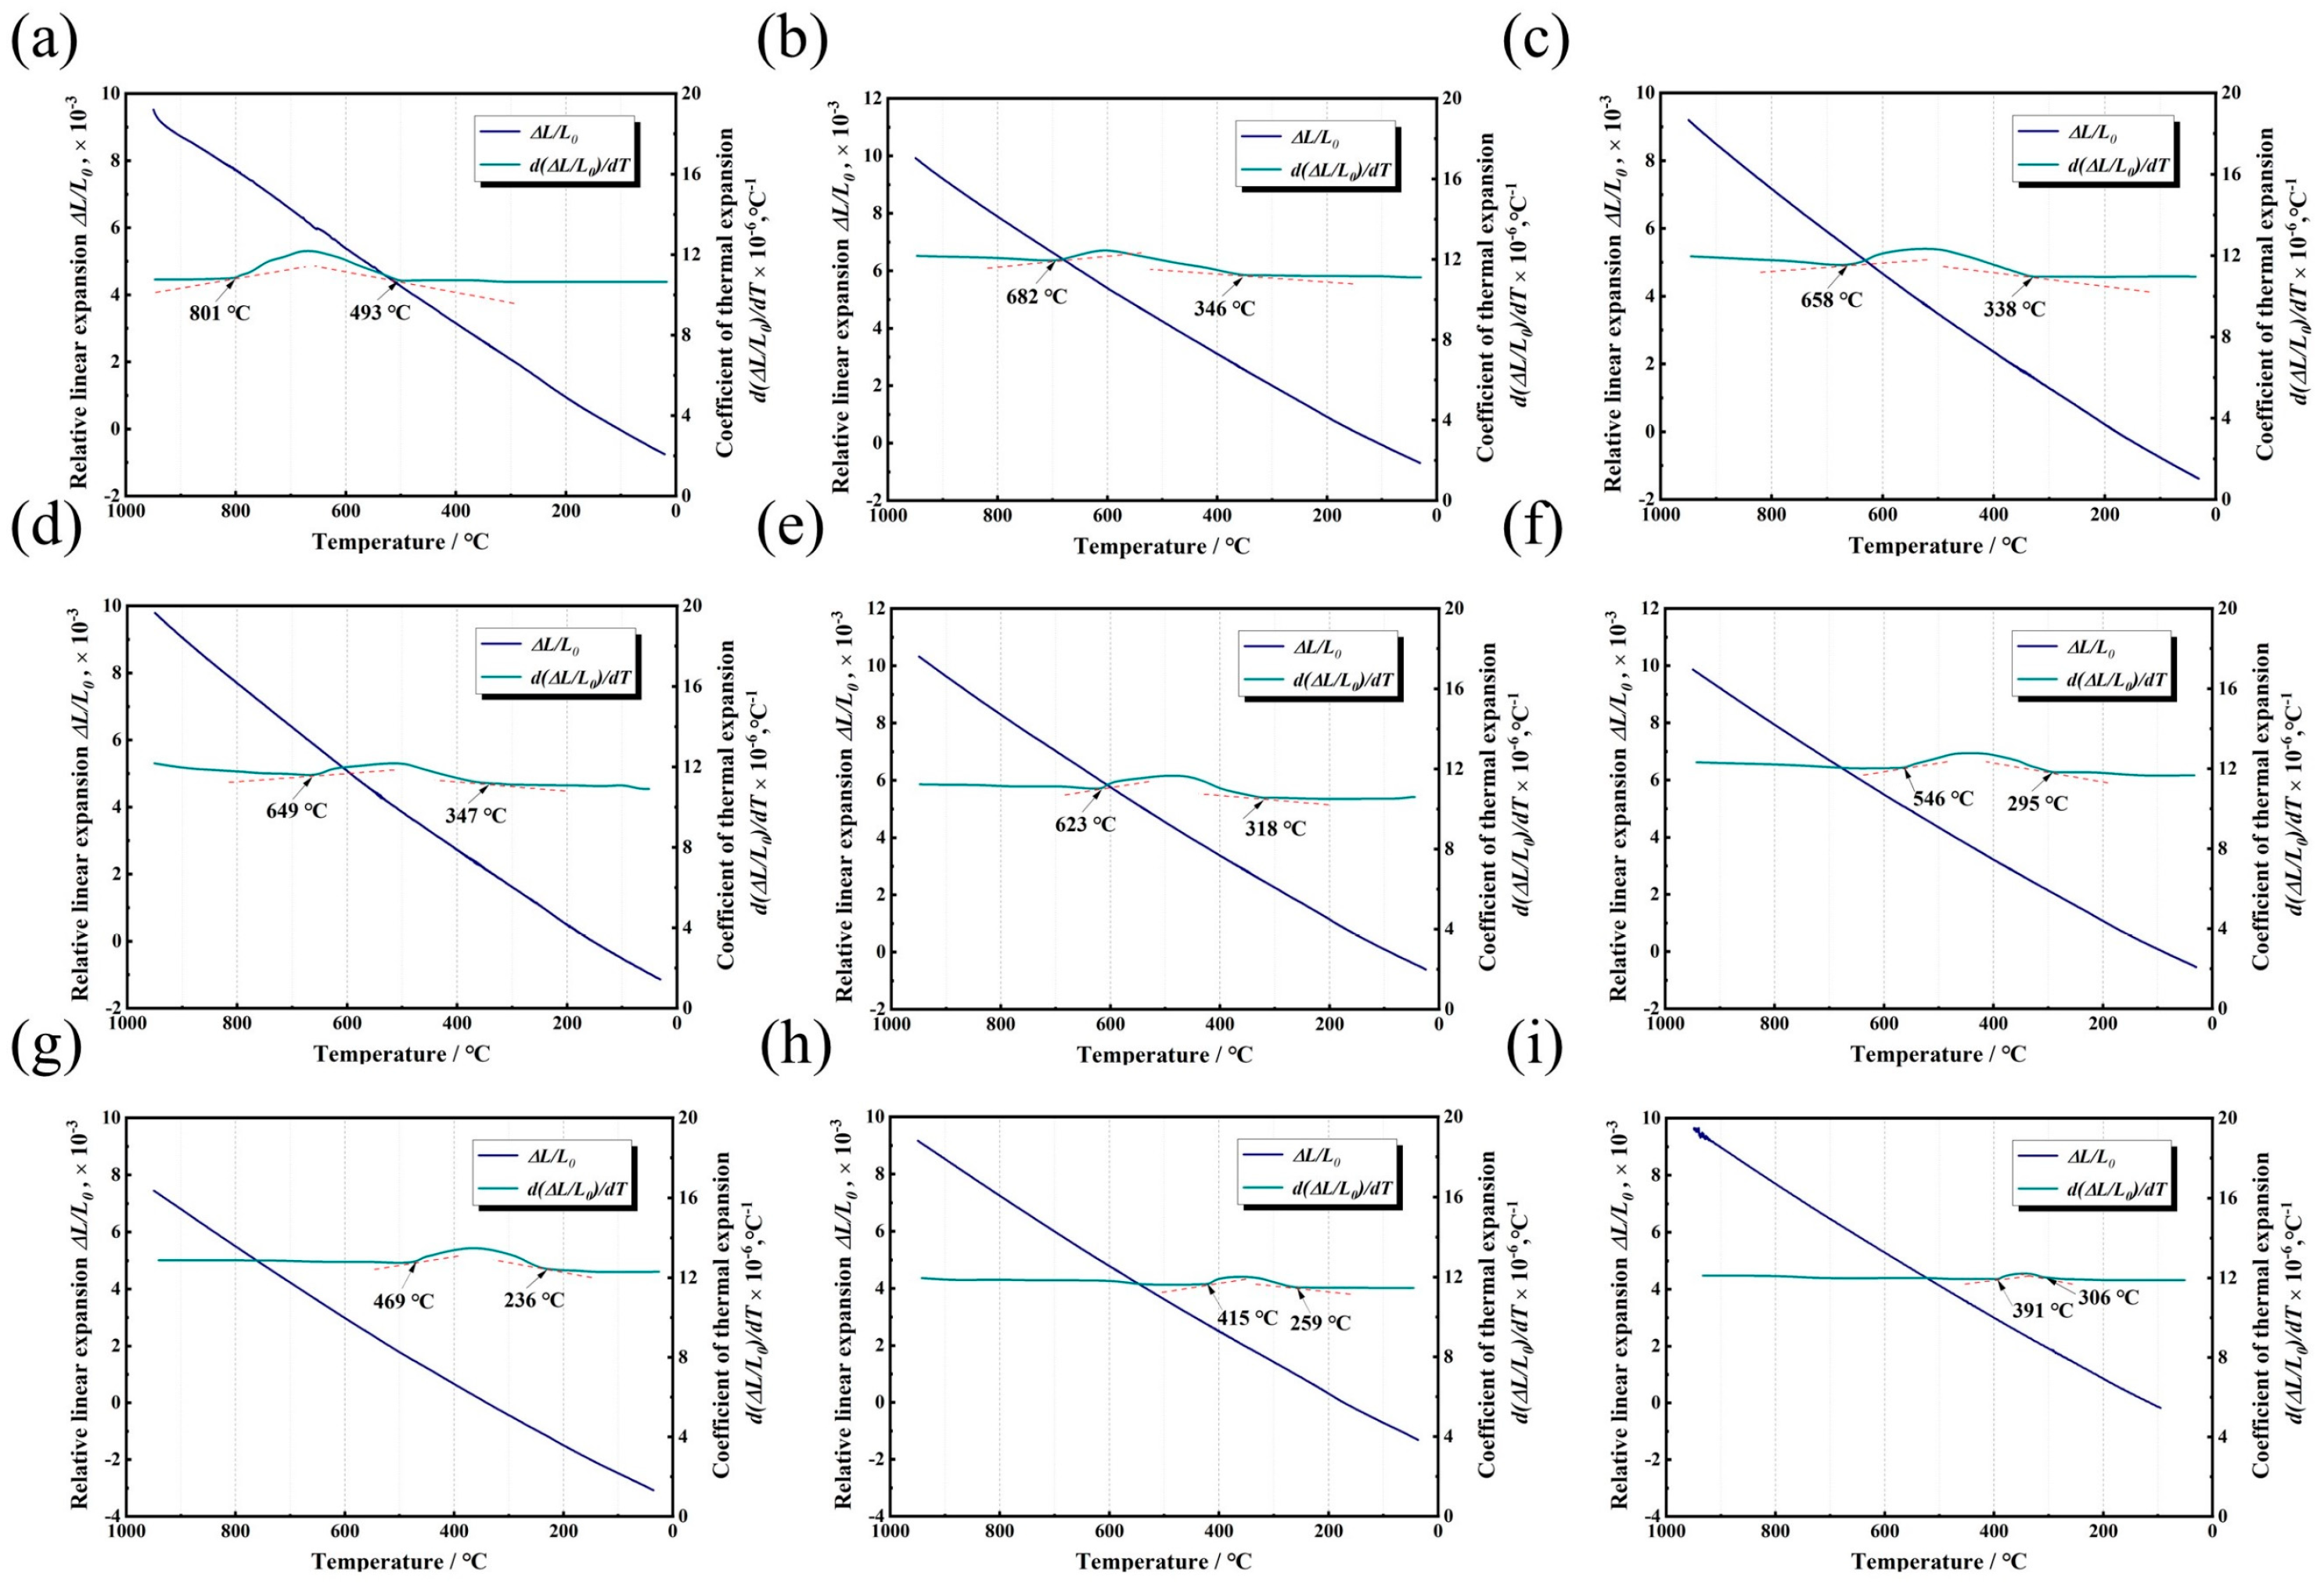
3.1. Dilatometric Behaviors

Figure 2 shows the relative expansion coefficient curves of TB17 titanium alloy at different cooling rates. As can be seen, the relative expansion coefficient at different cooling rates shows a parabolic curve change. During the cooling process, the relative expansion coefficient first maintains an approximate horizontal straight line. As the temperature decreases, the relative expansion coefficient increases first in a certain temperature range and then decreases slowly after reaching the peak until it drops to the initial relative expansion coefficient. The position corresponding to the temperature point where the relative expansion coefficient of the alloy changes significantly is taken at the beginning and end points of the phase transition. As can be seen from Figure 2, when the cooling rate is 1 °C/min, the phase transition start point and end point are 801 °C and 493 °C, respectively, and the relative expansion coefficient is the largest when the temperature is reduced to about 682 °C. As the cooling rate increases, the temperature range of the starting point and ending point of the phase transition gradually decreases. When the cooling rate increases to 400 °C/min, the start and end points of the phase transition are 391 °C and 306 °C, respectively, and the temperature corresponding to the maximum relative expansion coefficient is about 353 °C. In general, with the increasing cooling rate, the onset temperature of β→α phase transition of TB17 titanium alloy gradually decreases, while the phase transition final temperature first decreases and then increases. The dilatometric curves of TB17 titanium alloy at different cooling rates are shown in Figure 2. As the temperature decreases, the relative expansion at different cooling rates shows a linear downward trend, and there is no obvious deviation from the linear relationship. This is mainly because the volume increase of the alloy caused by the transition from β→α phase is about 0.17%, which is equivalent to the change of 0.06 ± 0.03% in the length direction [23,24]. It is difficult to show an obvious expansion or contraction effect on the relative expansion curve.

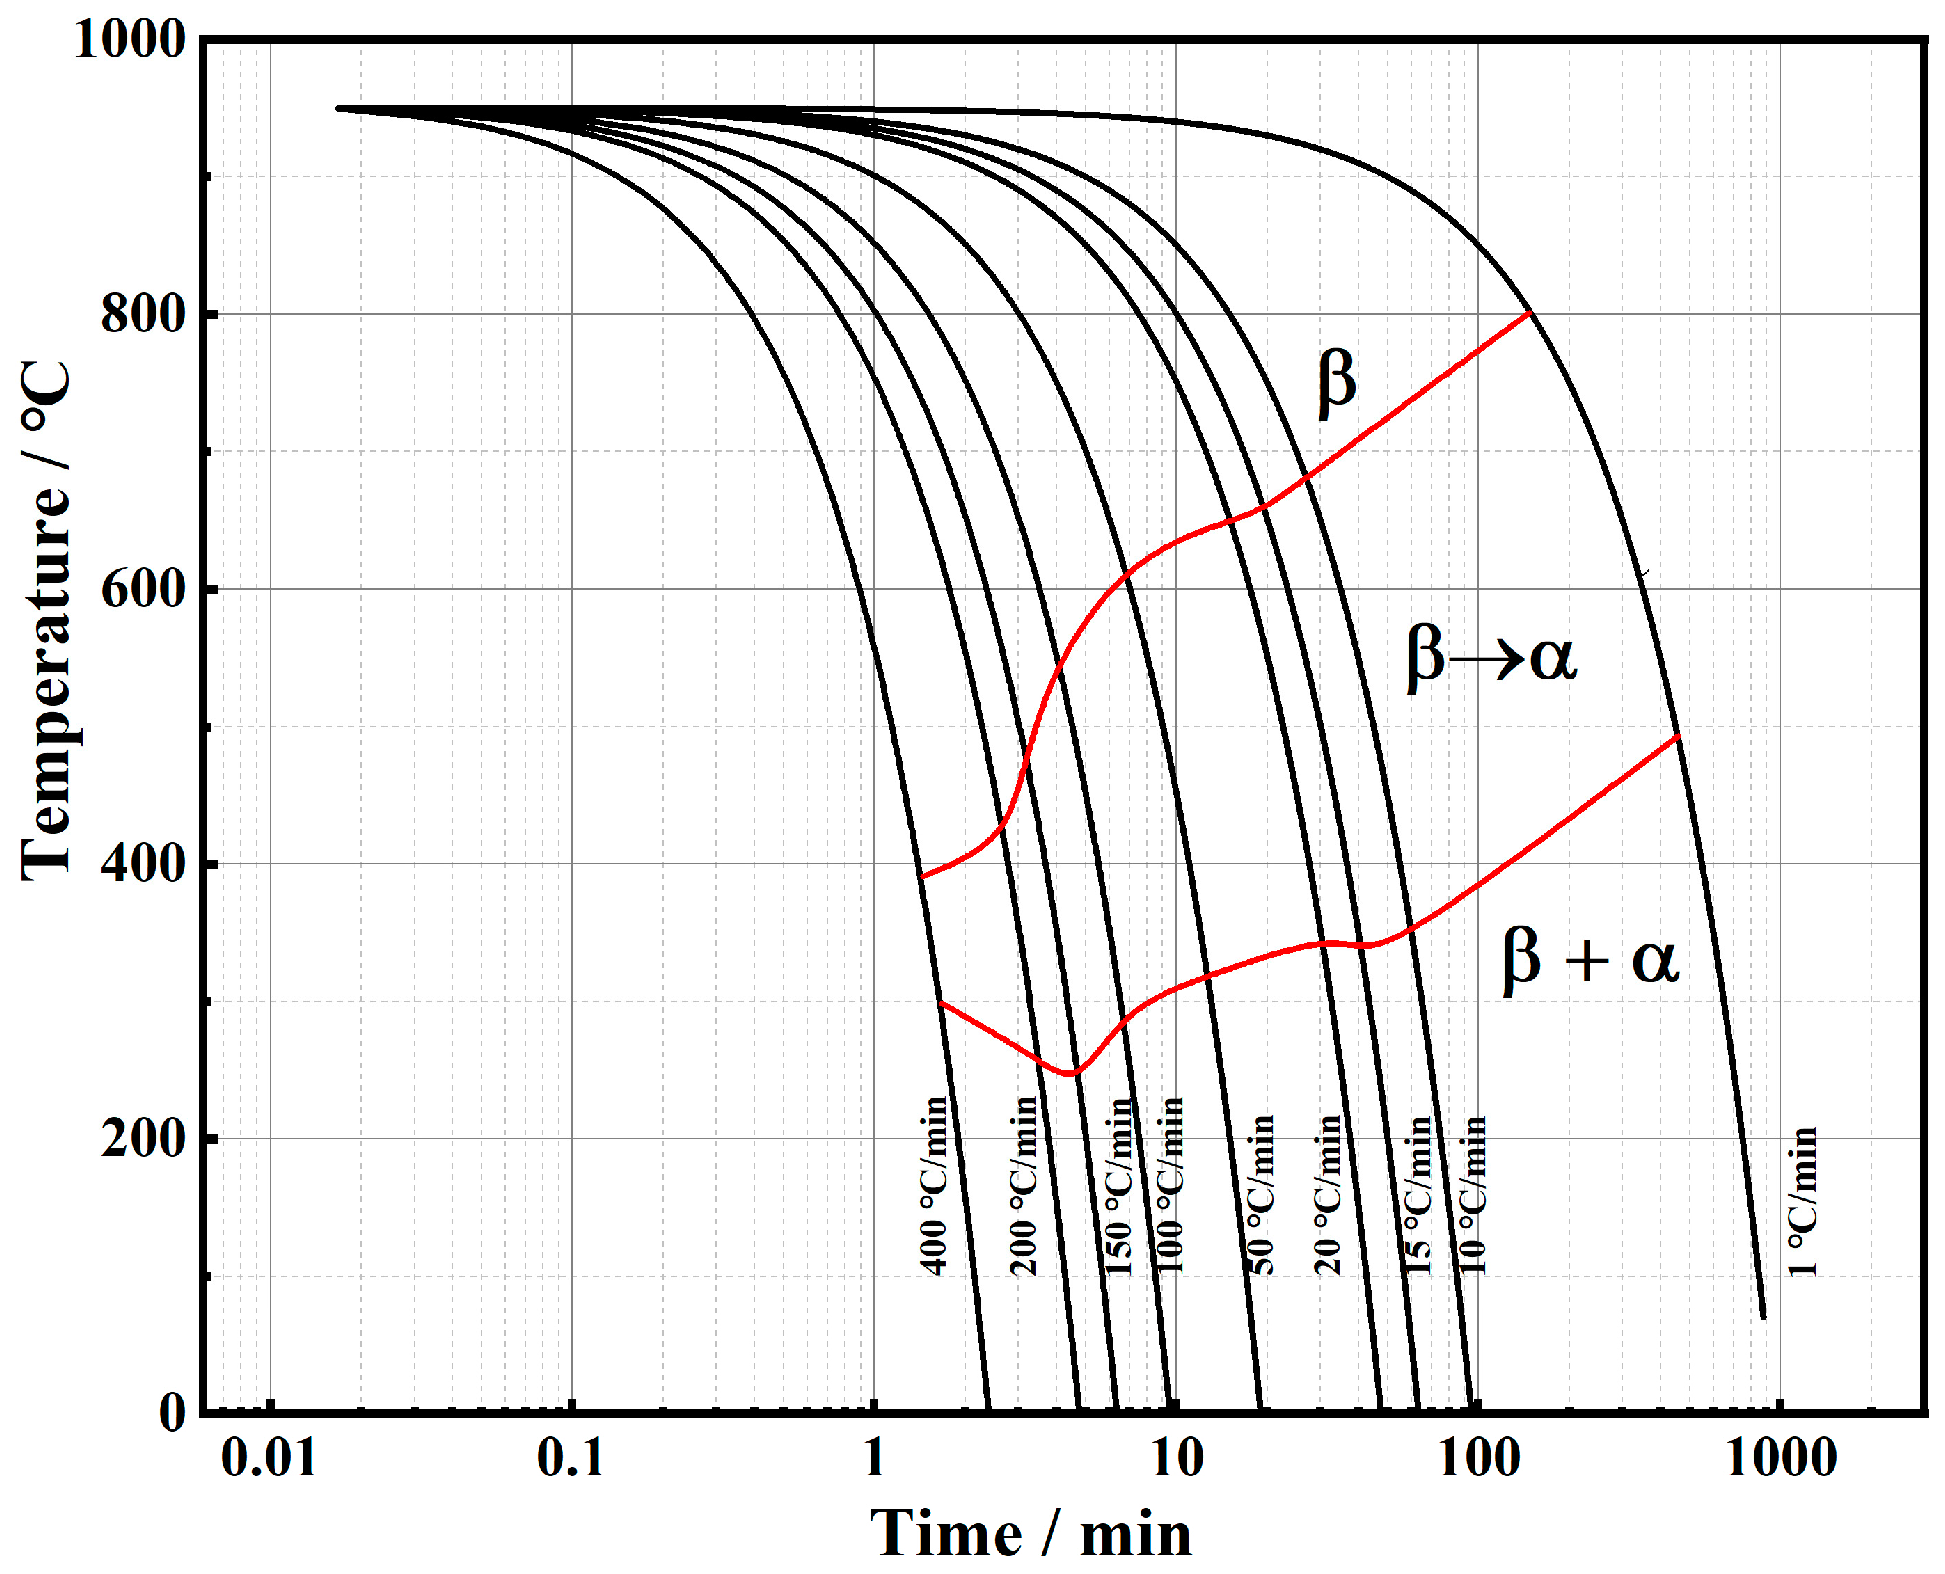
3.2. Establishment of CCT Curve of TB17 Titanium Alloy

The continuous cooling transformation (CCT) curve can reflect the phase transition law of the alloy during the cooling process. From this, the effect of the cooling rate on the start, end, and extent of the phase transition, as well as the structure of the transition can be obtained. As an effective foundation for analyzing the structure and properties of phase transformation products, it is of great guidance to formulate heat treatment process parameters and regulate the microstructure. According to the thermal expansion curves of TB17 titanium alloy at different cooling rates obtained in this chapter, the starting and ending temperature points of phase transformation at different cooling rates were obtained by the derivative method [25]. Combined with microstructure and microhardness analysis, the continuous cooling transformation kinetics curve (CCT curve) of TB17 titanium alloy was drawn, as shown in Figure 3. When the cooling rate is less than or equal to 400 °C/min, there is only α phase precipitation, and the precipitation of α phase mainly occurs in the middle and high-temperature region, no β→ω phase transition and β→α″ non-equilibrium phase transition occurs. The phase transition completes over a relatively wide range of temperatures and occurs at lower temperatures as the cooling rate increases.

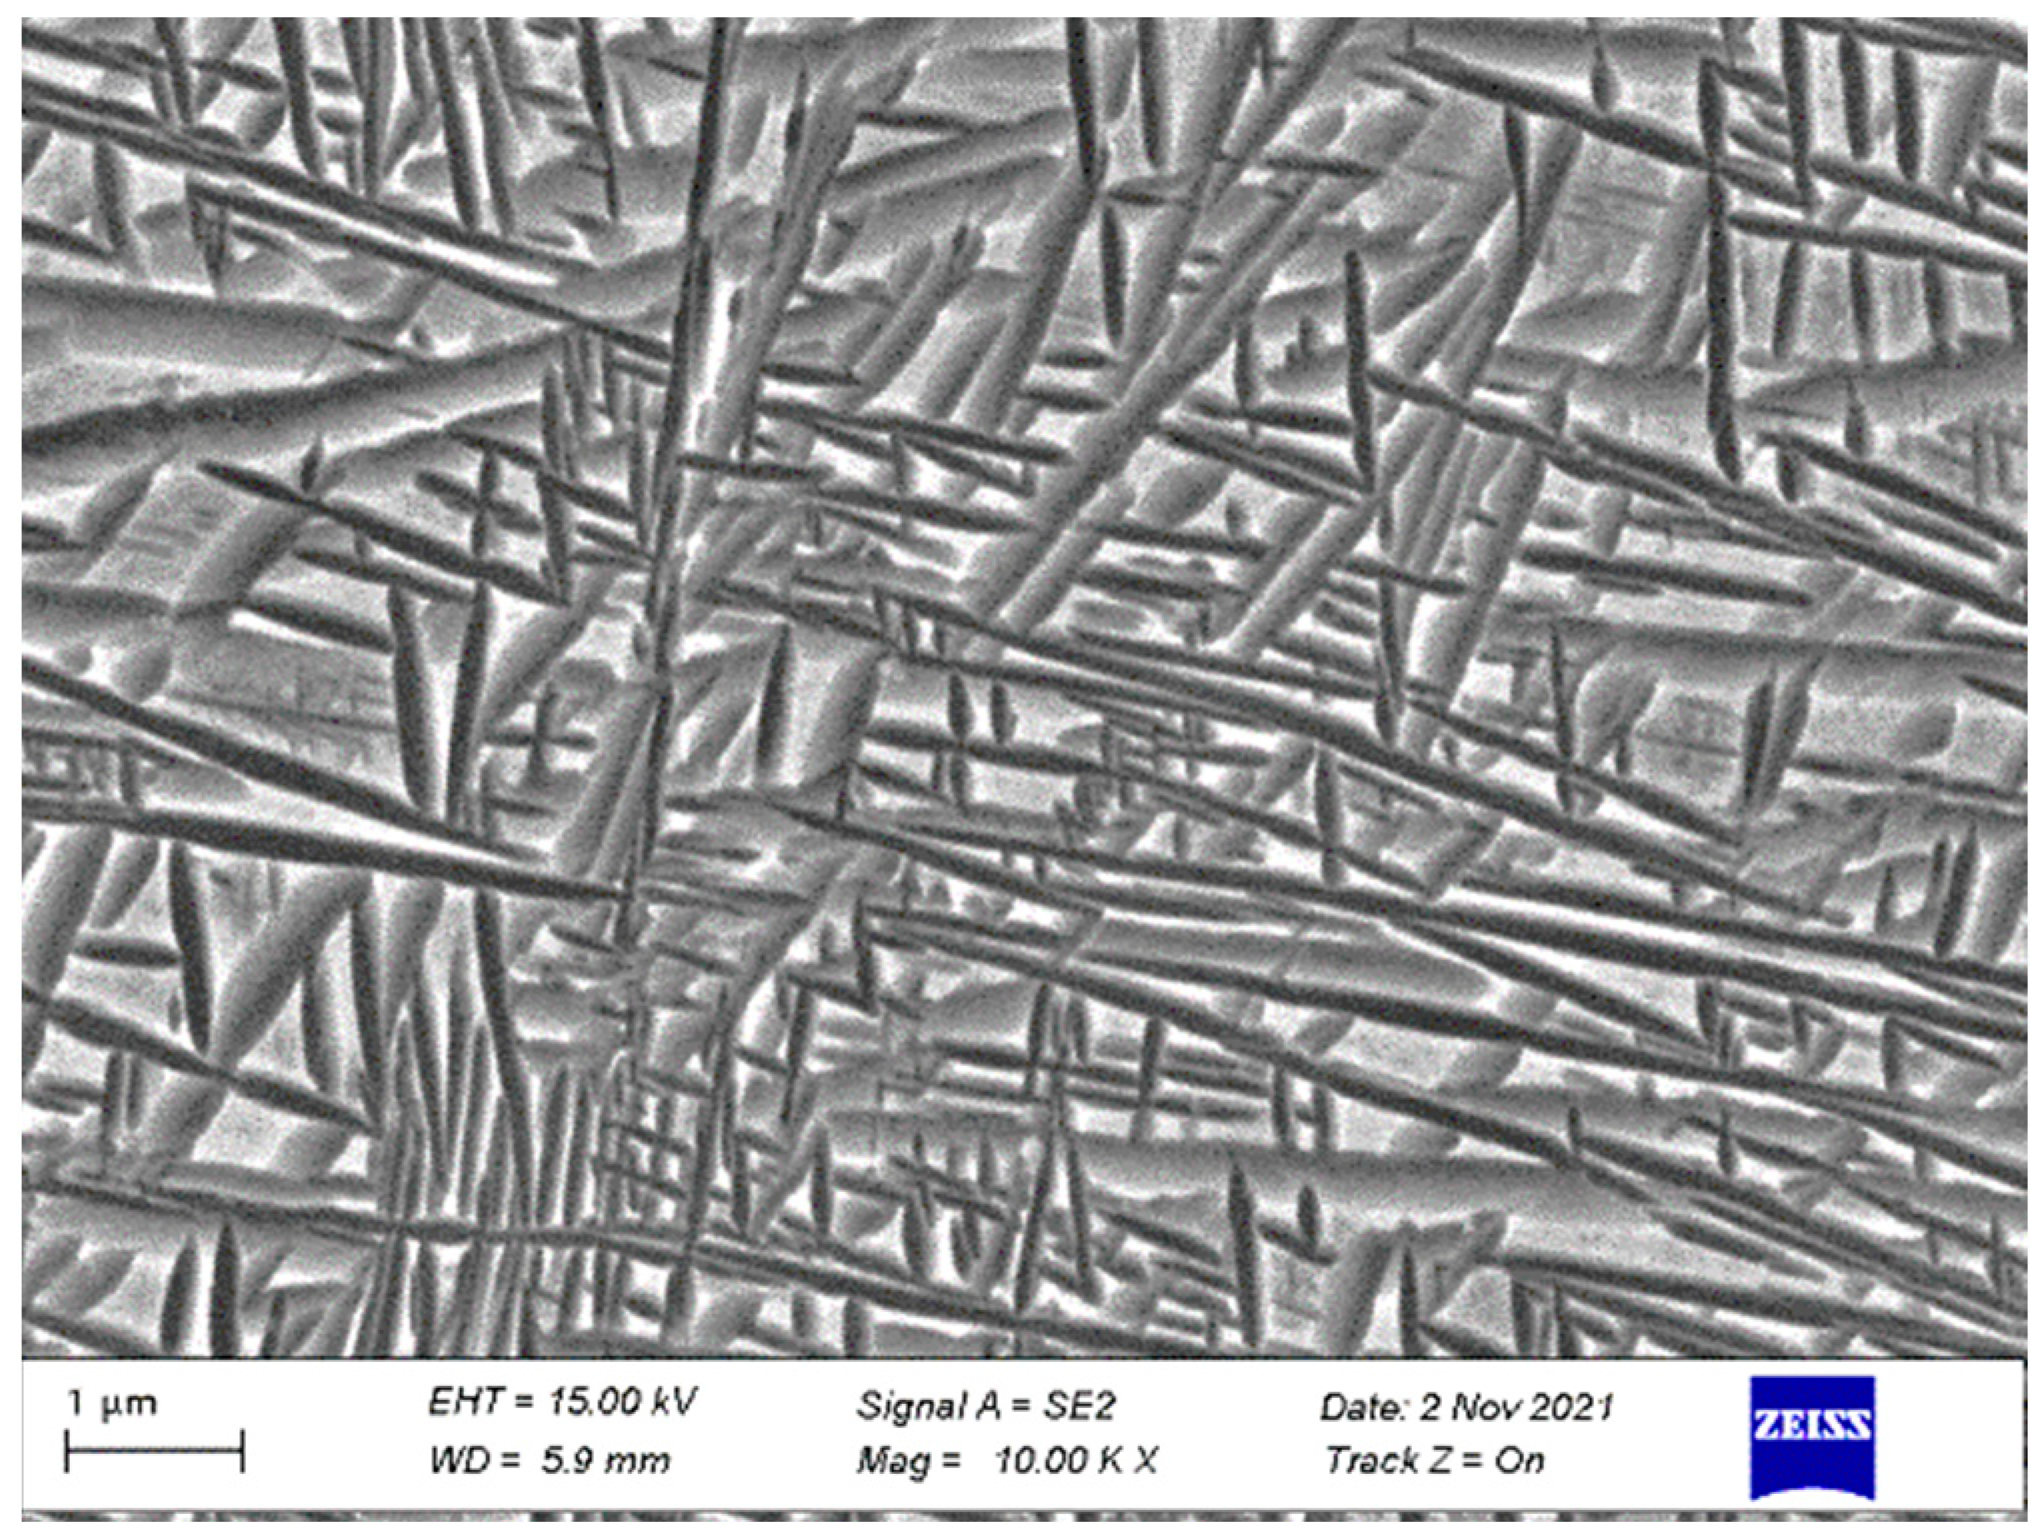
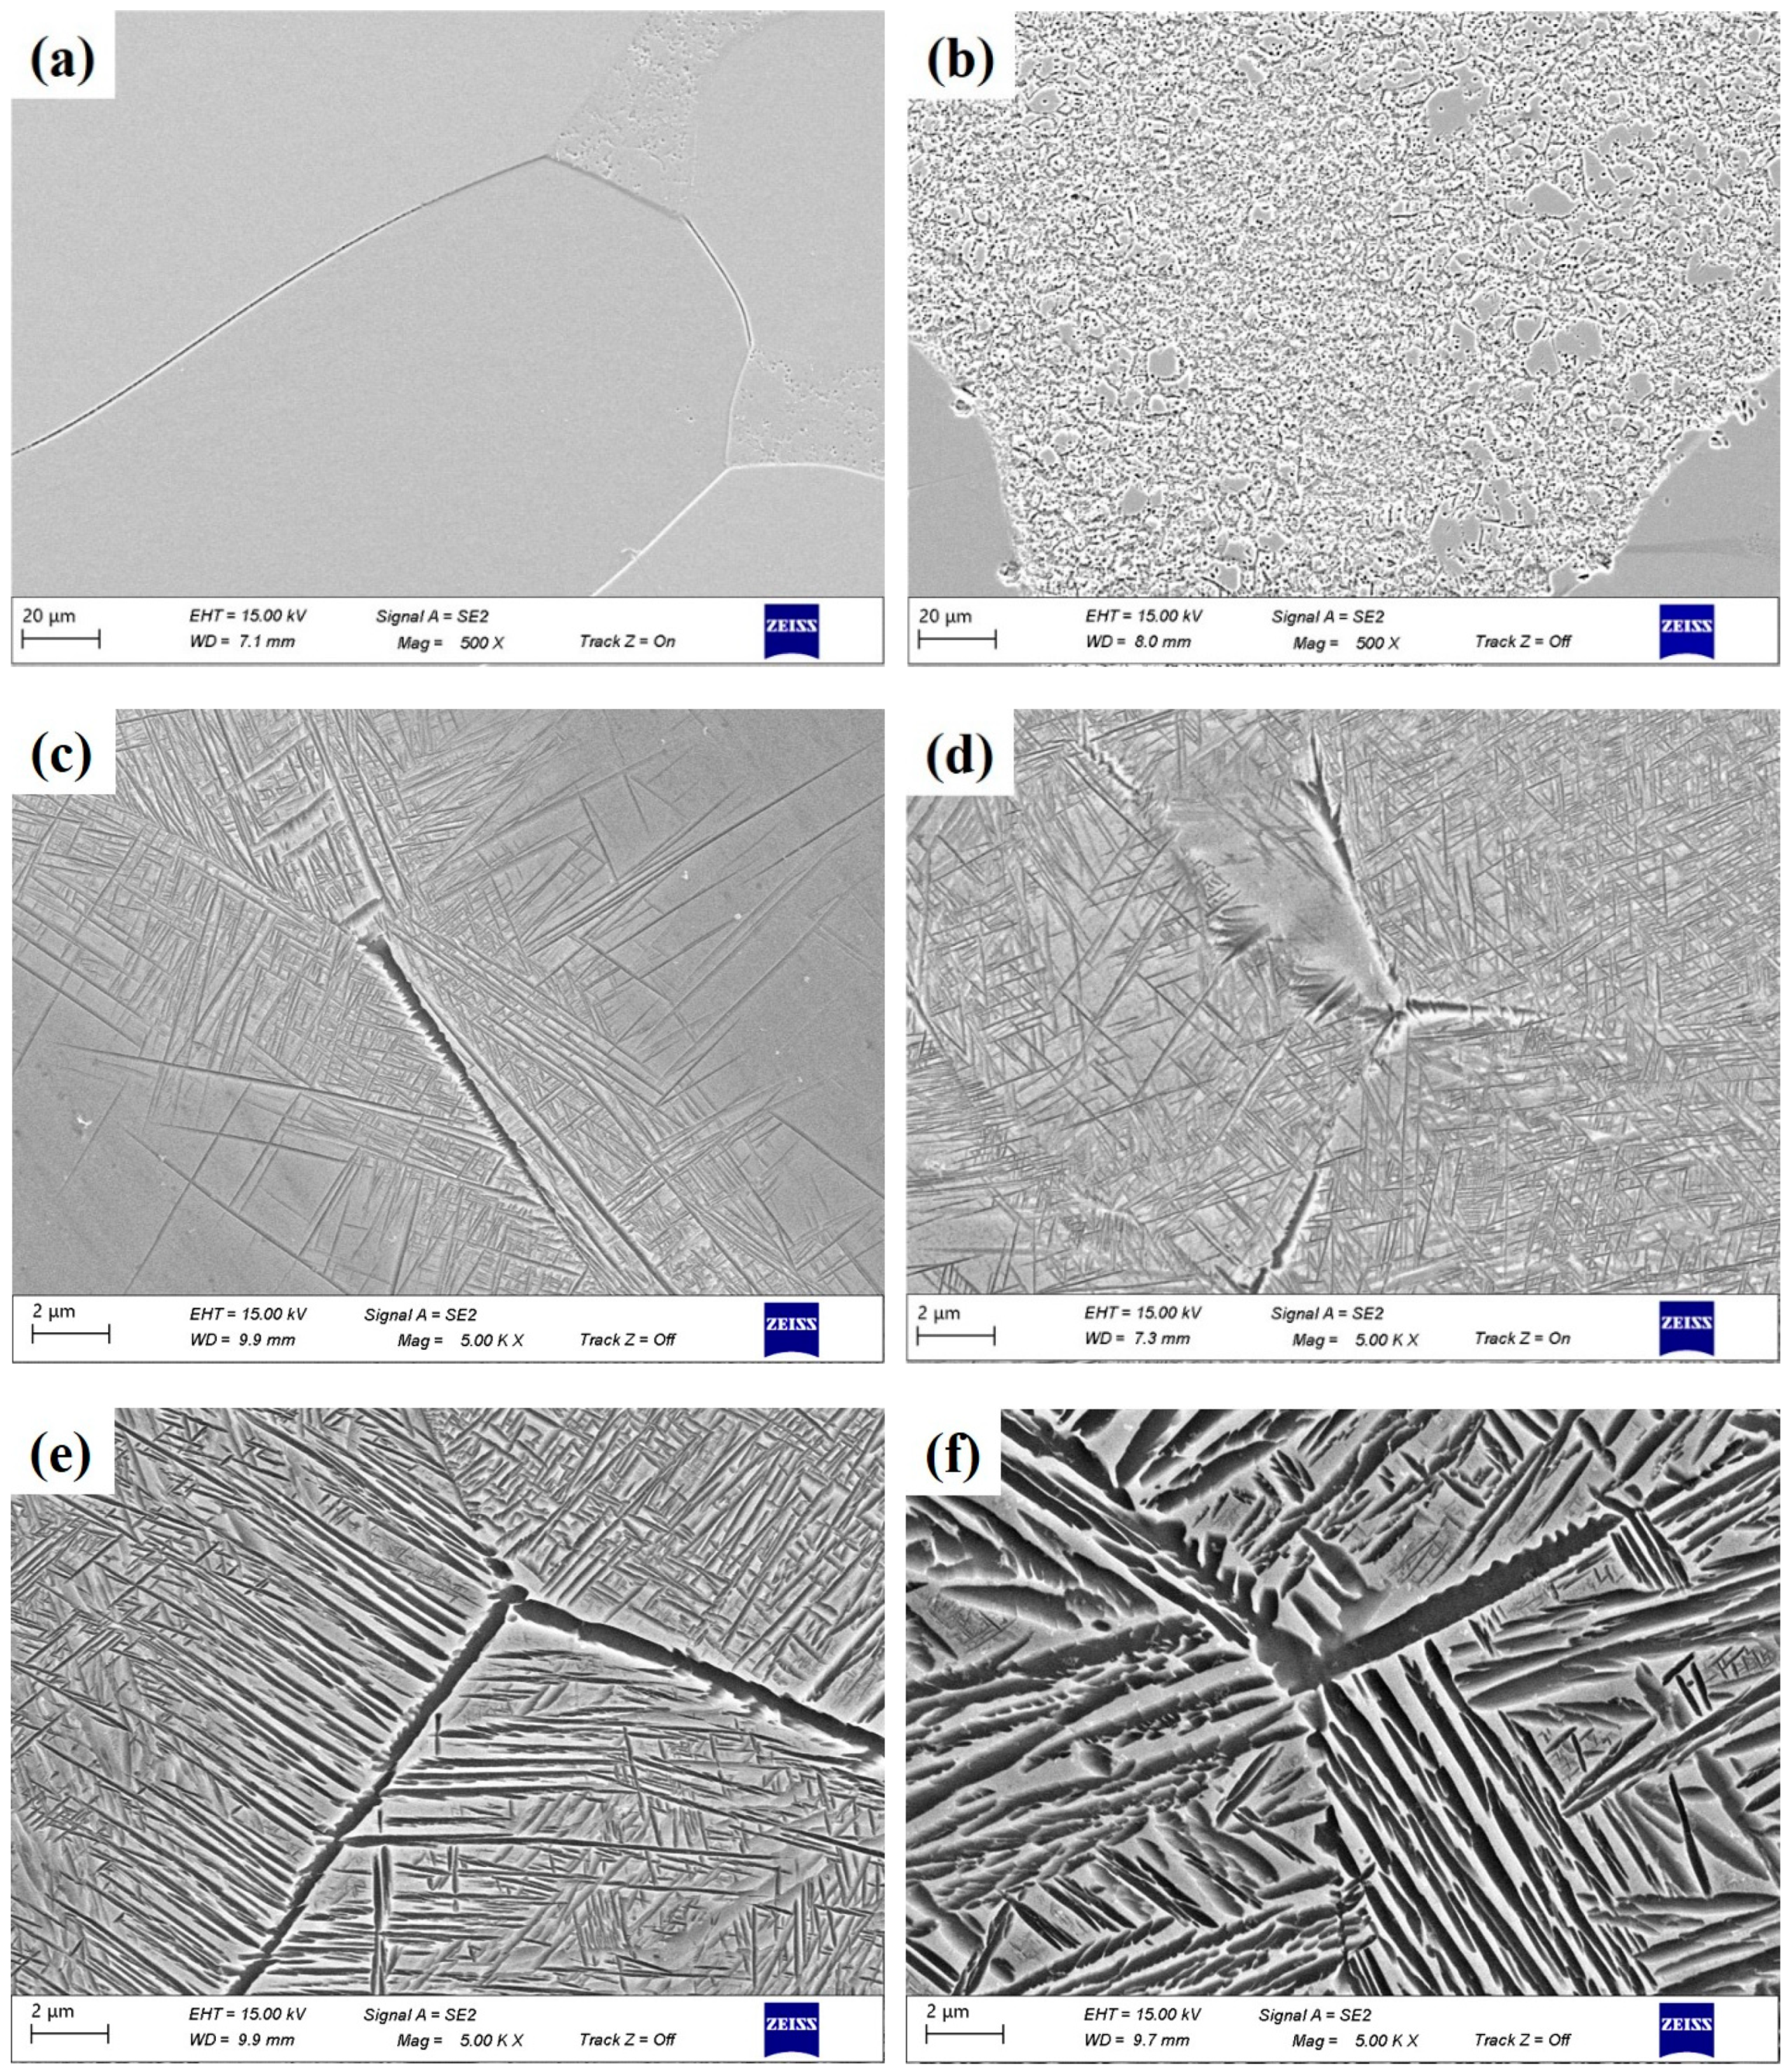
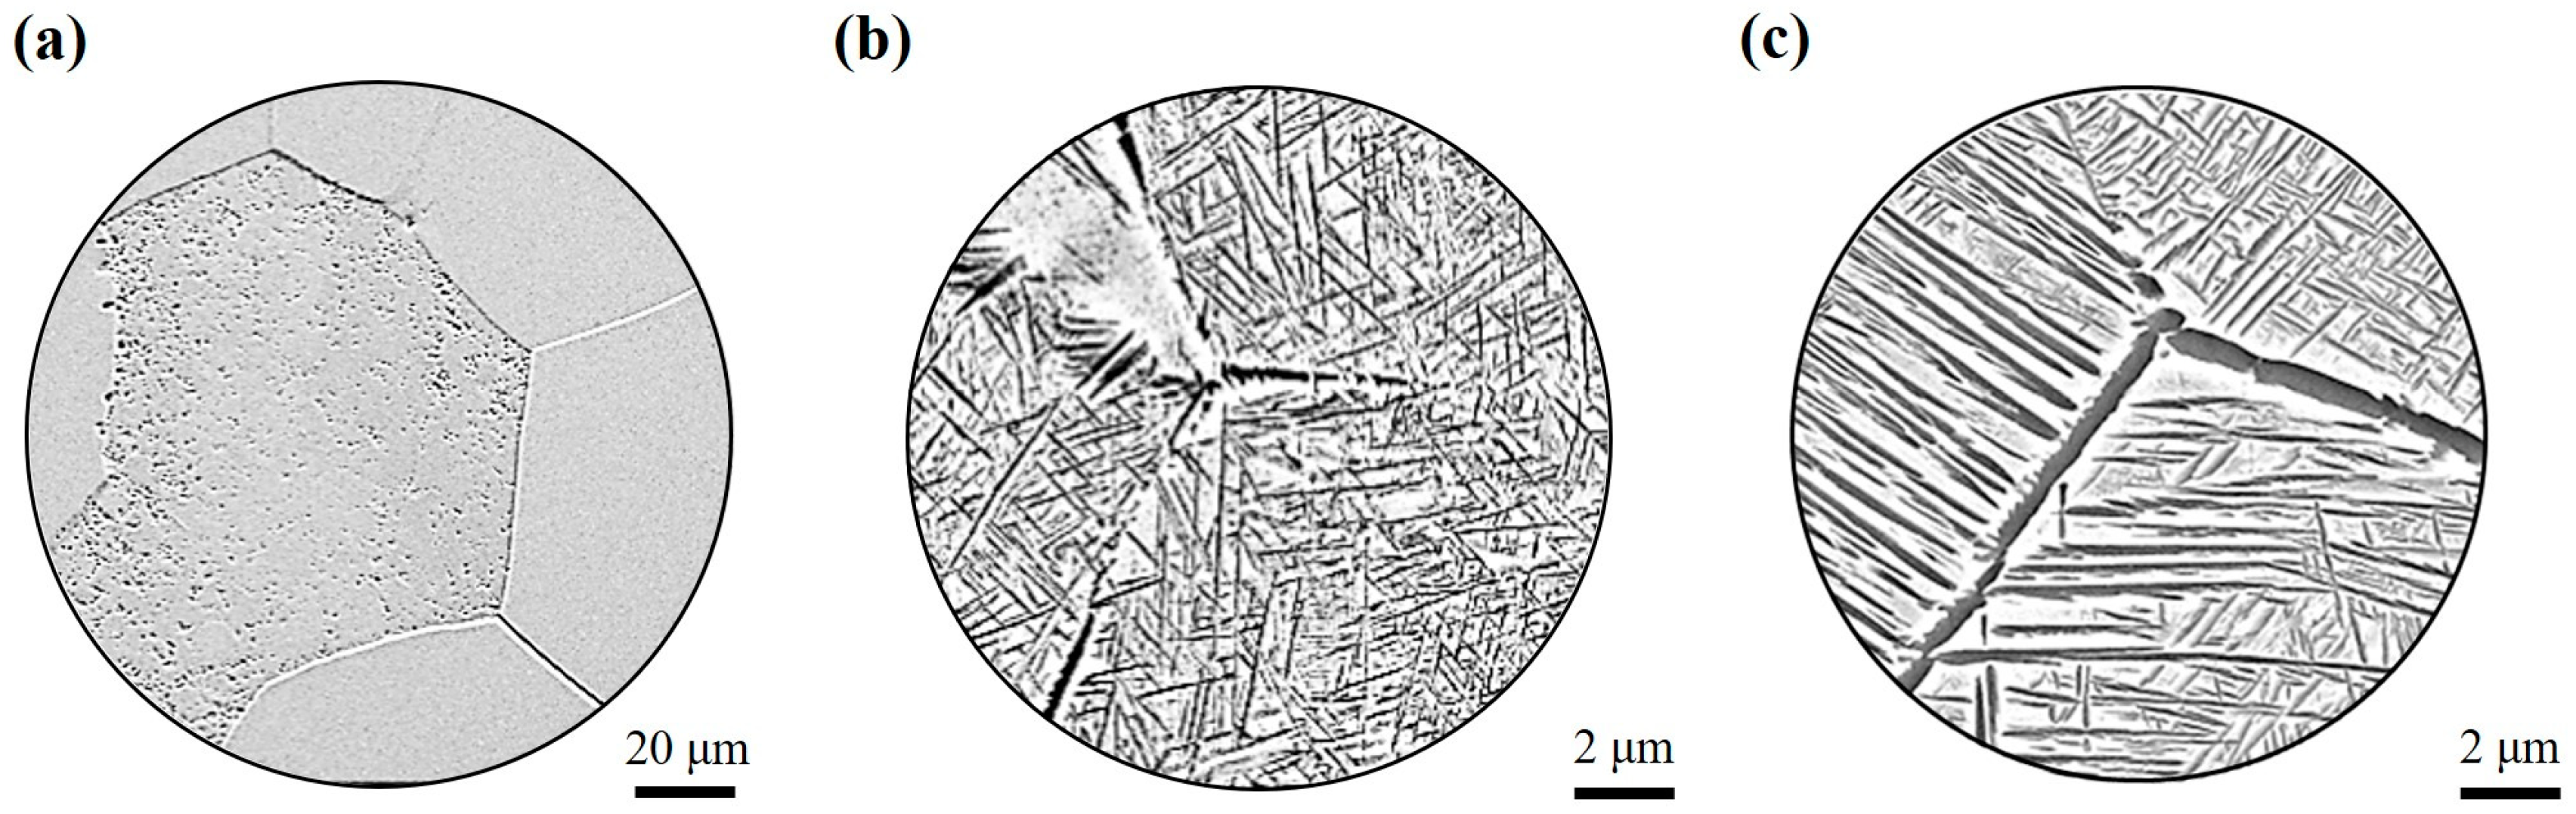
3.3. Microstructure Evolution
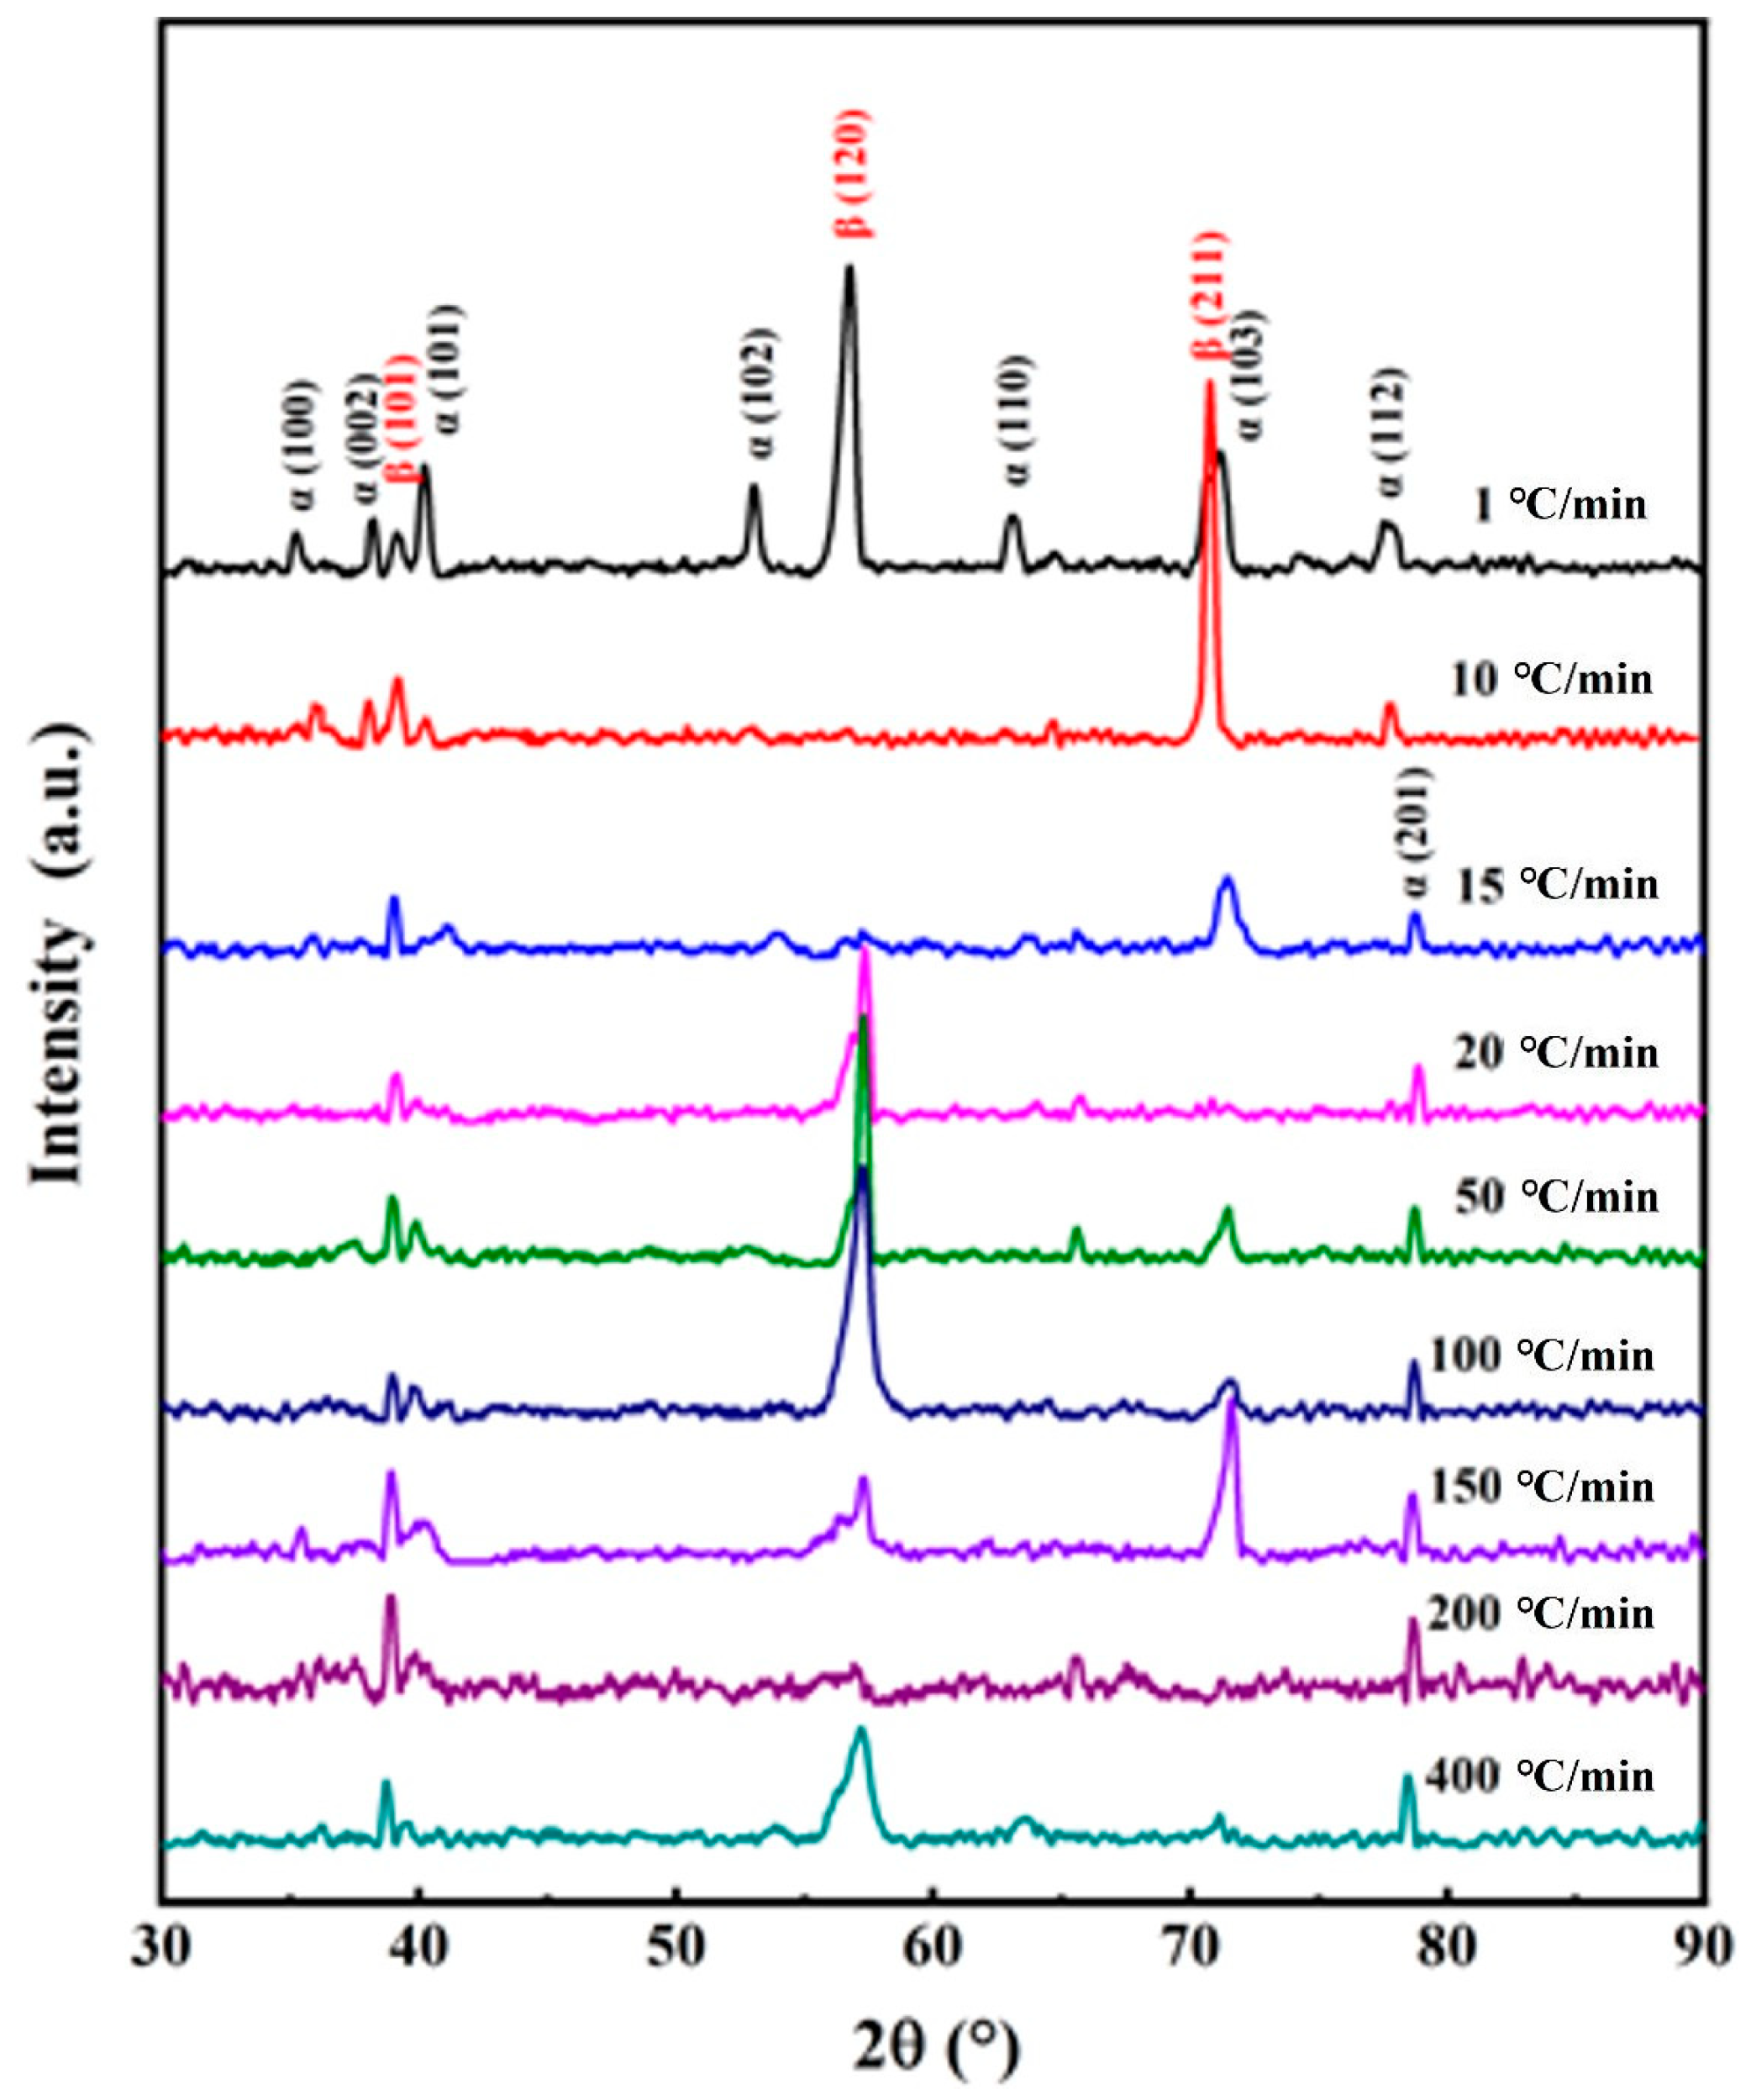
(1)
XRD diffraction pattern of TB17 titanium alloy at different cooling rates
Figure 4 illustrates the XRD diffraction pattern of TB17 titanium alloy under different cooling conditions. When the cooling rate is fast (50 °C/min–400 °C/min), the phase composition of TB17 titanium alloy is not much different, mainly composed of β phase and α phase. no β→ω phase transition or β→α″ phase transition occurs. When the cooling rate is reduced to 50 °C/min, the relative intensity of the diffraction peaks of the α phase becomes stronger and their positions increase, especially the diffraction peaks of the α (103) phase are obviously enhanced, and the diffraction peaks of α (100), α (002) and α (101) appear simultaneously. This shows that as the cooling rate decreases, the content of α phase precipitated from the β matrix during cooling increases.
At a medium cooling rate (15 °C/min–20 °C/min), the phase composition of TB17 titanium alloy is mainly composed of β phase and α phase, and no β→ω phase transition or β→α″ phase transition occurs. As the cooling rate decreases, the relative intensity of the β (101) phase diffraction peak gradually decreases, and the relative intensity of the α (103) phase diffraction peak gradually increases.
At a slow cooling rate (1 °C/min–10 °C/min), similarly to that of a high cooling rate, the phase composition of TB17 titanium alloy is mainly composed of β phase and α phase. As the cooling rate decreases, the relative intensity of the diffraction peak of the α (103) phase decreases, and the β (211) diffraction peak is differentiated, and strong β (120), α (102) and α (110) diffraction peaks appear. This shows that at a cooling rate of 1 °C/min, the α phase is fully precipitated in an approximately balanced phase transition.
(2)
Microstructure characteristics of TB17 titanium alloy at different cooling rates
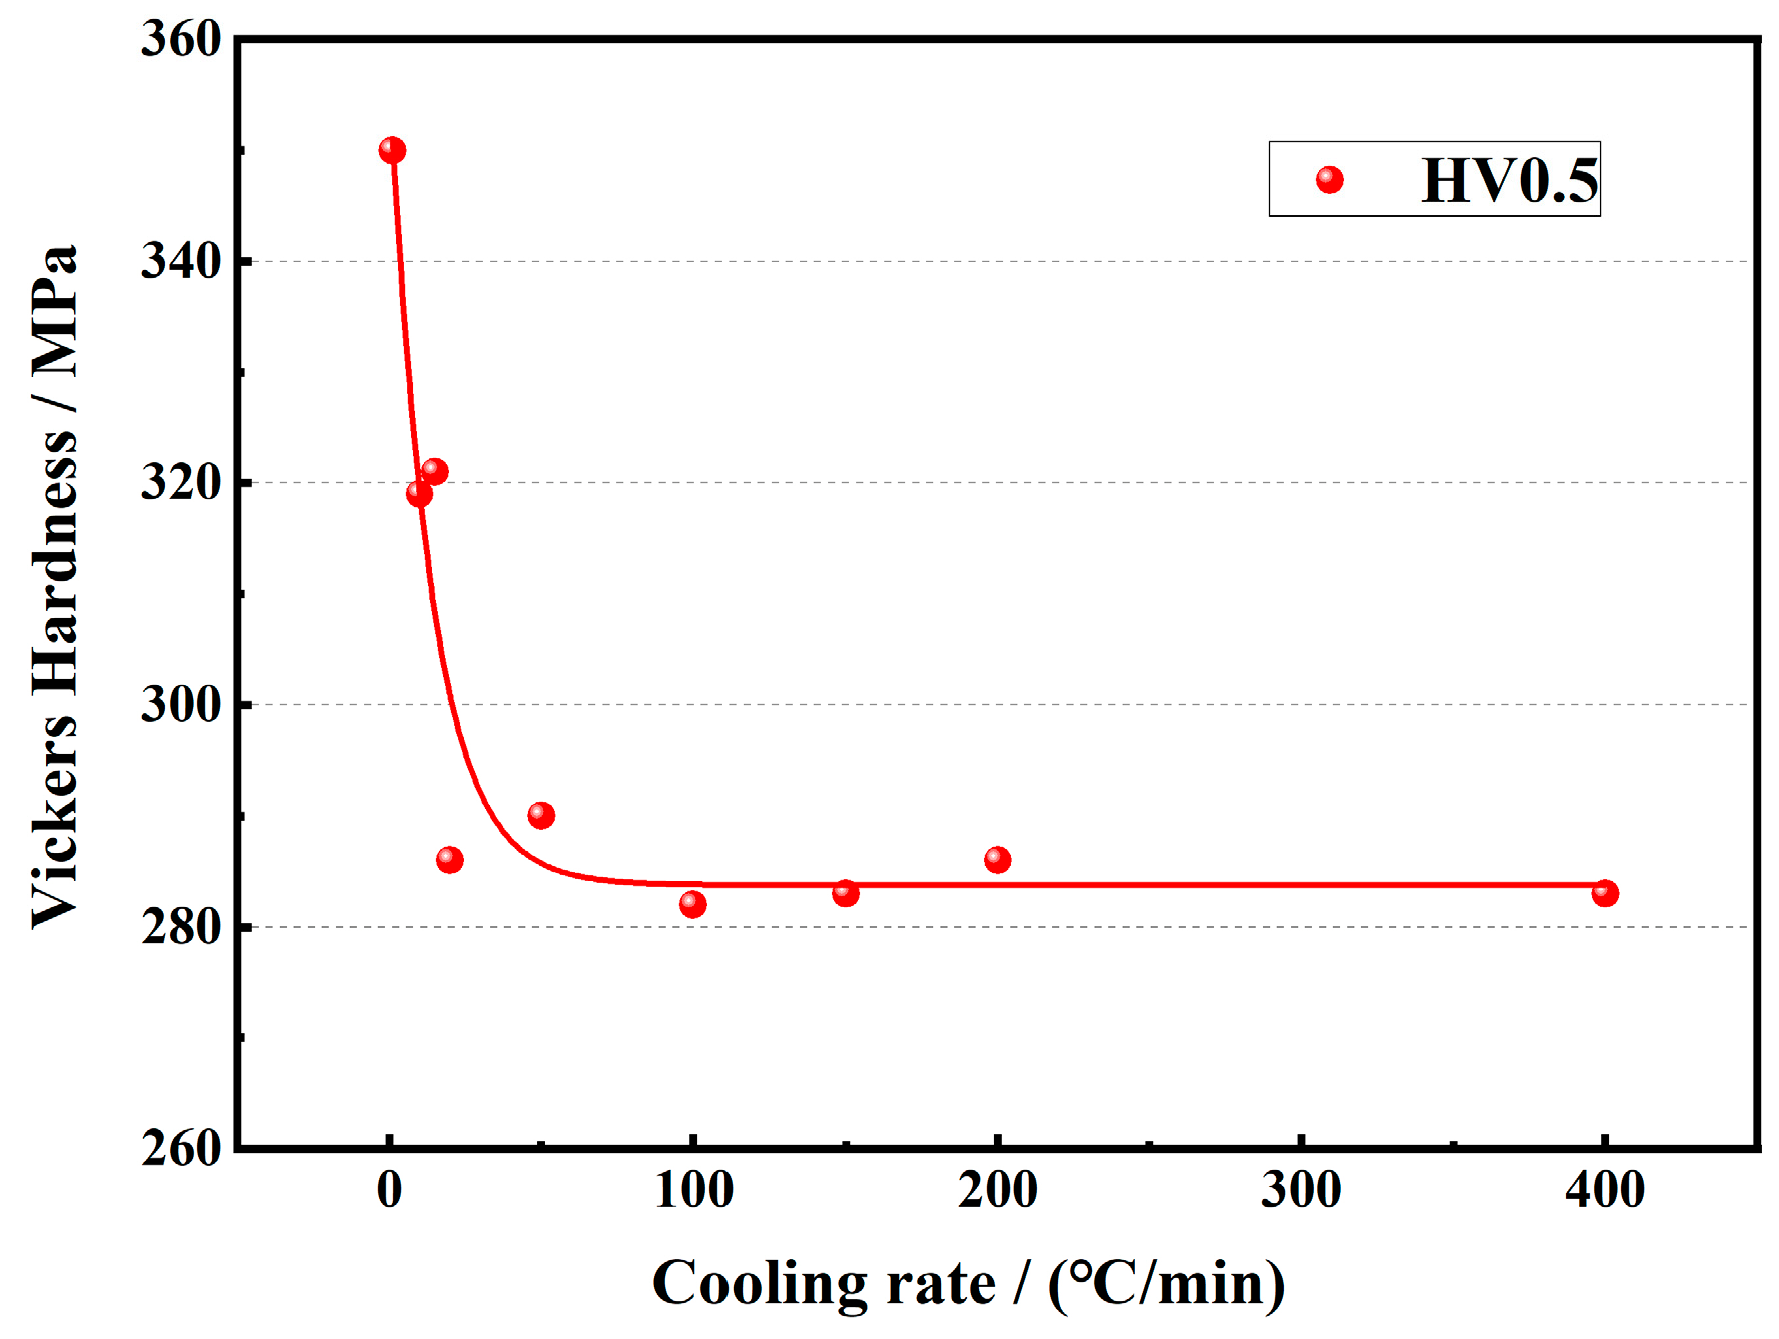
Figure 5 reveals the microstructures of TB17 titanium alloy under different cooling conditions. When the cooling rate is 400 °C/min, due to the rapid cooling rate, a complete β grain is formed, and the grain boundary, a very small amount of αWM is precipitated in the crystal, is obvious, as shown in Figure 5a. The size of αWM is fine and grainy (or short rod-shaped with a small height–diameter ratio). As the cooling rate decreases, the number of αWM precipitated from the β matrix gradually increases, the intragranular precipitation gradually changes to the simultaneous precipitation of intragranular and grain boundaries, and the size of its granular αWM gradually becomes larger. However, the precipitation of the αWM phase is not uniform, showing the phenomenon of selective precipitation in the local grain interior and grain boundary, which may be linked to the orientation difference between β grains. Figure 5b shows that when the cooling rate is reduced to 50 °C/min, bulk granular α-phases precipitate both within the grain and at the grain boundaries simultaneously. The number and size of the precipitated α-phases are significantly more than those of the faster cooling rate, which is in accordance with the XRD diffraction pattern (Figure 5).
The Burgers relation {0001}α∥{110}β is satisfied between α phase and β phase in titanium alloy, which means that there must be a semi-coherent relation and a non-coherent relation between α phase and β phase. Therefore, at the initial stage of nucleation, the α phase is granular or fine short rod-like structures. With the increase of precipitation time, the α phase migrates rapidly along the incoherent interface with the driving force of chemical potential energy difference and finally precipitates and grows into a lamellar or rod-like α phase. Due to the relatively fast cooling rate (50 °C/min–400 °C/min), the α phase has no time to grow into lamellar or rod-like, retaining the granular morphology of the α phase at the initial stage of nucleation.
At a cooling rate of 20 °C/min, αGB precipitates at some grain boundaries, as shown in Figure 5c. Its thickness is about 0.1 μm–0.2 μm. At the same time, αWGB and a small amount of αWM are precipitated at the grain boundary. At this point, under rapid cooling conditions, the α phase has transformed from granular to fine lamellar. Similar to αGB, the distribution of αWGB and αWM is not uniform, which does not cover the whole grain boundary structure and does not occupy the whole β grain.
At a cooling rate of 15 °C/min, the precipitated α phase increases significantly, and the area covered by αGB precipitation is more, as shown in Figure 5d. The αWGB precipitates and connects closely with each other along the grain boundary, and keeps the approximate length and direction to grow continuously into the β grains, forming a large cluster domain. The αWM in the crystal is densely distributed, but the precipitation orientation is dispersed, and the cross-distribution of each other is at the angle of 60°–90°. The thickness of the lamellar is about 15–30 nm. At this time, the precipitation of the α phase occupies almost the entire β grain, and the precipitation is sufficient.
In the condition of medium cooling rate (15 °C/min–20 °C/min), because of the reduced cooling rate, the α phase has a relatively sufficient time diffusion precipitation. When the temperature is reduced to below the phase transition point, the locally supersaturated metastable β phase is preferentially transformed under the action of rapid solute element diffusion, so the grain boundary and the vicinity of the grain boundary become the channel for rapid solute diffusion. The α/β interface migrates along the grain boundary under the control of solute diffusion, thus forming αGB and fine lamellar αWGB. As the cooling rate decreases, more αWGB precipitates along the grain boundary, the solute elements gradually diffuse into the crystal, and the fine lamellar αWM is gradually precipitated from the inside of the β crystal, which is cross-distributed with αWGB.
Figure 5e shows that when the cooling rate is 10 °C/min, The α phase is fully precipitated, not only forming a complete αGB but also αWGB and αWM are interlaced and distributed throughout the β grain, which is a typical Widmanstatten structure. Compared with the medium rate cooling condition, the α phase precipitated under the slow cooling condition is obviously wider, the lamellar thickness increases from 30–50 nm to 60–100 nm, and the grain boundary α phase is obvious, with a width of about 0.3 μm. Figure 5f shows that when the cooling rate is further reduced to 1 °C/min, due to the slow cooling rate, it can be clearly seen that large quantities of coarse lamellar α phases are precipitated on the β phase matrix, and the lamellar thickness is increased to 0.2 μm–0.5 μm. In the meantime, many fine α phases are precipitated around the coarse lamellar α phase, which are dotted or lamellar, distributed on the β matrix.
From the above analysis, it can be concluded that under the condition of slow cooling (1 °C/min–10 °C/min), the atomic diffusion is more sufficient, the migration of α/β interface during cooling is completely dominated by the diffusion of solute elements, and the α phase presents the process of precipitation → nucleation → growth. According to the Gibbs-Thomson effect, there is a concentration gradient in the β phase for α phase particles with different sizes, as shown by the fact that the smaller the particle, the higher the concentration of α stable elements around it. Therefore, the α-stable elements of the small-sized α phase continuously diffuse to the periphery of the large-sized α phase, which eventually leads to the gradual dissolution of the small-sized α phase and the continuous growth of the large-sized α phase. Therefore, as the cooling rate decreases, the α phase continues to grow, the α phase spacing gradually increases, and the macroscopic performance is the coarsening of the α phase.
In addition, α′, α″, and ω peaks are not observed in the XRD patterns of the TB17 titanium alloy regardless of the variation of the cooling rate. This suggests that there is only β→α diffusion transition as the phase transformation process during the continuous cooling process. In the α+β titanium alloy, with the increase in cooling rate, the content of α″ phase precipitated in the alloy increases and gradually transforms into orthorhombic martensite α″, such as TC21 [26]. Additionally, both α″ and ω phases can concurrently precipitate in Ti-1023 [27]. Generally speaking, the concentration of β stabilizing elements in the alloys determines their different precipitation mechanisms during cooling.
For rapid cooling (50 °C/min–400 °C/min), a complete β grain is formed, and the grain boundary, a small amount of αWM precipitated in the crystal, is obvious. At the medium cooling rate (15 °C/min–20 °C/min), αGB is precipitated at some grain boundaries, along with a small amount of fine lamellar αWM, which are also precipitated at the grain boundaries. For slow cooling (1 °C/min–10 °C/min), the α phase is fully precipitated, and coarse lamellar αWGB and αWM are interlaced and distributed throughout the β grain. Finally, Figure 6 illustrates the precipitation processes of αGB, αWGB, and αWM at rapid, medium, and slow cooling rates, respectively.
Measurements and summaries of α phase widths are shown in Figure 7. The microstructure of TB17 titanium alloy varies greatly under different cooling rates. Combined with the SEM images of TB17 titanium alloy with different cooling conditions (Figure 5), it can clearly be seen that this difference is mainly reflected in the thickness of the secondary α phase and the morphology of the secondary α phase.
When the cooling rate is in the rapid cooling condition (150 °C/min–400 °C/min), a very small amount of granular αWM is precipitated in the crystal. As the cooling rate decreases, the αWM precipitated in the crystal gradually increases, but the grain size does not change much, and its size is mainly concentrated between 20–40 nm. When the cooling rate is reduced to 50 °C/min–100 °C/min, the secondary α phase is precipitated in the crystal and the grain boundary simultaneously, showing the phenomenon of selective precipitation in the local grain and the grain boundary.
When the cooling rate is moderate (15 °C/min–20 °C/min), the secondary α phase precipitated in the alloy changes from granular to fine needle-like, and simultaneously αGB, αWGB, and αWM. The thickness of the secondary α phase is not much different. The thickness of αGB is about 0.1 μm–0.2 μm, and the thickness of αWGB and αWM is about 15–30 nm. When the cooling rate is at a slow cooling condition (10 °C/min and 1 °C/min), the αGB, αWGB, and αWM grow rapidly, especially the αGB, which proliferates from 0.356 μm at 10 °C/min to 0.806 μm. This demonstrates that the cooling rate significantly impacts the thickness of αGB, αWGB, and αWM.

3.4. Microhardness

The effect of the cooling rate on the microhardness of TB17 titanium alloy is shown in Figure 8. With the increase in cooling rate, the microhardness decreases rapidly. When the cooling rate is higher than 20 °C/min, the microhardness gradually becomes flat. This is because the TB17 titanium alloy has more alloying elements, and the faster cooling rate will inhibit the precipitation of the α phase, and the strengthening effect of the α phase cannot be obtained. Similar research results also appeared in the study of Zheng et al. [28]. The difference is that under slow cooling conditions, the α phase obtained in their study was finer and the microhardness improvement was more significant. In conjunction with the microstructure characteristics of Figure 5, the following conclusions can be drawn: When the cooling rate is a rapid cooling condition (50 °C/min–400 °C/min), the precipitated α phase is mainly granular, and its strengthening effect is limited; When the cooling rate is a medium cooling condition (15 °C/min–20 °C/min), the precipitated α phase is mainly fine lamellar, and the strengthening effect is obvious. Although the fine lamellar α sheet can rapidly increase the phase interface area and increase hardness, the increase in microhardness is not significant due to insufficient precipitation. When the cooling rate is a slow cooling condition (10 °C/min–1 °C/min), the precipitated α phase is mainly coarse lamellar, and the α phase is fully precipitated. The increase of α/β phase interface leads to an increase in the resistance of dislocation movement, and the microhardness is significantly improved.

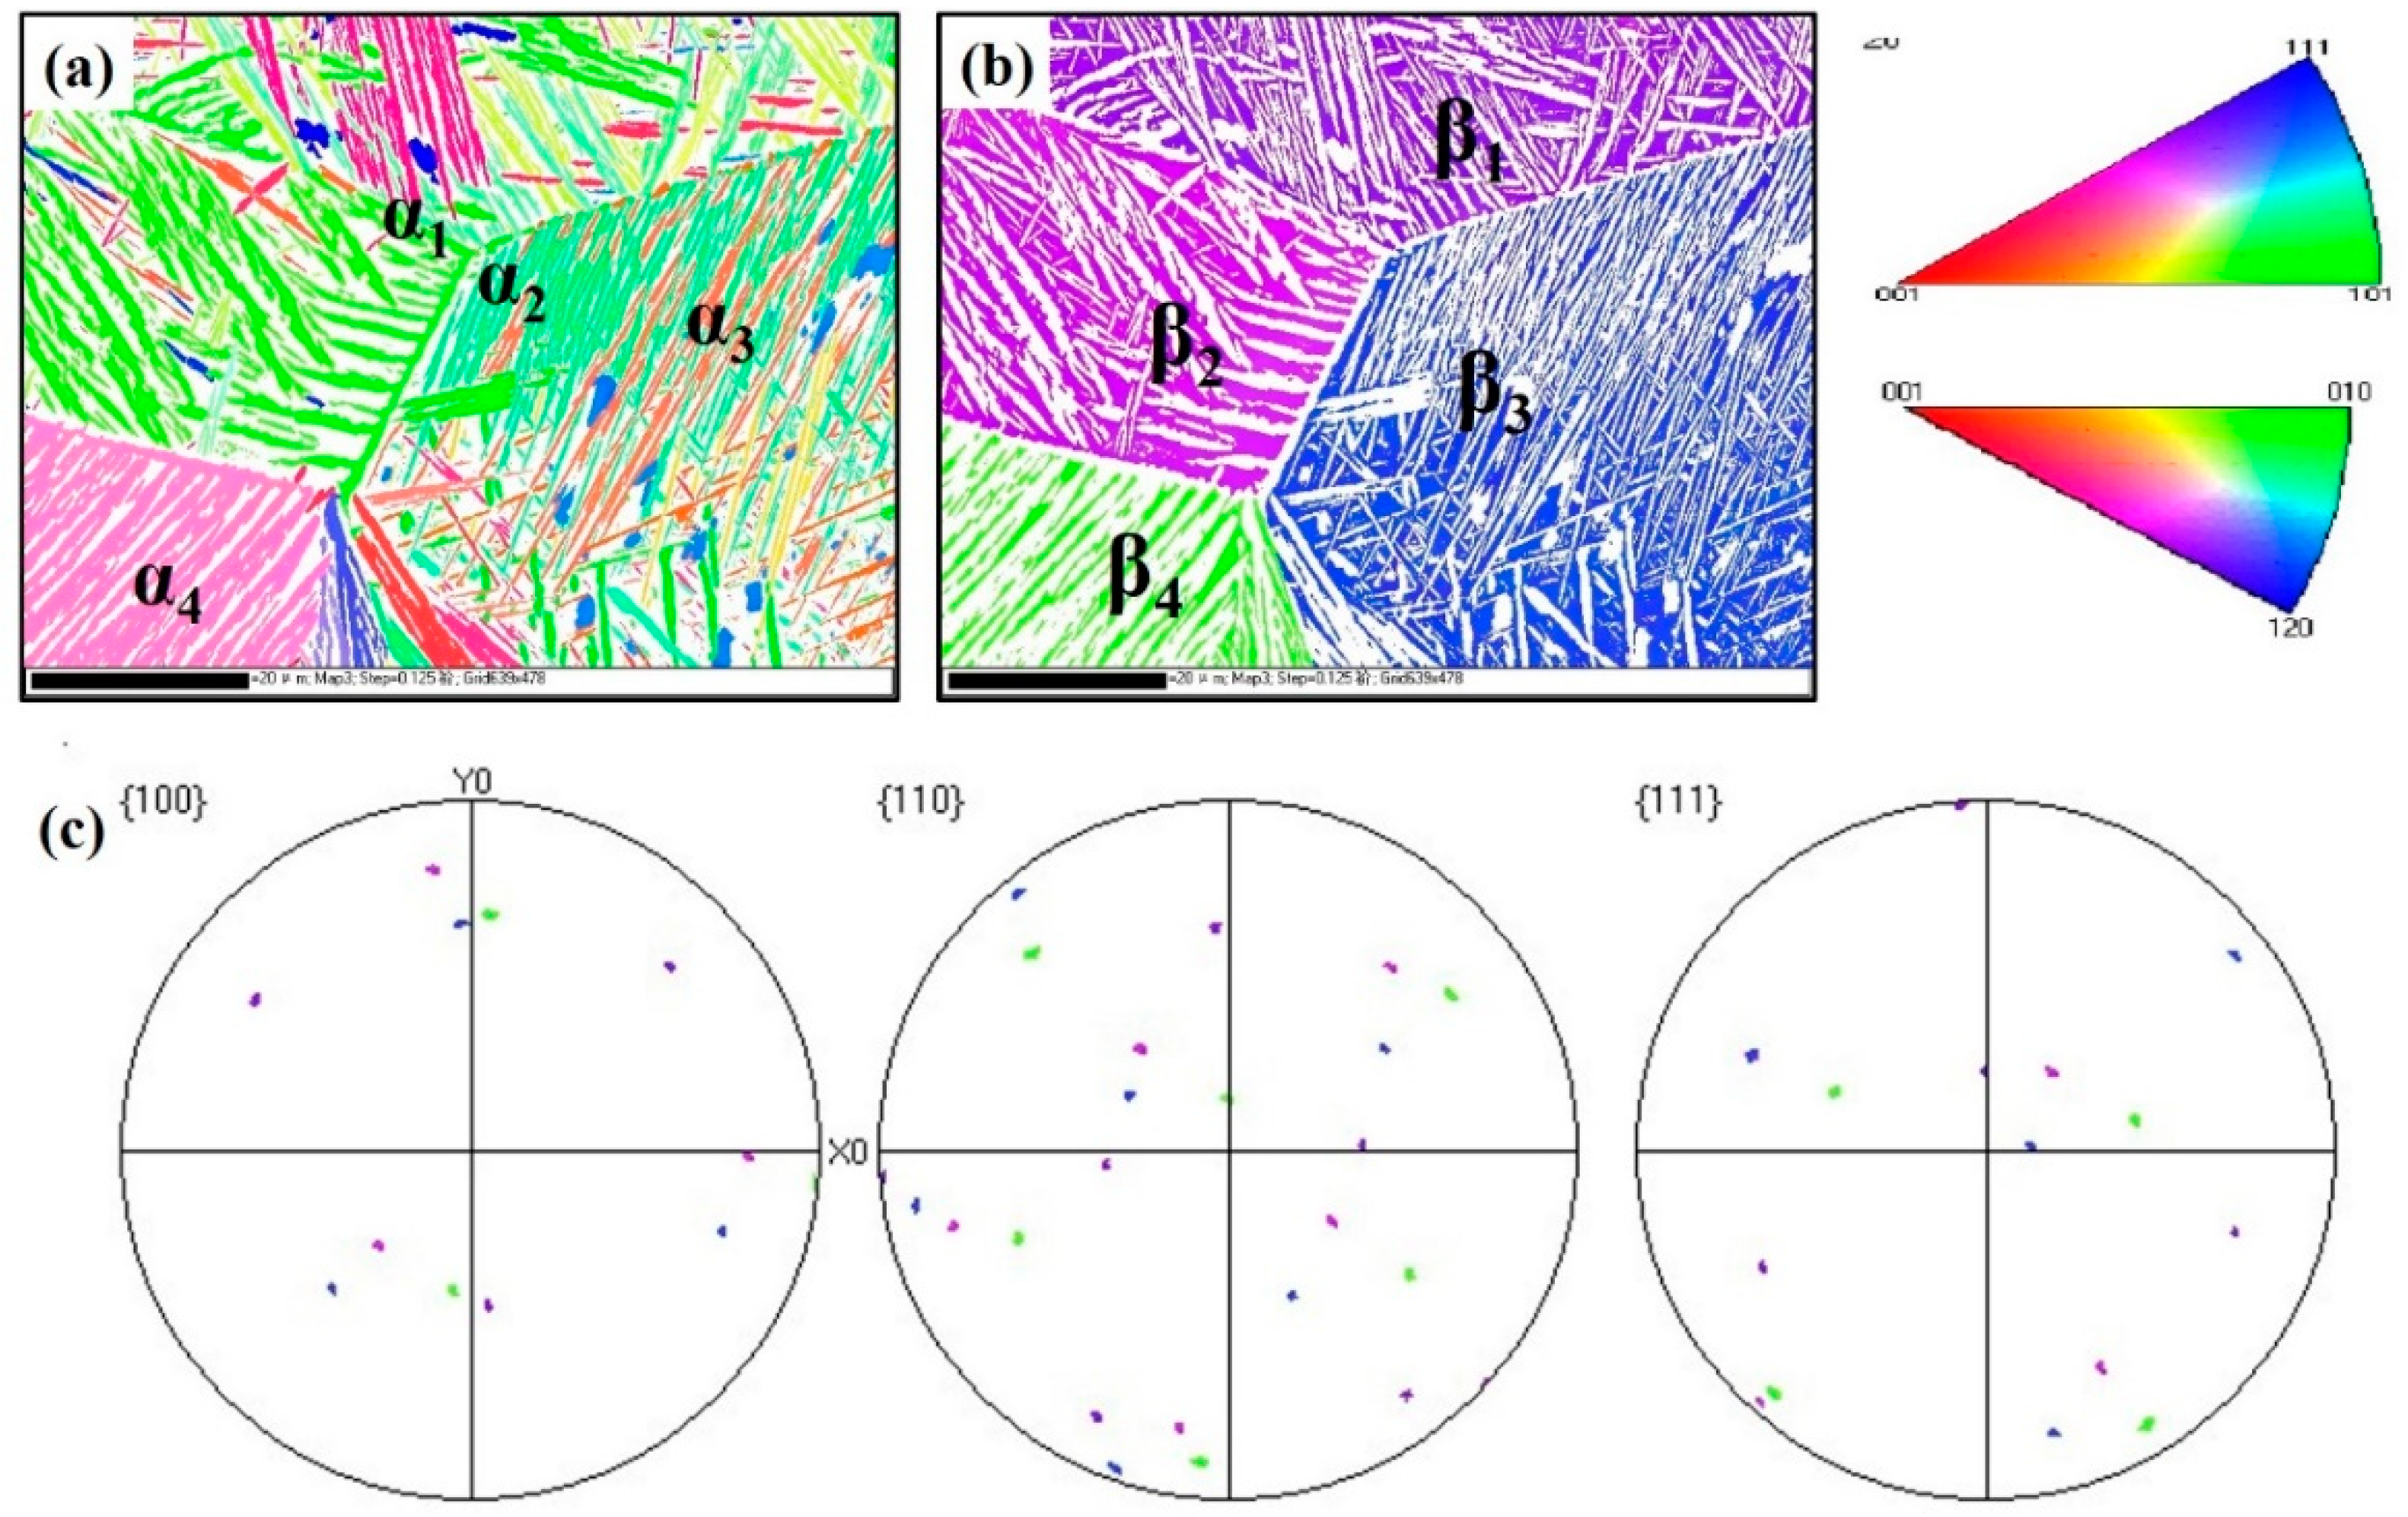
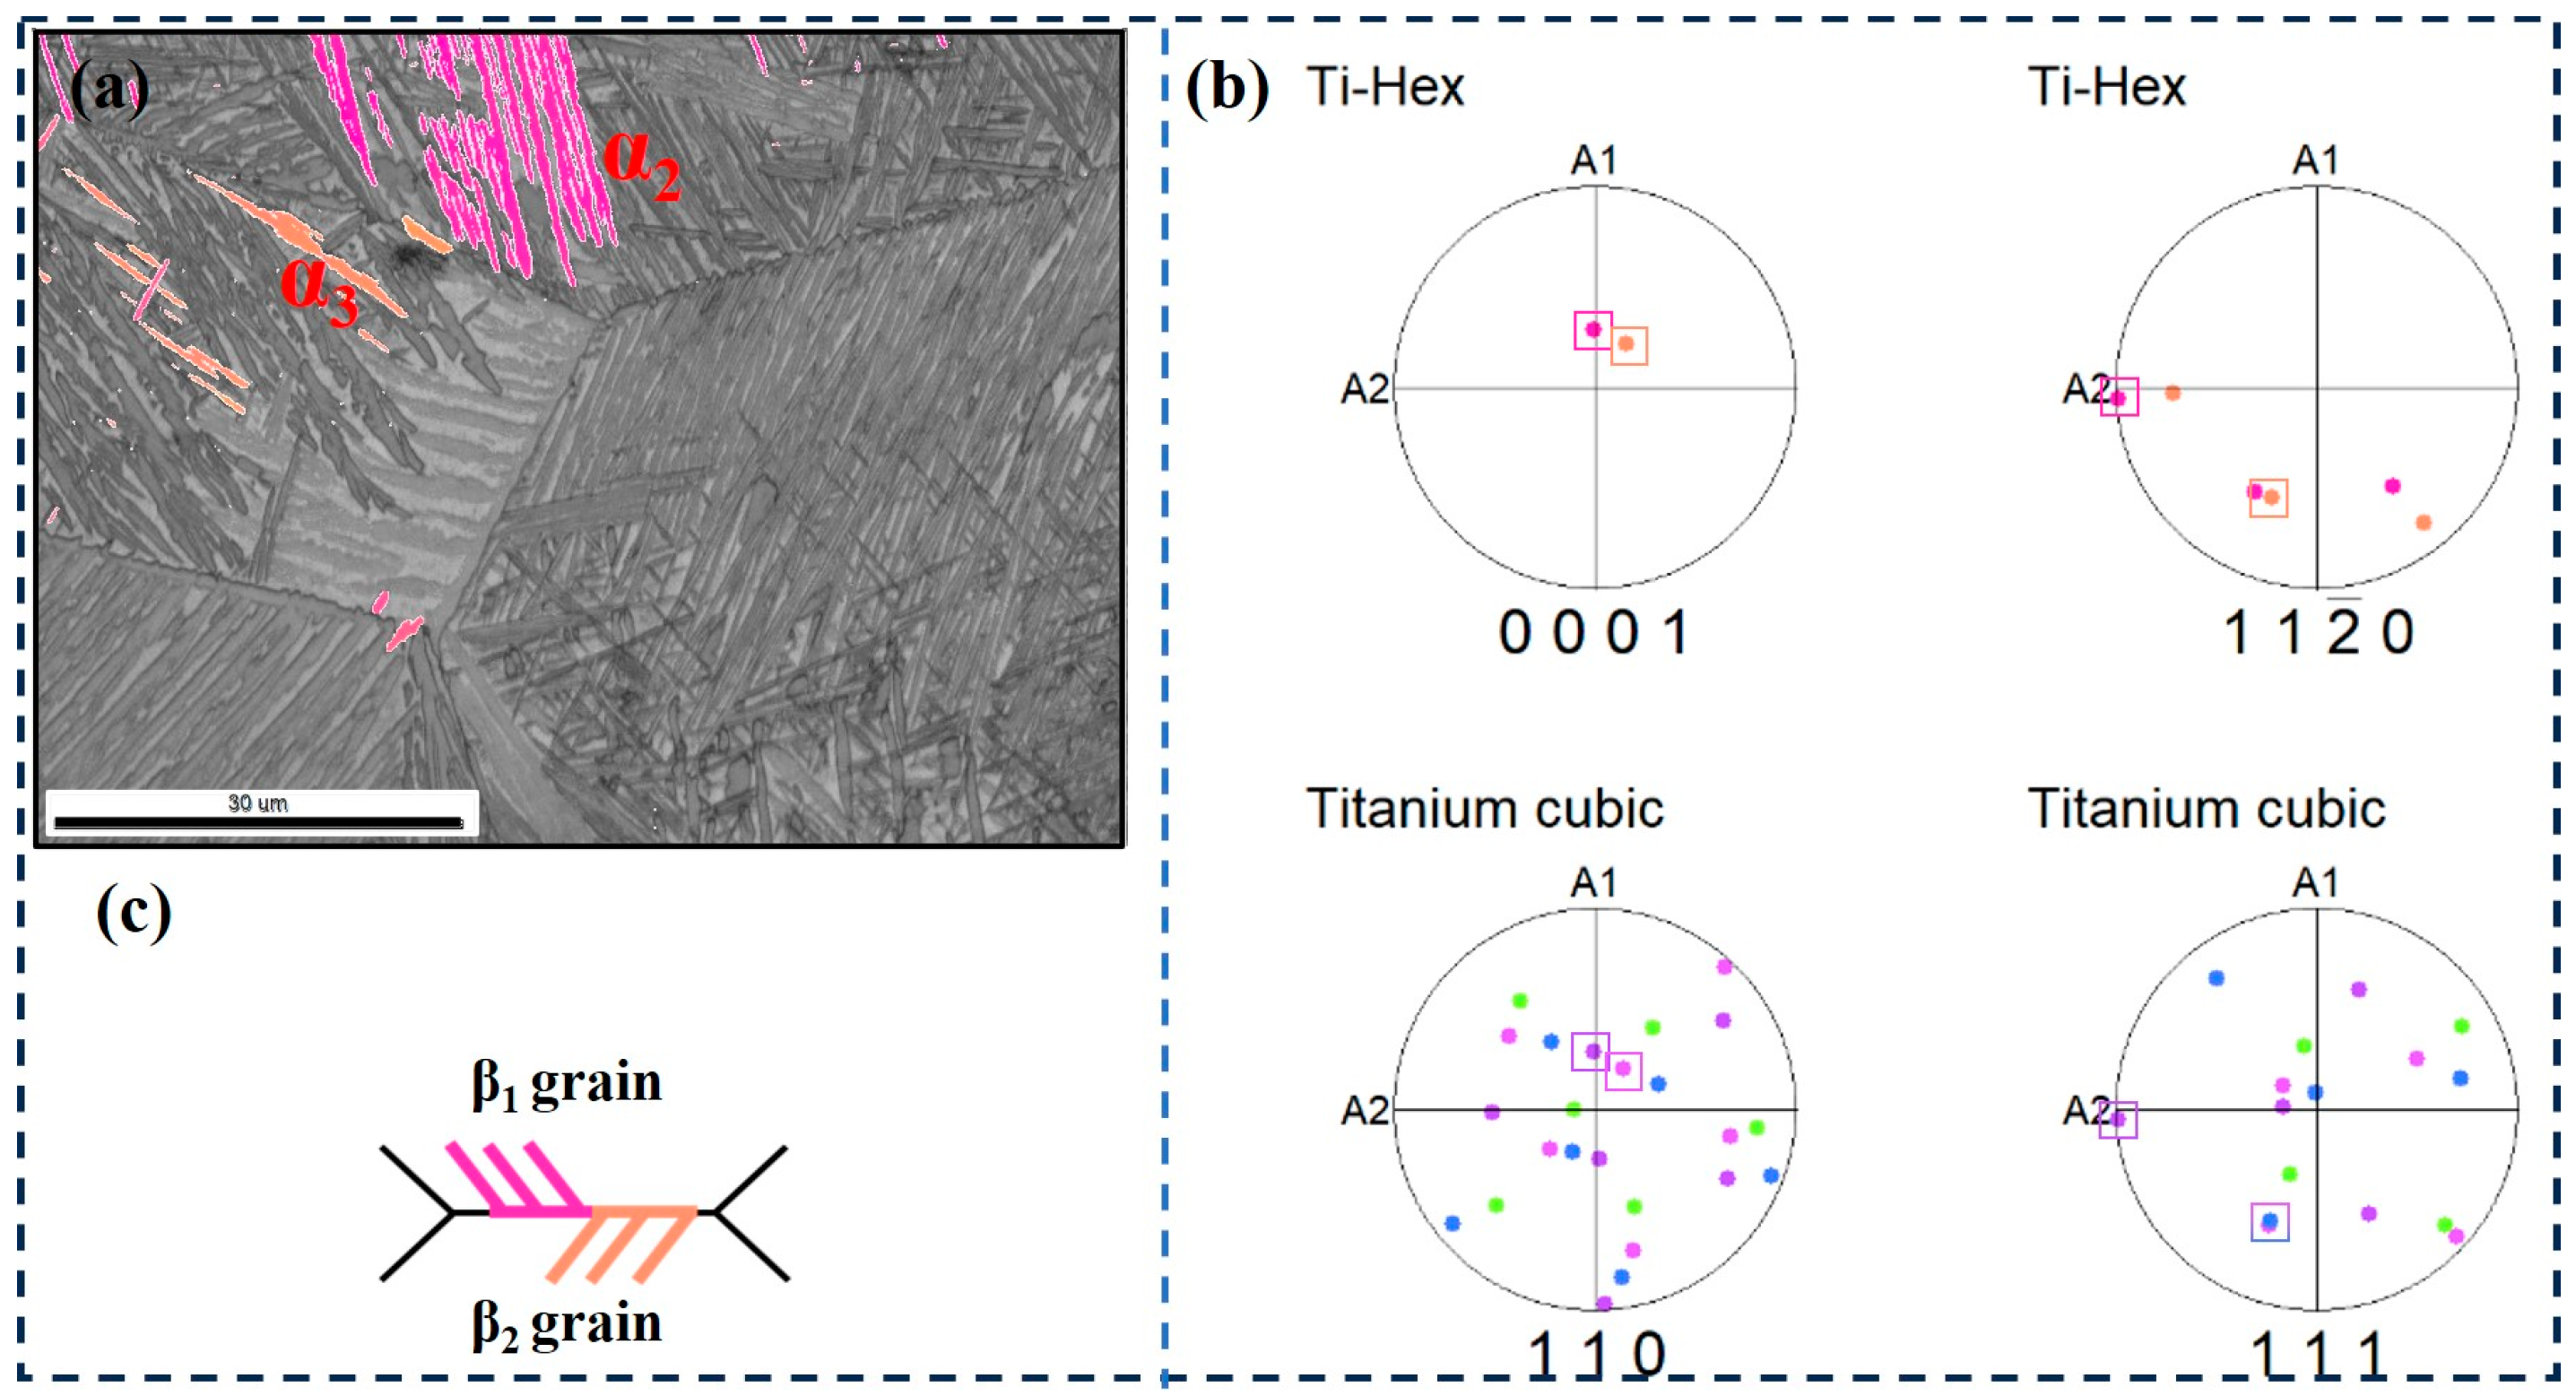
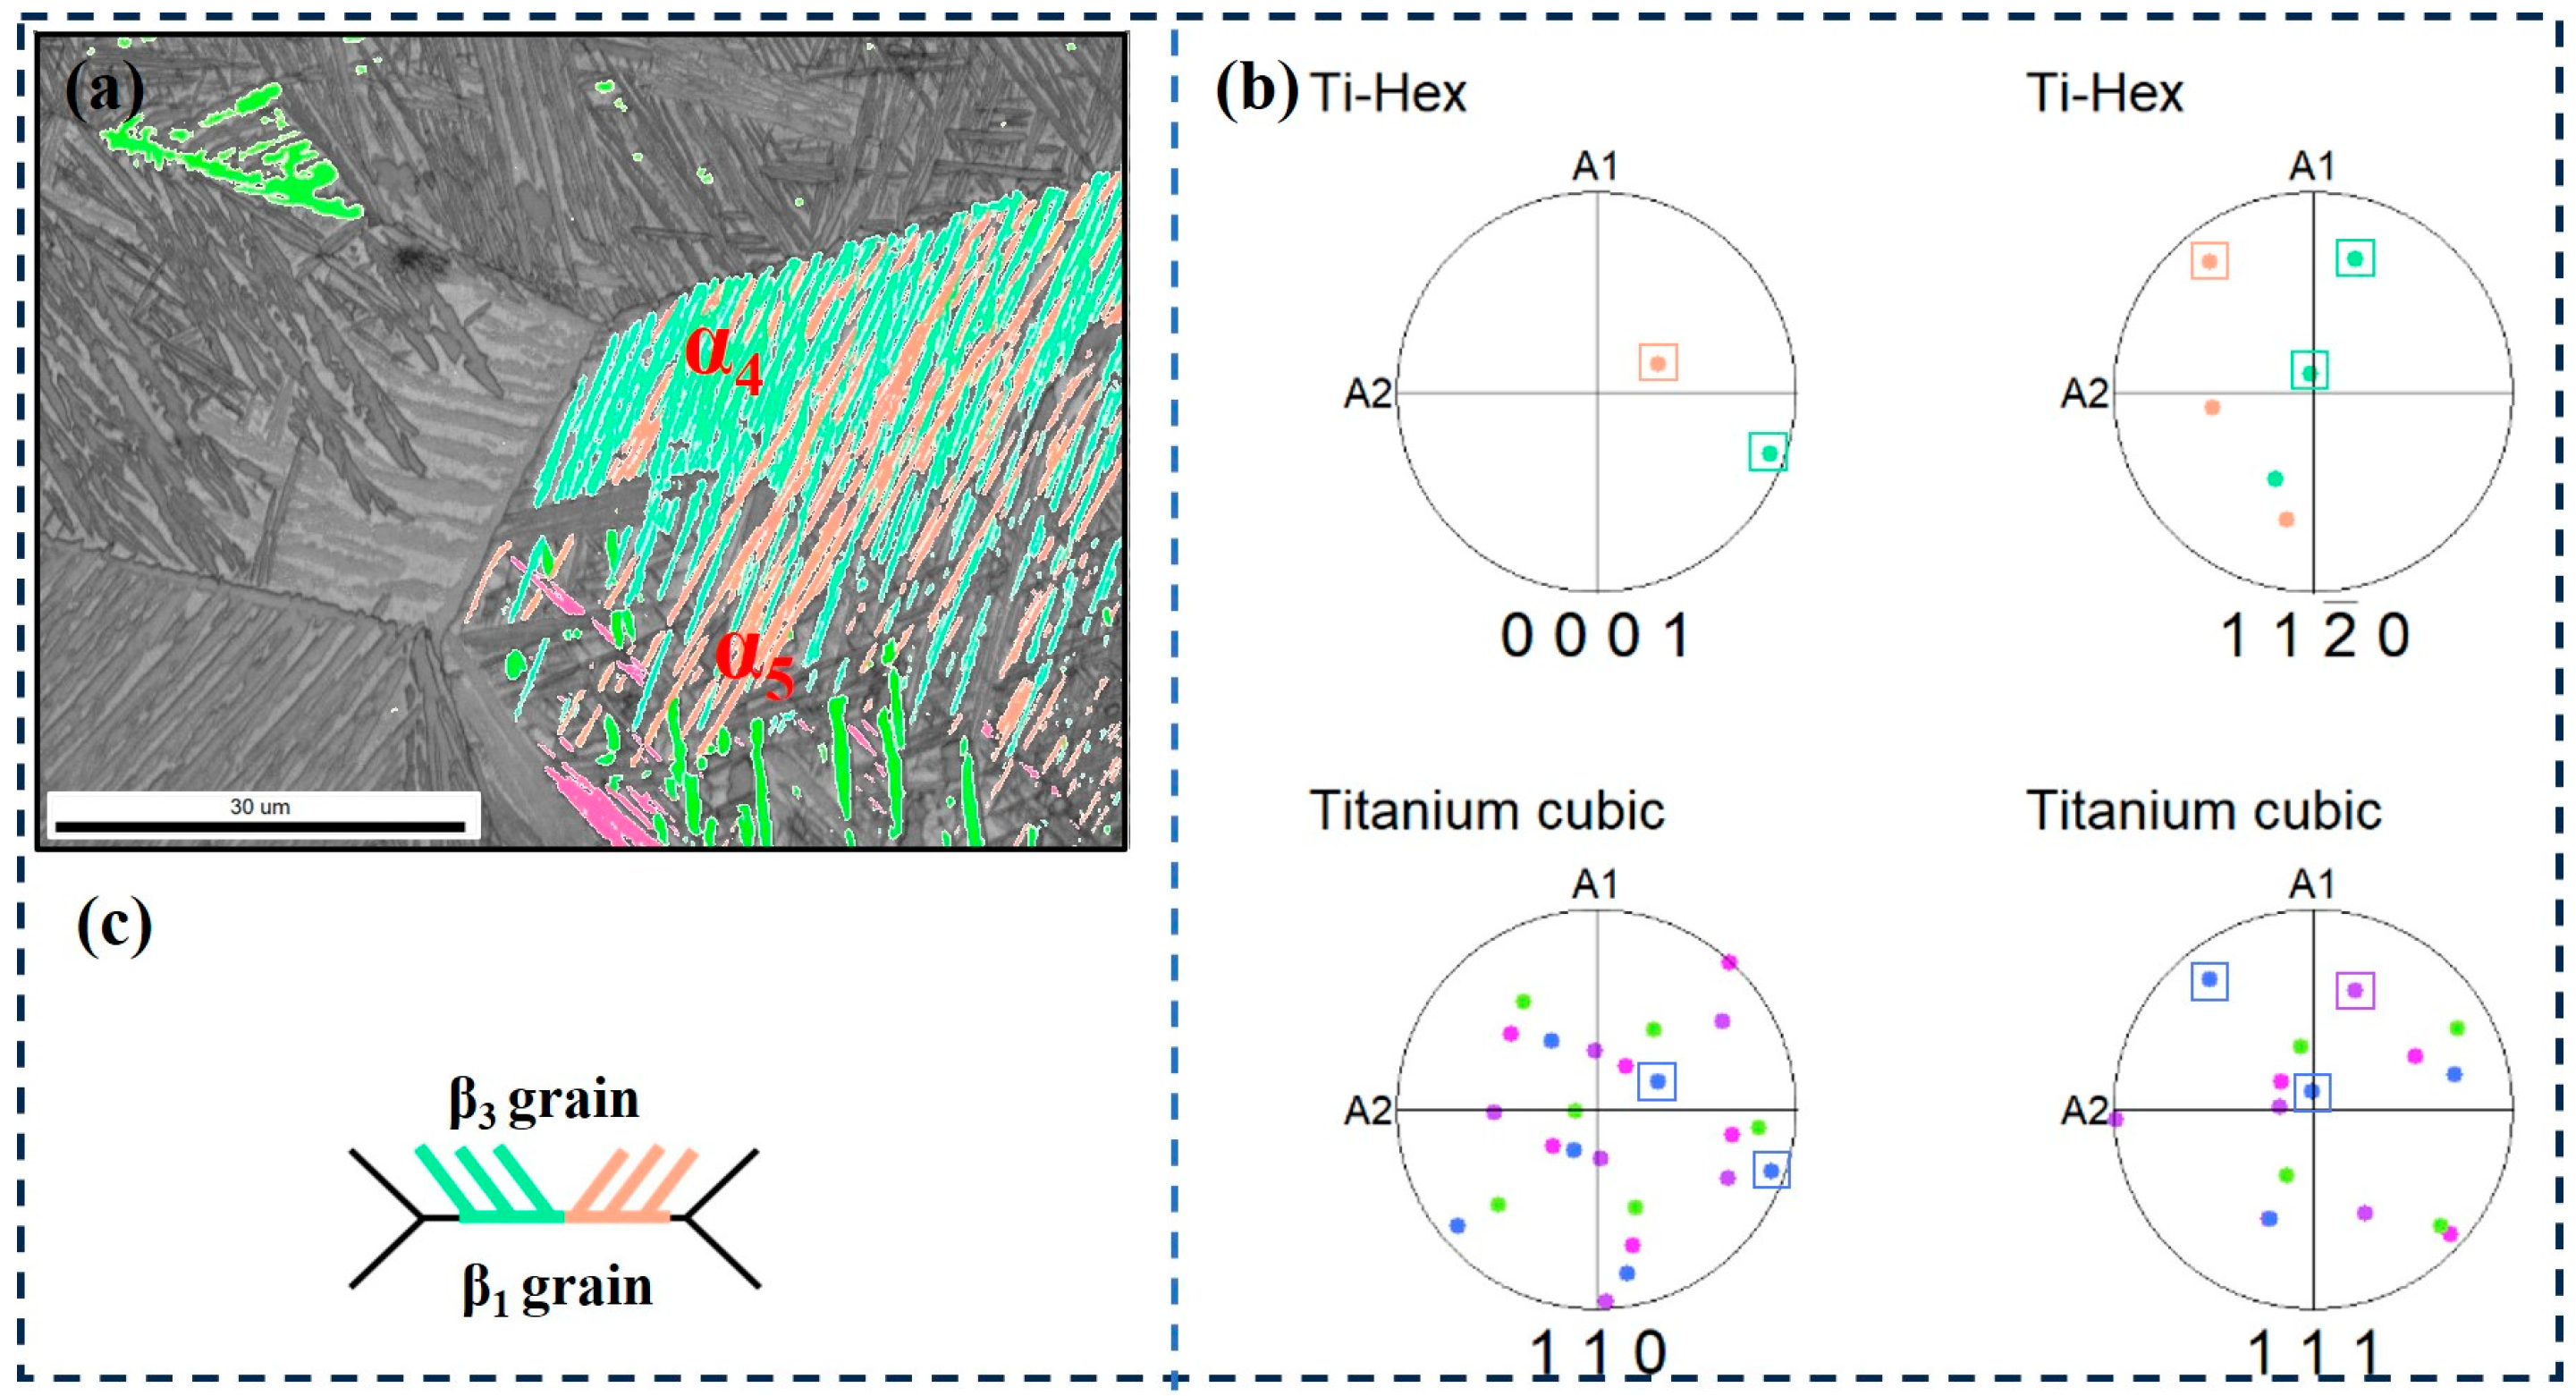
3.5. Selection of α Variants

The microstructure of TB17 titanium alloy is a fully precipitated lamellar structure or basketweave structure, and the precipitated α phase has the phenomenon of variant selection behavior, that is, only several of the twelve α phase variants will be precipitated in the microstructure, and the precipitation of other-oriented α phases will be inhibited and will not be precipitated from the β matrix. In this paper, the complete cooling rate (1 °C/min) of α phase precipitation is used to study the selection of α phase precipitation variants.
The EBSD observation of the microstructure under the cooling rate at 1 °C/min is shown in Figure 9. Figure 9a,b are the IPF orientation distribution maps of α phase and β phase, respectively. Their different colors mean different crystallographic orientations concerning the sample coordinate system.
There are four β grains in the figure, and their positions on the pole figure are shown in Figure 9c. The micro-texture has formed with αWGB precipitation at β/β grain boundary and there is no specific orientation relationship between adjacent β grains.
The selection of α variants near the original β grain boundary is mainly divided into three categories. The first type is that the α-clusters on both sides of the grain boundary have the same orientation, as shown in Figure 10. It can be seen that β2 and β3 have different orientations, but the α1 cluster on both sides of the β2 and β3 grain boundaries is consistent with the orientation of the grain boundary α (Figure 11c). Accordingly, Figure 10b shows the pole figure of α1 and β2, β3 grains on both sides of the grain boundary. The results show that α1, β2 and β3 grains satisfy the Burgers relationship, namely, {110}β2//{0001}α1, <111>β2//<11-20>α1 and {110}β3//{0001}α1, <111>β3//<11-20>α1. This indicates that the two clusters that maintain the Burgers relationship on either side of the adjacent β grains grow in different orientations but have the same crystallographic direction.
The second type is that the α-clusters on both sides of the grain boundary have different orientations, as shown in Figure 11. It can be seen that α2 grows from the β1 and β2 grain boundaries to the β1 crystal, and α3 grows from the β1 and β2 grain boundaries to the β2 crystal (Figure 11c), their c-axis angle is about 60°. Figure 11b is the pole figure of α2, α3 and β1, β2 grains. The {0001} pole figure and {11–20} pole figures of α2 correspond to the {110} pole figure and {111} pole figure of β1 grains, respectively, i.e., β1 is the Burgers grain of the cluster α2. In addition, the {0001} and {11–20} pole figures of α3 correspond to the {110} and {111} pole figures of β2 grains, respectively, i.e., β2 is the Burgers grains of cluster α3. This indicates that the two bundles that maintain BOR on both sides of the adjacent β grains have different growth directions and different crystallographic directions.
The third type is that the α clusters precipitated only in the β grains on one side of the grain boundary have different orientations, as shown in Figure 12. It can be seen that both α4 and α5 clusters grow along the grain boundaries of β1 and β3 to the interior of β3 grains; the growth directions are the same, but they have different orientations (Figure 12c). Figure 12b is the pole figure of α4, α5, β1, and β3 grains and shows that α4 and α5 only have a Burgers relationship with β3. That is to say, for clusters α4 and α5, β3 is a Burgers grain, and β1 is a non-Burges grain. This indicates that the α-bundles that maintain the Burgers relationship with only one side of the adjacent β grains may have the same growth direction, but different crystallographic directions, and these two directions correlate to two variants of the given {0001}α//{110}β.
To sum up, the cooling rate has a significant impact on the microstructure evolution and mechanical properties of the TB17 alloy. The change in cooling rate causes variations in the size and morphology of αGB, αWGB, and αWM phases that are in a competitive state with each other. The increase in cooling rate leads to a decrease in the content of the α phase, which is the reason for the decrease in alloy strength. In addition, with changes in cooling rate, three different types of α variant selection near the original β grain boundary appeared in the alloy.

4. Conclusions

In this study, the microstructure evolution, microhardness, and crystallographic characteristics of typical α precipitates in the new metastable β titanium alloy TB17 under continuous cooling conditions at different rates have been thoroughly investigated. The conclusions are as follows:
(1)
The continuous cooling transformation (CCT) diagram reveals when the cooling rate is less than or equal to 400 °C/min, only α phase precipitation occurs, without β→ω phase transition or β→α″ non-equilibrium phase transition.
(2)
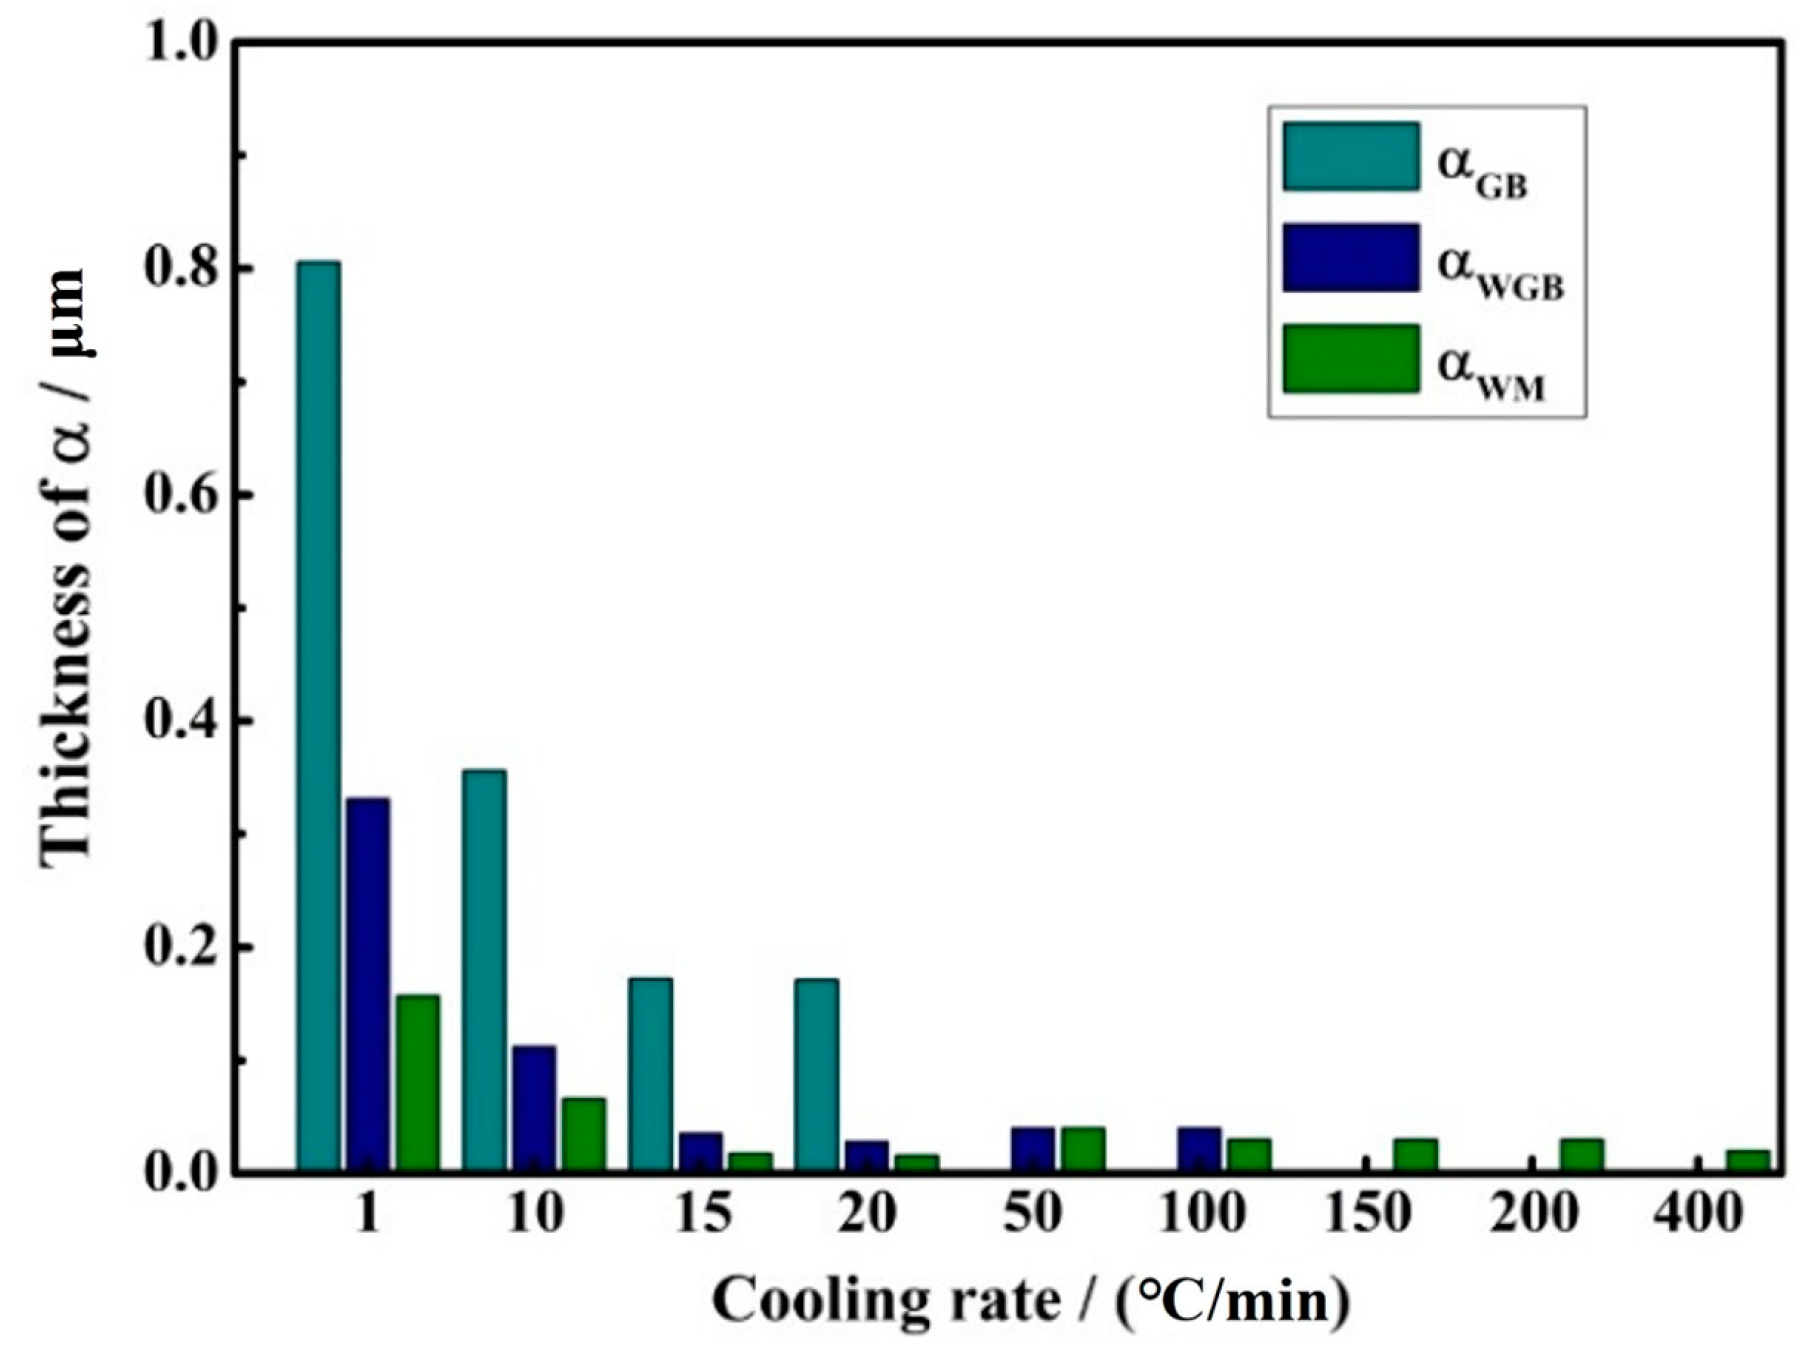
Not uniform of αWM precipitated phase, a small amount of fine lamellar αWGB precipitated phase formed under the low, intermediate, and high cooling rates, respectively. This is caused by the competitive growth of αGB, αWGB, and αWM.
(3)
As the cooling rate increases, the formation of α phase precipitations is inhibited and the strengthening effect of α phase cannot be obtained, resulting in the microhardness decreasing rapidly. The precipitation of the coarse α phase during slow cooling results in a significant increase in microhardness.
(4)
The selection of α variants near the original β grain boundary is mainly divided into three categories. The first type is that the α-clusters on both sides of the grain boundary maintain the BOR with either side of the adjacent β grains but grow in different directions. The second type is that the α-clusters on both sides of the grain boundary maintain BOR with one side of the adjacent β grains and grow in different directions. The third type is that the α clusters that precipitated only on one side of the grain boundary maintain the BOR with only one side of the adjacent β grains. It may have the same growth direction, but different crystallographic directions, and these two directions correspond to two variants of the given {0001}α//{110}β.

Author Contributions

Methodology, X.W.; Validation, C.L.; Formal analysis, Z.Z.; Writing—original draft, G.S.; Writing—review and editing, J.G.; Supervision, X.G., X.Z., and K.Z. All authors have read and agreed to the published version of the manuscript.

Funding

This research was funded by the Equipment Pre-research Project (51312030507, 51312JQ01, 41422010501).

Institutional Review Board Statement

Not applicable.

Informed Consent Statement

Not applicable.

Data Availability Statement

All data generated or analyzed during this study are included in the present article.

Conflicts of Interest

We are currently employed by Beijing Institute of Aeronautical Materials and Hunan Goldsky Titanium Industry Technology Co., Ltd. while contributing to this manuscript. Our contributions to this work and manuscript were made independently without any requirement, guidance or input by my employer. We received no financial compensation from any source for the contributions we made to this scientific work and manuscript.

References

  1. Kolli, R.P.; Devaraj, A. A Review of Metastable Beta Titanium Alloys. Metals 2018, 8, 506. [Google Scholar] [CrossRef]
  2. Ren, L.; Xiao, W.; Kent, D.; Wan, M.; Ma, C.; Zhou, L. Simultaneously enhanced strength and ductility in a metastable β-Ti alloy by stress-induced hierarchical twin structure. Scr. Mater. 2020, 184, 6–11. [Google Scholar] [CrossRef]
  3. Pesode, P.; Barve, S. A review—Metastable β titanium alloy for biomedical applications. J. Eng. Appl. Sci. 2023, 70, 25. [Google Scholar] [CrossRef]
  4. Gao, J.; Knowles, A.J.; Guan, D.; Rainforth, W.M. ω phase strengthened 1.2GPa metastable β titanium alloy with high ductility. Scr. Mater. 2019, 162, 77–81. [Google Scholar] [CrossRef]
  5. Qiu, C.; Liu, Q.; Ding, R. Significant enhancement in yield strength for a metastable beta titanium alloy by selective laser melting. Mater. Sci. Eng. A 2021, 816, 141291. [Google Scholar] [CrossRef]
  6. Ferrero, J. Candidate materials for high-strength fastener applications in both the aerospace and automotive industries. J. Mater. Eng. Perform. 2005, 14, 691–696. [Google Scholar] [CrossRef]
  7. Cotton, J.D.; Briggs, R.D.; Boyer, R.R.; Tamirisakandala, S.; Russo, P.; Shchetnikov, N.; Fanning, J.C. State of the Art in beta titanium alloys for Airframe applications. J. Occup. Med. 2015, 67, 1281–1303. [Google Scholar] [CrossRef]
  8. Ghosh, A.; Sivaprasad, S.; Bhattacharjee, A.; Kar, S.K. Microstructure-fracture toughness correlation in an aircraft structural component alloy Ti-5Al-5V-5Mo-3Cr. Mater. Sci. Eng. A 2013, 568, 61–67. [Google Scholar] [CrossRef]
  9. Zhang, H.; Zhang, X.; Zhu, Z.; Li, C.; Zhou, K. Characterization of a new type grain boundary phase in near-β titanium alloys. Scr. Mater. 2020, 177, 118–122. [Google Scholar] [CrossRef]
  10. Wang, Z.; Wang, X.; Zhu, Z. Characterization of high-temperature deformation behavior and processing map of TB17 titanium alloy. J. Alloys Compd. 2017, 692, 149–154. [Google Scholar] [CrossRef]
  11. Li, X.; Wang, X.N.; Liu, K.; Cao, G.H.; Li, M.B.; Zhu, Z.S.; Wu, S.J. Hierarchical structure and deformation behavior of a novel multicomponent βtitanium alloy with ultrahigh strength. J. Mater. Sci. Technol. 2022, 107, 227–242. [Google Scholar] [CrossRef]
  12. Mantri, S.A.; Choudhuri, D.; Alam, T.; Viswanathan, G.B.; Sosa, J.M.; Fraser, H.L.; Banerjee, R. Tuning the scale of a precipitates in b-titanium alloys for achieving high strength. Scr. Mater. 2018, 154, 139–144. [Google Scholar] [CrossRef]
  13. Srinivasu, G.; Natraj, Y.; Bhattacharjee, A.; Nandy, T.K.; Rao, G.N. Tensile and fracture toughness of high strength β titanium alloy, Ti-10V-2Fe-3Al, as a function of rolling and solution treatment temperatures. Mater. Des. 2013, 47, 323–330. [Google Scholar] [CrossRef]
  14. Shekhar, S.; Sarkar, R.; Kar, S.K.; Bhattacharjee, A. Effect of solution treatment and aging on microstructure and tensile properties of high strength β titanium alloy Ti-5Al-5V-5Mo-3Cr. Mater. Des. 2015, 66, 596–610. [Google Scholar] [CrossRef]
  15. Nag, S.; Banerjee, R.; Srinivasan, R.; Hwang, J.Y.; Harper, M.; Fraser, H.L. ω-Assisted nucleation and growth of a precipitates in the Ti-5Al-5Mo-5V-3Cr-0.5 Fe β titanium alloy. Acta Mater. 2009, 57, 2136–2147. [Google Scholar] [CrossRef]
  16. Afonso, C.R.M.; Aleixo, G.T.; Ramirez, A.J.; Caram, R. Influence of cooling rate on microstructure of Ti-Nb alloy for orthopedic implants. Mater. Sci. Eng. C 2007, 27, 908–913. [Google Scholar] [CrossRef]
  17. Ahmed, M.; Savvakin, D.G.; Ivasishin, O.M.; Pereloma, E.V. The effect of cooling rates on the microstructure and mechanical properties of thermo-mechanically processed Ti-Al-Mo-V-Cr-Fe alloys. Mater. Sci. Eng. A 2013, 576, 167–177. [Google Scholar] [CrossRef]
  18. Mantri, S.A.; Choudhuri, D.; Alam, T.; Ageh, V.; Sun, F.; Prima, F.; Banerjee, R. Change in the deformation mode resulting from beta-omega compositional partitioning in a Ti-Mo alloy: Room versus elevated temperature. Scr. Mater. 2017, 130, 69–73. [Google Scholar] [CrossRef]
  19. Prima, F.; Vermaut, P.; Texier, G.; Ansel, D.; Gloriant, T. Evidence of α-nanophase heterogeneous nucleation from ϖ particles in a β-metastable Ti-based alloy by high-resolution electron microcopy. Scr. Mater. 2006, 54, 645–648. [Google Scholar] [CrossRef]
  20. Ohmori, Y.; Ogo, T.; Nakai, K.; Kobayashi, S. Effect of ω-phase precipitation on β→α, α″ transformation in a metastable β titanium alloy. Mater. Sci. Eng. A 2001, 312, 182–188. [Google Scholar] [CrossRef]
  21. Angelier, C.; Bein, S.; Béchet, J. Building a continuous cooling transformation diagram of β-CEZ alloy by metallography and electrical resistivity measurements. Metall. Mater. Trans. 1997, 28, 2467–2475. [Google Scholar] [CrossRef]
  22. Xu, J.; Zeng, W.; Zhu, Z.; Li, M.; Du, J.; He, S.; Wang, X. Precipitation and evolution behaviors of grain boundary α and α side plates for ultra-high strength titanium alloy during continuous cooling. Mater. Des. 2023, 225, 111562. [Google Scholar] [CrossRef]
  23. Seward, G.G.E.; Celotto, S.; Prior, D.J.; Wheeler, J.; Pond, R.C. In situ SEM-EBSD observations of the hcp to bcc phase transformation in commercially pure titanium. Acta Mater. 2004, 52, 821–832. [Google Scholar] [CrossRef]
  24. Charpentier, M.; Hazotte, A.; Daloz, D. Lamellar transformation in near-γ TiAl alloys-Quantitative analysis of kinetics and microstructure. Mater. Sci. Eng. A 2008, 491, 321–330. [Google Scholar] [CrossRef]
  25. Yu, H.; Li, W.; Li, S.; Yang, Y.; Zou, H.; Liu, L. Phase Transformation Mechanism and Microstructure Evolution of TC4 Alloy during Continuous Cooling. Phys. Met. Metallogr. 2020, 121, 1375–1381. [Google Scholar] [CrossRef]
  26. Wang, Y.H.; Kou, H.; Chang, H.; Zhu, Z.S.; Zhang, F.S.; Li, J.; Zhou, L. Influence of solution temperature on phase transformation of TC21 alloy. Mater. Sci. Eng. A 2009, 508, 76–82. [Google Scholar] [CrossRef]
  27. Barriobero-Vila, P.; Requena, G.; Warchomicka, F.; Stark, A.; Schell, N.; Buslaps, T. Phase transformation kinetics during continuous heating of a b-quenched Ti-10V-2Fe-3Al alloy. J. Mater. Sci. 2015, 50, 1412–1426. [Google Scholar] [CrossRef]
  28. Zheng, Z.Y.; Chai, L.J.; Li, Z.H.; Huang, W.J.; Tian, L.; Wang, Y.F.; Liu, L.L. Effects of β-cooling rates on microstructural characteristics and hardness of Ti–5Al–5Mo–5V–3Cr–1Fe metastable β Ti alloy. Mater. Chem. Phys. 2022, 276, 125318. [Google Scholar] [CrossRef]
Figure 1. As-forged microstructure of TB17 titanium alloy.
Materials 17 05010 g001
Figure 2. (ai) are the relative coefficient curves and dilatometric curves of the alloy at cooling rates of 1 °C/min, 10 °C/min, 15 °C/min, 20 °C/min, 50 °C/min, 100 °C/min, 150 °C/min, 200 °C/min, and 400 °C/min, respectively; the horizontal solid lines in the figure are the relative coefficient curves, and the inclined solid lines are the dilatometric curves.
Materials 17 05010 g002
Figure 3. CCT diagram of TB17 titanium alloy.
Materials 17 05010 g003
Figure 4. X-ray diffraction results of TB17 titanium alloy under different cooling conditions.
Materials 17 05010 g004
Figure 5. The back-scattered electron (BSE) images of TB17 titanium alloy at different cooling conditions. (a) 400 °C/min, (b) 50 °C/min, (c) 20 °C/min, (d) 15 °C/min, (e) 10 °C/min, (f) 1 °C/min.
Materials 17 05010 g005
Figure 6. Evolution of microstructures under different cooling rates: (a) rapid cooling rate, (b) intermediate cooling rate, and (c) slow cooling rate.
Materials 17 05010 g006
Figure 7. The thickness of αGB, αWGB, and αWM under different cooling rates.
Materials 17 05010 g007
Figure 8. Microhardness curves of TB17 titanium alloy at different cooling rates.
Materials 17 05010 g008
Figure 9. EBSD observation of specimen under the cooling rate of 1 °C/min. (a) IPF orientation distribution map of α phase, (b) IPF orientation distribution map of β phase, (c) corresponding pole Figure 9 of four β grains.
Materials 17 05010 g009
Figure 10. EBSD observation of specimen at the cooling rate of 1 °C/min. (a) Highlighted inverse pole figure map of α1; (b) Corresponding pole figures of α1, β2, and β3 grains; (c) Schematic illustration of the growth direction of α1.
Materials 17 05010 g010
Figure 11. EBSD observation of specimens at the cooling rate of 1 °C/min. (a) Highlighted inverse pole figure map of α2 and α3; (b) Corresponding pole figures of α2, α3, β2, and β3 grains; (c) Schematic illustration of the growth direction of α2 and α3.
Materials 17 05010 g011
Figure 12. EBSD observation of specimen at the cooling rate of 1 °C/min. (a) Highlighted inverse pole figure map of α4 and α5; (b) Corresponding pole figures of α4, α5, β1, and β3 grains; (c) Schematic illustration of the growth direction of α4 and α5.
Materials 17 05010 g012
Table 1. Chemical compositions of TB17 alloy used in this study (wt.%).
ElementAlMoVNbCrZrSnFeOTi
wt.%3.916.841.192.052.711.021.020.040.089Bal.
Disclaimer/Publisher’s Note: The statements, opinions and data contained in all publications are solely those of the individual author(s) and contributor(s) and not of MDPI and/or the editor(s). MDPI and/or the editor(s) disclaim responsibility for any injury to people or property resulting from any ideas, methods, instructions or products referred to in the content.

