Article

Linear and Volumetric Polyethylene Wear Patterns after Primary Cruciate-Retaining Total Knee Arthroplasty Failure: An Analysis Using Optical Scanning and Computer-Aided Design Models

1
Valdoltra Orthopaedic Hospital, Jadranska cesta 31, 6280 Ankaran, Slovenia
2
Faculty of Medicine, University of Ljubljana, Vrazov trg 2, 1000 Ljubljana, Slovenia
3
Jožef Stefan Institute, Jamova cesta 39, 1000 Ljubljana, Slovenia
4
Faculty of Tourism Studies-Turistica, University of Primorska, Obala 11a, 6320 Portorož, Slovenia
5
Faculty of Electrical Engineering, University of Ljubljana, Tržaška cesta 25, 1000 Ljubljana, Slovenia
*
Author to whom correspondence should be addressed.
Materials 2024, 17(20), 5007; https://doi.org/10.3390/ma17205007
Submission received: 13 September 2024 / Revised: 4 October 2024 / Accepted: 11 October 2024 / Published: 13 October 2024

Abstract

:
(1) Background: Analyses of retrieved inserts allow for a better understanding of TKA failure mechanisms and the detection of factors that cause increased wear. The purpose of this implant retrieval study was to identify whether insert volumetric wear significantly differs among groups of common causes of total knee arthroplasty failure, whether there is a characteristic wear distribution pattern for a common cause of failure, and whether nominal insert size and component size ratio (femur-to-insert) influence linear and volumetric wear rates. (2) Methods: We digitally reconstructed 59 retrieved single-model cruciate-retaining inserts and computed their articular load-bearing surface wear utilizing an optical scanner and computer-aided design models as references. After comprehensively reviewing all cases, each was categorized into one or more of the following groups: prosthetic joint infection, osteolysis, clinical loosening of the component, joint malalignment or component malposition, instability, and other isolated causes. The associations between volumetric wear and causes of failure were estimated using a multiple linear regression model adjusted for time in situ. Insert linear penetration wear maps from the respective groups of failure were further processed and merged to create a single average binary image, highlighting a potential wear distribution pattern. The differences in wear rates according to nominal insert size (small vs. medium vs. large) and component size ratio (≤1 vs. >1) were tested using the Kruskal–Wallis test and the Mann–Whitney test, respectively. (3) Results: Patients with identified osteolysis alone and those also with clinical loosening of the component had significantly higher volumetric wear when compared to those without both causes (p = 0.016 and p = 0.009, respectively). All other causes were not significantly associated with volumetric wear. The instability group differentiated from the others with a combined peripheral antero-posterior wear distribution. Linear and volumetric wear rates showed no significant differences when compared by nominal insert size (small vs. medium vs. large, p = 0.563 and p = 0.747, respectively) or by component (femoral-to-insert) size ratio (≤1 vs. >1, p = 0.885 and p = 0.055, respectively). (4) Conclusions: The study found increased volumetric wear in cases of osteolysis alone, with greater wear when combined with clinical loosening compared to other groups. The instability group demonstrated a characteristic peripheral anterior and posterior wear pattern. Insert size and component size ratio seem not to influence wear rates.

Graphical Abstract

1. Introduction

Each year, more than one million total knee arthroplasties (TKA) are being performed worldwide, and this number is expected to increase significantly over the next decades [1]. Many patients have seen tremendous benefits from TKA; however, studies have shown that up to 20% of patients are not satisfied with the results of this procedure [2,3]. Consequently, this represents a huge concern to patients, surgeons, implant manufacturers, hospitals, and health care funds [4,5]. The most common indications for revision (or cause for dissatisfaction) in TKA include prosthetic joint infection (PJI), wear of the tibial polyethylene insert, aseptic loosening, periprosthetic fracture, malposition of the implant, mechanical failure, instability, and stiffness of the prosthetic joint [6,7]. There is also a large number of patients with failed TKA, where the exact cause of failure remains unknown. In these cases, a single cause alone would probably not lead to a problem, but a combination of causes could generate severe dissatisfaction, finally leading to revision without a clearly defined diagnosis. The appropriate diagnoses for these knee implants might be extremely difficult to clarify.
Increased wear of the tibial insert and the consequent induced osteolysis and aseptic loosening is the result of a multifactorial problem that involves factors related to the implant, the surgeon, and the patient. Consequently, it may alone account for up to 25% of all TKA revisions [8,9]. Analyses of retrieved inserts allow for a better understanding of TKA failure mechanisms and the detection of factors that cause increased wear [10]. Previous studies with their key findings are presented in Table 1 [10,11,12,13,14,15,16,17,18,19,20,21,22,23,24,25,26,27,28,29,30,31,32]. There is a lack of research on well-defined cohorts of retrieved insert samples, analyzed using modern methods involving information on the 3D wear distribution of the articular surface in different clinical causes for arthroplasty failure.
This implant retrieval study quantitatively assessed insert wear following failed cruciate-retaining (CR) type TKA. To minimize manufacturer-related variables, we analyzed only inserts made from identical gamma vacuum foil (GVF) UHMWPE and designed by a single manufacturer (DePuy Synthes, Johnson & Johnson, Warsaw, IN, USA). Our purpose was to identify (a) whether volumetric wear (adjusted for time in situ) significantly differs among groups of common causes of TKA failure, (b) whether there is a characteristic wear distribution pattern for a common cause of TKA failure, and (c) whether nominal insert size (small vs. medium vs. large) and component size ratio (femur-to-insert) influence linear and volumetric wear rates.

2. Materials and Methods
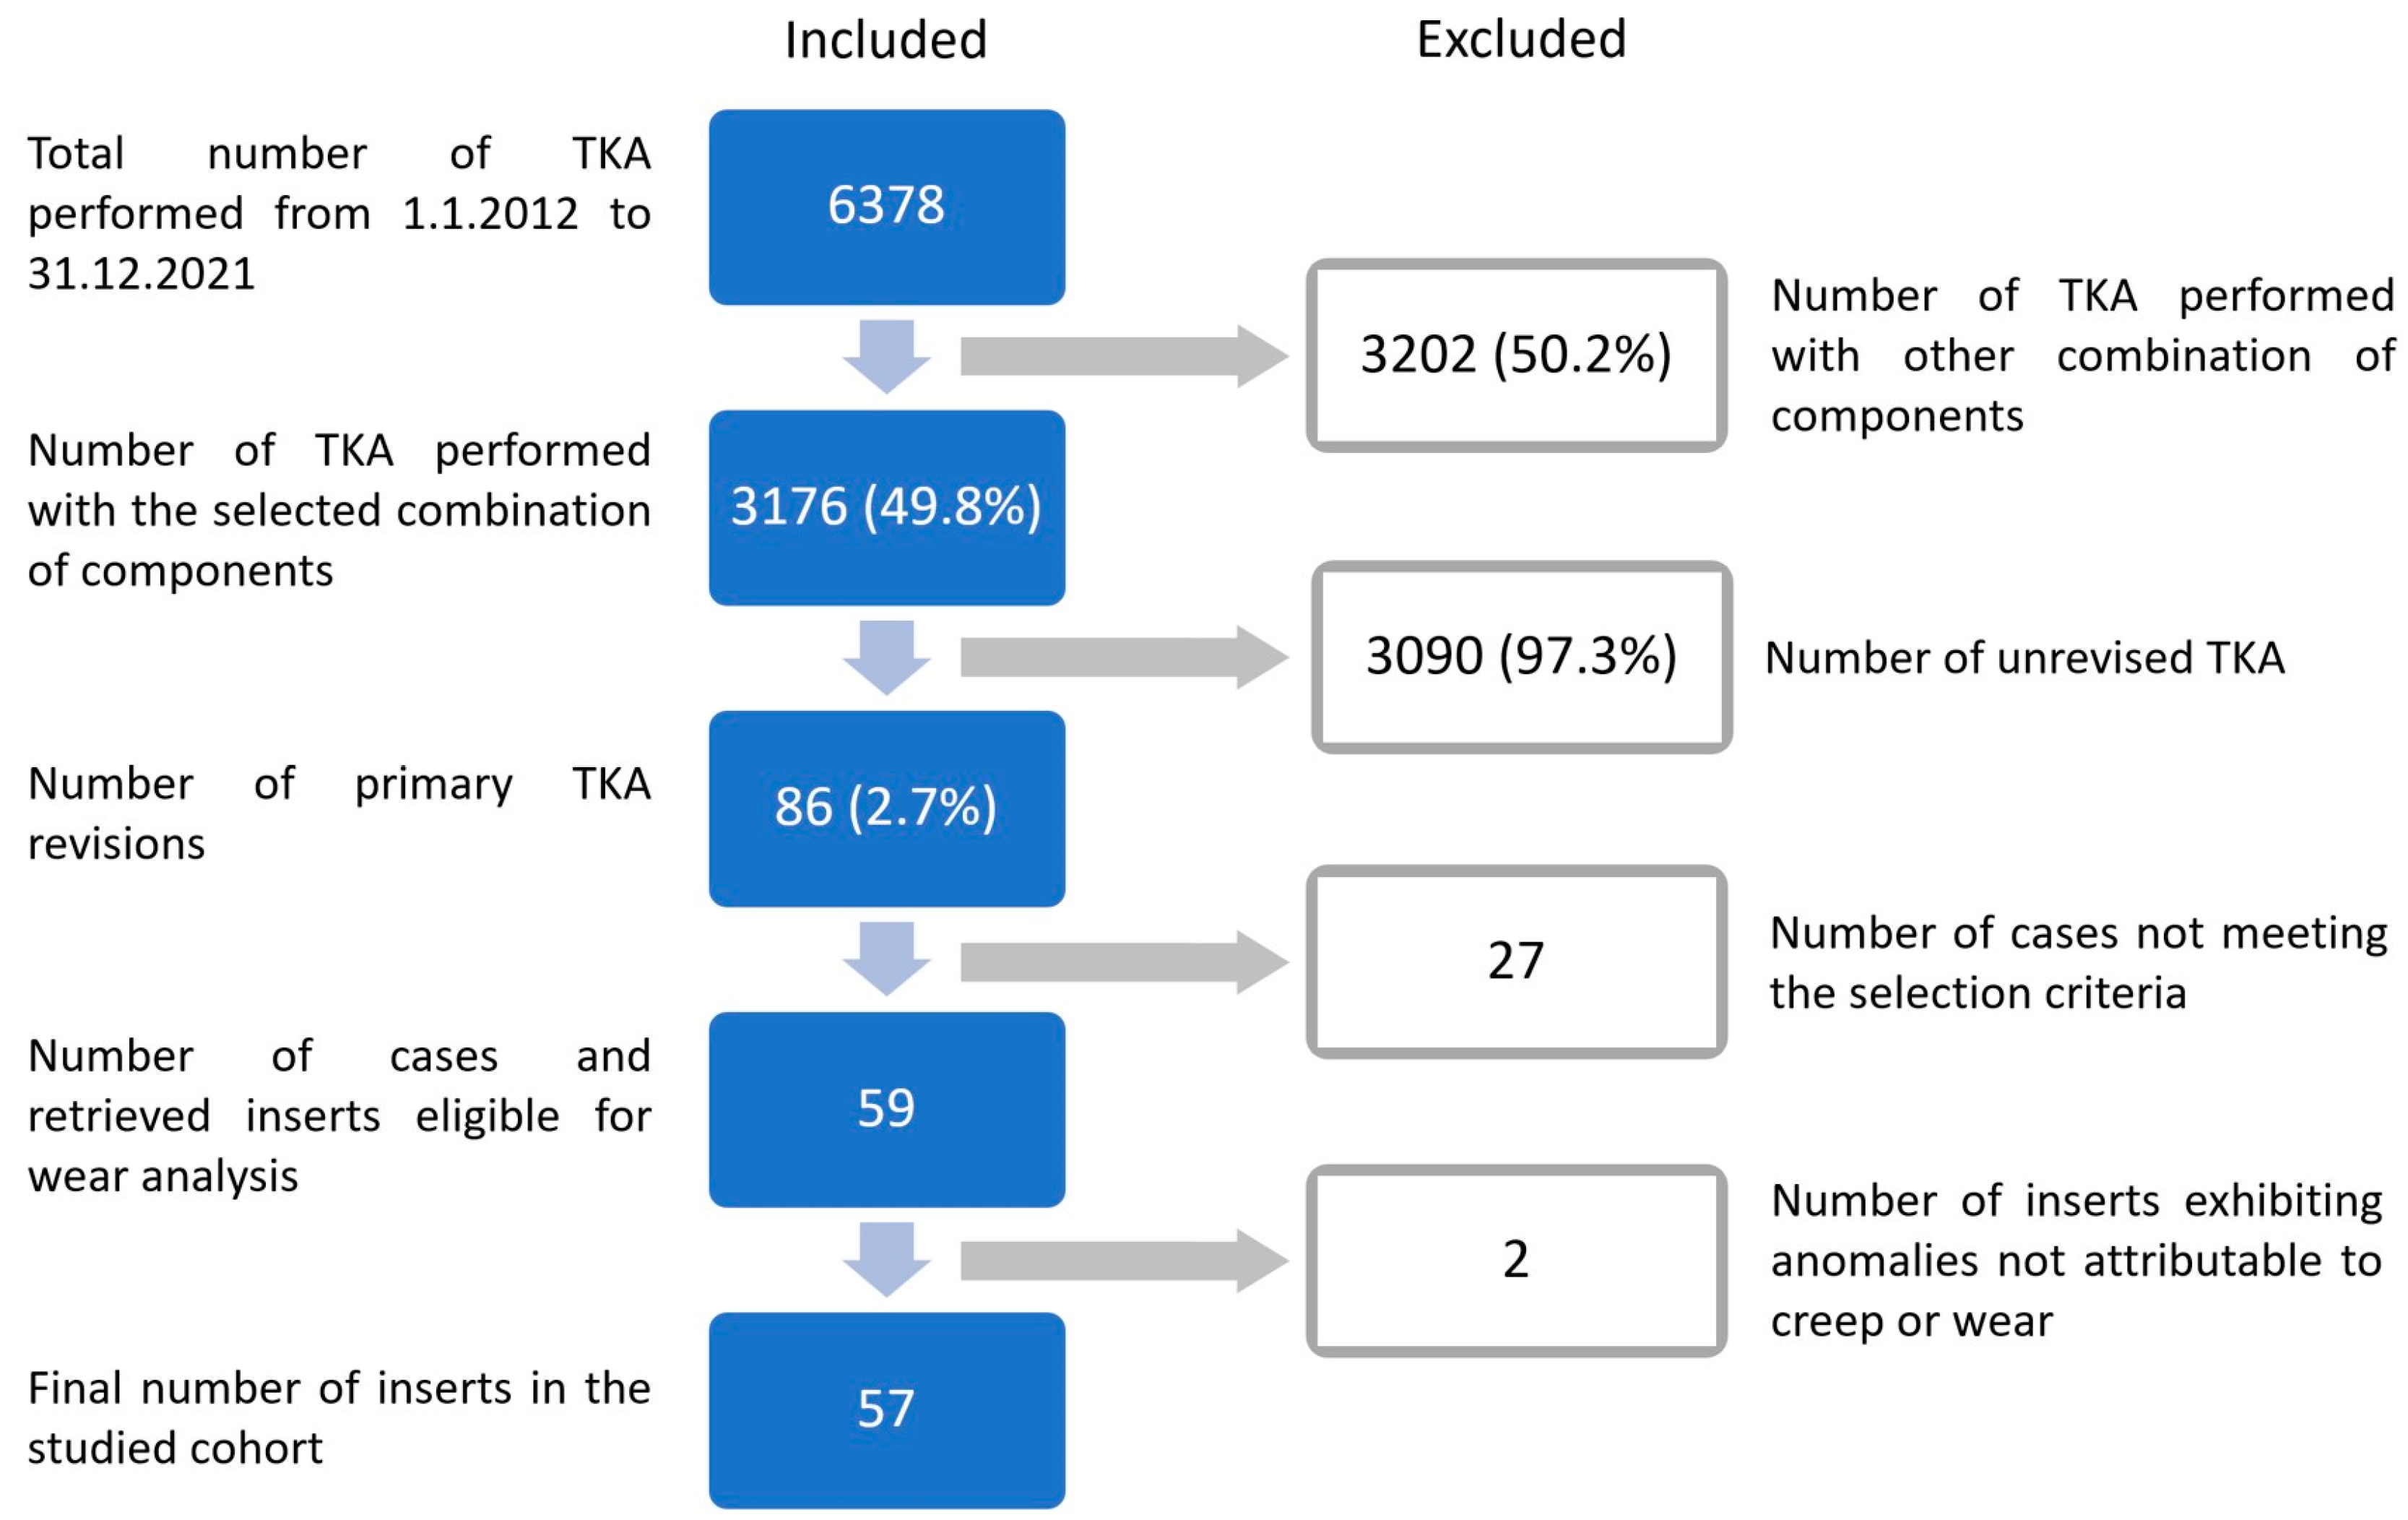
2.1. Retrievals

A prospective cohort of retrieved Sigma® Cruciate-Retaining Curved GVF i2 inserts from DePuy Synthes (Johnson & Johnson, Warsaw, IN, USA), that were removed during the primary revision surgery in Valdoltra Orthopedic Hospital, Slovenia between the years 2013 and 2021, has been included in the IRB approved study. Out of 6378 primary TKAs conducted during this period, 3176 TKAs were implanted with the chosen insert (refer to Figure 1). Among these, 86 cases (2.71%) underwent revision surgery. The current overall number of retrieved TKA components stored in our research department exceeds 600. Retrievals were included in the study if all the following criteria were met: cemented TKA, tibial component Sigma® Modular CoCr Tibia Tray Component (Non-Porous), and femoral component Sigma® CR Femoral Component (Non-Porous). Exclusion criteria comprised missing patient data, absent explant or information on prosthesis type, and lack of surgical report for the index or revision surgery. Out of the 59 retrieved inserts obtained from an equal number of patients meeting the selection criteria, 2 cases exhibited considerably different types of damage, as outlined in the results section. Since these anomalies could not be attributed to creep or wear, they were subsequently excluded from further analysis. Therefore, the final cohort consisted of 57 inserts. Clinical and demographic data of patients were obtained from the institutional Valdoltra Arthroplasty Registry [33] and electronic clinical records. The study has been registered with ClinicalTrials.gov (ID NCT05482438).

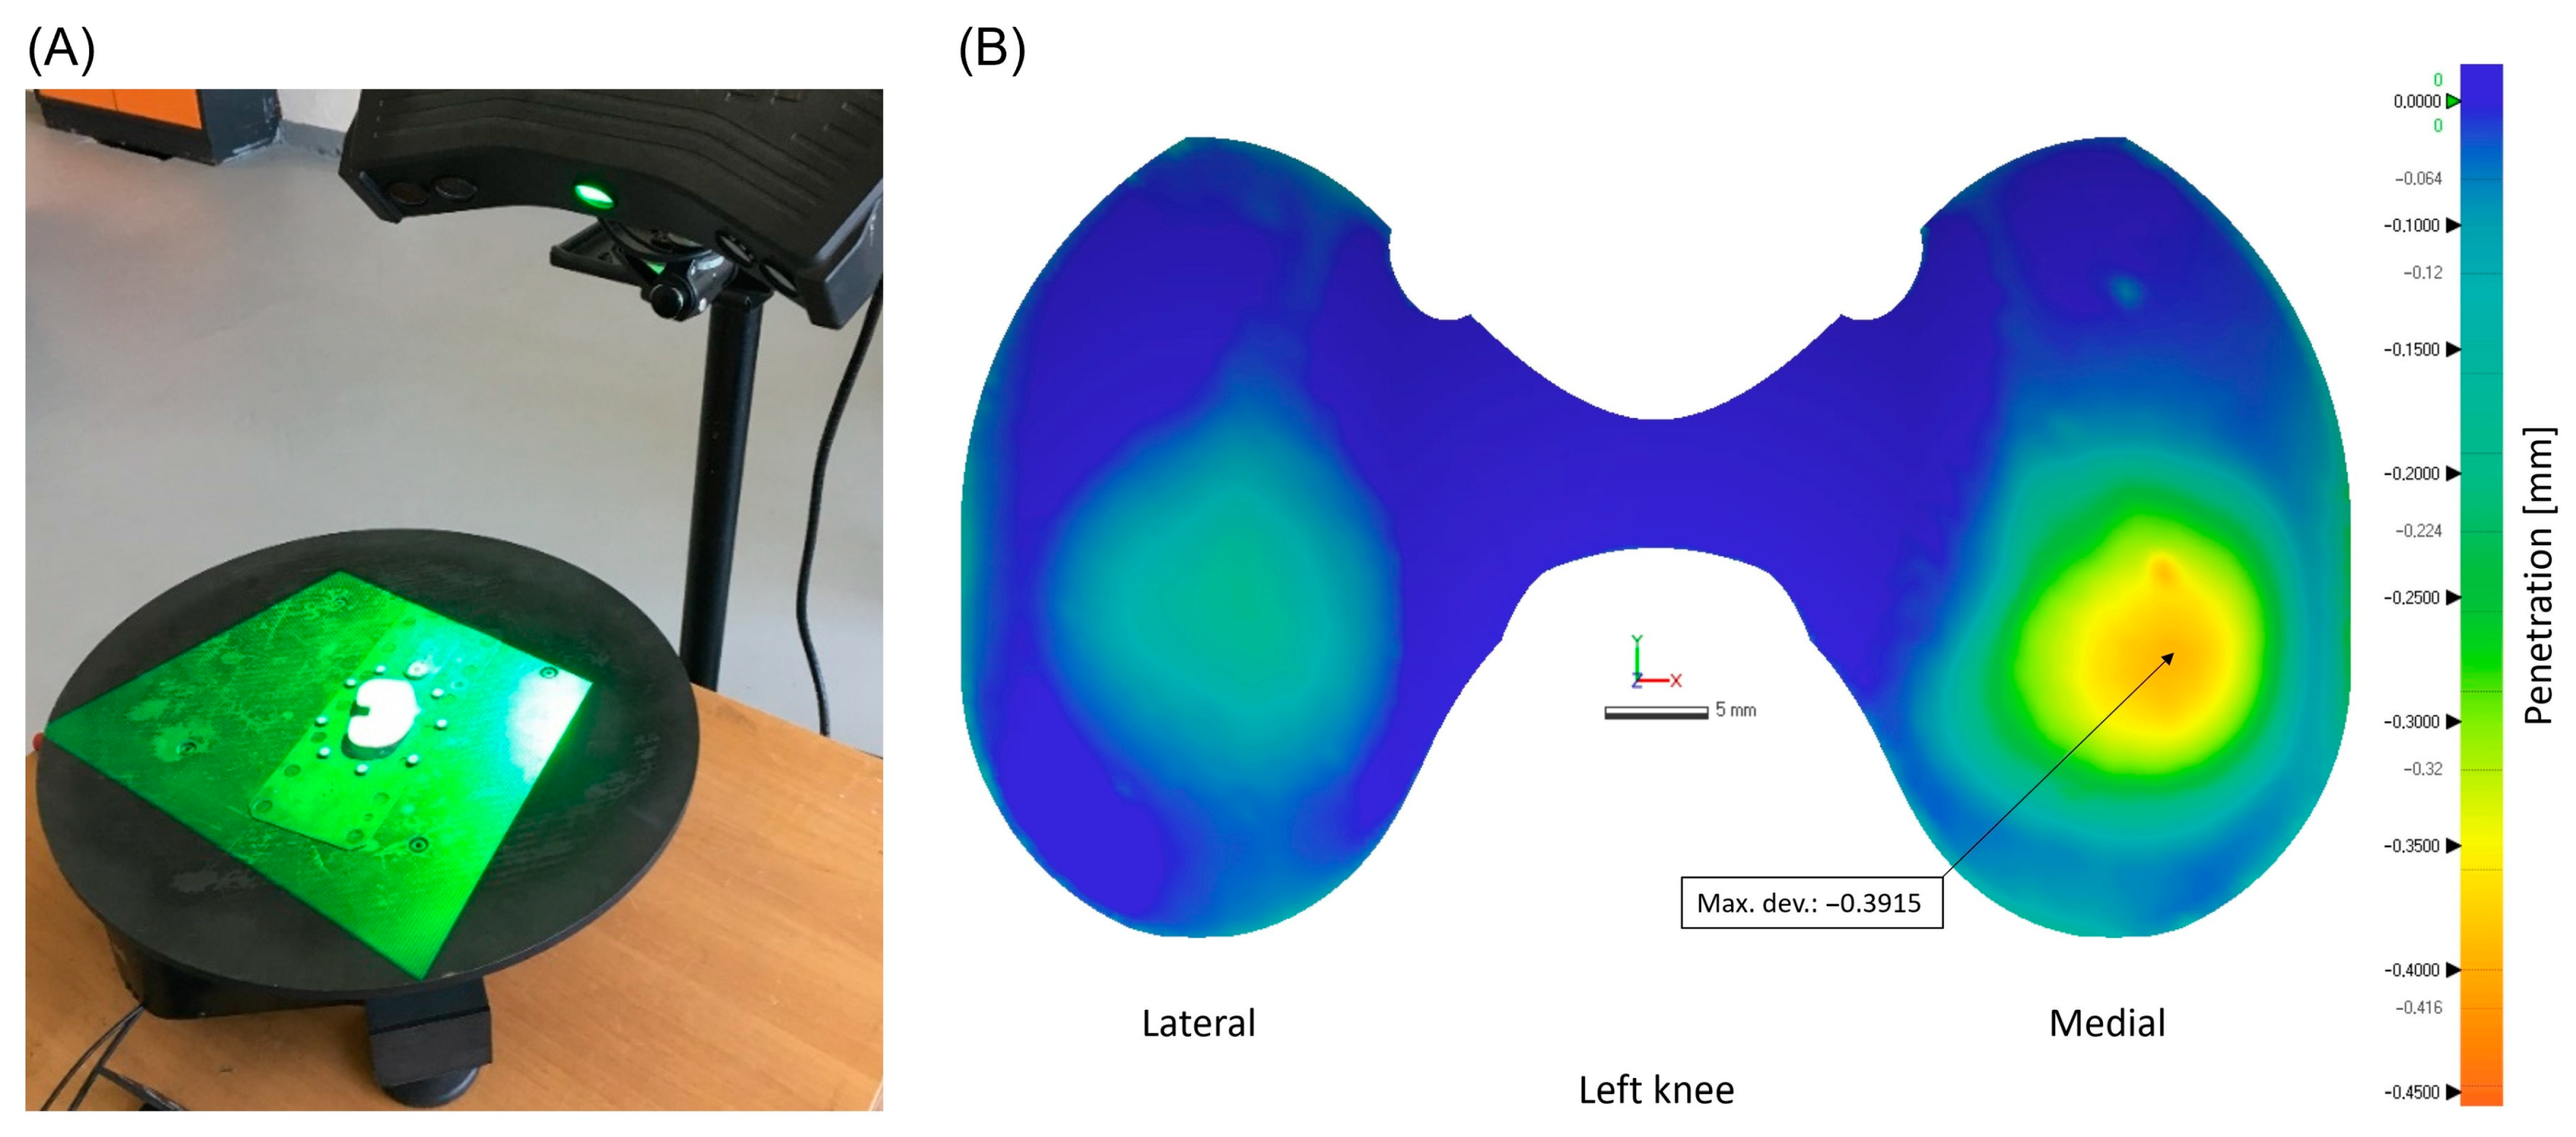
2.2. Scanning Process and Insert Wear Analysis

After the initial cleaning, a white anti-glare coating agent (3D SCAN-IT IP-25 by Samson Kamnik d.o.o., Kamnik, Slovenia) was uniformly applied with a spray gun on the surface of the insert. Then, it was placed on a rotating platform and scanned using an EviXscan 3D Heavy Duty Quadro 3D optical scanner (EVIXSCAN 3D, Bielsko-Biala, Poland) from multiple angles. For point cloud processing, we utilized the measurement software EviXscan 3D Suite 2.7 (EVIXSCAN 3D, Bielsko-Biala, Poland). With the described systems, we acquired a stereolithographic (STL) file of each retrieved insert. Geomagic Control X 2022.1.0 software (3D Systems, Rock Hill, SC, USA) was utilized for post-processing the measurements and conducting a comparison between the scanned insert with its reference computer-aided design (CAD) model of appropriate dimensions provided by DePuy Synthes (DePuy International Ltd., Leeds, UK). The superimposition of the scanned file with the corresponding CAD model for wear calculation was performed based on the best-fit alignment process, aligning with both plain nonbearing articular and lateral surfaces to ensure optimal accuracy. Nonbearing articular parts were subsequently removed perpendicularly, to allow for more precise further measurements and relevant presentations of the articular load-bearing surface, including the creation of a linear penetration wear map (Figure 2).
We calculated the linear wear of the articular load-bearing surface, defined as the maximum deviation in millimeters from the reference at any point of this surface. Also, the volumetric wear of the same surface, measured in cubic millimeters, was determined by subtracting the volume of the retrieved insert from the reference CAD model. In simple terms, linear wear refers to the maximum depth of material loss, while volumetric wear represents the total amount of material lost. The linear and volumetric wear rates were calculated by dividing the wear by the component time in situ (time from primary TKA to revision operation), reported as mm/year and mm3/year, respectively.

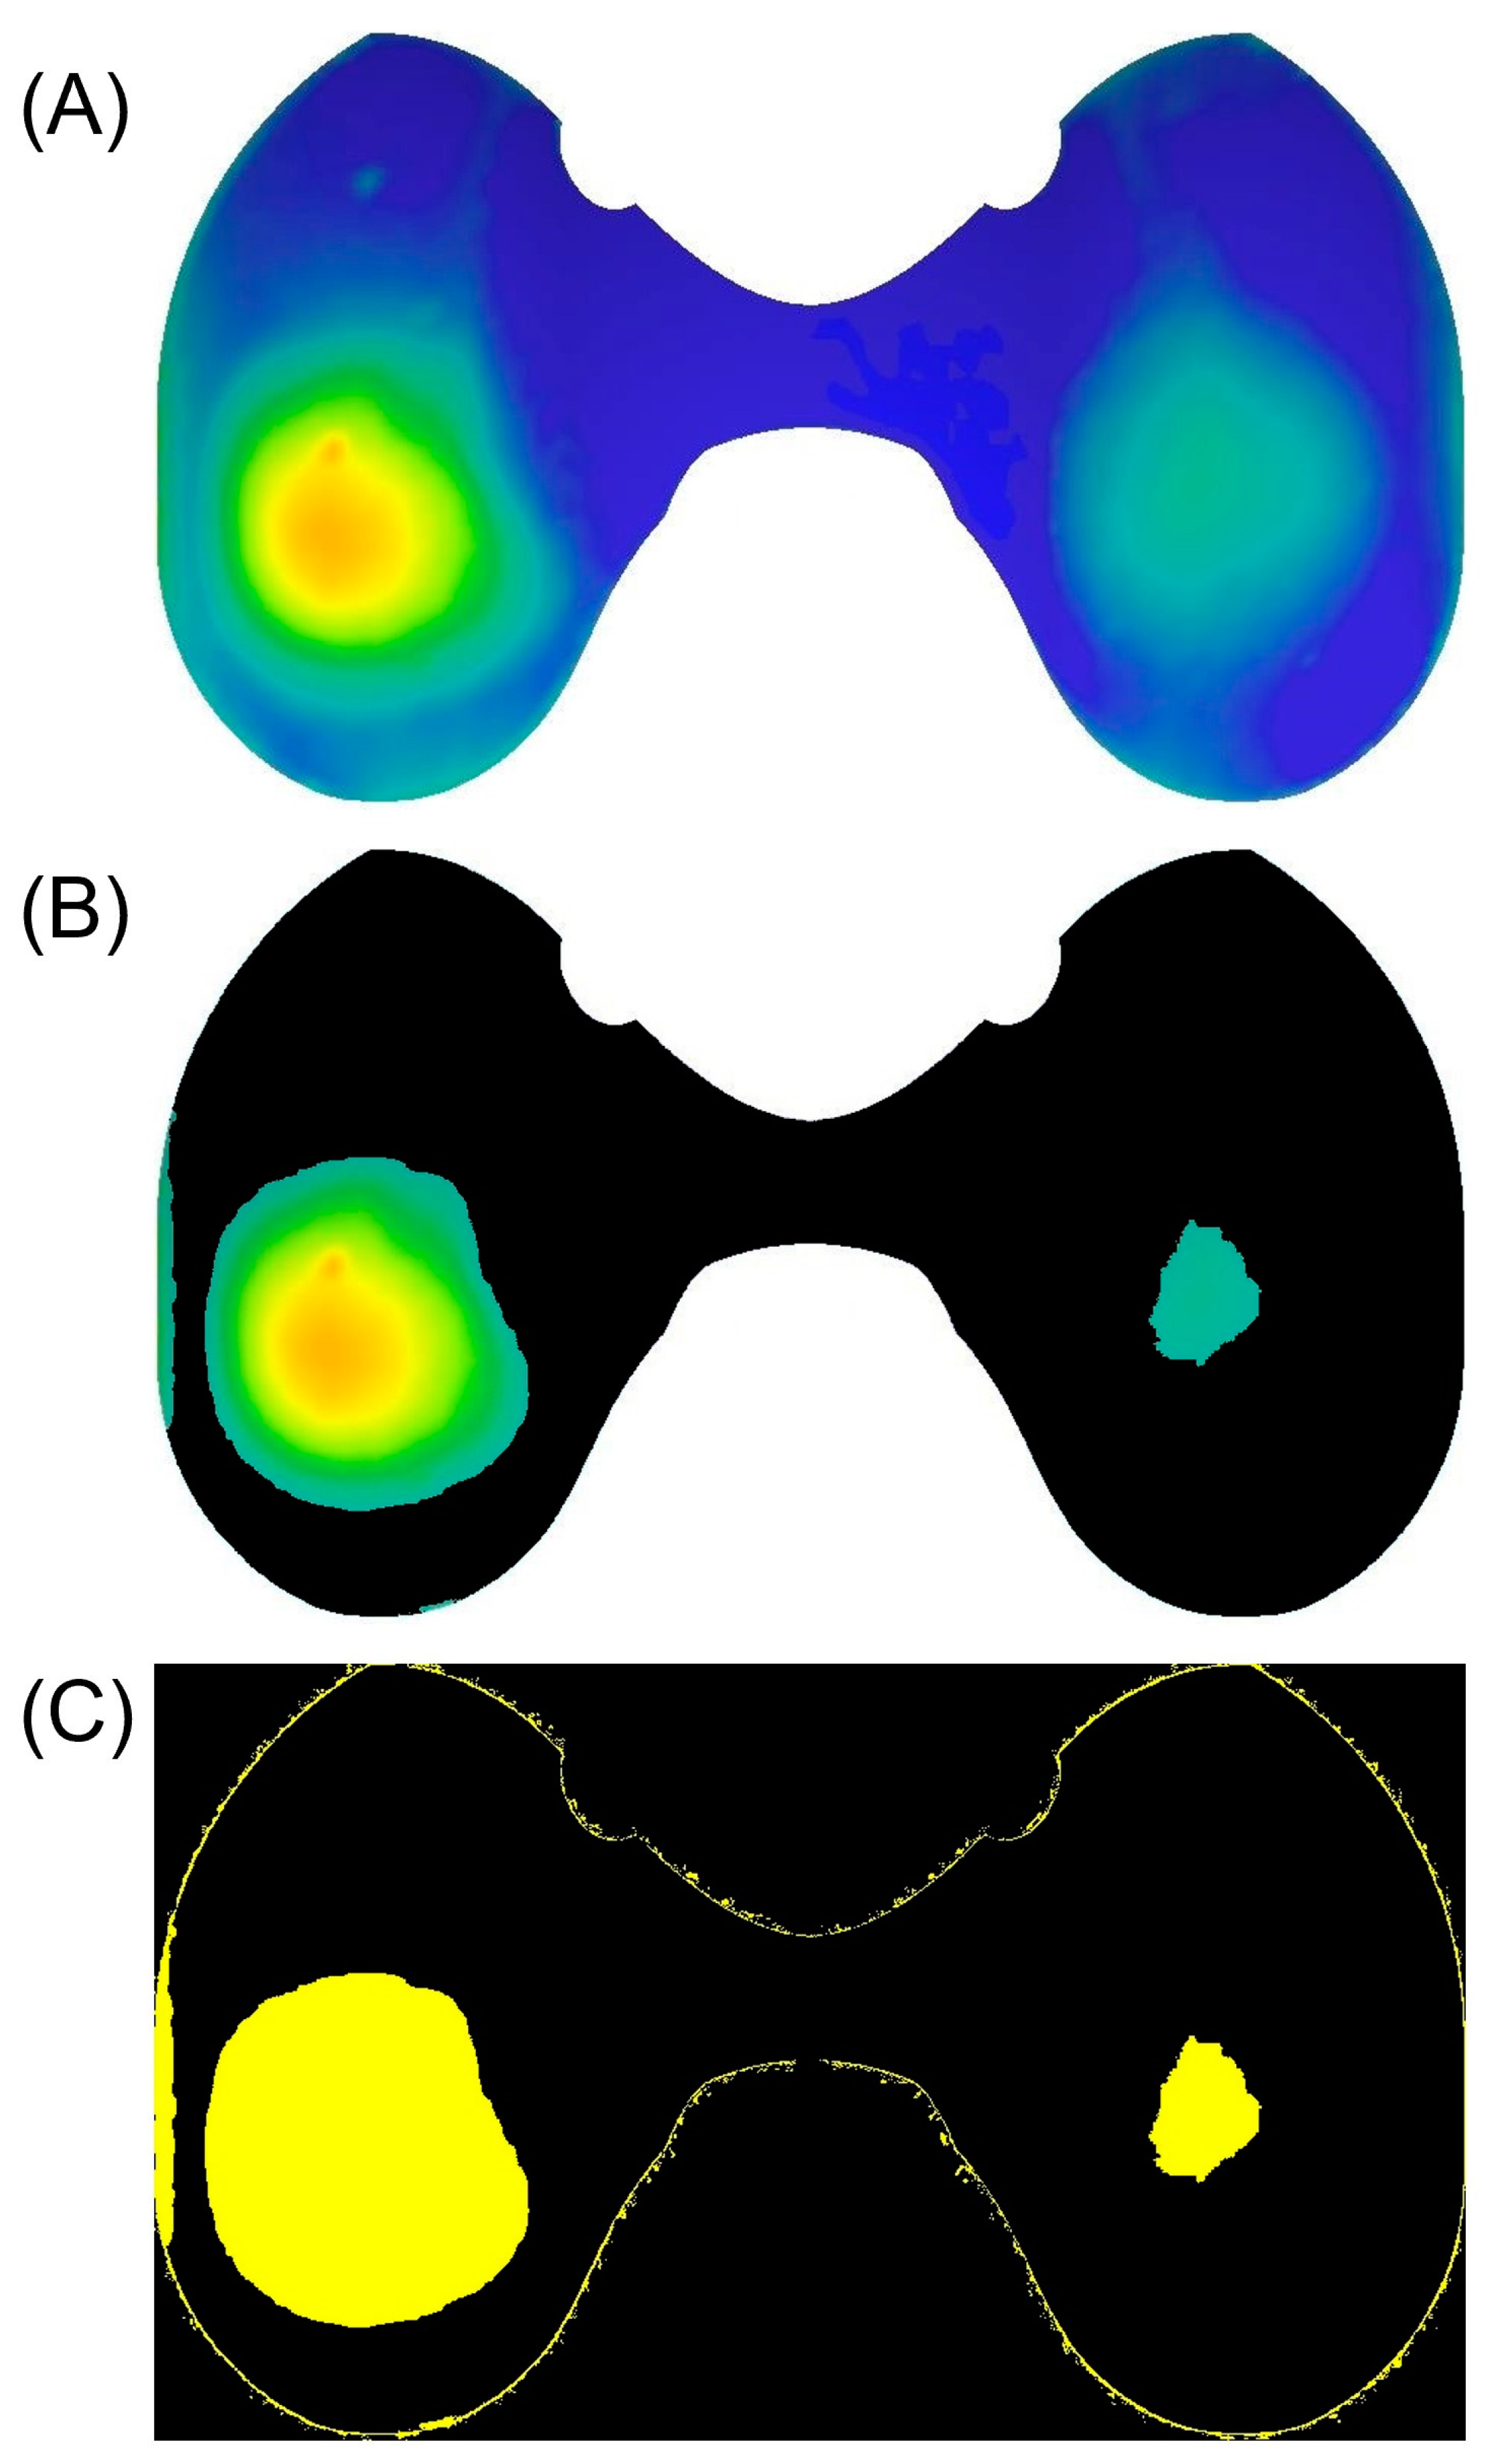
2.3. Determination of Characteristic Wear Patterns

Linear penetration wear maps of inserts from the respective groups associated with common causes of TKA failure were further analyzed to identify potential wear distribution patterns. Image processing was conducted using Python 3.11.2 (Python Software Foundation, Wilmington, DE, USA) and OpenCV (Palo Alto, CA, USA) libraries, with a primary focus on generating an “average image” of each group. In this process, each image contributed a proportional share to the final result. The substantial challenge encountered was the variability in the size and shape of the inserts. To ensure precise superimposition, insert image sizes were normalized, and the side of the insert was also normalized (left inserts were horizontally mirrored) to capture potential medial vs. lateral characteristics. Point cloud data from measurements were converted into heat maps, which were then used to create the average image. To enhance the visibility of areas with considerable wear and exclude those with less or no wear, initial penetration wear maps were converted into binary images based on the threshold determined by the actual result analysis (Figure 3). This method disregarded wear depth information, concentrating solely on the locations of considerable wear. Ultimately, processed images were superimposed to create a single average binary image, thereby enhancing visibility and highlighting a potential wear distribution pattern within a group.

2.4. Identification of All Possible Causes for TKA Failure

In addition to examining the cause of revision surgery indicated by the operating surgeon, we conducted a review of each case, searching for any potential additional causes contributing to TKA failure. To accomplish this, we reviewed perioperative and follow-up records, along with the available radiological, laboratory, and microbiological studies. Ultimately, each case was categorized into one or more of the following groups representing the most common causes of TKA failure, using validated guidelines:
  • Confirmed PJI according to the current European Bone and Joint Infection Society (EBJIS) definition [34];
  • Osteolysis (defined as progressive radiolucent lines one year after index TKA with radiological assessment according to the Knee Society Roentgenographic Evaluation and Scoring System) [35,36];
  • Clinical loosening of the component (intraoperative assessment—evident movement of a prosthetic component within the bone);
  • Joint malalignment or component malposition (in the coronal plane: deviation of hip-knee-ankle angle (HKAA) from 180 ± 3° (varus/valgus malalignment), deviation of mechanical lateral distal femoral angle (mLDFA) from 90 ± 3°, deviation of medial proximal tibial angle (MPTA) from 90° to 87°, in the sagittal plane, deviation of distal femoral flexion angle (DFFA) from 90° to 87° and deviation of tibial slope (TS) from 0° to 7°) [37];
  • Instability (positive history and clinical examination of abnormal and excessive displacement of a knee prosthesis [38] with intraoperative finding or positive stress radiography);
  • Other isolated causes (joint stiffness—flexion contracture greater than 10° and/or flexion limit ranging from 90° [39] and/or pain not classified in any of the previous groups).

2.5. Determination of Groups Based on Nominal Insert Size and Component Size Ratio

All total knee prostheses were implanted following the manufacturer’s instructions and the stated nominal size compatibility of the components.
Based on the median nominal insert size value of 3, we formed the following three groups: small (sizes 2 and 2.5), medium (size 3), and large (sizes 4 and 5).
Based on the nominal component size ratio (femoral-to-insert; F:I ratio) of each case in the cohort, we established two groups. The first group included cases with F:I ratios ≤ 1, whereas the second group included cases with F:I ratio > 1. It is important to mention that we treated the size of the femoral components 3 and 4 N as equivalent, due to their identical mediolateral dimensions. Consequently, the F:I ratios of femoral component sizes 3 and 4 N to insert size 3 were both 1.

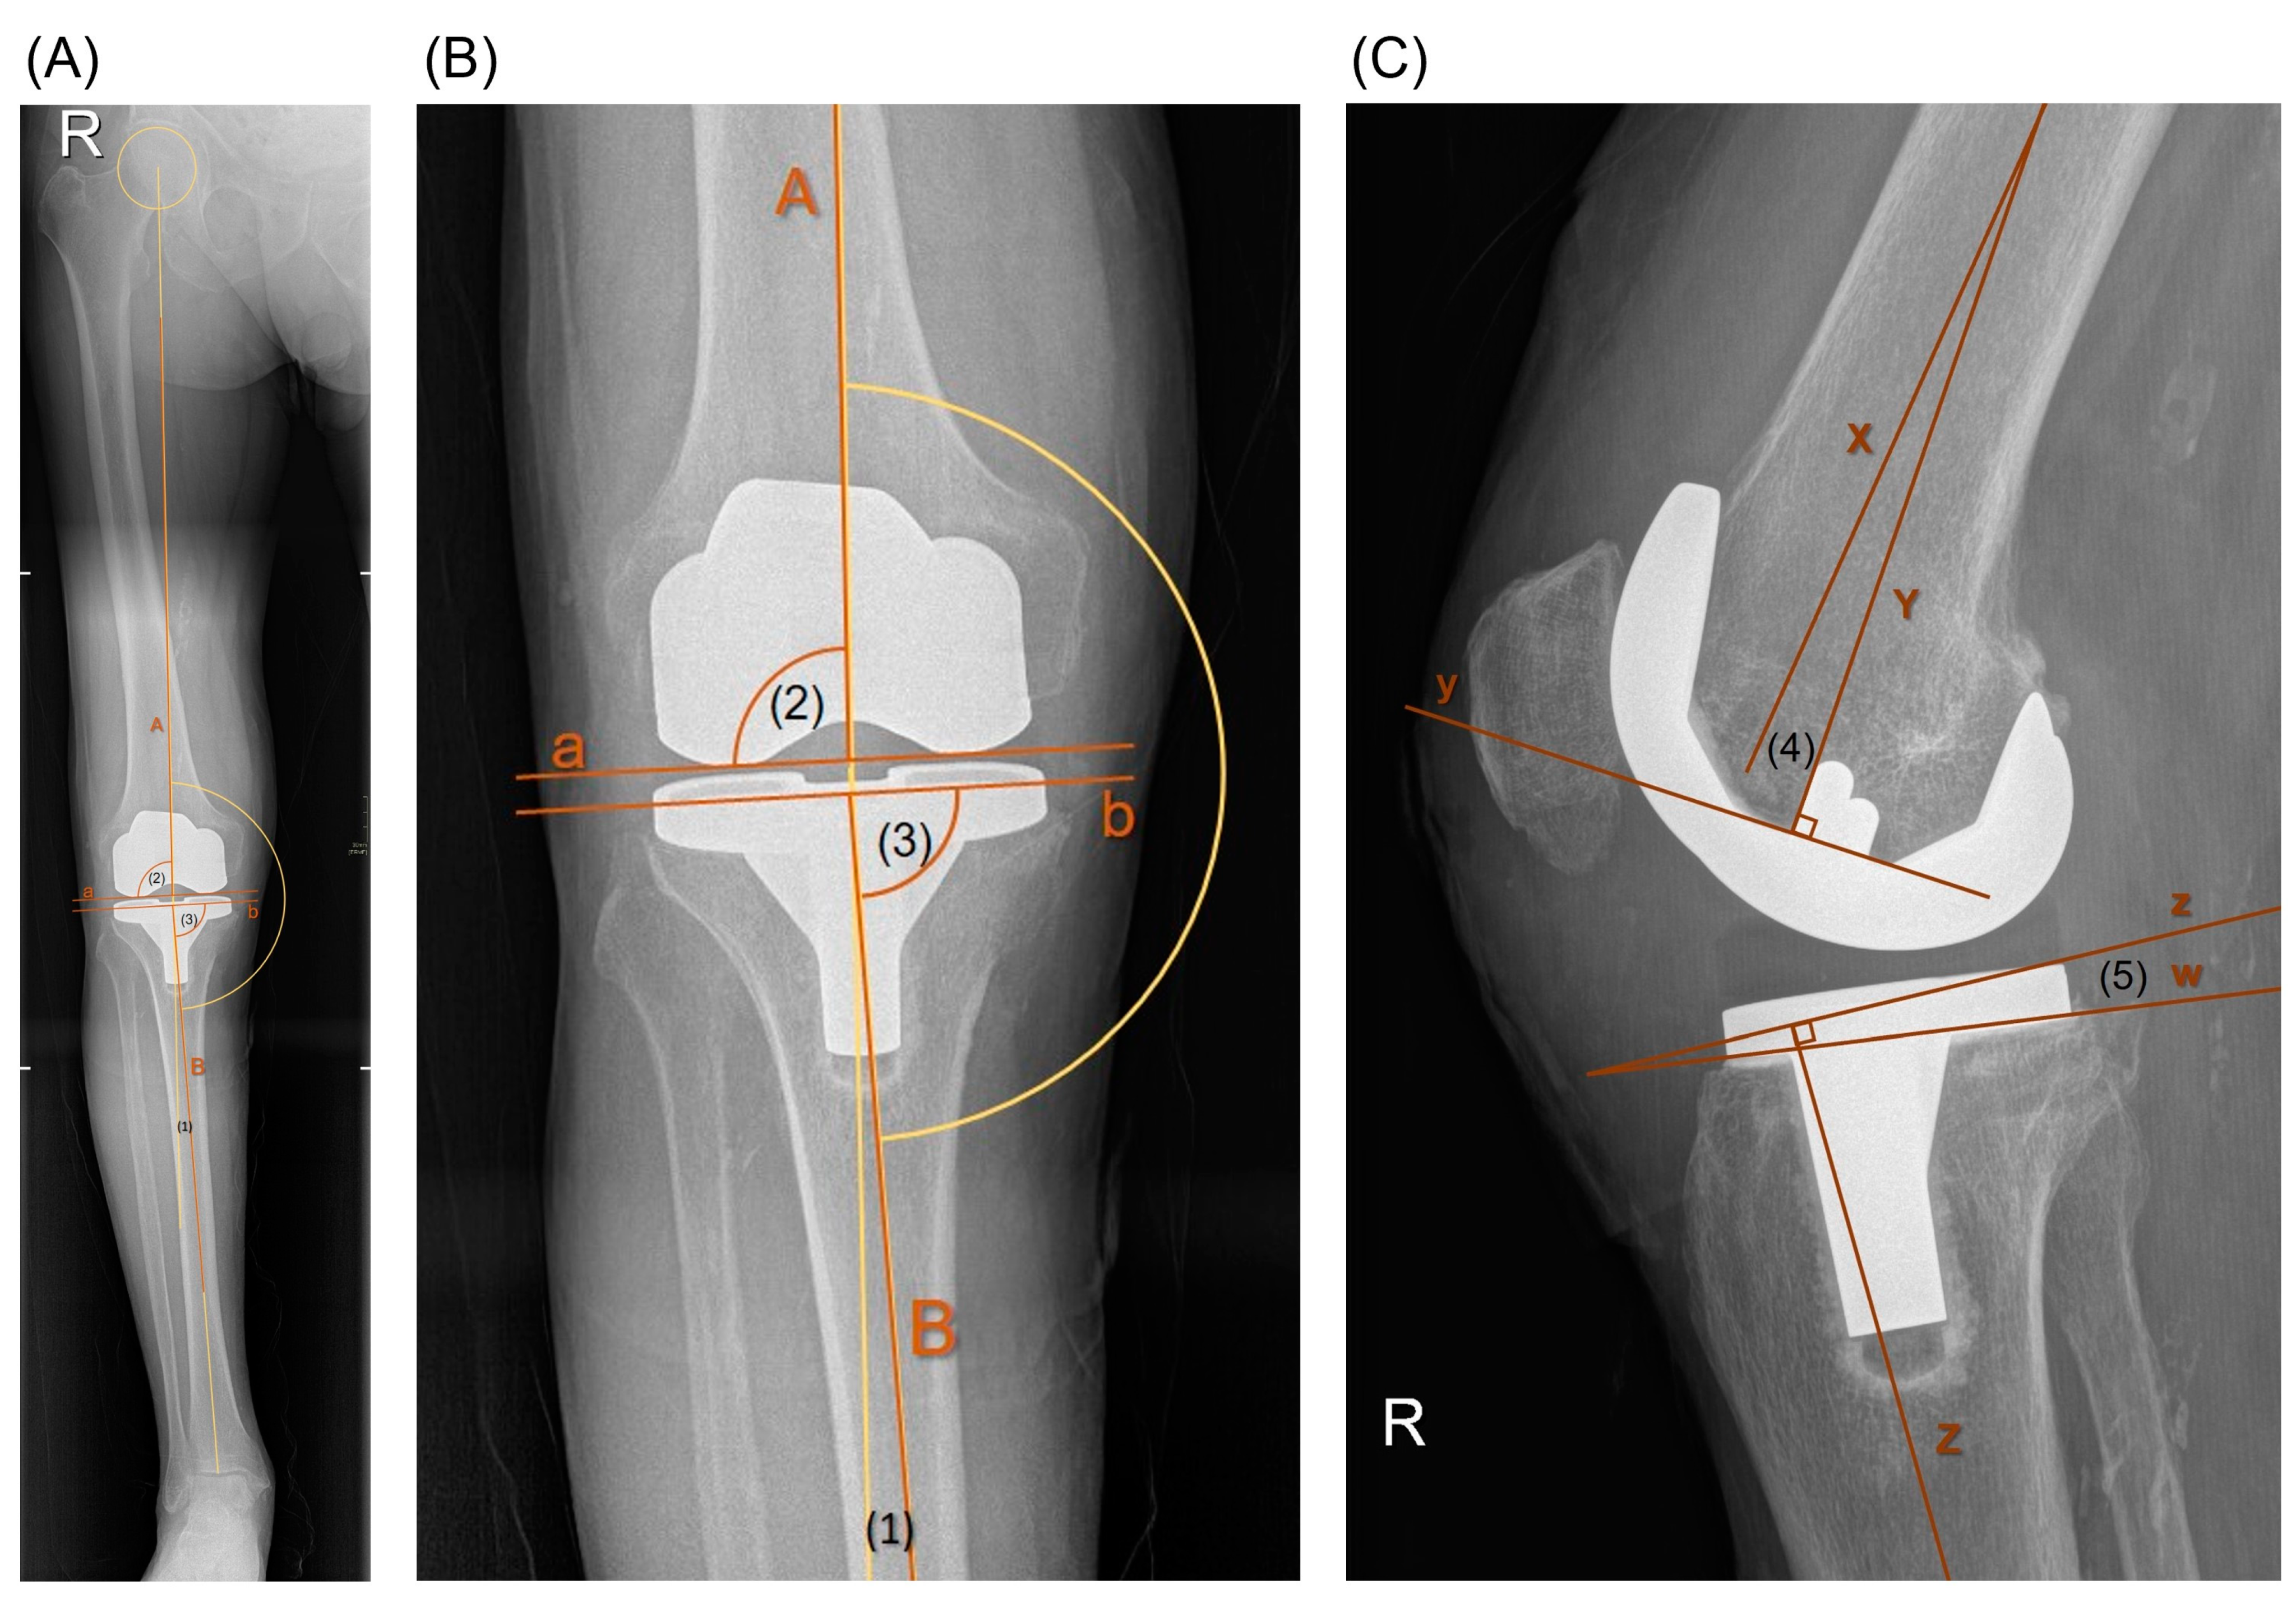
2.6. Radiological Assessment

Radiological diagnostic studies were conducted using the Enterprise Imaging 8.2.0.140 software (AGFA HealthCare, 2640 Mortsel, Belgium) on long-leg standing anteroposterior (AP) and standard short film lateral knee view [37]. Alignment and component positioning were assessed based on HKAA, mLDFA, MPTA, DFFA, and TS (refer to Figure 4).

2.7. Microscopic Analysis of Retrieved Inserts

Selected inserts were analyzed for visual wear patterns and damage using a digital microscope (ZEISS Smartzoom 5, Carl Zeiss AG, Oberkochen, Baden-Württemberg, Germany) and a scanning electron microscope (SEM) (Thermo Fisher Quanta 650 ESEM, Thermo Fisher Scientific Inc., Waltham, MA, USA). For SEM analysis, an ETD (Everhart-Thornley detector) was used in secondary electron (SE) mode with an acceleration voltage of 10 kV. Before the analysis, inserts were coated with a 15 nm thick carbon layer to prevent charging and improve imaging.

2.8. Statistical Analysis

Categorical variables were summarized using frequencies and percentages, while continuous variables were summarized using means and standard deviation (SD) or, in cases of non-normality as tested by the Shapiro–Wilk test, using the median and interquartile range (IQR). Pearson’s correlational coefficient (R) with 95% confidence interval (CI) was used to estimate the association between linear or volumetric wear and time in situ. The associations between volumetric wear and causes for TKA failure were estimated using a multiple linear regression model adjusted for time in situ. Osteolysis and clinical loosening of the component as causes of TKA failure were merged into one variable with the following categories: both causes present, osteolysis alone (indicating osteolysis without clinical component loosening), and none of them. The other causes of TKA failure were included in a regression model as dichotomous (yes vs. no) variables. The differences in linear and volumetric wear rates according to nominal insert size (small vs. medium vs. large) and component size ratio (≤1 vs. >1) were tested using the Kruskal–Wallis test and the Mann–Whitney test, respectively. A p-value < 0.05 was considered statistically significant. Analysis was performed using R 4.3.2 (Foundation for Statistical Computing, Vienna, Austria) statistical software.

3. Results

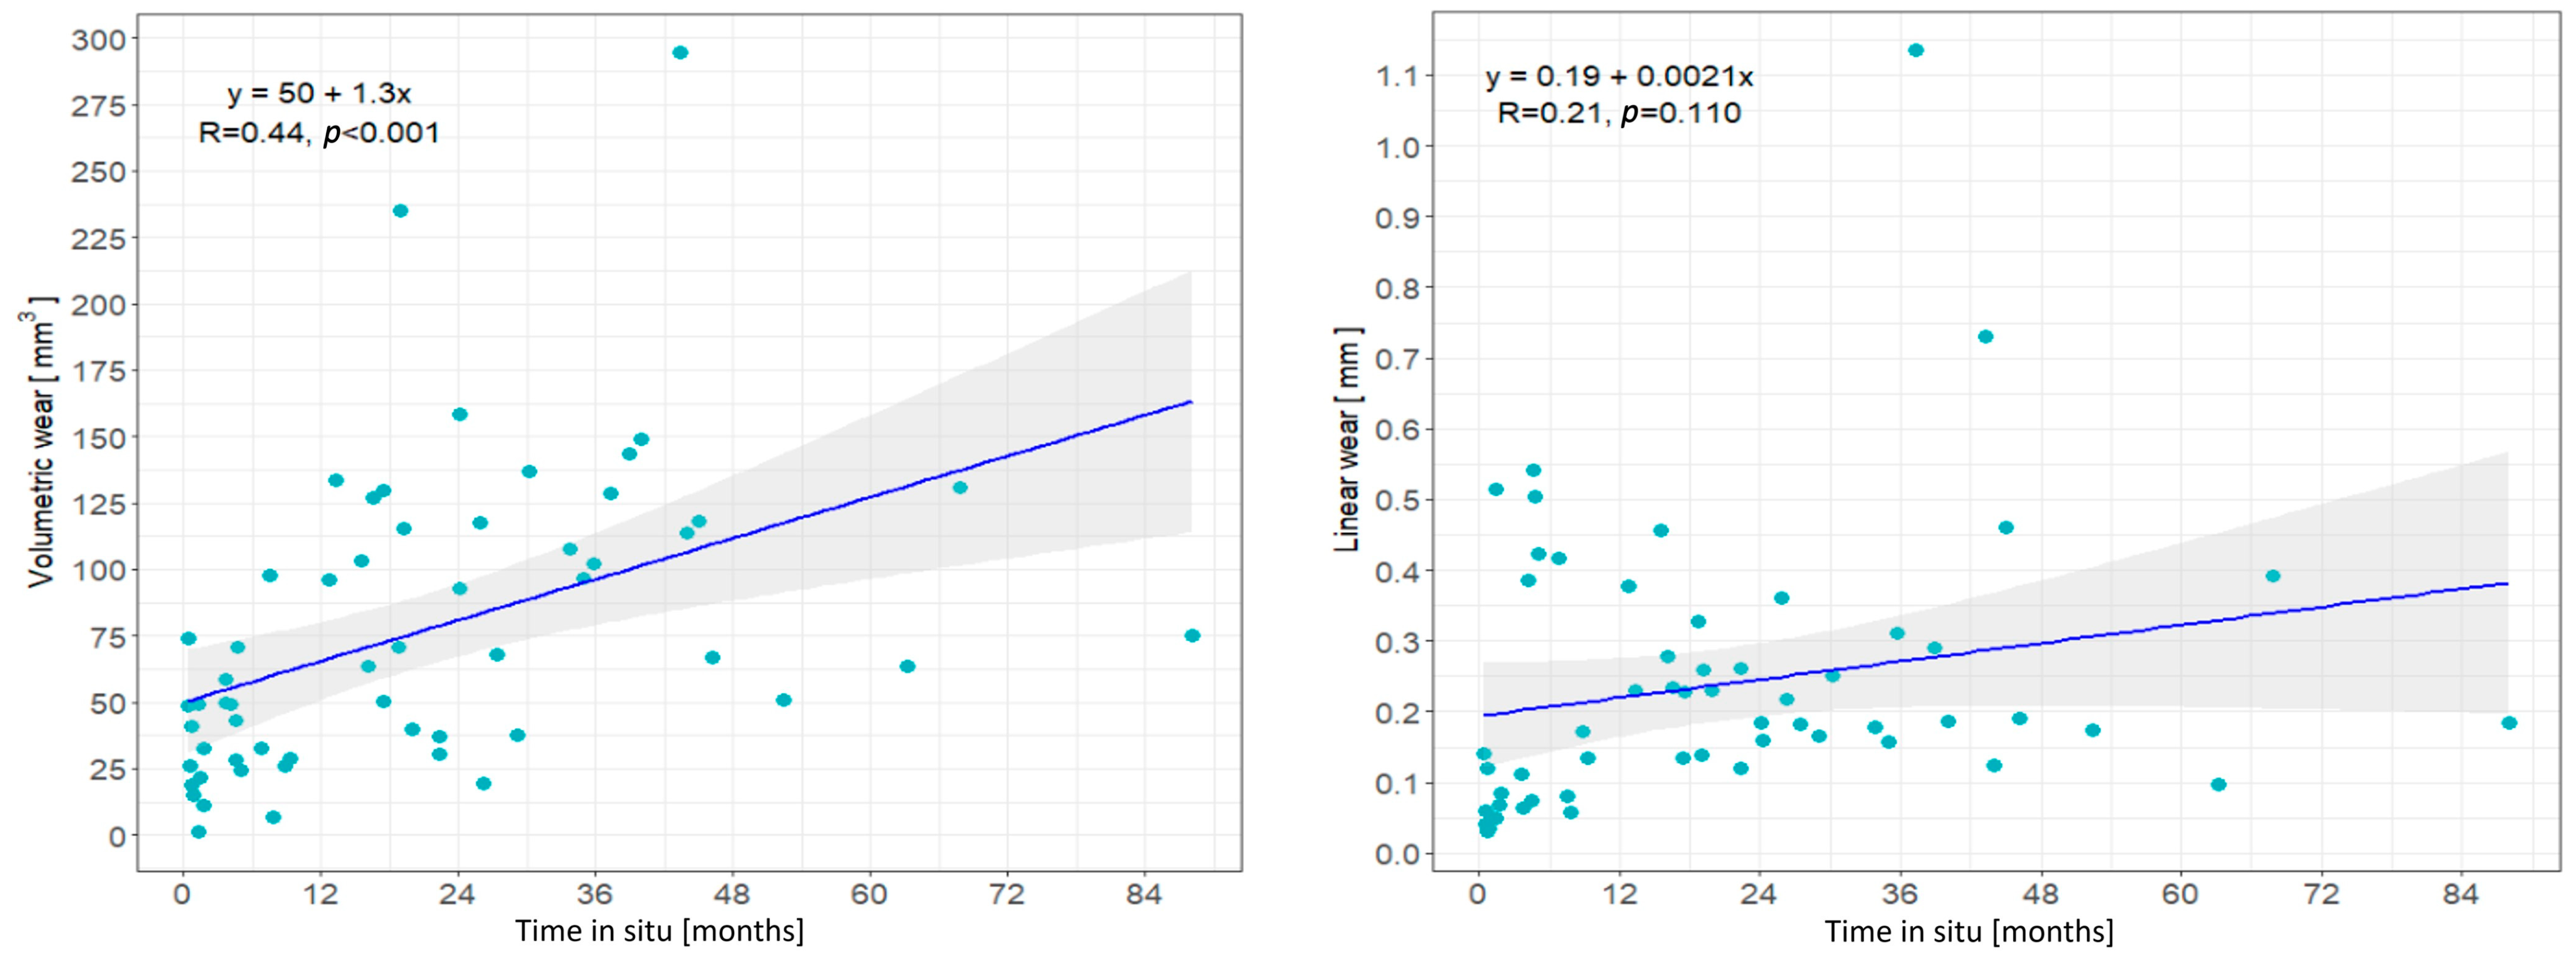
3.1. Patient Demographics, Insert Characteristics and Wear Correlation with Time In Situ

Articular load-bearing surface wears were computed for 57 inserts. The median scanning error was 9 (IQR 8–9) μm. The mean age of patients was 69.6 years and 57.9% were women. The median time in situ of inserts was 17.4 months. The median linear and volumetric wear were 0.18 mm and 63.7 mm3, respectively. Overall, 21.1% of inserts were categorized as small, 36.8% as medium and 42.1% as large. Moreover, 54.4% of inserts were categorized by nominal component size ratio as ≤1, while 45.6% were categorized as >1. Patient demographics and insert characteristics are presented in Table 2.
The relationship between linear wear and volumetric wear with time in situ is shown in Figure 5. There was a statistically significant correlation between volumetric wear and time in situ (R = 0.44, 95% CI 0.27–0.64, p < 0.001). The linear regression model demonstrated that the estimated initial volume loss at time 0 (intercept) was 50 mm3 (95% CI 30.3–69.8 mm3) and an average increase (slope) of 1.3 mm3 per month or 15.4 mm3 per year (95% CI 7–23.9 mm3), representing the volumetric wear rate. In contrast, the linear wear and time in situ were not significantly correlated (R = 0.21, 95% CI −0.03 to 0.43, p = 0.110). Additionally, the analysis of outliers was performed, and the results remained unchanged regarding statistical significance.

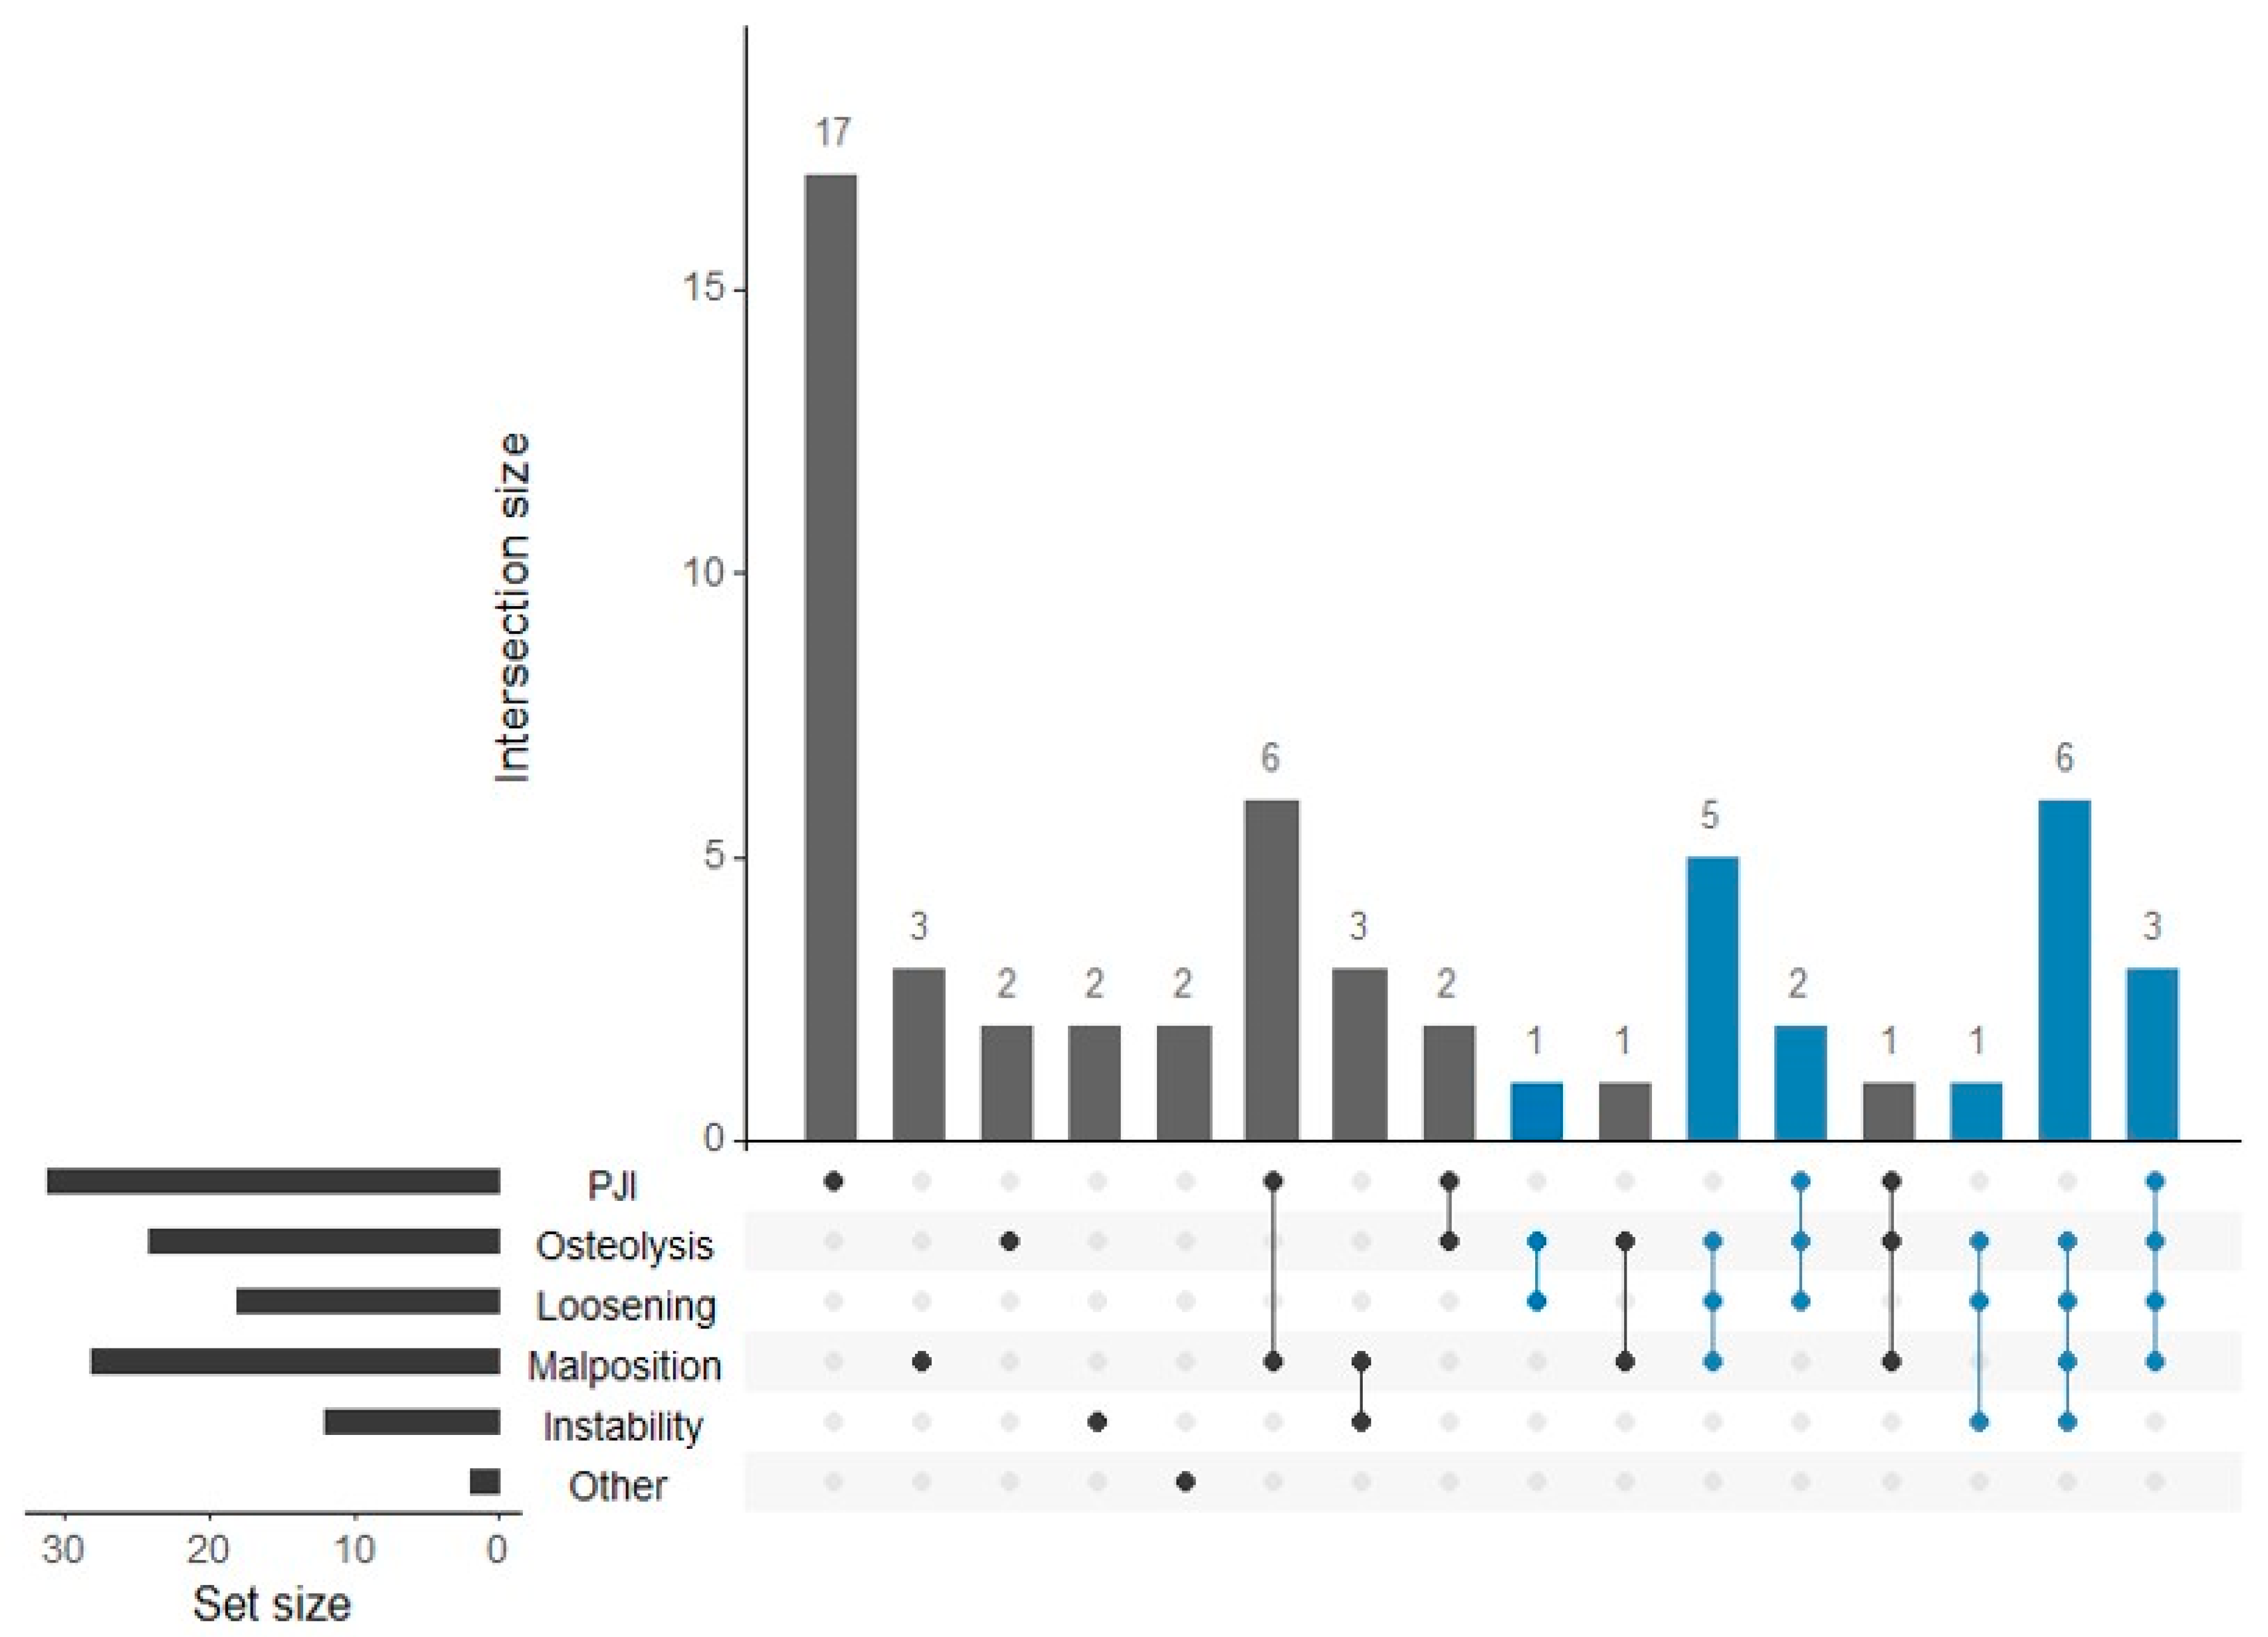
3.2. Distribution of TKA Failure Causes and Their Association with Volumetric Wear

After the identification of all possible causes of TKA failure within their respective groups, the following distribution was observed: 31 (54.3% out of 57) cases of confirmed PJI of which 11 (19.2%) were classified as early, 24 (42.1%) cases of osteolysis of which 6 (10.5%) cases were without concomitant component loosening, 18 (31.6%) cases of clinical loosening of the component (of which 13 cases or 72.2% were aseptic), 28 (49.1%) cases of joint malalignment or component malposition, 12 (21.1%) cases of instability (of which 10 cases or 83.3%) were recognized as mediolateral due to insufficiency of collateral ligaments), and 2 (3.5%) cases of other isolated causes (including instances of joint stiffness and patellofemoral pain). Due to the limited number of cases within the last group, it was underpowered for statistical analysis and thus excluded from further study. In 26 (45.6%) cases, a single detected cause of TKA failure was identified, while the rest exhibited multiple possible causes (2 in 13 (22.8%), 3 in 9 (15.8%) and 4 in 9 (15.8%) cases). The majority of single-cause cases were within the group of confirmed PJI (54.8%) (refer to Table 3 and Figure 6).
Notably, osteolysis was observed in all cases of clinical loosening of the component, while joint malalignment or component malposition was identified in 77.8% of cases within this group. Hence, the most common combination of causes of TKA failure was osteolysis with clinical loosening of the component and joint malalignment or component malposition (24.6%). Joint malalignment or component malposition was detected in 75.0% of cases of instability, whereas instability was identified in 32.1% of cases of joint malalignment or component malposition. Cases of confirmed PJI most commonly displayed concomitant joint malalignment or component malposition, observed in 32.3% of cases. In 79.2% of cases with varus or valgus malalignment, the location of maximum linear wear corresponded to the medial or lateral part of the insert, respectively.
The multivariate regression model with volumetric wear as the dependent variable showed a statistically significant association with variables time in situ (p = 0.013) and osteolysis with or without clinical loosening of a component (Table 4). Patients with identified osteolysis alone and those also with clinical loosening of the component had significantly higher volumetric wear when compared to those without both causes (p = 0.016 and p = 0.009, respectively). All other causes were not significantly associated with volumetric wear.

3.3. Wear Distribution Patterns

The threshold for binary image creation was determined to be 0.13 mm. To visualize wear patterns, an average binary image was created for each group of possible causes of TKA failure in a heatmap style. In this representation, the brightest areas indicate the highest frequency of considerable wear, whereas the darkest areas signify the lowest frequency of considerable wear in specific areas of the articular load-bearing surface. All inserts were normalized to the right knee, thus referring to the left part of the representation as medial and the right part as lateral. The results from the instability group differentiated from the others with a peripheral antero-posterior wear distribution (refer to Figure 7). In other groups, a characteristic pattern was not observed.

3.4. Comparison of Wear Rates Based on Insert Size and Component Size Ratio

Linear and volumetric wear rates were also compared based on the nominal insert size and component size ratio (femoral-to-insert) using the Kruskal–Wallis test and the Mann–Whitney test, respectively. The differences were not significant (nominal insert size: small vs. medium vs. large, p = 0.563 and p = 0.747, respectively; nominal component size ratio: ≤1 vs. >1, p = 0.885 and p = 0.055, respectively).

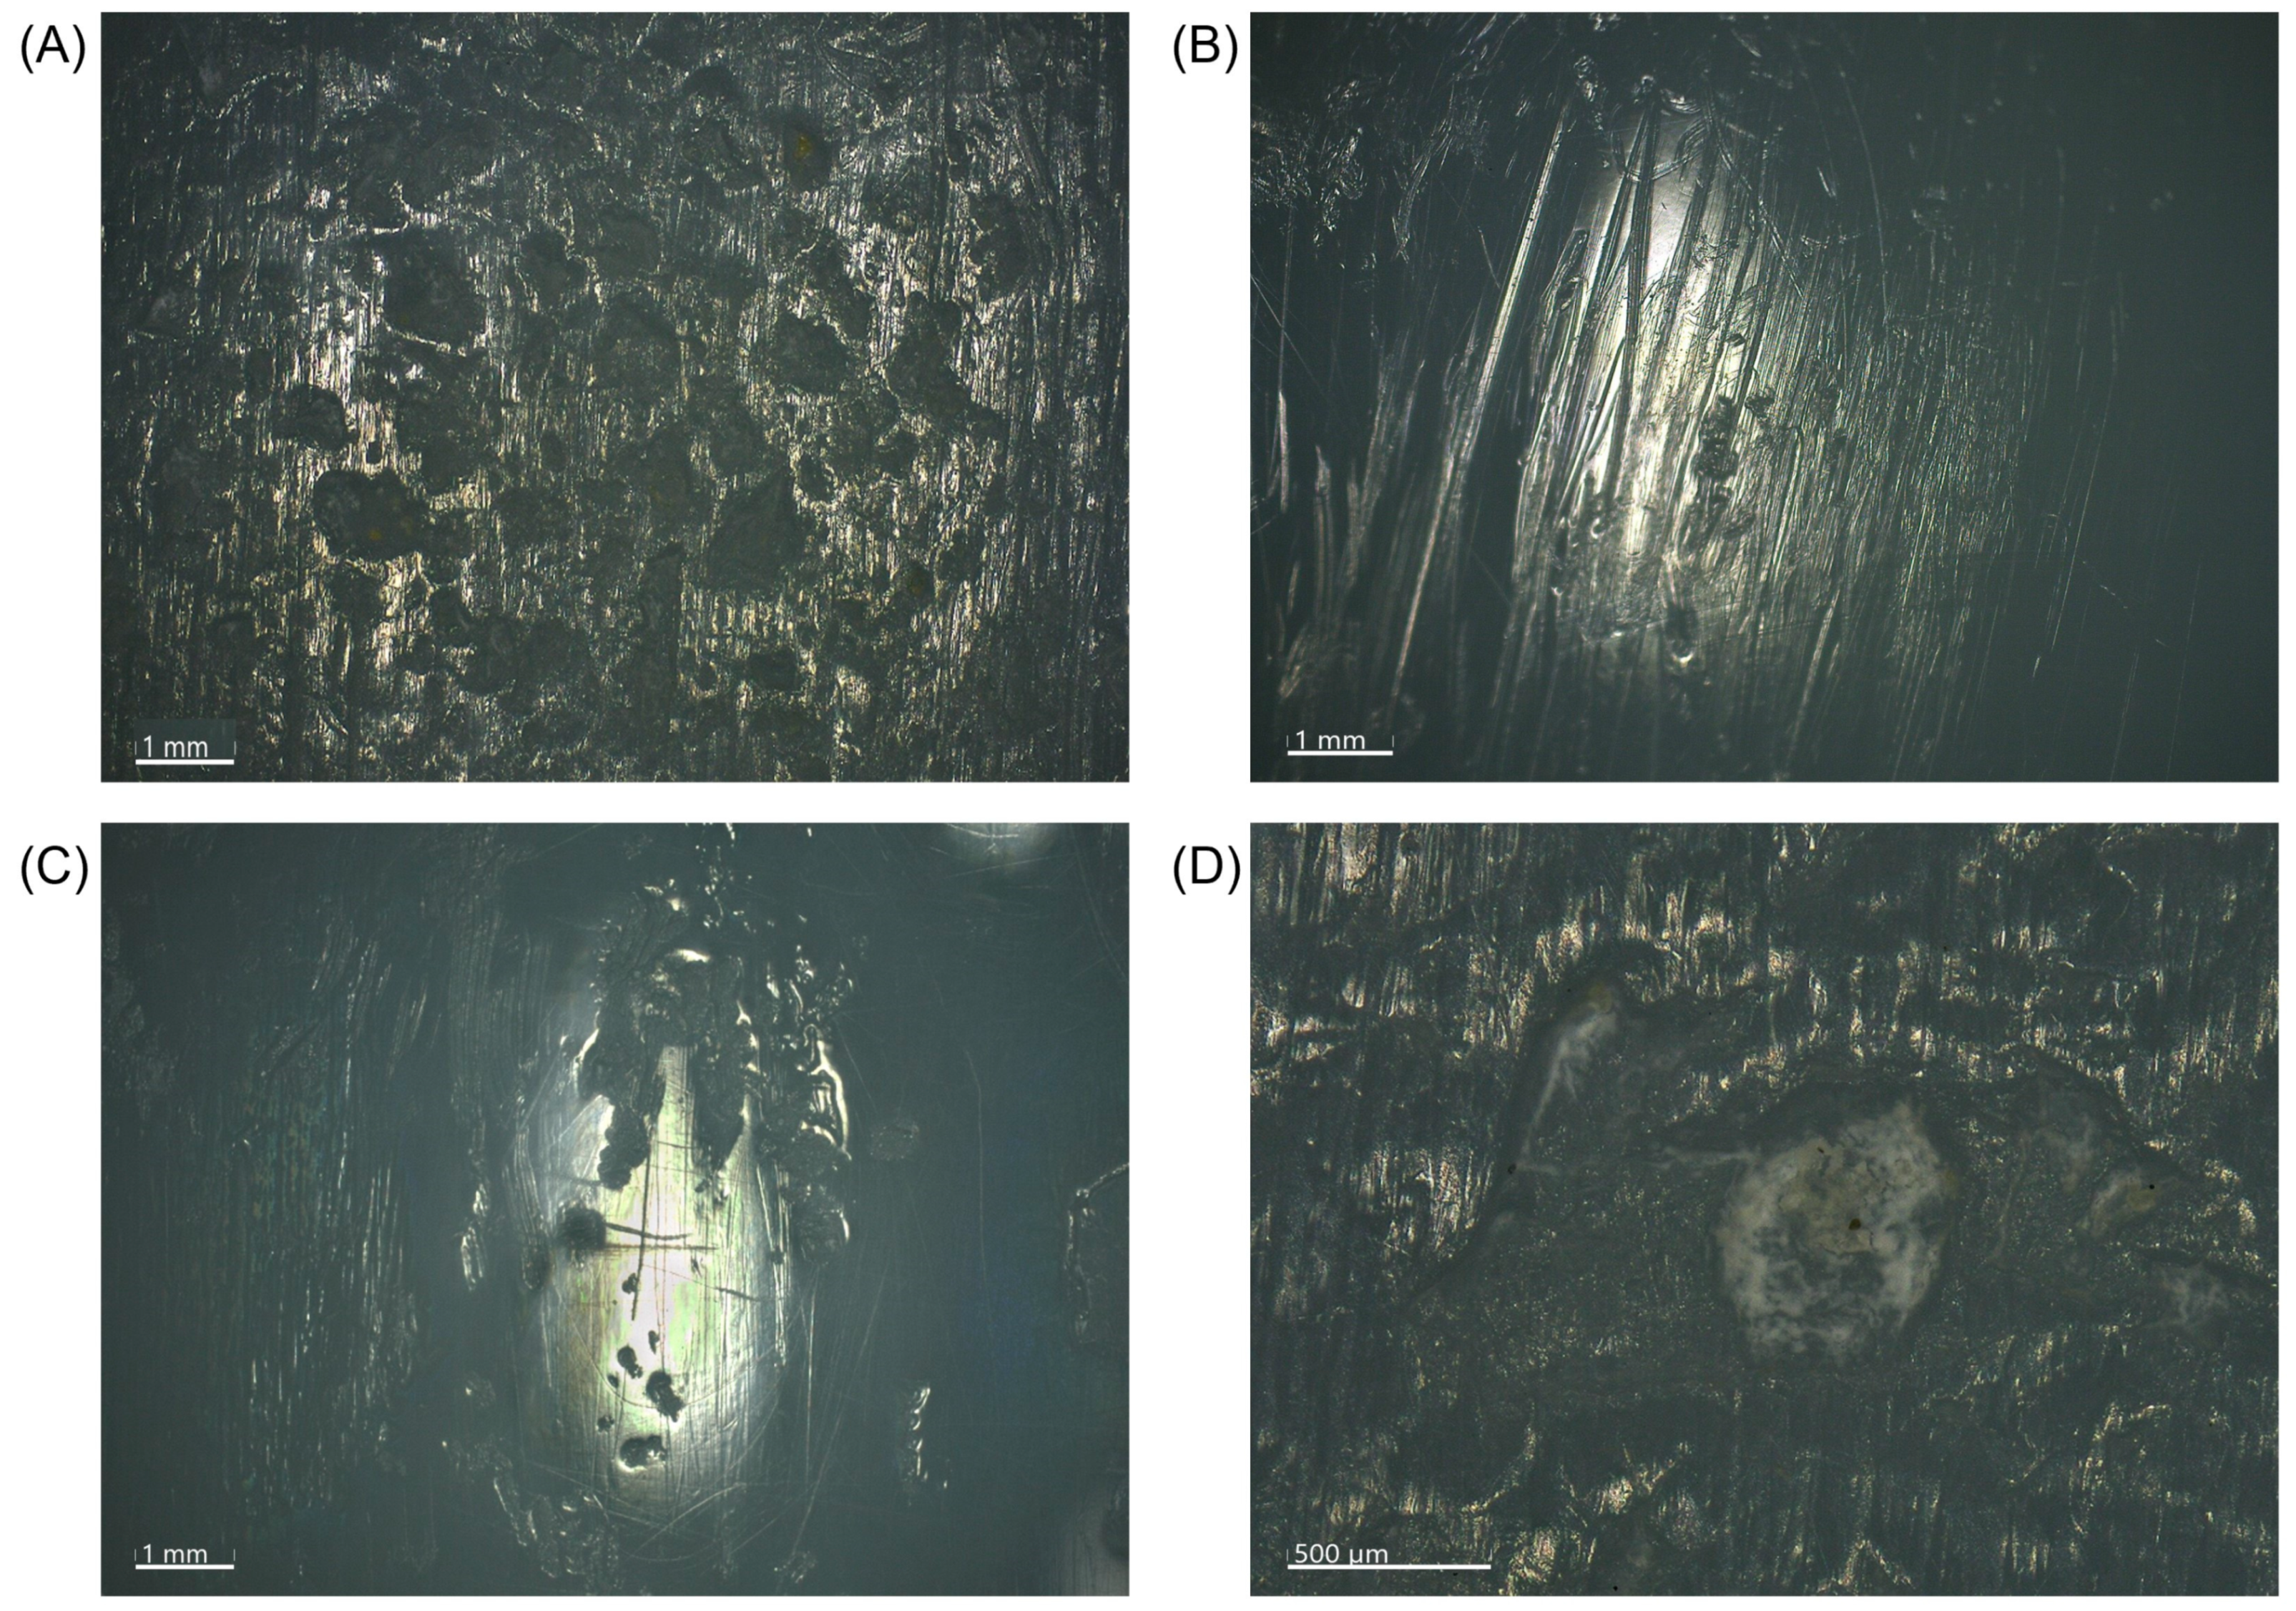
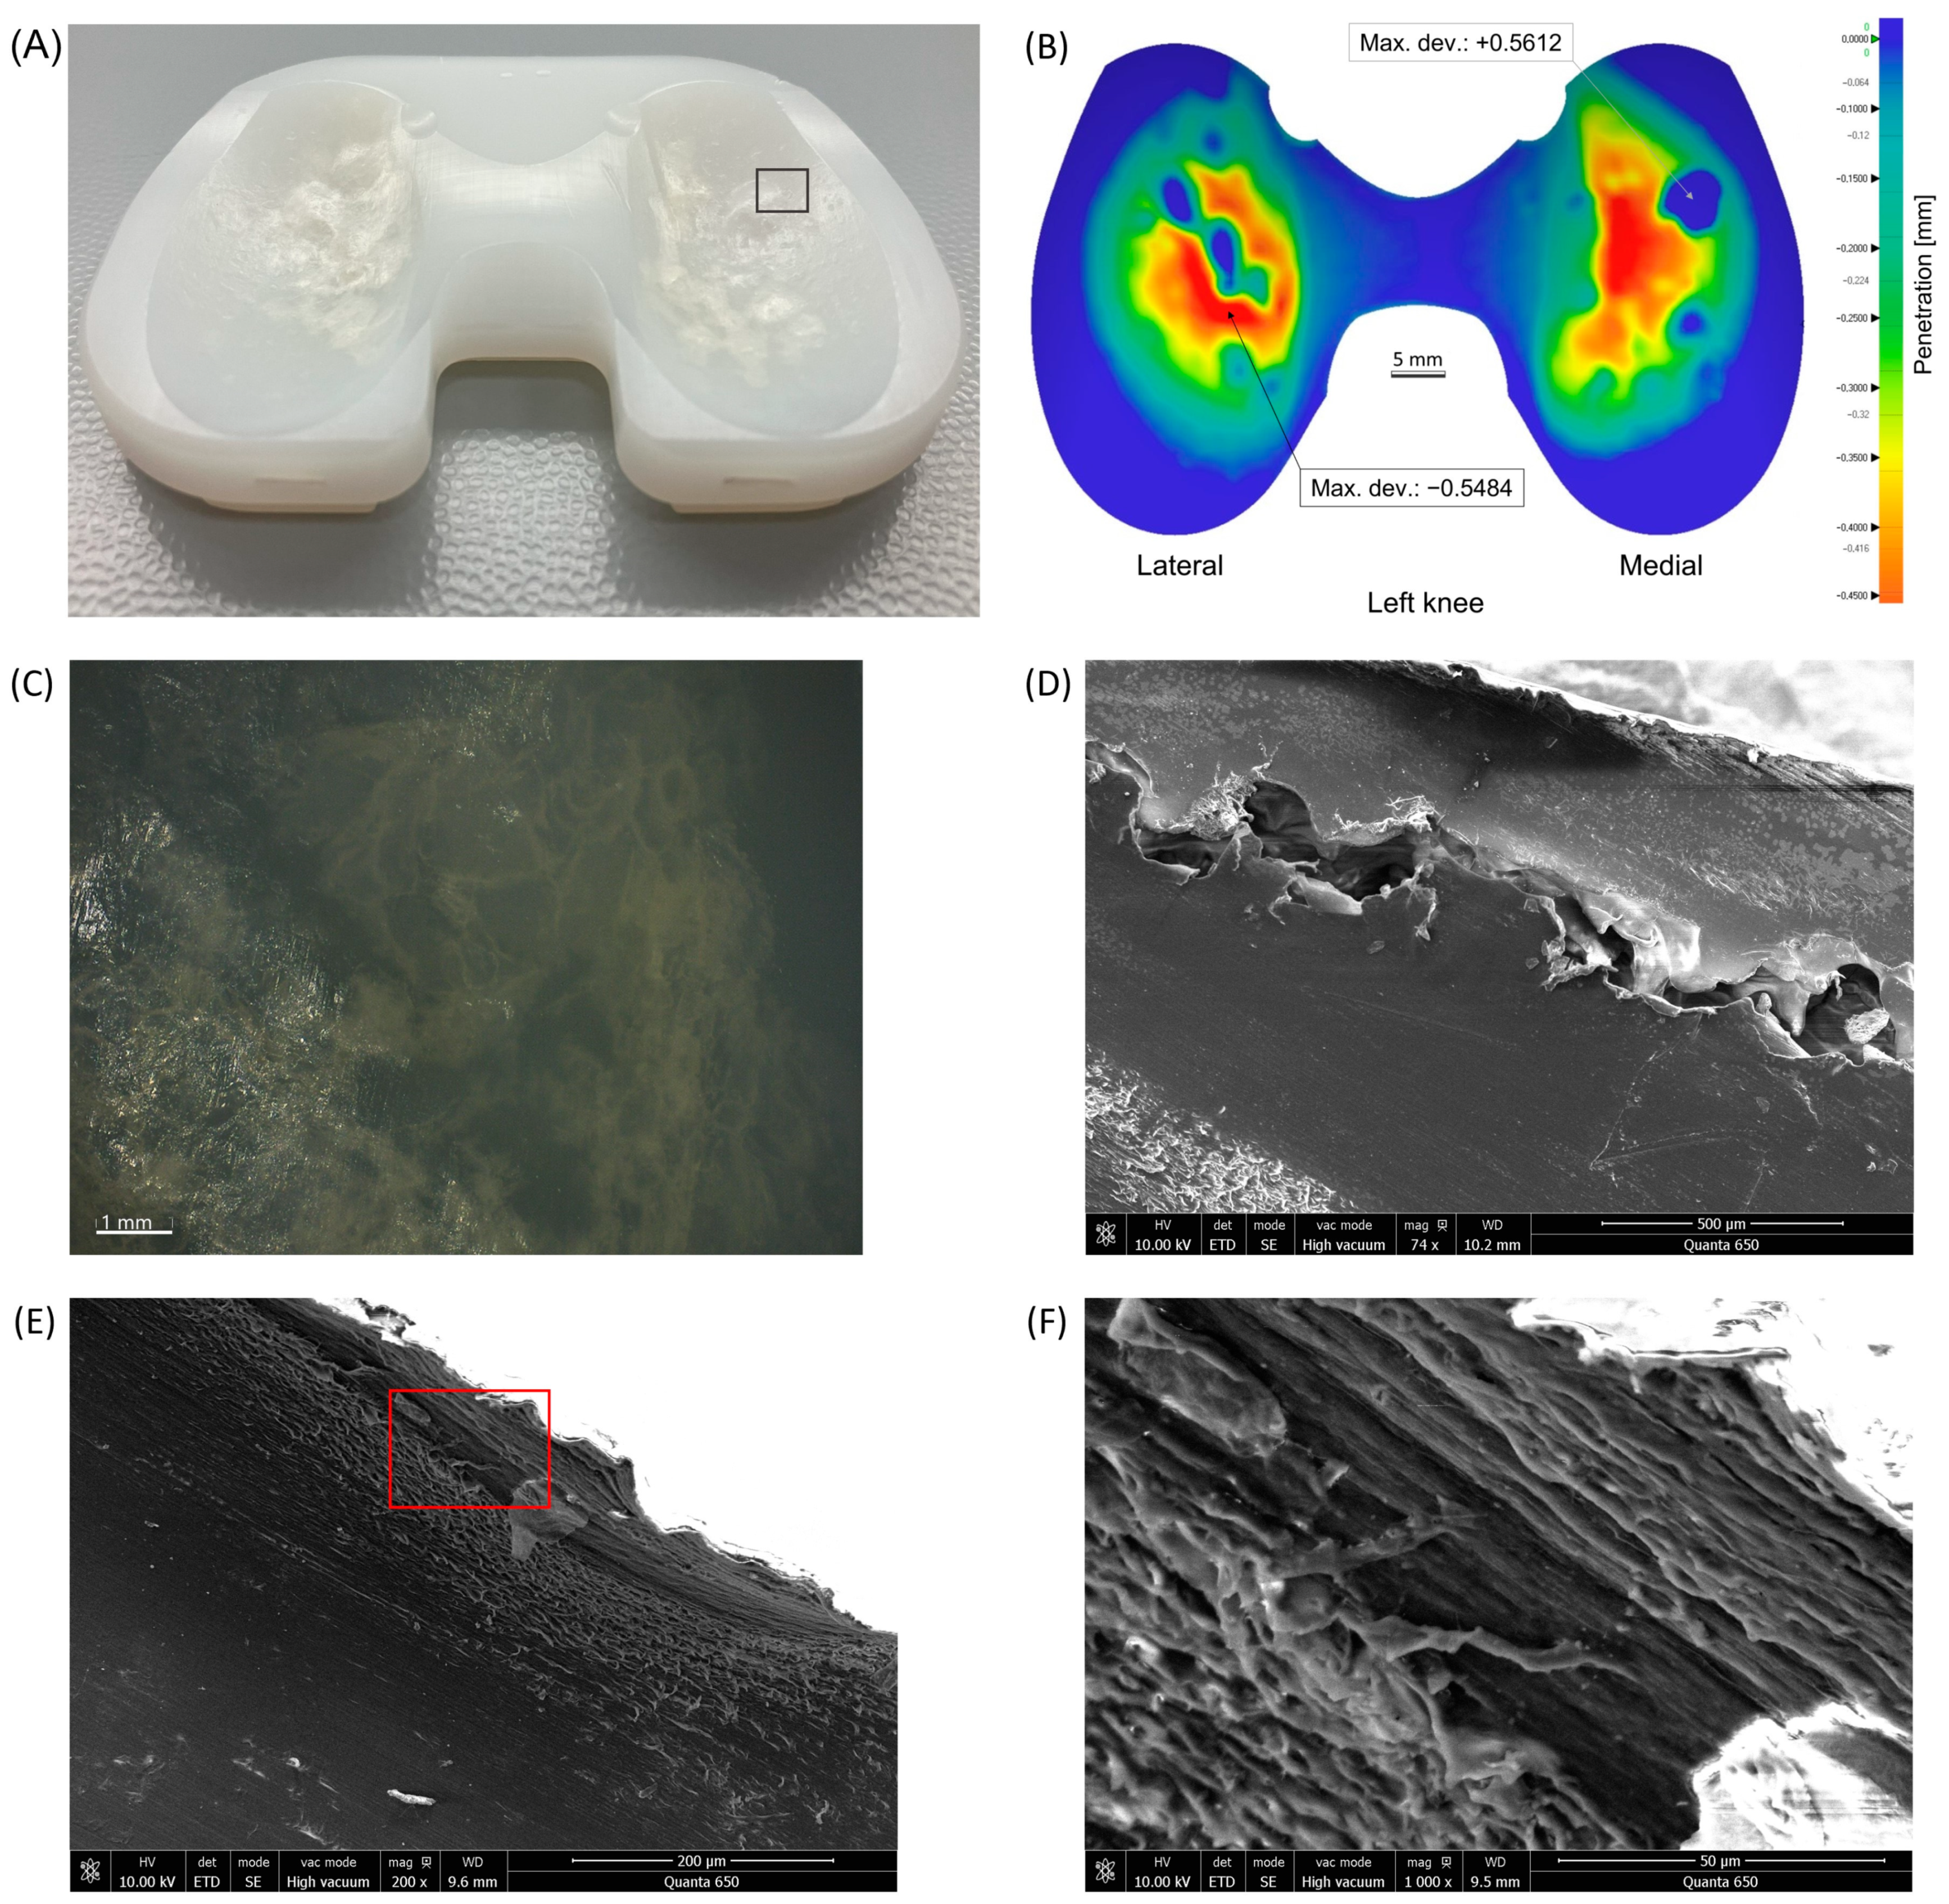
3.5. Microscopic Wear Patterns and Presentation of Excluded Inserts

Microscopic analysis of the articular load-bearing surfaces within our cohort demonstrated mainly abrasive and adhesive types of visual wear damage patterns, consisting of a combination of pitting, scratching, and burnishing. Only in individual cases, have we also noticed some embedded debris at the bottom of pits, that may represent bone cement Figure 8).
In two cases, considerably different types of damage were observed over the load-bearing areas, rendering appropriate volumetric wear calculations unfeasible; therefore, these two inserts were excluded from the analysis. In the first case, revision surgery was performed after 8.3 years in situ due to painful aseptic loosening of the tibial component and progressive joint varus alignment. The retrieved insert exhibited multiple protuberances on the central part of the articular load-bearing surfaces. Microscopic analysis revealed characteristic oxidation-related fatigue damage patterns, including layer separation and delamination (Figure 9).
In the second case, a notable discrepancy was observed across the entire edge and intercondylar portion of the load-bearing surface between the insert and its reference CAD model. This deviation is attributable to manufacturing reasons, given the very short time in situ of only 8 days and the revision surgery due to subcutaneous seroma (Figure 10).

4. Discussion

Our objectives were to determine whether volumetric wear (adjusted for time in situ) differs among groups of common causes of TKA failure, whether a group exhibits a characteristic wear distribution pattern, and also to investigate whether nominal insert size (small vs. medium vs. large) and component size ratio (femur-to-insert) influence linear and volumetric wear rates. The results of this study suggest that increased volumetric wear can be expected in cases with identified osteolysis alone and in combination with clinical loosening of a component. A characteristic combined peripheral anterior and posterior wear pattern has been discovered in instability cases. Lastly, nominal insert size and component size ratio seem not to influence linear and volumetric wear rates.
Increased wear or wear rates have been observed with longer time in vivo [31] and in cases where PE wear (including osteolysis) and loosening/subsidence were reported as reasons for revision [10], which is consistent with our findings. It is important to emphasize that component loosening rarely occurs without previous osteolysis, as osteolysis in the long term leads to bone loss, and finally the loosening of implants [40]. Consequently, we identified osteolysis in all of our cases with clinical loosening of a component. Highly cross-linked polyethylene (HXLPE), with its enhanced wear resistance, may theoretically be a better option for individuals with increased wear risk factors, such as male gender and younger age [10]. However, studies have shown that HXLPE did not improve clinical and radiographic outcomes after TKA [41,42,43]. Concerns remain regarding its mechanical properties compared to conventional UHMWPE, including reduced toughness, ductility, and fatigue resistance, making its benefits still controversial.
To our knowledge, a characteristic wear distribution pattern specific to a particular cause of failure has not yet been described. Interestingly, the instability-related peripheral anterior and posterior wear pattern appeared, even though the reported clinical instability was mediolateral in over 80% of the cases within the group. This could be explained by the increased valgus-varus laxity converting to an anteroposterior instability, leading to increased creep or wear in the anterior-posterior parts of the insert. Overall, the most prevalent wear pattern observed within our cohort exhibits a bias toward medial wear, which aligns with previous studies [16,32]. This can be attributed to the predominant varus knee malalignment (57.1% compared to 25.0% of valgus knees) within the group of joint malalignment or component malposition. Additionally, nearly 90% of cases in this group were also part of at least one other group of the most common causes of TKA failure, further contributing to these results. Monitoring patients with early signs of osteolysis and/or instability allows for timely interventions, potentially improving long-term outcomes.
There is a lack of information on whether insert size and component size ratios influence articular-side wear. In our study, neither feature appeared to be significant to the extent of wear. On the other hand, in a similar study, backside wear scores were significantly higher in medium compared to large insert sizes [31]. Factors like patient weight, activity level, or other biomechanical conditions could interact with component size in ways not fully reflected in our data. For example, larger components may behave differently under extreme conditions, such as in heavier or more active patients. Future studies could explore these potential interactions by examining larger cohorts and assessing how these variables collectively impact wear rates.
Describing wear in terms of dimensional change may encompass the plastic deformation (creep or bedding-in) of the PE bearings [44] in calculating wear (material loss) [45]. However, volumetric wear measurements provide a more accurate representation of material loss compared to qualitative surface damage appearance [26]. Moreover, this measurement is a key determinant of the number of polyethylene (PE) particles generated, which contribute to the osteolytic process. It is important to mention that third-body debris (bone, bone cement, and metal particles) remains a contributor to total wear through abrasive wear mechanisms [46,47].
Due to the inclusion of inserts failing with short time in situ, calculating wear rates (per year) would be overestimated [48]. Nonetheless, comparisons of volumetric wear between groups were adjusted for time in situ. Considerable volume loss was observed in inserts with a short time in situ, most probably attributed to creep. Simulator tests have demonstrated that the majority of creep occurs during the initial millions of cycles [49,50]. The estimated average increase in volume loss or wear of 15.4 mm3 per year, as determined by a linear regression model, was similar to previously published results [25,26,31].
Our analysis indicates that, particularly in aseptic cases, more causes in conjunction lead to unsuccessful TKA and eventual revision surgery. Consequently, we advise arthroplasty registries to report all of them. This would give a more detailed insight into the multifactorial process of TKA failure.
Study strengths include a completely homogeneous cohort of implants comprising a single type of UMHWPE insert and set of combined components (including wear-decreasing polished tibial tray surface [19]), along with a retrospective analysis of prospectively collected data sourced from an established institutional register of arthroplasty [33]. Each case of failure has been thoroughly reviewed for potential additional factors contributing to TKA failure. Long-leg standing radiographs enabled the assessment of medial/lateral wear distribution in cases of varus/valgus malalignment. Three-dimensional optical scanning has proven a simple, rapid, and precise method for analyzing wear in retrieved inserts, ensuring the reliable reconstruction and presentation of a penetration wear map [51,52]. In our study, wear was analyzed only on the insert load-bearing areas. This approach minimizes the potential bias in volume loss that may arise from damage to other articular areas, such as deformations produced during insert extraction. However, these damages on the analyzed surface may have still influenced our results, particularly regarding linear wear, which may explain the unexpected absence of correlation with time in situ [10,32]. This damage can sometimes be more obvious, particularly in cases with a short time in situ. However, due to the general uncertainty of the etiology of these changes, all maximal linear wear points on the articular load-bearing surface were considered. Consequently, it seems plausible that our data showed no statistically significant correlation between linear wear and time in situ due to a 0-time intercept of approximately 200 μm and no lower.
On the other hand, our study has several limitations. As a retrospective analysis of implant retrievals, there is an inherent risk of selection bias, particularly since the types of implants retrieved may not be representative of the broader population of well-functioning devices in use. Furthermore, the variability in patient-specific factors, such as activity level, and individual biomechanics, may influence wear and cannot be fully controlled in this study. We lacked information regarding the level of physical activity among patients after primary TKA implantation. However, a recent meta-analysis found no association between high physical activity levels and an increased risk of revision surgery during the first twelve years post-TKA [53]. The analysis in this study was limited to the articular surface. Backside wear could not be properly analyzed with the scanning technique because the insert locking tabs, damaged by extraction, often did not allow the scanning of covered parts. A recent simulator study involving similar conventional UHMWPE CR-type inserts estimated that backside damage contributes to up to 20% of the total wear of the insert [54]. However, it should be noted that the authors analyzed inserts with central dovetail locking mechanisms mounted on non-polished tibial trays, two factors previously identified to increase the extent of backside wear [28]. While our cohort size was relatively small, it is consistent with previous research focused on a single PE insert [19,23,26,31]. Findings may not be generalizable as only one implant design was investigated. Nonetheless, the results could potentially extend to other CR TKA designs. During the radiological assessment, we also examined for potential rotational malposition of components on CT scans [55]. However, this investigation was conducted only in a limited number of cases. We were unable to obtain information regarding the manufacturing tolerance, which refers to the dimensional variability between the CAD model and the real insert after manufacturing. As presented, such discrepancies could have significant implications when utilizing our method or a similar approach for wear analysis, particularly when relying on CAD models or unworn, new inserts [22] as references. An optimal superimposition of images could not be achieved because of the variability in the shape of articular load-bearing areas among different insert sizes, including thicknesses. Nevertheless, significant marginal damage remained visible.
A novel aspect of this study involves the detection methodology and presentation of wear distribution patterns per identified cause of TKA failure. This significant 3D upgrade to established quantitative retrieval polyethylene analysis provides a deeper insight into TKA wear mechanisms in relation to clinical circumstances. Moreover, it has the potential to aid in diagnostically demanding cases and to guide future improvements in implant designs.

5. Conclusions

Our findings indicate a significant increase in volumetric wear in cases where osteolysis was present alone, with an even greater increase observed when it was combined with clinical loosening of the component, compared to other common causes of TKA failure. A characteristic peripheral anterior and posterior wear pattern has been shown in the instability group. Reporting all contributing causes in arthroplasty registries is essential for gaining a comprehensive understanding of the multifactorial nature of TKA failure, especially in aseptic cases.

Author Contributions

Conceptualization, M.V., I.M. and R.T.; methodology, M.V., I.M., V.L., M.B., J.K. and R.T.; software, M.B. and J.K.; validation, I.M., E.P., J.K. and R.T.; formal analysis, M.V., M.B., E.P. and J.K.; investigation, M.V., I.M., V.L. and R.T.; resources, I.M., V.L., J.K. and R.T.; data curation, M.V. and J.K.; writing—original draft preparation, M.V.; writing—review and editing, I.M., V.L., M.B., E.P. and R.T.; visualization, M.V., M.B. and J.K.; supervision, I.M. and R.T.; project administration, M.V.; All authors have read and agreed to the published version of the manuscript.

Funding

This research received no external funding.

Institutional Review Board Statement

The study was conducted in accordance with the Declaration of Helsinki and approved by the Institutional Review Board (or Ethics Committee) of Valdoltra Orthopedic Hospital (protocol code 1/2022; 21 February 2022).

Informed Consent Statement

Not applicable.

Data Availability Statement

The data presented in this study are available upon request from the corresponding author. The data are not publicly available due to technical reasons.

Acknowledgments

The authors would like to thank DePuy Synthes (DePuy International Ltd, Leeds, LS11 8DT, UK) for providing the CAD models as support for the study and Barbara Kapun, BSc, of the Jožef Stefan Institute, for conducting the microscopic analysis of the inserts. Acknowledgements are also extended to the Center of Electron Microscopy and Microanalysis (CEMM) and the Department of Thin Films and Surfaces at the Jožef Stefan Institute for the use of their microscopes.

Conflicts of Interest

The authors declare no conflicts of interest.

References

  1. Shichman, I.; Roof, M.; Askew, N.; Nherera, L.; Rozell, J.C.; Seyler, T.M.; Schwarzkopf, R. Projections and Epidemiology of Primary Hip and Knee Arthroplasty in Medicare Patients to 2040–2060. JBJS Open Access 2023, 8, e22. [Google Scholar] [CrossRef] [PubMed]
  2. Choi, Y.-J.; Ra, H.J. Patient Satisfaction after Total Knee Arthroplasty. Knee Surg. Relat. Res. 2016, 28, 1–15. [Google Scholar] [CrossRef] [PubMed]
  3. Clement, N.D.; Bardgett, M.; Weir, D.; Holland, J.; Gerrand, C.; Deehan, D.J. The Rate and Predictors of Patient Satisfaction after Total Knee Arthroplasty Are Influenced by the Focus of the Question: A Standard Satisfaction Question Is Required. Bone Jt. J. 2018, 100-B, 740–748. [Google Scholar] [CrossRef] [PubMed]
  4. Delanois, R.E.; Mistry, J.B.; Gwam, C.U.; Mohamed, N.S.; Choksi, U.S.; Mont, M.A. Current Epidemiology of Revision Total Knee Arthroplasty in the United States. J. Arthroplast. 2017, 32, 2663–2668. [Google Scholar] [CrossRef] [PubMed]
  5. Dossett, H.G. Machine Learning: The Future of Total Knee Replacement. Fed. Pract. 2022, 39, 62. [Google Scholar] [CrossRef]
  6. Khan, M.; Osman, K.; Green, G.; Haddad, F.S. The Epidemiology of Failure in Total Knee Arthroplasty: Avoiding Your next Revision. Bone Jt. J. 2016, 98-B, 105–112. [Google Scholar] [CrossRef]
  7. Postler, A.; Lützner, C.; Beyer, F.; Tille, E.; Lützner, J. Analysis of Total Knee Arthroplasty Revision Causes. BMC Musculoskelet. Disord. 2018, 19, 55. [Google Scholar] [CrossRef]
  8. Naudie, D.D.R.; Ammeen, D.J.; Engh, G.A.; Rorabeck, C.H. Wear and Osteolysis Around Total Knee Arthroplasty. J. Am. Acad. Orthop. Surg. 2007, 15, 53–64. [Google Scholar] [CrossRef]
  9. Gallo, J.; Goodman, S.B.; Konttinen, Y.T.; Wimmer, M.A.; Holinka, M. Osteolysis around Total Knee Arthroplasty: A Review of Pathogenetic Mechanisms. Acta Biomater. 2013, 9, 8046–8058. [Google Scholar] [CrossRef]
  10. Currier, J.H.; Currier, B.H.; Abdel, M.P.; Berry, D.J.; Titus, A.J.; Van Citters, D.W. What Factors Drive Polyethylene Wear in Total Knee Arthroplasty?: Results of a Large Retrieval Series. Bone Jt. J. 2021, 103-B, 1695–1701. [Google Scholar] [CrossRef]
  11. Li, S.; Scuderi, G.; Furman, B.D.; Bhattacharyya, S.; Schmieg, J.J.; Insall, J.N. Assessment of Backside Wear From the Analysis of 55 Retrieved Tibial Inserts. Clin. Orthop. 2002, 404, 75–82. [Google Scholar] [CrossRef] [PubMed]
  12. Conditt, M.A.; Thompson, M.T.; Usrey, M.M.; Ismaily, S.K.; Noble, P.C. Backside Wear of Polyethylene Tibial Inserts: Mechanism and Magnitude of Material Loss. J. Bone Jt. Surg. 2005, 87, 326–331. [Google Scholar] [CrossRef]
  13. Ho, F.-Y.; Ma, H.-M.; Liau, J.-J.; Yeh, C.-R.; Huang, C.-H. Mobile-Bearing Knees Reduce Rotational Asymmetric Wear. Clin. Orthop. 2007, 462, 143–149. [Google Scholar] [CrossRef] [PubMed]
  14. Garcia, R.M.; Kraay, M.J.; Messerschmitt, P.J.; Goldberg, V.M.; Rimnac, C.M. Analysis of Retrieved Ultra–High-Molecular-Weight Polyethylene Tibial Components From Rotating-Platform Total Knee Arthroplasty. J. Arthroplast. 2009, 24, 131–138. [Google Scholar] [CrossRef] [PubMed]
  15. Lu, Y.-C.; Huang, C.-H.; Chang, T.-K.; Ho, F.-Y.; Cheng, C.-K.; Huang, C.-H. Wear-Pattern Analysis in Retrieved Tibial Inserts of Mobile-Bearing and Fixed-Bearing Total Knee Prostheses. J. Bone Jt. Surg. Br. 2010, 92-B, 500–507. [Google Scholar] [CrossRef]
  16. Srivastava, A.; Lee, G.Y.; Steklov, N.; Colwell, C.W.; Ezzet, K.A.; D’Lima, D.D. Effect of Tibial Component Varus on Wear in Total Knee Arthroplasty. Knee 2012, 19, 560–563. [Google Scholar] [CrossRef]
  17. Knowlton, C.B.; Wimmer, M.A. An Autonomous Mathematical Reconstruction to Effectively Measure Volume Loss on Retrieved Polyethylene Tibial Inserts. J. Biomed. Mater. Res. B Appl. Biomater. 2012, 101, 449–457. [Google Scholar] [CrossRef]
  18. Wimmer, M.A.; Laurent, M.P.; Haman, J.D.; Jacobs, J.J.; Galante, J.O. Surface Damage Versus Tibial Polyethylene Insert Conformity: A Retrieval Study. Clin. Orthop. Relat. Res. 2012, 470, 1814–1825. [Google Scholar] [CrossRef]
  19. Berry, D.J.; Currier, J.H.; Mayor, M.B.; Collier, J.P. Knee Wear Measured in Retrievals: A Polished Tray Reduces Insert Wear. Clin. Orthop. Relat. Res. 2012, 470, 1860–1868. [Google Scholar] [CrossRef]
  20. Stoner, K.; Jerabek, S.A.; Tow, S.; Wright, T.M.; Padgett, D.E. Rotating-Platform Has No Surface Damage Advantage Over Fixed-Bearing TKA. Clin. Orthop. Relat. Res. 2013, 471, 76–85. [Google Scholar] [CrossRef]
  21. Paterson, N.R.; Teeter, M.G.; MacDonald, S.J.; McCalden, R.W.; Naudie, D.D.R. The 2012 Mark Coventry Award: A Retrieval Analysis of High Flexion versus Posterior-Stabilized Tibial Inserts. Clin. Orthop. Relat. Res. 2013, 471, 56–63. [Google Scholar] [CrossRef] [PubMed]
  22. Engh, C.A.; Zimmerman, R.L.; Hopper, R.H.; Engh, G.A. Can Microcomputed Tomography Measure Retrieved Polyethylene Wear? Comparing Fixed-Bearing and Rotating-Platform Knees. Clin. Orthop. Relat. Res. 2013, 471, 86–93. [Google Scholar] [CrossRef] [PubMed]
  23. Pang, H.-N.; Jamieson, P.; Teeter, M.G.; McCalden, R.W.; Naudie, D.D.R.; MacDonald, S.J. Retrieval Analysis of Posterior Stabilized Polyethylene Tibial Inserts and Its Clinical Relevance. J. Arthroplast. 2014, 29, 365–368. [Google Scholar] [CrossRef] [PubMed]
  24. Holleyman, R.J.; Scholes, S.C.; Weir, D.; Jameson, S.S.; Holland, J.; Joyce, T.J.; Deehan, D.J. Changes in Surface Topography at the TKA Backside Articulation Following in Vivo Service: A Retrieval Analysis. Knee Surg. Sports Traumatol. Arthrosc. 2015, 23, 3523–3531. [Google Scholar] [CrossRef] [PubMed]
  25. Schwarzkopf, R.; Scott, R.D.; Carlson, E.M.; Currier, J.H. Does Increased Topside Conformity in Modular Total Knee Arthroplasty Lead to Increased Backside Wear? Clin. Orthop. Relat. Res. 2015, 473, 220–225. [Google Scholar] [CrossRef]
  26. Knowlton, C.B.; Bhutani, P.; Wimmer, M.A. Relationship of Surface Damage Appearance and Volumetric Wear in Retrieved TKR Polyethylene Liners: RETRIEVED TKR POLYETHYLENE DAMAGE PATTERNS AND VOLUMETRIC WEAR. J. Biomed. Mater. Res. B Appl. Biomater. 2017, 105, 2053–2059. [Google Scholar] [CrossRef]
  27. Li, Z.; Esposito, C.I.; Koch, C.N.; Lee, Y.; Padgett, D.E.; Wright, T.M. Polyethylene Damage Increases With Varus Implant Alignment in Posterior-Stabilized and Constrained Condylar Knee Arthroplasty. Clin. Orthop. Relat. Res. 2017, 475, 2981–2991. [Google Scholar] [CrossRef]
  28. Łapaj, Ł.; Mróz, A.; Kokoszka, P.; Markuszewski, J.; Wendland, J.; Helak-Łapaj, C.; Kruczyński, J. Peripheral Snap-Fit Locking Mechanisms and Smooth Surface Finish of Tibial Trays Reduce Backside Wear in Fixed-Bearing Total Knee Arthroplasty: A Retrieval Analysis of 102 Inlays. Acta Orthop. 2017, 88, 62–69. [Google Scholar] [CrossRef]
  29. Sisko, Z.W.; Teeter, M.G.; Lanting, B.A.; Howard, J.L.; McCalden, R.W.; Naudie, D.D.; MacDonald, S.J.; Vasarhelyi, E.M. Current Total Knee Designs: Does Baseplate Roughness or Locking Mechanism Design Affect Polyethylene Backside Wear? Clin. Orthop. 2017, 475, 2970–2980. [Google Scholar] [CrossRef]
  30. Affatato, S.; Ruzzi, S.; Milosevic, M.; Ruggiero, A. Wear Characterization and Contact Surfaces Analysis of Menisci and Femoral Retrieved Components in Bi-Condylar Knee Prostheses. J. Mech. Behav. Biomed. Mater. 2020, 110, 103959. [Google Scholar] [CrossRef]
  31. Pourzal, R.; Cip, J.; Rad, E.; Laurent, M.P.; Berger, R.A.; Jacobs, J.J.; Wimmer, M.A. Joint Line Elevation and Tibial Slope Are Associated with Increased Polyethylene Wear in Cruciate-retaining Total Knee Replacement. J. Orthop. Res. 2020, 38, 1596–1606. [Google Scholar] [CrossRef] [PubMed]
  32. Tone, S.; Hasegawa, M.; Naito, Y.; Pezzotti, G.; Sudo, A. Raman Spectroscopy Reveals Creep and Wear Rate of E-Beam-Sterilized Conventional UHMWPE Tibial Inserts. J. Mech. Behav. Biomed. Mater. 2020, 110, 103902. [Google Scholar] [CrossRef] [PubMed]
  33. Levašič, V.; Blas, M.; Kovač, S.; Milošev, I. Valdoltra Knee Arthroplasty Registry Report 2023 (Data 2002–2022); Valdoltra Orthopeadic Hospital: Ankaran, Slovenia, 2024. [Google Scholar]
  34. McNally, M.; Sousa, R.; Wouthuyzen-Bakker, M.; Chen, A.F.; Soriano, A.; Vogely, H.C.; Clauss, M.; Higuera, C.A.; Trebše, R. The EBJIS Definition of Periprosthetic Joint Infection. Bone Jt. J. 2021, 103-B, 18–25. [Google Scholar] [CrossRef] [PubMed]
  35. Ewald, F.C. The Knee Society Total Knee Arthroplasty Roentgenographic Evaluation and Scoring System. Clin. Orthop. 1989, 248, 9–12. [Google Scholar] [CrossRef]
  36. Meneghini, R.M.; Mont, M.A.; Backstein, D.B.; Bourne, R.B.; Dennis, D.A.; Scuderi, G.R. Development of a Modern Knee Society Radiographic Evaluation System and Methodology for Total Knee Arthroplasty. J. Arthroplast. 2015, 30, 2311–2314. [Google Scholar] [CrossRef]
  37. Khalifa, A.A.; Mullaji, A.B.; Mostafa, A.M.; Farouk, O.A. A Protocol to Systematic Radiographic Assessment of Primary Total Knee Arthroplasty. Orthop. Res. Rev. 2021, 13, 95–106. [Google Scholar] [CrossRef]
  38. Chang, M.J.; Lim, H.; Lee, N.R.; Moon, Y.-W. Diagnosis, Causes and Treatments of Instability Following Total Knee Arthroplasty. Knee Surg. Relat. Res. 2014, 26, 61–67. [Google Scholar] [CrossRef]
  39. Rodríguez-Merchán, E.C. The Stiff Total Knee Arthroplasty: Causes, Treatment Modalities and Results. EFORT Open Rev. 2019, 4, 602–610. [Google Scholar] [CrossRef]
  40. Saadi, S.B.; Ranjbarzadeh, R.; Kazemi, O.; Amirabadi, A.; Ghoushchi, S.J.; Kazemi, O.; Azadikhah, S.; Bendechache, M. Osteolysis: A Literature Review of Basic Science and Potential Computer-Based Image Processing Detection Methods. Comput. Intell. Neurosci. 2021, 2021, 4196241. [Google Scholar] [CrossRef]
  41. Yu, B.; Yang, G.; Wang, W.; Zhang, L.; Lin, X. Cross-Linked versus Conventional Polyethylene for Total Knee Arthroplasty: A Meta-Analysis. J. Orthop. Surg. 2016, 11, 39. [Google Scholar] [CrossRef]
  42. Bistolfi, A.; Giustra, F.; Bosco, F.; Faccenda, C.; Viotto, M.; Sabatini, L.; Berchialla, P.; Sciannameo, V.; Graziano, E.; Massè, A. Comparable Results between Crosslinked Polyethylene and Conventional Ultra-High Molecular Weight Polyethylene Implanted in Total Knee Arthroplasty: Systematic Review and Meta-Analysis of Randomised Clinical Trials. Knee Surg. Sports Traumatol. Arthrosc. 2022, 30, 3120–3130. [Google Scholar] [CrossRef]
  43. Giustra, F.; Bistolfi, A.; Bosco, F.; Fresia, N.; Sabatini, L.; Berchialla, P.; Sciannameo, V.; Massè, A. Highly Cross-Linked Polyethylene versus Conventional Polyethylene in Primary Total Knee Arthroplasty: Comparable Clinical and Radiological Results at a 10-Year Follow-Up. Knee Surg. Sports Traumatol. Arthrosc. 2023, 31, 1082–1088. [Google Scholar] [CrossRef] [PubMed]
  44. Meyers, M.A.; Chawla, K.K. Mechanical Behavior of Materials, 2nd ed.; Cambridge University Press: Cambridge, UK, 2010; ISBN 978-0-521-86675-0. [Google Scholar]
  45. Zhao, D.; Sakoda, H.; Sawyer, W.G.; Banks, S.A.; Fregly, B.J. Predicting Knee Replacement Damage in a Simulator Machine Using a Computational Model with a Consistent Wear Factor. J. Biomech. Eng. 2008, 130, 011004. [Google Scholar] [CrossRef] [PubMed]
  46. McGloughlin, T.M.; Kavanagh, A.G. Wear of Ultra-High Molecular Weight Polyethylene (UHMWPE) in Total Knee Prostheses: A Review of Key Influences. Proc. Inst. Mech. Eng. [H] 2000, 214, 349–359. [Google Scholar] [CrossRef] [PubMed]
  47. De Baets, T.; Waelput, W.; Bellemans, J. Analysis of Third Body Particles Generated during Total Knee Arthroplasty: Is Metal Debris an Issue? Knee 2008, 15, 95–97. [Google Scholar] [CrossRef]
  48. Kulkarni, P.G.; Paudel, N.; Magar, S.; Santilli, M.F.; Kashyap, S.; Baranwal, A.K.; Zamboni, P.; Vasavada, P.; Katiyar, A.; Singh, A.V. Overcoming Challenges and Innovations in Orthopedic Prosthesis Design: An Interdisciplinary Perspective. Biomed. Mater. Devices 2024, 2, 58–69. [Google Scholar] [CrossRef]
  49. Estok, D.M.; Bragdon, C.R.; Plank, G.R.; Huang, A.; Muratoglu, O.K.; Harris, W.H. The Measurement of Creep in Ultrahigh Molecular Weight Polyethylene. J. Arthroplast. 2005, 20, 239–243. [Google Scholar] [CrossRef]
  50. Teeter, M.G.; Parikh, A.; Taylor, M.; Sprague, J.; Naudie, D.D. Wear and Creep Behavior of Total Knee Implants Undergoing Wear Testing. J. Arthroplast. 2015, 30, 130–134. [Google Scholar] [CrossRef]
  51. Valigi, M.; Logozzo, S.; Affatato, S. New Challenges in Tribology: Wear Assessment Using 3D Optical Scanners. Materials 2017, 10, 548. [Google Scholar] [CrossRef]
  52. Affatato, S.; Valigi, M.; Logozzo, S. Wear Distribution Detection of Knee Joint Prostheses by Means of 3D Optical Scanners. Materials 2017, 10, 364. [Google Scholar] [CrossRef]
  53. Kornuijt, A.; Kuijer, P.P.F.M.; Van Drumpt, R.A.; Siebelt, M.; Lenssen, A.F.; Van Der Weegen, W. A High Physical Activity Level after Total Knee Arthroplasty Does Not Increase the Risk of Revision Surgery during the First Twelve Years: A Systematic Review with Meta-Analysis and GRADE. Knee 2022, 39, 168–184. [Google Scholar] [CrossRef] [PubMed]
  54. Ngai, V.; Kunze, J.; Cip, J.; Laurent, M.P.; Jacobs, J.J.; Wimmer, M.A. Backside Wear of Tibial Polyethylene Components Is Affected by Gait Pattern: A Knee Simulator Study Using Rare Earth Tracer Technology. J. Orthop. Res. 2020, 38, 1607–1616. [Google Scholar] [CrossRef] [PubMed]
  55. Berger, R.A.; Crossett, L.S.; Jacobs, J.J.; Rubash, H.E. Malrotation Causing Patellofemoral Complications After Total Knee Arthroplasty. Clin. Orthop. 1998, 356, 144–153. [Google Scholar] [CrossRef] [PubMed]
Figure 1. Flow diagram of studied cohort identification. Abbreviation: TKA, total knee arthroplasty.
Materials 17 05007 g001
Figure 2. (A) Process of metrology data collection from an insert with an optical scanner. (B) Example of a penetration wear map of the articular load-bearing surface with a point of maximal linear wear indicated with an arrow. Abbreviations: Max. dev., maximal deviation.
Materials 17 05007 g002
Figure 3. Image processing steps of a penetration wear map before superimposition with other images within the group. (A) Cropped and horizontally mirrored image (inserts of left knees only). (B) Areas with no or less damage removed (shown in black); more damaged areas with depth still visible. (C) Binarized more damaged areas represented in yellow.
Materials 17 05007 g003
Figure 4. (A) Long-leg standing AP view. (B) Enlarged image (A): A = femoral mechanical axis; B = tibial mechanical axis; a = distal horizontal tangent to the femoral component; b = proximal horizontal tangent to the tibial component; (1) hip-knee-ankle (HKA) angle; (2) mechanical lateral distal femoral angle (mLDFA) = angle within [A] and [a]; (3) medial proximal tibial angle (MPTA) = angle within [B] and [b]. (C) Lateral knee view: X = femoral anatomical axis in sagittal plane; y = horizontal tangent to the femoral component; Y = perpendicular axis to [x]; (4) distal femoral flexion angle (DFFA) = angle within [X] and [Y]; Z = tibial anatomical axis in sagittal plane; z = perpendicular horizontal to Z; w = proximal tangent to the tibial component; (5) tibial slope (TS) = angle within [w] and [z].
Materials 17 05007 g004
Figure 5. Illustration of the relationship between volumetric wear (left) and linear wear (right) with time in situ deduced using the linear regression model with regression lines (dark blue) and 95% confidence intervals (grey area). The light blue dots represent individual cases.
Materials 17 05007 g005
Figure 6. The attribute plot of identified possible causes of TKA failure. Abbreviations: loosening, clinical loosening of the component; malposition, joint malalignment or component malposition; other, other isolated causes; PJI, confirmed prosthetic joint infection. Note: Cases with identified osteolysis and clinical loosening of the component are shown in blue.
Materials 17 05007 g006
Figure 7. Wear distribution within groups of causes of TKA failure. In the instability group, areas of higher frequency of wear are located in the peripheral anterior and posterior areas of the articular load-bearing surface.
Materials 17 05007 g007
Figure 8. Microscopic images showing the predominant visual wear patterns within the cohort. (A) Pitting. (B) Scratching. (C) Burnishing. (D) Embedded debris at the bottom of a pit.
Materials 17 05007 g008
Figure 9. Insert with articular load-bearing surface protuberances. (A) Photo. (B) Penetration wear map with resulting volumetric wear of −72.46 mm3 (note; a negative value indicates an increase in volume). (C) Microscopic view of the black rectangle shown in (A) exhibiting discoloration and layer separations observed using a digital microscope. (D) Scanning electron microscope image of a section through a protuberance showing rough layer separation. (E) Scanning electron microscope image of a section through an area adjacent to a protuberance showing delamination. (F) Enlarged view of the red rectangle shown in (E). Abbreviations: det, detector; ETD, Everhart-Thornley detector; HV, high voltage; mag, magnification; SE, secondary electrons; vac, vacuum; WD, working distance.
Materials 17 05007 g009
Figure 10. Insert showing a significant discrepancy from its reference CAD model. (A) Photo. (B) Penetration wear map. (C) Microscopic view of the black rectangle shown in (A), with arrows indicating the direction of parallel machining marks.
Materials 17 05007 g010
Table 1. Studies analyzing the wear of retrieved TKA polyethylene inserts.
Study, YearInsert TypeImplantNu.Time In Situ (Months)Assessment/Measuring MethodWear RateNotes/Key Findings
Li et al. [11], 2002FBAnatomic Modular Knee (AMK)®, Genesis®, Insall-Burstein II®, PFC®55(1–73)Visual assessment of wear patterns, CMMNABackside PE wear results as a significant contributor to the generation of PE debris.
Conditt et al. [12], 2005CRAMK®15(36–146)Surface laser profilometry138 ± 95 mm3/year *The predicted volume PE loss because of backside wear is substantial and may be sufficient to induce osteolysis.
Ho et al. [13], 2007MB, FBNew Jersey LCS® RP,
Miller Galante I® FB
51115 (48–162)Visual assessment of wear patternsNALow-grade wear (burnishing, abrasion, and cold flow) more common in MB knees; high-grade wear (scratching, pitting, metal embedding, and delamination) more common in FB knees.
Garcia et al. [14], 2009MBLCS® RP,
Sigma® RP
4030 (0.3–191)Visual assessment of wear patternsNANo significant difference between medial and lateral wear.
Wear increases with time in situ, patients’ weight, and BMI.
Increased wear in unstable knees.
Lu et al. [15], 2010MB, FBLCS®,
PCA®,
Miller-Galante®
73121 (48–162)Visual assessment of wear patternsNAIncreased articular surface wear in FB knees.
Increased backside wear in MB knees.
Wear in MB knees not associated with time in situ and BMI.
Srivastava et al. [16], 2011CRPFC®1692.4 (12–156)Visual assessment of wear patterns, Laser scanner CMM131 ± 78 mm3/yearVarus malalignment of the tibial component (≥3°) increases medial compartment wear and overall insert wear even when the knee is in neutral alignment.
Knowlton et al. [17], 2012CRMiller-Galante II®9(4.1–30.2)Laser scanner CMM39.2 ± 7.2 mm3/yearAn autonomous mathematical reconstruction can be used to effectively measure volume loss in retrieved tibial inserts.
Wimmer et al. [18], 2012CCK/PS,
CR
Insall-Burstein II®,
Miller-Galante II®
6918.6 (0.8–59.7),
19.9 (0.4–64.3)
Visual assessment of wear patternsNAMore conformity (CCK/PS) increase surface fatigue damage in TKA compared to less conform designs (CR).
Berry et al. [19], 2012MB, FBa Sigma® RP, b Sigma® with Ti or CoCr trays
312a 36 (0.4–124),
b 72 (2–179)
Insert thicknesses measurements using a dial indicatora 0.04 mm/year;
b 0.07 mm/year
(total);
b 0.02 mm/year *;
b 44 mm3/year *
Wear rate lower in RP compared to FB inserts.
Backside wear rate lower for FB inserts mated with CoCr trays than for rough Ti trays.
Inserts against polished trays (RP or FB) showed no increase in wear rate over time.
The wear rate of PS and CR inserts was not different.
Stoner et al. [20], 2013MB, FBPFC® Sigma RP,
PFC® Sigma
4224 (5–46)
65 (6–134)
Visual assessment of wear patternsNAThe increased total damage score on the RP, coupled with increased surface area damaged and the propensity for third-body debris, indicates no damage advantage to MB design.
Paterson et al. [21], 2013HF, PSGenesis® II
4020 (4–43)Visual assessment of wear patterns,
micro-CT
NAIncreased wear of post and backside surface of HF inserts due to ability of higher flexion of the knee.
Engh et al. [22], 2013MB, FBLCS®,
Sigma® RP,
PFC® Sigma
2452Volumetric wear analysis with micro-CT43 ± 25 mm3/year;
74 ± 49 mm3/year
Micro-CT can determine the volume and location of wear in retrieved inserts.
Significant influence of manufacturer tolerance when short follow-up or low wear present. A more accurate method for greater wear and simulator studies when repeated measurements possible.
Pang et al. [23], 2014PSGenesis II®8342 (4–124)Visual assessment of wear patternsNALimb malalignment (varus) and JLE (>5 mm) resulted in more wear.
In cases with JLE, an external rotation subluxation wear pattern was found with more damage over the posteromedial aspect of the post.
Holleyman et al. [24], 2014FBmany different30156 (36–240)Profilometry with a non-contact profilometerNASurface roughness and skewness measured on the insert undersurface and the tibial baseplate of explants.
Decreased backside wear found when a polished tibial tray was used compared to an unpolished design.
Schwarzkopf et al. [25], 2015CRPFC®70142 (15–289)Insert thicknesses measurementsa 0.0063 mm/year *; 14.2 mm3/year *;
b 0.05 mm/year *;
117 mm3/year *
More conforming b (curved) tibial inserts demonstrated more backside-normalized wear than the flatter a (posterior lipped) inserts.
Knowlton et al. [26], 2017CRMiller-Galante® II6436 (0.4–108)Visual assessment of wear patterns, video microscopy, low-incidence laser CMM12.9 ± 5.97 mm3/year;
0.035 ± 0.017 mm/year medially; 0.034 ± 0.011 mm/year laterally
Although striated patterns were the main contributors to volume loss, visual damage patterns were only moderate predictors. Geometric volume loss provides a more accurate quantification of in vivo wear.
Li et al. [27], 2017PS, CCKmany different156>24Visual assessment of wear patternsNAHigher damage in TKAs with postoperative varus alignment.
Łapaj et al. [28], 2017CR, PSmany different10230Visual assessment of wear patternsNAA smooth tibial tray surface and a peripheral locking mechanism reduce backside wear in vivo.
No significant differences were found between damage scores in CR vs PS inlays or between genders.
Sisko et al. [29], 2017CR, PSAMK®, Sigma®, Scorpio®, Triathlon®, Genesis® II30>48Visual assessment of wear patterns, linear wear measurement with micro-CTPolished designs 0.0102 ± 0.0044 mm/year *;
Non-polished designs 0.0224 ± 0.0119 mm/year *
Total backside damage scores and linear wear rates were highest, involving the non-polished design with only a peripheral rim capture.
Affatato et al. [30], 2020CR, PSmany different1270 (12–139)Visual assessment of wear patterns, topographical analysisNADamage patterns consistent with respect to the main prosthetic components movements.
No significant difference found between surface roughness measurements, patient BMI, age at revision, and time in situ.
Pourzal et al. [31], 2020CRNexGen®5961.2Laser scanner CMM11.6 mm3/yearIncreased wear rates with JLE and increased PTS (>7° vs. <3°).
Increased backside wear scores of medium compared to large insert size.
Tone et al. [32], 2020UC, PSInserts form B. Braun Aesculap (Tuttlingen, Germany)13a (0.75–8.5);
b (15.6–97.2)
Raman spectroscopya 0.055 ± 0.020 mm/year on med. LD;
b 0.041 ± 0.020 mm/year on lat. LD
A strong correlation between the amount of wear and time in situ.
Increased insert thickness reduction in medial a
compared to lateral b load zone.
Currier et al. [10], 2021CR, PSSigma®, Sigma® RP, NexGen®, Triathlon®, Genesis® II158558 (0–290)Calculation of wear based on the reference thickness of inserts with survival <16 monthsfrom 0.021 mm/year (PJI group) to 0.067 mm/year (PE wear group)Wear rate increased with duration in vivo.
Lower wear rates associated with older patients, females, polished modular tibial tray surfaces, HXLPE, and constrained TKA designs.
Note: Time in situ and wear rates are expressed as medians with range or standard deviation. The asterisk (*) after a value refers to the backside wear rate. Abbreviations: BMI, body mass index; CCK, constrained condylar knee; CMM, coordinate measuring machine; CR, cruciate retaining; FB, fixed-bearing; HF, high flexion; HXLPE, highly cross-linked polyethylene; JLE, joint line elevation; lat., lateral; LD, load zone; MB, mobile bearing; med., medial; NA, not available; Nu., number; PE, polyethylene; PJI, prosthetic joint infection; PS, posterior stabilized; PTS, posterior tibial slope; RP, rotating-platform; TKA, total knee arthroplasty; UC, ultra-congruent.
Table 2. Patient demographics and insert characteristics.
n = 57
Gender, female; n (%)33 (57.9%)
Age, years; mean ± SD69.6 ± 7.8
BMI; mean ± SD32.2 ± 5.1
Time in situ, months; median (IQR)17.4 (4.4–32.0)
Linear wear, mm; median (IQR)0.18 (0.11–0.32)
Volumetric wear, mm3; median (IQR)63.7 (32.6–114.1)
TKA side, right; n (%)29 (50.9%)
Insert size; n (%)
small12 (21.1%)
medium21 (36.8%)
large24 (42.1%)
Nominal component size ratio (F:I), n (%)
≤131 (54.4%)
>126 (45.6%)
Abbreviations: n, number of inserts; SD, standard deviation; BMI, body mass index; IQR, interquartile range; F:I, femoral-to-insert.
Table 3. Number (%) of cases per number of identified possible causes of TKA failure.
AllConfirmed PJIOsteolysisLooseningMalalignment/MalpositionInstabilityOther
One26 (45.6%)17 (54.8%)2 (8.3%)03 (10.7%)2 (16.6%)2 (100%)
Two13 (22.8%)8 (25.8%)4 (16.7%)1 (5.6%)10 (35.7%)3 (25.0%)0
Three9 (15.8%)3 (9.7%)9 (37.5%)8 (44.4%)6 (21.4%)1 (8.3%)0
Four9 (15.8%)3 (9.7%)9 (37.5%)9 (50.0%)9 (31.1%)6 (50.0%)0
Abbreviations: loosening, clinical loosening of the component; malalignment/malposition, joint malalignment or component malposition; other, other isolated causes; PJI, prosthetic joint infection.
Table 4. The association between volumetric wear and time in situ, and between volumetric wear and causes of TKA failure.
Estimate (95% CI)p-Value
Time in situ, months0.96 (0.21–1.71)0.013
Confirmed PJI
Yes23.96 (−10.9–58.82)0.174
NoRef.
Osteolysis and clinical loosening of a component
Both causes41.16 (10.98–71.34)0.009
Osteolysis alone52.06 (10.02–94.09)0.016
NoRef.
Joint malalignment or component malposition
Yes25.23 (−2.26–52.72)0.071
NoRef.
Instability
Yes23.16 (−14.38–60.7)0.221
NoRef.
Abbreviations: CI, confidence interval; Ref., reference.
Disclaimer/Publisher’s Note: The statements, opinions and data contained in all publications are solely those of the individual author(s) and contributor(s) and not of MDPI and/or the editor(s). MDPI and/or the editor(s) disclaim responsibility for any injury to people or property resulting from any ideas, methods, instructions or products referred to in the content.

