Article

Assessing the Potential of Rare Earth Elements in Bottom Ash from Coal Combustion in Poland

1
Faculty of Mining, Safety Engineering and Industrial Automation, Silesian University of Technology, ul. Akademicka 1, 44-100 Gliwice, Poland
2
Department of Environmental Monitoring, Central Mining Institute – National Research Institute, Plac Gwarków 1, 40-166 Katowice, Poland
*
Authors to whom correspondence should be addressed.
Materials 2024, 17(17), 4323; https://doi.org/10.3390/ma17174323
Submission received: 18 July 2024 / Revised: 27 August 2024 / Accepted: 28 August 2024 / Published: 31 August 2024

Abstract

:
The aim of the research was to assess the potential of bottom ash from Polish coal-fired power plants as an alternative source of rare earth elements (REY). The potential of these ashes was compared with fly ash from the same coal combustion cycle. The phase and chemical composition, as well as REY, were determined using: X-ray diffraction and inductively coupled plasma mass spectrometry. The tested ashes were classified as inert-low pozzolanic and inert-medium pozzolanic, as well as sialic and ferrosialic, with enrichment in detrital material. The phase and chemical composition of bottom ash was similar to fly ash from the same fuel combustion cycle. The REY content in the ash was 199–286 ppm and was lower than the average for global deposits, and the threshold value was considered profitable for recovery from coal. Bottom ash’s importance as a potential source of REY will increase by recovering these metals from separated amorphous glass and mullite and grains rich in Al, Mg, K, and P. The industrial value of bottom ash as an alternative source of REY was similar to fly ash from the same fuel combustion cycle.

1. Introduction

Maintaining global industrial production at current levels is linked to a high energy demand, which is still mainly supplied by fossil fuels. This type of energy production is associated with atmospheric and other emissions into the environment. However, renewable energy has become a beacon of hope for our civilization and can provide an alternative to fossil fuels or a type of replacement, especially in the development of technologies such as photovoltaics, wind turbines, and electric vehicles. Rare earth elements (REEs) are needed for such technological developments, as well as for electronics, telecommunications, metallurgy, the chemical industry, medicine, defense, and others. It is common knowledge that these are at a high risk of shortages and market disruptions due to their rarity in the Earth’s crust [1,2,3,4,5,6,7,8,9]. In 1787, Ytterby, Sweden, pioneered the study of REEs, with the discovery of the new mineral ytterbite, a black rock, by Carl Axel Arrhenius. The first of the elements of this group, yttrium, was only found in this rock by the Finnish chemist Johan Gadolin in 1794. The period of the first industrial applications of REEs was between 1891 and 1930. In 1903, the Austrian chemist Carl Auer von Welsbach was the first to apply cerium to the ferrocerium alloy, which was used as an ignition source for lighters. This alloy is still produced today. The 1960s was the advent of a period of rapid development in the field of REE applications, driven by the discovery of their unique properties (magnetic, optical, and catalytic) [4,10,11,12,13,14].
The distinctive characteristics of these metals have facilitated the advancement of numerous fields, where electronic technology has been facilitated by the miniaturization of devices; the production of batteries has been enhanced by the incorporation of higher energy density, improved discharge characteristics, and simplified disposal; the utilization of catalysts has been expanded into the chemical, refining, and automotive industries; the glass industry has benefited from the incorporation of additional functions into glass; laser manufacturing; metallurgy industry (alloys with specific properties); ceramics; defense and satellite systems; alternative energy sources; and energy-saving technologies [15,16,17,18,19,20].
The convenience of modern and innovative technologies has increased the demand for REEs in world markets. Before the 1950s, the annual world production of REOs (REE oxides) was below 5000 Mg. However, in the 1960s, their use and demand began to increase, and their consumption increased by a factor of 5. Since the 1970s, the production and consumption of REEs have increased rapidly, reaching 350,000 Mg in 2023 [21,22,23]. Forecasts indicate that REE demand will continue to rise and peak its global production in 2041 by approx. 247,000 Mg. However, previous forecast scenarios indicated that the demand in 2035 will be 450,000 Mg [7]. The total REO reserves are estimated to be approx. 110 million Mg [23], which equates to a static depletion rate (reserves/current production) of 314 years. This approximation contrasts with earlier estimates of 870 years [24]. REE production is based on natural resources found in the Earth’s crust. These include various types of deposits, such as carbonatites and alkaline igneous rocks, skarn, pegmatites, laterites, ion adsorption clays, placer deposits, hydrothermal, and marine sediments. However, upon the extraction of these resources, their supply will inevitably decline. The reliability of the REE supply chain is therefore of paramount importance for economic development, however there is a growing concern about the stability of the market in this regard. Consequently, research is being conducted to identify alternative sources of REEs, with the potential extraction of these metals from power generation fly ash being a promising avenue of exploration. Fly ash has several important advantages over REE ores: firstly, it is readily available in large quantities as waste; secondly, it does not require special mining inputs; and thirdly, it is a powder material that is easy to process. However, the REE content of fly ash varies depending on the region, which stems the geological processes shaping coal deposits. These variations range from tens of ppm to 1% [9,25,26,27,28,29,30,31,32,33,34,35,36,37,38,39,40,41,42,43,44,45,46,47].
The potential of bottom ash as an alternative source of REEs has received less attention than that of fly ash. Several publications have reported REE contents in bottom ash, which range from 49 to 1203 ppm [27,48,49,50,51,52,53]. However, it should be noted that, although accounting for a much smaller proportion than fly ash during thermal coal combustion, bottom ash has an REE content comparable to fly ash.
The production of REEs from natural resources or alternative sources is a multi-step process with environmental risks. A growing body of research considers the recovery of REEs and the circular economy [12,17,18,20,54,55,56,57]. It can be concluded that both fly ash and bottom ash, of attractive concentrations, can provide an alternative source of REEs to natural resources. In this case, the entire process of mining ores and their preparation for the extraction of metals is circumvented, thereby reducing the environmental impacts associated with mining operations and ore processing to extract these metals.
REE include lanthanides (15 elements) along with scandium and yttrium. Yttrium is closely related to lanthanides (similar ionic radius and ionic charge), hence they are referred to as REY. In the geochemical division of REY, three groups are distinguished [32,58,59]: light—(LREYs: La, Ce, Pr, Nd, Pm, and Sm), medium—(MREYs: Eu, Gd, Tb, Dy, and Y), and heavy—(HREYs—Ho, Er, Tm, Yb, and Lu). The position of yttrium is between Dy and Ho. A market division has also been adopted based on the forecasted relationships between the demand and supply of the following groups of elements [59]: critical (Nd, Eu, Tb, Dy, Y, and Er), uncritical (La, Pr, Sm, and Gd), and excessive (Ce, Ho, Tm, Yb, and Lu).
REY contents in fly ash or bottom ash are usually reported, but the results of these wastes originating from the same fuel combustion cycle are rarely presented. The aim of our study was to show the distribution of REY in bottom ash samples and compare it to the distribution in fly ash for samples of both wastes collected during the same combustion cycle in several Polish coal-fired power plants. Additionally, we assessed the industrial potential of bottom ash and indicated the justification for increasing its importance as an alternative source of REY. Furthermore, a comparison study was conducted on the potential of bottom ash with the potential of fly ash from the same coal combustion cycle.

2. Materials and Methods

Eight bottom ash samples were collected for the study from four Polish power plants equipped with conventional (pulverized coal) boilers (Table 1). The ashes were generated from the combustion of hard coal. The samples were labeled Z1–Z8.
Two samples were collected at each power station (from two different power units) over a period of one month at a rate of approx. 10 kg per day. Subsequently, the samples were reduced in size and transported to the laboratory. The material was then subjected to grinding in a zircon mill and sieving through a sieve with a mesh of less than 0.10 mm.
The phase composition, main chemical constituents, and REY were determined in the material prepared for testing.
The phase composition was determined by X-ray diffraction using an Empyrean diffractometer from PANalytical (Malvern, UK). The measurements were conducted under the following conditions: The X-ray diffraction measurements were conducted using a Cu lamp with an angular range from 5° to 70°, a step size of 0.02°, and an exposure time of 2 s. The proportions of the different phases were determined by the Rietveld method using HighScore Plus software (version 4.9).
The main chemical components, including SiO2, TiO2, Al2O3, Fe2O3, Mn3O4, MgO, CaO, Na2O, K2O, P2O5, and SO3, as well as the content of REY, were determined using inductively coupled plasma mass spectrometry (ICP-MS). The samples were mixed with a flux of lithium metaborate and lithium tetraborate and fused in an induction furnace. Molten melt was immediately poured into a solution of 5% nitric acid containing an internal standard and mixed continuously until completely dissolved. The prepared solutions were analyzed. The measurements were obtained using a Perkin Elmer SCIEX ELAN 6000 ICP-MS spectrometer at Activation Laboratories Ltd. in Ancaster, ON, Canada.
The prospective coefficient (Coutl) was calculated according to the following formula [32]:
C o u t l = N d + E u + T b + D y + E r + Y C e + H o + T m + Y b + L u
The bottom ashes under investigation were evaluated as a potential alternative source of REY, with the industrial value of the material determined based on the dependence of the percentage of critical elements on Coutl.
The REY contents of the samples were normalized to their contribution to the upper continental crust (UCC) in order to determine the degree of enrichment of the studied samples relative to the UCC. There are three types of enrichment, which depend on the distribution of REY content according to subgroups [32,58,59]: Type L—enrichment in LREY (La + Ce + Pr + Nd + Pm + Sm); Type M—enrichment in MREY (Eu + Gd + Tb + Dy + Y); and Type H—enrichment in HREY (Ho + Er + Tm + Yb + Lu), which depends on the value of ratios: LaN/LuN > 1 (type L); LaN/SmN < 1 and GdN/LuN > 1 (type M); and LaN/LuN < 1 (type H).

3. Results

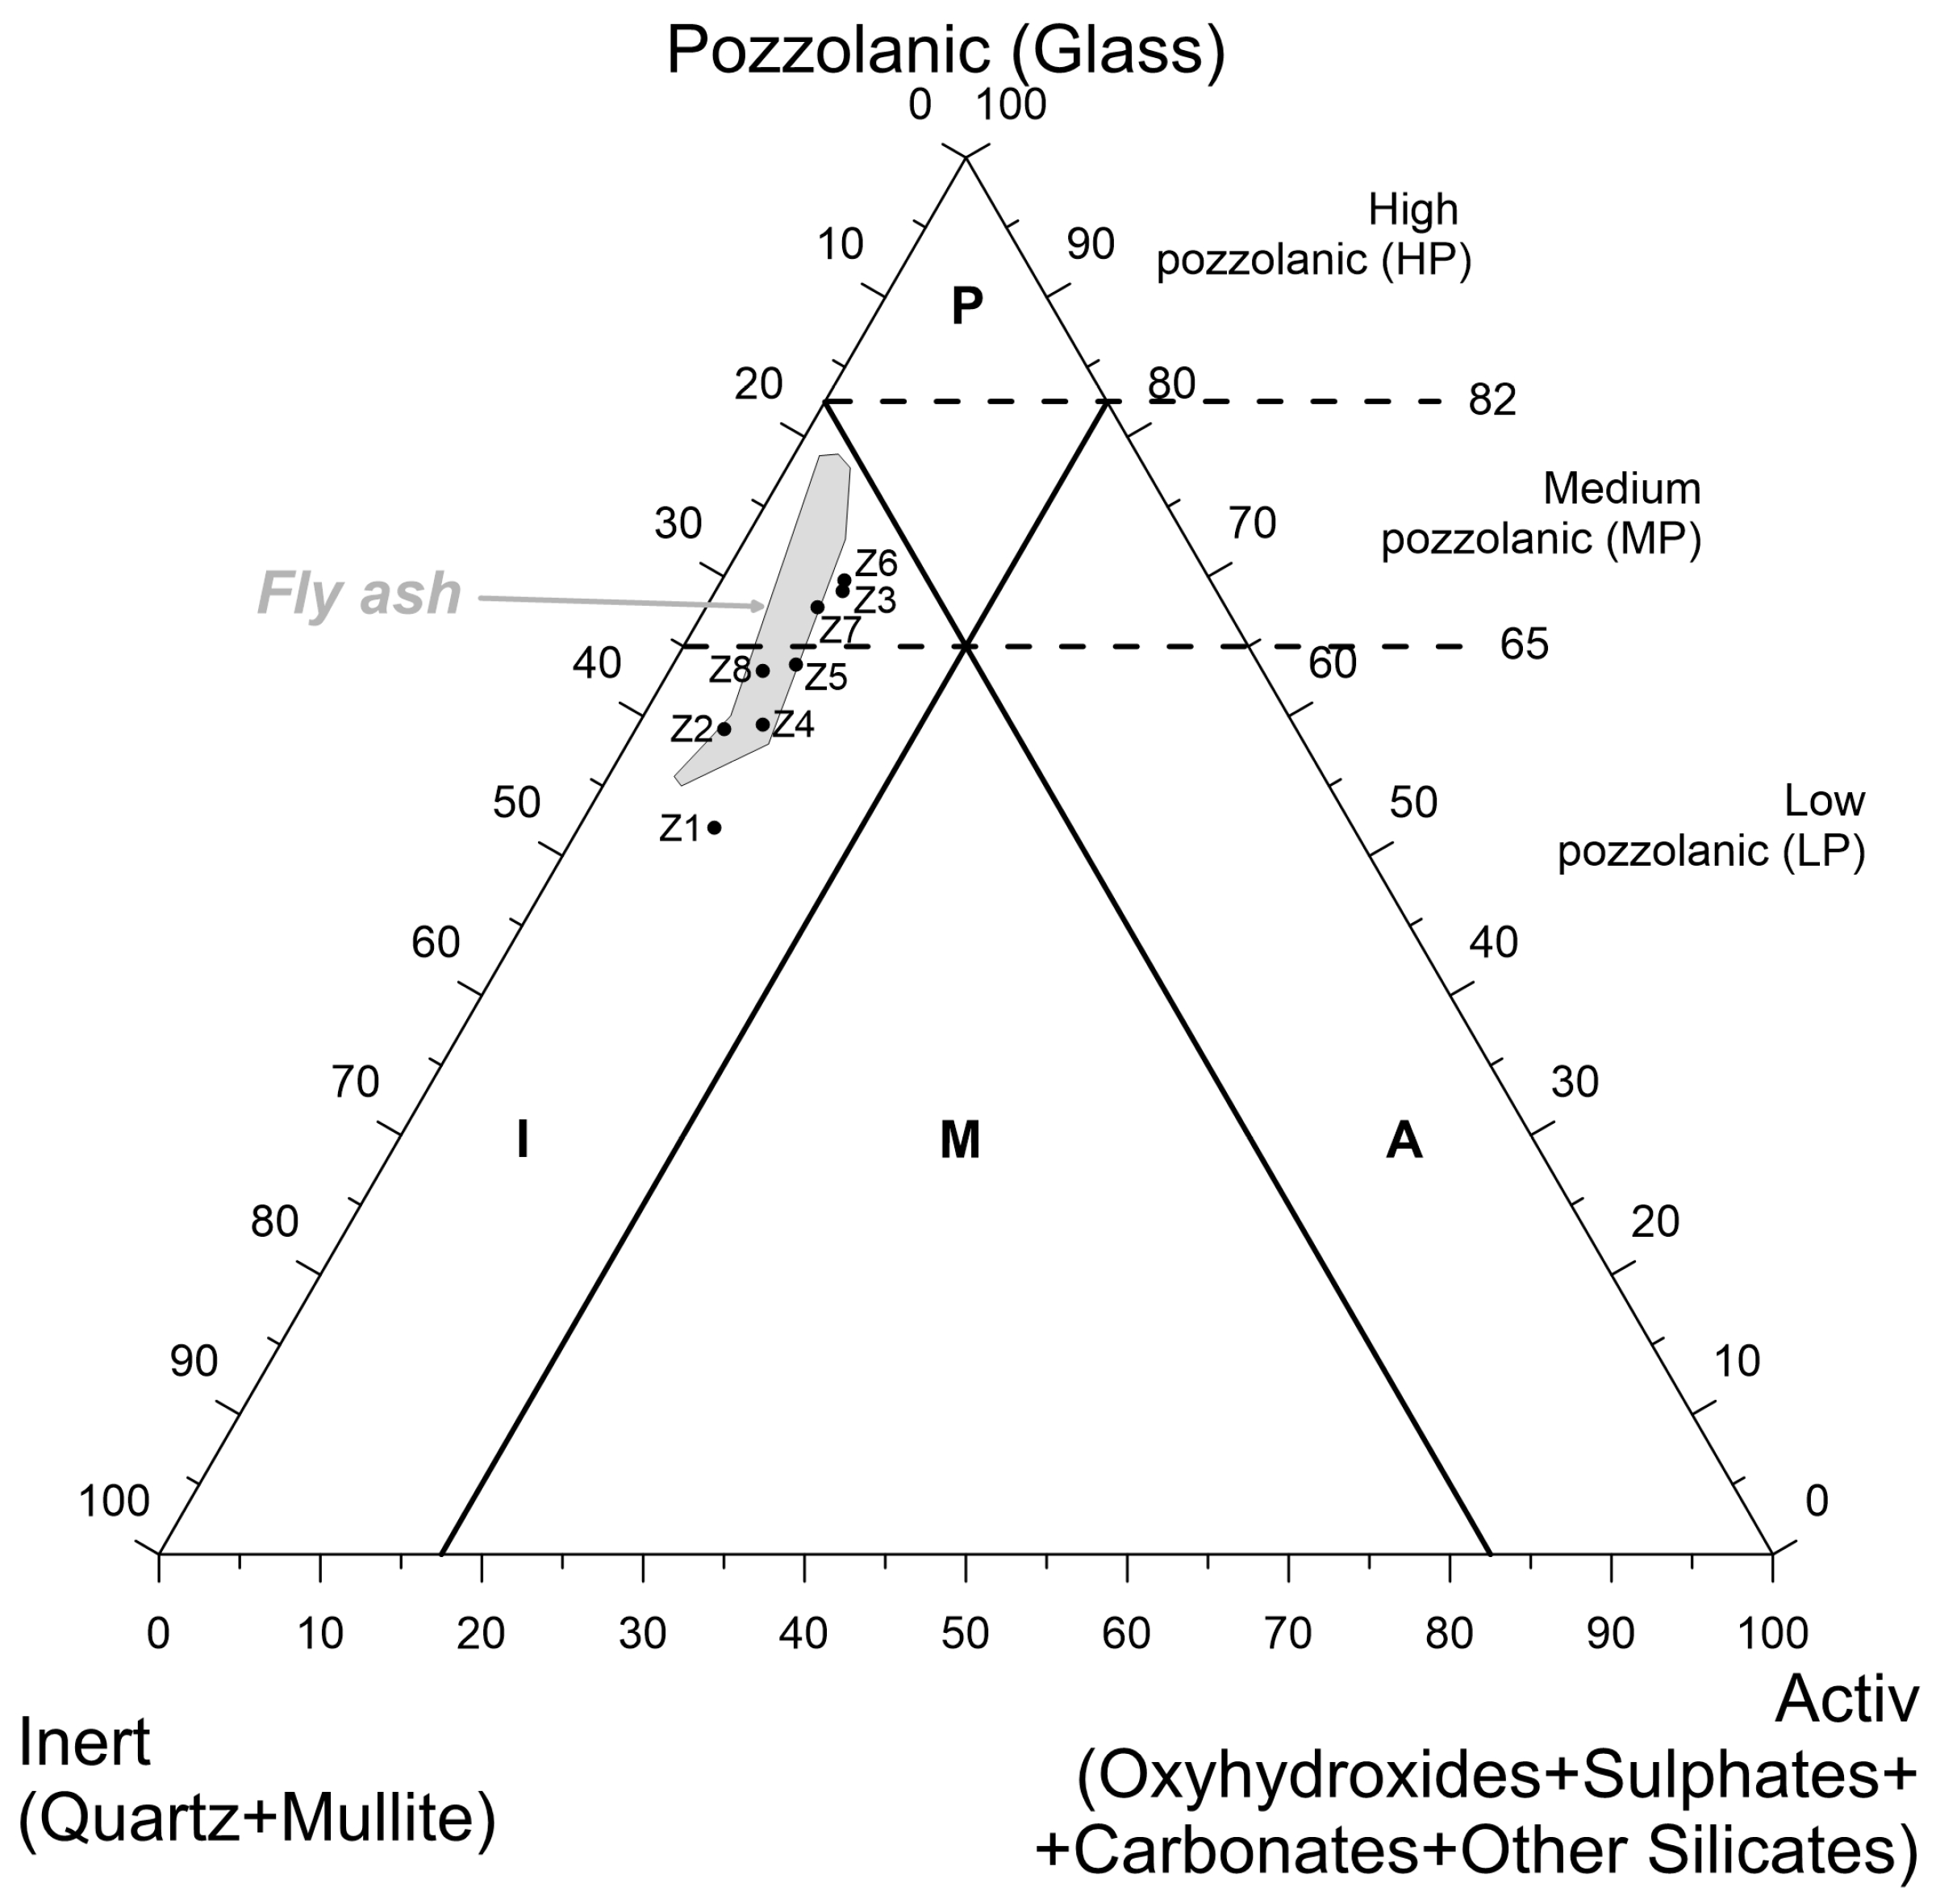
3.1. Phase Composition

Despite the samples originating from different power plants, the phase composition of the bottom ashes exhibited a remarkably consistent inventory of components. These included silicates (quartz, mullite, and anorthite), iron oxides (hematite, magnetite, and maghemite), Fe-containing spinels, calcite, and a glassy phase. The study demonstrated that the predominant component of the analyzed ashes was the glass phase, with an average proportion of 62.6%. The lowest contents were observed in ashes from the Łagisza power station (52.0–59.1%), while the highest were found in ashes from the Jaworzno III power station (Table 2). The second most prevalent component was mullite, with an average content of 20.1% in the analyzed ashes. The lowest contents were observed in samples from the Siersza power station (11.9–17.2%), while the highest was from the Łagisza power station (23.9–27.7%). Another component in the analyzed ash in higher amounts was quartz, with an average content of approx. 10%. The lowest amounts were present in ash from the Łaziska power station (4.3–5.7%) and the highest from the Siersza power station (11.2–15.7%). The quantities of the other phase components were considerably lower, with no values exceeding 5%. The three components (glassy phase, mullite, and quartz) collectively account for more than 90% of the samples.
A comparison of the amounts of the individual phase components in the bottom ashes under investigation with that of components in previously studied fly ash samples from the same power plants and collected during the same fuel combustion cycle [42] indicated that the proportions of the dominant phases, namely glass phase, mullite and quartz, in the fly ashes were significantly higher than in the bottom ashes (Figure 1a). A clear relationship between the proportion of the glass phase (Am) and the sum of the amounts of quartz and mullite (Q + Mu) was apparent in both the bottom ash and fly ash (r = 0.99, p < 0.05; r = 0.98, p < 0.05, respectively). This highlighted that the observed increase in the proportion of Q + Mu was associated with a reduced Am amount (Figure 1b).
In Vassilev’s classification [60], which considers the quantities of components such as activ (oxyhydrooxides + sulfates + carbonates + other silicates), puzzolanic (glass), and inert (quartz + mullite), the examined ashes of both samples from the Lagisza power plant are classified as inert-low pozzolanic (I-LP). The remaining ash samples exhibited ambiguous positions, with the majority falling within the inert-low pozzolanic (I-LP) or inert-medium pozzolanic (I-MP) fields (Figure 2). Therefore, the fuel fed to the power boilers exhibited some degree of variability in quality, although theoretically, such a variation should not have occurred. It was observed that the projection points of bottom ash in Vassilev’s diagram were arranged along the Pozzolanic-Insert line, which was almost identical to the projection field for fly ash that came from the same power plants and was collected in the same fuel combustion cycle [42].

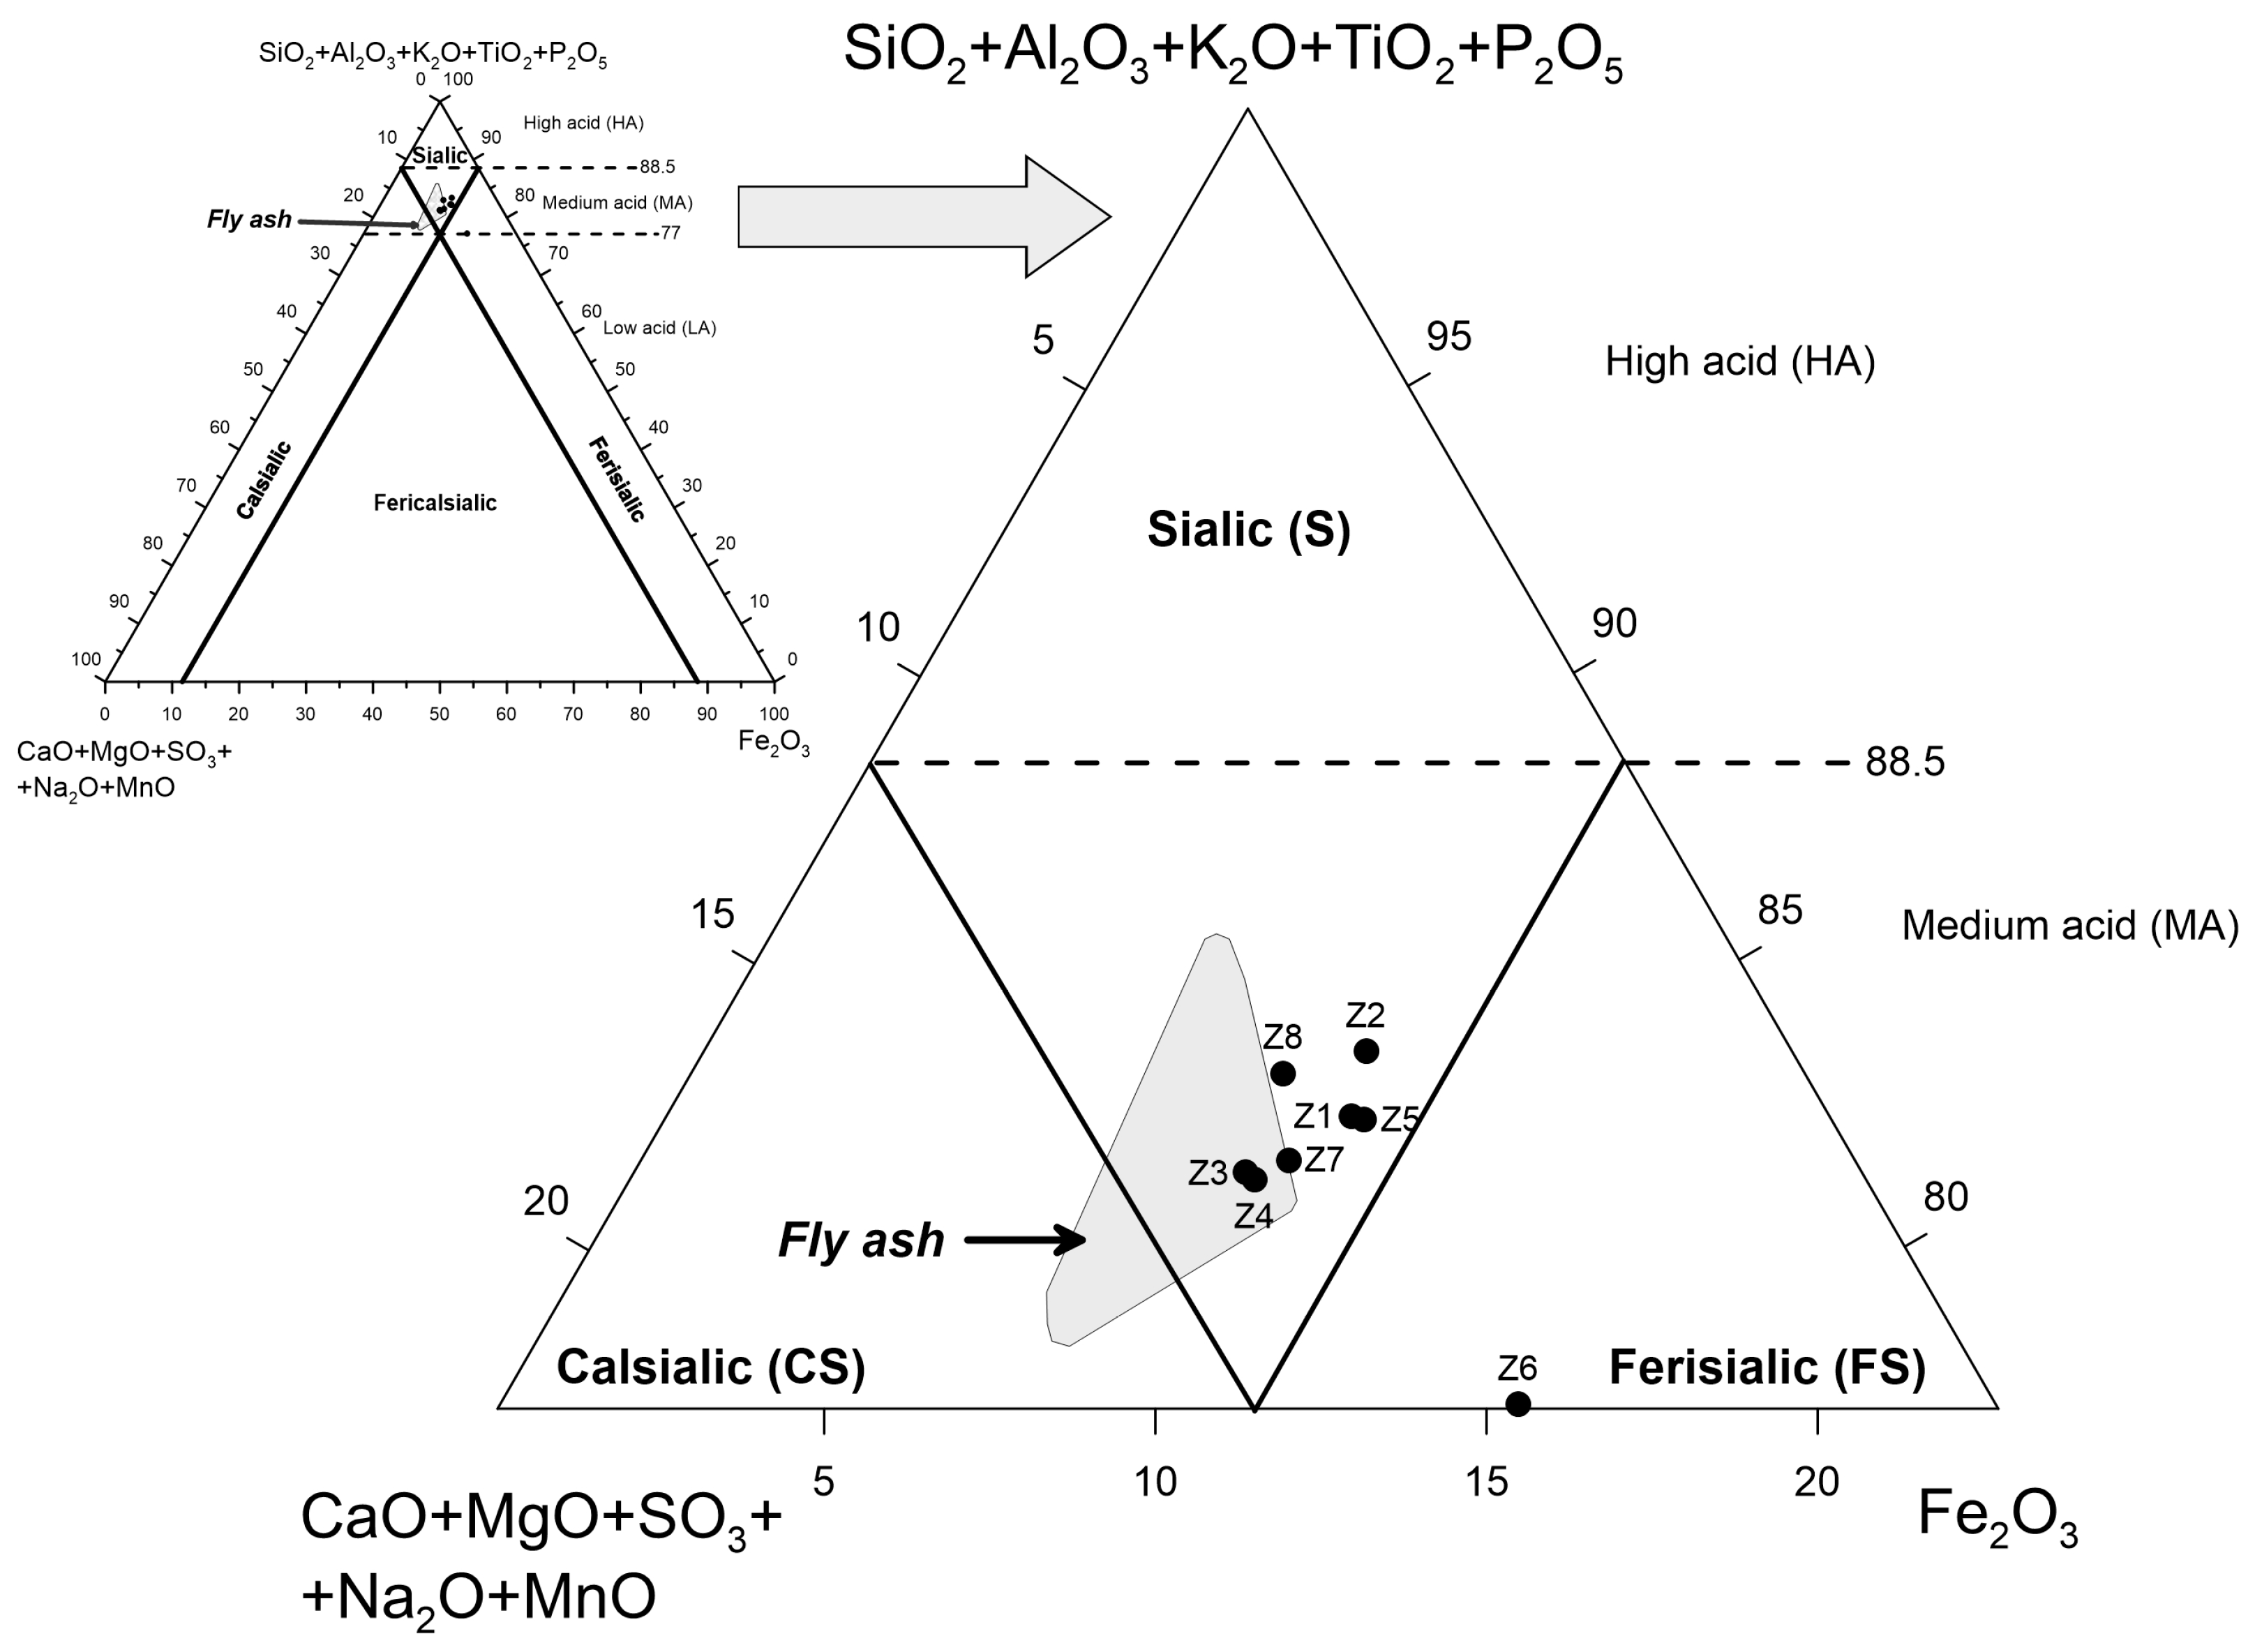
3.2. Chemical Composition

The chemical composition of the bottom ashes was analyzed, and the results reveal that the main constituents are SiO2, Al2O3, and loss of ignition (LOI), with average contents of 47.81%, 22.82%, and 9.05% mass, respectively (Table 3). It was notable that the samples from the Łaziska power plant exhibited a slightly higher content of Al2O3 compared to the other samples. This was evidenced by the lowest value of the SiO2/Al2O3 ratio, which was 1.84–1.88. The aforementioned ratio was observed to be above 2.00 in the remaining samples, with values as high as 2.40–2.50 being observed in the Siersza power plant samples. The SiO2 and Al2O3 contents exhibited minimal variation, with coefficients of variation of 3.59% and 10.39%, respectively. A markedly greater degree of variation was observed for LOI, with a range of 0.79–16.55% mass and a coefficient of variation exceeding 59%. The energy waste from pulverized coal-fired boilers is primarily attributable to the presence of unburned fuel. The lowest LOI contents in the investigated ash, as shown in the Jaworzno III and Łaziska power plants (0.79–5.35% and 3.19–7.66% masses, respectively), were attributed to a more efficient combustion process or superior fuel quality in comparison to the other power plants.
Fe2O3 was of particular interest among the other chemical components, which exhibited an average content below 10% mass. However, only the samples from the Jaworzno III power plant had amounts above this value, ranging from 10.06% to 15.35% mass.
The average contents of MgO, CaO, Na2O, and K2O were a few mass percent each (2.40%, 3.29%, 1.18%, and 2.35% mass, respectively). However, none of the samples exceeded a 4% mass. The calculated CaO/MgO ratios ranged from 1.16 to 1.71 (mean 1.37), while the K2O/Na2O ratios were in the range of 1.17–4.22 (mean value of 2.22).
TiO2 content was approx. 1% mass, while that of Mn3O4, P2O5, and SO3 did not exceed 0.50% mass, with averages of 0.10%, 0.20%, and 0.25% mass, respectively.
The results of the chemical composition tests allowed for the classification of the tested bottom ash according to ASTM C618 (2015) into class F [61], as evidenced by the following criteria: (i) the sum of SiO2, Al2O3, and Fe2O3 oxides was above 70% mass, and (ii) the CaO content was below 20% mass. The obtained results reveal that, according to the Polish classification, they belong to siliceous ash (k) as they meet the following criteria: (i) SiO2 > 40%; (ii) Al2O3 < 30%; (iii) CaO <10%; and (iv) SO3 < 4%.
The projection of the points of the studied ashes in the Vassilev classification system based on the ratio of Fe2O3-SiO2 + Al2O3 + K2O + TiO2 + P2O5-CaO + MgO + SO3 + Na2O + MnO [60] revealed that they generally belonged to the sialic-medium acid (S-MA) type (Figure 3). The exception was a sample from the Jaworzno III power plant (Z6), which was classified as a ferrisialic-medium acidic (FS-MA) type. This sample exhibited the highest Fe2O3 content (15.35% mass). The positions of the points on the diagram were a logical consequence of the significant amounts of identified phase components, namely quartz and mullite, which belong to silicates, aluminosilicates, and glass, and are usually dominated by SiO2 and Al2O3.
The projection points of the bottom ash in the Vassilev’s chemical ash classification diagram (Figure 3) were situated within or close to the projection field for fly ash from the same power. They were obtained during the same fuel combustion cycle [42]. Points outside the fly ash field demonstrated a shift toward the top of the SiO2 + Al2O3 + K2O + TiO2 + P2O5 component, indicating a higher proportion of the sum of these components and a lower proportion of the sum of CaO + MgO + SO3 + Na2O + MnO components compared to points in the field. The sole exception was sample Z6, located outside the fly ash characteristic field. This sample exhibited a shift toward the top of Fe2O3, thereby indicating an increase in the contribution of this component.
It was found that some of the chemical components exhibited a high positive or negative correlation with one another, with the absolute value of r exceeding 0.70 and p being less than 0.05. These included SiO2-LOI (−0.81), and TiO2-Al2O3 and LOI (0.91 and −0.80, respectively); Al2O3-K2O, P2O5, and LOI (0.76, 0.88, and −0.74, respectively); Fe2O3-SO3 and LOI (0.76 and −0.73, respectively); Mn3O4-MgO and K2O (0.85 and 0.78, respectively); MgO-CaO and K2O (0.71 and 0.78, respectively); Na2O-P2O5 and SO3 (−0.78 and −0.71, respectively); K2O-P2O5 (0.82); and SO3-LOI (−0.72). Correlations of a similar nature (r > |0.70|, p < 0.05) were observed for the following variables: SiO2/Al2O3-TiO2, K2O, and P2O5 (−0.79, −0.71, and −0.96, respectively); CaO/MgO-Fe2O3 (0.77); and K2O/Na2O-P2O5 (0.87).
The calculated detrital/authigenic index (DAI)—(SiO2 + Al2O3 + K2O + Na2O + TiO2)/(Fe2O3 + CaO + MgO + SO3 + P2O5 + MnO) ranged from 3.51 to 5.38 (mean 4.80). These values unambiguously demonstrated that the ashes under investigation were formed through the combustion of coal containing detrital mineral matter [60]. The DAI index exhibited a high negative correlation with Fe2O3 (r = −0.90, p < 0.05) and SO3 (r = −0.72, p < 0.05), as well as with (MgO + CaO)/(K2O + Na2O) ratios (r = −0.87, p < 0.05) and CaO/MgO (r = −0.84, p < 0.05).

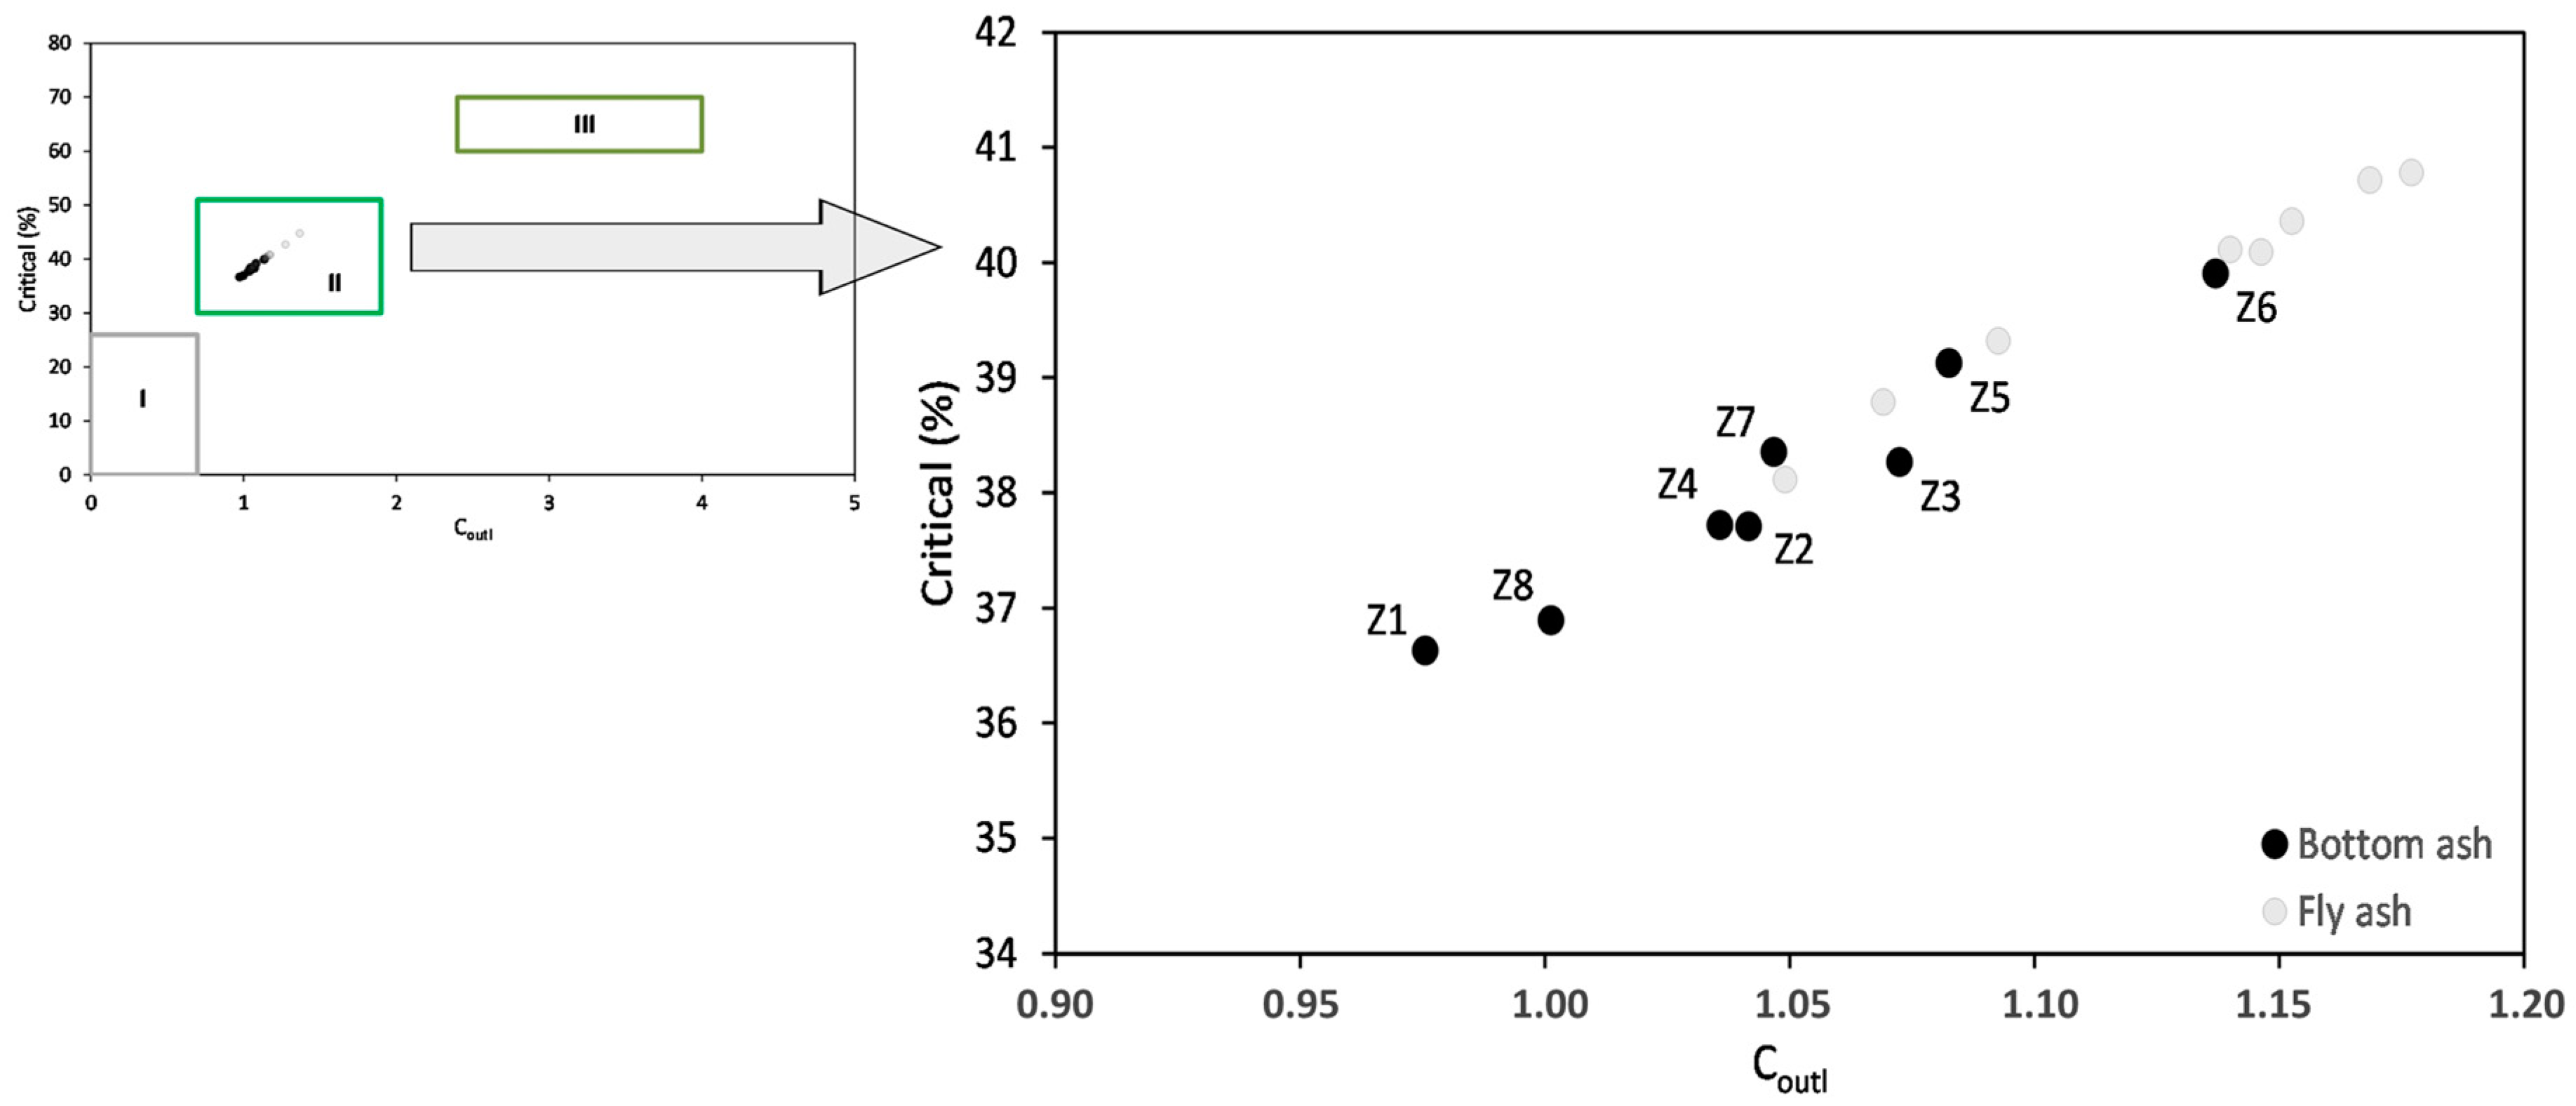
3.3. Rare Earth Elements

The concentrations of individual REY in the studied bottom ash samples exhibited slight variability (Table 4), similar to the total REY, for which the coefficient of variation was V = 12.31%. Indeed, the contents of REY ranged from 199.61 to 286.01 ppm, with the highest concentrations observed in bottom ash from the Łaziska power plant. The mean REY of 234.72 ppm was below the mean for world deposits [32,62,63]. The converted REY contents to REO oxides, for which the average was 277.72 ppm, are also lower than the average for coal ash of world deposits, and below the value of 1000 ppm, which is considered to be the limit for cost-effective recovery from coal.
It is worth noting that the sample contained a relatively high concentration of Ce (mean = 78.81 ppm), as well as elevated levels of Nd, Y, and La in comparison to other elements (mean = 37.63, 37.46, and 34.79 ppm, respectively). Consequently, the distribution of REY in coal and coal ash could be described in terms of three subgroups of elements [32,58,59], with the LREY subgroup being the dominant one, as evidenced by the mean value of 168.75 ppm. This value accounted for more than 71% of the total REY. The mean shares of the remaining subgroups were MREY (23.68%) and HREY (4.47%).
Additionally, the results indicate that the critical element contents range from 75.30 to 109.70 ppm in the samples (mean value of 89.35 ppm), which are comparable to the excess element contents at 72.71–104.81 ppm and s = 85.31 ppm. Consequently, the mean contributions of these two elemental groups to the total REY content were 38.08% for the critical and 36.33% for the excessive elements, with low variability (2.86 and 2.05%, respectively).
Non-critical elements exhibited slightly lower contents than critical and excessive elements, with a range of 51.60–71.50 ppm (mean value of 60.06 ppm). This resulted in their lower contribution to the total REY content, with a mean value of 25.60 ppm and low variability (V = 2.32%).
The prospective Coutl factor, calculated based on the determined contributions of critical and excessive elements, exhibited a narrow range of values, ranging from 0.98 to 1.14, with low variability (V = 4.74%). In terms of their potential industrial value, the bottom ashes were assessed based on their individual REY composition. As an alternative source of these elements, the percentage of critical elements was found to depend on Coutl. Therefore, the bottom ashes were placed in cluster II, which was defined as a promising raw material for REY (Figure 4). The same assessment of the potential industrial value was established for fly ash from the same power plants and taken during the same fuel combustion cycle [42].
The calculated LaN/LuN, LaN/SmN, and GdN/LuN ratios indicated that all the studied bottom ash samples exhibited an H-type REY distribution relative to the UCC, thereby demonstrating enrichment in the HREY subgroup of heavy elements. All standardization curves were above the reference level, and the contents of individual elements were typically twice as high as those of the UCC [64] (Figure 5). The normalization curves showed similar enrichment and characteristics of the analyzed fly ash from the same coal combustion cycle [42].

4. Discussion

It is important in the field of REY recovery technologies to ascertain which minerals act as carriers of these elements, or to determine the relationship between the chemical compound and these elements [9,65]. In order to highlight these relationships, a correlation analysis was performed between the following variables: the proportion of identified phases with chemical constituents; REY elements and their subgroups (LREY, MREY, and HREY), as well as critical, non-critical, and excess with phase compositions; and REY elements and their subgroups (LREY, MREY, and HREY), as well as critical, non-critical, and excess with chemical constituents.

4.1. Correlation between Phase Components and Chemical Components

Some of the identified phases exhibited a significantly high positive or negative correlation with the chemical components, with an absolute value of r > 0.70, p < 0.05. The following correlations were observed: quartz-TiO2 and Al2O3 (0.80 and −0.92, respectively), anorthite-Na2O and P2O5 (0.83 and −0.77, respectively), amorphous substance-SiO2 (0.73), quartz-K2O/Na2O (−0.76), and mullite-CaO/MgO (−0.80).

4.2. The Relationship between REY and Phase Components

The correlation coefficients between REY and its subgroups, together with the critical, non-critical, and excess elements with the phase components, indicated (Figure 6) a strong and significant positive correlation from the sum of mullite and amorphous glass (r = 0.78–0.90, p < 0.05) (Figure 7a–f). The combined treatment of these two components was justified, as mullite is typically dispersed within the grains of the amorphous glass and rarely forms independent grains. Furthermore, REY elements are typically dispersed in ashes within the vitreous phase [35,37,65,66]. Therefore, it was necessary to consider the separation of these phase components to extract REY components.
The second phase demonstrated a robust and statistically significant inverse correlation with all the aforementioned REY element groups with the strongest correlation being observed for quartz (r = −0.81 to −0.91, p < 0.05) (Figure 7g,h). This relationship between REY and quartz was expected as REY is unable to be incorporated into the quartz structure due to its crystallochemical properties. Furthermore, the preferred form of their presence in quartz is liquid inclusions [67,68], which are excluded for ash. Consequently, the removal of quartz from ash may result the enrichment of REY.
It was noted that other phase components did not exhibit a strong correlation with REY element groups. In certain cases, the absolute values of this coefficient were above 0.60, but they were not statistically significant (e.g., Fe spinels with REY, LREY, and excess elements; hematite with REY, LREY, non-critical, and excess elements; and magnetite with MREY) (Figure 6).

4.3. The Relationship between REY and Chemical Components

REY elements and their subgroups (LREY, MREY, and HREY), as well as critical, non-critical, and excessive elements, demonstrated a strong and significant correlation with some chemical components with an absolute value of the correlation coefficient r > 0.70 at p < 0.05. The following elements were found to be significantly correlated (i) with REY and LREY: Al2O3, Mn3O4, K2O, and P2O5, (ii) with MREY: K2O and LOI; (iii) with HREY: Al2O3, K2O, P2O5, SO3, and LOI; (iv) with critical elements: Al2O3, K2O, and P2O5; and (v) with non-critical and excessive elements: Al2O3, Mn3O4, K2O, and P2O5 (Figure 8). We observed from the above data that the individual REY subgroups, as well as the critical, non-critical, and excessive elements, tended to correlate with the recurring chemical components. This mainly includes Al2O3 (Figure 9a–e), Mn3O4 (Figure 9f–h, 10a), K2O (Figure 10b–h), and P2O5 (Figure 11a–f), and occasionally with SO3 (Figure 11g) and LOI (Figure 11h).
A strong and significant correlation was observed between the ratios of some of the components and the individual REY element groups. This correlation was negative for SiO2/Al2O3 with all REY groups, and positive for K2O/Na2O with REY, LREY, and non-critical elements. An SiO2/Al2O3-CaO/MgO-K2O/Na2O diagram was constructed, presenting the chemical compositions and correlations between the individual components, with projection points indicating the range of the REY content and P2O5 content in the samples (Figure 12). We observed a concentration of projection points with higher REY and P2O5 contents toward K2O/Na2O and with lower contents of these components toward the SiO2/Al2O3-CaO/MgO line. A higher proportion of potassium with a lower proportion of sodium and, at the same time, a higher proportion of aluminum with less silicon and higher magnesium with less calcium is indicative of an increase in phosphorus and REY elements. It can be concluded that the higher the concentrations of aluminum, magnesium, potassium, and phosphorus, the higher the proportion of REY in the bottom ash.
The associations of REY elements and their subgroups, together with critical, non-critical, and excess elements with the phase and chemical compositions in the bottom ashes studied only for Al2O3 and P2O5 were found to be similar to those observed in fly ashes from the same fuel combustion cycle [42]. Nevertheless, the quantitative characterization of the different elemental groups showed that the bottom ash and fly ash were comparable. However, small differences in their phase and chemical composition indicated some correlations did not repeat (e.g., TiO2, MgO, CaO, and DAI) or adopt the opposite sign in bottom ash (Mn3O4, sometimes K2O and Na2O). This may indicate the occurrence of a specific geochemical differentiation on a small scale in the formation conditions of these two energy wastes, which is difficult to explain unambiguously.

5. Conclusions

The studies conducted on bottom ash from the combustion of hard coal in Polish power plants revealed that the dominant phases were mullite, quartz, and amorphous glass. These phases, in conjunction with the other phases, permitted the classification of the ash as inert-low pozzolanic and inert-medium pozzolanic types, which made them comparable fly ash from the same fuel combustion cycle.
The principal chemical constituents of the bottom ashes under investigation were SiO2 and Al2O3. Considering the remaining constituents permitted the classification of the ashes into the sialic and ferrosialic types, with enrichment in detrital material. Hence, the ashes were comparable to the fly ashes from the same fuel combustion cycle.
The REY content in the bottom ash was in the range of 199–286 ppm, which was lower than the average for global deposits. Furthermore, the REY content converted into oxides was lower than the average for coal ash from global deposits and lower than the limit considered viable for recovery from coal (1000 ppm). A distribution of H-type REY was observed relative to the UCC, i.e., with enrichment in the heavy element subgroup HREY. Similar characteristics were noted for fly ash from the same fuel combustion cycle.
The potential industrial value of the studied bottom ashes was assessed based on the calculated values of the prospective Coutl factor and the individual REY composition. This indicates that the bottom ashes could be considered as an alternative source of REY and defined as REY promising raw materials.
In order to enhance the significance of bottom ash as a potential source of REY and to increase the concentration of these elements, the recovery of these metals should be carried out from separated amorphous glass together with mullite and grains rich in aluminum, magnesium, potassium, and phosphorus.
The results of the conducted studies indicate that the assessment of the potential industrial value of the studied bottom ash from Polish coal-fired power plants as an alternative REY source (a promising raw material) is in many respects similar to the potential of fly ash from the same fuel combustion cycle.

Author Contributions

Investigation, Z.A., J.K., B.B. and J.N.; methodology, Z.A., J.K., B.B. and J.N.; data curation, Z.A., J.K., B.B. and J.N.; formal analysis, Z.A., J.K. and J.N.; writing—original draft preparation, Z.A., J.K., B.B. and J.N.; writing—review and editing, Z.A., J.K., B.B. and J.N. All authors have read and agreed to the published version of the manuscript.

Funding

The paper has been prepared for the project: “Assessment of possible recycling directions of heavy & rare metals recovered from combustion waste products” (funding number: ERA-MIN/RAREASH/01/201), funded by the National Centre for Research and Development under the ERA-NET ERA-MIN Programme.

Institutional Review Board Statement

Not applicable.

Informed Consent Statement

Not applicable.

Data Availability Statement

The original contributions presented in the study are included in the article, further inquiries can be directed to the corresponding author/s.

Conflicts of Interest

The authors declare no conflicts of interest.

References

  1. Switzer, S.; Gerber, L.; Sindico, F. Access to Minerals: WTO Export Restrictions and Climate Change Considerations. Laws 2015, 4, 617–637. [Google Scholar] [CrossRef]
  2. Ascenzi, P.; Bettinelli, P.; Boffi, A.; Botta, P.; De Simeone, G.; Luchinat, C.; Marengo, E.; Mei, H.; Aime, S. Rare earth elements (REE) in biology and medicine. Rend. Lincei Sci. Fis. Nat. 2020, 31, 821–833. [Google Scholar] [CrossRef]
  3. Salfate, G.; Sánchez, J. Rare Earth Elements Uptake by Synthetic Polymeric and Cellulose-Based Materials: A Review. Polymers 2022, 14, 4786. [Google Scholar] [CrossRef] [PubMed]
  4. Balaram, V. Rare earth elements: A review of applications, occurrence, exploration, analysis, recycling, and environmental impast. Geosci. Front. 2019, 10, 1285–1303. [Google Scholar] [CrossRef]
  5. Balaram, V. Potential Future Alternative Resources for Rare Earth Elements: Opportunities and Challenges. Minerals 2023, 13, 425. [Google Scholar] [CrossRef]
  6. Sobri, N.A.; Yunus, M.Y.B.M.; Harun, N. A review of ion adsorption clay as a high potential source of rare earth minerals in Malaysia. Mater. Today Proc. 2023, 1–8. [Google Scholar] [CrossRef]
  7. El Azhari, H.; Cherif, E.K.; El Halimi, R.; Azzirgue, E.M.; Ou Larbi, Y.; Coren, F.; Salmoun, F. Predicting the Production and Depletion of Rare Earth Elements and Their Influence on Energy Sector Sustainability through the Utilization of Multilevel Linear Prediction Mixed-Effects Models with R Software. Sustainability 2024, 16, 1951. [Google Scholar] [CrossRef]
  8. Brown, R.M.; Struhs, E.; Mirkouei, A.; Raja, K.; Reed, D. Mixed rare earth metals production from surface soil in Idaho, USA: Techno-economic analysis and greenhouse gas emission assessment. Sci. Total Environ. 2024, 944, 173945. [Google Scholar] [CrossRef]
  9. Thomas, B.S.; Dimitriadis, P.; Kundu, C.; Vuppaladadiyam, S.S.V.; Raman, R.K.S.; Bhattacharya, S. Extraction and separation of rare earth elements from coal and coal fly ash: A review on fundamental understanding and on-going engineering advancements. J. Environ. Chem. Eng. 2024, 12, 112769. [Google Scholar] [CrossRef]
  10. Greinacher, E. History of rare earth applications, rare earth market today: Overview. In Industrial Applications of Rare Earth Elements; Gschneidner, K.A., Jr., Ed.; ACS Symposium Series 164; American Chemical Society: Washington, DC, USA, 1981; pp. 3–18. [Google Scholar]
  11. Krishnamurthy, N.; Gupta, C.K. Extractive Metallurgy of Rare Earths, 2nd ed.; CRC Press: Boca Raton, FL, USA; Taylor and Francis Group: Abingdon, UK, 2015. [Google Scholar]
  12. Sikander, A.; Savvilotidou, V.; Jia, X.; Nicomel, N. The presence of rare earth elements and critical metals in waste electric and electronic equipment: Challenges for recovery. Glob. NEST J. 2018, 20, 773–777. [Google Scholar]
  13. Löffler, G.R. Carl Auer von Welsbach (1858–1929)—A Famous Austrian Chemist Whose Services Have Been Forgotten for Modern Physics. Substantia 2019, 3, 91–107. [Google Scholar]
  14. Sager, M.; Wiche, O. Rare Earth Elements (REE): Origins, Dispersion, and Environmental Implications—A Comprehensive Review. Environments 2024, 11, 24. [Google Scholar] [CrossRef]
  15. Charalampides, G.; Vatalis, K.I.; Apostoplos, B.; Ploutarch-Nikolas, B. Rare Earth Elements: Industrial Applications and Economic Dependency of Europe. Procedia Econ. Financ. 2015, 24, 126–135. [Google Scholar] [CrossRef]
  16. Zhang, S.; Ding, Y.; Liu, B.; Chang, C. Supply and demand of some critical metals and present status of their recycling in WEEE. Waste Manag. 2017, 65, 113–127. [Google Scholar] [CrossRef] [PubMed]
  17. Drobniak, A.; Mastalerz, M. Rare Earth Elements—A brief overview. Indiana J. Earth Sci. 2022, 4, 33628. [Google Scholar] [CrossRef]
  18. Willenbacher, M.; Wohlgemuth, V. Rebound Effects in the Use of Rare Earth Metals in ICT. Int. J. Environ. Sci. Nat. Res. 2022, 30, 556277. [Google Scholar]
  19. Patel, K.S.; Sharma, S.; Maity, J.P.; Martín-Ramos, P.; Fiket, Ž.; Bhattacharya, P.; Zhu, Y. Occurrence of uranium, thorium and rare earth elements in the environment: A review. Front. Environ. Sci. 2023, 10, 1058053. [Google Scholar] [CrossRef]
  20. Salehi, H.; Maroufi, S.; Mofarah, S.S.; Nekouei, R.K.; Sahajwalla, V. Recovery of Rare Earth Metals from Ni-MH Batteries: A Comprehensive Review. Renew. Sustain. Energy Rev. 2023, 178, 113248. [Google Scholar]
  21. Weng, Z.; Simon, M.J.; Gavin, M.M.; Haque, N. A Detailed Assessment of Global Rare Earth Element Resources: Opportunities and Challenges. Soc. Econ. Geol. 2015, 110, 1925–1952. [Google Scholar] [CrossRef]
  22. Zhou, B.; Li, Z.; Chen, C. Global Potential of Rare Earth Resources and Rare Earth Demand from Clean Technologies. Minerals 2017, 7, 203. [Google Scholar] [CrossRef]
  23. U.S. Geological Survey. Mineral Commodity Summaries 2024; Mineral Commodity Summaries; U.S. Geological Survey: Reston, VA, USA, 2024; Volume 2024, pp. 144–145. [Google Scholar]
  24. Alonso, E.; Sherman, A.M.; Wallington, T.J.; Everson, M.P.; Field, F.R.; Roth, R.; Kirchain, R.E. Evaluating rare earth element availability: A case with revolutionary demand from clean technologies. Environ. Sci. Technol. 2012, 46, 3406–3414. [Google Scholar] [CrossRef]
  25. Seredin, V.V. Rare earth element-bearing coals from the Russian Far East deposits. Int. J. Coal Geol. 1996, 30, 101–129. [Google Scholar] [CrossRef]
  26. Hower, J.C.; Ruppert, L.F.; Eble, C.F. Lanthanide, yttrium, and zirconium anomalies in the Fire Clay coal bed, Eastern Kentucky. Int. J. Coal Geol. 1999, 39, 141–153. [Google Scholar] [CrossRef]
  27. Hower, J.C.; Dai, S.; Seredin, V.V.; Zhao, L.; Kostova, I.J.; Silva, L.F.; Mardon, S.M.; Gurdal, G. A note on the occurrence of yttrium and rare earth elements in coal combustion products. Coal Combust. Gasif. Prod. 2013, 5, 39–47. [Google Scholar]
  28. Hower, J.C.; Groppo, J.G.; Henke, K.R.; Hood, M.M.; Eble, C.F.; Honaker, R.Q.; Zhang, W.; Qian, D. Notes on the potential for the concentration of rare earth elements and yttrium in coal combustion fly ash. Minerals 2015, 5, 356–366. [Google Scholar] [CrossRef]
  29. Hower, J.C.; Granite, E.J.; Mayfield, D.B.; Lewis, A.S.; Finkelman, R.B. Notes on Contributions to the Science of Rare Earth Element Enrichment in Coal and Coal Combustion Byproducts. Minerals 2016, 6, 32. [Google Scholar] [CrossRef]
  30. Hower, J.C.; Groppo, J.G.; Henke, K.R.; Graham, U.M.; Hood, M.M.; Joshi, P.; Preda, D.V. Ponded and landfilled fly ash as a source of rare earth elements from a Kentucky power plant. Coal Comb. Gasific. Prod. 2017, 9, 1–21. [Google Scholar] [CrossRef]
  31. Mardon, S.M.; Hower, J.C. Impact of coal properties on coal combustion by-product quality: Examples from a Kentucky power plant. Int. J. Coal Geol. 2004, 59, 153–169. [Google Scholar] [CrossRef]
  32. Seredin, V.V.; Dai, S. Coal deposits as potential alternative sources for lanthanides and yttrium. Int. J. Coal Geol. 2012, 94, 67–93. [Google Scholar] [CrossRef]
  33. Seredin, V.V.; Dai, S.; Sun, Y.; Chekryzhov, I.Y. Coal deposits as promising sources of rare metals for alternative power and energy-efficient technologies. Appl. Geochem. 2013, 31, 1–11. [Google Scholar] [CrossRef]
  34. Franus, W.; Wiatros-Motyka, M.M.; Wdowin, M. Coal fly ash as a resource for rare earth elements. Environ. Sci. Pollut. Res. 2015, 22, 9464–9474. [Google Scholar] [CrossRef]
  35. Zhang, W.; Rezaee, M.; Bhagavatula, A.; Li, Y.; Groppo, J.; Honaker, R. A Review of the Occurrence and Promising Recovery Methods of Rare Earth Elements from Coal and Coal By-Products. Int. J. Coal Prep. Util. 2015, 35, 295–330. [Google Scholar] [CrossRef]
  36. Dai, S.; Graham, I.T.; Ward, C.R. A review of anomalous rare earth elements and yttrium in coal. Int. J. Coal Geol. 2016, 159, 82–95. [Google Scholar] [CrossRef]
  37. Dai, S.; Finkelman, R.B. Coal as a promising source of critical elements: Progress and future prospects. Int. J. Coal Geol. 2018, 186, 155–164. [Google Scholar] [CrossRef]
  38. Dai, S.; Yan, X.; Ward, C.R.; Hower, J.C.; Zhao, L.; Wang, X.; Zhao, L.; Ren, D.; Finkelman, R.B. Valuable elements in Chinese coals: A review. Int. Geol. Rev. 2018, 60, 590–620. [Google Scholar] [CrossRef]
  39. Taggart, R.K.; Hower, J.C.; Dwyer, G.S.; Hsu-Kim, H. Trends in the Rare Earth Element Content of U.S.-Based Coal Combustion Fly Ashes. Environ. Sci. Technol. 2016, 50, 5919–5926. [Google Scholar] [CrossRef]
  40. Adamczyk, Z.; Komorek, J.; Lewandowska, M.; Nowak, J.; Białecka, B.; Całusz-Moszko, J.; Klupa, A. Ashes from bituminous coal burning in fluidized bed boilers as a potential source of rare earth elements. Gospod. Surowcami Miner.-Miner. Resour. Manag. 2018, 34, 21–36. [Google Scholar] [CrossRef]
  41. Adamczyk, Z.; Komorek, J.; Lewandowska, M. The high temperature ashes (HTA) from bituminous coal combustion as a potential resource of rare earth elements. Gospod. Surowcami Miner.-Miner. Resour. Manag. 2018, 34, 135–150. [Google Scholar] [CrossRef]
  42. Adamczyk, Z.; Komorek, J.; Białecka, B.; Nowak, J.; Klupa, A. Assessment of the potential of polish fly ashes as a source of rare earth elements. Ore Geol. Rev. 2020, 124, 103638. [Google Scholar] [CrossRef]
  43. Adamczyk, Z.; Komorek, J.; Kokowska-Pawłowska, M.; Nowak, J. Distribution of Rare-Earth Elements in Ashes Produced in the Coal Combustion Process from Power Boilers. Energies 2023, 16, 2696. [Google Scholar] [CrossRef]
  44. Hussain, R.; Luo, K. Geochemical Evaluation of Enrichment of Rare-Earth and Critical Elements in Coal Wastes from Jurassic and Permo-Carboniferous Coals in Ordos Basin, China. Nat. Resour. Res. 2020, 29, 1731–1754. [Google Scholar] [CrossRef]
  45. Pyrgaki, K.; Gemeni, V.; Karkalis, C.; Koukouzas, N.; Koutsovitis, P.; Petrounias, P. Geochemical Occurrence of Rare Earth Elements in Mining Waste and Mine Water: A Review. Minerals 2021, 11, 860. [Google Scholar] [CrossRef]
  46. Fu, B.; Hower, J.C.; Zhang, W.; Luo, G.; Hu, H.; Yao, H. A review of rare elements and yttrium in coal ash: Content, modes of occurrences, combustion behavior, and extraction methods. Prog. Energy Combust. Sci. 2022, 88, 100954. [Google Scholar] [CrossRef]
  47. Strzałkowska, E. Rare earth elements and other critical elements in the magnetic fraction of fly ash from several Polish power plants. Int. J. Coal Geol. 2022, 258, 104015. [Google Scholar] [CrossRef]
  48. Ma, Z.; Shan, X.; Cheng, F. Distribution Characteristics of Valuable Elements, Al, Li, and Ga, and Rare Earth Elements in Feed Coal, Fly Ash, and Bottom Ash from a 300 MW Circulating Fluidized Bed Boiler. ACS Omega 2019, 4, 6854–6863. [Google Scholar] [CrossRef]
  49. Tuan, L.Q.; Thenepalli, T.; Chilakala, R.; Vu, H.H.T.; Ahn, J.W.; Kim, J. Leaching Characteristics of Low Concentration Rare Earth Elements in Korean (Samcheok) CFBC Bottom Ash Samples. Sustainability 2019, 11, 2562. [Google Scholar] [CrossRef]
  50. Firman, H. A Study on the Potential Rare Earth Elements in Coal Combustion Product from Banjarsari Power Plant, South Sumatera. IOP Conf. Ser. Mater. Sci. Eng. 2021, 1125, 012003. [Google Scholar] [CrossRef]
  51. Besari, D.A.A.; Anggara, F.; Rosita, W.; Petrus, T.B.M. Characterization and mode of occurrence of rare earth elements and yttrium in fly and bottom ash from coal-fired power plants in Java, Indonesia. Int. J. Coal Sci. Technol. 2022, 9, 20. [Google Scholar] [CrossRef]
  52. Bishop, B.A.; Shivacumar, K.R.; Alessi, D.S.; Robbins, L. Insights into the rare earth element potential of coal combustion by-products from western Canada. Environ. Sci. Adv. 2023, 2, 529–542. [Google Scholar] [CrossRef]
  53. Huang, S.; Ning, S.; Zhang, D.; Cai, Y.; Yan, X.; Liu, K.; Xu, X. Rare Earth Element Characteristics in Coal Ash from the Jungar Energy Gangue Power Plant, Inner Mongolia, China. Minerals 2023, 3, 1212. [Google Scholar] [CrossRef]
  54. Leal Filho, W.; Kotter, R.; Özuyar, P.G.; Abubakar, I.R.; Eustachio, J.H.P.P.; Matandirotya, N.R. Understanding Rare Earth Elements as Critical Raw Materials. Sustainability 2023, 15, 1919. [Google Scholar] [CrossRef]
  55. Gkika, D.A.; Chalaris, M.; Kyzas, G.Z. Review of Methods for Obtaining Rare Earth Elements from Recycling and Their Impact on the Environment and Human Health. Processes 2024, 12, 1235. [Google Scholar] [CrossRef]
  56. Allam, E.M.; Lashen, T.A.; Abou El-Enein, S.A.; Hassanin, M.A.; Sakr, A.K.; Cheira, M.F.; Almuqrin, A.; Hanfi, M.Y.; Sayyed, M.I. Rare Earth Group Separation after Extraction Using Sodium Diethyldithiocarbamate/Polyvinyl Chloride from Lamprophyre Dykes Leachate. Materials 2022, 15, 1211. [Google Scholar] [CrossRef] [PubMed]
  57. Allam, E.M.; Lashen, T.A.; Abou El-Enein, S.A.; Hassanin, M.A.; Sakr, A.K.; Hanfi, M.Y.; Sayyed, M.I.; Al-Otaibi, J.S.; Cheira, M.F. Cetylpyridinium Bromide/Polyvinyl Chloride for Substantially Efficient Capture of Rare Earth Elements from Chloride Solution. Polymers 2022, 14, 954. [Google Scholar] [CrossRef] [PubMed]
  58. Bau, M. Controls on the fractionation of isovalent trace elements in magmatic and aqueous systems: Evidence from Y/Ho, Zr/Hf, and lanthanide tetrad effect. Contrib. Mineral. Petrol. 1996, 123, 323–333. [Google Scholar] [CrossRef]
  59. Seredin, V.V. A new method for primary evaluation of the outlook for rare earth element ores. Geol. Ore Depos. 2010, 52, 428–433. [Google Scholar] [CrossRef]
  60. Vassilev, S.V.; Vassileva, C.G. A new approach for the classification of coal fly ashes based on their origin, composition, properties, and behaviour. Fuel 2007, 86, 1490–1512. [Google Scholar] [CrossRef]
  61. Suarez-Ruiz, I.; Valentim, B.; Borrego, A.G.; Bouzinos, A.; Flores, D.; Kalaitzidis, S.; Malinconico, M.L.; Marques, M.; Misz-Kennan, M.; Predeanu, G.; et al. Development of a petrographic classification of fly-ash components from coal combustion and co-combustion. (An ICCP Classification System, Fly-Ash Working Group—Commission III.). Int. J. Coal Geol. 2017, 183, 188–203. [Google Scholar] [CrossRef]
  62. Ketris, M.P.; Yudovich, Y.E. Estimations of clarkes for carbonaceous biolithes: World average for trace element contents in black shales and coals. Int. J. Coal Geol. 2009, 78, 135–148. [Google Scholar] [CrossRef]
  63. Jarosiński, A. Możliwości pozyskiwania metali ziem rzadkich w Polsce. Zesz. Nauk. Inst. Gospod. Surowcami Miner. Energią Pol. Akad. Nauk 2016, 92, 75–88. [Google Scholar]
  64. Taylor, S.R.; McLennan, S.H. The Continental Crust: Its Composition and Evolution; Blackwell: Oxford, UK, 1985; pp. 1–312. [Google Scholar]
  65. Wu, L.; Ma, L.; Huang, G.; Li, J.; Xu, H. Distribution and Speciation of Rare Earth Elements in Coal Fly Ash from the Qianxi Power Plant, Guizhou Province, Southwest China. Minerals 2022, 12, 1089. [Google Scholar] [CrossRef]
  66. Kolker, A.; Scott, C.; Hower, J.C.; Vazquez, J.A.; Lopano, C.L.; Dai, S. Distribution of rare earth elements in coal combustion fly ash, determined by SHRIMPRG ion microprobe. Int. J. Coal Geol. 2017, 184, 1–10. [Google Scholar] [CrossRef]
  67. Götze, J.; Plötze, M.; Graupner, T.; Hallbauer, D.K.; Bray, C. Trace element incorporation into quartz: A combined study by ICP-MS, electron spin resonance, cathodoluminescence, capillary ion analysis and gas chromatography. Geochim. Cosmochim. Acta 2004, 68, 3741–3759. [Google Scholar] [CrossRef]
  68. Götze, J.; Pan, Y.; Müller, A. Mineralogy and mineral chemistry of quartz: A review. Mineral. Mag. 2021, 85, 639–664. [Google Scholar] [CrossRef]
Figure 1. Differentiation of the contents of: (a) individual phases; (b) dependence of the glassy phase (Am) on the sum of quartz and mullite (Q + Mu) in the tested bottom ash (BFA) and fly ash (FA) (r—correlation coefficient value; p—confidence interval).
Materials 17 04323 g001
Figure 2. Projection points of the tested bottom ashes in Vassilev’s phase classification of fly ash [60] against the background of fly ash from the same fuel combustion cycle [42].
Materials 17 04323 g002
Figure 3. Projection points of the tested bottom ashes in Vassilev’s chemical classification of fly ash [60] against the background of fly ash from the same fuel combustion cycle [42].
Materials 17 04323 g003
Figure 4. The relationship between the percentage of critical elements in the tested bottom ashes and the prospective Coutl coefficient compared to the classification of coal ashes enriched in REEs [32] against the background of fly ash from the same fuel combustion cycle [42]. REY source: I—non-prospective; II—prospective; III—a highly prospective REY source.
Materials 17 04323 g004
Figure 5. Distribution of REY content in the tested bottom ash against the background of fly ash (FA) from the same fuel combustion cycle according to power plants: (a) Łagisza; (b) Siersza; (c) Jaworzno III; (d) Łaziska. The proportion of REY was normalized to their content in the upper continental crust (UCC) [64].
Materials 17 04323 g005
Figure 6. Values of correlation coefficients for the relationships between the contents of REY, LREY, MREY, HREY, and critical, non-critical, and excessive elements, and the contents of some phases in the tested bottom ash. Definitions: Am, glass; An, anorthite; Cc, calcite; He, hematite; Mgh, maghemite; Mgt, magnetite; Mu, mullite; Q, quartz; SpFe, Fe spinel.
Materials 17 04323 g006
Figure 7. Dependence on the contents of: (af) LREY, MREY, HREY, and critical, non-critical, and excessive elements on the sum of glass and mullite (Am+Mu); (g,h) HREY and critical elements on quartz (Q) in the tested bottom ash. Explanations: r—correlation coefficient value; p—confidence interval.
Materials 17 04323 g007
Figure 8. Values of correlation coefficients (r) for the relationships between the contents of REY, LREY, MREY, HREY, and critical, non-critical, and excessive elements, and the contents of (a) SiO2, TiO2, Al2O3, Fe2O3, Mn3O4, and MgO; (b) CaO, Na2O, K2O, P2O5, SO3, and LOI in the tested bottom ash.
Materials 17 04323 g008
Figure 9. Dependence on the content of: (ae) REY, LREY, MREY, and critical and non-critical elements on the Al2O3; (fh) REY, LREY, and excessive elements on Mn3O4 in the tested bottom ash. Explanations: r—correlation coefficient value; p—confidence interval.
Materials 17 04323 g009
Figure 10. Dependence on the content of: (a) non-critical elements on the Mn2O3; (bh) REY, LREY, critical, non-critical, and excessive elements on K2O in the tested bottom ash. Explanations: r—correlation coefficient value; p—confidence interval.
Materials 17 04323 g010
Figure 11. Dependence on the content of: (af) REY, LREY, HREY, critical, non-critical, and excessive elements on P2O5; (g) HREY on SO3; (h) HREY on the LOI in the tested bottom ash. Explanations: r—correlation coefficient value; p—confidence interval.
Materials 17 04323 g011
Figure 12. Diagram of the SiO2/Al2O3-CaO/MgO-K2O/Na2O system, with projection points indicating the range of REY and P2O5 contents in the bottom ash samples tested.
Materials 17 04323 g012
Table 1. The selected bottom ash samples for testing.
Power PlantSample
ŁagiszaZ1
Z2
SierszaZ3
Z4
Jaworzno IIIZ5
Z6
ŁaziskaZ7
Z8
Table 2. The phase components content in the tested bottom ash samples (in % mass).
Power PlantSampleQMuAnCcHeMgtMghSpFeAmTotal
ŁagiszaZ111.927.72.50.51.50.81.02.152.0100.0
Z211.523.92.60.40.4 0.61.559.1100.0
SierszaZ311.211.94.80.50.6 0.51.569.0100.0
Z415.717.23.70.71.10.70.31.259.4100.0
Jaworzno IIIZ58.819.94.2 1.0 0.32.163.7100.0
Z68.414.33.60.41.60.30.80.969.7100.0
ŁaziskaZ75.719.63.10.60.3 0.42.567.8100.0
Z84.326.62.20.70.30.10.52.063.3100.0
Min.4.311.92.20.00.3 0.30.952.0
Max.15.727.74.80.71.60.81.02.569.7
S9.720.13.30.50.90.20.61.762.6
SD3.45.30.80.20.50.30.20.55.8
V35.426.325.244.457.9131.441.629.19.2
Am, glass; An, anorthite; Cc, calcite; He, hematite; Mgh, maghemite; Mgt, magnetite; Mu, mullite; Q, quartz; SpFe, Fe spinel; Min., minimum; Max., maximum; S, average; SD, standard deviation; V, coefficient of variation.
Table 3. Content of main chemical components in the tested bottom ash (in % mass).
Power PlantSampleSiO2TiO2Al2O3Fe2O3Mn3O4MgOCaONa2OK2OP2O5SO3LOIDAISiO2/
Al2O3
(MgO + CaO)/
(K2O + Na2O)
CaO/
MgO
K2O/
Na2O
ŁagiszaZ146.370.9123.049.190.112.232.861.052.080.220.2111.734.962.011.631.281.98
Z245.310.8221.758.470.091.892.270.992.080.210.2515.875.382.081.361.202.10
SierszaZ348.800.8120.348.260.102.573.721.822.130.100.1411.214.962.401.591.451.17
Z446.340.7318.517.930.102.503.581.442.060.090.1716.554.812.501.741.431.43
JaworznoZ550.231.0124.2110.060.092.082.971.452.190.170.195.355.082.071.391.431.51
Z649.930.9323.3315.320.092.193.740.802.240.210.430.793.512.141.951.712.80
ŁaziskaZ748.760.9525.949.540.122.873.841.182.960.290.363.194.691.881.621.342.51
Z846.810.9625.488.320.122.893.350.733.080.330.277.665.041.841.641.164.22
Min. 45.310.7318.517.930.091.892.270.732.060.090.140.793.511.841.361.161.17
Max 50.211.0125.9415.320.122.893.841.823.080.330.4316.555.382.501.951.714.22
S 47.810.8922.829.640.102.403.291.182.350.200.259.054.802.121.611.372.22
SD 1.710.092.372.250.010.340.510.350.390.080.095.390.560.230.190.170.98
V 3.599.8410.3923.3711.5114.2315.6229.1616.5938.3536.5159.6311.6610.9811.6712.5744.22
LOI, loss of ignition; DAI, detrital/authigenic index; Min., minimum; Max., maximum; S, average; SD, standard deviation; V, coefficient of variation.
Table 4. The REY content in examined fly ash samples and basic statistical parameters.
PPSYLaCePrNdSmEuGdTbDyHoErTmYbLuType
REE
[ppm]
ŁaziskaZ131.8034.1077.049.4036.506.901.706.601.106.301.203.500.603.600.50H
Z234.0033.4075.909.3037.308.701.807.601.107.201.303.900.603.600.50H
SierszaZ337.3033.8073.358.8034.007.801.807.601.107.301.403.700.503.600.60H
Z433.8030.3067.318.0030.206.801.506.501.105.601.203.100.503.200.50H
JaworznoZ536.6031.1073.728.9035.307.301.607.301.207.301.504.400.503.600.50H
Z641.0032.5073.958.8035.608.101.908.101.307.601.504.400.604.000.70H
ŁaziskaZ745.9041.2096.3111.2046.509.502.109.601.508.901.804.800.805.100.80H
Z839.3041.9092.8911.3045.609.401.908.701.307.901.504.200.704.400.60H
Min. 31.8030.3067.318.0030.206.801.506.501.105.601.203.100.503.200.50
Max 45.9041.9096.3111.3046.509.502.109.601.508.901.804.800.805.100.80
S 37.4634.7978.819.4637.638.061.797.751.217.261.434.000.603.890.59
SD 4.564.3810.201.185.631.060.191.040.150.990.200.560.110.600.11
V 12.1612.5812.9412.4814.9513.1410.5513.4312.0213.6713.9113.8917.8215.5219.17
PPSREYLREYMREYHREYLREYMREYHREYCUECUEREOCoutl
[ppm][%][ppm][%][ppm]
ŁaziskaZ1220.84163.9447.509.407422480.9057.0082.94372638261.000.98
Z2226.20164.6051.709.907323485.3059.0081.90382636267.421.04
SierszaZ3222.65157.7555.109.807125485.2058.0079.45382636263.611.07
Z4199.61142.6148.508.507124475.3051.6072.71382636236.411.04
JaworznoZ5220.82156.3254.0010.507124586.4054.6079.82392536261.381.08
Z6230.05158.9559.9011.206926591.8057.5080.75402535272.571.14
ŁaziskaZ7286.01204.7168.0013.3072245109.7071.50104.81382537338.411.05
Z8271.59201.0959.1011.4074224100.2071.30100.09372637320.981.00
Min. 199.61142.6147.508.5069.0921.514.2075.3051.6072.7136.6324.7335.10236.410.98
Max 286.01204.7168.0013.3074.2326.044.87109.7071.50104.8139.9026.2537.56338.411.14
S 234.72168.7555.4810.5071.8523.684.4789.3560.0685.3138.0825.6036.33277.721.05
SD 28.9122.156.741.471.741.550.2511.017.3711.081.090.590.7434.100.05
V 12.3113.1312.1614.032.436.545.6812.3312.2712.992.862.322.0512.284.74
PP, power plant; S, sample; Coutl, outlook coefficient; REOs, rare earth elements oxides; C, critical; U, non-critical; E, excessive; Min., minimum; Max., maximum; S, average; SD, standard deviation; V, coefficient of variation.
Disclaimer/Publisher’s Note: The statements, opinions and data contained in all publications are solely those of the individual author(s) and contributor(s) and not of MDPI and/or the editor(s). MDPI and/or the editor(s) disclaim responsibility for any injury to people or property resulting from any ideas, methods, instructions or products referred to in the content.

