2.1. Testing Materials
(1) Cement: Tianshan P·O42.5R cement produced by Xinjiang Urumqi Tianshan Cement Plant (Urumqi, China), with an actual strength of 44.6 MPa;
(2) Natural coarse aggregate (NCA): pebbles in Urumqi, Xinjiang produced in Xinjiang Kangsheng Lvyuan Building Materials Co., Ltd. (Urumqi, China), with particle size of 5–30 mm and bulk density of 2687 kg/m3;
(3) Recycled coarse aggregate (RCA): it is broken from the abandoned cement stabilized base after the demolition of a military apron in Liugong Town, Changji Prefecture, Xinjiang. The particle size ranges from 5 mm to 30 mm, and the bulk density is 2613 kg/m
3. The detailed performance indicators are outlined in
Table 1.
(4) Fine aggregate: washing-machine-made sand in Xinjiang, with fineness modulus of 3.0 and apparent density of 2487 kg/m3;
(5) DS: taken from the Taklimakan Desert, with fineness modulus of 0.12, average particle size of 0.118 (
Table 2), bulk density of 1334 kg/m
3, apparent density of 2790 kg/m
3, water content of 0.4%, and mud content of 0.4%.
(6) FA: produced in Xinjiang Kangsheng Lvyuan Building Materials Co., Ltd. (Urumqi, China).
2.4. Test Methods
Using the results of the standard compaction test, the mass of the mixture required to prepare the specimen is calculated based on the optimum water content and the maximum dry density obtained from the compaction test. The specimen preparation and strength test are conducted in adherence to the standard requirements [
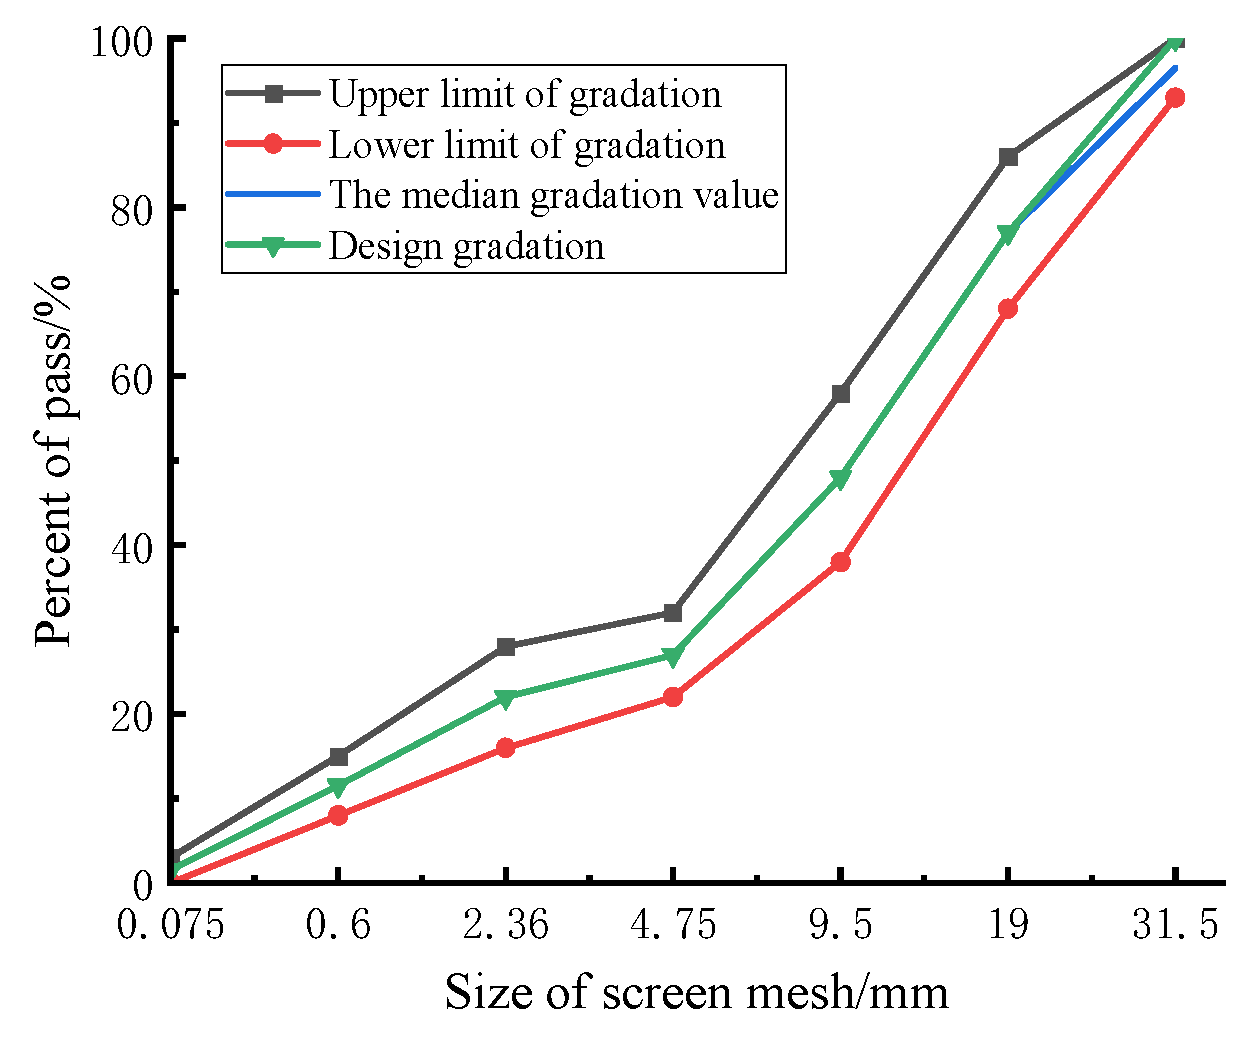
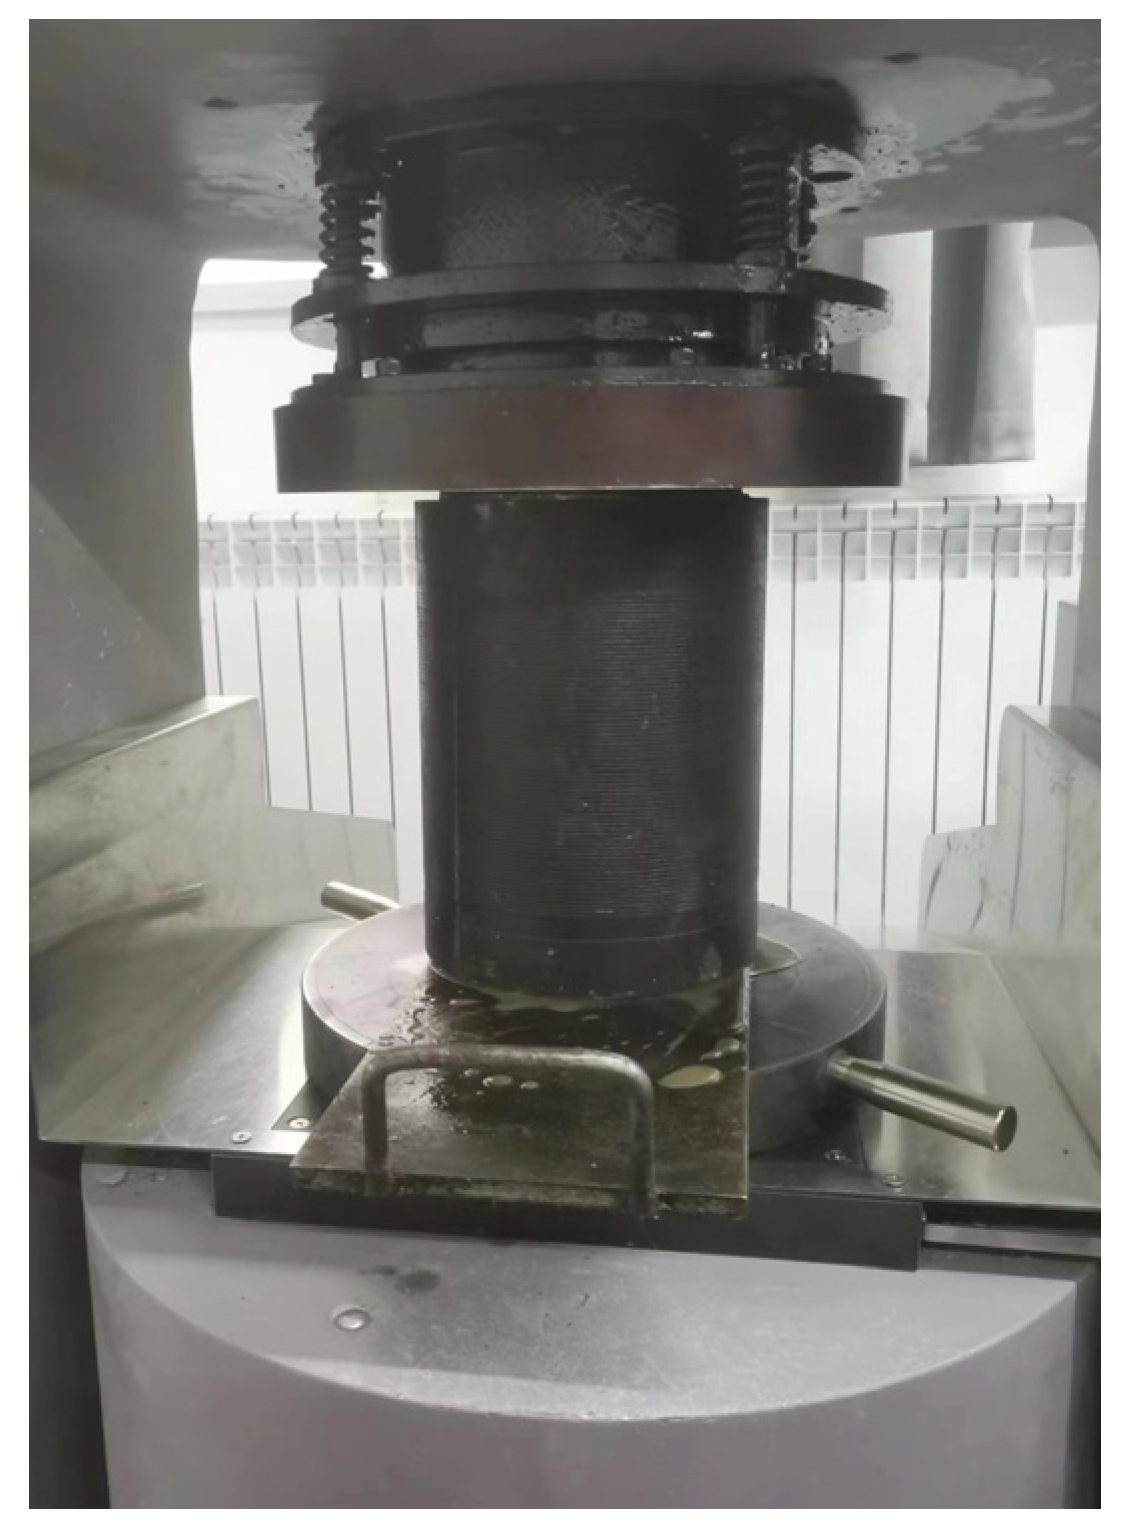
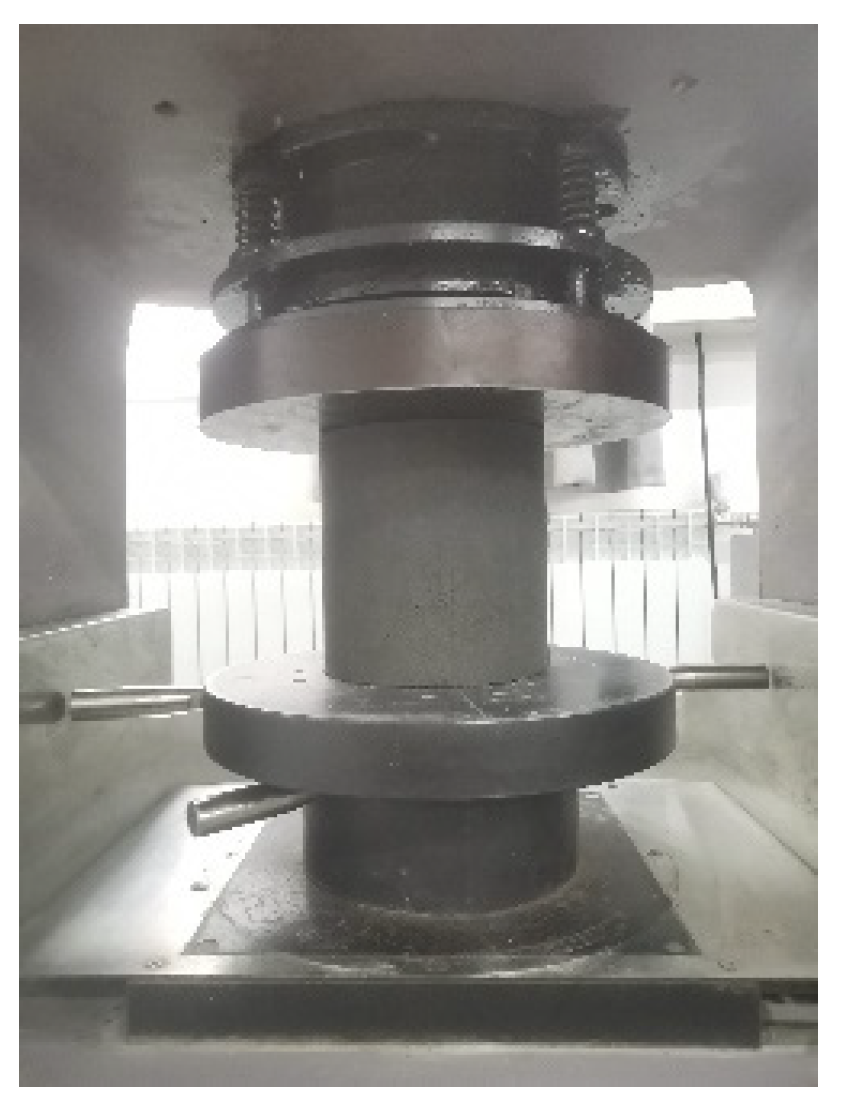
32]. The specimen (Φ 150 mm × 150 mm) is formed by static pressure method, as shown in
Figure 3. Six specimens are fabricated for each mixture rate and undergo the parallel test in turn, with the average value serving as the test result. After molding, the specimens were demolded and placed in a standard curing room set at a temperature of 20 °C ± 2 °C and a relative humidity of more than 95% for standard curing.
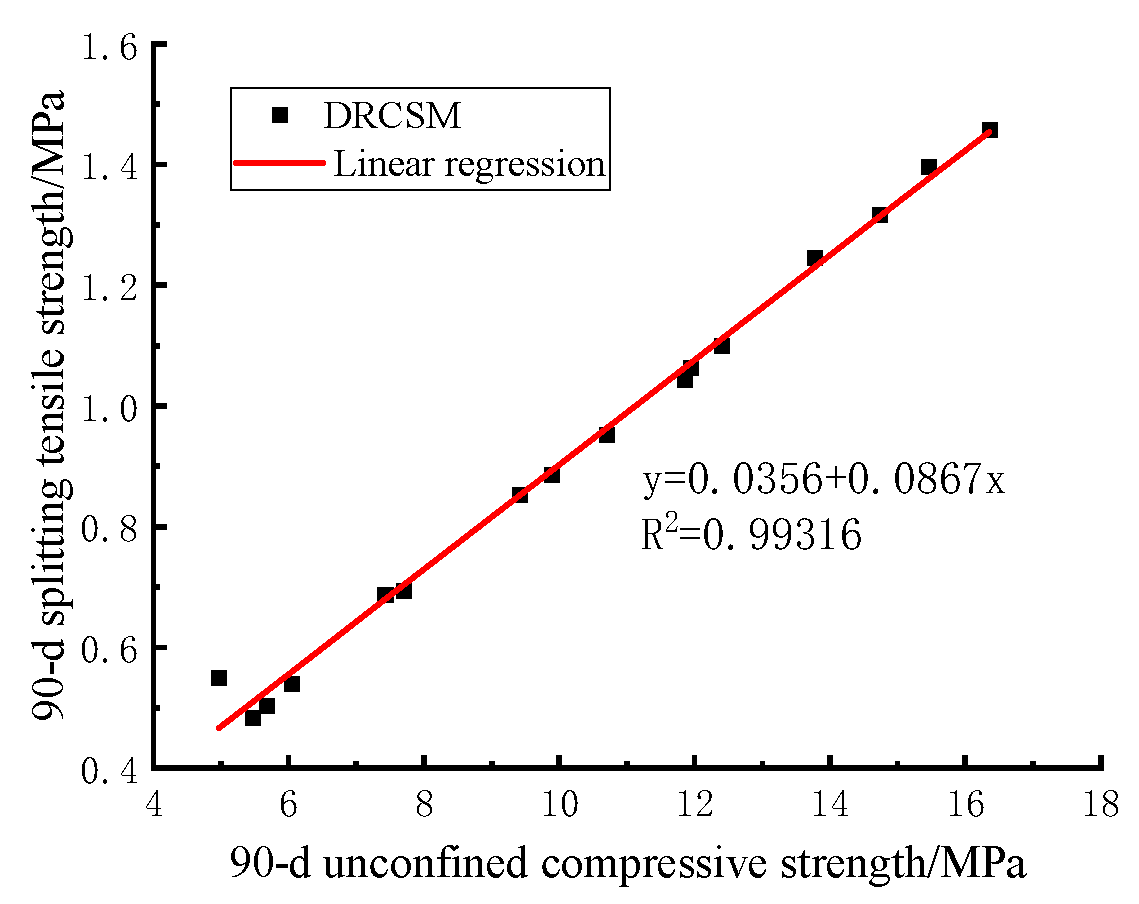
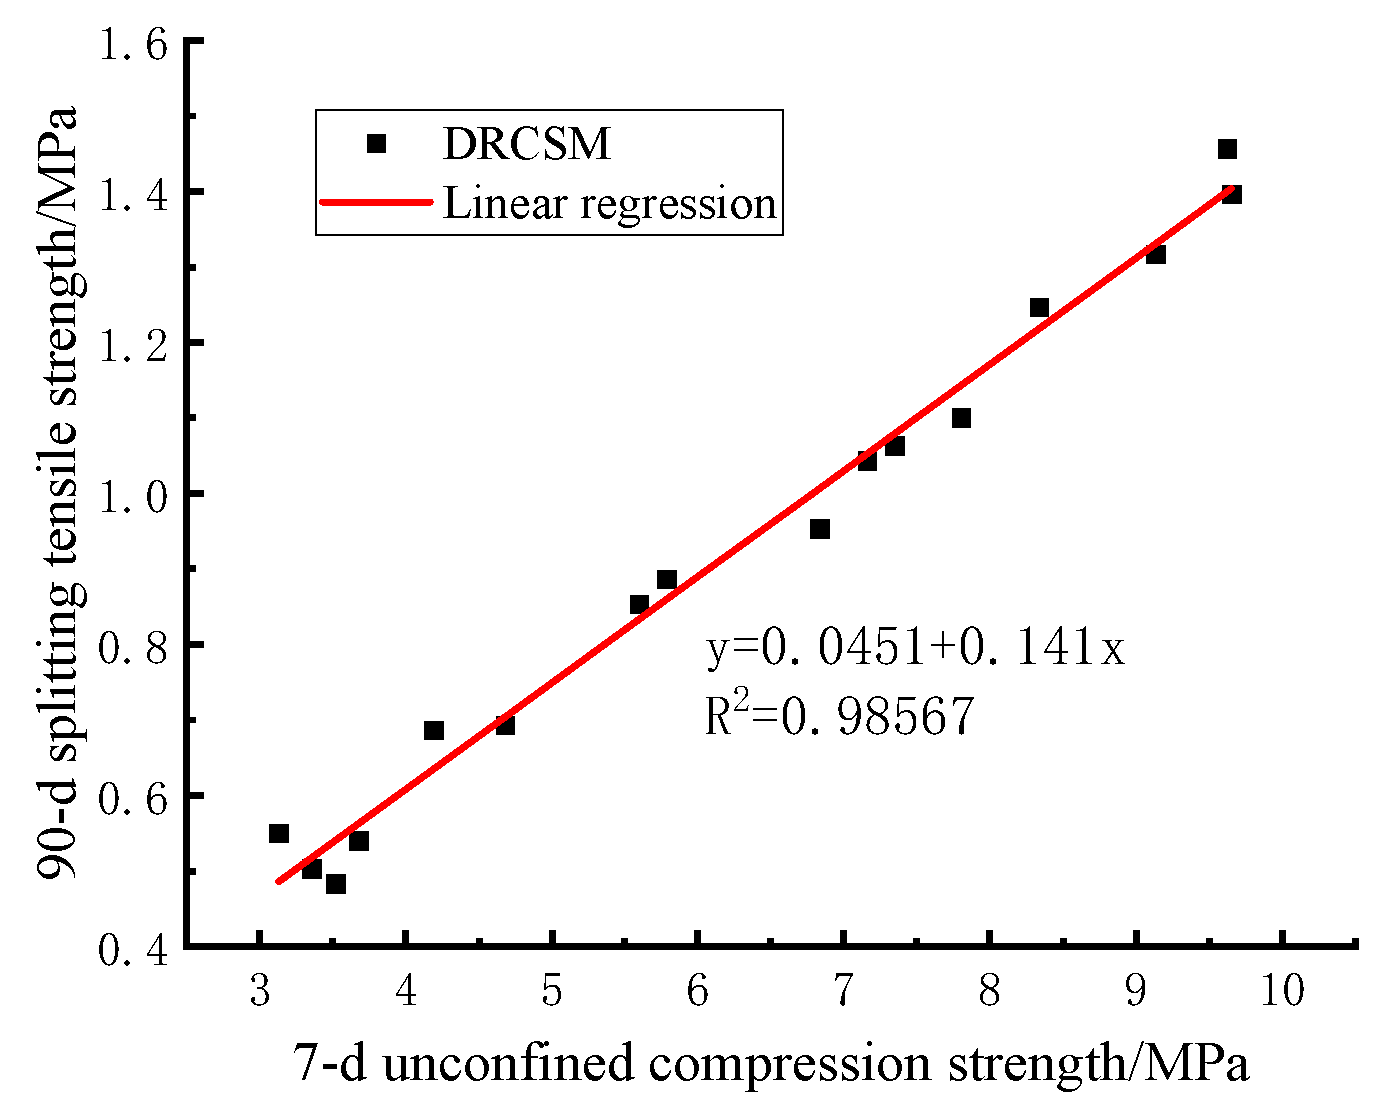
The specimens are cured for 7, 28, and 90 d, followed by 24 h of soaking after the specified age. Subsequently, the surface moisture is eliminated, and the mass is weighed. The height is measured to be accurate at 0.1 mm, and the surface is flattened with a scraper. Next, the unconfined compressive strength and splitting tensile strength are tested by universal pressure-testing machine, as displayed in
Figure 4, and the fixture used in the splitting test is shown in
Figure 5. During the test, the loading rate is set as 1 mm/min, and the pressure when the specimen is cracked is assigned as the maximum pressure.
The compressive strength of the mixture specimen is calculated according to Equation (1):
In the equation: —Compressive strength of the specimen/MPa;
—Maximum pressure at specimen failure/N;
—The sectional area of the specimen/mm2.
The splitting tensile strength of cement-stabilized base specimen is calculated according to Equation (2):
In the equation: —Splitting tensile strength of the specimen/MPa;
—Diameter of specimen/mm;
—Width of the layering/mm;
—The central angle corresponding to the half strip width/°;
—Maximum pressure at specimen failure/N;
—Height of the specimen after immersion/mm.
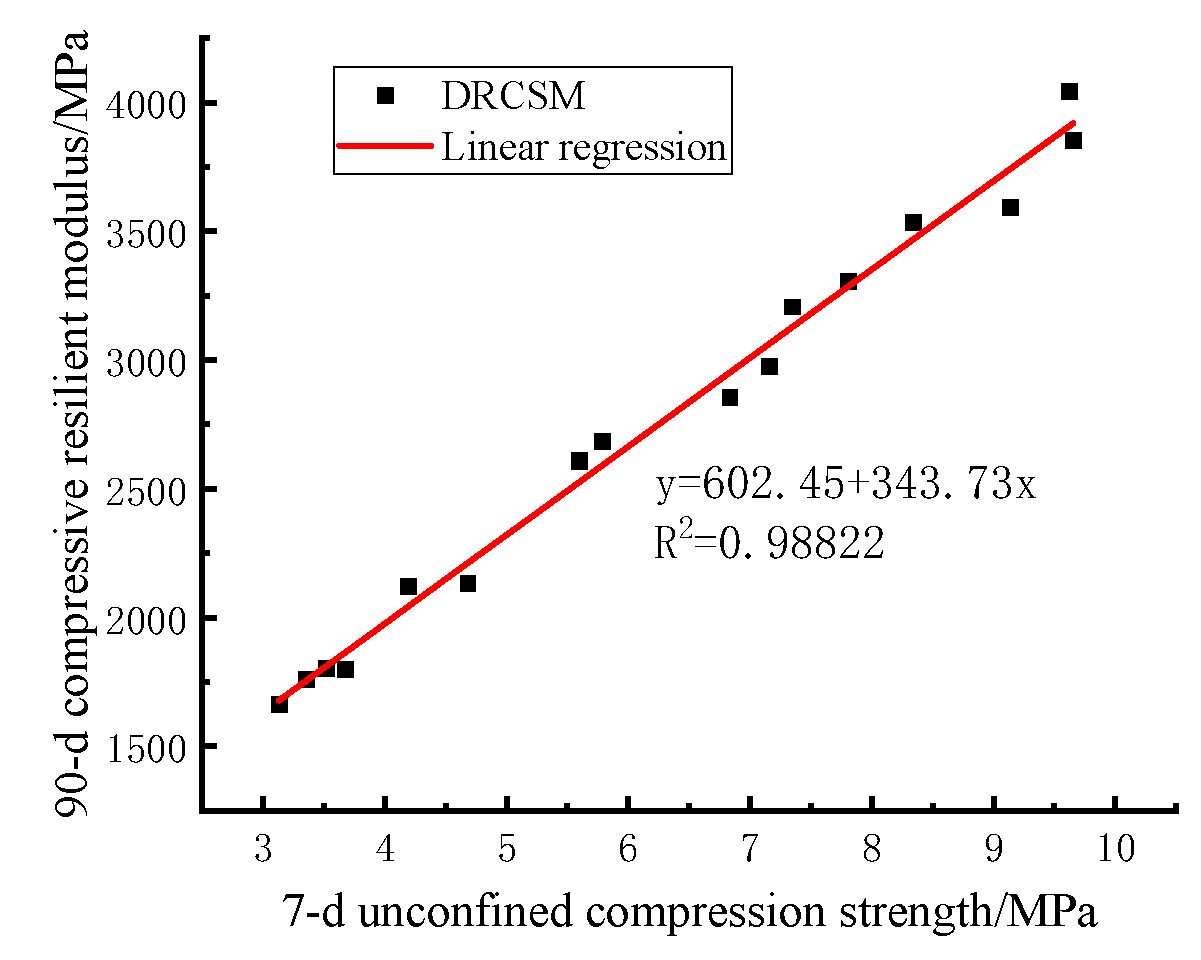
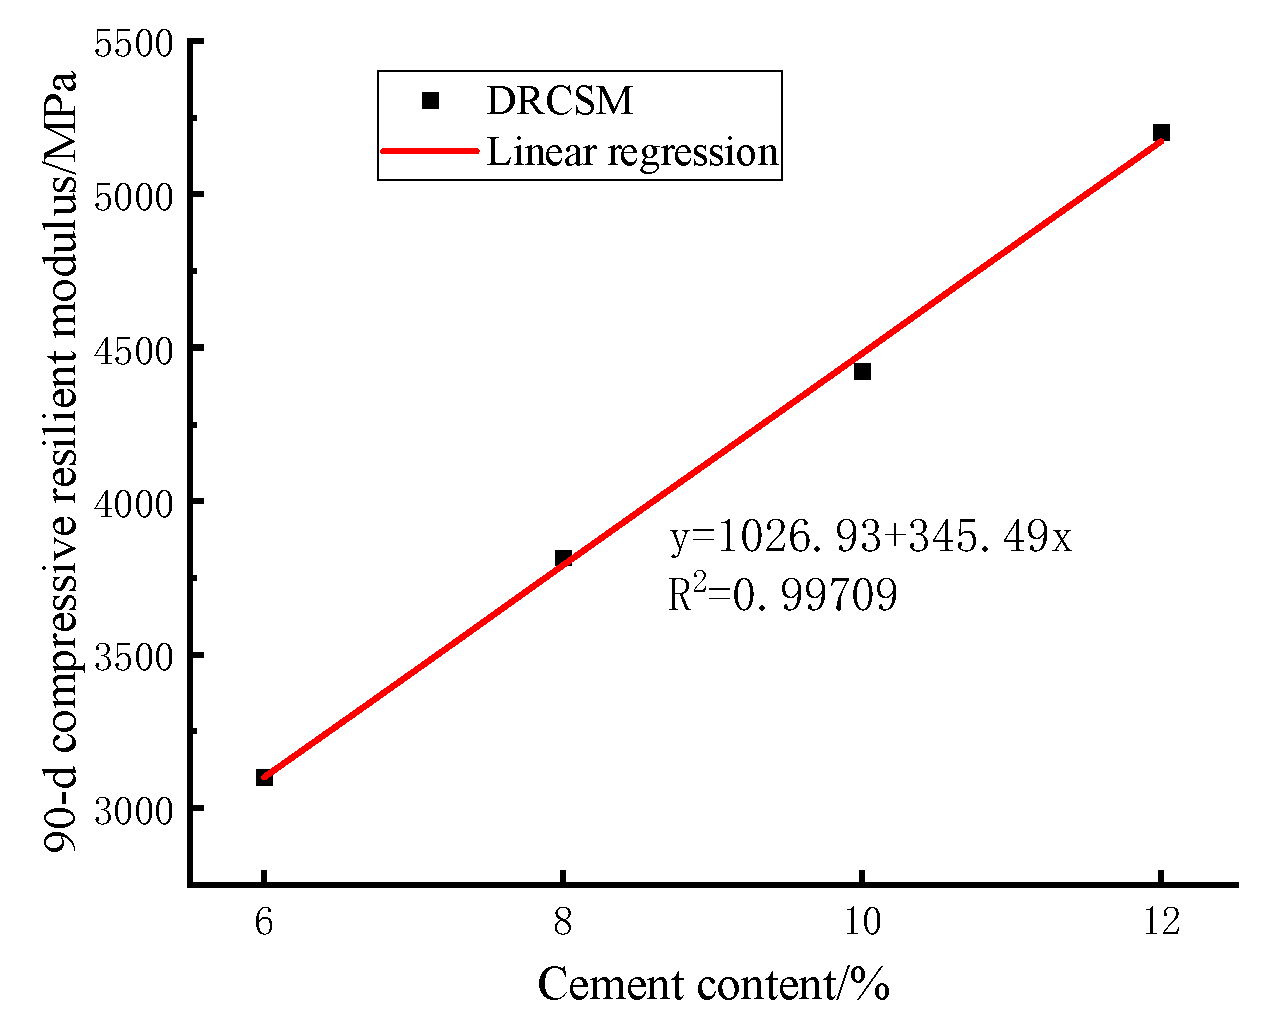
Expression for calculating the compressive resilient modulus under each load level is provided in Equation (3):
In the equation: —Compressive resilient modulus/MPa;
—Unit pressure/MPa;
—Height of the specimen/mm;
—Rebound deformation of the specimen/mm.
2.5. Carbon-Emission Life-Cycle Calculation of Recycled Aggregate
Xiao et al. [
29] utilized life-cycle assessment (LCA) methodology to delineate the carbon emissions associated with the utilization of recycled aggregates within road engineering, categorizing them into direct and indirect emissions. Direct emissions primarily comprise CO
2 emissions stemming from fossil energy utilization across various stages of recycled aggregate production and application, along with those arising from the cement manufacturing process. Indirect emissions encompass CO
2 emissions arising from energy acquisition processes (such as electricity and diesel usage), constituting an integral component of recycled aggregate carbon emissions.
The total carbon emission
and LCA-derived carbon emission
of recycled concrete can be quantitatively computed using Equations (4) and (5).
Among these equations,
represents the carbon emissions of each stage of the life cycle of recycled concrete. Specifically,
consists of carbon emissions
stemming from raw material production, and carbon emissions
originating from the transportation of raw materials to the recycled concrete mixing station. Both components can be calculated using Equations (6) and (7).
represents the carbon emission incurred during the production process of recycled concrete, which can be determined using Equation (8).
denotes the carbon emission arising from the transportation of ready-mixed recycled concrete to the construction site, ascertainable through Equation (9). It is pertinent to note that the average transportation distance is 30 km.
denotes the carbon emissions attributed to recycled concrete during the construction phase. It is posited that the carbon emissions of recycled concrete and conventional concrete are substantially equivalent during construction. Drawing from reference [
20], an average value of 21.8 is adopted as the carbon emissions of the primary components, representing the carbon emissions of unit recycled concrete construction
.
denotes the carbon emissions incurred during the demolition of recycled concrete. This includes carbon emissions
generated throughout the demolition process and carbon emissions
arising during the transportation of waste concrete. As per reference [
33], precise calculation of carbon emissions during the demolition process poses challenges. Consequently, it is approximated at 90% of the construction process, yielding
, while
can be calculated using Equation (6).
Due to the varying data requirements across each stage of the life cycle, the variables in Equations (6)–(9) are explained as follows: represents the quantity of the first type of raw materials per unit of recycled concrete; denotes the quantity of energy (e.g., electric energy, coal, diesel) consumed in the production of raw materials; signifies the carbon emission coefficient of various energy sources, comprising the aggregate of both direct carbon emission coefficient and the indirect carbon emission coefficient . represents the carbon emission associated with each material in cement production; stands for the direct carbon emission coefficient engendered by transportation usage; signifies the unit transportation energy consumption for the respective transportation mode; represents the transportation distance of raw materials for category i; represents the transportation distance of recycled concrete; m signifies the total mass of recycled concrete per cubic meter.
Xiao et al. [
34] discovered that the alkaline substances present in concrete possess the capability to absorb atmospheric CO
2 and undergo reaction, thereby exerting a compensation effect on the environment. Furthermore, they noted a correlation between the carbonation depth of recycled concrete and the replacement rate of recycled aggregate. To facilitate prediction, they proposed an equation for estimating the carbonation depth of recycled concrete, presented as Equation (10).
represents the carbonization depth, serving as an indicator of concrete’s carbonization extent. It is noteworthy that higher carbonization degree in concrete corresponds to increased CO
2 absorption over time.
denotes the carbon-absorption capacity resulting from the carbonation of recycled concrete, quantifiable through Equation (11).
signifies relative humidity;
represents the unit water consumption of recycled concrete;
denotes the correction coefficient of cement type, assumed as 1 within this study;
represents the correction coefficient for cement hydration. For curing ages exceeding 90 days,
assumes a value of 0.85 at 1 d and 28 d, with linear interpolation for other ages.
stands for the volume fraction of CO
2;
signifies the duration of carbonization; and
represents the influence coefficient of recycled aggregate, where its value interpolates linearly between 1 and 1.5 across a range of recycled aggregate replacement rates from 0% to 100%.
denotes the quantity of CO
2 absorbed per unit of recycled concrete upon complete carbonization, calculated following reference [
35].
represents the exposed surface area per unit of recycled concrete, with a recommended value of 5.68 m
2 based on reference [
36].


