
Prediction of Rock Unloading Strength Based on PSO-XGBoost Hybrid Models


Abstract
1. Introduction
2. Rock Unloading Path
- (1)
- Path I: The confining stress decreases while the axial stress keeps increasing (i.e., o~a~b~c in Figure 1a). During this loading path, σ1 = σ2 = σ3 is firstly increased from Point o to Point a (hydrostatic pressure). Then, keeping σ2 = σ3 constant and increasing the axial stress σ1 to the unloading Point b, unloading σ2 = σ3 is finally achieved while σ1 continues to increase until rock failure Point c.
- (2)
- Path II: The confining stress decreases while the axial stress stays constant (i.e., o~a~b~d in Figure 1a). The loading procedure of o~a~b is the same as for Path I. Finally, unloading σ2 = σ3 is achieved while σ1 stays constant until rock failure Point d.
- (3)
- Path III: The confining stress decreases while the axial stress also decreases (i.e., o~a~b~e in Figure 1a). The loading procedure of o~a~b is the same as for Path I. Finally, both confining stress σ2 = σ3 and σ1 unload until rock failure Point e.

3. Model Construction
3.1. XGBoost Model
- (1)
- Gradient boosting framework
- (2)
- Objective function
- (3)
- Tree construction
- (4)
- Approximate histogram algorithm
- (5)
- Parallel processing
- (6)
- Sub-sampling and column sampling
- (7)
- Missing value processing
- (8)
- Information on second-order derivatives
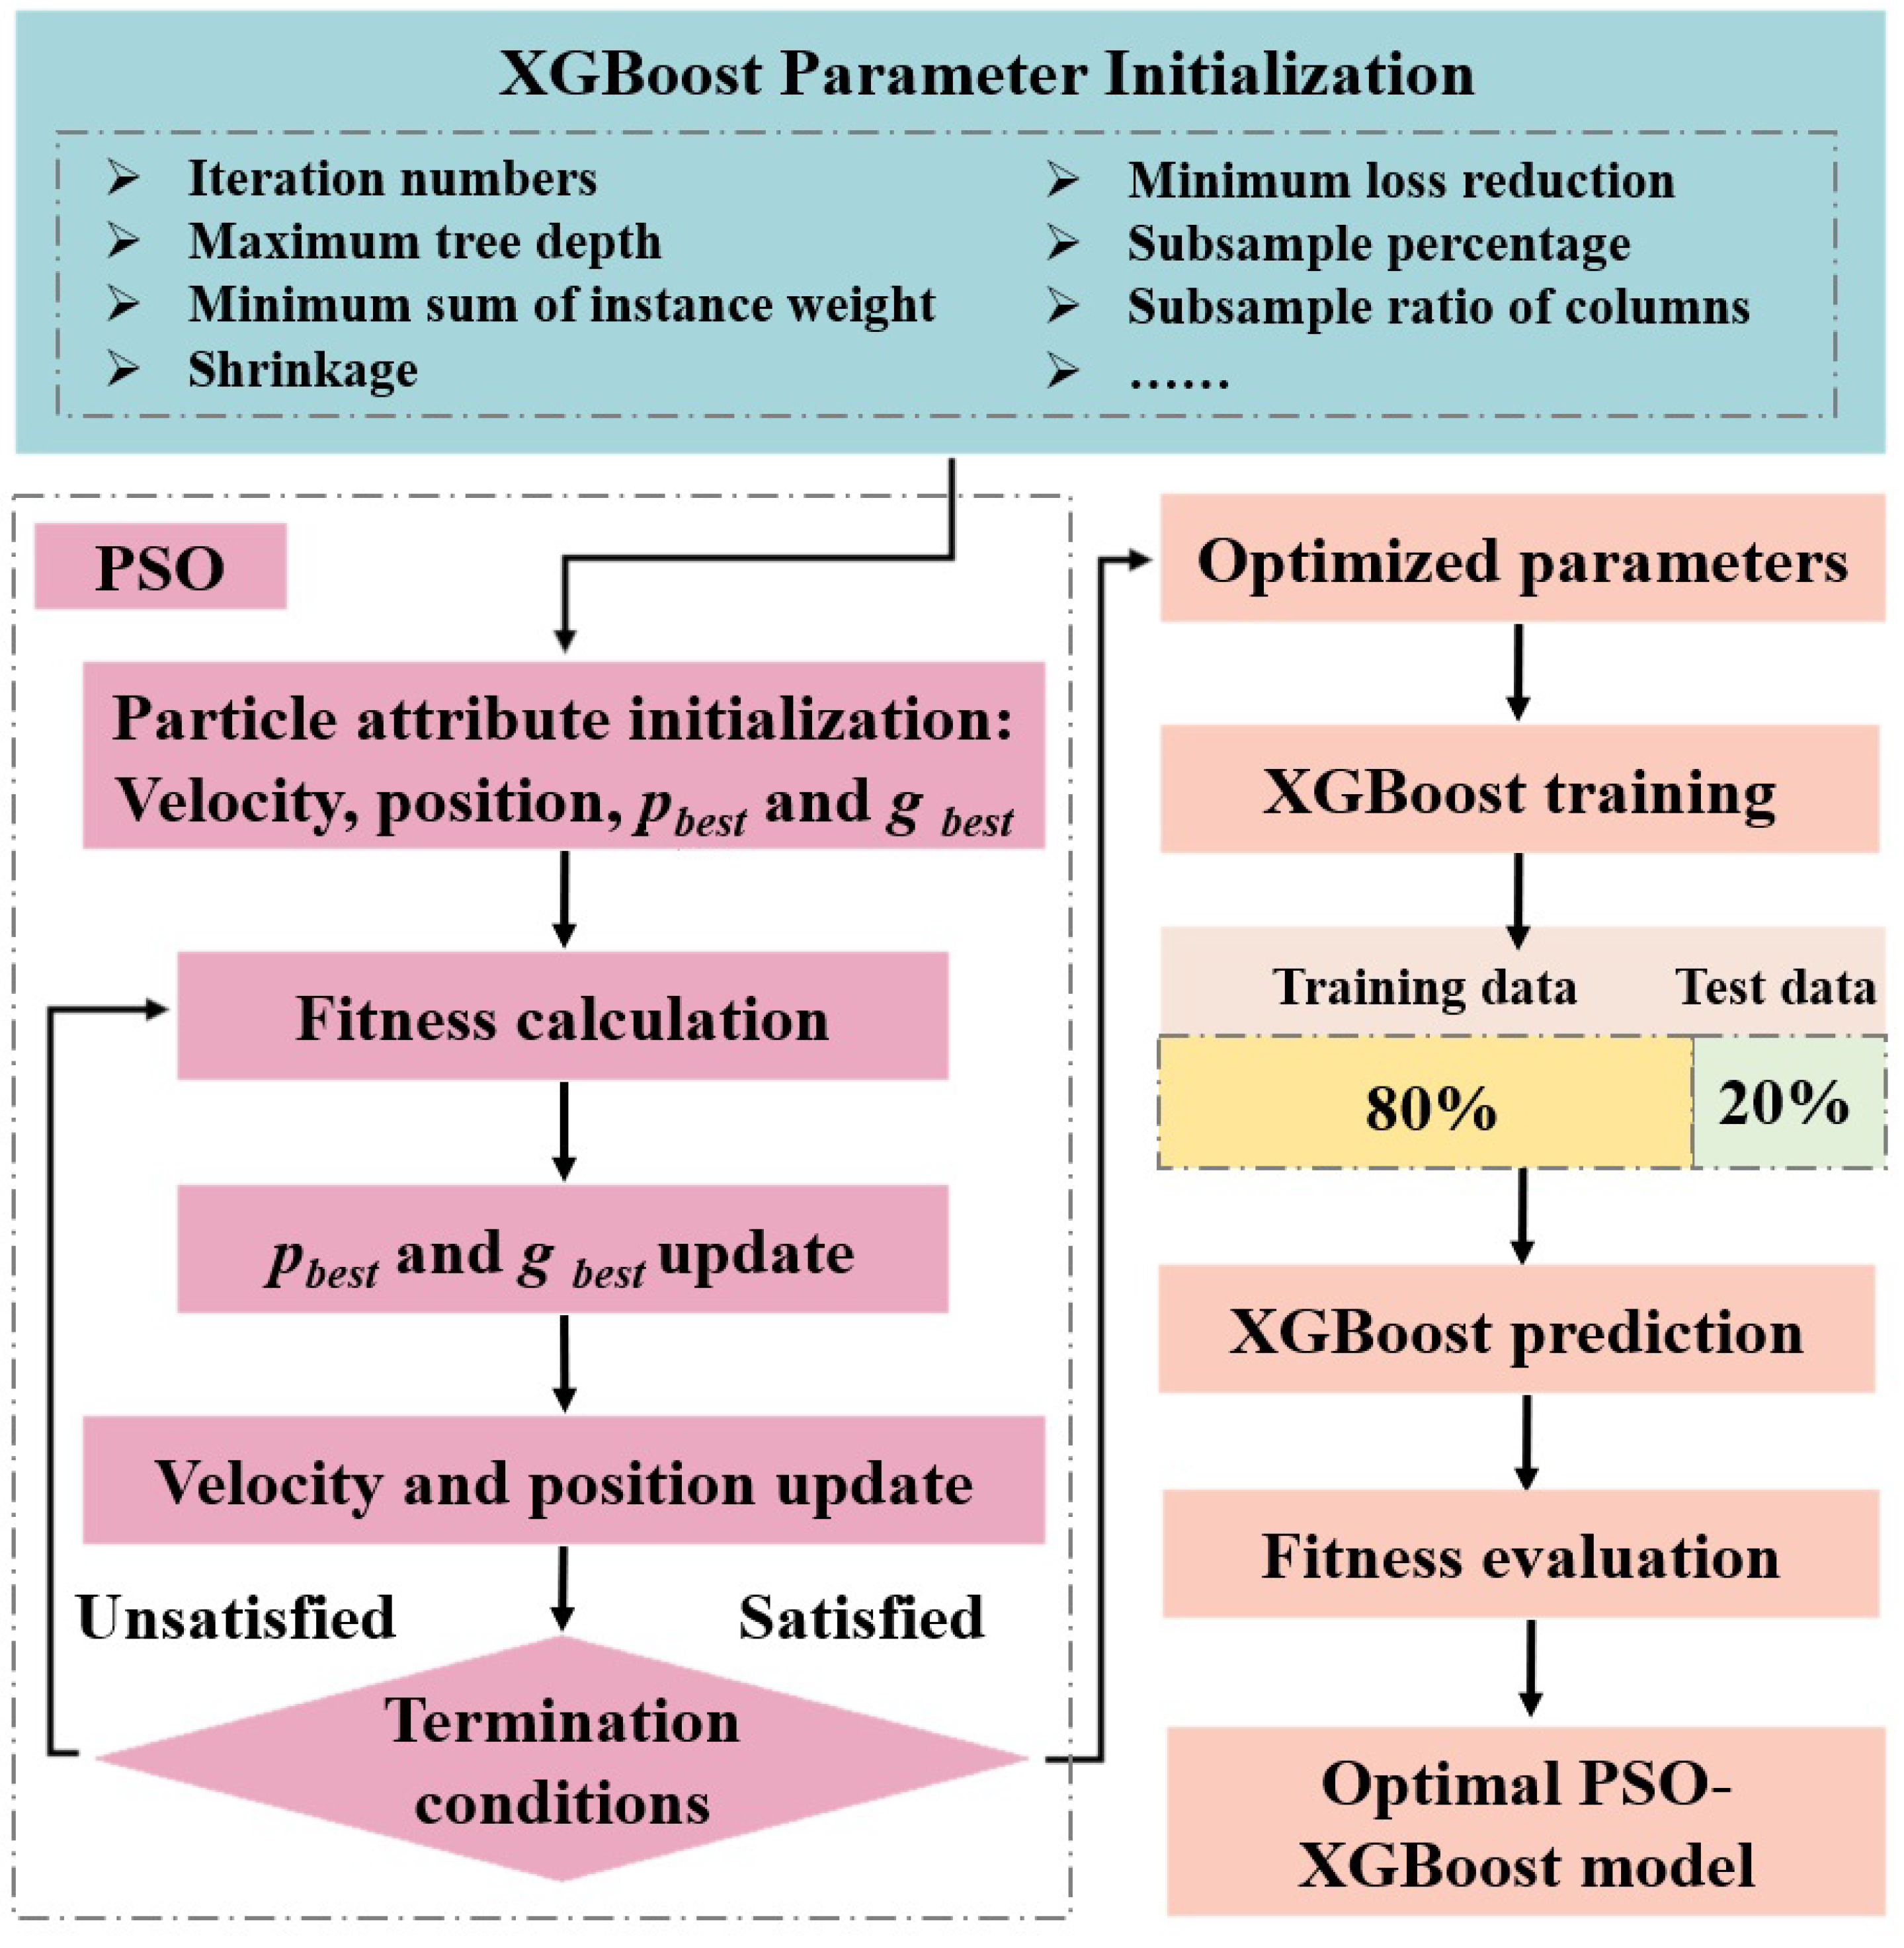
3.2. PSO-XGBoost Hybrid Model
4. Model Validation
4.1. Database Construction
4.2. Evaluation Indicators
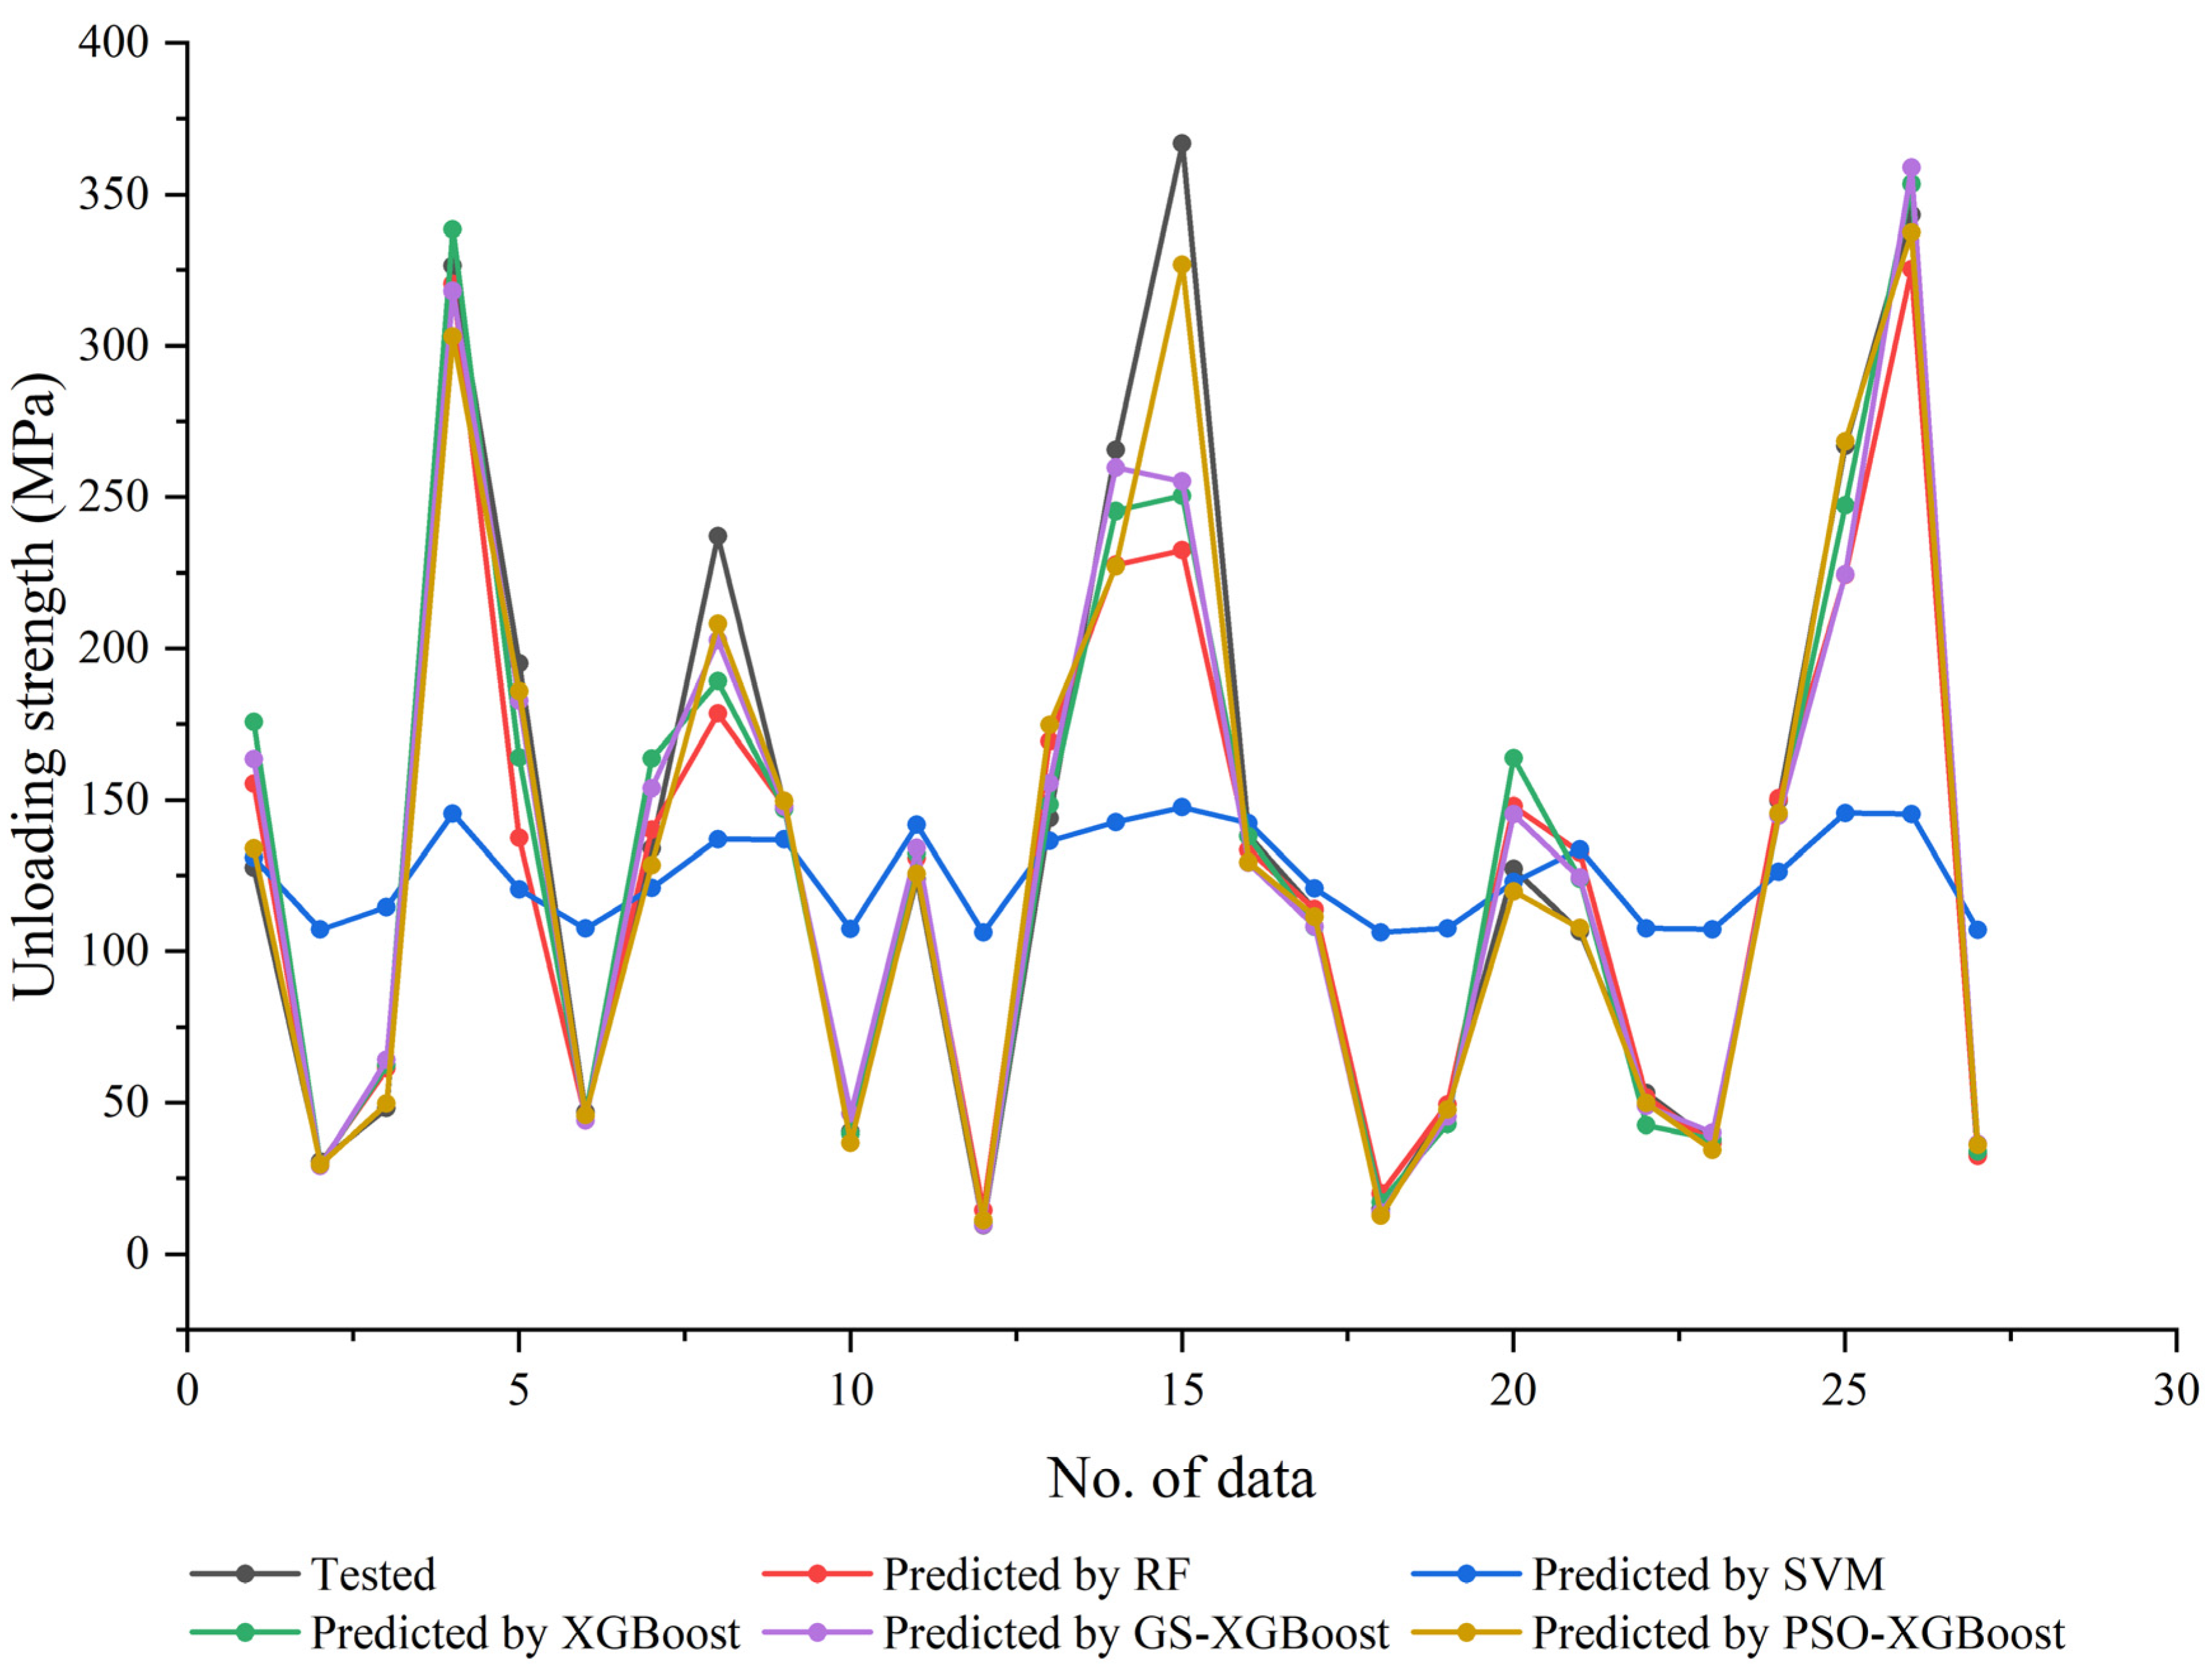
4.3. Model Evaluation
- (1)
- Rock unloading strength may be affected by a variety of factors and there may be complex interactions between these factors. The RF model can naturally handle multi-categorization or multi-labeling tasks such as rock strength prediction without the need for one-to-one or one-to-all approaches as in SVM. Therefore, the RF model is more suitable than the SVM model for rock unloading strength predictions.
- (2)
- In addition, the XGBoost model is a highly flexible model that can fit nonlinear relationships well, whereas the RF model and SVM model may not perform well in dealing with certain types of nonlinear relationships; thus, the XGBoost model outperforms the RF model and SVM model in terms of prediction accuracy.
- (3)
- Finally, both the PSO-XGBoost hybrid model and GS-XGBoost hybrid model improved the prediction accuracy and generalization ability by optimizing the hyperparameters of the XGBoost model. In particular, the PSO-XGBoost model achieved a fast and extensive search through the particle swarm optimization algorithm, and it is able to find a near-optimal combination of parameters in a shorter time. In contrast, the GS-XGBoost model systematically explores the predefined parameter space through the grid search method, which is able to find the global optimal solution but is less efficient when the parameter space is large. In summary, with respect to the prediction performance, PSO-XGBoost hybrid model > GS-XGBoost hybrid model > XGBoost model.
4.4. Feature Importance Analysis
- (1)
- Node splitting: During the construction of the tree, the features and splitting points that cause the objective function (e.g., the loss function) to decrease the most are selected at each moment a node splits. This process is achieved by maximizing the gain (Gain).
- (2)
- Gain calculation: The gain indicates the degree of improvement of the objective function before and after the split. Specifically, the gain is the sum of the objective function of the two child nodes after the split minus the objective function of the parent node before the split. The greater the gain, the greater the contribution of the feature in the splitting of this node.
- (3)
- Gain accumulation: Traverse all trees and nodes and accumulate the gain of each feature over all nodes to obtain the total value of each feature.
- (4)
- Normalization: The total gain of each feature is divided by the total gain of all features to obtain the relative importance of each feature.
4.5. Discussion
5. Conclusions
- (1)
- The complexity of the rock unloading environment makes it difficult to perform accurate strength predictions. In this study, the particle swarm optimization (PSO) algorithm was combined with the extreme gradient boosting (XGBoost) algorithm to propose a new rock unloading strength prediction model. Through using PSO to automate the parameter optimization search, the dependence on experience can be reduced and the prediction accuracy and efficiency of the XGBoost model can be improved.
- (2)
- Five indicators (R2, MAE, MAPE, MSE, and RMSE) were selected to evaluate the generalization performance of the proposed PSO-XGBoost hybrid model against the other four mainstream models (GS-XGBoost, XGBoost, RF, and SVM), in which the PSO-XGBoost hybrid model outperformed the other models in all the evaluation indicators. The generalization performance was ranked as PSO-XGBoost hybrid model > GS-XGBoost hybrid model > XGBoost model > RF model > SVM model.
- (3)
- For the four input features of the uniaxial compressive strength UCS, initial confining stress σ30, failure confining stress σ3p, and unloading velocity v, the gain of each feature was calculated for the importance analysis to assess the importance of each feature on the performance of the PSO-XGBoost hybrid model. The importance order of these features for the unloading strength of rock was obtained as follows: UCS > σ30 > σ3p > v.
Author Contributions
Funding
Institutional Review Board Statement
Data Availability Statement
Conflicts of Interest
References
- Chen, Y.F.; Lin, H.; Xie, S.J.; Ding, X.R.; He, D.L.; Yong, W.X.; Gao, F. Effect of joint microcharacteristics on macroshear behavior of single-bolted rock joints by the numerical modelling with PFC. Environ. Earth Sci. 2022, 81, 276. [Google Scholar] [CrossRef]
- Yang, H.T.; Bai, B.; Lin, H. Seismic magnitude calculation based on rate- and state-dependent friction law. J. Cent. South Univ. 2023, 30, 2671–2685. [Google Scholar] [CrossRef]
- Li, S.; Lin, H.; Lin, Q.B.; Wang, Y.X.; Zhao, Y.L.; Hu, H.H. Mechanical behavior and failure characteristics of double-layer composite rock-like specimens with two coplanar joints under uniaxial loading. Trans. Nonferrous Met. Soc. China 2023, 33, 2815–2831. [Google Scholar] [CrossRef]
- Tang, Y.; Lin, H.; Li, S.; Chen, Y.F.; Ou, K.; Xie, L.L. Numerical study of rock bridge shape identification and rock bridge damage mechanism. Comput. Part. Mech. 2024. [Google Scholar] [CrossRef]
- Kockar, M.K.; Akgun, H. Methodology for tunnel and portal support design in mixed limestone, schist and phyllite conditions: A case study in Turkey. Int. J. Rock Mech. Min. Sci. 2003, 40, 173–196. [Google Scholar] [CrossRef]
- Ha, Q.L. Loading rock mechanics and unloading rock mechanics. Chin. J. Geotech. Eng. 1998, 20, 114. [Google Scholar]
- Lau, J.S.O.; Chandler, N.A. Innovative laboratory testing. Int. J. Rock Mech. Min. Sci. 2004, 41, 1427–1445. [Google Scholar] [CrossRef]
- Swansson, S.R.; Brown, W.S. An observation of loading path independence of fracture in rock. Int. J. Rock Mech. Min. Sci. Geomech. Abstr. 1971, 8, 271–281. [Google Scholar] [CrossRef]
- Crouch, S.L. A note on post-failure stress-strain path dependence in norite. Int. J. Rock Mech. Min. Sci. Geomech. Abstr. 1972, 9, 197–204. [Google Scholar] [CrossRef]
- Zivaljevic, S.; Tomanovic, Z. Loading history effect on time-dependent deformations after unloading-reversible creep of soft rock (marl). Mech. Time-Depend. Mater. 2022, 26, 499–530. [Google Scholar] [CrossRef]
- Abi, E.; Yuan, H.C.; Cong, Y.; Wang, Z.Q.; Jiang, M.J. Experimental Study on the Entropy Change Failure Precursors of Marble under Different Stress Paths. KSCE J. Civ. Eng. 2023, 27, 356–370. [Google Scholar] [CrossRef]
- Gu, X.B.; Bi, J.; Xu, M. Zonal disintegration mechanism of isotropic rock masses around a deep spherical tunnel. J. Cent. South Univ. 2015, 22, 4074–4082. [Google Scholar] [CrossRef]
- Manouchehrian, A.; Cai, M. Simulation of unstable rock failure under unloading conditions. Can. Geotech. J. 2016, 53, 22–34. [Google Scholar] [CrossRef]
- He, M.; Zhao, F. Laboratory study of unloading rate effects on rockburst. Disaster Adv. 2013, 6, 11–18. [Google Scholar]
- Chen, Y.; Zuo, J.; Li, Z.; Dou, R. Experimental investigation on the crack propagation behaviors of sandstone under different loading and unloading conditions. Int. J. Rock Mech. Min. Sci. 2020, 130, 104310. [Google Scholar] [CrossRef]
- Li, X.; Cao, W.; Zhou, Z.; Zou, Y. Influence of stress path on excavation unloading response. Tunn. Undergr. Space Technol. 2014, 42, 237–246. [Google Scholar] [CrossRef]
- Bing, D.; Zhao, G.; Konietzky, H.; Wasantha, P.L.P. Experimental and Numerical Study on the Damage Evolution Behaviour of Granitic Rock during Loading and Unloading. KSCE J. Civ. Eng. 2018, 22, 3278–3291. [Google Scholar] [CrossRef]
- Fotovvat, A.; Sadrekarimi, A.; Etezad, M. Instability of gold mine tailings subjected to undrained and drained unloading stress paths. Geotechnique 2022, 74, 174–192. [Google Scholar] [CrossRef]
- Huang, X.; Liu, Q.; Liu, B.; Liu, X.; Pan, Y.; Liu, J. Experimental Study on the Dilatancy and Fracturing Behavior of Soft Rock Under Unloading Conditions. Int. J. Civ. Eng. 2017, 15, 921–948. [Google Scholar] [CrossRef]
- Xu, H.; Feng, X.-T.; Yang, C.; Zhang, X.; Zhou, Y.; Wang, Z. Influence of initial stresses and unloading rates on the deformation and failure mechanism of Jinping marble under true triaxial compression. Int. J. Rock Mech. Min. Sci. 2019, 117, 90–104. [Google Scholar] [CrossRef]
- Cao, W.; Li, X.; Tao, M.; Zhou, Z. Vibrations induced by high initial stress release during underground excavations. Tunn. Undergr. Space Technol. 2016, 53, 78–95. [Google Scholar] [CrossRef]
- Li, J.; Lin, F.; Liu, H.; Zhang, Z. Triaxial Experimental Study on Changes in the Mechanical Properties of Rocks Under Different Rates of Confining Pressures Unloading. Soil Mech. Found. Eng. 2019, 56, 246–252. [Google Scholar] [CrossRef]
- Wang, R.; Xu, B.; Wan, Y.; Wang, H.; Wang, W.; Meng, Q. Characteristics of unloading damage and permeability evolution of sandstone under hydro-mechanical coupling. Eur. J. Environ. Civ. Eng. 2023, 27, 2566–2575. [Google Scholar] [CrossRef]
- Zhang, L.; Gao, S.; Wang, Z.; Ren, M. Analysis on deformation characteristics and energy dissipation of marble under different unloading rates. Teh. Vjesn.-Tech. Gaz. 2014, 21, 987–993. [Google Scholar]
- Si, X.; Gong, F. Strength-weakening effect and shear-tension failure mode transformation mechanism of rockburst for fine-grained granite under triaxial unloading compression. Int. J. Rock Mech. Min. Sci. 2020, 131, 104347. [Google Scholar] [CrossRef]
- Meng, Y.Y.; Jing, H.W.; Liu, X.W.; Yin, Q. Effects of initial unloading level on the mechanical, micro failure and energy evolution characteristics of stratified rock mass under triaxial unloading confining pressure. Theor. Appl. Fract. Mech. 2023, 128, 104161. [Google Scholar] [CrossRef]
- Yin, P.F.; Yang, S.Q.; Gao, F.; Tian, W.L. Experimental and DEM Simulation Study on the Mechanical Characteristic and Strain Energy Evolution of Longmaxi Shale under a Confining Pressure Unloading Path. Energies 2023, 16, 5960. [Google Scholar] [CrossRef]
- Falegnami, A.; Tomassi, A.; Corbelli, G.; Romano, E. Managing Complexity in Socio-Technical Systems by Mimicking Emergent Simplicities in Nature: A Brief Communication. Biomimetics 2024, 9, 322. [Google Scholar] [CrossRef]
- Liu, X.R.; Liu, J.; Feng, H.; Du, L.B.; Zhong, Z.L. Experimental research on unloading mechanical properties of sandstone under different initial unloading levels and pore pressures. Yantu Gongcheng Xuebao/Chin. J. Geotech. Eng. 2018, 40, 1143–1151. [Google Scholar]
- Zhang, Y.; Yang, Y.; Ma, D. Mechanical Characteristics of Coal Samples under Triaxial Unloading Pressure with Different Test Paths. Shock Vib. 2020, 2020, 8870821. [Google Scholar] [CrossRef]
- Liu, Q.; Cheng, Y.; Jin, K.; Tu, Q.; Zhao, W.; Zhang, R. Effect of confining pressure unloading on strength reduction of soft coal in borehole stability analysis. Environ. Earth Sci. 2017, 76, 173. [Google Scholar] [CrossRef]
- Zheng, Z.Q.; Liu, H.Z.; Zhuo, L.; Xiao, M.L.; Xie, H.Q.; He, J.D.; Peng, M.L. Experimental Study on the Dilatancy and Energy Evolution Behaviors of Red-Bed Rocks under Unloading Conditions. Materials 2023, 16, 5759. [Google Scholar] [CrossRef] [PubMed]
- Guo, Y.; Wang, L.; Chang, X. Study on the damage characteristics of gas-bearing shale under different unloading stress paths. PLoS ONE 2019, 14, e0224654. [Google Scholar] [CrossRef] [PubMed]
- Chen, C.; Liu, L.P.; Cong, Y. Experimental Investigation on Deformation and Strength Behavior of Marble with the Complex Loading-Unloading Stress Path. Adv. Civ. Eng. 2020, 2020, 8853044. [Google Scholar] [CrossRef]
- Li, D.Y.; Sun, Z.; Xie, T.; Li, X.B.; Ranjith, P.G. Energy evolution characteristics of hard rock during triaxial failure with different loading and unloading paths. Eng. Geol. 2017, 228, 270–281. [Google Scholar] [CrossRef]
- Rui, Y.; Lv, J.K.; Bo, Z.; Ma, D.P. Rock Unloading Failure Precursor Based on Acoustic Emission Parametric Fractal Characteristics. Lithosphere 2022, 2022, 8221614. [Google Scholar] [CrossRef]
- Du, F.; Wang, K.; Wang, G.D.; Jiang, Y.F.; Xin, C.P.; Zhang, X. Investigation of the acoustic emission characteristics during deformation and failure of gas-bearing coal-rock combined bodies. J. Loss Prev. Process Ind. 2018, 55, 253–266. [Google Scholar] [CrossRef]
- Jin, A.B.; Liu, J.W.; Zhao, Y.Q.; Wang, B.X.; Sun, H.; Dong, W.Y. Mechanical characteristics analysis of granite under unloading conditions. Rock Soil Mech. 2019, 40, 459–467. [Google Scholar] [CrossRef]
- Li, D.Y.; Sun, Z.; Zhu, Q.Q.; Peng, K. Triaxial Loading and Unloading Tests on Dry and Saturated Sandstone Specimens. Appl. Sci. 2019, 9, 1689. [Google Scholar] [CrossRef]
- Wang, L.; Xu, J.; Chen, C.; Guo, J.; Xu, X. Mechanical properties and crack propagation mechanism of non-through jointed sandy slate in triaxial unloading test. J. Civ. Environ. Eng. 2024, 2024, 1–10. [Google Scholar]
- Zou, Q. Experimental study on mechanical properties of tunnel surrounding rock under different stress paths. J. Heilongjiang Univ. Sci. Technol. 2021, 31, 511–516. [Google Scholar]
- Liu, Z.; Xiao, M.; Zhuo, L.; Xie, H.; He, J. Loading and unloading characteristics of mica-quartz schist and constitutive model for its unloading. Chin. J. Geotech. Eng. 2016, 38, 85–91. [Google Scholar]
- Zhao, G.; Dai, B.; Dong, L.; Yang, C. Experimental research on mechanical characteristics and strength criterion of rock of triaxial unloading tests under different stress paths. Rock Soil Mech. 2015, 36, 3121–3127, 3149. [Google Scholar] [CrossRef]


| Rock Type | Characteristics | Properties | UCS/MPa | σ30/MPa | v/MPa/s | σ3p/MPa | σ1p/MPa |
|---|---|---|---|---|---|---|---|
| Feldspar sandstone [29] | Medium-fine grained feldspathic sandstone, greenish gray, and pore-based cementation. | - | 56.94 | 15 | 0.033 | 10.15 | 81.15 |
| 56.94 | 25 | 0.033 | 14.8 | 108.97 | |||
| 56.94 | 35 | 0.033 | 20.7 | 122.35 | |||
| 56.94 | 45 | 0.033 | 23.5 | 139.27 | |||
| 56.94 | 15 | 0.033 | 10.8 | 88.2 | |||
| 56.94 | 25 | 0.033 | 16.8 | 113.69 | |||
| 56.94 | 35 | 0.033 | 21.75 | 129.46 | |||
| 56.94 | 45 | 0.033 | 28.1 | 144.85 | |||
| 56.94 | 15 | 0.033 | 11.6 | 94.51 | |||
| 56.94 | 25 | 0.033 | 18.7 | 122.16 | |||
| 56.94 | 35 | 0.033 | 25.6 | 134.38 | |||
| 56.94 | 45 | 0.033 | 32.2 | 149.8 | |||
| Coal [30] | Collected from the No. 16 coal seam in the Yangcun coal mine. | Wave velocities: 1.9~2.0 km/s | 20.3 | 4 | 0.02 | 2.28 | 33.1 |
| 20.3 | 7 | 0.02 | 4.35 | 40.5 | |||
| 20.3 | 10 | 0.02 | 6.07 | 56.61 | |||
| 20.3 | 4 | 0.05 | 0.62 | 29.77 | |||
| 20.3 | 7 | 0.05 | 3.8 | 38.79 | |||
| 20.3 | 10 | 0.05 | 4.53 | 53.28 | |||
| 20.3 | 4 | 0.08 | 0.6 | 26.8 | |||
| 20.3 | 7 | 0.08 | 1.61 | 36.81 | |||
| 20.3 | 10 | 0.08 | 4.53 | 47.68 | |||
| 20.3 | 10 | 0.11 | 1.55 | 45.65 | |||
| 20.3 | 10 | 0.14 | 1.39 | 43.63 | |||
| Traditional coal [31] | Made by coal particles with a small size | Cohesion: 1.72 MPa; Friction: 35.06° | 1.66 | 2 | 0.005 | 1.69 | 10.58 |
| 1.66 | 4 | 0.005 | 3.02 | 17.04 | |||
| 1.66 | 6 | 0.005 | 4.4 | 22.92 | |||
| 1.66 | 8 | 0.005 | 5.75 | 27.56 | |||
| Newly reconstituted coal [31] | Made by small coal blocks and coal powder | Cohesion: 1.18 MPa; Friction: 35.06° | 0.95 | 2 | 0.005 | 1.61 | 9.54 |
| 0.95 | 4 | 0.005 | 3.66 | 15.01 | |||
| 0.95 | 6 | 0.005 | 4.74 | 21.62 | |||
| 0.95 | 8 | 0.005 | 6.31 | 26.13 | |||
| Mudstone [32] | Collected from a tunnel project in a Lower Jurassic interlayered mudstone–sandstone stratum. | Density: 2.63 g/cm3; Water content: 2.14%; Porosity: 1.67%; Wave velocities: 2.663 km/s; | 49.01 | 10 | 0.05 | 4.8 | 49.81 |
| 49.01 | 10 | 0.05 | 5.25 | 48.27 | |||
| 49.01 | 20 | 0.05 | 14.82 | 73.48 | |||
| 49.01 | 20 | 0.05 | 14.8 | 75.35 | |||
| 49.01 | 25 | 0.05 | 17.49 | 99.12 | |||
| 49.01 | 25 | 0.05 | 17.27 | 101.76 | |||
| Sandstone [32] | Density: 2.68 g/cm3; Water content: 2.53%; Porosity: 6.03%; Wave velocities: 4.214 km/s. | 97.88 | 10 | 0.05 | 6.65 | 106.55 | |
| 97.88 | 10 | 0.05 | 6.89 | 123.78 | |||
| 97.88 | 20 | 0.05 | 20 | 144 | |||
| 97.88 | 20 | 0.05 | 14.98 | 139.29 | |||
| 97.88 | 25 | 0.05 | 19.06 | 147.91 | |||
| 97.88 | 25 | 0.05 | 19.26 | 147.01 | |||
| Shale [33] | Deposited in the period as the gas-bearing shale of the deep Longmaxi Formation. | Elastic modulus: 19.5 GPa; Poisson Ratio: 0.19; Tensile strength: 10.23 MPa. | 124.26 | 60 | 0.4 | 51.71 | 326.37 |
| 124.26 | 60 | 0.6 | 53.7 | 333.35 | |||
| 124.26 | 60 | 0.8 | 54.74 | 343.34 | |||
| 124.26 | 60 | 1.0 | 54.15 | 355.51 | |||
| Marble [34] | Gray-white marbles belonging to the Baishan group (T2b) of the Triassic strata. | Density: 2.72 g/cm3; Wave velocities: 5.338~6.354 km/s. | 79.15 | 10 | 0.01 | 2.2 | 95.26 |
| 79.15 | 10 | 0.05 | 0 | 74.27 | |||
| 79.15 | 20 | 0.01 | 10.15 | 118.71 | |||
| 79.15 | 20 | 0.05 | 0 | 105.74 | |||
| 79.15 | 40 | 0.01 | 22 | 177.07 | |||
| 79.15 | 40 | 0.05 | 11.2 | 127.61 | |||
| Shale (0°) [27] | The Paleozoic lower Silurian Longmaxi Formation of the middle and upper Yangtze regions. | Elastic modulus: 25.1 GPa; Poisson Ratio: 0.111 Cohesion: 28.88 MPa; Friction: 52.3° | 146.41 | 20 | 0.008 | 19.64 | 263.7 |
| 146.41 | 20 | 0.033 | 19.57 | 261.5 | |||
| 146.41 | 20 | 0.067 | 15.53 | 255.3 | |||
| 146.41 | 20 | 0.1 | 14.26 | 250.7 | |||
| Shale (60°) [27] | Elastic modulus: 23.8 GPa; Poisson Ratio: 0.113; Cohesion: 23.96 MPa; Friction: 41.7°; | 100.52 | 20 | 0.008 | 17.37 | 237.2 | |
| 100.52 | 20 | 0.03 | 13.69 | 218.5 | |||
| 100.52 | 20 | 0.06 | 9.34 | 197.5 | |||
| 100.52 | 20 | 0.1 | 16.53 | 174.2 | |||
| Shale (90°) [27] | Elastic modulus: 37.4 GPa; Poisson Ratio: 0.136; Cohesion: 53.35 MPa; Friction: 45.6°. | 229.33 | 20 | 0.008 | 18.03 | 336.2 | |
| 229.33 | 20 | 0.03 | 13.56 | 351.5 | |||
| 229.33 | 20 | 0.06 | 14.18 | 316.4 | |||
| 229.33 | 20 | 0.1 | 7.25 | 322.7 | |||
| Granite [35] | Fine-to-medium-grained granite with a massive structure. | Density: 2.64 g/cm3; Wave velocities: 3.6~4.4 km/s. | 138 | 10 | 0.02 | 2.3 | 190.6 |
| 138 | 20 | 0.02 | 10.2 | 266.9 | |||
| 138 | 40 | 0.02 | 24.4 | 366.8 | |||
| 138 | 60 | 0.02 | 56.8 | 404.3 | |||
| Coal [36] | Taken from No. 3 coal and its roof sandstone in Yangcun Coal Mine, Jining, Shandong, China. | - | 20.91 | 4 | 0.02 | 2.3 | 34.04 |
| 20.91 | 4 | 0.05 | 0.63 | 30.65 | |||
| 20.91 | 4 | 0.08 | 0.61 | 27.6 | |||
| 20.91 | 7 | 0.02 | 4.39 | 41.62 | |||
| 20.91 | 7 | 0.05 | 3.84 | 39.88 | |||
| 20.91 | 7 | 0.08 | 1.63 | 37.89 | |||
| 20.91 | 10 | 0.02 | 6.13 | 58.19 | |||
| 20.91 | 10 | 0.05 | 4.58 | 54.79 | |||
| 20.91 | 10 | 0.08 | 4.58 | 49.02 | |||
| 20.91 | 10 | 0.11 | 1.57 | 46.99 | |||
| 20.91 | 10 | 0.14 | 1.4 | 44.91 | |||
| Sandstone [36] | - | 131.34 | 4 | 0.02 | 1.24 | 136.51 | |
| 131.34 | 4 | 0.05 | 0.01 | 132.96 | |||
| 131.34 | 4 | 0.08 | 0.01 | 124.02 | |||
| 131.34 | 7 | 0.02 | 4.36 | 143.25 | |||
| 131.34 | 7 | 0.05 | 1.88 | 138.24 | |||
| 131.34 | 7 | 0.08 | 0 | 125.75 | |||
| 131.34 | 10 | 0.02 | 7.25 | 158.85 | |||
| 131.34 | 10 | 0.05 | 4.99 | 146.04 | |||
| 131.34 | 10 | 0.08 | 2.75 | 141.38 | |||
| 131.34 | 10 | 0.11 | 2.7 | 135.47 | |||
| 131.34 | 10 | 0.14 | 0 | 132.21 | |||
| 131.34 | 13 | 0.05 | 6.82 | 156.75 | |||
| 131.34 | 16 | 0.05 | 8.69 | 168.11 | |||
| 131.34 | 19 | 0.05 | 11.56 | 192.53 | |||
| Gas-bearing coal-sandstone [37] | Taken from the No. 15 coal seam and its roof rock of the Xinjing coal mine in Shanxi Province, China. | - | 10.88 | 4 | 0.01 | 1.81 | 25.19 |
| 10.88 | 4 | 0.01 | 2.11 | 16.87 | |||
| 10.88 | 4 | 0.01 | 2.72 | 15.01 | |||
| 10.88 | 7 | 0.01 | 2.41 | 18.17 | |||
| 10.88 | 10 | 0.01 | 3.23 | 23.98 | |||
| Granite [38] | Dense granite sample, mainly composed of quartz, feldspar, hornblende, and black mica. | - | 228.7 | 5 | 0.01 | 0 | 180.2 |
| 228.7 | 10 | 0.01 | 0 | 212.6 | |||
| 228.7 | 15 | 0.01 | 3 | 265.6 | |||
| 228.7 | 20 | 0.01 | 4.75 | 301.5 | |||
| Dry sandstone [39] | Obtained from a quarry in Yunnan Province | Density: 2.388 g/cm3; Wave velocities: 3.305 km/s. | 117.35 | 10 | 0.05 | 1.52 | 118.54 |
| 117.35 | 20 | 0.05 | 14.82 | 151.15 | |||
| 117.35 | 30 | 0.05 | 15.51 | 181.04 | |||
| 117.35 | 40 | 0.05 | 20.01 | 200.74 | |||
| Saturated sandstone [39] | Density: 2.457 g/cm3; Wave velocities: 3.373 km/s. | 94.76 | 10 | 0.05 | 4.56 | 91.7 | |
| 94.76 | 20 | 0.05 | 10.56 | 120.91 | |||
| 94.76 | 30 | 0.05 | 19.73 | 144.01 | |||
| 94.76 | 40 | 0.05 | 21.61 | 153.19 | |||
| Intact sandy slate [40] | Jointed sandy slate of the underground plant of the Kara hydroelectric power station. | Density: 2.68~2.75 g/cm3; Wave velocities: 2.9~3.4 km/s. | 81.15 | 5 | 0.1 | 4.09 | 119.75 |
| 81.15 | 10 | 0.1 | 7.03 | 147.15 | |||
| 81.15 | 15 | 0.1 | 9.06 | 181.02 | |||
| 81.15 | 20 | 0.1 | 9.06 | 222.10 | |||
| Fractured sandy slate [40] | Cohesion: 0.114 MPa; Friction: 27.605° | 57.74 | 5 | 0.1 | 1.69 | 95.63 | |
| 57.74 | 10 | 0.1 | 9.04 | 120.49 | |||
| 57.74 | 15 | 0.1 | 13.15 | 146.09 | |||
| 57.74 | 20 | 0.1 | 18.43 | 195.15 | |||
| Sandstone [41] | Taken from the tunnel construction site and consisted of quartz, feldspar, and mica. | Density: 2.57 g/cm3; Porosity: 0.68%; Particle size: 0.018~0.540 mm. | 149.44 | 20 | 0.1 | 15.96 | 183.54 |
| 149.44 | 30 | 0.1 | 24.88 | 224.84 | |||
| 149.44 | 40 | 0.1 | 33.49 | 255.71 | |||
| 149.44 | 50 | 0.1 | 40.35 | 273.82 | |||
| Quartz mica schist (vertical) [42] | Gray-black in appearance with glittering minerals that were thinly layered and had significant lamellar structures. | Cohesion: 12.40 MPa; Friction: 33.76°; | 55.41 | 30 | 0.05 | 16.99 | 106.07 |
| 55.41 | 40 | 0.05 | 18 | 127.31 | |||
| 55.41 | 50 | 0.05 | 37.27 | 183.06 | |||
| 55.41 | 60 | 0.05 | 38.09 | 202.64 | |||
| Quartz mica schist (parallel) [42] | Cohesion: 14.39 MPa; Friction: 35.11°. | 46.42 | 30 | 0.05 | 16.66 | 98.19 | |
| 46.42 | 40 | 0.05 | 25.02 | 134.02 | |||
| 46.42 | 50 | 0.05 | 35.89 | 164.83 | |||
| 46.42 | 60 | 0.05 | 45.87 | 191.06 | |||
| Granite [43] | Grayish white | Density: 2.5 g/cm3; Wave velocities: 3.2~3.8 km/s. | 80 | 10 | 0.05 | 5.4 | 192.4 |
| 80 | 20 | 0.05 | 12.1 | 250 | |||
| 80 | 30 | 0.05 | 18.6 | 304.3 |
| Evaluation Indicator | Computational Formula | Evaluation Criteria |
|---|---|---|
| Coefficient of determination | Larger R2, better performance | |
| Mean square error | Smaller MSE, better performance | |
| Root mean square error | Smaller RMSE, better performance | |
| Mean absolute error | Smaller MAE, better performance | |
| Mean absolute percentage error | Smaller MAPE, better performance |
| Evaluation Indicators | Prediction Performance | ||||
|---|---|---|---|---|---|
| RF | SVM | XGBoost | GS-XGBoost | PSO-XGBoost | |
| R2 | 0.89 | 0.22 | 0.92 | 0.93 | 0.98 |
| MAE | 18.66 | 68.63 | 16.74 | 14.95 | 8.80 |
| MAPE | 13.02 | 125.33 | 11.60 | 10.40 | 6.51 |
| MSE | 1158.51 | 8163.92 | 858.29 | 702.65 | 198.10 |
| RMSE | 34.04 | 90.35 | 29.30 | 26.51 | 14.07 |
Disclaimer/Publisher’s Note: The statements, opinions and data contained in all publications are solely those of the individual author(s) and contributor(s) and not of MDPI and/or the editor(s). MDPI and/or the editor(s) disclaim responsibility for any injury to people or property resulting from any ideas, methods, instructions or products referred to in the content. |
© 2024 by the authors. Licensee MDPI, Basel, Switzerland. This article is an open access article distributed under the terms and conditions of the Creative Commons Attribution (CC BY) license (https://creativecommons.org/licenses/by/4.0/).
Share and Cite
Liu, B.; Lin, H.; Chen, Y.; Yang, C. Prediction of Rock Unloading Strength Based on PSO-XGBoost Hybrid Models. Materials 2024, 17, 4214. https://doi.org/10.3390/ma17174214
Liu B, Lin H, Chen Y, Yang C. Prediction of Rock Unloading Strength Based on PSO-XGBoost Hybrid Models. Materials. 2024; 17(17):4214. https://doi.org/10.3390/ma17174214
Chicago/Turabian StyleLiu, Baohua, Hang Lin, Yifan Chen, and Chaoyi Yang. 2024. "Prediction of Rock Unloading Strength Based on PSO-XGBoost Hybrid Models" Materials 17, no. 17: 4214. https://doi.org/10.3390/ma17174214
APA StyleLiu, B., Lin, H., Chen, Y., & Yang, C. (2024). Prediction of Rock Unloading Strength Based on PSO-XGBoost Hybrid Models. Materials, 17(17), 4214. https://doi.org/10.3390/ma17174214