Article

Reducing Water Absorption and Improving Flexural Strength of Aluminosilicate Ceramics by MnO2 Doping

1
College of Chemistry and Materials Science, Fujian Normal University, Fuzhou 350117, China
2
Xiamen Key Laboratory of Rare Earth Photoelectric Functional Materials, Xiamen Institute of Rare Earth Materials, Haixi Institute, Chinese Academy of Sciences, Xiamen 361021, China
3
Fujian Institute of Research on the Structure of Matter, Chinese Academy of Sciences, Fuzhou 350002, China
*
Authors to whom correspondence should be addressed.
Materials 2024, 17(11), 2557; https://doi.org/10.3390/ma17112557
Submission received: 19 April 2024 / Revised: 18 May 2024 / Accepted: 22 May 2024 / Published: 25 May 2024

Abstract

:
As key performance indicators, the water absorption and mechanical strength of ceramics are highly associated with sintering temperature. Lower sintering temperatures, although favorable for energy saving in ceramics production, normally render the densification degree and water absorption of as-prepared ceramics to largely decline and increase, respectively. In the present work, 0.5 wt.% MnO2, serving as an additive, was mixed with aluminosilicate ceramics using mechanical stirring at room temperature, achieving a flexural strength of 58.36 MPa and water absorption of 0.05% and lowering the sintering temperature by 50 °C concurrently. On the basis of the results of TG-DSC, XRD, MIP, and XPS, etc., we speculate that the MnO2 additive promoted the elimination of water vapor in the ceramic bodies, effectively suppressing the generation of pores in the sintering process and facilitating the densification of ceramics at a lower temperature. This is probably because the MnO2 transformed into a liquid phase in the sintering process flows into the gap between grains, which removed the gas inside pores and filled the pores, suppressing the generation of pores and the abnormal growth of grains. This study demonstrated a facile and economical method to reduce the porosity and enhance the densification degree in the practical production of aluminosilicate ceramics.

1. Introduction

The porosity of ceramic materials highly depends on the sintering process and the sintering temperature as key parameters, and is closely related to the population, shape, and distribution of pores in ceramics, thereby affecting the performance of ceramics, e.g., the mechanical strength and water adsorption, etc. [1,2]. Higher sintering temperatures favor gas diffusion in ceramic materials to suppress the formation of pores [3]. Due to the complex crystallization properties of aluminosilicate ceramic oxide components, high temperatures (>1200 °C) are normally employed to ensure complete sintering [4,5,6], giving rise to huge energy consumption.
Recently, the implementation of energy-saving production policies have motivated many industries, especially high energy-consuming industries, to develop new technologies to reduce energy consumption [7,8,9]. For the ceramic industry, the key point is to lower the sintering temperature while ensuring sufficiently high mechanical strength [10,11] and low water absorption [12,13,14] to meet the production requirements.
In the past few years, some fundamental studies have discovered that the modification of a single component of common ceramic oxides, i.e., the introduction of additives, can theoretically suppress the growth of grains and induce grain refinement, thus enhancing the strength and toughness of ceramics to a certain extent and ultimately achieving a reduction in sintering temperature [15,16,17,18]. For instance, Wang et al. [19] investigated the microstructural evolution of Al2O3 with different Nd2O3 additions, showing that the addition of neodymium inhibits the densification of Al2O3 through grain boundary segregation. In a similar study, Hassan’s team [20] reported the effect of the Nb2O5 amount on the densification and mechanical properties of Al2O3, and revealed that even a small amount of Nb2O5 (0.6 vol.%) can improve the densification, bending strength, hardness and fracture toughness of the Al2O3 matrix, attributed to the decrease of porosity and the strengthening of the Nb2O5 crystal interface. These results demonstrated the feasibility that doping with additives is capable of densifying the ceramic materials and lowering the sintering temperature concurrently. Of note, the local brittleness caused by the change in stress orientation in the sintering process and the difficulty in reducing the porosity are still the biggest challenges confronted in practical ceramic production.
Adding sintering aids, such as MgO or ZrO2, into the alumina ceramic, makes it able to suppress the growth of grains, thereby largely preventing more pores from generating [21,22]. Furthermore, some liquid phase sintering aids which transform into a liquid phase at the stage of high-temperature sintering, e.g., SiO2 and CaO, can lower the sintering temperature of alumina ceramics, together with reducing the mechanical strength [6,23,24,25]. Moreover, aluminosilicate ceramics made from geologic minerals are less costly than SiO2-doped alumina ceramics [26,27,28,29,30] and are thus extensively used in various fields, particularly construction materials and daily ceramics, both of which desire to achieve a low-consumption production of ceramics with high flexural strength and low water absorption properties [31].
In the present work, to further reduce the production cost while ensuring the flexural strength and water absorption remain undegraded, MnO2 was employed as a sintering aid. Aluminosilicate ceramics with 0~0.5 wt.% MnO2 addition were sintered at 1150 °C, and the impact of Mn doping on the flexural strength, porosity, and water absorption of the ceramics was characterized and disclosed.

2. Materials and Methods

2.1. Materials

MnO2 was purchased from Innochem, Beijing, China (Mn 58% min.). The aluminosilicate ceramic slurry used in this experiment was provided by Liangci Technology Co., Ltd. (Quanzhou, China), with a content of 356 g/200 mL. The chemical composition of raw materials is shown in Table 1.

2.2. Preparation of MnO2-Doped Aluminosilicate Ceramic

The MnO2-doped aluminosilicate ceramics were prepared using mechanical agitation at room temperature and calcination. Typically, after the provided aluminosilicate ceramic slurry was mechanically stirred for 4 h at 400 rpm, a certain amount of MnO2 (0, 0.05, 0.1, 0.3, 0.5 wt.%) was added to the uniformly dispersed slurry, followed by stirring for another 12 h at 800 rpm to achieve thorough mixing of MnO2 and ceramic slurry. Then, the mixture was poured into a plaster mold and left for 2 h. After the plaster mold was removed, the sample was dried for 12 h at 55 °C and for another 4 h at 110 °C. The obtained sample (ceramic body) was cooled down in a desiccator and denoted as M-0, M-0.05, M-0.1, M-0.3, and M-0.5, respectively.
The obtained ceramic body was sintered at the desired temperature (1150 °C or 1200 °C) for 8 h, and the period of elevating temperature was set as 12 h. According to the MnO2 amount and sintering temperature, the finally obtained samples were denoted as M-0-1200 (as control sample), M-0-1150, M-0.05-1150, M-0.1-1150, M-0.3-1150, and M-0.5-1150, respectively.

2.3. Measurements and Characterization

2.3.1. Water Absorption Measurement

To begin with, the sintered sample was rammed to a suitable size and weighed (the mass was denoted as m1). Subsequently, the sample was immersed in boiling water for 2 h and soaked in water at room temperature for 20 h, followed by removing the surface moisture with a wet towel and weighing (the mass was denoted as m2). The water absorption was calculated using the following equation:
W = m 2 m 1 m 1 × 1 00 %
where W (%) is the water absorption, m 1   (g) is the mass of dry sample, and m 2   (g) is the mass of wet sample.

2.3.2. Flexural Strength Measurement

The flexural strength of the ceramic was measured using the universal material testing machine (2365, INSTRON, Norwood, MA, USA). The indenter contacted the upper surface of the sample via manual adjustment, and the movement rate of the upper indenter was 0.5 mm min−1. The measurement for each sample was repeated three times, and the average value was provided. The flexural strength was calculated using the following equation:
σ f = 8 FL π R 3
where σ f (MPa) is the flexural strength, F (N) represents the load when the sample breaks, L (mm) is the span (100 mm), and R (mm) is the radius of the sample section.

2.3.3. Characterization

Mercury intrusion porosimetry (MIP) was carried out using the mercury injection apparatus (AutoPore W9510, Micromeritics, Norcross, GA, USA) applicable for the aperture measurement range of 5 nm~800 μm. The unsintered ceramic sample was subjected to qualitative and quantitative analysis using the thermogravimetry-differential scanning calorimetry (TGA/DSC 1, Mettler Telodo, Zurich, Switzerland). The sample (20 mg) was heated from 30 to 1200 °C with a heating ramp of 10 °C min−1; the heating rate was 10 °C min−1. The component contents of the materials were qualitatively determined using the X-ray fluorescence (XRF) spectrometer (Axios, Panalytical, Almelo, The Netherlands). The composition of the sintered ceramics was analyzed using the X-ray diffractometer (XRD) (Miniflex 600, Rigaku, Akishima-shi, Japan). The sample was measured using the scanning speed of 10° min−1 with a step size of 0.02°. X-ray photoelectron spectroscopy (XPS) analysis was performed on X-ray photoelectron spectroscopy system (K-Alpha, Thermo Fisher Scientific, Waltham, MA, USA) equipped with Al Kα X-ray radiation as the X-ray source. Fourier transform infrared spectroscopy (FTIR) (Nicolet iS 50, Thermo Fisher Scientific, MA, USA) was performed in the range 4000–400 cm−1. The morphology and chemical composition of the ceramics were obtained using a field emission scanning electron microscope (SEM) (Apreo S LoVac, Thermo Fisher Scientific, MA, USA) equipped with Energy dispersive X-ray spectrometer (EDS).

3. Results and Discussion

3.1. Phase Analysis

Figure 1 shows the XRD patterns for the six ceramic samples prepared at different conditions. The main crystalline phases of the six samples are mullite (PDF# 15-0776) and quartz (PDF# 85-0930). The diffraction peaks located at 26.3°and 26.6°are attributed to the (210) facet of mullite phase and (011) facet of quartz phase, respectively. No diffraction peaks attributed to MnO2 were observed, probably due to the tiny amount of MnO2. Meanwhile, compared to the other five samples, the diffraction peak of M-0-1150 located at 26.6° slightly shifted to the direction of the low degree by 0.3°, indicating that the cell parameters had become larger. As no obvious difference in the diffraction peak positions between the undoped ceramic sample sintered at 1200 °C and the MnO2-doped counterparts sintered at 1150 °C was observed, we speculated that the added MnO2 effectively suppressed the abnormal growth of grains and the resulting formation of a large number of pores caused by a lower sintering temperature.
Based on the obtained XRD patterns, the Rietveld method was employed to perform the crystal structure refinement. As displayed in Figure 2a–c, the calculated XRD patterns are in good agreement with the experimental patterns, indicated by the smooth difference curves (Diff). Meanwhile, the Rwp and Rp values less than 10% and the Gof values between 1 and 2 confirmed the reliability of the refinement results. Table 2 lists the refined cell parameters for the M-0-1200, M-0-1150, and M-0.5-1150 samples. The proportions of the mullite phase in the three ceramic samples are 43.39 wt.%, 41.45 wt.%, 44.40 wt.%, respectively, indicating that lower sintering temperatures adversely affected the formation of the mullite phase and this situation can be improved by the MnO2 additive. It’s well known that more Mullite phase in aluminosilicate ceramics benefits for the enhancement in mechanical strength. Moreover, a certain extent of the increase in the cell parameters of M-0-1200 was observed, relative to those of M-0-1150. In terms of the cell volume, lowering the sintering temperate by 50 °C rendered the cell volume to increase from 168.5400 Å3 to 169.7880 Å3. And it was lowered to 168.9500 Å3 after the addition of 0.5 wt.% of MnO2, getting close to that of the M-0-1200 sample. Theoretically, the smaller the cell volume, the smaller the porosity.

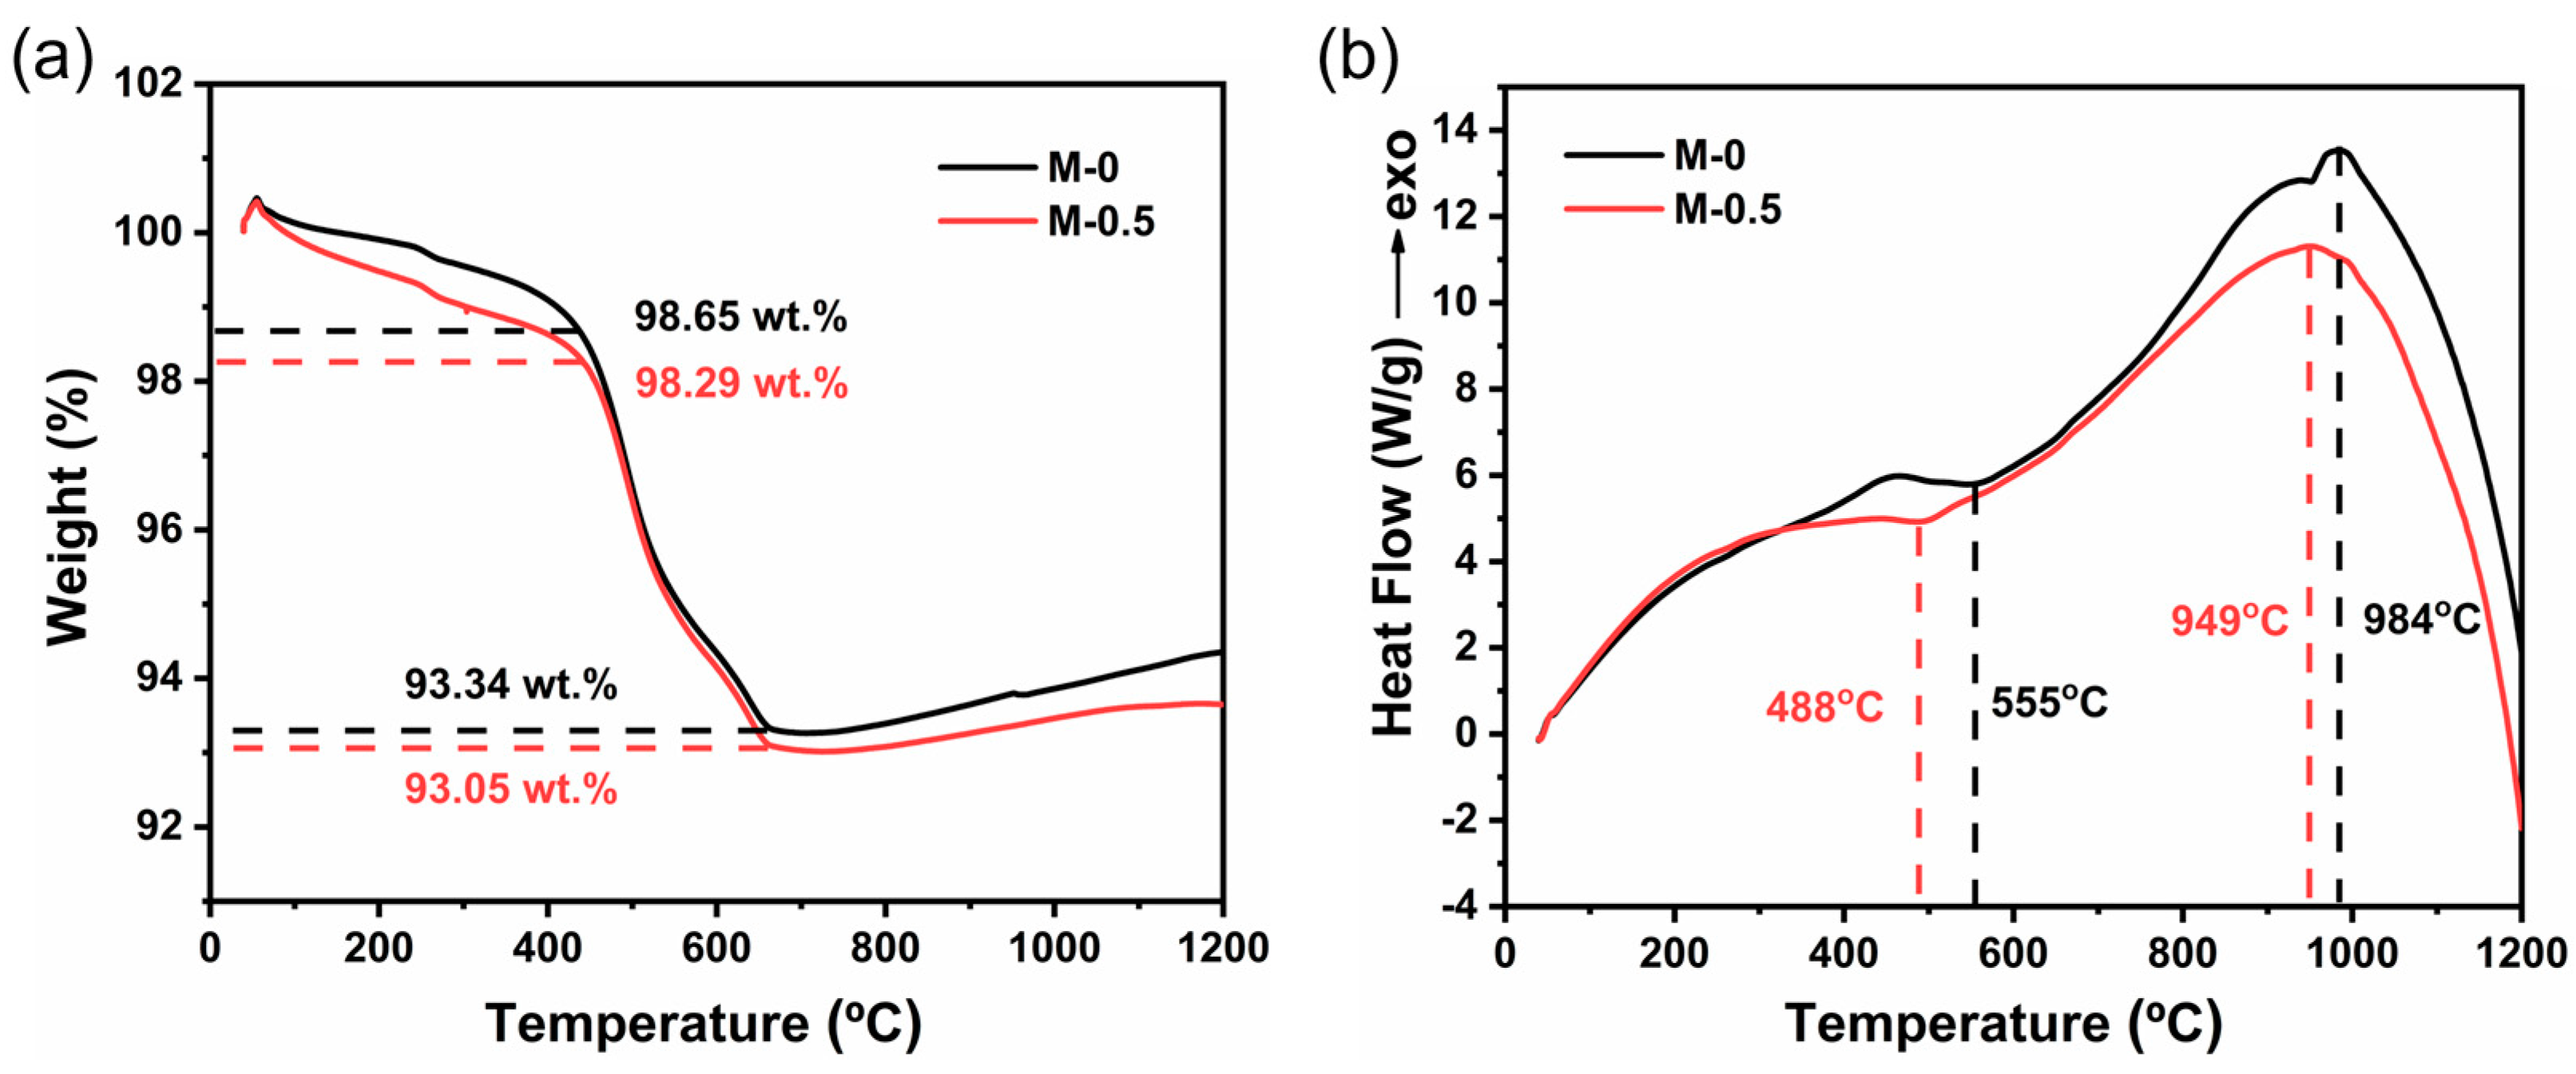
3.2. Thermogravimetric Analysis (TGA) and Differential Scanning Calorimetry (DSC)

The TGA and DSC analysis of the M-0 and M-0.5 samples were performed and the results are shown in Figure 3. In Figure 3a, weight loss occurred in the in the M-0.5 sample in the temperature range of 30–500 °C. The moisture residue in the ceramic body was converted to water vapor and removed rapidly, possibly accompanied by the elimination of some impurities, in a thermal environment. For the DSC curves in Figure 3b, an endothermic peak appeared at ~488 °C for the M-0.5 sample, while the endothermic peak for the M-0 sample appeared at ~550 °C. The emergence of the endothermic peak probably resulted from the removal of the crystal water in the ceramic body. The shift of the endothermic peak to the direction of a low temperature suggested that the MnO2 doping facilitated the removal of crystal water in the sintering of the aluminosilicate ceramic body. Moreover, owing to the crystallization process, an exothermic peak for the M-0.5 sample appeared at ~949 °C, lower by 35 °C than that of the M-0 sample, which suggested that the MnO2 in the ceramic body made the crystallization start to occur at a lower temperature. Based on these results, we deduced that enough MnO2 additive promoted the rapid elimination of moisture residue and crystal water in the ceramic body sintered at a lower temperature and thus reduced the total pore amount and volume. It suppressed the abnormal growth of grains during the sintering process and improved the densification of ceramics [32].

3.3. Composition Analysis

Because of the detection limit of XRD and the low amount of addition (<0.5 wt.%), the MnO2 phase that possibly exists in the ceramic sample may not be detected. Thereby, X-ray photoelectron spectroscopy (XPS) was used to analyze the valence state of the Mn element in the prepared sample to determine the existing form of Mn; the results are shown in Figure 4. Figure 4a presents the Si2p, Al2p, and O1s signals in the M-0-1200 and M-0.5-1150 samples. No signal belonging to the Mn element was observed for the M-0-1200 sample (Figure 4c), while two peaks located at 653.6 eV and 641.8 eV, ascribed to Mn (IV) 2p1/2 and 2p3/2, were observed for the Mn-0.5-1150 sample (Figure 4b). This result indicates the existence of MnO2.
XRF was employed to quantify the MnO2 in the as-prepared ceramic samples. As listed in Table 3, the contents of the main components, Al2O3 and SiO2, are similar for all the samples. Approximately 0.08 wt.% of MnO2 exists in the undoped ceramic samples, likely coming from the aluminosilicate ceramic slurry itself provided by the company. For the doped ceramic samples, the measured content of MnO2 gradually increases from 0.18 to 0.89 wt.%, with the amount added increasing from 0.05 to 0.5 wt.%.

3.4. Effect of MnO2 on Ceramic Macroscopic Properties

For the impact of the MnO2 addition, the flexural strength and water absorption of the ceramic samples were characterized by a three-point bending test and mercury intrusion porosimetry, respectively. Figure 5a shows that without MnO2 addition, the flexural strength of sample decreased by 11.65%, from 51.61 MPa to 45.59 MPa, upon the reduction in the sintering temperature from 1200 °C to 1150 °C. After MnO2 doping and sintering at 1150 °C, the flexural strength of the sample was enhanced gradually with the increase in the MnO2 doping amount. The 0.3 wt.% of MnO2 addition enabled the flexural strength of M-0.3-1150 to reach 53.27 MPa, exceeding that of M-0-1200. Further increasing the MnO2 content to 0.5 wt.% endowed the M-0.5-1150 sample with a flexural strength of 58.36 MPa, higher than that of M-0-1200 by 13.08%. The experimental data show that the flexural strength of MnO2 sintered at 1150 °C with an addition of 0.5 wt.% exceeds that of the undoped sample sintered at 1200 °C. Based on these results, we speculated that the MnO2 doping made the ceramic sample become more densified and possess more grain boundaries, and the latter largely avoided the excessive growth of cracks, absorbed more energy, and acted as a buffer against cracks. MnO2 is beneficial to stop the abnormal growth of grains caused by lower sintering temperatures [33].
Figure 5b displays the porosity and water absorption of ceramic samples as a function of the MnO2 doping amount. In the 0–0.3 wt.% of MnO2 doping range, both the porosity and water absorption of the samples sintered at 1150 °C were remarkably higher than those of the M-0-1200 sample. It is not until the doping amount of MnO2 reaches 0.5 wt.% that the porosity (5.12%) and water adsorption (0.05%) of the samples sintering at 1150 °C become lower than those of the M-0-1200 sample. Because of the increase in the addition of MnO2, more adsorbed water and crystallized water are excluded, reducing the generation of pores and thus increasing the densification. Figure 5c displays the relationship between the pore size and incremental intrusion of Hg. The change trend in the intrusion of Hg with pore size was basically in line with that of porosity. In the whole range of pore size (0~800 nm), the integrated area of M-0-1150 is remarkably larger than those of the other samples, indicating that the M-0-1150 sample has the largest pore volume (Table 4). For the samples sintered at 1150 °C, the intrusion of Hg decreased upon the addition of MnO2. The content of MnO2 added within 0–0.1 wt.% slightly decreased the intrusion of Hg, but no obvious intrusion of Hg was observed for the M-0.5-1150 sample with 0.5 wt.% of MnO2 added content. This indicated that the M-0.5-1150 sample possesses the lowest pore volume among all the prepared ceramic samples. This is likely because MnO2, as the sintering aid, was transformed into the liquid phase in the sintering process; the liquid-phase MnO2 flowed into pores, expelling the gas in the pores and filling the pores. The insufficient addition of MnO2 rendered this phenomenon weakened. As listed in Table 4, the decreased trends of apparent density and pore volume occurred to the ceramic samples with MnO2 doping. And the M-0.5-1150 sample has the lowest apparent density, indicating that a number of closed pores formed inside it [34]. This is probably because the liquid-phase MnO2 forming in the sintering process filled the gaps between grains, generating more closed pores. Also, this is the reason why M-0.5-1150 has a remarkably low water absorption.
Pore size is one of the most important factors affecting the performance of ceramics, and the pore sizes of the six prepared samples are shown in Figure 5d. The average pore sizes of M-0-1200 and M-0-1150 were 206.14 nm and 407.89 nm, respectively. The decline of 50 °C in sintering temperature caused a 2-fold increase in pore size. An additional 0.5 wt.% amount of MnO2 decreased the pore size of the M-0.5-1150 sample by 1/2 and 3/4, compared to those of the M-0-1200 and M-0-1150 samples, respectively, validating the effectiveness of MnO2 doping in the pore size reduction in ceramic samples. This is also the reason why MnO2 doping could enhance the density and flexural strength of ceramics.

3.5. Surface Chemical Species and Morphology Analysis

As a conventional structural characterization method, FTIR spectroscopy can identify the functional groups and vibration modes in materials. In silicate crystals, the composition contains a variety of other cations in addition to silicon and oxygen, which may result in the occurrence of an isomorphous replacement. Thus, FTIR characterization was conducted to figure out whether manganese ions replaced aluminum ions in the aluminosilicate crystals after the addition of MnO2 [35]. Figure 6 shows the FTIR spectra of the six sintered ceramic samples. The peaks appearing at 779 and 798 cm−1 are from the quartz phase [36]. And the absorption band at 1033 and 1010 cm−1 arise from the vibrations of Si-O-Si and Si-O-Al, respectively [14]. No noticeable peak that arose from the MnO2 doping appeared, indicating that 0–0.5 wt.% MnO2 doping did not lead to manganese ion replacement during crystallization.
SEM and EDS characterizations were performed to observe the pores in the microstructure and densification degree of the samples (Figure 7). Figure 7a–f shows the SEM images of the aluminosilicate ceramics doped with different contents of MnO2. Of them, M-0-1150 has the most pores (Figure 7b), M-0.5-1150 has the least pores (Figure 7f) and the M-0.5-1150 sample possesses the smallest pore size, compared to other five samples; this is probably ascribed to the suppressing effect on the pore formation in the sintering process by the sufficient MnO2 additive. This again proves that the addition of MnO2 to aluminosilicate ceramics can promote their densification. As displayed in Figure 7j-k, the EDS mapping results showed that the region around the pores was rich in the Mn element, instead of the Al element. It implied that MnO2 may transform into liquid and flow into the pores in the sintering process, which promoted the gas removal and reduction in pore size. Additionally, the uniform distribution of the Mn element in the samples validated that the preparation of such aluminosilicate ceramics can be achieved through simple mechanical stirring and the common sintering process.

4. Conclusions

In this study, we prepared MnO2-doped aluminosilicate ceramics and disclosed that a 0.3 wt.% addition of MnO2 can sufficiently make the aluminosilicate ceramics sintered at 1150 °C possess identical flexural strength as the undoped counterpart sintered at 1200 °C (M-0-1200 sample). The lowest water absorption reaches 0.05%, merely one-tenth of the water absorption for the M-0-1200 ceramic sample. The added MnO2 can decrease both the pore size and total pore volume, and enhance the sintering densification; this is probably because the MnO2 transforms into a liquid phase in the sintering process and flows into the gap between grains which removes the gas inside the pores and fills the pores, suppressing the generation of pores and the abnormal growth of grains. Also, this study demonstrated a facile method, doping with MnO2 using mechanical stirring at room temperature, to lower the water absorption, enhance the flexural strength, and reduce the sintering temperature concurrently, which has a promising value for practical ceramic production.

Author Contributions

Conceptualization, Y.L. and Y.W.; methodology, B.Y. and S.L.; formal analysis, B.Y. and C.L.; investigation, B.Y. and Y.W.; data curation, B.Y., S.L. and C.F.; writing—original draft preparation, B.Y.; writing—review and editing, Y.W.; supervision, Y.L. and Y.W.; project administration, Y.W.; funding acquisition, Y.L. All authors have read and agreed to the published version of the manuscript.

Funding

This research was funded by National Science Youth Foundation of China (22202205), Fujian Provincial Natural Science Foundation of China (2022J01502), and Open Source Foundation of State Key Laboratory of Structural Chemistry.

Institutional Review Board Statement

Not applicable.

Informed Consent Statement

Not applicable.

Data Availability Statement

Data are contained within the article.

Conflicts of Interest

The authors declare no conflicts of interest.

References

  1. Li, H.; Liu, Y.; Colombo, P.; Li, W.; Liu, Y.; Hu, K.; Lu, Z. The Influence of Sintering Procedure and Porosity on the Properties of 3D Printed Alumina Ceramic Cores. Ceram. Int. 2021, 47, 27668–27676. [Google Scholar] [CrossRef]
  2. Wang, Z.; Lin, T.; He, X.; Shao, H.; Zheng, J.; Qu, X. Microstructure and Properties of TiC-high Manganese Steel Cermet Prepared by Different Sintering Processes. J. Alloys Compd. 2015, 650, 918–924. [Google Scholar] [CrossRef]
  3. Kreisberg, V.A.; Ivakin, Y.D.; Danchevskaya, M.N. Content and Diffusion of Water and Gases in MgAl2O4 Spinel Crystals Synthesized to Produce Ceramics. J. Eur. Ceram. Soc. 2019, 39, 508–513. [Google Scholar] [CrossRef]
  4. Michálek, M.; Michálková, M.; Blugan, G.; Kuebler, J. Effect of Carbon Contamination on the Sintering of Alumina Ceramics. J. Eur. Ceram. Soc. 2018, 38, 193–199. [Google Scholar] [CrossRef]
  5. Vukšić, M.; Žmak, I.; Ćurković, L.; Kocjan, A. Effect of Two-Step Sintering on Properties of Alumina Ceramics Containing Waste Alumina Powder. Materials 2022, 15, 7840. [Google Scholar] [CrossRef]
  6. Yang, R.; Qi, Z.; Gao, Y.; Yang, J.; Zhou, Y.; Liu, H.; Peng, L.; Jiao, J. Effects of Alumina Sols on the Sintering of α-alumina Ceramics. Ceram. Int. 2020, 46, 20865–20870. [Google Scholar] [CrossRef]
  7. Adhvaryu, A.; Kala, N.; Nyshadham, A. The Light and the Heat: Productivity Co-Benefits of Energy-Saving Technology. Rev. Econ. Stat. 2020, 102, 779–792. [Google Scholar] [CrossRef]
  8. Patwa, D.; Bordoloi, U.; Dubey, A.A.; Ravi, K.; Sekharan, S.; Kalita, P. Energy-efficient Biochar Production for Thermal Backfill Applications. Sci. Total Environ. 2022, 833, 155253. [Google Scholar] [CrossRef]
  9. Wang, H.; Zhong, R.Y.; Liu, G.; Mu, W.; Tian, X.; Leng, D. An Optimization Model for Energy-efficient Machining for Sustainable Production. J. Clean. Prod. 2019, 232, 1121–1133. [Google Scholar] [CrossRef]
  10. Huang, J.; Chen, H.; Yang, J.; Zhou, T.; Zhang, H. Effects of Particle Size on Microstructure and Mechanical Strength of a Fly Ash Based Ceramic Membrane. Ceram. Int. 2023, 49, 15655–15664. [Google Scholar] [CrossRef]
  11. Qian, S.; Liu, F.; Ma, M.; Chen, G.; Liu, Z.; Li, Y. Mechanical Strength Enhancement of Low Temperature Co-fired Multilayer Ceramic Substrates by Introducing Residual Stress. Ceram. Int. 2019, 45, 10982–10990. [Google Scholar] [CrossRef]
  12. Aguiar, M.C.; Gadioli, M.C.; Sant’Ana, M.A.; Almeida, K.M.; Vidal, F.W.; Vieira, C.M. Red Ceramics Produced with Primary Processing Fine Waste of Ornamental Stones according to the Circular Economy Model. Sustainability 2022, 14, 12887. [Google Scholar] [CrossRef]
  13. Guerrero-Gómez, G.; Acevedo-Peñaloza, C.H.; Noriega-Sánchez, C.J. Influence of the Firing Process on Water Absorption and Compressive Strength in Ceramic Samples. J. Phys. Conf. Ser. 2019, 1388, 012023. [Google Scholar] [CrossRef]
  14. Linda Bih, N.; Aboubakar Mahamat, A.; Bidossèssi Hounkpè, J.; Azikiwe Onwualu, P.; Boakye, E.E. The Effect of Polymer Waste Addition on the Compressive Strength and Water Absorption of Geopolymer Ceramics. Appl. Sci. 2021, 11, 3540. [Google Scholar] [CrossRef]
  15. Hofer, A.-K.; Kraleva, I.; Prötsch, T.; Vratanar, A.; Wratschko, M.; Bermejo, R. Effect of Second Phase Addition of Zirconia on the Mechanical Response of Textured Alumina Ceramics. J. Eur. Ceram. Soc. 2023, 43, 2935–2942. [Google Scholar] [CrossRef]
  16. Qian, C.; Hu, K.; Shen, Z.; Wang, Q.; Li, P.; Lu, Z. Effect of Sintering Aids on Mechanical Properties and Microstructure of Alumina Ceramic Via Stereolithography. Ceram. Int. 2023, 49, 17506–17523. [Google Scholar] [CrossRef]
  17. Tovar-Vargas, D.; Roitero, E.; Anglada, M.; Jiménez-Piqué, E.; Reveron, H. Mechanical Properties of Ceria-calcia Stabilized Zirconia Ceramics with Alumina Additions. J. Eur. Ceram. Soc. 2021, 41, 5602–5612. [Google Scholar] [CrossRef]
  18. Wang, W.; Chen, J.; Sun, X.; Sun, G.; Liang, Y.; Bi, J. Influence of Additives on Microstructure and Mechanical Properties of Alumina Ceramics. Materials 2022, 15, 2956. [Google Scholar] [CrossRef] [PubMed]
  19. Wang, C.M.; Chan, H.M.; Harmer, M.P. Effect of Nd2O3 Doping on the Densification and Abnormal Grain Growth Behavior of High-purity Alumina. J. Am. Ceram. Soc. 2004, 87, 378–383. [Google Scholar] [CrossRef]
  20. Hassan, A.M.; Naga, S.M.; Awaad, M. Toughening and Strengthening of Nb2O5 Doped Zirconia/alumina (ZTA) Composites. Int. J. Refract. Met. Hard Mater. 2015, 48, 338–345. [Google Scholar] [CrossRef]
  21. Li, H; Elsayed, H; Colombo, H. Enhanced Mechanical Properties of 3D Printed Alumina Ceramics by Using Sintering Aids. Aids. Ceram. Int. 2023, 49, 24960–24971. [Google Scholar] [CrossRef]
  22. Wahsh, M.M.S.; Khattab, R.M.; Khattab, R.M. Thermo-mechanical Properties of Mullite/Zirconia Reinforced Alumina Ceramic Composites. Mater. Des. 2012, 41, 31–36. [Google Scholar] [CrossRef]
  23. Bocanegra-Bernal, M.H.; Domínguez-Rios, C.; Garcia-Reyes, A.; Aguilar-Elguezabal, A.; Echeberria, J.; Nevarez-Rascon, A. Fracture Toughness of an α-Al2O3 Ceramic for Joint Prostheses under Sinter and Sinter-HIP Conditions. Int. J. Refract. Met. Hard Mater. 2009, 27, 722–728. [Google Scholar] [CrossRef]
  24. Li, J.; Ye, Y. Densification and Grain Growth of Al2O3 Nanoceramics During Pressureless Sintering. J. Am. Ceram. Soc. 2005, 89, 139–143. [Google Scholar] [CrossRef]
  25. YT, O.; Koo, J.B.; Hong, K.J.; Park, J.S.; Shin, D.C. Effect of Grain Size on Transmittance and Mechanical Strength of Sintered Alumina. Mater. Sci. Eng. A 2004, 374, 191–195. [Google Scholar] [CrossRef]
  26. Biswal, B.; Mishra, D.K. Dielectric Properties of Alumino-silicate Ceramics Synthesized by Plasma Sintering. Ceram. Int. 2022, 48, 9765–9780. [Google Scholar] [CrossRef]
  27. Biswal, B.; Mishra, D.K.; Das, S.N.; Bhuyan, S. Structural, Micro-structural, Optical and Dielectric Behavior of Mullite Ceramics. Ceram. Int. 2021, 47, 32252–32263. [Google Scholar] [CrossRef]
  28. Li, L.; Xu, Z.; Li, H.; Li, J.; Hu, D.; Xiang, Y.; Han, L.; Peng, X. Immobilization of Strontium and Cesium by Aluminosilicate Ceramics Derived from Metakaolin Geopolymer-zeolite A Composites via 1100 °C Heating Treatment. Ceram. Int. 2022, 48, 15236–15242. [Google Scholar] [CrossRef]
  29. Mendes, J.P.; Elyseu, F.; Nieves, L.J.J.; Zaccaron, A.; Bernardin, A.M.; Angioletto, E. Synthesis and Characterization of Geopolymers Using Clay Ceramic Waste as Source of Aluminosilicate. Sustain. Mater. Technol. 2021, 28, e00264. [Google Scholar] [CrossRef]
  30. Tahwia, A.M.; Ellatief, M.A.; Bassioni, G.; Heniegal, A.M.; Elrahman, M.A. Influence of High Temperature Exposure on Compressive Strength and Microstructure of Ultra-high Performance Geopolymer Concrete with Waste glass and Ceramic. J. Mater. Res. Technol. 2023, 23, 5681–5697. [Google Scholar] [CrossRef]
  31. Suvorova, O.; Kumarova, V.; Nekipelov, D.; Selivanova, E.; Makarov, D.; Masloboev, V. Construction Ceramics from Ore Dressing Waste in Murmansk Region, Russia. Constr. Build. Mater. 2017, 153, 783–789. [Google Scholar] [CrossRef]
  32. Zhou, M.; Huang, Z.; Qi, J.; Wei, N.; Wu, D.; Zhang, Q.; Wang, S.; Feng, Z.; Lu, T. Densification and Grain Growth of Gd2Zr2O7 Nanoceramics During Pressureless Sintering. J. Eur. Ceram. Soc. 2017, 37, 1059–1065. [Google Scholar] [CrossRef]
  33. Oliveira, M.; Ferreira, J.M.F. Structural and Mechanical Characterisation of MgO-, CaO- and BaO-doped Aluminosilicate Ceramics. Mater. Sci. Eng. A 2003, 344, 35–44. [Google Scholar] [CrossRef]
  34. Lasheen, E.S.R.; Rashwan, M.A.; Azer, M.K. Effect of Mineralogical Variations on Physico-mechanical and Thermal Properties of Granitic Rocks. Sci. Rep. 2023, 13, 10320. [Google Scholar] [CrossRef] [PubMed]
  35. Turlybekuly, A.; Pogrebnjak, A.D.; Sukhodubb, L.F.; Sukhodubb, L.F.; Kistaubayeva, A.S.; Savitskaya, I.S.; Shokatayeva, D.H.; Shokatayeva, D.H.; Shaimardanov, Z.K.; Plotnikov, S.V.; et al. Synthesis, Characterization, In Vitro BioCompatibility and Antibacterial Properties Study of Nanocomposite Materials Based on Hydroxyapatite-Biphasic ZnO Micro- and Nanoparticles Embedded in Alginate Matrix. Mater. Sci. Eng. C 2019, 104, 109965. [Google Scholar] [CrossRef] [PubMed]
  36. Chalouati, Y.; Mannai, F.; Bennour, A.; Srasra, E. Firing Behavior of Argillites from Northern Tunisia as Raw Materials for Ceramic Applications. Int. J. Appl. Ceram. Technol. 2021, 18, 2323–2335. [Google Scholar] [CrossRef]
Figure 1. XRD patterns for M-0-1200, M-0-1150, M-0.05-1150, M-0.1-1150, M-0.3-1150 and M-0.5-1150.
Materials 17 02557 g001
Figure 2. Rietveld refinement of the XRD patterns for (a) M-0-1200, (b) M-0-1150, and (c) M-0.5-1150.
Materials 17 02557 g002
Figure 3. (a) TGA and (b) DSC curves of M-0 and M-0.5 samples.
Materials 17 02557 g003
Figure 4. (a) Full XPS spectra of M-0.5-1150 and M-0-1200 samples. (b) High-resolution XPS spectrum of the Mn 2p core level for M-0.5-1150 sample. (c) High-resolution XPS spectrum of the Mn 2p core level for M-0-1200 sample.
Materials 17 02557 g004
Figure 5. (a) Three-point flexural strength, (b) porosity factor and water absorption, (c) the relationship between pore size and incremental intrusion of Hg, and (d) pore size of as-prepared ceramic samples.
Materials 17 02557 g005
Figure 6. The FTIR spectra of (a) M-0 sintering at 1200 °C and (b–f) M-0, M-0.05, M-0.1, M-0.3, M-0.5 sintering at 1150 °C.
Materials 17 02557 g006
Figure 7. (af) SEM images of M-0-1200,M-0-1150, M-0.05-1150, M-0.1-1150, M-0.3-1150 and M-0.5-1150. (g) Field emission SEM images of M-0.5-1150 and element mapping results of (h) O, (i) Si, (j) Al, (k) Mn signals. The pores are marked by yellow circle.
Materials 17 02557 g007
Table 1. Chemical composition of raw materials.
OxidesSiO2Al2O3MnO2K2OFe2O3CaOOther
Content (wt.%)60~6520~250~0.12~41~20.5~12.9~16.5
Table 2. The cell parameters of the ceramic samples.
SamplesM-0-1200M-0-1150M-0.5-1150
Phase 1Quartz (wt.%)56.6158.5555.60
Space GroupP3121P3121P3121
Cell Parametersa (Å)4.9318 (61)4.9417 (67)4.9421(13)
b (Å)4.9318 (61)4.9417 (67)4.9421(13)
c (Å)5.4216 (84)5.4368 (10)5.4239 (19)
V (Å3)114.1990 (33)114.9780 (38)114.7280 (73)
Phase 2Mullite (wt.%)43.3941.4544.40
Space GroupPbamPbamPbam
Cell Parametersa (Å)7.5652 (12)7.5840 (15)7.5674 (23)
b (Å)7.7073 (12)7.7279 (16)7.7158 (25)
c (Å)2.8906 (43)2.8970 (50)2.8935 (10)
V (Å3)168.5400 (45)169.7880 (57)168.9500 (95)
Table 3. Chemical compositions of as-prepared ceramic samples a.
SampleAl2O3 (wt.%)SiO2 (wt.%)MnO2 (wt.%)Others (wt.%)
M-0-120025.4166.000.078.53
M-0-115025.3863.390.0911.14
M-0.05-115026.4364.440.188.96
M-0.1-115023.3163.390.5412.77
M-0.3-115024.3264.150.8410.69
M-0.5-115026.3364.140.898.64
a Measured using XRF.
Table 4. Physical properties of the as-prepared ceramic samples a.
SampleApparent Density
(g/mL)
Pore Volume
(mL/g)
M-0-12002.47990.0378
M-0-11502.54420.0774
M-0.05-11502.49310.0583
M-0.1-11502.50540.0625
M-0.3-11502.49780.0617
M-0.5-11502.42050.0223
a Data from MIP tests.
Disclaimer/Publisher’s Note: The statements, opinions and data contained in all publications are solely those of the individual author(s) and contributor(s) and not of MDPI and/or the editor(s). MDPI and/or the editor(s) disclaim responsibility for any injury to people or property resulting from any ideas, methods, instructions or products referred to in the content.

