

Effect of Thermal Activation on the Structure and Electrochemical Properties of Carbon Material Obtained from Walnut Shells

 , ,
, ,  ,
,  , and
, and 
Abstract
1. Introduction
2. Materials and Methods
3. Results and Discussion
4. Conclusions
Author Contributions
Funding
Institutional Review Board Statement
Informed Consent Statement
Data Availability Statement
Acknowledgments
Conflicts of Interest
References
- Jaiswal, K.K.; Chowdhury, C.R.; Yadav, D.; Verma, R.; Dutta, S.; Jaiswal, K.S.; Sangmesh, B.; Karuppasamy, K.S.K. Renewable and sustainable clean energy development and impact on social, economic, and environmental health. Energy Nexus 2022, 7, 100118. [Google Scholar] [CrossRef]
- Martins, F.; Felgueiras, C.; Smitkova, M.; Caetano, N. Analysis of Fossil Fuel Energy Consumption and Environmental Impacts in European Countries. Energies 2019, 12, 964. [Google Scholar] [CrossRef]
- Solarz, J.; Gawlik-Kobylińska, M.; Ostant, W.; Maciejewski, P. Trends in Energy Security Education with a Focus on Renewable and Nonrenewable Sources. Energies 2022, 15, 1351. [Google Scholar] [CrossRef]
- Chen, X.; Wang, M.; Wang, B.; Hao, H.; Shi, H.; Wu, Z.; Chen, J.; Gai, L.; Tao, H.; Zhu, B.; et al. Energy Consumption Reduction and Sustainable Development for Oil & Gas Transport and Storage Engineering. Energies 2023, 16, 1775. [Google Scholar] [CrossRef]
- Szroeder, P.; Sagalianov, I.Y.; Radchenko, T.M.; Tatarenko, V.A.; Prylutskyy, Y.I.; Strupiński, W. Effect of Uniaxial Stress on the Electrochemical Properties of Graphene with Point Defects. Appl. Surf. Sci. 2018, 442, 185–188. [Google Scholar] [CrossRef]
- Szroeder, P.; Sahalianov, I.; Radchenko, T.; Tatarenko, V.; Prylutskyy, Y. The Strain- and Impurity-Dependent Electron States and Catalytic Activity of Graphene in a Static Magnetic Field. Opt. Mater. 2019, 96, 109284. [Google Scholar] [CrossRef]
- Solomenko, A.G.; Balabai, R.M.; Radchenko, T.M.; Tatarenko, V.A. Functionalization of quasi-two-dimensional materials: Chemical and strain-induced modifications. Prog. Phys. Met. 2022, 23, 147–238. [Google Scholar] [CrossRef]
- Prysyazhnyuk, P.; Di Tommaso, D. The Thermodynamic and Mechanical Properties of Earth-Abundant Metal Ternary Borides Mo2(Fe,Mn)B2 Solid Solutions for Impact-and Wear-Resistant Alloys. Mater. Adv. 2023, 4, 3822–3838. [Google Scholar] [CrossRef]
- Prysyazhnyuk, P.; Shlapak, L.; Semyanyk, I.; Kotsyubynsky, V.; Troshchuk, L.; Korniy, S.; Artym, V. Analysis of the Effects of Alloying with Si and Cr on the Properties of Manganese Austenite Based on AB INITIO Modelling. East.-Eur. J. Enterp. Technol. 2020, 6, 28–36. [Google Scholar] [CrossRef]
- Pashechko, M.I.; Shyrokov, V.V.; Duryahina, Z.A.; Vasyliv, K.B. Structure and corrosion-mechanical properties of the surface layers of steels after laser alloying. Mater. Sci. 2003, 39, 108–117. [Google Scholar] [CrossRef]
- Duryahina, Z.A.; Kovbasyuk, T.M.; Bespalov, S.A.; Pidkova, V.Y. Micromechanical and Electrophysical Properties of Al2O3 Nanostructured Dielectric Coatings on Plane Heating Elements. Mater. Sci. 2016, 52, 50–55. [Google Scholar] [CrossRef]
- Koohi-Fayegh, S.; Rosen, M.A. A review of energy storage types, applications and recent developments. J. Energy Storage 2020, 27, 101047. [Google Scholar] [CrossRef]
- Rahman, M.M.; Oni, A.O.; Gemechu, E.; Kumar, A. Assessment of energy storage technologies: A review. Energy Convers. Manag. 2020, 223, 113295. [Google Scholar] [CrossRef]
- Sharma, S.; Chand, P. Supercapacitor and electrochemical techniques: A brief review. Results Chem. 2023, 5, 100885. [Google Scholar] [CrossRef]
- González, A.; Goikolea, E.; Barrena, J.A.; Mysyk, R. Review on supercapacitors: Technologies and materials. Renew. Sustain. Energy Rev. 2016, 58, 1189–1206. [Google Scholar] [CrossRef]
- He, Y.; Chen, W.; Gao, C.; Zhou, J.; Li, X.; Xie, E. An overview of carbon materials for flexible electrochemical capacitors. Nanoscale 2013, 5, 8799–8820. [Google Scholar] [CrossRef] [PubMed]
- Lee, Y.J.; Kim, G.-P.; Bang, Y.; Yi, J.; Seo, J.G.; Song, I.K. Activated carbon aerogel containing graphene as electrode material for supercapacitor. Mater. Res. Bull. 2014, 50, 240–245. [Google Scholar] [CrossRef]
- Gim, H.G.; Kim, Y.T.; Choi, J. Polydimethylsiloxane-assisted plasma electrolytic oxidation of Ti for synthesizing SiO2–TiO2 composites for application as Li-ion battery anodes. Electrochem. Commun. 2023, 148, 107455. [Google Scholar] [CrossRef]
- Sun, M.; Wu, J.; Lu, P.; Zhang, Z.; Zhang, Y.; Li, D. Sphere-like MoS2 and porous TiO2 composite film on Ti foil as lithium-ion battery anode synthesized by plasma electrolytic oxidation and magnetron sputtering. J. Alloys Compd. 2022, 892, 162075. [Google Scholar] [CrossRef]
- Ropyak, L.; Shihab, T.; Velychkovych, A.; Bilinskyi, V.; Malinin, V.; Romaniv, M. Optimization of Plasma Electrolytic Oxidation Technological Parameters of Deformed Aluminum Alloy D16T in Flowing Electrolyte. Ceramics 2023, 6, 146–167. [Google Scholar] [CrossRef]
- Shatskyi, I.; Makoviichuk, M.; Ropyak, L.; Velychkovych, A. Analytical Model of Deformation of a Functionally Graded Ceramic Coating under Local Load. Ceramics 2023, 6, 1879–1893. [Google Scholar] [CrossRef]
- Ropyak, L.; Shihab, T.; Velychkovych, A.; Dubei, O.; Tutko, T.; Bilinskyi, V. Design of a Two-Layer Al–Al2O3 Coating with an Oxide Layer Formed by the Plasma Electrolytic Oxidation of Al for the Corrosion and Wear Protections of Steel. Prog. Phys. Met. 2023, 24, 319–365. [Google Scholar] [CrossRef]
- Kamran, U.; Heo, Y.-J.; Lee, J.W.; Park, S.-J. Functionalized Carbon Materials for Electronic Devices: A Review. Micromachines 2019, 10, 234. [Google Scholar] [CrossRef]
- Frackowiak, E.; Béguin, F. Carbon materials for the electrochemical storage of energy in capacitors. Carbon 2001, 39, 937–950. [Google Scholar] [CrossRef]
- Malini, K.; Selvakumar, D.; Kumar, N.S. Activated carbon from biomass: Preparation, factors improving basicity and surface properties for enhanced CO2 capture capacity—A review. J. CO2 Util. 2023, 67, 102318. [Google Scholar] [CrossRef]
- Yuan, X.; Liang, C.; Ruan, C.; Chang, Y.; Xu, L.; Huang, H.; Chen, M.; Yong, Z. Low-cost synthesis of multi-walled carbon nanotubes using red soil as catalyst. Diam. Relat. Mater. 2021, 112, 108241. [Google Scholar] [CrossRef]
- Kumar, A.; Kostikov, Y.; Zanatta, M.; Sorarù, G.D.; Orberger, B.; Nessim, G.D.; Mariotto, G. Carbon nanotubes synthesis using siliceous breccia as a catalyst source. Diam. Relat. Mater. 2019, 97, 107433. [Google Scholar] [CrossRef]
- Reed, A.R.; Williams, P.T. Thermal processing of biomass natural fiber wastes by pyrolysis. Int. J. Energy Res. 2004, 28, 131–145. [Google Scholar] [CrossRef]
- Pang, X.; Cao, M.; Qin, J.; Li, X.; Yang, X. Synthesis of bamboo-derived porous carbon: Exploring structure change, pore formation and supercapacitor application. J. Porous Mater. 2022, 29, 559–569. [Google Scholar] [CrossRef]
- Yang, L.; Qiu, J.; Wang, Y.; Guo, S.; Feng, Y.; Dong, D.; Yao, J. Molten salt synthesis of hierarchical porous carbon from wood sawdust for supercapacitors. J. Electroanal. Chem. 2019, 856, 113673. [Google Scholar] [CrossRef]
- Chakraborty, A.; Paul, A.; Ghosh, A.; Murmu, N.C.; Kuila, T. Teak wood derived porous carbon: An efficient cathode material for zinc-ion hybrid supercapacitor. Energy Storage 2023, 6, e540. [Google Scholar] [CrossRef]
- Weerasinghe, J.; Prasad, K.; Mathew, J.; Trifoni, E.; Baranov, O.; Levchenko, I.; Bazaka, K. Carbon Nanocomposites in Aerospace Technology: A Way to Protect Low-Orbit Satellites. Nanomaterials 2023, 13, 1763. [Google Scholar] [CrossRef]
- Kolkovskyi, P.I.; Ostafiychuk, B.K.; Kolkovskyi, M.I.; Ivanichok, N.Y.; Sklepova, S.-V.S.; Rachiy, B.I. Mechanisms of charge accumulation in electrochemical systems formed based on nanoporous carbon and manganese oxide. Phys. Chem. Solid State 2020, 21, 621–627. [Google Scholar] [CrossRef]
- Arepalli, S.; Moloney, P. Engineered nanomaterials in aerospace. MRS Bull. 2015, 40, 804–811. [Google Scholar] [CrossRef]
- Kotsyubynsky, V.; Rachiy, B.; Boychuk, V.; Budzulyak, I.; Turovska, L.; Hodlevska, M. Correlation between structural properties and electrical conductivity of porous carbon derived from hemp bast fiber. Fuller. Nanotub. Carbon Nanostruct. 2022, 30, 873–882. [Google Scholar] [CrossRef]
- Ostafiychuk, B.K.; Ivanichok, N.Y.; Sklepova, S.-V.; Ivanichok, O.M.; Kotsyubynsky, V.O.; Kolkovskyy, P.I.; Budzulyak, I.M.; Lisovskiy, R.P. Influence of plant biomass activation conditions on the structure and electrochemical properties of nanoporous carbon material. Mater. Today Proc. 2022, 62, 5712–5715. [Google Scholar] [CrossRef]
- Sklepova, S.-V.S.; Gasyuk, I.M.; Ivanichok, N.Y.; Kolkovskyi, P.I.; Kotsyubynsky, V.O.; Rachiy, B.I. The porous structure of activated carbon-based on waste coffee grounds. Phys. Chem. Solid State 2022, 23, 484–490. [Google Scholar] [CrossRef]
- Ivanichok, N.Y.; Ivanichok, O.M.; Rachiy, B.I.; Kolkovskyi, P.I.; Budzulyak, I.M.; Kotsyubynsky, V.O.; Boychuk, V.M.; Khrushch, L.Z. Effect of the carbonization temperature of plant biomass on the structure, surface condition and electrical conductive properties of carbon nanoporous material. J. Phys. Stud. 2021, 25, 3801. [Google Scholar] [CrossRef]
- Liu, R.; Wang, C.H.; Bathgate, R.G. Crack Closure in Spherical Shells. Int. J. Fract. 1999, 99, 307–323. [Google Scholar] [CrossRef]
- Rong, L.; Tie, Z.; Wu, X.J.; Wang, C.H. Crack closure effect on stress intensity factors of an axially and a circumferentially cracked cylindrical shell. Int. J. Fract. 2004, 125, 227–248. [Google Scholar] [CrossRef]
- Shats’kyi, I.P. Closure of a longitudinal crack in a shallow cylindrical shell in bending. Mater. Sci. 2005, 41, 186–191. [Google Scholar] [CrossRef]
- Shats’kyi, I.P.; Makoviichuk, M.V. Contact interaction of crack lips in shallow shells in bending with tension. Mater. Sci. 2005, 41, 486–494. [Google Scholar] [CrossRef]
- Dovbnya, K.; Shevtsova, N. Studies on the stress state of an orthotropic shell of arbitrary curvature with the through crack under bending loading. Strength Mater. 2014, 46, 345–349. [Google Scholar] [CrossRef]
- Shats’kyi, I.P.; Makoviichuk, M.V. Analysis of the limiting state of cylindrical shells with cracks with regard for the contact of crack lips. Strength Mater. 2009, 41, 560–565. [Google Scholar] [CrossRef]
- Shatskii, I.P.; Makoviichuk, N.V. Effect of closure of collinear cracks on the stress-strain state and the limiting equilibrium of bent shallow shells. J. Appl. Mech. Tech. Phys. 2011, 52, 464–470. [Google Scholar] [CrossRef]
- Brunauer, S.; Emmett, P.H.; Teller, E. Adsorption of Gases in Multimolecular Layers. J. Am. Chem. Soc. 1938, 60, 309–319. [Google Scholar] [CrossRef]
- De Boer, J.H.; Lippens, B.C.; Linsen, B.G.; Broekhoff, J.C.P.; van den Heuvel, A.; Osinga, T.J. Thet-curve of multimolecular N2-adsorption. J. Colloid Interface Sci. 1966, 21, 405–414. [Google Scholar] [CrossRef]
- Evans, R.; Marconi, U.M.B.; Tarazona, P. Capillary condensation and adsorption in cylindrical and slit-like pores. J. Chem. Soc. Faraday Trans. 2 1986, 82, 1763–1787. [Google Scholar] [CrossRef]
- Neimark, A. A new approach to the determination of the surface fractal dimension of porous solids. Phys. A Stat. Mech. Appl. 1992, 191, 258–262. [Google Scholar] [CrossRef]
- Pfiefer, P.; Kennter, J.; Cole, M.W. Fundamentals of Adsorption; Mersmann, A.B., Sholl, S.E., Eds.; Engineering Foundation: New York, NY, USA, 1991; 689p. [Google Scholar]
- Tzeng, S.-S. Catalytic graphitization of electroless Ni–P coated PAN–based carbon fibers. Carbon 2006, 44, 1986–1993. [Google Scholar] [CrossRef]
- Zhou, Z.; Liu, T.; Khan, A.U.; Liu, G. Controlling the physical and electrochemical properties of block copolymer-based porous carbon fibers by pyrolysis temperature. Mol. Syst. Des. Eng. 2020, 5, 153–165. [Google Scholar] [CrossRef]
- Thommes, M.; Kaneko, K.; Neimark, A.V.; Olivier, J.P.; Francisco, R.; Rouquerol, J.; Sing, K.S.W. Physisorption of gases, with special reference to the evaluation of surface area and pore size distribution (IUPAC Technical Report). Pure Appl. Chem. 2015, 87, 1051. [Google Scholar] [CrossRef]
- Ulfah, M.; Raharjo, S.; Hastuti, P.; Darmadji, P. The influence of textural and chemical properties of palm kernel shell activated carbon on the adsorption capacity and desorption efficiency of β-carotene in a model system. Int. Food Res. J. 2019, 26, 345–353. Available online: http://www.ifrj.upm.edu.my/26%20(01)%202019/(39).pdf (accessed on 1 February 2019).
- Lua, A.C.; Yang, T. Effect of activation temperature on the textural and chemical properties of potassium hydroxide activated carbon prepared from pistachio-nut shell. J. Colloid Interface Sci. 2004, 274, 594–601. [Google Scholar] [CrossRef]
- Zhu, J.-F.; Liu, J.-Z.; Yang, Y.-M.; Cheng, J.; Zhou, J.-H.; Cen, K.-F. Fractal characteristics of pore structures in 13 coal specimens: Relationship among fractal dimension, pore structure parameter, and slurry ability of coal. Fuel Process. Technol. 2016, 149, 256–267. [Google Scholar] [CrossRef]
- Wang, Z.; Cheng, Y.; Qi, Y.; Wang, R.; Wang, L.; Jiang, J. Experimental study of pore structure and fractal characteristics of pulverized intact coal and tectonic coal by low temperature nitrogen adsorption. Powder Technol. 2019, 350, 15–25. [Google Scholar] [CrossRef]
- Pfeifer, P.; Liu, K.-Y. Chapter 12. Multilayer adsorption as a tool to investigate the fractal nature of porous adsorbents. In Studies in Surface Science and Catalysis; Rudziński, W., Steele, W.A., Zgrablich, G., Eds.; Elsevier: Amsterdam, The Netherlands, 1997; Volume 104, pp. 625–677. [Google Scholar] [CrossRef]
- Shanker, O. Random matrices, generalized zeta functions and self-similarity of zero distributions. J. Phys. A Math. Gen. 2006, 39, 13983–13997. [Google Scholar] [CrossRef]
- Bandura, A.; Skaskiv, O. Analytic functions in the unit ball of bounded L-index in joint variables and of bounded L-index in direction: A connection between these classes. Demonstr. Math. 2019, 52, 82–87. [Google Scholar] [CrossRef]
- Guo, F.; Zhao, X.; Guo, Y.; Zhang, Y.; Wu, J. Fractal analysis and pore structure of gasification fine slag and its flotation residual carbon. Colloid. Surface. A 2020, 585, 124148. [Google Scholar] [CrossRef]
- Tang, J.; Feng, L.; Li, Y.; Liu, J.; Liu, X. Fractal and pore structure analysis of Shengli lignite during drying process. Powder Technol. 2016, 303, 251–259. [Google Scholar] [CrossRef]
- Jorio, A.; Souza Filho, A.G. Raman Studies of Carbon Nanostructures. Annu. Rev. Mater. Res. 2016, 46, 357–382. [Google Scholar] [CrossRef]
- Sadezky, A.; Muckenhuber, H.; Grothe, H.; Niessner, R.; Pöschl, U. Raman microspectroscopy of soot and related carbonaceous materials: Spectral analysis and structural information. Carbon 2005, 43, 1731–1742. [Google Scholar] [CrossRef]
- Bokobza, L.; Bruneel, J.-L.; Couzi, M. Raman spectroscopy as a tool for the analysis of carbon-based materials (highly oriented pyrolitic graphite, multilayer graphene and multiwall carbon nanotubes) and of some of their elastomeric composites. Vib. Spectrosc. 2014, 74, 57–63. [Google Scholar] [CrossRef]
- Yuan, X.; Cong, Y.; Yu, Y.; Li, X.; Zhang, J.; Dong, Z.; Yuan, G.; Cui, Z.; Li, Y. Unique graphitized mesophase carbon microbead@niobium carbide-derived carbon composites as high performance anode materials of lithium-ion battery. Electrochim. Acta 2017, 238, 112–119. [Google Scholar] [CrossRef]
- Qiu, B.; Deng, Y.; Du, M.; Xing, M.; Zhang, J. Ultradispersed Cobalt Ferrite Nanoparticles Assembled in Graphene Aerogel for Continuous Photo-Fenton Reaction and Enhanced Lithium Storage Performance. Sci. Rep. 2016, 6, 29099. [Google Scholar] [CrossRef]
- Pimenta, M.A.; Dresselhaus, G.; Dresselhaus, M.S.; Cançado, L.G.; Jorio, A.; Saito, R. Studying disorder in graphite-based systems by Raman spectroscopy. Phys. Chem. Chem. Phys. 2007, 9, 1276–1290. [Google Scholar] [CrossRef]
- Boichuk, V.; Kotsyubynsky, V.; Kachmar, A.; Budzulyak, S.; Budzulyak, I.; Rachiy, B.; Yablon, L. Effect of Synthesis Conditions on Pseudocapacitance Properties of Nitrogen-Doped Porous Carbon Materials. J. Nano Res. 2019, 59, 112–125. [Google Scholar] [CrossRef]
- Ardizzone, S.; Fregonara, G.; Trasatti, S. “Inner” and “Outer” active surface of RuO2 electrodes. Electrochim. Acta 1990, 35, 263–267. [Google Scholar] [CrossRef]
- Mei, B.-A.; Munteshari, O.; Lau, J.; Dunn, B.; Pilon, L. Physical Interpretations of Nyquist Plots for EDLC Electrodes and Devices. J. Phys. Chem. C 2017, 122, 194–206. [Google Scholar] [CrossRef]
- Mandzyuk, V.I.; Mironyuk, I.F.; Ivanichok, N.Y.; Rachiy, B.I. Impedance spectroscopy of capacitor systems based on saccharide-derived porous carbon materials. Phys. Chem. Solid State 2021, 22, 711–716. [Google Scholar] [CrossRef]
- Li, J.; Zhao, X.D. Preparation and Electrochemical Characterization of an Activated Carbon Material of High Surface Area for Supercapacitor. Adv. Mater. Res. 2012, 463–464, 410–414. [Google Scholar] [CrossRef]


| Sample | Surface Area, m2/g | Pore Volume, cm3/g | Vmeso/V∑, % | dpor, nm | ||
|---|---|---|---|---|---|---|
| SBET | Smicro | V∑ | Vmeso | |||
| CC | 238 | 133 | 0.133 | 0.014 | 10.5 | 2.2 |
| CCA1 | 421 | – | 0.576 | 0.445 | 77.3 | 5.5 |
| CCA2 | 431 | – | 0.521 | 0.390 | 74.9 | 4.8 |
| CCA3 | 400 | – | 0.498 | 0.387 | 77.7 | 5.0 |
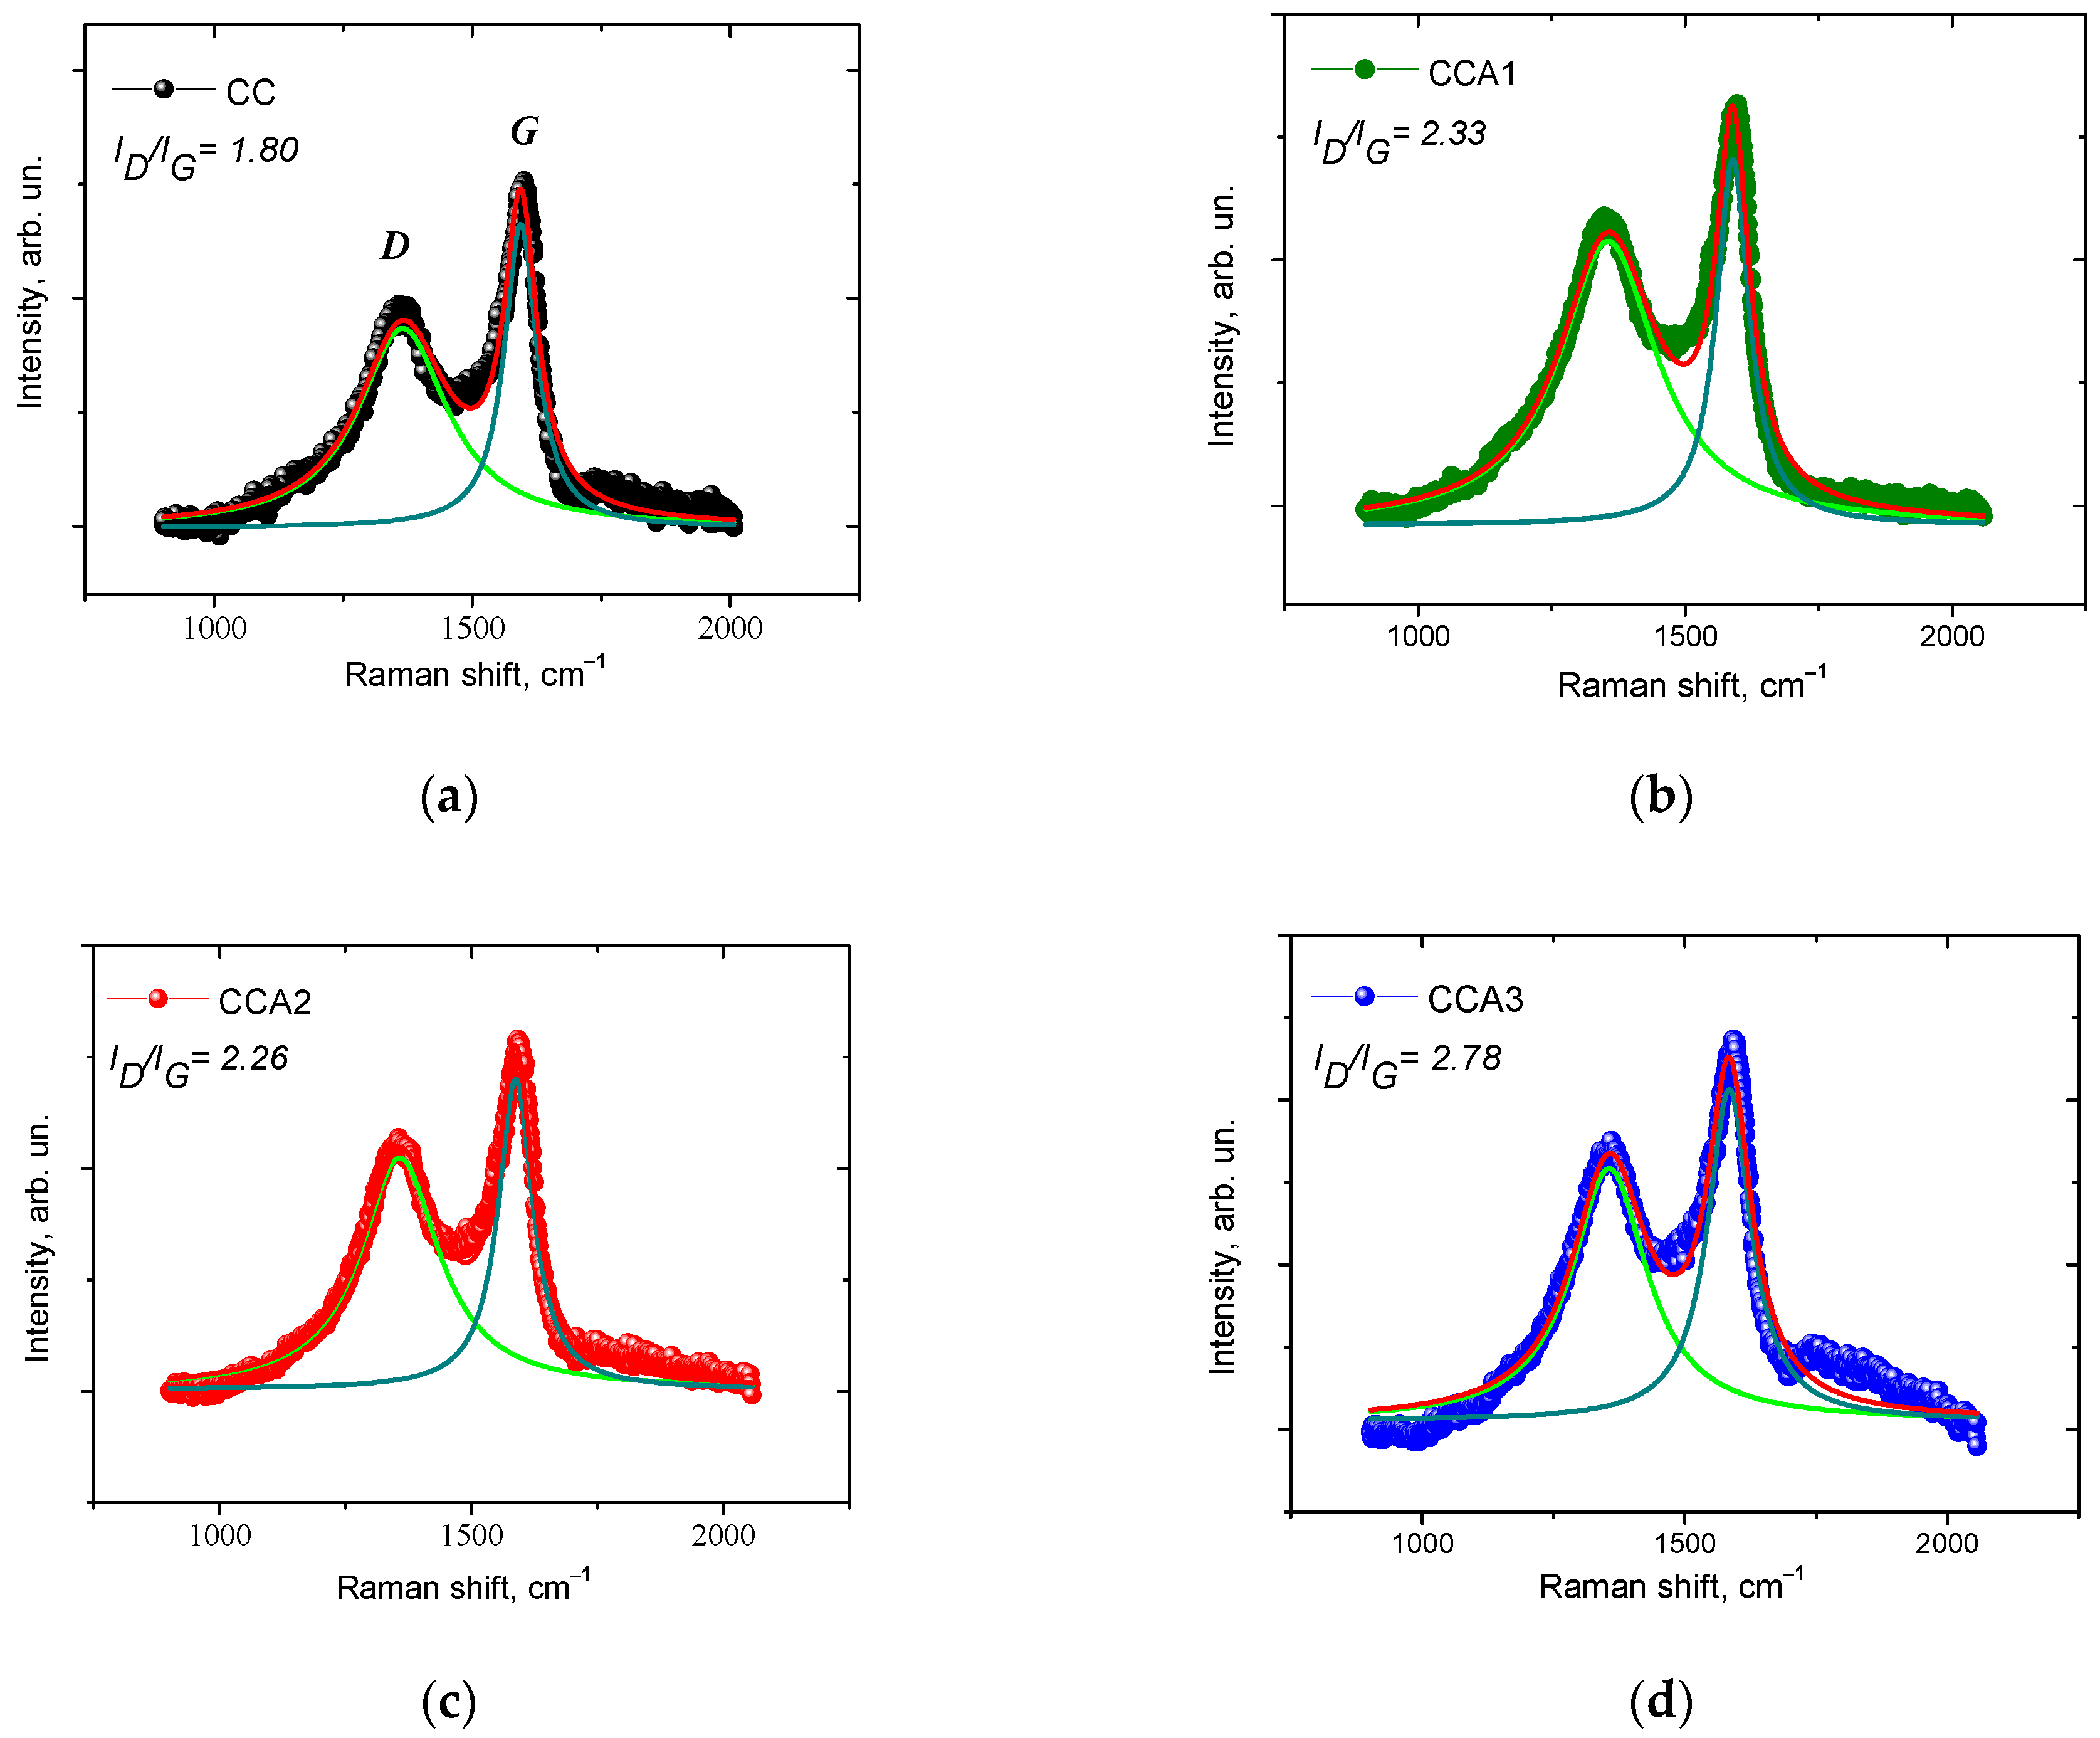
| Sample | Low-Pressure Region (P/P0 ≤ 0.4) | High-Pressure Region (P/P0 > 0.4) | ||||
|---|---|---|---|---|---|---|
| Slope | R2 | DF1 | Slope | R2 | DF2 | |
| CC | −0.830 ± 0.003 | 0.996 | 2.17 | −0.115 ± 0.003 | 0.991 | 2.88 |
| CCA1 | −0.479 ± 0.002 | 1.0 | 2.52 | −0.418 ± 0.02 | 0.991 | 2.58 |
| CCA2 | −0.308 ± 0.002 | 1.0 | 2.69 | −0.379 ± 0.01 | 0.994 | 2.62 |
| CCA3 | −0.311 ± 0.003 | 0.999 | 2.69 | −0.378 ± 0.02 | 0.994 | 2.62 |
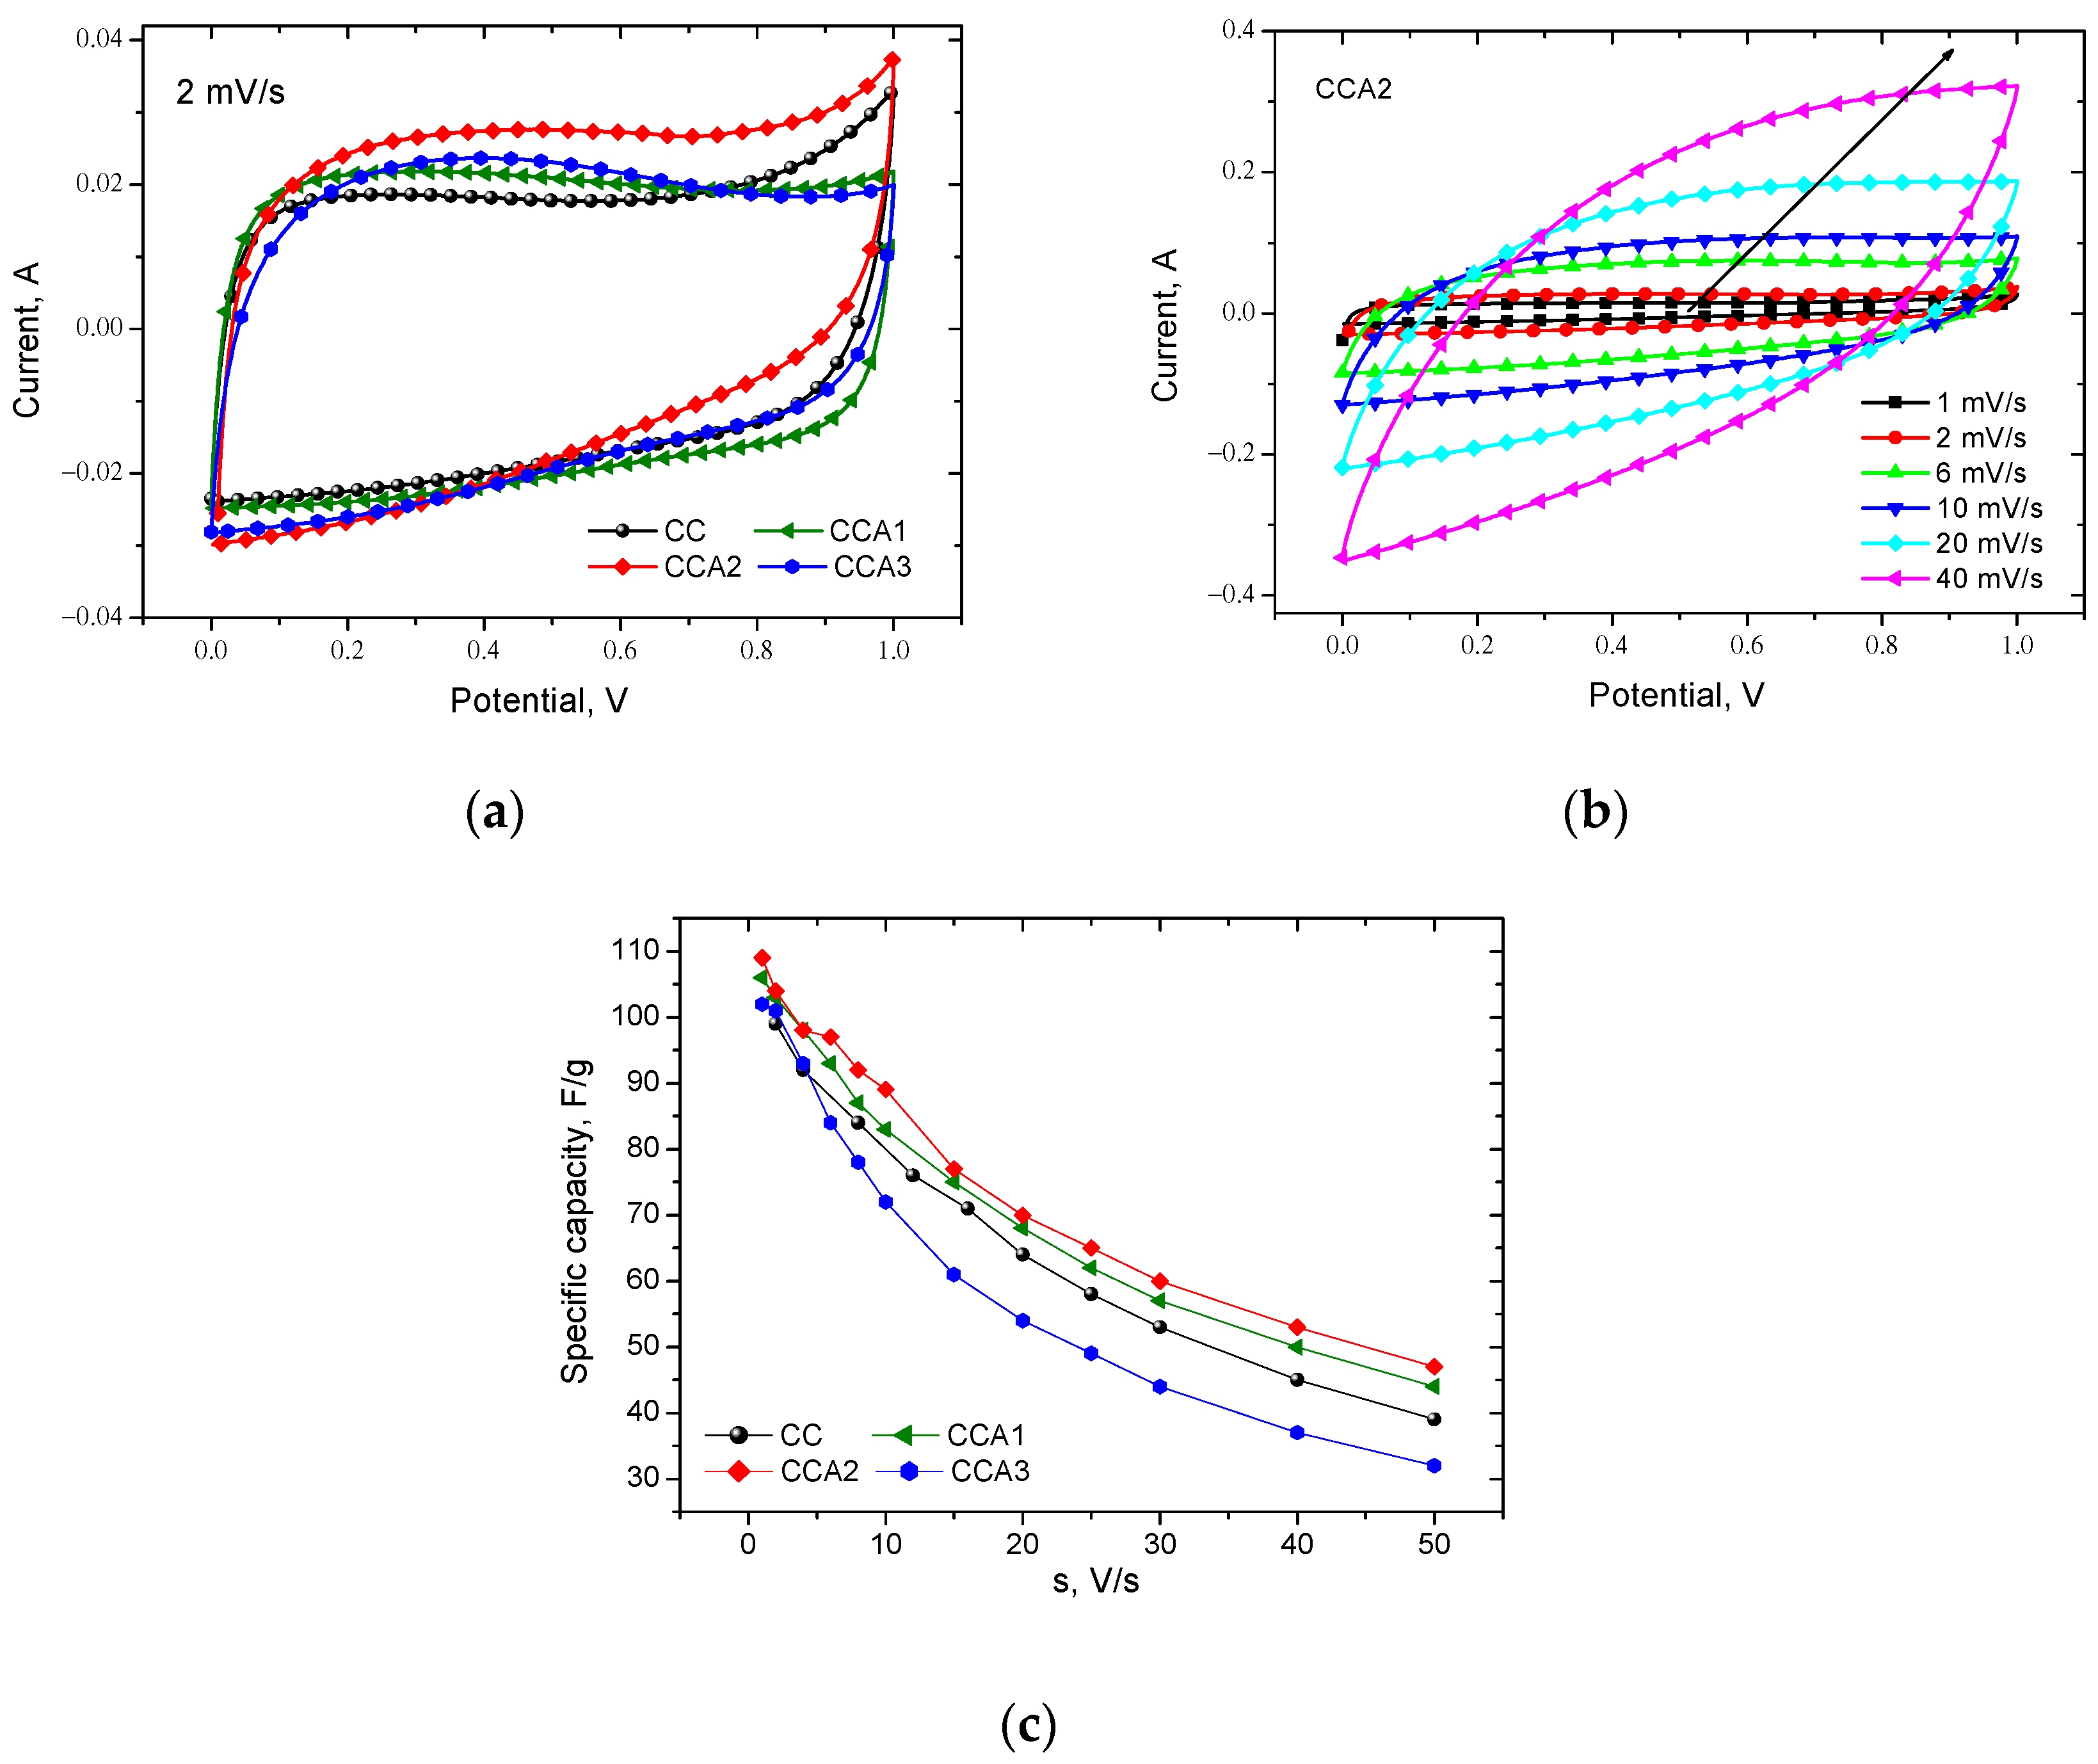
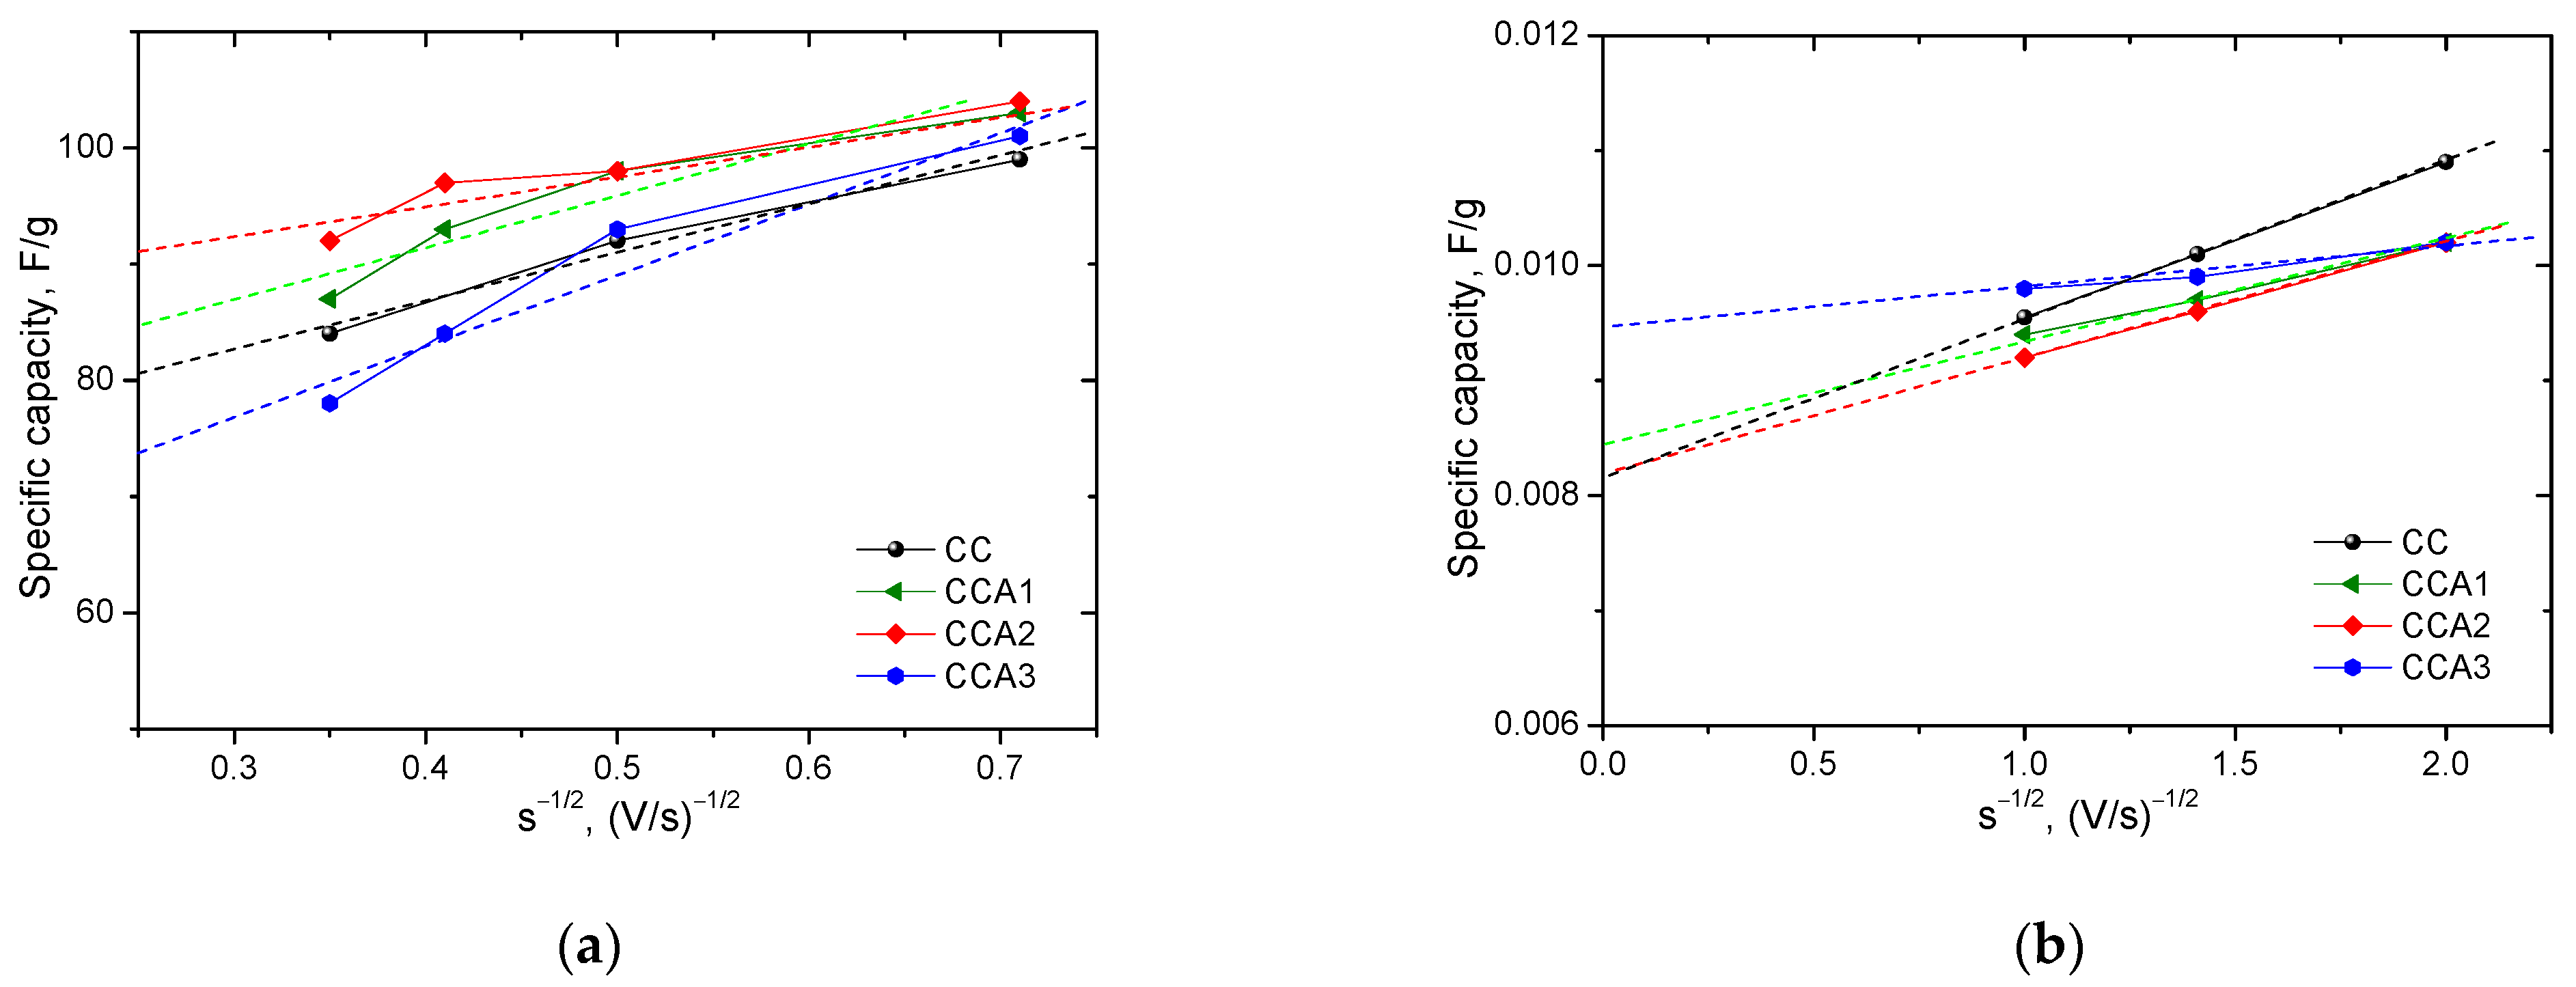
| Capacity | PCM | |||
|---|---|---|---|---|
| CC | CCA1 | CCA2 | CCA3 | |
| CDEL, F/g | 70.3 | 75.0 | 83.0 | 58.5 |
| C, F/g | 120 | 116 | 122 | 107 |
| CDEL/C, % | 59 | 65 | 68 | 55 |
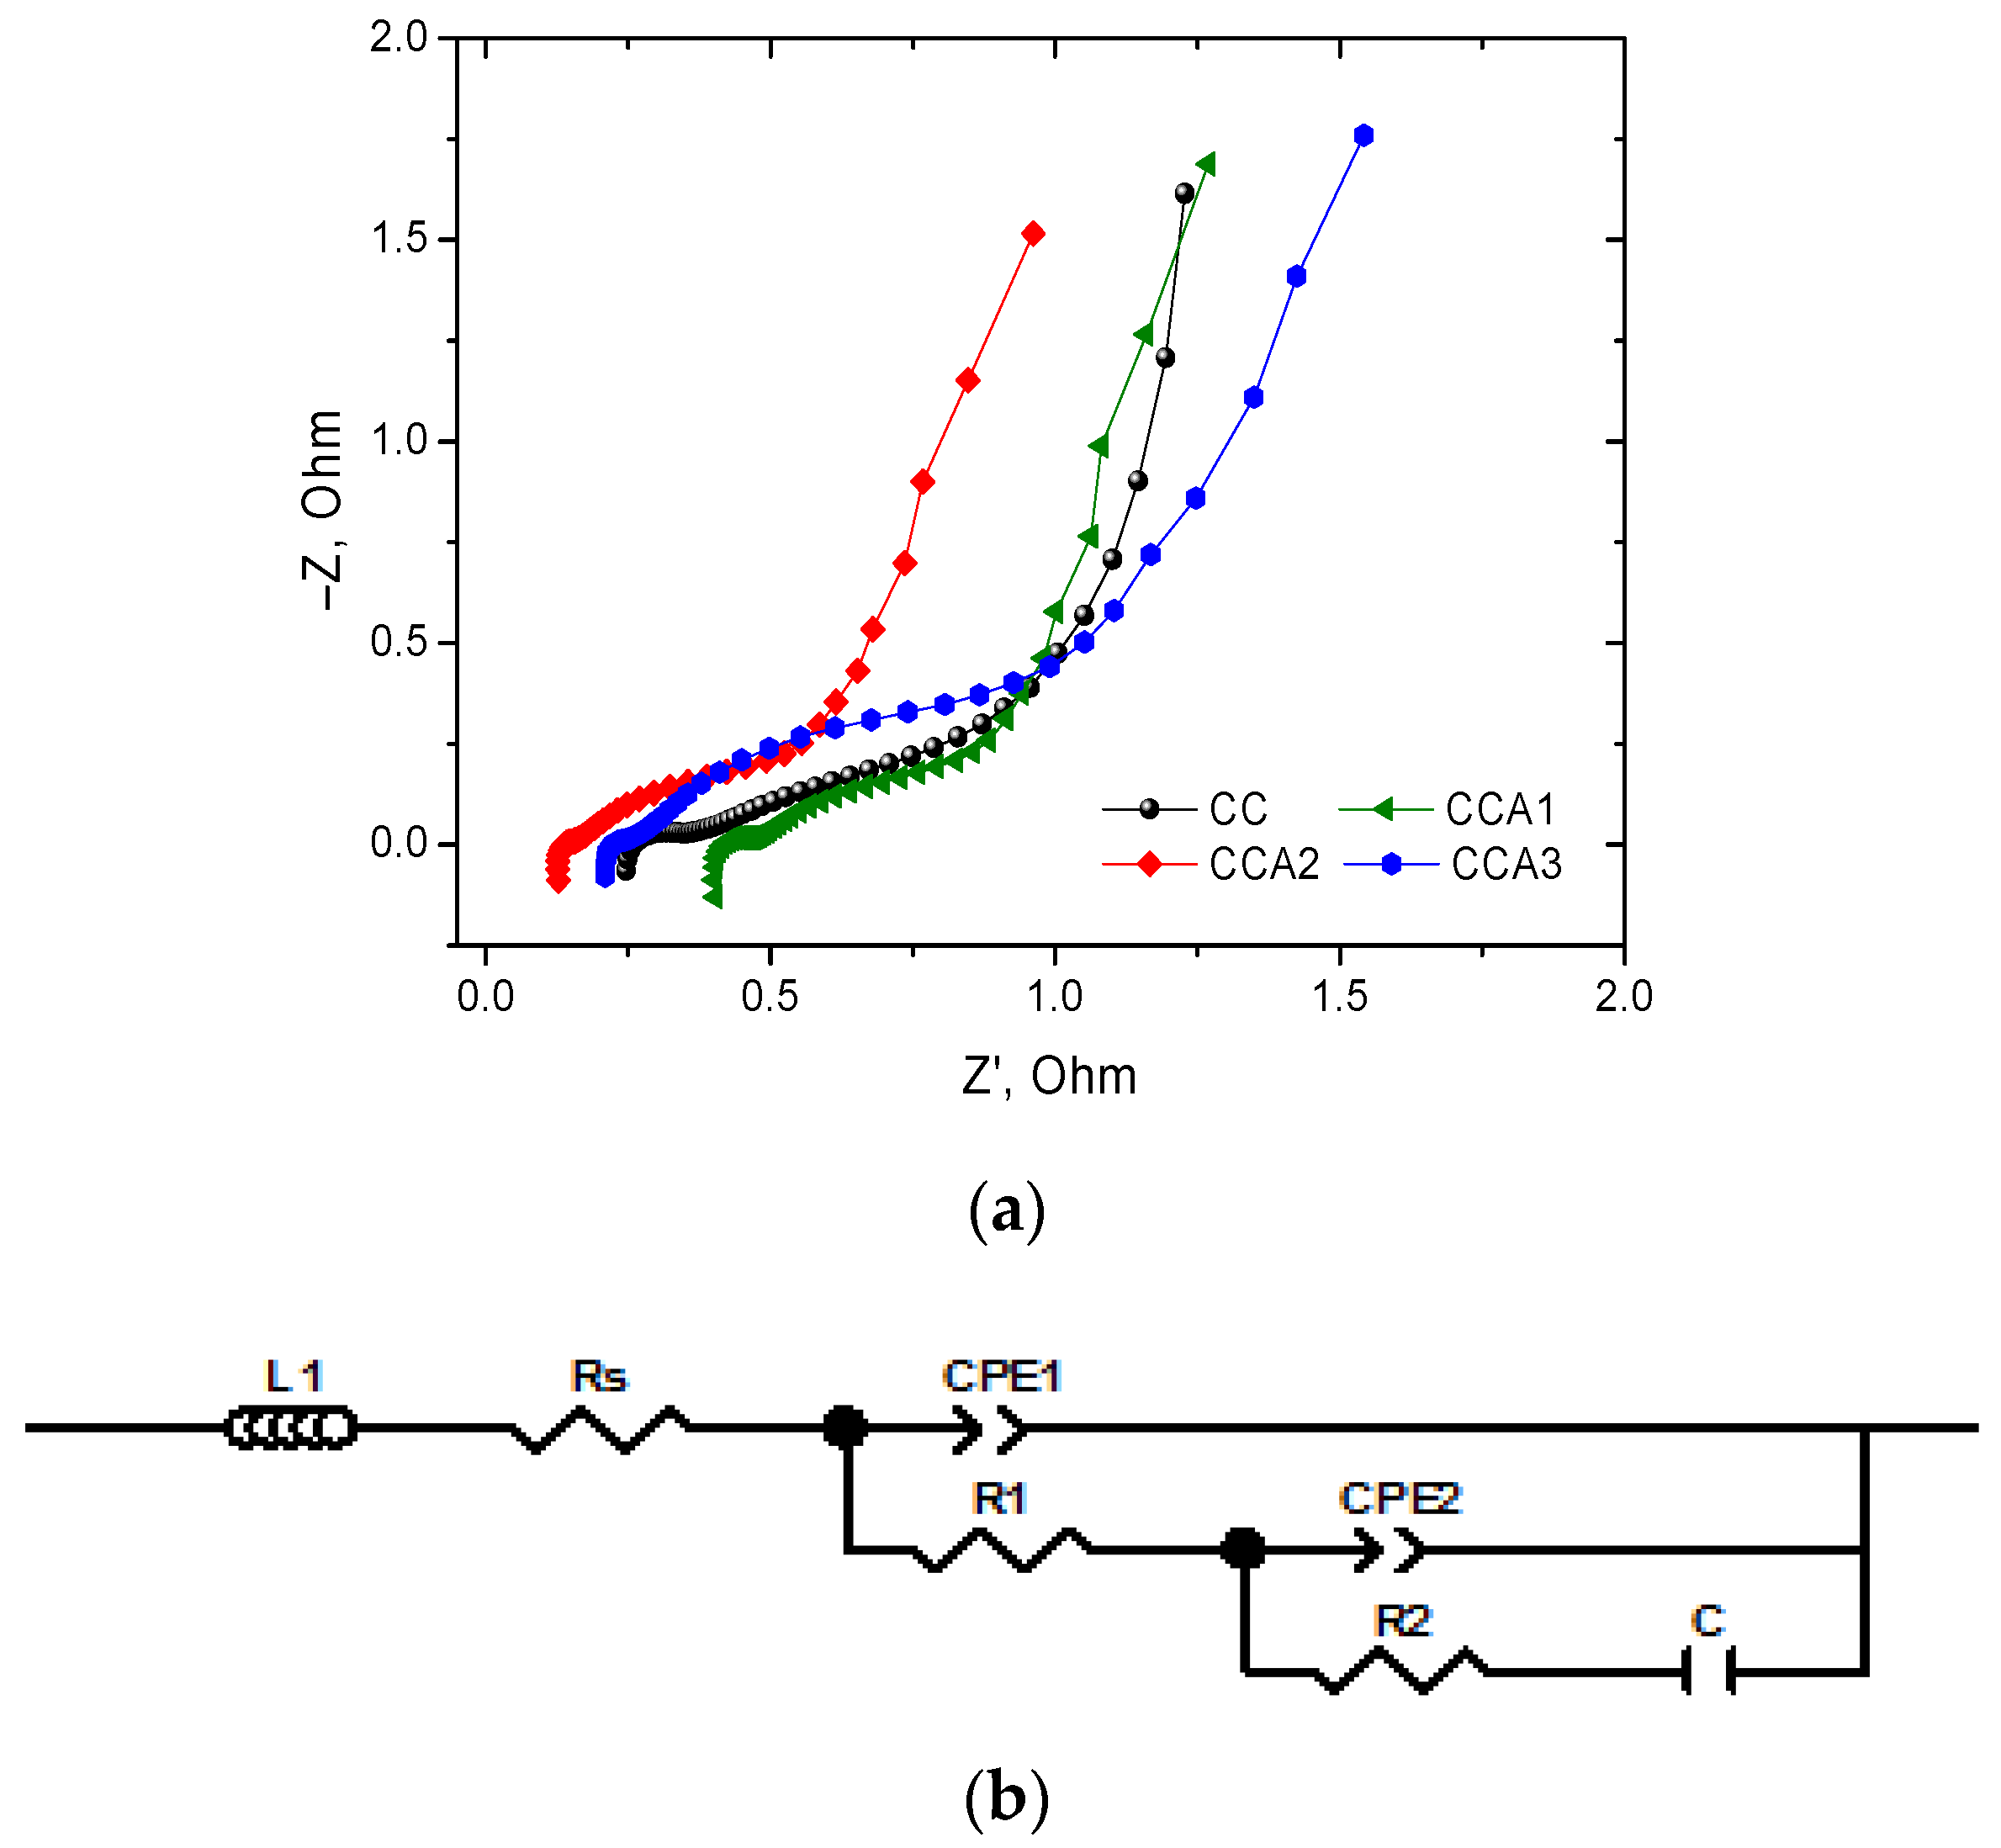
| Sample PCM | L, μH | Rs, Ohm | CPE1T | CPE1P | R1, Ohm | CPE2T | CPE2P | R2, Ohm | C, F |
|---|---|---|---|---|---|---|---|---|---|
| CC | 0.14 | 0.19 | 0.038 | 0.43 | 0.20 | 0.99 | 0.50 | 1.13 | 4.87 |
| CCA1 | 0.19 | 0.39 | 0.004 | 0.75 | 0.07 | 1.05 | 0.53 | 0.85 | 4.90 |
| CCA2 | 0.15 | 0.12 | 0.003 | 0.84 | 0.03 | 1.21 | 0.55 | 0.92 | 5.30 |
| CCA3 | 0.13 | 0.20 | 0.007 | 0.71 | 0.05 | 0.80 | 0.56 | 1.70 | 5.10 |
Disclaimer/Publisher’s Note: The statements, opinions and data contained in all publications are solely those of the individual author(s) and contributor(s) and not of MDPI and/or the editor(s). MDPI and/or the editor(s) disclaim responsibility for any injury to people or property resulting from any ideas, methods, instructions or products referred to in the content. |
© 2024 by the authors. Licensee MDPI, Basel, Switzerland. This article is an open access article distributed under the terms and conditions of the Creative Commons Attribution (CC BY) license (https://creativecommons.org/licenses/by/4.0/).
Share and Cite
Ivanichok, N.; Kolkovskyi, P.; Ivanichok, O.; Kotsyubynsky, V.; Boychuk, V.; Rachiy, B.; Bembenek, M.; Warguła, Ł.; Abaszade, R.; Ropyak, L. Effect of Thermal Activation on the Structure and Electrochemical Properties of Carbon Material Obtained from Walnut Shells. Materials 2024, 17, 2514. https://doi.org/10.3390/ma17112514
Ivanichok N, Kolkovskyi P, Ivanichok O, Kotsyubynsky V, Boychuk V, Rachiy B, Bembenek M, Warguła Ł, Abaszade R, Ropyak L. Effect of Thermal Activation on the Structure and Electrochemical Properties of Carbon Material Obtained from Walnut Shells. Materials. 2024; 17(11):2514. https://doi.org/10.3390/ma17112514
Chicago/Turabian StyleIvanichok, Nataliia, Pavlo Kolkovskyi, Oleh Ivanichok, Volodymyr Kotsyubynsky, Volodymyra Boychuk, Bogdan Rachiy, Michał Bembenek, Łukasz Warguła, Rashad Abaszade, and Liubomyr Ropyak. 2024. "Effect of Thermal Activation on the Structure and Electrochemical Properties of Carbon Material Obtained from Walnut Shells" Materials 17, no. 11: 2514. https://doi.org/10.3390/ma17112514
APA StyleIvanichok, N., Kolkovskyi, P., Ivanichok, O., Kotsyubynsky, V., Boychuk, V., Rachiy, B., Bembenek, M., Warguła, Ł., Abaszade, R., & Ropyak, L. (2024). Effect of Thermal Activation on the Structure and Electrochemical Properties of Carbon Material Obtained from Walnut Shells. Materials, 17(11), 2514. https://doi.org/10.3390/ma17112514