Article

Phonon Properties and Lattice Dynamics of Two- and Tri-Layered Lead Iodide Perovskites Comprising Butylammonium and Methylammonium Cations—Temperature-Dependent Raman Studies

Institute of Low Temperature and Structure Research, Polish Academy of Sciences, Okólna 2 str., 50-422 Wroclaw, Poland
*
Author to whom correspondence should be addressed.
Materials 2024, 17(11), 2503; https://doi.org/10.3390/ma17112503
Submission received: 23 April 2024 / Revised: 14 May 2024 / Accepted: 19 May 2024 / Published: 22 May 2024
(This article belongs to the Special Issue Terahertz Vibrational Spectroscopy in Advanced Materials)

Abstract

:
Hybrid lead iodide perovskites are promising photovoltaic and light-emitting materials. Extant literature data on the key optoelectronic and luminescent properties of hybrid perovskites indicate that these properties are affected by electron–phonon coupling, the dynamics of the organic cations, and the degree of lattice distortion. We report temperature-dependent Raman studies of BA2MAPb2I7 and BA2MA2Pb3I10 (BA = butylammonium; MA = methylammonium), which undergo two structural phase transitions. Raman data obtained in broad temperature (360–80 K) and wavenumber (1800–10 cm−1) ranges show that ordering of BA+ cations triggers the higher temperature phase transition, whereas freezing of MA+ dynamics occurs below 200 K, leading to the onset of the low-temperature phase transition. This ordering is associated with significant deformation of the inorganic sublattice, as evidenced by changes observed in the lattice mode region. Our results show, therefore, that Raman spectroscopy is a very valuable tool for monitoring the separate dynamics of different organic cations in perovskites, comprising “perovskitizer” and interlayer cations.

1. Introduction

Hybrid organic–inorganic lead halide perovskites have been widely studied in recent years due to their outstanding photovoltaic, light-emitting, nonlinear optical (NLO), and ferroelectric properties. These compounds may crystallize in various structures that exhibit significantly different properties. The three-dimensional (3D) perovskites of the general formula APbX3 (A = small organic cation, X = halide anion) are famous for their photovoltaic properties, which make them attractive materials for new-generation solar cells [1,2]. Unfortunately, the 3D perovskites are rare and can be formed for a few small organic cations only, such as methylammonium (MA+), formamidinium (FA+), aziridinium (AZR+), and methylhydrazinium (MHy+) [3,4,5,6,7,8,9]. One of the methods to enhance the diversity and modify the properties of these 3D lead halide perovskites is the preparation of mixed systems [10,11]. A more efficient way is, however, the employment of larger organic cations, which allow the synthesis of various lower-dimensional structures [12,13,14]. The most interesting ones are two-dimensional (2D) single-layered A′PbX4 or A″2PbX4 analogues (A′ and A″ are divalent and monovalent cations, respectively), composed of layers built up from corner-shared PbX6 octahedra separated by organic layers [14,15,16,17,18]. Such systems are natural quantum well structures, with much higher exciton binding energy and a blue shift of the bandgap compared to 3D analogues [14,15,16]. As a result, the photovoltaic performance of such 2D perovskites is poor compared to 3D analogues [19]. However, they are attractive materials for light-emitting, ferroelectric, and NLO applications [15,16,17,18,20]. To overcome problems with the large exciton binding energy of single-layered 2D perovskites, quasi-layered perovskites comprising two different cations can be synthesized. Most famous are Dion–Jacobson (DJ) (A′An−1PbnX3n+1) and Ruddlesden–Popper (RP) (A″2An−1PbnX3n+1) compounds (n indicates the number of octahedral layers within each inorganic slab), in which small cage cations A are located in the voids of inorganic slabs and large divalent (A′) or monovalent (A″) cations separate the slabs [11,18,21]. It is worth adding that in such systems, an increase in the inorganic slab thickness (number of layers, n) improves photovoltaic properties [21,22].
Lead halide perovskites are soft semiconductors in which optoelectronic properties, especially exciton binding energy and charge carrier transport, are strongly affected by changes in the strength of electron–phonon coupling [23,24,25]. This strength depends on the energy of phonon modes, the deformation of inorganic slabs, and the dynamics of organic cations [23,24,25]. The presence of organic components and the freezing of their dynamic molecular motions also afford an effective way for the generation of polar (ferro- or antiferroelectric) order [11,15,20,26,27]. It is therefore important to understand the effect of temperature on phonon properties, the dynamics of organic cations, and structural changes in hybrid perovskites. The most widely used method for such studies is Raman spectroscopy. This method has been employed for studies of many 3D and single-layer 2D lead halide perovskites [28,29,30,31,32,33,34,35,36]. Surprisingly, Raman studies of multilayered perovskites are very scarce. Fu et al. probed the low-wavenumber (200–20 cm−1) Raman modes of HA2GAPb2I7 and HA2MAPb2I7 (HA = hexylammonium) in the 300–77 K range, which revealed no phase transitions [37]. The low-wavenumber ranges of HA2GAPb2I7 (below 250 cm−1) and BA2MAPb2Br7 (150–10 cm−1) were also studied as a function of pressure to monitor distortion of the inorganic layers on compression [38,39]. RT Raman spectra below 200 cm−1 were presented for BA2APb2I7 (A = MA, FA, GA, dimethylammonium) and in the 1700–800 cm−1 range for BA2MA2Pb3I10 and BA2EA2Pb3I10 (EA = ethylammonium) [40,41]. Dahod et al. reported Raman spectra at RT and 77 K in the 150–10 cm−1 range for a range of RP phases (n = 2–4) comprising MA+ and FA+ cage cations and BA+ interlayer cations [42]. Recently, pressure-dependent Raman studies were reported for BA2MAPb2I7 in the 890–450 cm−1 range to monitor pressure-driven isomerism of BA+ cations [43]. This short overview of literature data shows that reports on Raman spectra of multi-layered perovskites were limited to narrow wavenumbers or temperature ranges.
Multi-layered RP iodides comprising BA+ and MA+ cations (n = 2–4) have been discovered by Stoumpos et al., and their crystal structures were reported as non-centrosymmetric at RT, i.e., Cc2m for BA2MAPb2I7 and C2cb for BA2MA2Pb3I10 [44]. This report suggests that these perovskites are promising candidates for solar cell and light-emitting applications. Later studies confirmed the good photovoltaic properties of these compounds [45,46] and showed that they also exhibit efficient NLO properties such as third harmonic generation (THG) and two-photon absorption [47]. Differential scanning colorimetry (DSC) showed that BA2MAPb2I7 (BA2MA2Pb3I10) exhibits two structural phase transitions observed on heating near 200 and 280 K (190 and 280 K) [48]. However, the nature of these phase transitions has not been studied. Cortecchia et al. confirmed that on cooling, BA2MAPb2I7 exhibits two structural phase transitions at 280.5 and 195.5 K associated with Cc2mP 1 ¯ P 1 ¯ symmetry change [49]. The higher (lower) temperature phase transition involved large (negligible) out-of-plane tilting of the octahedral units [49]. This paper did not provide any information on the contribution of BA+ and MA+ cation dynamics to the phase transition mechanism since BA+ and MA+ cations were assumed to be ordered in all phases. Two phase transitions were also reported for BA2MA2Pb3I10 at ~284 and ~185–190 K, but the crystal structures of the high-temperature (HT) and intermediate phases were solved as centrosymmetric, i.e., Cmca and P 1 ¯ , respectively [50]. The centrosymmetric structure of the room-temperature phase, space group Cmcm, was also proposed for BA2MAPb2I7 [50]. Later studies revealed that BA2MAPb2I7 and BA2MA2Pb3I10 undergo phase transitions at 283.5 K (280 K) and 282 K (279 K) on heating and cooling, respectively, and that the phase stable below 280 K shows the presence of two different BA+ conformers [51]. This interesting report also showed that the phase transition is associated with a large change in the butyl CH3 group dynamics and that the dynamics of MA+ are similar to those in 3D MAPbI3 [51]. Very recently, quasi-elastic neutron scattering studies of BA2MAPb2I7 and BA2MA2Pb3I10 revealed that rotational freedom of the butyl CH3 group and MA+ cation freezes below 280 and 180 K, respectively [52]. It was also concluded that the rotational freedom of both cations is more restricted in the n = 2 compound [52].
Herein, we report temperature-dependent Raman studies of BA2MAPb2I7 and BA2MA2Pb3I10 to understand the effect of the inorganic slab thickness on the phonon properties of these perovskites. Our aim is also to understand the mechanism of the phase transitions and temperature-induced changes in the lattice dynamics and how the behavior of multi-layered perovskites differs from the behavior of 3D MAPbI3.

2. Materials and Methods

2.1. Materials and Synthesis

Single crystals of BA2MAPb2I7 and BA2MA2Pb3I10 were grown in the same method as recently reported for MA1-xAxPbI3 systems (A = EA, MHy) [53,54]. In this method, stoichiometric amounts of PbI2, n-butylamine (99.5%, Sigma-Aldrich, St. Louis, MO, USA), and methylamine (2M solution in methanol, Sigma-Aldrich, St. Louis, MO, USA) were dissolved in a mixture of propylene carbonate (99.7%, Sigma-Aldrich, St. Louis, MO, USA) and hydroiodic acid (57 wt% in H2O, Sigma-Aldrich, St. Louis, MO, USA). The HI/propylene carbonate ratio was 1:2.7, and the total amount of reagents corresponded to one mmol of the target compounds. The clear solutions were transferred to glass vials, which were closed and kept at 50 °C. Dark purple (BA2MA2Pb3I10) and purple (BA2MAPb2I7) plate-like crystals were separated from the liquid and dried at RT. A good agreement of their powder diffraction patterns with the simulated ones based on single-crystal data reported in [44] confirmed the phase purity of the obtained bulk samples (Figure S1).

2.2. Raman Spectroscopy

Temperature-dependent Raman spectra of BA2MAPb2I7 and BA2MA2Pb3I10 crystals in the 1700–100 cm−1 range were measured using a Renishaw inVia Raman spectrometer (Renishaw, Wotton-under-Edge, UK), equipped with a confocal DM2500 Leica optical microscope (Renishaw, Wotton-under-Edge, UK), a thermoelectrically cooled CCD as a detector (Renishaw, Wotton-under-Edge, UK), and a diode laser operating at 830 nm (Renishaw, Wotton-under-Edge, UK). A 20× microscope magnification lens was used; the size of the studied crystals was less than 0.5 mm, and the laser spot diameter was about 0.75 μm. We could not record the spectra in the N-H and C-H stretching regions (above 2800 cm−1) since the higher wavenumber range of the used CCD detector combined with the 830 nm laser is 1800 cm−1. The same spectrometer was used to record Raman spectra in the low-wavenumber range (200–10 cm−1), but in this case an eclipse filter (Renishaw, Wotton-under-Edge, UK) was employed. This range was measured since it provides information on the lattice modes and, thus, the long-range order and distortion of the inorganic sublattice. The temperature was controlled using a THMS600 stage (Linkam, Tadworth, UK), and the spectral resolution was 2 cm−1. The temperature ranges, 360–80 and 320–80 K for BA2MAPb2I7 and BA2MA2Pb3I10, respectively, were chosen to cover the temperatures at which phase transformations occur. The lowest temperature was 80 K due to the limitations of the Linkam stage.

3. Results and Discussion

3.1. Temperature-Dependent Raman Study of BA2MAPb2I7

Room-temperature and intermediate structures of BA2MAPb2I7 are presented in Figure 1a. These structures consist of corner-shared PbI6 octahedra forming inorganic slabs composed of two perovskite layers. MA+ cations are located inside the perovskite voids, while BA+ cations separate the inorganic slabs. Both structures differ in respect to organic cation disorder and tilts of PbI6 octahedra, as mentioned in the Section 1. Further crystallographic details can be found in [50].
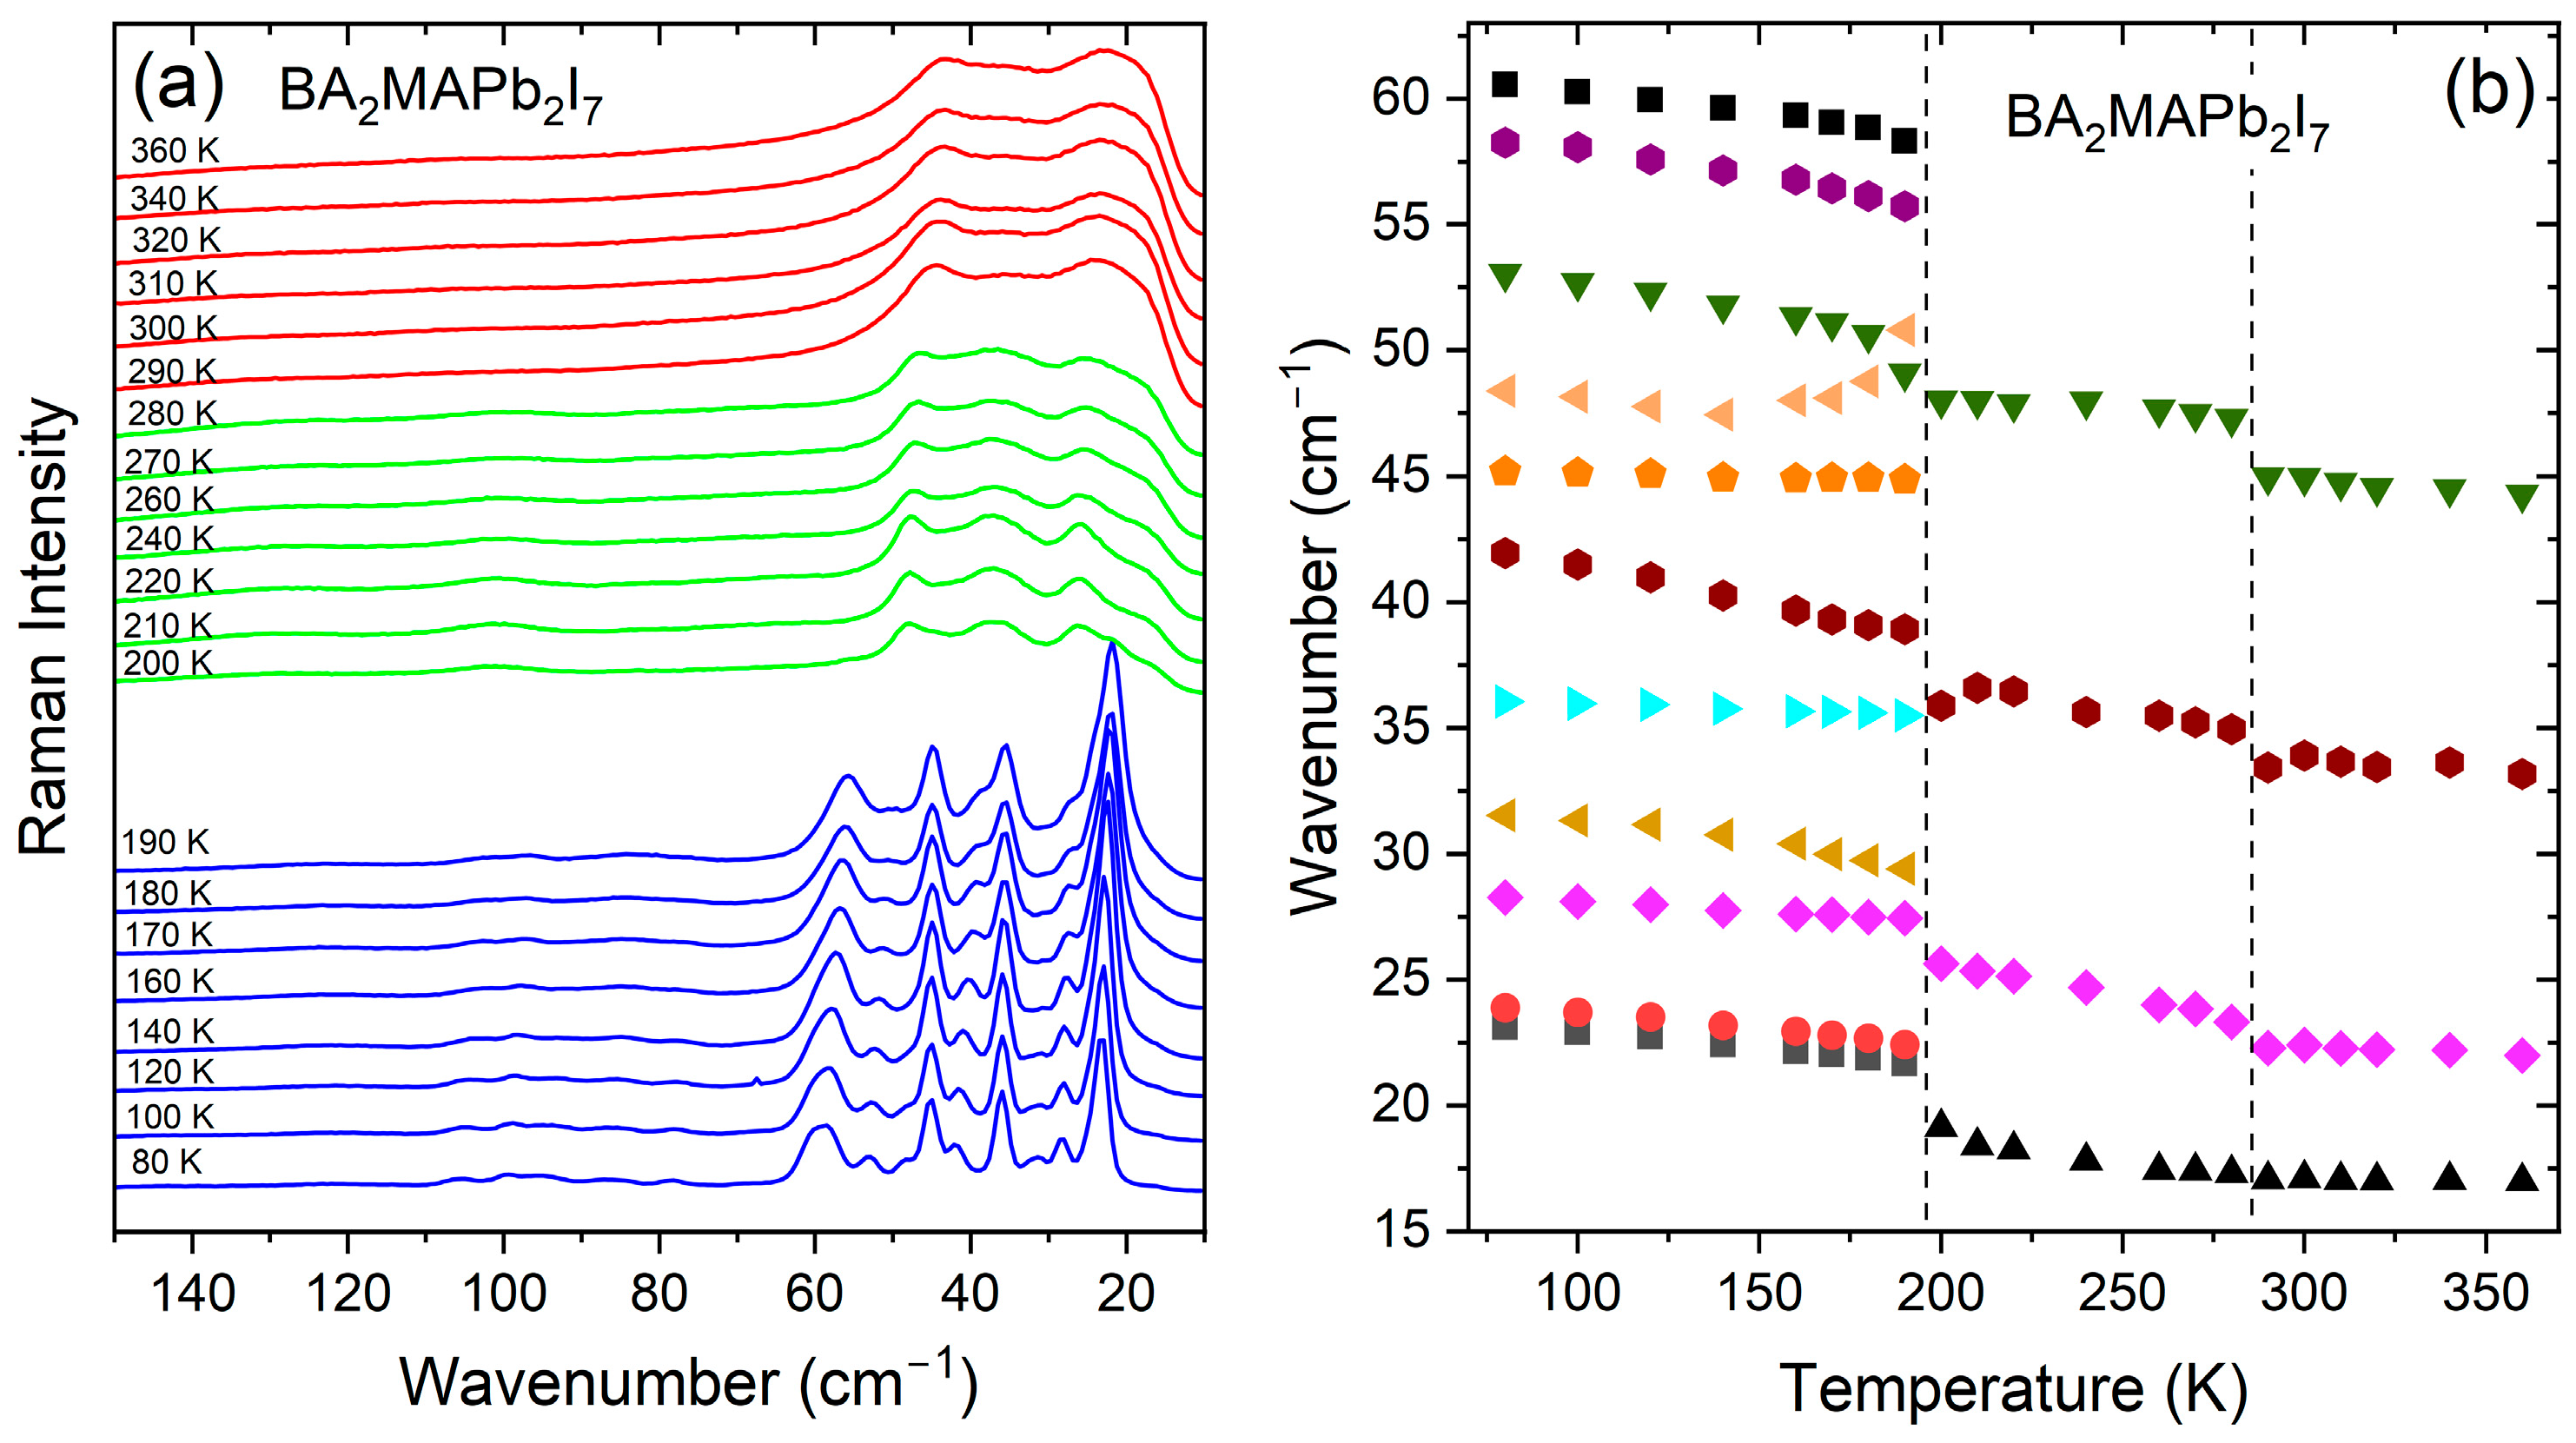
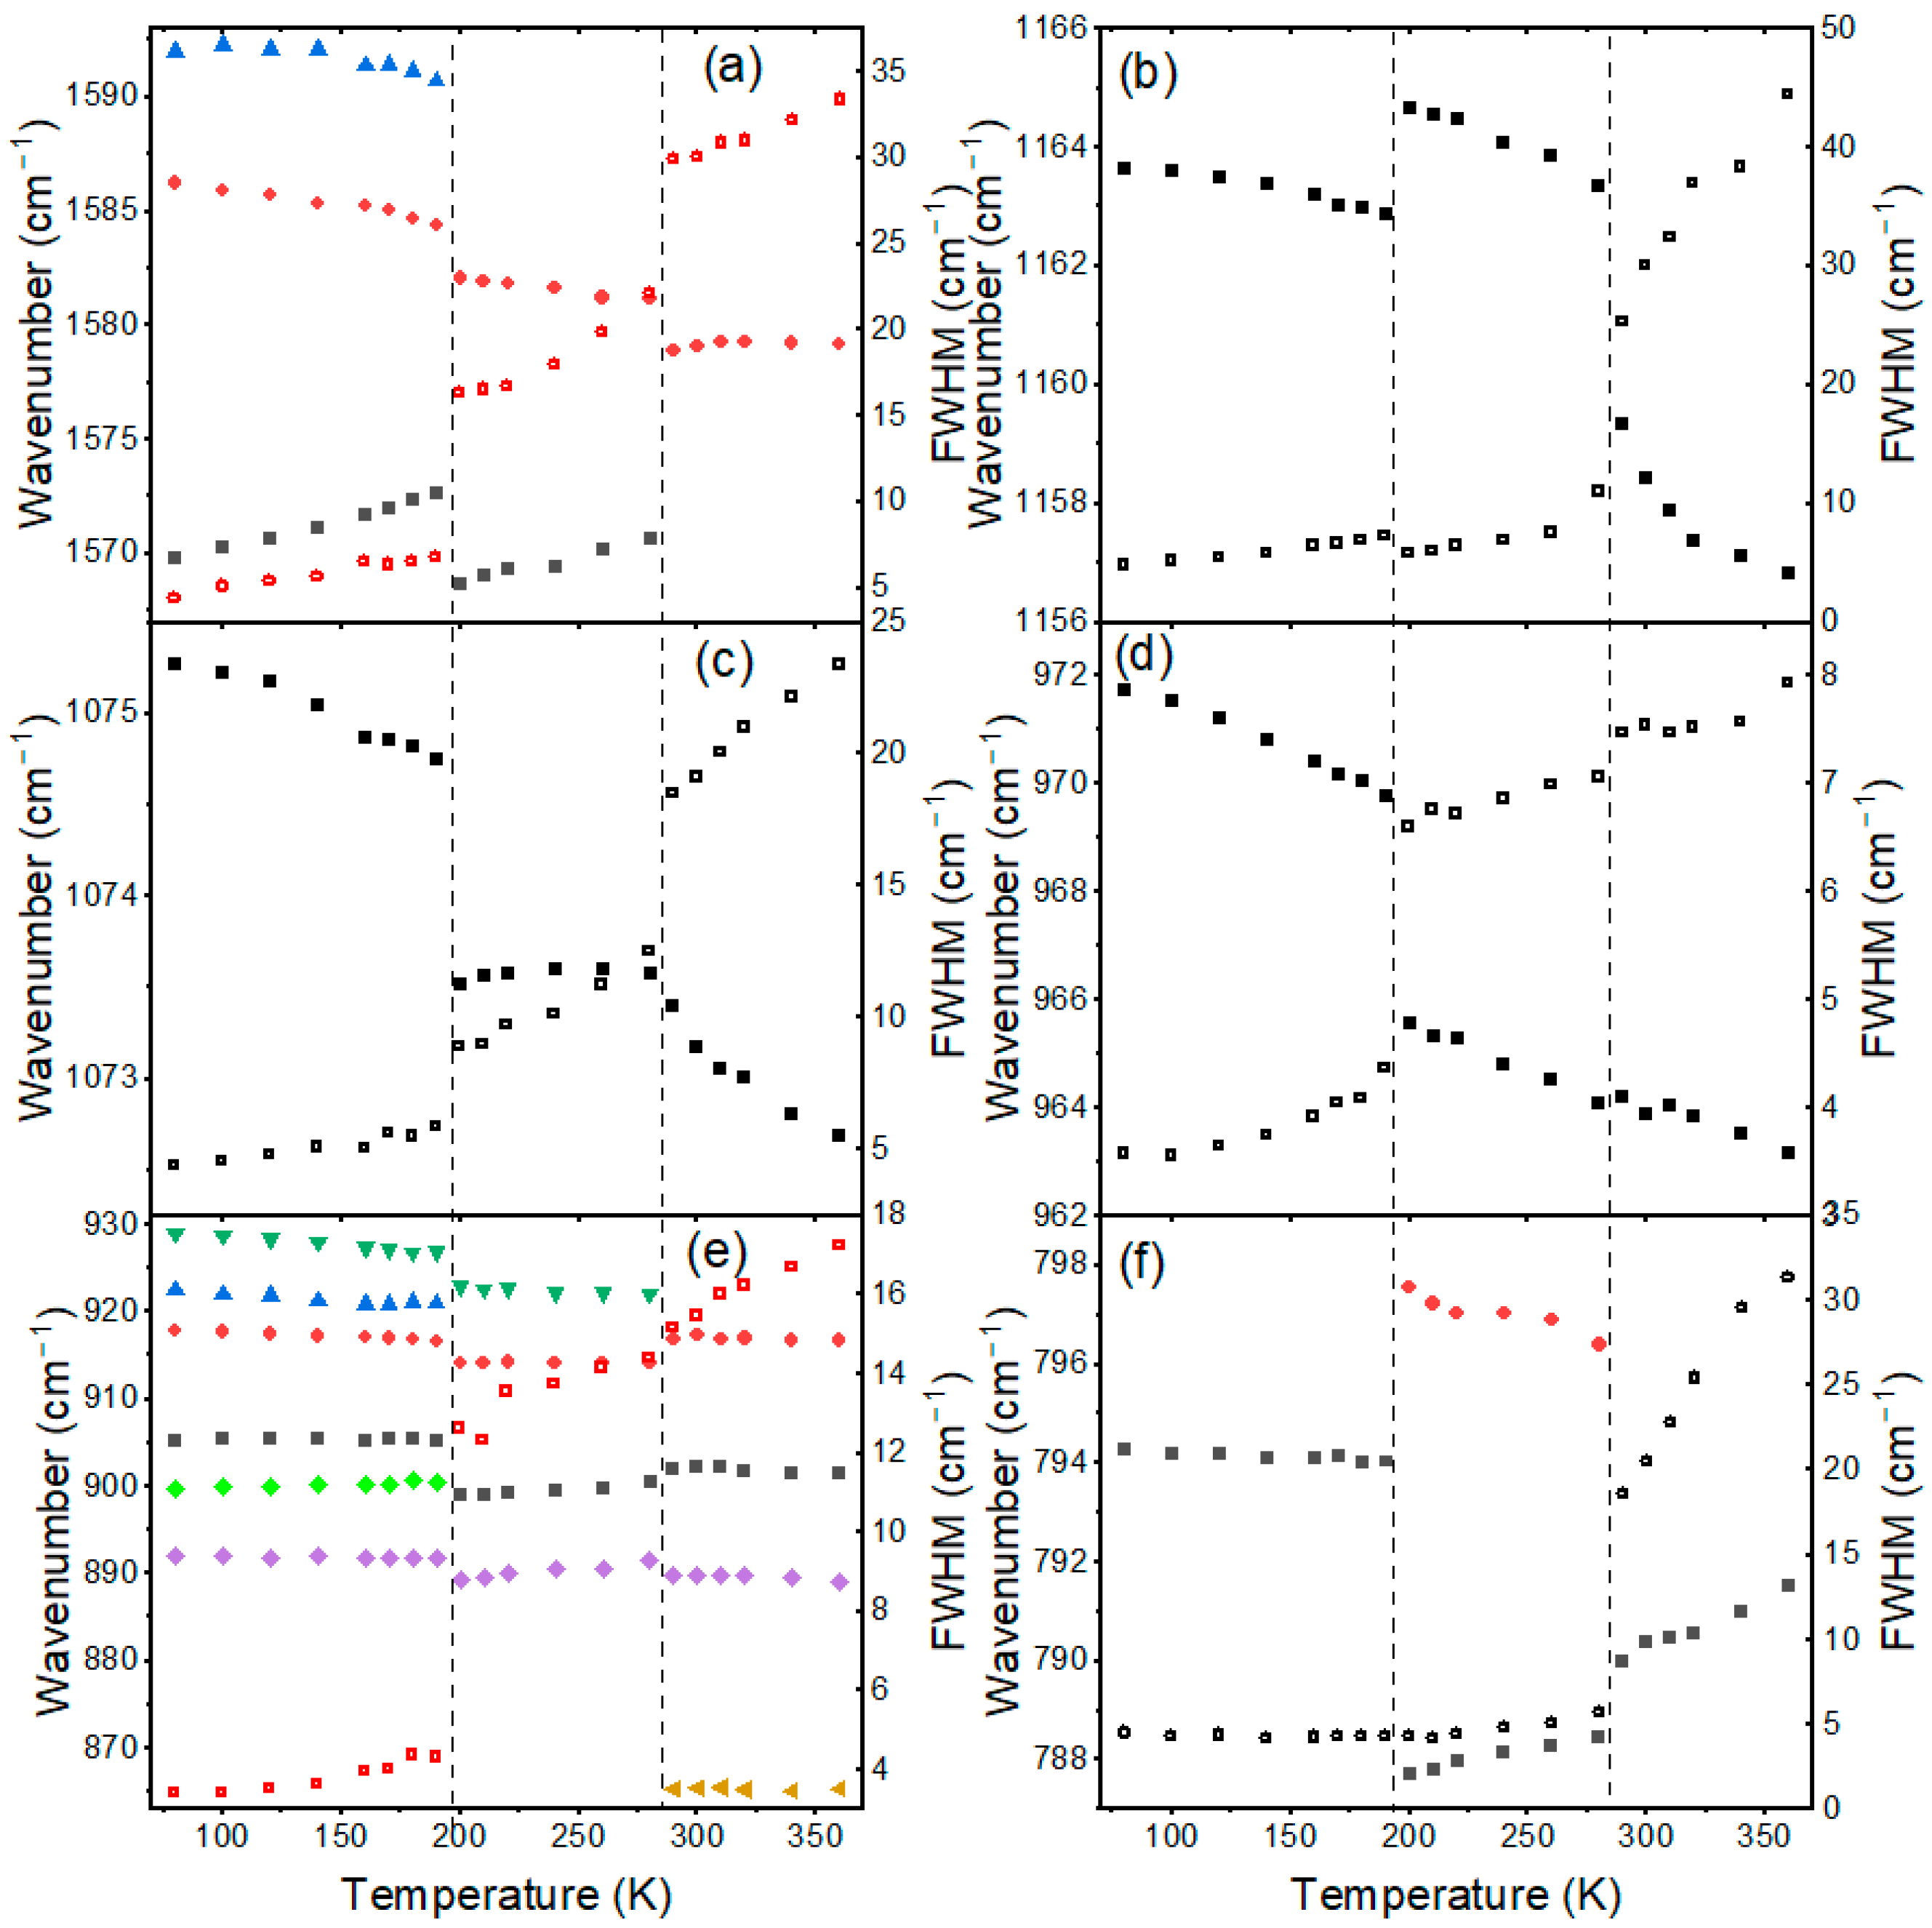
The temperature-dependent Raman spectra of a BA2MAPb2I7 single crystal are presented in Figure 2a and Figure S2, whereas plots of the wavenumbers and full width at half-maximum (FWHM) values vs. temperature are presented in Figure 2b and Figure 3. The observed modes are listed in Table S1 together with the assignment based on previous Raman scattering studies of MA-based perovskites [29,32,33,34] and compounds comprising BA+ cations [41,55,56]. All modes observed above 300 cm−1 can be attributed to internal vibrations of MA+ and BA+ cations (Table S1). The broad band at 238 cm−1 (value at 280 K) can be attributed to the MA-cage mode, i.e., the mode that involves the C–N torsion [29,34]. Interestingly, this mode was observed at a very similar wavenumber in MAPbI3 (241 cm−1 at RT [34]). This behavior shows that the separation of double octahedral layers by interlayer BA+ cations weakly affects interactions between MA+ cations and PbI6 octahedra. In the lattice modes region, we attribute the bands below 32 cm−1 to octahedra librations (or alternatively to octahedra twist), those in the 68–33 cm−1 range to Pb-I bending (or alternatively to octahedra distortion), and the remaining bands, observed in the 200–70 cm−1 range, to coupled modes involving librations and translations of MA+ and BA+ as well as Pb–I stretching modes (Table S1).
Raman spectra of the high-temperature (HT) phase in the lattice modes region are dominated by very strong and broad bands observed below 44 cm−1 (Figure 2a, Table S1). Other lattice modes are visible at 132 and 104 cm−1 as shoulders (Table S1). The very large width of the lattice bands points to a pronounced disorder of the HT phase. When the temperature decreases, clear changes can be observed at 280 K. Firstly, Raman bands exhibit weak shifts (Figure 2a and Figure 3). Secondly, the relative intensity of the Raman bands changes (Figure 2a). Thirdly, Raman bands narrow, but this narrowing is rather weak, and the number of observed Raman bands does not change (Figure 2). The observed changes in the Raman spectra indicate that the phase transition from the HT phase to the intermediate phase weakly affects the inorganic slabs, suggesting that the major contribution to the PT mechanism comes from the interlayer BA+ cations. On further cooling, abrupt narrowing and splitting of the Raman bands occur at 190 K (Figure 2). It can also be noticed that the bands exhibit a significant shift to higher wavenumbers (Figure 2b and Table S1). Raman spectra show, therefore, that the PT from the intermediate phase to the low-temperature (LT) phase near 190 K leads to abrupt freezing of molecular motions, strong distortion of the inorganic slabs, and hardening of the lattice.
To understand the impact of organic cation dynamics on the mechanism of phase transitions, we have also studied the temperature dependence of the internal modes. Figure S2 and Figure 3 show that many bands related to BA+ and MA+ cations are very broad in the HT phase, confirming the disorder of organic cations. Upon cooling, sudden changes can be observed when the temperature decreases from 290 to 280 K (Figure S2 and Figure 3). Firstly, some bands related to BA+ cations exhibit sudden narrowing. For instance, FWHM of the ρ(NH3+), νas(CC), and ρ(CH2) modes of BA+ decreases from 25.2, 18.5, and 18.6 cm−1 at 290 K to 11.0, 12.5, and 5.7 cm−1 at 280 K (Figure 3b,c,f). On the other hand, the MA-related bands do not show significant narrowing at the phase transition temperature (for instance, the ν(CN) and ρ(NH3+) + ρ(CH3) modes in Figure 3d,e; note that the apparent narrowing for the δas(NH3+) mode of MA+ seen in Figure 3a is largely due to the fact that above 290 K the band was fitted as a singlet and at 280 K as a doublet). Secondly, Raman bands exhibit weak shifts, up to 4 cm−1 for the ρ(NH3+) mode of BA+ (Figure 3 and Figure S2, Table S1). Temperature-dependent spectra of internal modes indicate, therefore, that this phase transition is triggered by the ordering of BA+ cations while the dynamics of MA+ cations are weakly affected.
Abrupt changes can also be noticed when the temperature decreases from 200 to 190 K (Figure 3 and Figure S2). First of all, sudden narrowing is observed for the MA-related bands. For instance, FWHM of the δas(NH3+), ν(CN), and ρ(NH3+) + ρ(CH3) modes of MA+ decreases from 16.3, 6.6, and 12.6 cm−1 at 200 K to 6.8, 4.3, and 4.3 cm−1 at 190 K (Figure 3a,d,e). Bands related to BA+ vibrations exhibit either negligible (for instance, the ρ(NH3+) and ρ(CH2) modes in Figure 3b,f) or much less pronounced changes in FWHM (see the νas(CC) band in Figure 3c, which narrows from 8.9 cm−1 at 200 K to 5.9 cm−1 at 190 K). Secondly, Raman bands exhibit significant shifts, usually to higher wavenumbers. This behavior is observed for both cations (Figure 3 and Figure S2, Table S1). Thirdly, many bands split into doublets (Table S1). Fourthly, Raman bands exhibit sudden changes in relative intensity (Figure S2). Changes in the Raman spectra prove that the phase transition from the intermediate phase to the LT phase is triggered by the ordering of MA+ cations, which increases hydrogen bond strength and shortens the C-N bond of MA+. The dynamics of BA+ cations do not contribute significantly to the phase transition mechanism, but distortion induced in the inorganic slabs also affects BA-framework interactions, as evidenced by significant shifts in BA-related modes. Since these modes exhibit shifts to higher values, Raman data suggest that the phase transition leads to strengthening of the hydrogen bonds formed between BA+ and Br.
It is important to compare our results with the previous crystallographic, solid-state NMR, and quasi-elastic neutron scattering data [49,51,52]. Raman data confirm conclusions derived from NMR and neutron scattering studies that the phase transition near 280 K is related to the freezing of the butyl CH3 group dynamics, while that near 190 K is due to the freezing of the rotational freedom of the MA+ cation [51,52]. Crystallographic and NMR data also suggested that the phases stable below 290 K comprise two different BA+ conformers. Raman data show the presence of two unique BA+ cations through the splitting of many BA-related bands into doublets in the LT phase but no splitting of BA+ bands in the intermediate phase. It is likely that the expected splitting is not observed in the intermediate phase since, due to its weak magnitude and broadening of bands, separate bands could not be resolved. Crystallographic data also revealed that the phase transition near 290 K leads to a decrease in symmetry from orthorhombic to triclinic and that it is triggered by tilts of BA+ cations and PbI6 octahedra without any pronounced distortion of the octahedra [49]. Interestingly, in spite of strong symmetry change and pronounced out-of-plane tilts of PbI6 octahedra, Raman spectra in the lattice modes region show weak changes and no splitting. We argue that this effect is related to both the large width of the lattice bands, the weak sensitivity of these modes to out-of-plane tilts, and the small distortion of the PbI6 units in the intermediate phase. According to the structural data, the LT phase is also triclinic, and the phase transition near 190 K leads to a pronounced increase in the octahedral distortion [49]. Our Raman spectra show drastic changes at this phase transition in the lattice modes region, i.e., large shifts and splitting of modes, which resembles changes observed in 3D MAPbBr3 and MAPbI3 at the tetragonal-to-orthorhombic phase transition at 148 K associated with freezing of MA+ motions [29,33]. This behavior points to very similar mechanisms for these LT-phase transitions in BA2MAPb2I7 and 3D analogues. We suppose that such pronounced sensitivity of Raman spectra to this phase transition, in spite of the same triclinic symmetry of both LT and intermediate phases of BA2MAPb2I7, can be attributed to the fact that this phase transition leads to strong distortion of PbI6 units and narrowing of bands due to locking of MA+ dynamics, which facilitate observation of the phase transition-induced changes in the lattice mode region. Thus, our Raman data indicate that distortion of the lead– halide octahedra has a much more pronounced effect on the lattice modes than their out-of-plane tilts or symmetry changes.
The presence of structural phase transitions should affect the optoelectronic application of BA2MAPb2I7 because they affect octahedral tilts, distortion of the framework, dielectric screening of free carriers and phonon energies, and thus electron–phonon coupling and exciton binding energy. In this respect, literature data on lead halide perovskites showed that changes in Pb-X bond lengths, tilts, and distortions of PbX6 octahedra affect the band gap and PL [5,49,50]. First of all, an increase in the octahedral tilting (decrease of the Pb-(µ-I)-Pb angles from the ideal 180°) leads to weaker interaction between Pb s orbitals and I px and py orbitals in the valence band maximum, mixing of I p and s orbitals, as well as an increase in the antibonding interaction in the conduction band maximum [50]. These effects lead to a blue shift in the band gap. On the other hand, a decrease in the equatorial Pb-I bond lengths leads to an increase in the antibonding interaction at the valence bond maximum [50]. As a result, the band gap narrows with decreasing Pb-I bond lengths. Former PL studies [50] are consistent with our Raman data and previous structural data [49] since they revealed a weak blue shift of a few nm at the HT-intermediate phase transition, where Raman data show weak changes in the lattice modes region due to weak distortion of the PbI6 octahedra, and a strong blue shift exceeding 20 nm at the intermediate-LT phase transition, where Raman data show drastic changes in the lattice modes region due to very large octahedral distortion. It is worth noting that in the case of 3D MAPbI3, the tetragonal to orthorhombic phase transition associated with the freezing of MA+ dynamics and strong distortion of the inorganic subnetwork also led to a very large blue shift of about 20 nm [57] and drastic changes in the Raman spectra in the lattice modes region [29]. This result confirms the same mechanism of the LT phase transitions in 3D and 2D analogues and a similar distortion of the inorganic subnetwork. It also shows that there is a clear correlation between changes in the lattice modes at the phase transition and the blue shift of the photoluminescence.
Regarding implications of the observed structural changes and lattice dynamics on photovoltaic properties, it is important to note that according to former studies of MAPbX3 (X = Br, I) perovskites, mobility and lifetime of charge carriers increase when the temperature decreases due to a slowing down of molecular dynamics. An especially pronounced increase by a factor of 3–6 was observed at the LT phase transition when the reorientational motions of MA+ cations were locked [58]. Studies of the photovoltaic behavior of MAPbI3 showed, however, that whereas the power conversion efficiency (PCE) was weakly affected by the cubic-tetragonal phase transition, it strongly decreased in the LT orthorhombic phase [59]. Our Raman data show that the HT-intermediate (intermediate-LT) phase transition has a weak (strong) effect on the octahedral distortion and dynamics of MA+ cations. Therefore, Ramana data show that the HT-intermediate (intermediate-LT) phase transition should weakly (strongly) affect the photovoltaic performance.

3.2. Temperature-Dependent Raman Study of BA2MA2Pb3I10

Figure 1b shows that, similarly to BA2MAPb2I7, the crystal structures of BA2MA2Pb3I10 also consist of inorganic slabs separated by BA+ cations. However, in this case, the inorganic slabs are composed of three inorganic layers.
The temperature-dependent Raman spectra of a BA2MA2Pb3I10 single crystal are presented in Figure 4a and Figure S3, whereas plots of the wavenumbers and FWHM values vs. temperature are presented in Figure 4b and Figure 5. The observed modes are listed in Table S2. The Raman spectra of the HT phase of BA2MA2Pb3I10 are very similar to the spectra of BA2MAPb2I7. In particular, in the internal mode’s region, no clear shifts of bands can be observed at 290 K between the two compounds (Figures S2–S4). Closer inspection shows, however, that the lattice modes of BA2MA2Pb3I10 shift slightly (by less than 2 cm−1) to higher wavenumbers, and the Raman bands in the lattice modes region are broader compared to BA2MAPb2I7 (Figure 2, Figure 4 and Figure S5). These changes suggest larger disorder and shorter Pb-I bonds in the HT phase of tri-layered analogue, probably due to a larger octahedral distortion.
Changes in the Raman spectra of BA2MA2Pb3I10 due to the onset of the structural phase transitions are very similar to those discussed above for BA2MAPb2I7, i.e., the HT (LT) phase transition leads to weak (strong) narrowing of the lattice modes, strong (weak) narrowing of BA-related bands, and weak (strong) narrowing of MA-related bands (Figure 4a and Figures S3–S5). Furthermore, the LT phase transition leads to the splitting of lattice modes and many internal modes into two or three components (Figure 4, Figure 5 and Figures S3–S5, Table S2). Many internal modes also exhibit significant shifts, especially at the LT phase transition (Figure 5 and Figure S3). Raman spectra indicate, therefore, that BA2MA2Pb3I10 exhibits very similar structural changes as its two-layered analogue, i.e., the HT (LT) phase transition is triggered by the freezing of BA+ (MA+) dynamics, which leads to weak (or strong) distortion of the octahedral slabs.
Let us now discuss some differences in the evolution of Raman spectra at phase transition temperatures. In the lattice modes region, the main difference in the spectra of the intermediate phases (at 280 K) can be seen in the increased or decreased intensity of the ~47 and ~23 cm−1 (~32 cm−1) bands of BA2MA2Pb3I10 (Figure 4 and Figure S5). Much larger differences are seen, however, when the compounds transform into the LT phases. In particular, many lattice modes of BA2MA2Pb3I10 are observed at lower wavenumbers compared to BA2MAPb2I7 (Figure 2, Figure 4 and Figure S5; Tables S1 and S2). This behavior suggests that the LT phase of tri-layered perovskite is less distorted than the LT phase of the two-layered analogue. In the internal modes region at 280 K, the most obvious difference is the larger wavenumber of the MA-cage mode of BA2MAPb2I7 (238 cm−1) than BA2MA2Pb3I10 (234 cm−1). Since the energy of this mode depends strongly on the size of the perovskite cage, as evidenced by the large shift of this mode to lower wavenumbers in 3D analogues when Cl is replaced by larger Br and then I [34], the shift of the MA-cage mode to lower wavenumbers for BA2MA2Pb3I10 indicates weakening of MA-cage interactions and thus longer MAI distance when going from two-layered to three-layered analogue. The same effect is also observed in the LT phases, where the MA-cage mode is observed at 240 cm−1 for BA2MAPb2I7 and 237 cm−1 for BA2MA2Pb3I10 (Tables S1 and S2). Significant differences in the MA-framework interactions are also reflected in the behavior of other MA-related bands. For instance, the δ(CN), ν(CN), and ρ(NH3+) + ρ(CH3) modes observed at 1260, 972, and 918 cm−1 for BA2MAPb2I7 shift to 1255, 970, and 923 cm−1 for BA2MA2Pb3I10. Contrary to the MA-based modes, BA-related modes’ wavenumbers do not show any significant dependence on the thickness of octahedral slabs.
It is worth adding that the shifts and broadening of the MA-related bands of BA2MAPb2I7 and BA2MA2Pb3I10 are similar to those reported for MAPbI3 [29]. For instance, during the phase transition to the LT phase, FWHM (wavenumber) of the δas(NH3+), ν(CN), and ρ(NH3+) + ρ(CH3) modes decreased (increased) by 9.5, 2.2, and 8.3 cm−1 (2.3, 4.2, and 2.5 cm−1) for BA2MAPb2I7, 16.0, 2.6, and 5.7 cm−1 (3.9, 1.7, and 6.8 cm−1) for BA2MA2Pb3I10, and about 28, 2, and 10 cm−1 (4, 2, and 5 cm−1) for MAPbI3 [29]. This result confirms that the dynamics of MA+ in the RP phases are similar to those in 3D MAPbI3 and that it freezes at low temperatures.
Although BA2MAPb2I7 and BA2MA2Pb3I10 show very similar temperature dependence in Raman spectra, charge carrier mobility near room temperature might be slightly smaller in the latter case due to more pronounced MA+ dynamics in BA2MA2Pb3I10 resulting from weaker MA-framework interactions. Weaker distortion of PbI6 octahedra at the intermediate-LT phase transition in BA2MA2Pb3I10 compared to BA2MAPb2I7 suggests that this transformation should have a weaker effect on photovoltaic and photoluminescence properties in the tri-layered analogue.

4. Conclusions

We have performed temperature-dependent Raman studies of two RP iodides comprising BA+ and MA+ cations. We proposed the assignment of Raman-active modes. The smaller width of Raman bands in the lattice region observed for the HT phase of BA2MAPb2I7 compared to BA2MA2Pb3I10 revealed that the lattice dynamics of organic cations are more restricted in the two-layered analogue. The increase in inorganic slab thickness has negligible effect on BA+ modes but affects MA-related modes, indicating that thickness affects hydrogen-bond interactions between MA+ and I.
Temperature-dependent studies revealed that in both compounds, the HT-intermediate phase transition is triggered by changes in BA+ dynamics, probably by freezing of the BA-related CH3 group reorientational motions, and this change is associated with tilts of BA+ cations without any pronounced distortion of the inorganic slabs. The intermediate-LT phase transition is triggered by the freezing of MA+ reorientational motions, which leads to pronounced distortion of the inorganic slabs. This type of structural change is very similar to that observed in 3D MAPbI3, but separation of inorganic slabs by BA+ cations leads to a significant increase in the phase transition temperatures from ~160 K for MAPbI3 to ~185–190 K for BA2MA2Pb3I10 and 195.5 K for BA2MAPb2I7. This behavior indicates that restriction of the rotational freedom of MA+ increases with decreasing thickness of the inorganic slabs. We also show that there is a clear correlation between changes in the lattice modes at the phase transitions and blue shifts in the photoluminescence. Since multilayered systems pose a significant challenge to crystal structure solutions, Raman spectroscopy provides an alternative for monitoring the degree of octahedral distortion in order to understand temperature-dependent changes in band gaps and photoluminescence. In summary, we show that vibrational spectroscopy is a very valuable tool in studies of hybrid perovskites comprising two different organic cations since it allows to obtain information on the distortion of inorganic sublattice and to monitor molecular dynamics separately for each cation, thus helping to understand the mechanism of the structural phase transitions and the effect of structural changes on the optoelectronic properties of these compounds.

Supplementary Materials

The following are available online at https://www.mdpi.com/article/10.3390/ma17112503/s1. Table S1: Raman wavenumbers for BA2MAPb2I7 at 360, 280, and 80 K. Table S2: Raman wavenumbers for BA2MA2Pb3I10 at 320, 280, and 80 K. Figure S1: Experimental and simulated powder X-ray diffraction patterns of BA2MAPb2I7 and BA2MA2Pb3I10. Figure S2: Temperature-dependent Raman spectra of BA2MAPb2I7 in the 1700–100 cm−1 range. Figure S3: Temperature-dependent Raman spectra of BA2MA2Pb3I10 in the 1640–200 cm−1 range. Figure S4: Comparison of Raman spectra of BA2MAPb2I7 and BA2MA2Pb3I10 corresponding to three phases at 290, 280, and 80 K in the internal modes region. Figure S5: Comparison of Raman spectra of BA2MAPb2I7 and BA2MA2Pb3I10 corresponding to three phases at 290, 280, and 80 K in the lattice modes region.

Author Contributions

Conceptualization, M.M.; Methodology, M.M.; Validation, M.M. and M.P.; Formal analysis, S.S. and M.P.; Investigation, S.S. and M.P.; Resources, M.M.; Data curation, M.M., S.S. and M.P.; Writing—original draft, M.M., S.S. and M.P.; Writing—review & editing, M.M., S.S. and M.P.; Visualization, S.S.; Supervision, M.M.; Project administration, M.M.; Funding acquisition, M.M. All authors have read and agreed to the published version of the manuscript.

Funding

This research received funding from the National Science Center (Narodowe Centrum Nauki) in Poland under project No. 2020/38/A/ST3/00214.

Institutional Review Board Statement

Not applicable.

Informed Consent Statement

Not applicable.

Data Availability Statement

The data presented in this study are available at: https://doi.org/10.5281/zenodo.11147550.

Conflicts of Interest

The authors declare no conflicts of interest.

References

  1. Tu, Y.; Wu, J.; Xu, G.; Yang, X.; Cai, R.; Gong, Q.; Zhu, R.; Huang, W. Perovskite Solar Cells for Space Applications: Progress and Challenges. Adv. Mater. 2021, 33, 2006545. [Google Scholar] [CrossRef]
  2. Yang, T.; Gao, L.; Lu, J.; Ma, C.; Du, Y.; Wang, P.; Ding, Z.; Wang, S.; Xu, P.; Liu, D.; et al. One-stone-for-two-birds strategy to attain beyond 25% perovskite solar cells. Nat. Commun. 2023, 14, 839. [Google Scholar] [CrossRef] [PubMed]
  3. Oku, T. Crystal Structures of Perovskite Halide Compounds Used for Solar Cells. Rev. Adv. Mater. Sci. 2020, 59, 264–305. [Google Scholar] [CrossRef]
  4. Stoumpos, C.C.; Malliakas, C.D.; Kanatzidis, M.G. Semiconducting Tin and Lead Iodide Perovskites with Organic Cations: Phase Transitions, High Mobilities, and near-Infrared Photoluminescent Properties. Inorg. Chem. 2013, 52, 9019–9038. [Google Scholar] [CrossRef] [PubMed]
  5. Mączka, M.M.; Ptak, M.; Gągor, A.; Stefańska, D.; Zaręba, J.K.; Sieradzki, A. Methylhydrazinium Lead Bromide: Noncentrosymmetric Three-Dimensional Perovskite with Exceptionally Large Framework Distortion and Green Photoluminescence. Chem. Mater. 2020, 32, 1667–1673. [Google Scholar] [CrossRef]
  6. Maçzka, M.; Gagor, A.; Zareba, J.K.; Stefanska, D.; Drozd, M.; Balciunas, S.; Šimenas, M.; Banys, J.; Sieradzki, A.; Ma̧czka, M.; et al. Three-Dimensional Perovskite Methylhydrazinium Lead Chloride with Two Polar Phases and Unusual Second-Harmonic Generation Bistability above Room Temperature. Chem. Mater. 2020, 32, 4072–4082. [Google Scholar] [CrossRef]
  7. Drozdowski, D.; Gągor, A.; Stefańska, D.; Zarȩba, J.K.; Fedoruk, K.; Mączka, M.; Sieradzki, A. Three-Dimensional Methylhydrazinium Lead Halide Perovskites: Structural Changes and Effects on Dielectric, Linear, and Nonlinear Optical Properties Entailed by the Halide Tuning. J. Phys. Chem. C 2022, 126, 1600–1610. [Google Scholar] [CrossRef]
  8. Petrosova, H.R.; Kucheriv, O.I.; Shova, S.; Gural’skiy, I.A. Aziridinium Cation Templating 3D Lead Halide Hybrid Perovskites. Chem. Commun. 2022, 58, 5745–5748. [Google Scholar] [CrossRef]
  9. Maczka, M.; Ptak, M.; Gagor, A.; Zareba, J.; Liang, X.; Balciunas, S.; Semenikhin, A.A.; Kucheriv, O.I.; Gural’skiy, I.A.; Shova, S.; et al. Phase Transitions, Dielectric Response, and Nonlinear Optical Properties of Aziridinium Lead Halide Perovskites. Chem. Mater. 2023, 35, 9725–9738. [Google Scholar] [CrossRef]
  10. Simenas, M.; Balciunas, S.; Wilson, J.N.; Svirskas, S.; Kinka, M.; Garbaras, A.; Kalendra, V.; Gagor, A.; Szewczyk, D.; Sieradzki, A.; et al. Suppression of Phase Transitions and Glass Phase Signatures in Mixed Cation Halide Perovskites. Nat. Commun. 2020, 11, 5103. [Google Scholar] [CrossRef]
  11. Simenas, M.; Gagor, A.; Banys, J.; Maczka, M. Phase Transitions and Dynamics in Mixed Three- and Low-Dimensional Lead Halide Perovskites. Chem. Rev. 2024, 124, 2281–2326. [Google Scholar] [CrossRef] [PubMed]
  12. Han, Y.; Cui, B.B. Low-dimensional metal halide perovskite materials: Structure strategies and luminescence applications. Adv. Sci. 2021, 8, 2004805. [Google Scholar] [CrossRef] [PubMed]
  13. Maczka, M.; Drozdowski, D.; Stefańska, D.; Gagor, A. Zero-dimensional mixed-cation hybrid lead halides with broadband emissions. Inorg. Chem. Front. 2023, 10, 7222–7230. [Google Scholar] [CrossRef]
  14. Li, X.; Hoffman, J.M.; Kanatzidis, M.G. The 2D Halide Perovskite Rulebook: How the Spacer Influences Everything from the Structure to Optoelectronic Device Efficiency. Chem. Rev. 2021, 121, 2230–2291. [Google Scholar] [CrossRef] [PubMed]
  15. Mączka, M.; Zarȩba, J.K.; Gągor, A.; Stefańska, D.; Ptak, M.; Roleder, K.; Kajewski, D.; Soszyński, A.; Fedoruk, K.; Sieradzki, A. [Methylhydrazinium]2PbBr4, a ferroelectric hybrid organic-inorganic perovskite with multiple nonlinear optical outputs. Chem. Mater. 2021, 33, 2331–2342. [Google Scholar] [CrossRef]
  16. Li, W.; Wang, Z.; Deschler, F.; Gao, S.; Friend, R.H.; Cheetham, A.K. Chemically Diverse and Multifunctional Hybrid Organic–Inorganic Perovskites. Nat. Rev. Mater. 2017, 2, 16099. [Google Scholar] [CrossRef]
  17. Han, X.; Zheng, Y.; Chai, S.; Chen, S.; Xu, J. 2D organic-inorganic hybrid perovskite materials for nonlinear optics. Nanophotonics 2020, 9, 1787–1810. [Google Scholar] [CrossRef]
  18. Smith, M.D.; Connor, B.A.; Karunadasa, H.I. Tuning the Luminescence of Layered Halide Perovskites. Chem. Rev. 2019, 119, 3104–3139. [Google Scholar] [CrossRef]
  19. Chao, L.; Wang, Z.; Xia, Y.; Chen, Y.; Huang, W. Recent progress on low dimensional perovskite solar cells. J. Energy Chem. 2018, 27, 1091–1100. [Google Scholar] [CrossRef]
  20. Siwach, P.; Sikarwar, P.; Halpati, J.S.; Chandiran, K. Design of above-room-temperature ferroelectric two-dimensional layered halide perovskites. J. Mater. Chem. A 2022, 10, 8719–8738. [Google Scholar] [CrossRef]
  21. Niu, T.; Xue, Q.; Yip, H.Y. Advances in Dion-Jacobson phase two-dimensional metal halide perovskite solar cells. Nanophotonics 2021, 10, 2069–2102. [Google Scholar] [CrossRef]
  22. Huang, Y.; Li, Y.; Lim, E.L.; Kong, T.; Zhang, Y.; Song, J.; Hagfeldt, A.; Bi, D. Stable Layered Perovskite Solar Cells with an Efficiency over 19% via Multifunctional Interfacial Engineering. J. Am. Chem. Soc. 2021, 143, 3911–3917. [Google Scholar] [CrossRef] [PubMed]
  23. Zhao, D.; Hu, H.; Haselsberger, H.; Marcus, R.A.; Michel-Beyerle, M.E.; Lam, Y.M.; Zhu, J.X.; La-o-Vorakiat, C.; Beard, M.C.; Chia, E.E.M. Monitoring electron-phonon interactions in lead halide perovskites using time-resolved THz spectroscopy. ACS Nano 2019, 13, 8826–8835. [Google Scholar] [CrossRef] [PubMed]
  24. Schilcher, M.J.; Robinson, P.J.; Abramovitch, D.J.; Tan, L.Z.; Rappe, A.M.; Reichman, D.R.; Egger, D.A. The Significance of Polarons and Dynamic Disorder in Halide Perovskites. ACS Energy Lett. 2021, 6, 2162–2173. [Google Scholar] [CrossRef]
  25. Herz, L.M. How Lattice Dynamics Moderate the Electronic Properties of Metal-Halide Perovskites. J. Phys. Chem. Lett. 2018, 9, 6853–6863. [Google Scholar] [CrossRef] [PubMed]
  26. Han, S.; Liu, X.; Liu, Y.; Xu, Z.; Li, Y.; Hong, M.; Luo, J.; Sun, Z. High-Temperature Antiferroelectric of Lead Iodide Hybrid Perovskites. J. Am. Chem. Soc. 2019, 141, 12470–12474. [Google Scholar] [CrossRef] [PubMed]
  27. Paillard, C.; Bai, X.; Infante, I.C.; Guennou, M.; Geneste, G.; Alexe, M.; Kreisel, J.; Dkhil, B. Photovoltaics with Ferroelectrics: Current Status and Beyond. Adv. Mater. 2016, 28, 5153–5168. [Google Scholar] [CrossRef] [PubMed]
  28. Ptak, M.; Sieradzki, A.; Simenas, M.; Maczka, M. Molecular spectroscopy of hybrid organic-inorganic perovskites and related compounds. Coord. Chem. Rev. 2021, 448, 214180. [Google Scholar] [CrossRef]
  29. Nakada, K.; Matsumoto, Y.; Shimoi, Y.; Yamada, K.; Furukawa, Y. Temperature-Dependent Evolution of Raman Spectra of Methylammonium Lead Halide Perovskites, CH3NH3PbX3 (X=I, Br). Molecules 2019, 24, 626. [Google Scholar] [CrossRef]
  30. Ibaceta-Jaña, J.; Muydinov, R.; Rosado, P.; Mirhosseini, H.; Chugh, M.; Nazarenko, O.; Dirin, D.N.; Heinrich, D.; Wagner, M.R.; Kühne, T.D.; et al. Vibrational Dynamics in Lead Halide Hybrid Perovskites Investigated by Raman Spectroscopy. Phys. Chem. Chem. Phys. 2020, 22, 5604–5614. [Google Scholar] [CrossRef]
  31. Ruan, S.; McMeekin, D.P.; Fan, R.; Webster, N.A.S.; Ebendorff-Heidepriem, H.; Cheng, Y.B.; Lu, J.; Ruan, Y.; McNeill, C.R. Raman Spectroscopy of Formamidinium-Based Lead Halide Perovskite Single Crystals. J. Phys. Chem. C 2020, 124, 2265–2272. [Google Scholar] [CrossRef]
  32. Leguy, A.M.A.; Goñi, A.R.; Frost, J.M.; Skelton, J.; Brivio, F.; Rodríguez-Martínez, X.; Weber, O.J.; Pallipurath, A.; Alonso, M.I.; Campoy-Quiles, M.; et al. Dynamic Disorder, Phonon Lifetimes, and the Assignment of Modes to the Vibrational Spectra of Methylammonium Lead Halide Perovskites. Phys. Chem. Chem. Phys. 2016, 18, 27051–27066. [Google Scholar] [CrossRef] [PubMed]
  33. Mączka, M.; Ptak, M. Temperature-Dependent Raman Studies of FAPbBr3 and MAPbBr3 Perovskites: Effect of Phase Transitions on Molecular Dynamics and Lattice Distortion. Solids 2022, 3, 111–121. [Google Scholar] [CrossRef]
  34. Mączka, M.; Zienkiewicz, J.A.; Ptak, M. Comparative Studies of Phonon Properties of Three-Dimensional Hybrid Organic—Inorganic Perovskites Comprising Methylhydrazinium, Methylammonium, and Formamidinium Cations. J. Phys. Chem. C 2022, 126, 4048–4056. [Google Scholar] [CrossRef]
  35. Mączka, M.; Ptak, M. Lattice Dynamics and Structural Phase Transitions in Two-Dimensional Ferroelectric Methylhydrazinium Lead Bromide Investigated Using Raman and IR spectroscopy. J. Phys. Chem. C 2022, 126, 7991–7998. [Google Scholar] [CrossRef]
  36. Spirito, D.; Asensio, Y.; Hueso, L.E.; Martin-Garcia, B. Raman spectroscopy in layered hybrid organic-inorganic metal halide perovskites. J. Phys. Mater. 2022, 5, 034004. [Google Scholar] [CrossRef]
  37. Fu, Y.; Hautzinger, M.P.; Luo, Z.; Wang, F.; Pan, D.; Aristov, M.M.; Guzei, I.A.; Pan, A.; Zhu, X.; Jin, S. Incorporating Large A Cations into Lead Iodide Perovskite Cages: Relaxed Goldschidt Tolerance Factor and Impact on Exciton-Phonon Interaction. ACS Cent. Sci. 2019, 5, 1377–1386. [Google Scholar] [CrossRef]
  38. Li, H.; Qin, Y.; Shan, B.; Shen, Y.; Ersan, F.; Soignard, E.; Ataca, C.; Tongay, S. Unusual Pressure-Driven Phase Transformation and Band Renormalization in 2D vdW Hybrid Lead Halide Perovskites. Adv. Mater. 2020, 32, 1907364. [Google Scholar] [CrossRef] [PubMed]
  39. Guo, S.; Zhao, Y.; Bu, K.; Fu, Y.; Luo, H.; Chen, M.; Hautzinger, M.P.; Wang, Y.; Jin, S.; Yang, W.; et al. Pressure-Suppressed Carrier Trapping Leads to Enhanced Emission in Tow-Dimensional Perovskite (HA)2(GA)Pb2I7. Angew. Chem. Int. Ed. 2020, 59, 17533–17539. [Google Scholar] [CrossRef]
  40. Li, X.; Fu, Y.; Pedesseau, L.; Guo, P.; Cuthriell, S.; Hadar, I.; Even, J.; Katan, C.; Stoumpos, C.C.; Schaller, R.D.; et al. Negative Pressure Engineering with Large Cage Cations in 2D Halide Perovskites Causes Lattice Softening. J. Am. Chem. Soc. 2020, 142, 11486–11496. [Google Scholar] [CrossRef]
  41. Liang, M.; Lin, W.; Lan, Z.; Meng, J.; Zhao, Q.; Zou, X.; Castelli, I.E.; Pullerits, T.; Canton, S.E.; Zheng, K. Electronic Structure and Trap States of Two-Dimensional Ruddlesden–Popper Perovskites with the Relaxed Goldschmidt Tolerance Factor. ACS Appl. Electron. Mater. 2020, 2, 1402–1412. [Google Scholar] [CrossRef]
  42. Dahod, N.S.; France-Lanord, A.; Paritmongkol, W.; Grossman, J.C.; Tisdale, W.A. Low-frequency Raman spectrum of 2D layered perovskites: Local atomistic motion or superlattice modes? J. Chem. Phys. 2020, 153, 0044710. [Google Scholar] [CrossRef] [PubMed]
  43. Yin, T.; Yan, H.; Abdelwahab, I.; Lekina, Y.; Lü, X.; Yang, W.; Sun, H.; Leng, K.; Cai, Y.; Zhen, Z.X.; et al. Pressure driven rotational isomerism in 2D hybrid perovskites. Nat. Commun. 2023, 14, 411. [Google Scholar] [CrossRef]
  44. Stoumpos, C.C.; Cao, D.H.; Clark, D.J.; Young, J.; Rondinelli, J.M.; Jang, J.I.; Hupp, J.T.; Kanatzidis, M.G. Ruddlesden-Popper Hybrid Lead Iodide perovskite 2D Homologous Semiconductors. Chem. Mater. 2016, 28, 2852–2867. [Google Scholar] [CrossRef]
  45. Stoumpos, C.C.; Soe, C.M.M.; Tsai, H.; Nie, W.; Blancon, J.C.; Cao, D.H.; Liu, F.; Traore, B.; Katan, C.; Even, J.; et al. High Members of the 2D Ruddlesden-Popper Halide perovskites: Synthesis, Optical Properties, and Solar Cells of (CH3(CH2)3NH3)2(CH3NH3)4Pb5I16. Chem 2017, 2, 427–440. [Google Scholar] [CrossRef]
  46. Dang, Y.; Wei, J.; Liu, X.; Wang, X.; Xu, K.; Lei, M.; Hu, W.; Tao, X. Layered hybrid perovskite solar cells based on single-crystalline precursor solutions with superior reproducibility. Sustain. Energy Fuels 2018, 2, 2237–2243. [Google Scholar] [CrossRef]
  47. Saouma, F.O.; Stoumpos, C.C.; Wong, J.; Kanatzidis, M.G.; Jang, J.I. Selective enhancement of optical nonlinearity in two-dimensional organic-inorganic lead iodide perovskites. Nat. Commun. 2017, 8, 742. [Google Scholar] [CrossRef] [PubMed]
  48. Gelvez-Rueda, M.C.; Hutter, E.M.; Cao, D.H.; Renaud, N.; Stoumpos, C.C.; Hupp, J.T.; Savenije, T.J.; Kanatzidis, M.G.; Grozema, F.C. Interconversion between Free Charges and Bound Excitons in 2D Hybrid Lead Halide Perovskites. J. Phys. Chem. C 2017, 121, 26566–26574. [Google Scholar] [CrossRef] [PubMed]
  49. Cortecchia, D.; Neutzner, S.; Yin, J.; Salim, T.; Kandada, A.R.S.; Bruno, A.; Lam, Y.M.; Marti-Rujas, J.; Petrozza, A.; Soci, C. Structure-controlled optical thermoresponse in Ruddlesden-Popper layered perovskites. APL Mater. 2018, 6, 114207. [Google Scholar] [CrossRef]
  50. Paritmongkol, W.; Dahod, N.S.; Stollmann, A.; Mao, N.; Settens, C.; Zheng, S.L.; Tisdale, W.A. Synthetic Variation and Strcutural Trends in Layered Two-Dimensional Alkylammonium Lead Halide Perovskites. Chem. Mater. 2019, 31, 5592–5607. [Google Scholar] [CrossRef]
  51. Lyu, F.; Zheng, X.; Li, Z.; Chen, Z.; Shi, R.; Wang, Z.; Liu, H.; Lin, B.L. Spatiodynamics, Photodynamics, and Their Correlation in Hybrid Perovskites. Chem. Mater. 2021, 33, 3524–3533. [Google Scholar] [CrossRef]
  52. Koegel, A.A.; Oswald, I.W.H.; Rivera, C.; Miller, S.L.; Fallon, M.J.; Prisk, T.R.; Brown, C.M.; Neilson, J.R. Influence of Inorganic Layer Thickness on Methylammonium Dynamics in Hybrid Perovskite Derivatives. Chem. Mater. 2022, 34, 8316–8323. [Google Scholar] [CrossRef]
  53. Simenas, M.; Balciunas, S.; Gagor, A.; Pieniazek, A.; Tolborg, K.; Kinka, M.; Klimavicius, V.; Svirskas, S.; Kalendra, V.; Ptak, M.; et al. Mixology of MA1−xEAxPbI3 Hybrid Perovskites: Phase Transitions, Cation Dynamics, and Photoluminescence. Chem. Mater. 2022, 34, 10104–10112. [Google Scholar] [CrossRef] [PubMed]
  54. Maczka, M.; Ptak, M.; Fedoruk, K.; Stefanska, D.; Gagor, A.; Zareba, J.K.; Sieradzki, A. The lattice symmetrization worked, but with a plot twist: Effects of methylhydrazinium doping of MAPbI3 on phase transitions, cation dynamics and photoluminescence. J. Mater. Chem. C 2024, 12, 1396–1405. [Google Scholar] [CrossRef]
  55. Jeghnou, H.; Ouasri, A.; Rhandour, A.; Dhamelincourt, M.C.; Dhamelincourt, P.; Mazzah, A. Structural Phase Transition in (n-C4H9NH3)2SiF6: DSC and Raman Studies. J. Raman Spectrosc. 2003, 34, 126–130. [Google Scholar] [CrossRef]
  56. Jalbout, A.F.; Ouasri, A.; Jeghnou, H.; Rhandour, A. Experimental and Theoretical Studies of Monoalkylammonium Hexafluorosilicate [CH3(CH2)nNH3]2SiF6 (n = 2,3) and Ethylammonium Hexafluorosilicate [(C2H5)2NH2]2SiF6. Vib. Spectrosc. 2007, 44, 94–100. [Google Scholar] [CrossRef]
  57. Wright, A.; Verdi, C.; Milot, R.L.; Eperon, G.E.; Perez-Osorio, M.A.; Snaith, H.J.; Giustio, F.; Johnson, M.B.; Herz, L.M. Electron-Phonon Coupling in Hybrid Lead Halide Perovskites. Nat. Commun. 2016, 7, 11755. [Google Scholar] [CrossRef] [PubMed]
  58. Gelvez-Rueda, M.C.; Cao, D.H.; Patwardhan, S.; Renaud, N.; Stoumpos, C.C.; Schatz, G.C.; Hupp, J.T.; Farha, O.K.; Savenije, T.J.; Kanatzidis, M.G.; et al. Effect of Cation Rotation on Charge Dynamics in Hybrid Lead Halide Perovskites. J. Phys. Chem. C 2016, 120, 16577–16585. [Google Scholar] [CrossRef]
  59. Zhang, H.; Qiao, X.; Shen, Y.; Moehl, T.; Zakeeruddin, S.M.; Grätzel, M.; Wang, M. Photovoltaic behaviour of lead methylammonium triiodide perovskite solar cells down to 80 K. J. Mater. Chem. A 2015, 3, 11762–11767. [Google Scholar] [CrossRef]
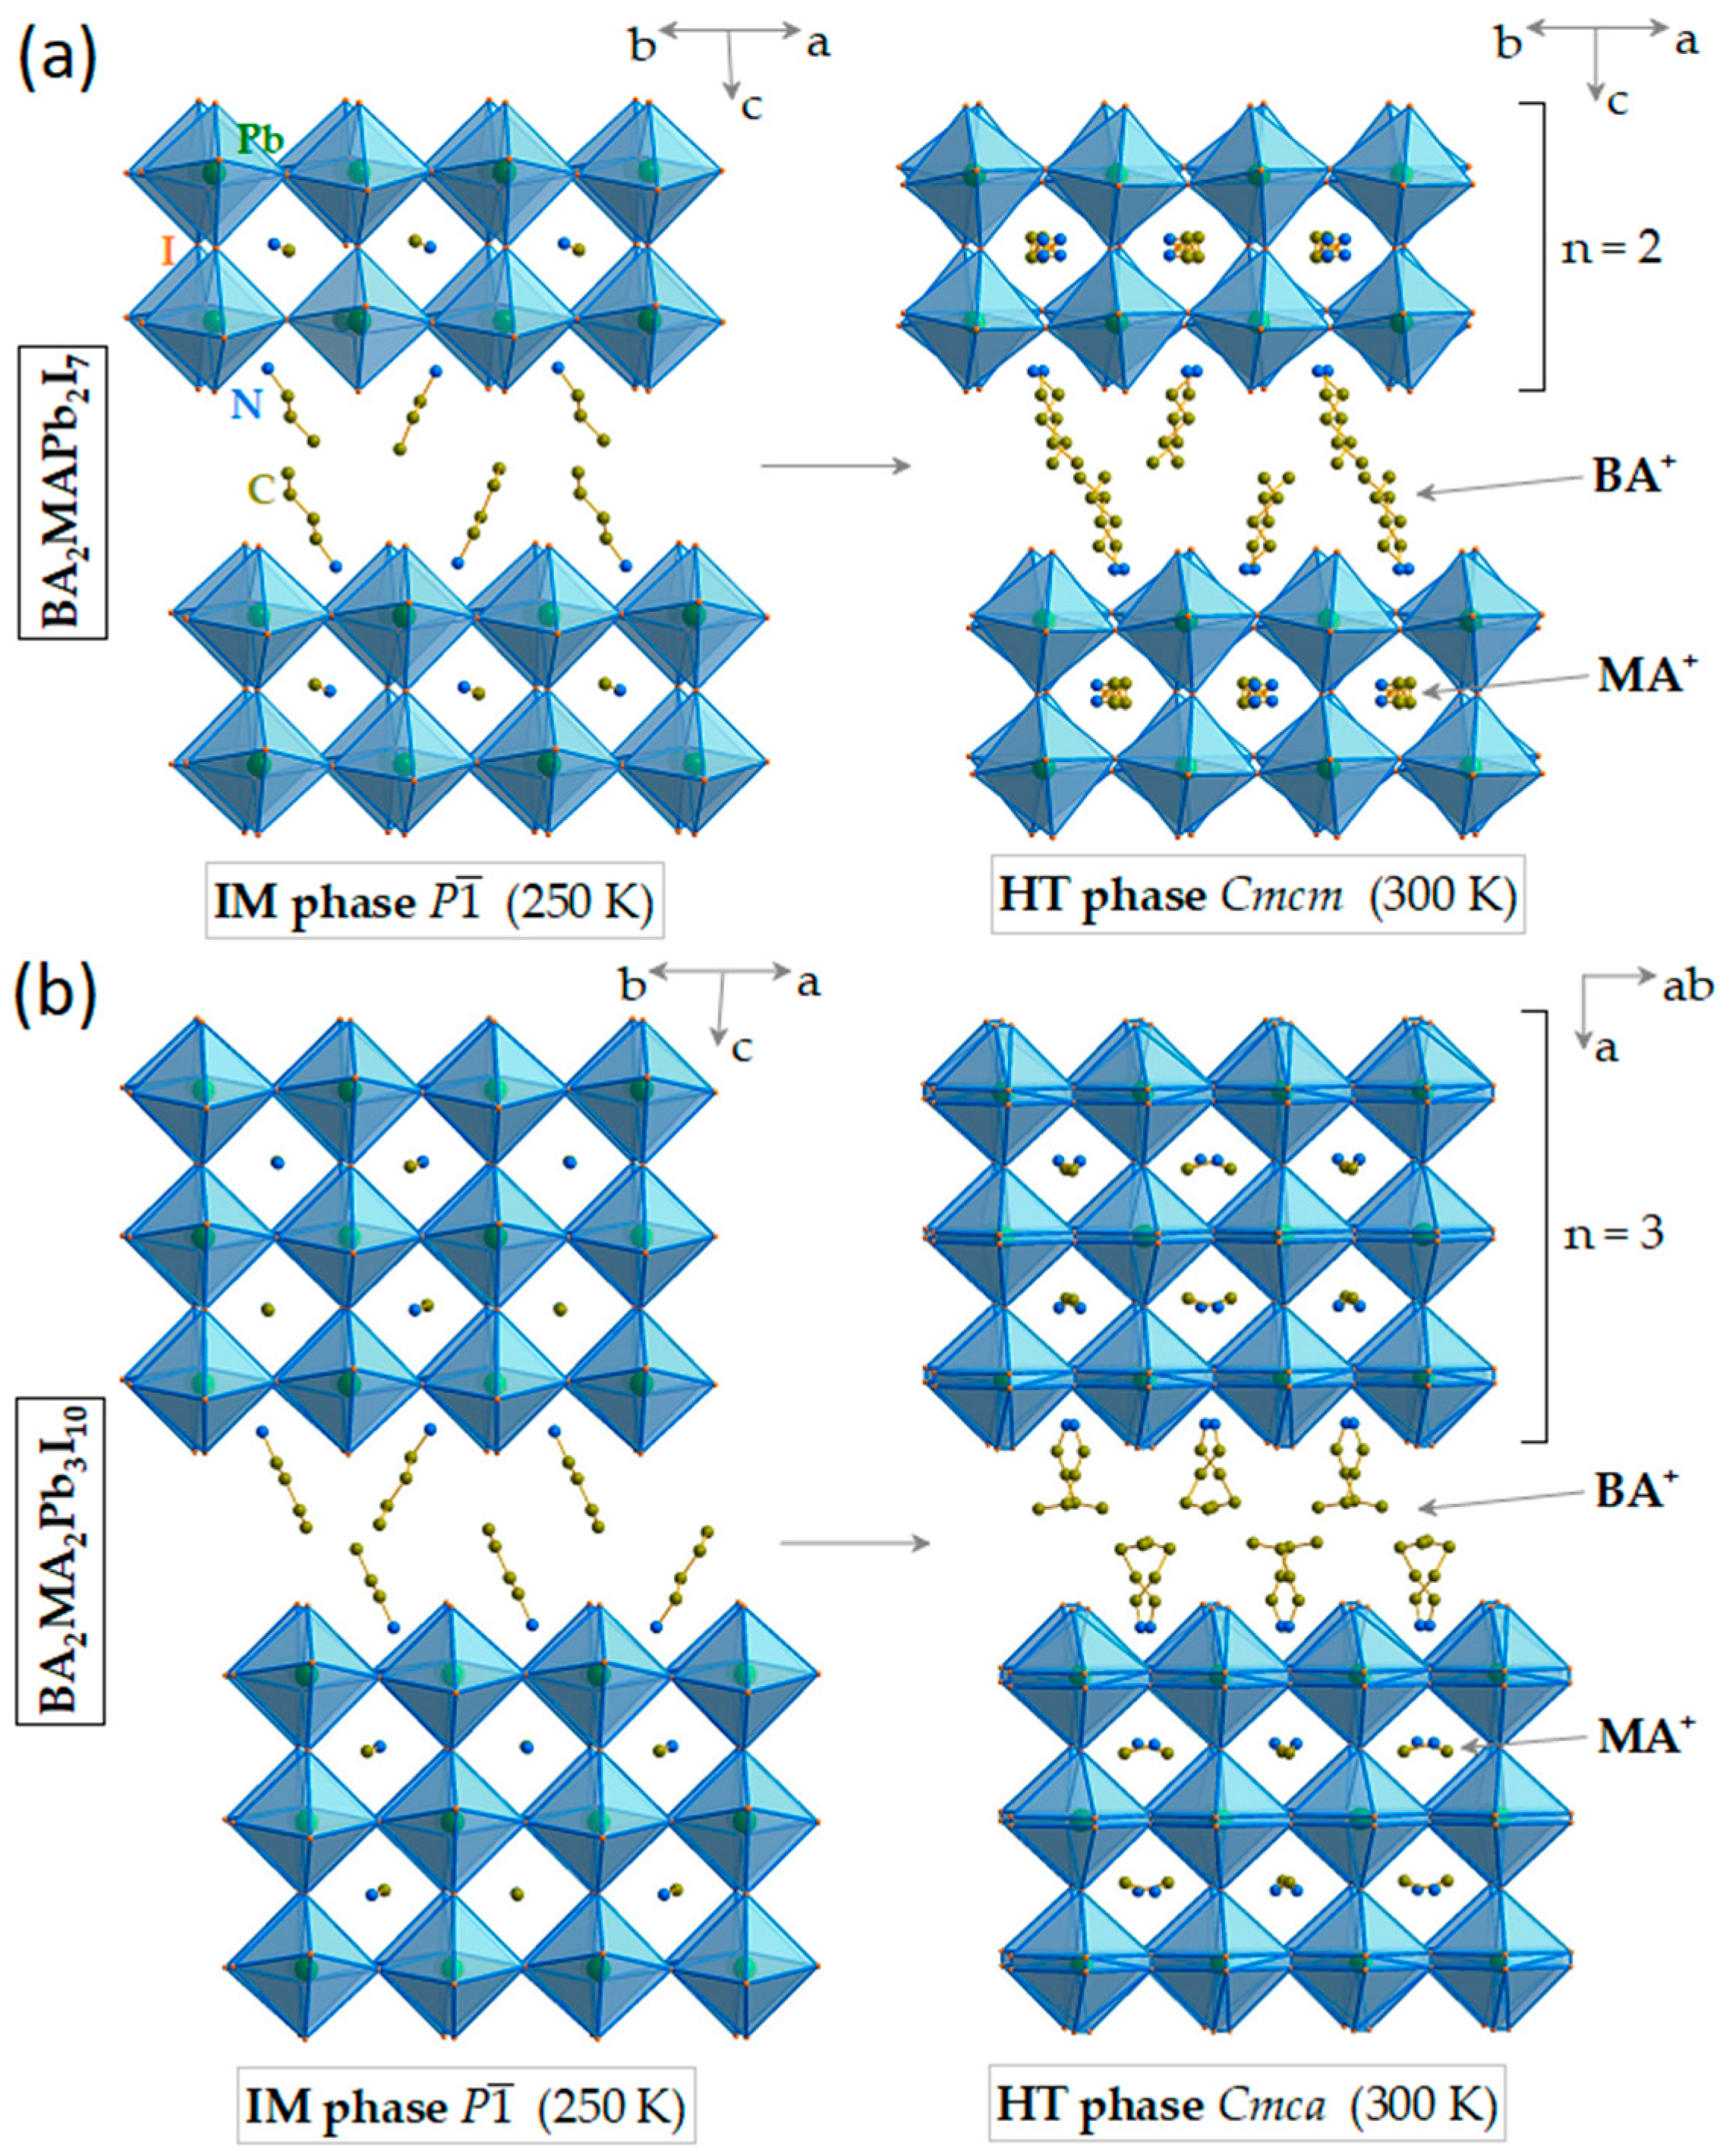
Figure 1. Crystal structures of the high-temperature (HT) and intermediate (IM) phases of (a) BA2MAPb2I7 and (b) BA2MA2Pb3I10.
Materials 17 02503 g001
Figure 2. Temperature-dependent Raman spectra in the 150–10 cm−1 range (a) and plots of Raman wavenumbers for lattice modes (b) of BA2MAPb2I7. Red, green, and blue colors correspond to the HT, intermediate, and LT phases, respectively. Vertical lines indicate phase transition temperatures.
Materials 17 02503 g002
Figure 3. Plots of Raman wavenumbers (closed symbols) and FWHM (open symbols) for selected internal modes of BA2MAPb2I7: (a) δas(NH3+), (d) ν(CN) and (e) ρ(NH3+) + ρ(CH3) modes of MA+ as well as (a) δas(NH3+), (b) ρ(NH3+), (c) νas(CC), (e) ω(NH,CH), νs(CC), νs(CN) and (f) ρ(CH2) modes of BA+. The same color denotes FWHM and wavenumber data for the same mode. Vertical lines denote phase transition temperatures.
Materials 17 02503 g003
Figure 4. Temperature-dependent Raman spectra in the 150–10 cm−1 range (a) and plots of Raman wavenumbers for lattice modes (b) of BA2MA2Pb3I10. Red, green, and blue colors correspond to the HT, intermediate, and LT phases, respectively. Vertical lines denote phase transition temperatures.
Materials 17 02503 g004
Figure 5. Plots of Raman wavenumbers (closed symbols) and FWHM (open symbols) for selected internal modes of BA2MA2Pb3I10: (a) δas(NH3+), (d) ν(CN), and (e) ρ(NH3+) + ρ(CH3) modes of MA+ as well as (a) δas(NH3+), (b) ρ(NH3+), (c) νas(CC), (e) ω(NH,CH), νs(CC), νs(CN), and (f) ρ(CH2) modes of BA+. The same color denotes the FWHM and wavenumber data for the same mode.
Materials 17 02503 g005
Disclaimer/Publisher’s Note: The statements, opinions and data contained in all publications are solely those of the individual author(s) and contributor(s) and not of MDPI and/or the editor(s). MDPI and/or the editor(s) disclaim responsibility for any injury to people or property resulting from any ideas, methods, instructions or products referred to in the content.