
Theoretical Prediction of Strengthening in Nanocrystalline Cu with Multi-Element Grain Boundary Segregation Decoration


Abstract
1. Introduction
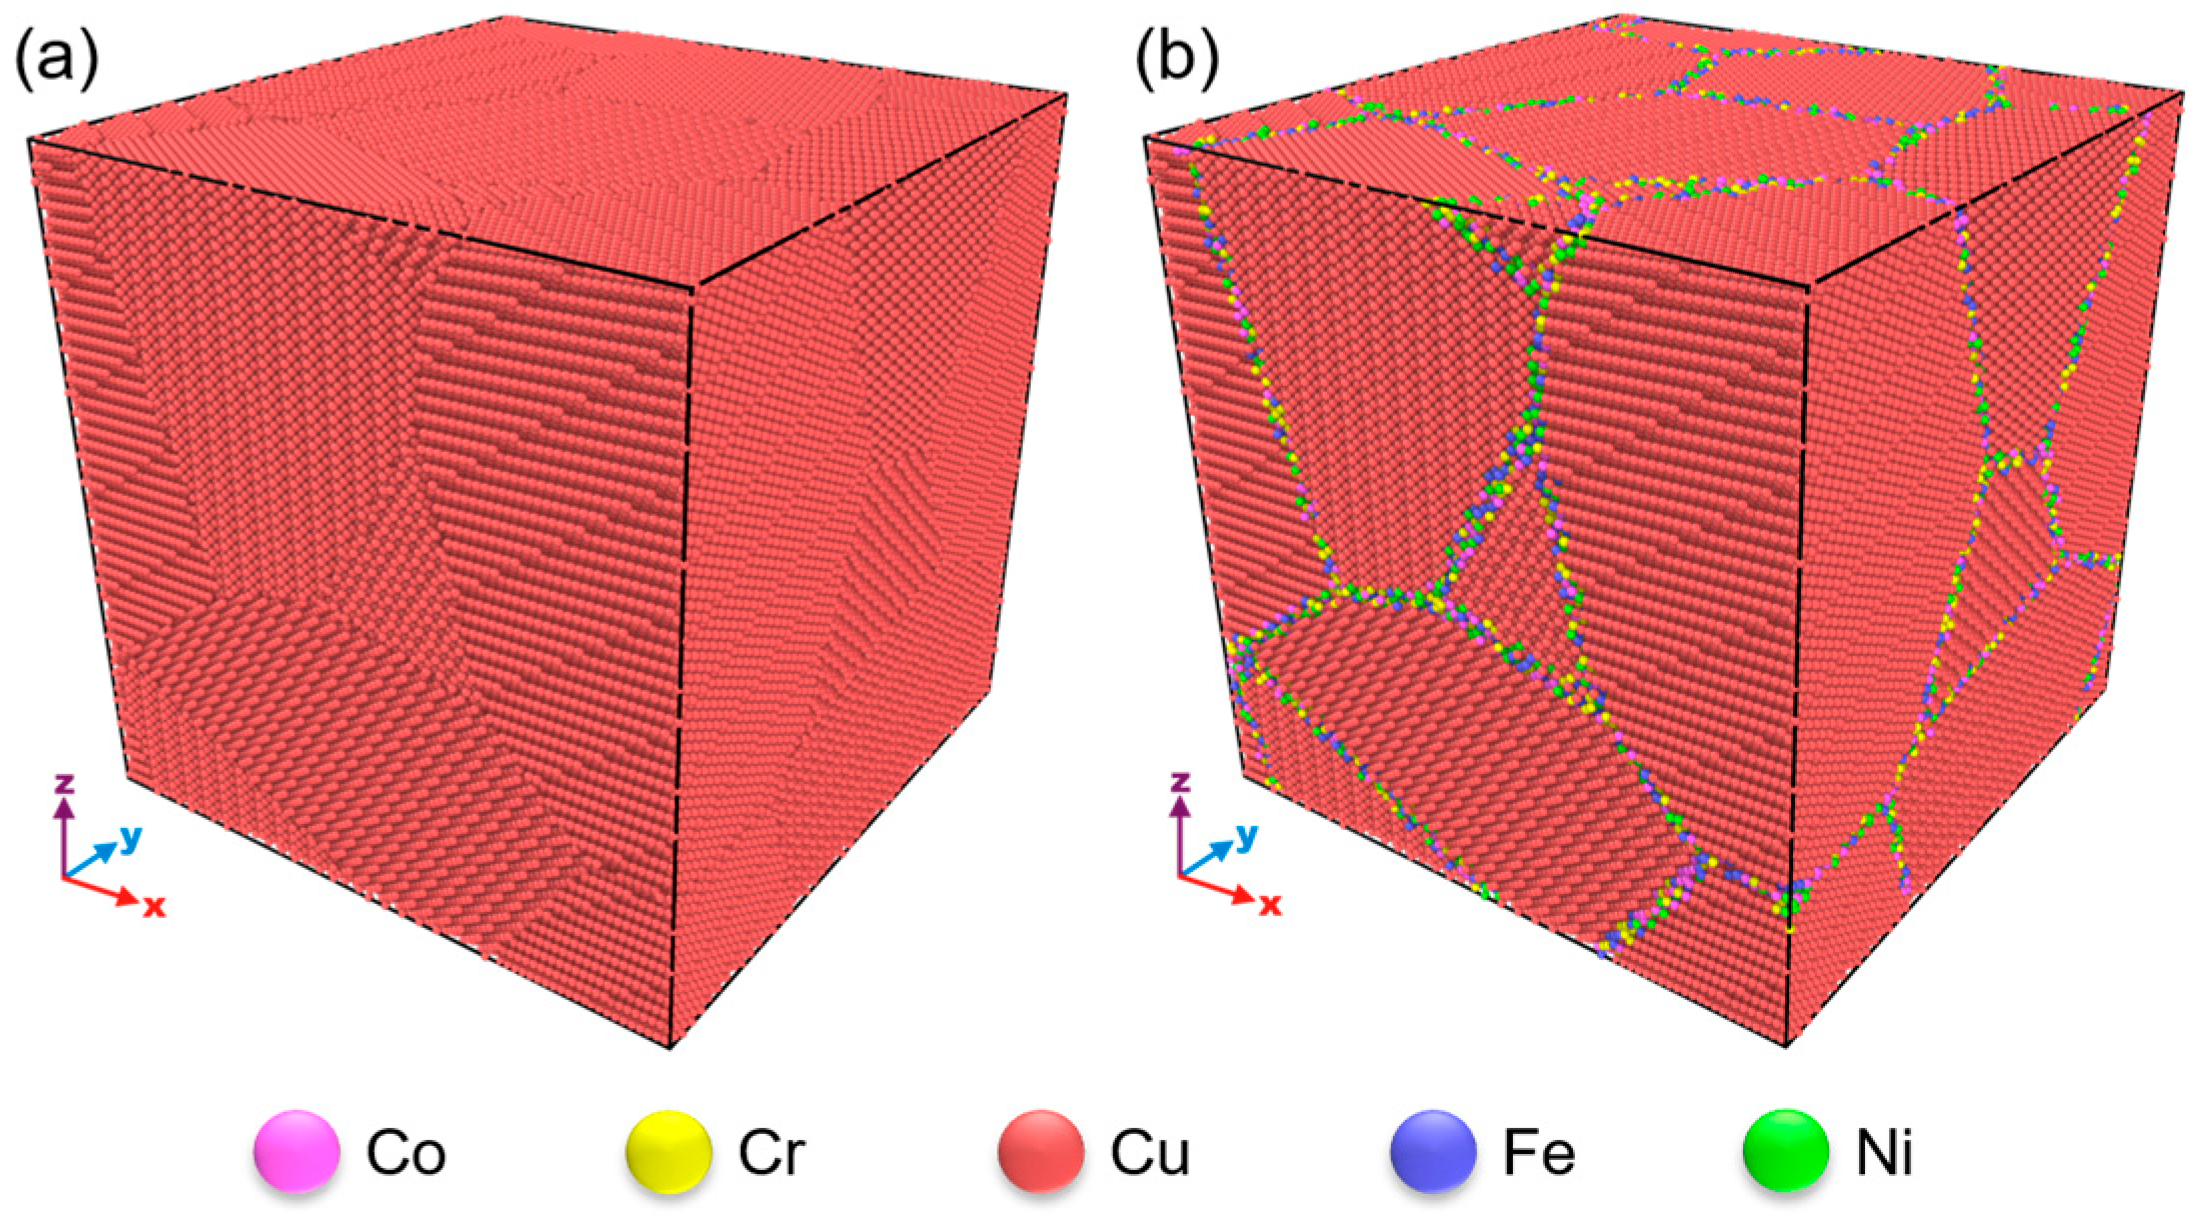
2. Method
3. Results
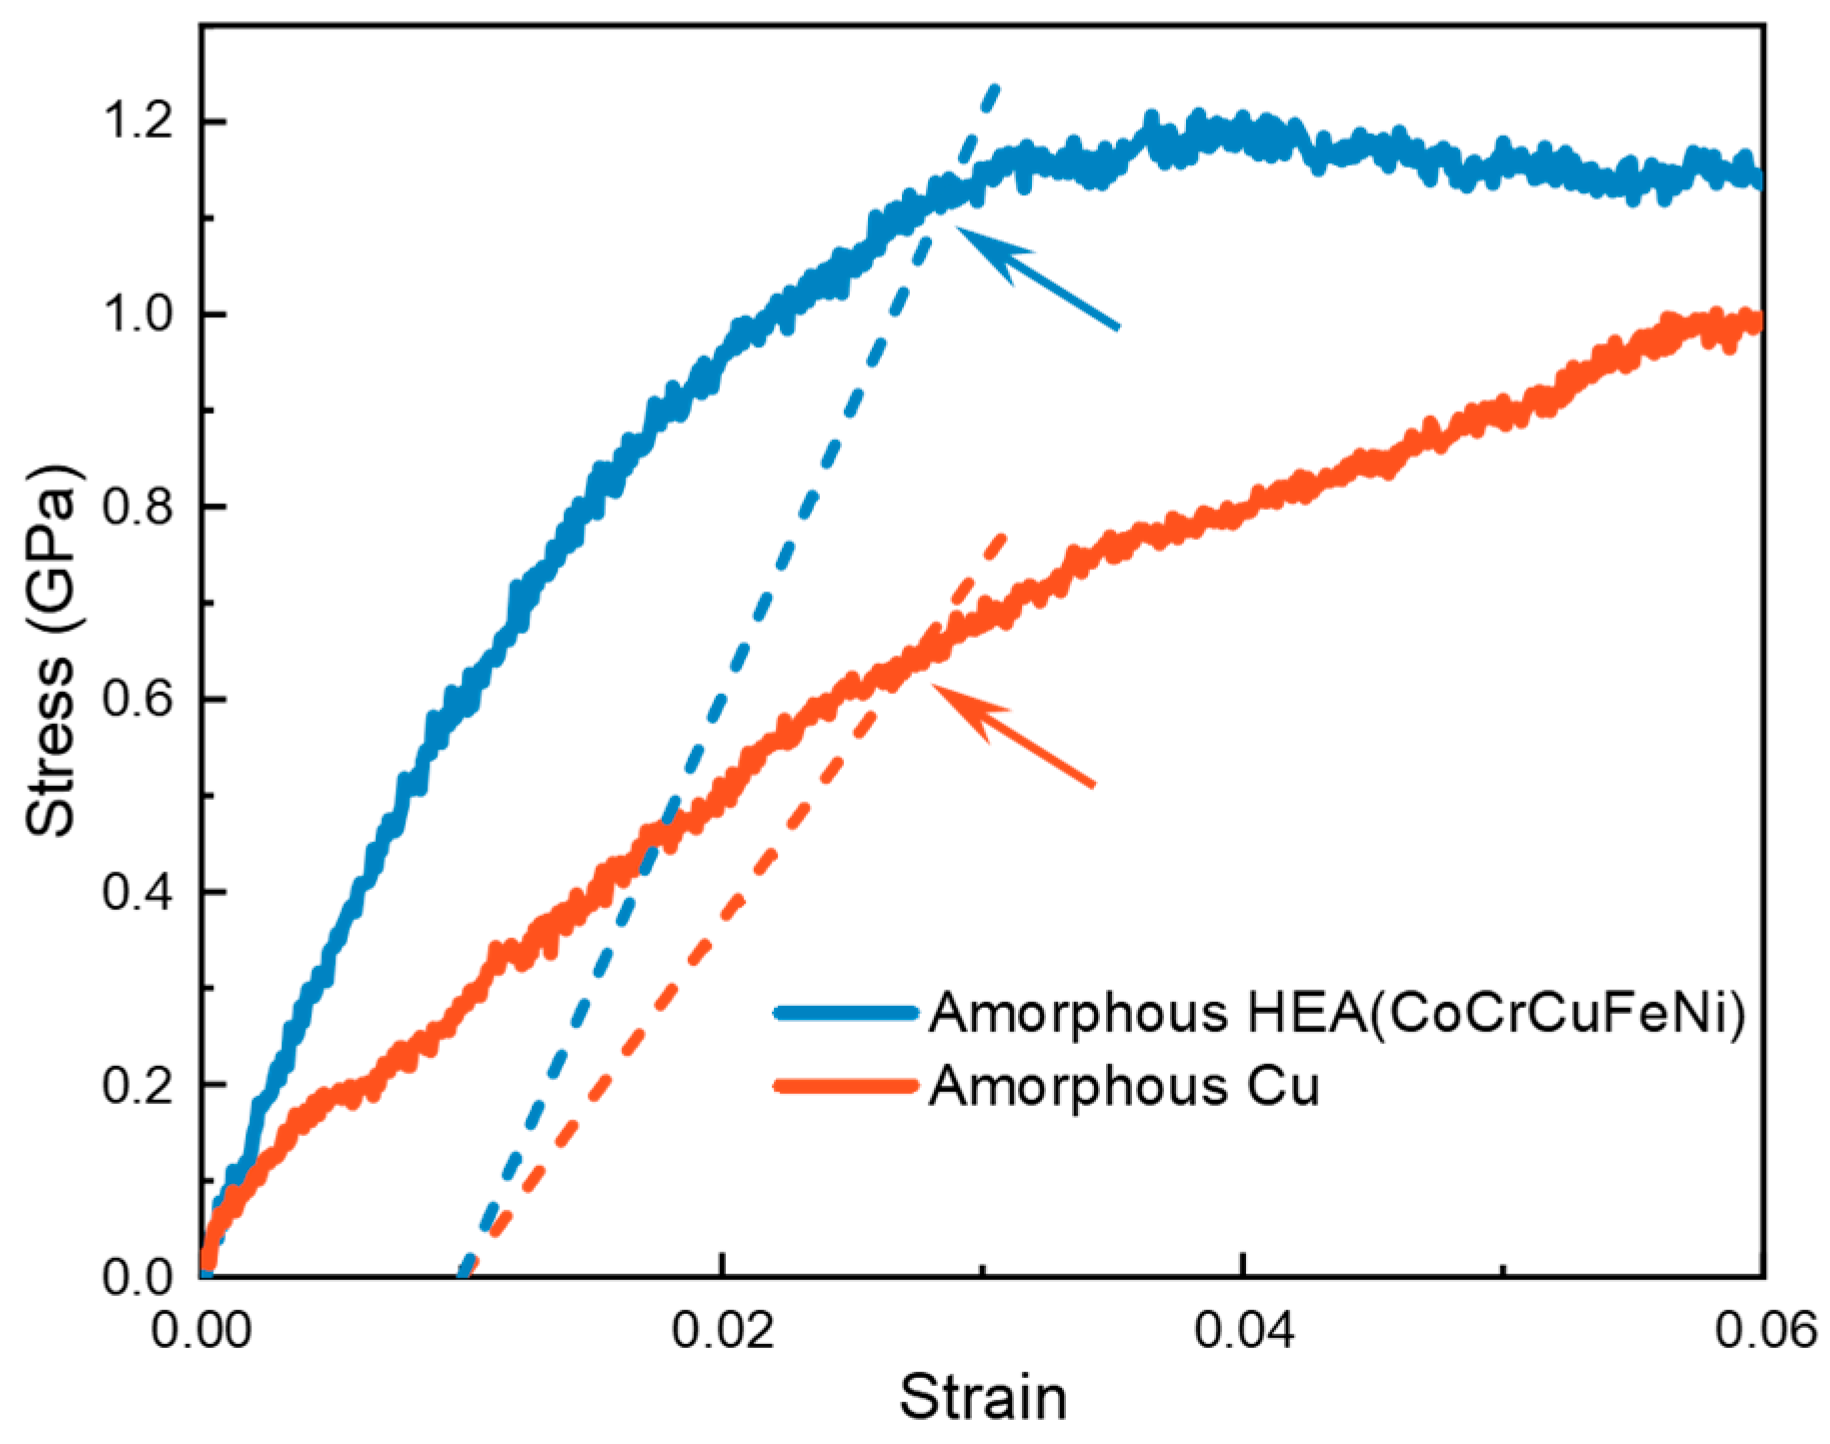
3.1. Mechanical Response
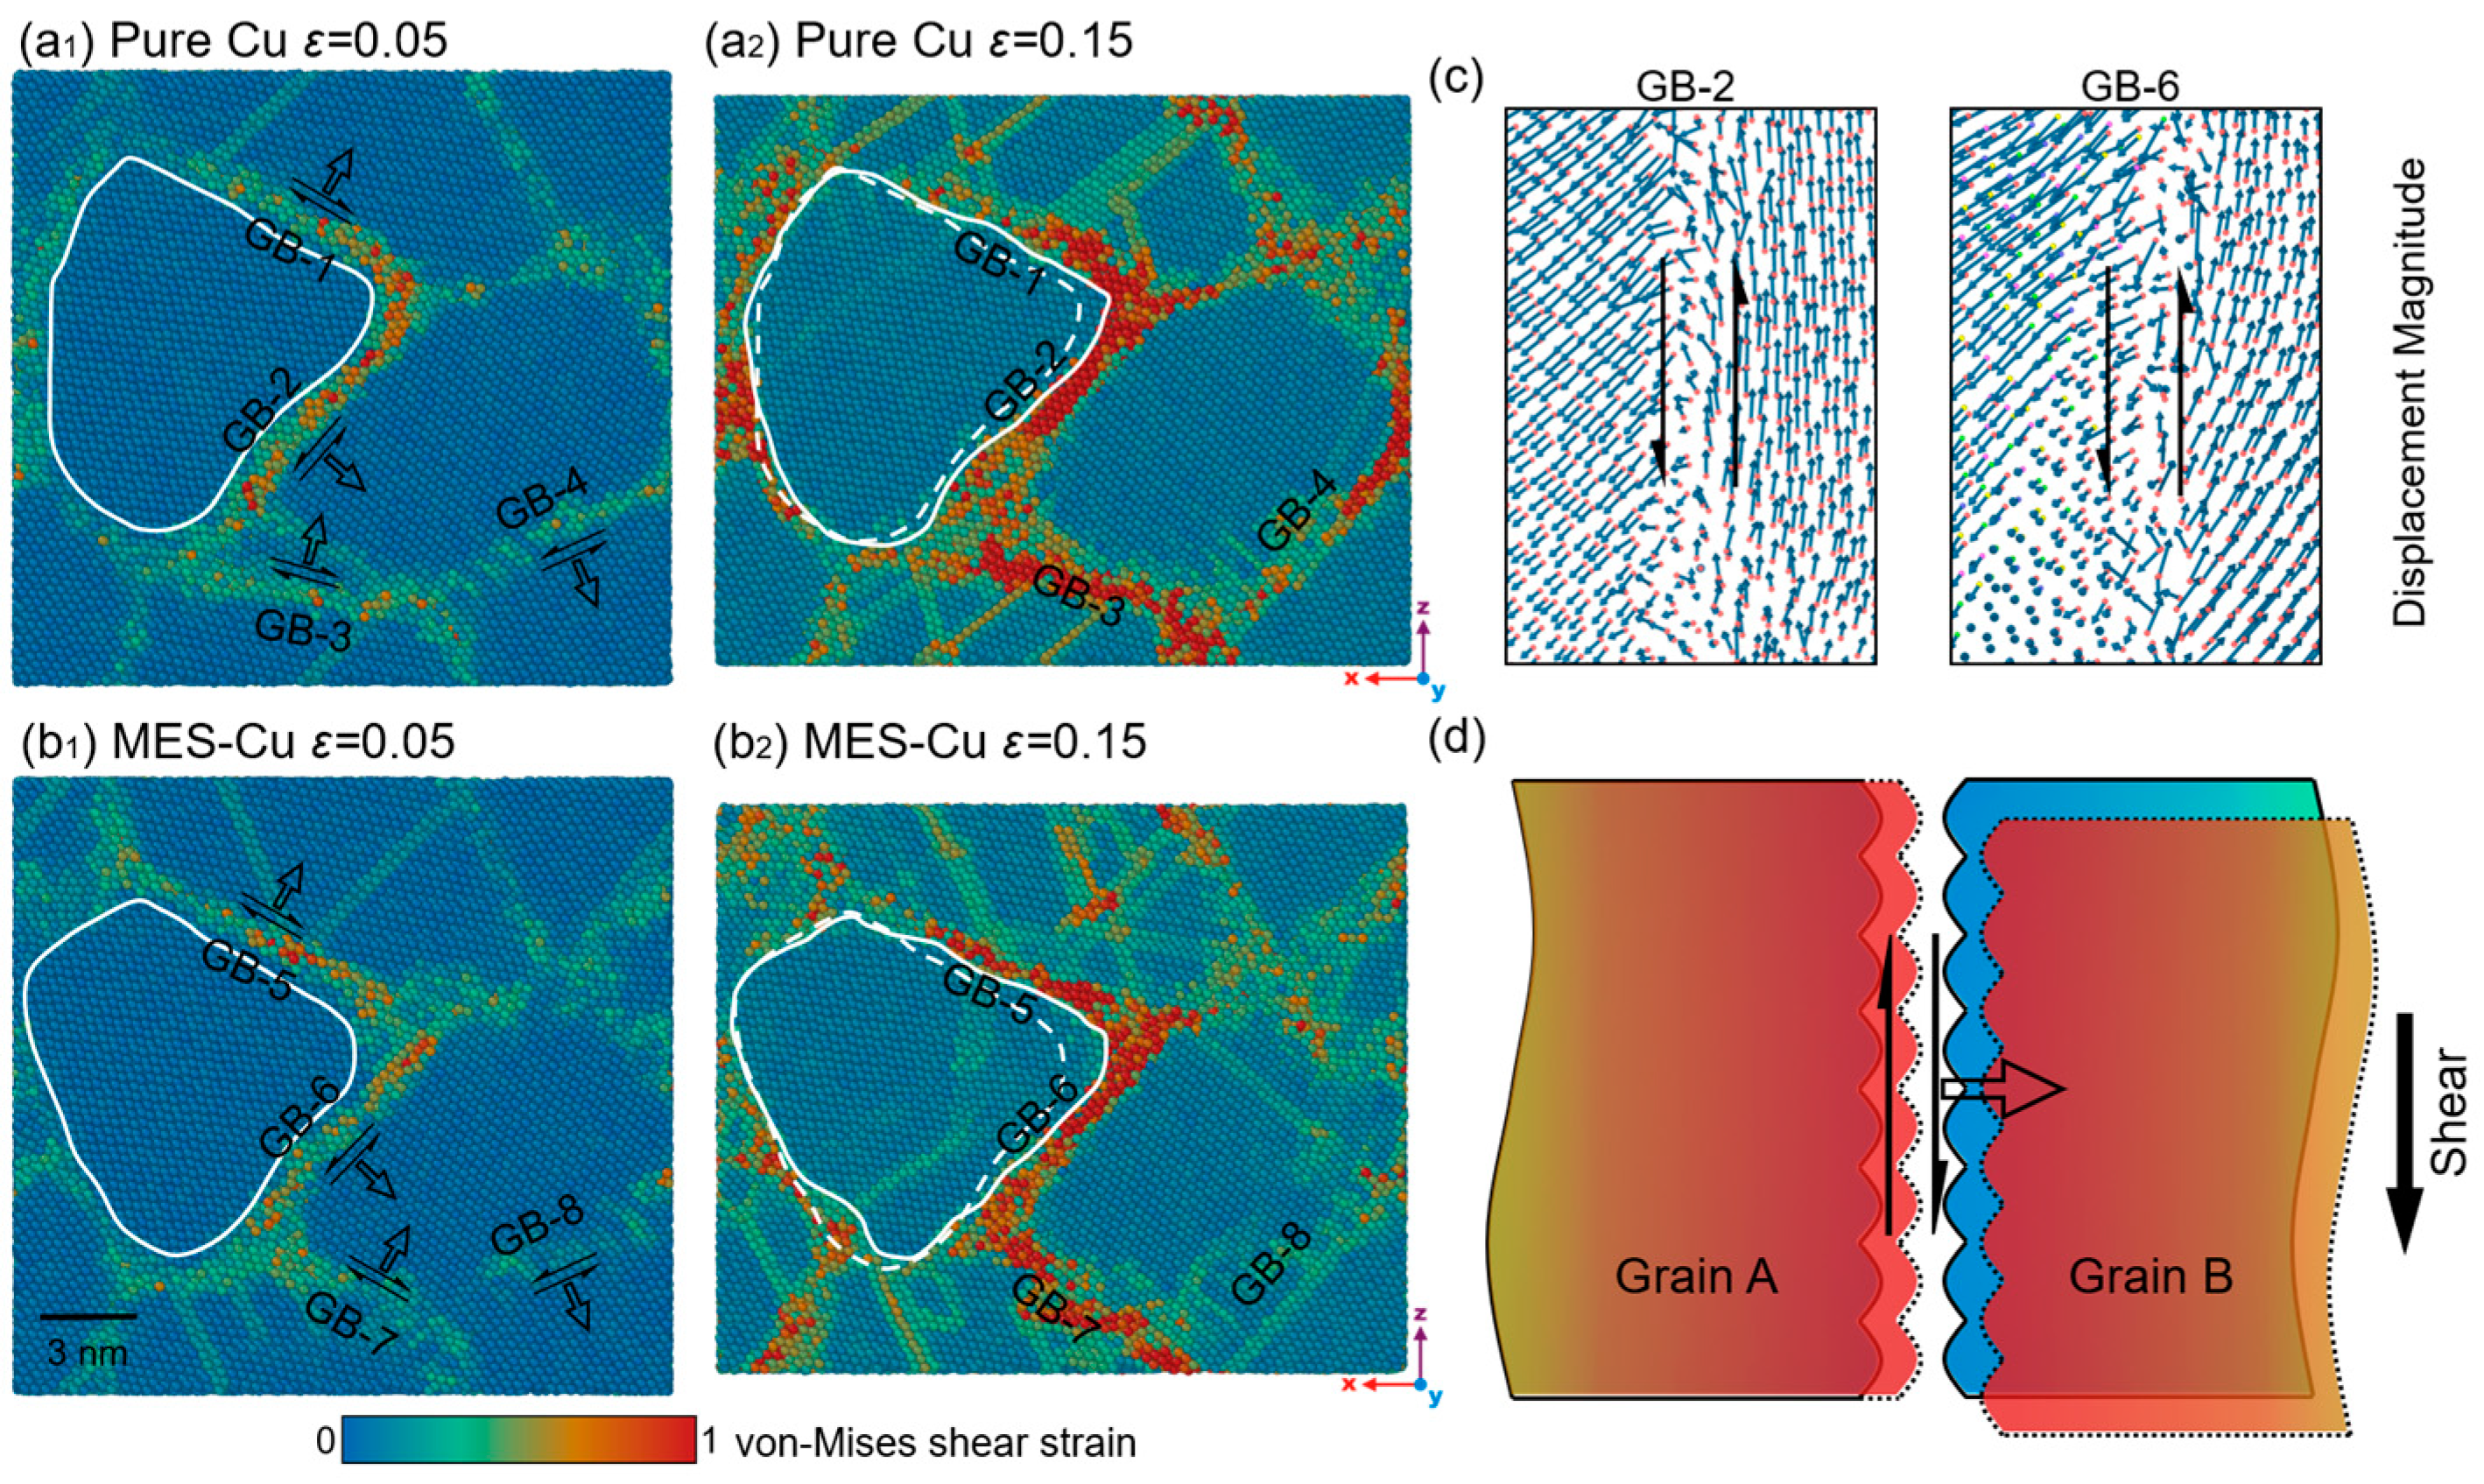
3.2. Microstructure Evolution: Migration and Sliding of GBs
4. Discussion
4.1. Derivation of Theoretical Model
4.2. Validation of Theoretical Model
4.3. Effect of Migration and Sliding on Strength
5. Conclusions
Author Contributions
Funding
Institutional Review Board Statement
Informed Consent Statement
Data Availability Statement
Conflicts of Interest
Appendix A. Tensile Mechanical Properties of Pure Cu and MES-Cu with Different Grain Size at 500 K

Appendix B. Applicability of the Theoretical Model in Pure Cu and MES-Cu at 500 K

References
- Hall, E.O. The Deformation and Ageing of Mild Steel: III Discussion of Results. Proc. Phys. Soc. Sect. B 1951, 64, 747–753. [Google Scholar] [CrossRef]
- Petch, N.J. The Cleavage Strength of Polycrystals. J. Iron Steel I 1953, 174, 25–28. [Google Scholar]
- Quek, S.S.; Chooi, Z.H.; Wu, Z.X.; Zhang, Y.W.; Srolovitz, D.J. The inverse hall-petch relation in nanocrystalline metals: A discrete dislocation dynamics analysis. J. Mech. Phys. Solids 2016, 88, 252–266. [Google Scholar] [CrossRef]
- Lu, S.J.; Kan, Q.H.; Zaiser, M.; Li, Z.H.; Kang, G.Z.; Zhang, X. Size-dependent yield stress in ultrafine-grained polycrystals: A multiscale discrete dislocation dynamics study. Int. J. Plast. 2022, 149, 103183. [Google Scholar] [CrossRef]
- Liu, W.B.; Liu, Y.; Sui, H.N.; Chen, L.R.; Yu, L.; Yi, X.; Duan, H.L. Dislocation-grain boundary interaction in metallic materials: Competition between dislocation transmission and dislocation source activation. J. Mech. Phys. Solids 2020, 145, 104158. [Google Scholar] [CrossRef]
- Gao, Y.J.; Huang, Z.J.; Deng, Q.Q.; Liao, K.; Li, Y.X.; Yi, X.A.; Luo, Z.R. Structural transformation and energy analysis for pile-up dislocations at triple junction of grain boundary. Trans. Nonferrous Met. Soc. 2022, 32, 45–63. [Google Scholar] [CrossRef]
- Liu, W.B.; Yu, L.; Liu, Y.; Sui, H.N.; Fan, H.D.; Duan, H.L. Dislocation pile-up polarization model for mechanical properties of polycrystalline metals based on grain boundary resistance variability. J. Mech. Phys. Solids 2022, 160, 104793. [Google Scholar] [CrossRef]
- Hu, J.; Shi, Y.N.; Sauvage, X.; Sha, G.; Lu, K. Grain boundary stability governs hardening and softening in extremely fine nanograined metals. Science 2017, 355, 1292–1296. [Google Scholar] [CrossRef] [PubMed]
- Schiotz, J.; Jacobsen, K.W. A maximum in the strength of nanocrystalline copper. Science 2003, 301, 1357–1359. [Google Scholar] [CrossRef]
- Schuh, C.A.; Nieh, T.G.; Yamasaki, T. Hall-Petch breakdown manifested in abrasive wear resistance of nanocrystalline nickel. Scr. Mater. 2002, 46, 735–740. [Google Scholar] [CrossRef]
- Cordero, Z.C.; Knight, B.E.; Schuh, C.A. Six decades of the Hall-Petch effect—A survey of grain-size strengthening studies on pure metals. Int. Mater. Rev. 2016, 61, 495–512. [Google Scholar] [CrossRef]
- Lu, K. Stabilizing nanostructures in metals using grain and twin boundary architectures. Nat. Rev. Mater. 2016, 1, 16019. [Google Scholar] [CrossRef]
- Xu, W.; Zhang, B.; Li, X.Y.; Le, K. Suppressing atomic diffusion with the Schwarz crystal structure in supersaturated Al-Mg alloys. Science 2021, 373, 683–687. [Google Scholar] [CrossRef] [PubMed]
- Li, X.Y.; Jin, Z.H.; Zhou, X.; Lu, K. Constrained minimal-interface structures in polycrystalline copper with extremely fine grains. Science 2020, 370, 831–836. [Google Scholar] [CrossRef] [PubMed]
- Bringa, E.M.; Caro, A.; Leveugle, E. Pressure effects on grain boundary plasticity in nanophase metals. Appl. Phys. Lett. 2006, 89, 023101. [Google Scholar] [CrossRef]
- Zhou, X.Y.; Ahmadian, A.; Gault, B.; Ophus, C.; Liebscher, C.H.; Dehm, G.; Raabe, D. Atomic motifs govern the decoration of grain boundaries by interstitial solutes. Nat. Commun. 2023, 14, 3535. [Google Scholar] [CrossRef] [PubMed]
- Peng, H.R.; Jian, Z.Y.; Liu, C.X.; Huang, L.K.; Ren, Y.M.; Liu, F. Uncovering the softening mechanism and exploring the strengthening strategies in extremely fine nanograined metals: A molecular dynamics study. J. Mater. Sci. Technol. 2022, 109, 186–196. [Google Scholar] [CrossRef]
- Zhou, N.X.; Hu, T.; Huang, J.J.; Luo, J. Stabilization of nanocrystalline alloys at high temperatures via utilizing high-entropy grain boundary complexions. Scr. Mater. 2016, 124, 160–163. [Google Scholar] [CrossRef]
- Farkas, D. Grain boundary structure in high-entropy alloys. J. Mater. Sci. 2020, 55, 9173–9183. [Google Scholar] [CrossRef]
- Li, L.; Kamachali, R.D.; Li, Z.; Zhang, Z. Grain boundary energy effect on grain boundary segregation in an equiatomic high-entropy alloy. Phys. Rev. Mater. 2020, 4, 053603. [Google Scholar] [CrossRef]
- Luo, J.; Zhou, N.X. High-entropy grain boundaries. Commun. Mater. 2023, 4, 7. [Google Scholar] [CrossRef]
- Li, X.; Fu, T.; Li, C.; Hu, H.; Peng, X. Effect of layer thickness on mechanical properties of Cu/CoCrFeNi nanolaminates: Implications from a quantitative flow stress model. J. Mater. Res. Technol. 2024, 28, 3485–3493. [Google Scholar] [CrossRef]
- Bai, Z.; Fu, T.; Hu, H.; Yu, W.; Peng, X. Automated identification of stacking faults and twin boundaries in face-centered cubic crystal. Comput. Mater. Sci. 2024, 235, 112837. [Google Scholar] [CrossRef]
- Liang, Q.H.; Weng, S.Y.; Fu, T.; Hu, S.; Peng, X.H. Dislocation reaction-based formation mechanism of stacking fault tetrahedra in FCC high-entropy alloy. Mater. Chem. Phys. 2022, 282, 125997. [Google Scholar] [CrossRef]
- Hahn, E.N.; Meyers, M.A. Grain-size dependent mechanical behavior of nanocrystalline metals. Mater. Sci. Eng. A-Struct. 2015, 646, 101–134. [Google Scholar] [CrossRef]
- Chandross, M.; Argibay, N. Ultimate Strength of Metals. Phys. Rev. Lett. 2020, 124, 125501. [Google Scholar] [CrossRef]
- Xiao, J.W.; Deng, C. Ultimate Strength of Nanotwinned Face-Centered Cubic Metals. Phys. Rev. Lett. 2020, 125, 266101. [Google Scholar] [CrossRef]
- Hu, H.; Fu, T.; Li, C.A.Y.; Weng, S.Y.; Zhao, Y.B.; Chen, X.; Peng, X.H. Delay of inverse Hall-Petch relationship of nanocrystalline Cu by modifying grain boundaries with coherent twins. Phys. Rev. B 2022, 105, 024107. [Google Scholar] [CrossRef]
- Hirel, P. Atomsk: A tool for manipulating and converting atomic data files. Comput. Phys. Commun. 2015, 197, 212–219. [Google Scholar] [CrossRef]
- Kelchner, C.L.; Plimpton, S.J.; Hamilton, J.C. Dislocation nucleation and defect structure during surface indentation. Phys. Rev. B 1998, 58, 11085–11088. [Google Scholar] [CrossRef]
- Stukowski, A. Visualization and analysis of atomistic simulation data with OVITO–the Open Visualization Tool. Model. Simul. Mater. Sci. Eng. 2010, 18, 015012. [Google Scholar] [CrossRef]
- Farkas, D.; Caro, A. Model interatomic potentials and lattice strain in a high-entropy alloy. J. Mater. Res. 2018, 33, 3218–3225. [Google Scholar] [CrossRef]
- Plimpton, S. Fast Parallel Algorithms for Short-Range Molecular-Dynamics. J. Comput. Phys. 1995, 117, 1–19. [Google Scholar] [CrossRef]
- Wolf, D.; Yamakov, V.; Phillpot, S.R.; Mukherjee, A.K. Deformation mechanism and inverse Hall-Petch behavior in nanocrystalline materials. Int. J. Mater. Res. 2003, 94, 1091–1097. [Google Scholar] [CrossRef]
- Ledbetter, H.M. Elastic constants of polycrystalline copper at low temperatures. Relationship to single-crystal elastic constants. Phys. Status Solidi A 1981, 66, 477–484. [Google Scholar] [CrossRef]
- Wang, G.-H.; Pan, H.; Ke, F.-J.; Xia, M.-F.; Bai, Y.-L. Study of mechanical properties of amorphous copper with molecular dynamics simulation. Chin. Phys. B 2008, 17, 259. [Google Scholar]
- Qiu, R.-Z.; Li, C.-C.; Fang, T.-H. Mechanical properties and crack growth behavior of polycrystalline copper using molecular dynamics simulation. Phys. Scr. 2017, 92, 085702. [Google Scholar] [CrossRef]
- Langdon, T.G. Grain boundary sliding revisited: Developments in sliding over four decades. J. Mater. Sci. 2006, 41, 597–609. [Google Scholar] [CrossRef]
- Shen, M.; Li, Y.W.; Hu, C.Z.; Xue, S.K.; Xiang, C.Y.; Luo, J.; Yu, Z.Y. The interfacial structure underpinning the Al-Ga liquid metal embrittlement: Disorder vs. order gradients. Scr. Mater. 2021, 204, 114149. [Google Scholar] [CrossRef]
- Gleiter, H. Nanocrystalline materials. Progress. Mater. Sci. 1989, 33, 223–315. [Google Scholar] [CrossRef]
- Smoluchowski, R. Theory of Grain Boundary Motion. Phys. Rev. 1951, 83, 69–70. [Google Scholar] [CrossRef]
- Mott, N.F. Slip at Grain Boundaries and Grain Growth in Metals. Proc. Phys. Soc. Lond. 1948, 60, 391–394. [Google Scholar] [CrossRef]
- Sietsma, J.; Thijsse, B.J. An Investigation of Universal Medium Range Order in Metallic Glasses. J. Non-Cryst. Solids 1991, 135, 146–154. [Google Scholar] [CrossRef]
- Hirotsu, Y.; Matsushita, M.; Ohkubo, T.; Makino, A.; Oikawa, T. Average and local structures of amorphous Pd75Si25 alloy analyzed by modern electron diffraction techniques. Mater. Sci. Eng. A-Struct. 1997, 226, 274–279. [Google Scholar] [CrossRef]
- Dubois, J.M.; Montoya, F.; Back, C. Icosahedral Order in Glass-Forming Metallic Melts. Mater. Sci. Eng. A-Struct. 1994, 178, 285–291. [Google Scholar] [CrossRef]
- Červinka, L. Modeling of medium-range order in metallic glasses: Calculation of X-ray scattering in a Ti61Cu16Ni23 glass. J. Non-Cryst. Solids 1993, 156–158, 94–97. [Google Scholar] [CrossRef]
- Lamparter, P.; Steeb, S.; Grallath, E. Neutron-Diffraction Study on the Structure of the Metallic-Glass Cu57zr43. Z. Fur Naturforschung Sect. A 1983, 38, 1210–1222. [Google Scholar] [CrossRef]
- Petkov, V.; Apostolov, A.; Sassik, H. Short-Range Order in Gd4cu3 Metallic-Glass. J. Non-Cryst. Solids 1990, 122, 262–268. [Google Scholar] [CrossRef]
- Červinka, L. Medium-range ordering in non-crystalline solids. J. Non-Cryst. Solids 1987, 90, 371–381. [Google Scholar] [CrossRef]
- Dubois, J.M.; Le Caer, G. Ordre local et proprietes physiques des verres metalliques riches en fer. Acta Metall. 1984, 32, 2101–2114. [Google Scholar] [CrossRef]
- Gaskell, P.H. On the structure of simple inorganic amorphous solids. J. Phys. C Solid. State Phys. 1979, 12, 4337–4368. [Google Scholar] [CrossRef]
- Lamparter, P.; Sperl, W.; Steeb, S.; Bletry, J. Atomic-Structure of Amorphous Metallic Ni81b19. Z. Fur Naturforschung Sect. A 1982, 37, 1223–1234. [Google Scholar] [CrossRef]
- Liu, A.C.Y.; Neish, M.J.; Stokol, G.; Buckley, G.A.; Smillie, L.A.; de Jonge, M.D.; Ott, R.T.; Kramer, M.J.; Bourgeois, L. Systematic Mapping of Icosahedral Short-Range Order in a Melt-SpunZr36Cu64Metallic Glass. Phys. Rev. Lett. 2013, 110, 205505. [Google Scholar] [CrossRef] [PubMed]
- Gaskell, P.H. Models for the structure of amorphous metals. In Glassy Metal II: Atomic Structure and Dynamics, Electronic Structure, Magnetic Properties; Beck, H., Güntherodt, H.-J., Eds.; Springer: Berlin/Heidelberg, Germany, 1983; pp. 5–49. [Google Scholar]
- Argibay, N.; Chandross, M. Theoretical model for prediction of high-strength metallic glasses. Phys. Rev. Mater. 2022, 6, 115602. [Google Scholar] [CrossRef]
- Wang, H.; Chen, D.K.; An, X.H.; Zhang, Y.; Sun, S.J.; Tian, Y.Z.; Zhang, Z.F.; Wang, A.G.; Liu, J.Q.; Song, M.; et al. Deformation-induced crystalline-to-amorphous phase transformation in a CrMnFeCoNi high-entropy alloy. Sci. Adv. 2021, 7, eabe3105. [Google Scholar] [CrossRef] [PubMed]
- Garg, P.; Rupert, T.J. Grain incompatibility determines the local structure of amorphous grain boundary complexions. Acta Mater. 2023, 244, 118599. [Google Scholar] [CrossRef]
- Keblinski, P.; Phillpot, S.R.; Wolf, D.; Gleiter, H. Amorphous structure of grain boundaries and grain junctions in nanocrystalline silicon by molecular-dynamics simulation. Acta Mater. 1997, 45, 987–998. [Google Scholar] [CrossRef]
- Masumura, R.; Ovid’ko, I. Enhanced diffusion near amorphous grain boundaries in nanocrystalline and polycrystalline solids. Mater. Phys. Mech. 2000, 1, 31–38. [Google Scholar]
- Van Swygenhoven, H.; Caro, A. Plastic behavior of nanophase metals studied by molecular dynamics. Phys. Rev. B 1998, 58, 11246–11251. [Google Scholar] [CrossRef]
- Mishin, Y. Stochastic model and kinetic Monte Carlo simulation of solute interactions with stationary and moving grain boundaries. I. Model formulation and application to one-dimensional systems. Phys. Rev. Mater. 2023, 7, 063403. [Google Scholar] [CrossRef]
- Mishin, Y. Stochastic model and kinetic Monte Carlo simulation of solute interactions with stationary and moving grain boundaries. II. Application to two-dimensional systems. Phys. Rev. Mater. 2023, 7, 063404. [Google Scholar] [CrossRef]
- Argon, A.S. Plastic-Deformation in Metallic Glasses. Acta Met. 1979, 27, 47–58. [Google Scholar] [CrossRef]
- Spaepen, F. A microscopic mechanism for steady state inhomogeneous flow in metallic glasses. Acta Metall. 1977, 25, 407–415. [Google Scholar] [CrossRef]
- Li, H.Q.; Choo, H.; Ren, Y.; Saleh, T.A.; Lienert, U.; Liaw, P.K.; Ebrahimi, F. Strain-dependent deformation behavior in nanocrystalline metals. Phys. Rev. Lett. 2008, 101, 015502. [Google Scholar] [CrossRef] [PubMed]
- Brandstetter, S.; Van Swygenhoven, H.; Van Petegem, S.; Schmitt, B.; Maass, R.; Derlet, P.M. From micro- to macroplasticity. Adv. Mater. 2006, 18, 1545–1548. [Google Scholar] [CrossRef]
- Vo, N.Q.; Averback, R.S.; Bellon, P.; Caro, A. Yield strength in nanocrystalline Cu during high strain rate deformation. Scr. Mater. 2009, 61, 76–79. [Google Scholar] [CrossRef]
- Rottler, J.; Robbins, M.O. Macroscopic friction laws and shear yielding of glassy solids. Comput. Phys. Commun. 2005, 169, 177–182. [Google Scholar] [CrossRef]
- Lund, A.C.; Schuh, C.A. Yield surface of a simulated metallic glass. Acta Mater. 2003, 51, 5399–5411. [Google Scholar] [CrossRef]
- Armstrong, R.W. 60 Years of Hall-Petch: Past to Present Nano-Scale Connections. Mater. Trans. 2014, 55, 2–12. [Google Scholar] [CrossRef]
- Zhang, M.; Rao, Z.; Xu, T.; Fang, L. Quantifying the influence of grain boundary activities on Hall-Petch relation in nanocrystalline Cu by using phase field and atomistic simulations. Int. J. Plast. 2020, 135, 102846. [Google Scholar] [CrossRef]
- Sansoz, F.; Ke, X. Hall-Petch strengthening limit through partially active segregation in nanocrystalline Ag-Cu alloys. Acta Mater. 2022, 225, 117560. [Google Scholar] [CrossRef]
- Borovikov, V.; Mendelev, M.I.; King, A.H. Effects of Ag and Zr solutes on dislocation emission from Σ11(332)[110] symmetric tilt grain boundaries in Cu: Bigger is not always better. Int. J. Plast. 2018, 109, 79–87. [Google Scholar] [CrossRef]
- Ming, K.S.; Zhu, Z.W.; Zhu, W.Q.; Fang, B.; Wei, B.Q.; Liaw, P.K.; Wei, X.D.; Wang, J.; Zheng, S.J. Enhancing strength and ductility via crystalline-amorphous nanoarchitectures in TiZr-based alloys. Sci. Adv. 2022, 8, eabm2884. [Google Scholar] [CrossRef] [PubMed]
- Xiao, J.W.; Deng, C. Mitigating the Hall-Petch breakdown in nanotwinned Cu by amorphous intergranular films. Scr. Mater. 2021, 194, 113682. [Google Scholar] [CrossRef]
- Schiøtz, J.; Vegge, T.; Di Tolla, F.D.; Jacobsen, K.W. Atomic-scale simulations of the mechanical deformation of nanocrystalline metals. Phys. Rev. B 1999, 60, 11971–11983. [Google Scholar] [CrossRef]
- Meyers, M.A.; Mishra, A.; Benson, D.J. Mechanical properties of nanocrystalline materials. Prog. Mater. Sci. 2006, 51, 427–556. [Google Scholar] [CrossRef]
- Agnew, S.R.; Elliott, B.R.; Youngdahl, C.J.; Hemker, K.J.; Weertman, J.R. Microstructure and mechanical behavior of nanocrystalline metals. Mater. Sci. Eng. A 2000, 285, 391–396. [Google Scholar] [CrossRef]


| L (kJ/mol) | ρL (g/cm3) | M (g/mol) | Tm (K) | |
|---|---|---|---|---|
| Pure Cu | 15.64 | 7.38 | 63.546 | 1397 |
| MES-Cu | 16.39 | 7.334 | 62.111 | 1699 |
Disclaimer/Publisher’s Note: The statements, opinions and data contained in all publications are solely those of the individual author(s) and contributor(s) and not of MDPI and/or the editor(s). MDPI and/or the editor(s) disclaim responsibility for any injury to people or property resulting from any ideas, methods, instructions or products referred to in the content. |
© 2024 by the authors. Licensee MDPI, Basel, Switzerland. This article is an open access article distributed under the terms and conditions of the Creative Commons Attribution (CC BY) license (https://creativecommons.org/licenses/by/4.0/).
Share and Cite
Guo, F.; Li, C.; Fu, T.; Peng, X. Theoretical Prediction of Strengthening in Nanocrystalline Cu with Multi-Element Grain Boundary Segregation Decoration. Materials 2024, 17, 2504. https://doi.org/10.3390/ma17112504
Guo F, Li C, Fu T, Peng X. Theoretical Prediction of Strengthening in Nanocrystalline Cu with Multi-Element Grain Boundary Segregation Decoration. Materials. 2024; 17(11):2504. https://doi.org/10.3390/ma17112504
Chicago/Turabian StyleGuo, Fuli, Chuanying Li, Tao Fu, and Xianghe Peng. 2024. "Theoretical Prediction of Strengthening in Nanocrystalline Cu with Multi-Element Grain Boundary Segregation Decoration" Materials 17, no. 11: 2504. https://doi.org/10.3390/ma17112504
APA StyleGuo, F., Li, C., Fu, T., & Peng, X. (2024). Theoretical Prediction of Strengthening in Nanocrystalline Cu with Multi-Element Grain Boundary Segregation Decoration. Materials, 17(11), 2504. https://doi.org/10.3390/ma17112504