Article

Experimental Analysis of the Influence of Carrier Layer Material on the Performance of the Control System of a Cantilever-Type Piezoelectric Actuator

Faculty of Mechanical Engineering and Robotics, AGH University of Krakow, al. A. Mickiewicza 30, 30-059 Krakow, Poland
Materials 2024, 17(1), 96; https://doi.org/10.3390/ma17010096
Submission received: 14 November 2023 / Revised: 10 December 2023 / Accepted: 21 December 2023 / Published: 24 December 2023

Abstract

:
The subject of this article is an experimental analysis of the control system of a composite-based piezoelectric actuator and an aluminum-based piezoelectric actuator. Analysis was performed for both the unimorph and bimorph structures. To carry out laboratory research, two piezoelectric actuators with a cantilever sandwich beam structure were manufactured. In the first beam, the carrier layer was made of glass-reinforced epoxy composite (FR4), and in the second beam, it was made of 1050 aluminum. A linear mathematical model of both actuators was also developed. A modification of the method of selecting weights in the LQR control algorithm for a cantilever-type piezoelectric actuator was proposed. The weights in the R matrix for the actuator containing a carrier layer made of stiffer material should be smaller than those for the actuator containing a carrier layer made of less stiff material. Additionally, regardless of the carrier layer material, in the case of a bimorph, the weight in the R matrix that corresponds to the control voltage of the compressing MFC patch should be smaller than the weight corresponding to the control voltage of the stretching MFC patch.

1. Introduction

A piezoelectric actuator is a device that uses the inverse piezoelectric effect to convert electrical energy into mechanical energy: because of this energy conversion, motion of the mechanical component of the actuator is generated [1]. One of the mechanical components used in piezoelectric actuators is the cantilever beam [2]. Two basic types of cantilever beam structure can be distinguished: unimorph and bimorph. The unimorph is a structure in which there is one layer of piezoelectric material and one carrier layer. The bimorph is a structure with two layers of piezoelectric material and one carrier layer [3], or with two layers of piezoelectric material alone [4]. Some researchers use the name “triple-layer” instead of the name “bimorph” [5]. In the unimorph and bimorph structures of the cantilever beam, the layers are usually glued together [6]. In the case of a structure containing a carrier layer, the motion of the cantilever beam is generated by creating tensile or compressive stresses in this carrier layer through the interaction of the piezoelectric layer (unimorph) or two layers (bimorph).
In both the unimorph and the bimorph, the piezoelectric layers can be made of different materials. The piezoelectric materials used can be divided into three main groups: (1) piezoelectric ceramics, usually lead zirconate titanate (PZT) [7]; (2) piezoelectric composites, usually type P1 macro fiber composite (MFC) made from PZT fibers and warp of nonpiezoelectric polymers [8]; and (3) piezoelectric polymers, usually polyvinylidene fluoride (PVDF) [9]. The first fundamental difference in the use of these piezoelectric materials is due to the relationship between energy conversion efficiency and brittleness. Piezoelectric ceramics are characterized by the highest energy conversion efficiency but are at the same time the most fragile compared to composites or polymers [10]. On the other hand, piezoelectric polymers are the most flexible but have the lowest energy conversion efficiency compared to ceramics and composites [9]. Composites have lower energy conversion efficiency than ceramics but are more resistant to destruction due to deformations [11]. The second fundamental difference in the use of these piezoelectric materials in the cantilever beams of the actuators results from the relationship between the direction of the stress generated in the carrier layer by the piezoelectric layer or layers and the direction of polarization of the piezoelectric layer or layers. When piezoelectric ceramics and polymers are used, the polarization direction of the piezoelectric layer or layers is perpendicular to the direction of stress generated in the carrier layer. When the composite MFC type P1 is used, the direction of stress is parallel to the direction of polarization. This difference leads to the fact that the conversion of electrical energy into mechanical energy in actuators with the use of PZT is described by the piezoelectric coefficient d31, and in actuators with the use of MFC type P1 by d33. Nguyen et al. [12] also noticed that MFC has better dynamic actuation than the bulk PZT type for the range of high frequency.
The carrier layer of the cantilever beam in piezoelectric actuators is made of materials that can be divided into two main groups: (1) metals, and (2) composites. The metals used in the cantilever structure are primarily aluminum alloys [13], brass [14], beryllium [15], and steel [16]. The composite used is primarily glass-reinforced epoxy composite (FR4) [17]. The use of a stiffer material in the carrier layer leads to a decrease in the value of the cantilever beam tip motion generated [18]. The tip motion of the cantilever beam made from aluminum is larger in comparison to the motion of actuators made from steel or copper; however, this difference decreases as the thickness of the carrier layer decreases [19]. In general, for the same geometrical dimension and under the same applied electric field, the lower the stiffness of the material of the carrier layer in the cantilever beam of the piezoelectric actuator, the greater displacements of this cantilever beam tip are generated. On the other hand, the application of a carrier layer with greater stiffness leads to a generation of larger blocking forces [20]. The choice of carrier layer material can also affect other areas of actuator operation [21].
Nowadays, research on control systems of cantilever-type piezoelectric actuators focuses mainly on the compensation of nonlinear phenomena: hysteresis [22] and/or creep [23]. Mathematical models of the aforementioned nonlinear phenomena, proposed by the authors, expand a linear model, which can be lumped [24] or continuous [25]. Continuous models are the direct basis for prototyping control laws, which use state space: LQR [26] and LQG [27]. In published research results, a continuous model is usually constructed for only one selected material of the carrier layer. It should be noted that the influence of the difference between the Young’s modulus of the carrier layer and the piezoelectric layer is considered in energy harvesting models [28].
There are no research results presented in the available literature regarding the influence of the material of the carrier layer on the selection of weights in linear LQR control. Most often, these weights are selected by the trial-and-error method for one selected carrier material. Among the few other methods for one selected carrier material, the following can be distinguished: Ebrahimi-Tirtashi et al. [25] used Bryson’s rule; Wang et al. [26] noticed that the initial values of the weights should be chosen as the desired maximum squared values under the steady states and inputs; Tian et al. [29] proposed a genetic algorithm for weights selection. In this article, an experimental analysis of the impact of the carrier layer material on actuator performance was carried out. Based on the results of laboratory experiments, a modification of Bryson’s rule of weights selection in matrix R was proposed. The modification enabled effective control regardless of the material of the supporting layer, the maximum set value of the actuator displacement, and the duration of this set value at a constant level.

2. Materials and Methods
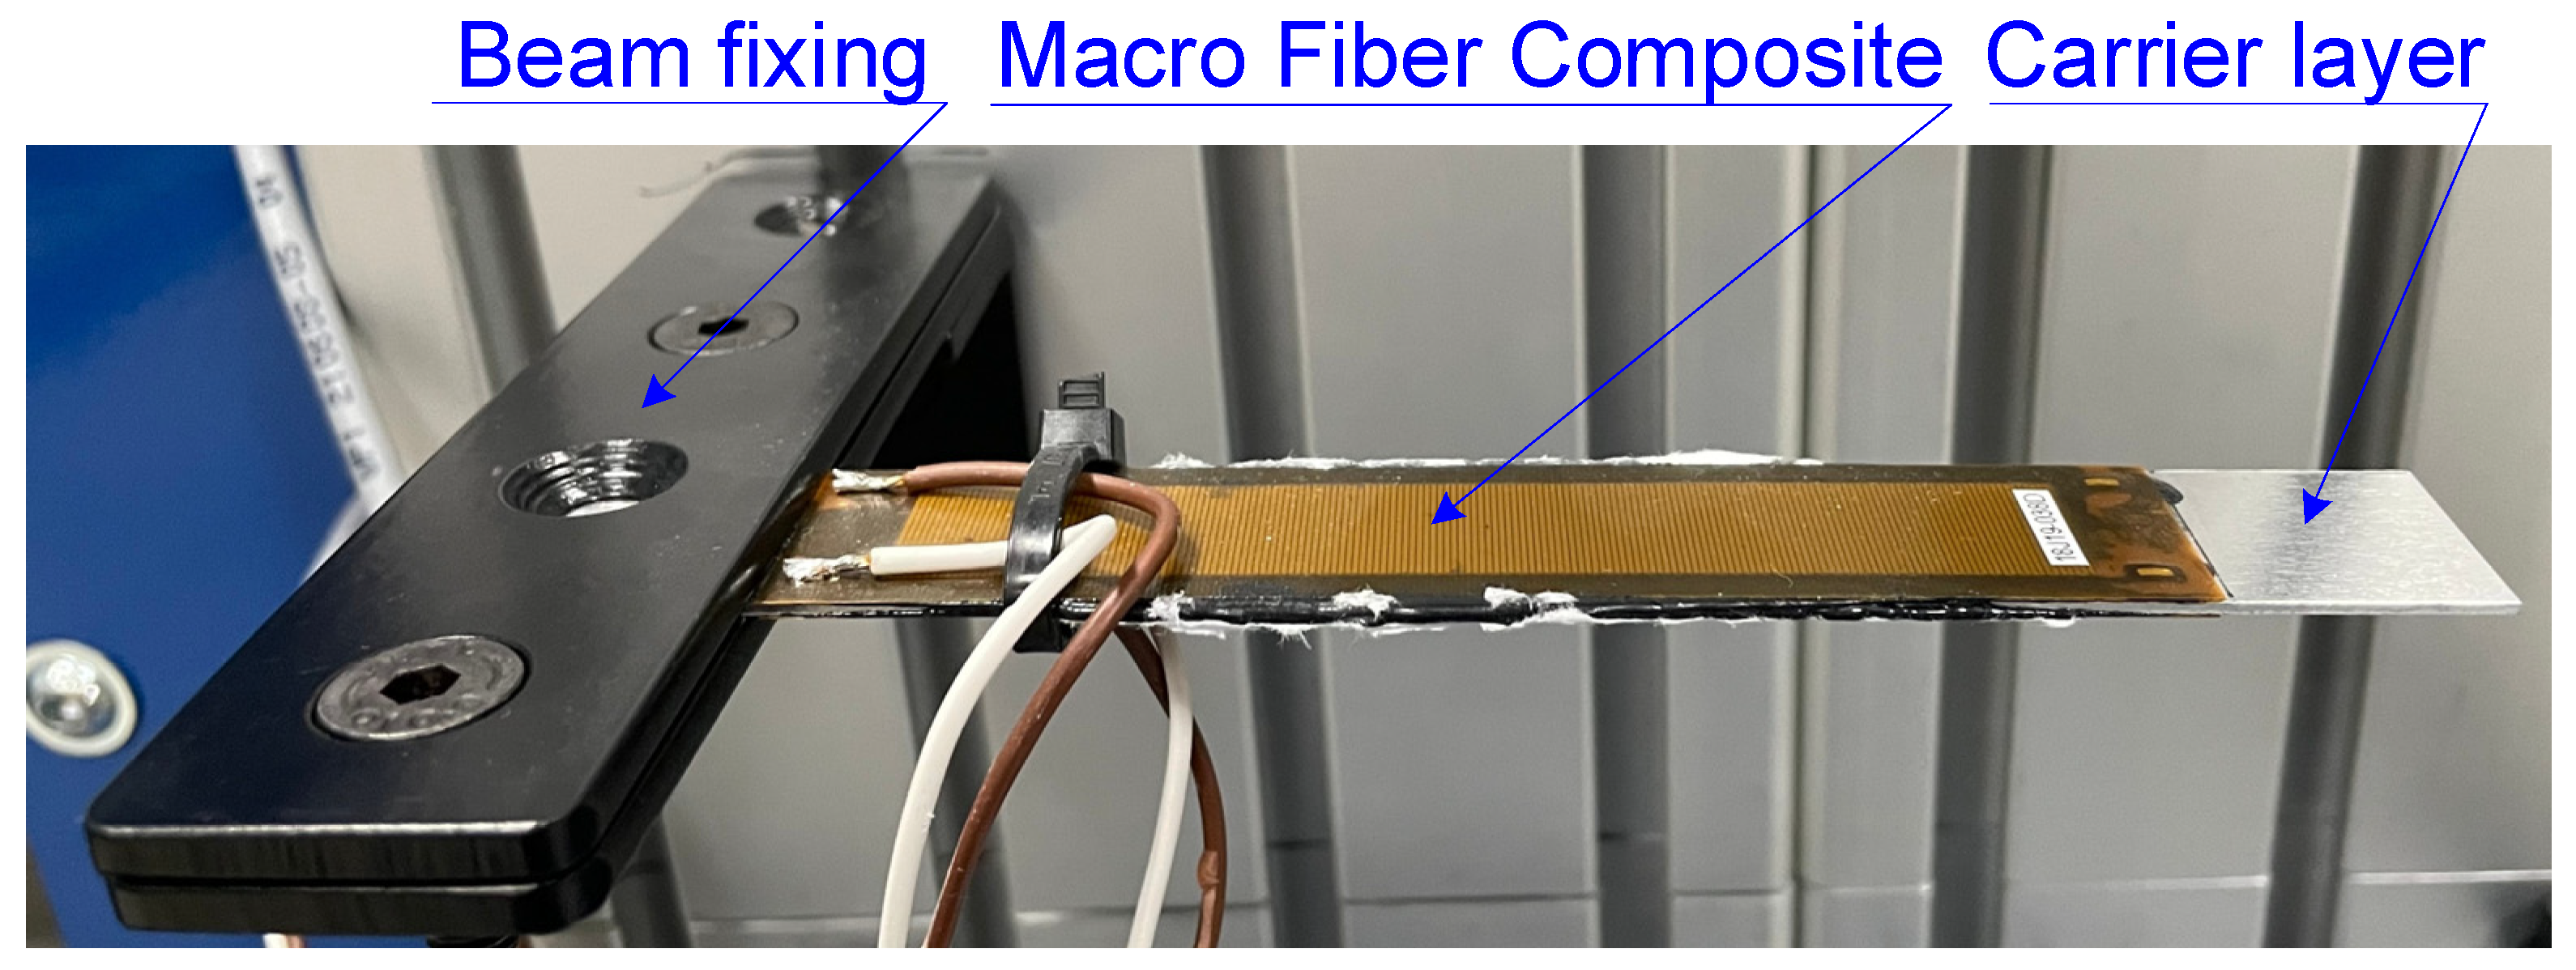
2.1. Materials

Two manufactured piezoelectric cantilever sandwich beams were the research objects. The beams differed in the material of the carrier layer. In the first beam, the carrier layer was made of glass-reinforced epoxy composite (FR4), produced by W.P.P.H.U. HATRON S.C., Kraków, Poland, and in the second beam, it was made of 1050 aluminum. The schema of the cross-section of both cantilever beams is shown in Figure 1 and a view of one of the produced cantilever beams in Figure 2.
Each cantilever beam consisted of one carrier layer and two piezoelectric layers. Patches of macro fiber composite (MFC) type P1 [30], produced by Smart Material Corp., Sarasota, FL, USA, were used as piezoelectric layers. The MFC patches were symmetrically glued to both sides of the carrier layer. Epoxy adhesive DP490 [31], produced by the 3M company, Saint Paul, MN, USA, was used to create a glued connection between the MFC patches and the carrier layer. The geometric properties of the manufactured cantilever are presented in Table 1.

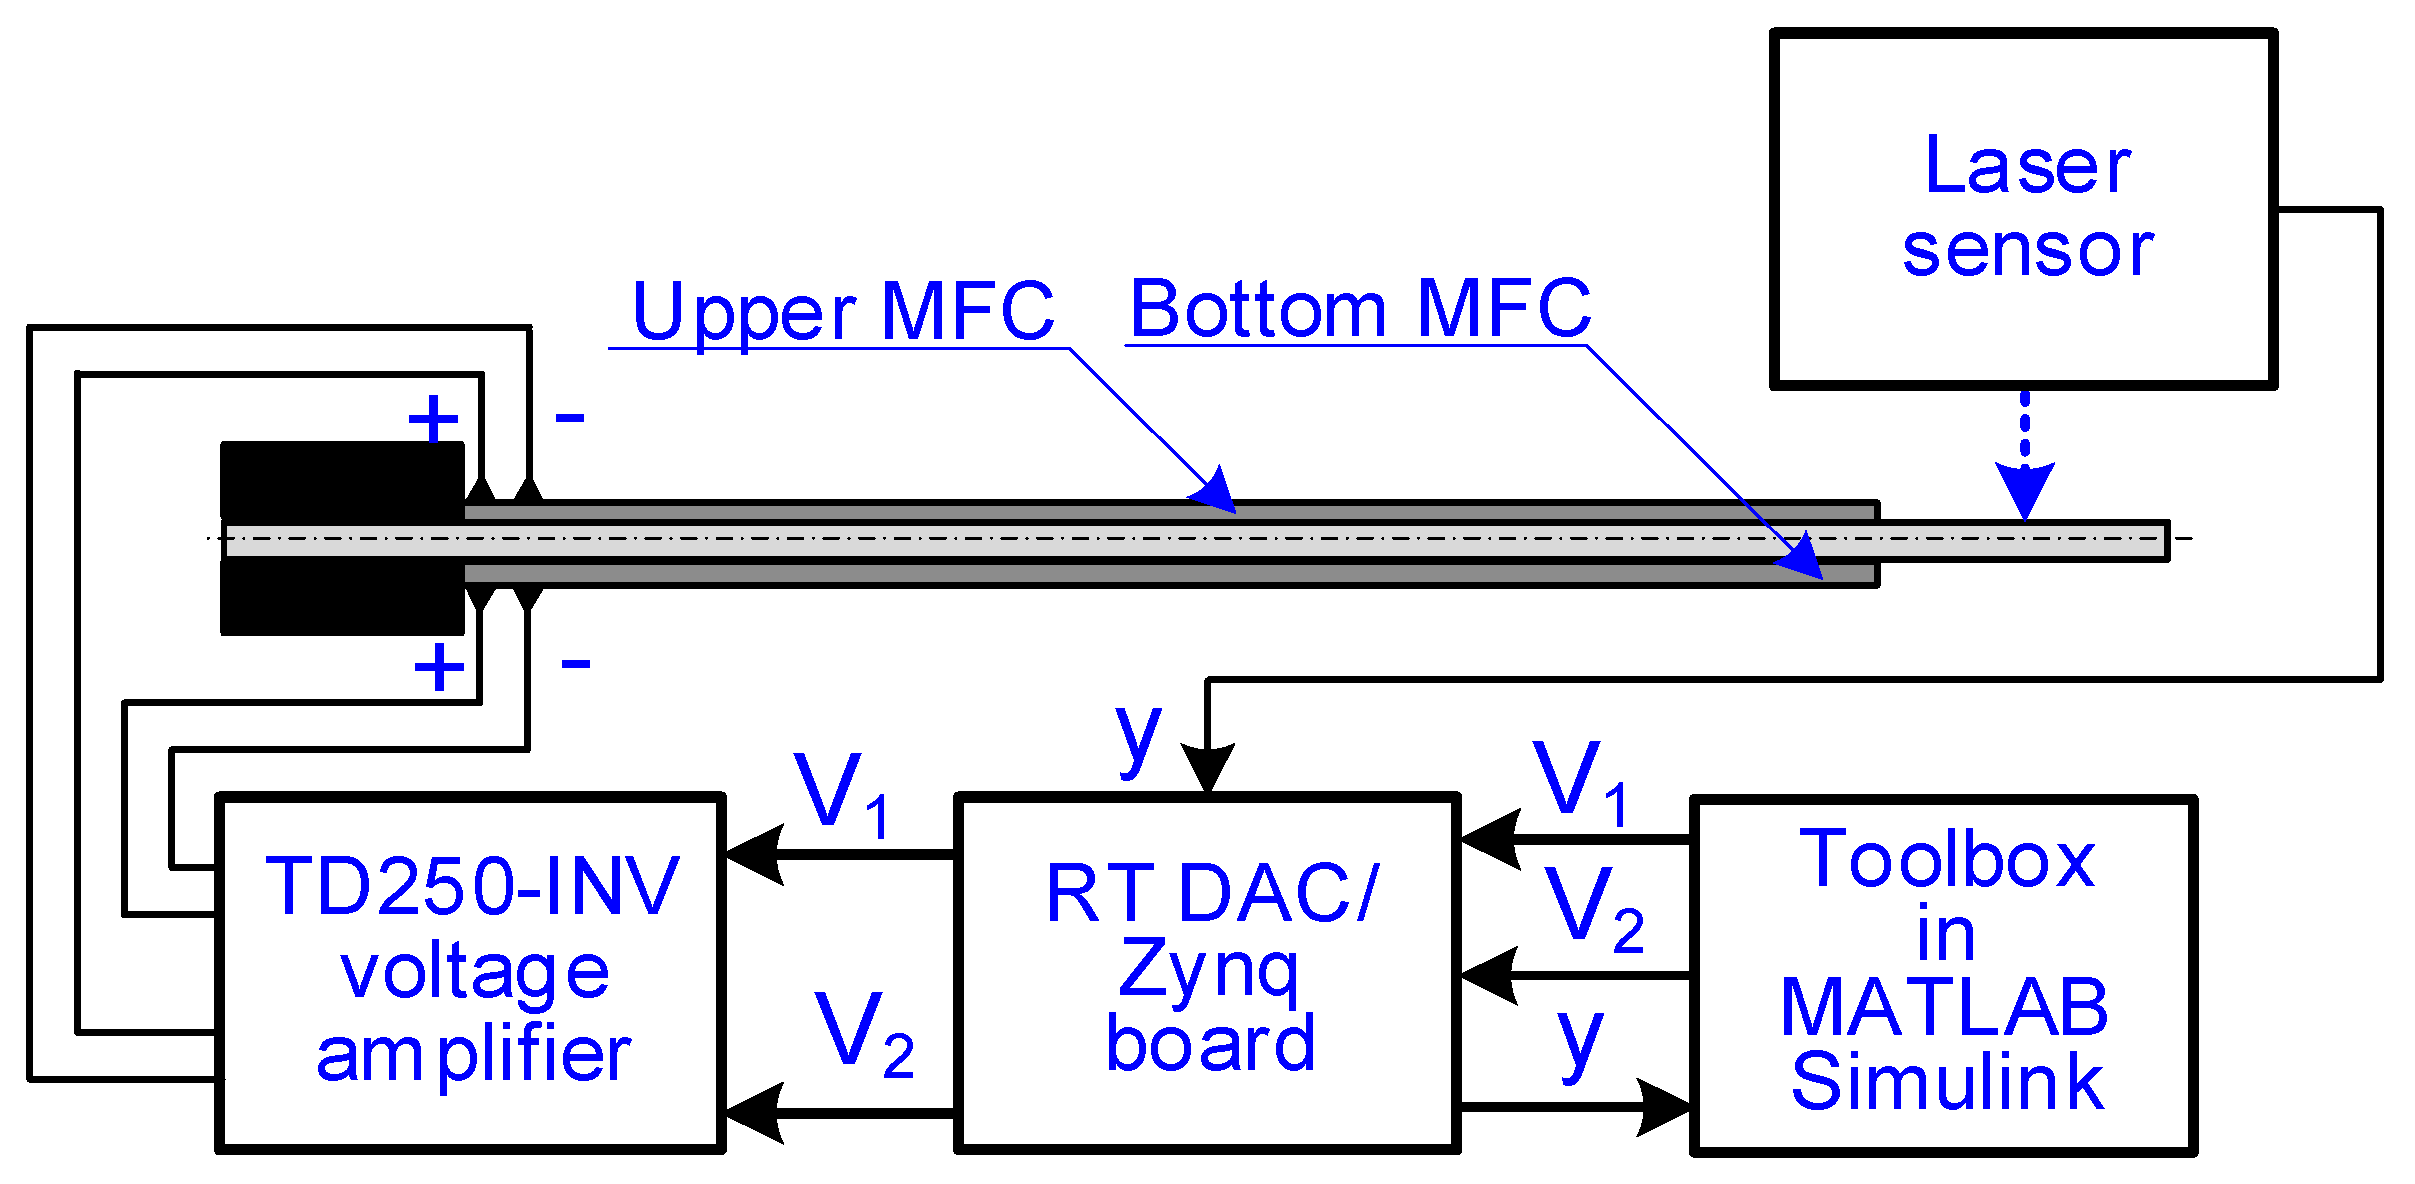
2.2. Laboratory Research Method

The motion of the beam was forced by using a system consisting of a computer with MATLAB Simulink software, an A/D board, and a voltage amplifier. The generation of control voltage waveforms, which were supplied to the MFC patch/patches, was performed in the 2019b version of the MATLAB Simulink program, in which the solver ode1 was used to perform the calculations. A fixed-step equal to 0.001 s was used in these calculations to obtain real-time calculations. The generated voltage waveforms were sent to the TD250-INV voltage amplifier, produced by PiezoDrive company, Shortland, Australia, in real time. The voltages were sent in real time using an RT_DAC/Zynq A/D board, manufactured by INTECO company Kraków, Poland, integrated with a dedicated MATLAB toolbox described in [32]. The TD250-INV voltage amplifier generated from one to two control voltages in the range from −500 V to +500 V. In all laboratory experiments, the displacement of one point in the cantilever beam structure was measured. The distance between the measured point and the beam fixing was 110 mm. The measurement system contained an LG5B65PI laser sensor of displacement, produced by BANNER company, Minneapolis, MN, USA, and the aforementioned RT_DAC/Zynq A/D board, which enabled data acquisition in real time. The LG5B65PI laser sensor had a measurement resolution equal to 40 microns for the measurement at a frequency equal to 450 Hz, and the analog linearity was ±10 microns. The measurement system schema is shown in Figure 3.
The actuator temperature was measured using the Flir E40 thermovision camera during the longest experiments, which lasted 26 s. No observable temperature changes were noted between the beginning and end of the experiment. Temperature changes affect the electrical impedance of the piezoelectric layer [33,34], but the position error of the actuator resulting from warm-up only appears where the actuator is excited for a long time, and even then, this error is very small [35].

2.3. Simulation Research Method

Simulation experiments were carried out in the 2019b version of the MATLAB Simulink program, in which the solver ode23tb was used to perform the calculations. A variable-step was used in these calculations. The ode23tb algorithm is an implementation of the TR-BDF2 method, which is a combination of trapezoidal and second-order backward differentiation [36]. The purpose of the simulations was to determine the displacement of the tip of the cantilever beam caused by an applied control voltage, of which the values were assumed in advance, to one (unimorph) or two MFC patches (bimorph). A variable-step was used in the simulation research because only such a step enabled the simulation of the operation of the actuator described by a mathematical model containing matrixes of very large sizes. The simulations did not attempt to obtain the real-time response of the modeled system.

3. Mathematical Model of Piezoelectric Actuator and Synthesis of Control System

3.1. Piezoelectric Actuator

The displacements of selected points in the cantilever beam structure were calculated using a mathematical model, which was built on the basis of two methods: Finite Element Method (FEM) and State Space Method. FEM was used because a tip mass does not occur [37]. The mathematical model was built in two stages: (1) determination of stiffness matrix Kg and mass matrix Mg for the assumed number of finite elements; and (2) determination of state matrix A, control matrix B, output matrix C, and feed-through matrix D.
The structure of the cantilever beam, which is shown in Figure 1, was divided into 48 finite elements, each of a length equal to 2.5 mm. As a result of this division, 49 nodes were created. A total of 48 nodes had two degrees of freedom, and one node, which was in the beam fixing, had zero degrees of freedom. A motion equation can be given by [25]:
M g d ( t ) + C g d ( t ) + K g d ( t ) = Ε 1 V 1 ( t ) + E 2 V 2 ( t )
where Mg is a global mass matrix (dimensions: 96 × 96 for 48 nodes), Cg is a global damping matrix (dimensions: 96 × 96 for 48 nodes), Kg is a global stiffness matrix (dimensions: 96 × 96 for 48 nodes), E1 (dimensions: 96 × 1 for 48 nodes) and E2 (dimensions: 96 × 1 for 48 nodes) are localization matrixes of forces generated by the upper MFC patch and the bottom MFC patch, V1 and V2 are voltages applied to the upper MFC patch and the bottom MFC patch, and d is a vector of vertical (w) and rotational (φ) displacements: d = [w, φ]T of node. Local mass matrixes Ml and local stiffness matrixes Kl were calculated as follows [26]:
M l = M l c + 2 M l m f c       K l = K l c + 2 K l m f c
where Mlc and Klc are local mass and stiffness matrixes of the carrier layer, and Mlmfc and Klmfc are the local mass and stiffness matrixes of MFC:
M l c = ρ c A c l e 420 156 22 l e 54 13 l e 22 l e 4 l e 2 13 l e 3 l e 2 54 13 l e 156 22 l e 13 l e 3 l e 2 22 l e 4 l e 2   K l c = E c η I c l e 12 6 l e 12 6 l e 6 l e 4 l e 2 6 l e 2 l e 2 12 6 l e 12 6 l e 6 l e 2 l e 2 6 l e 4 l e 2 M l m f c = ρ mfc A m f c l e 420 156 22 l e 54 13 l e 22 l e 4 l e 2 13 l e 3 l e 2 54 13 l e 156 22 l e 13 l e 3 l e 2 22 l e 4 l e 2     K l m f c = E m f c η I m f c l e 12 6 l e 12 6 l e 6 l e 4 l e 2 6 l e 2 l e 2 12 6 l e 12 6 l e 6 l e 2 l e 2 6 l e 4 l e 2
where ρc is the density of the carrier layer, Ac is the cross-section area of the carrier layer, le is the length of the finite element, Ec is Young’s modulus of the carrier layer, Ic is the moment of inertia of the carrier layer, ρmfc is the density of the MFC patch, Amfc is the cross-section area of the MFC patch, Emfc is Young’s modulus of the MFC patch, Imfc is the moment of inertia of the MFC patch, and η is the ratio of the piezoelectric material elastic constant to that constant of the carrier layer material:
η = Y m f c Y c
A global damping matrix was calculated as proportional damping in the Rayleigh form [38]:
C g = α M g + β K g
where α and β are the dimensionless coefficients, which were selected experimentally.
Considering that both the upper MFC and the bottom MFC are equidistant from the neutral axis of the cantilever beam, the bending moment can be calculated in the same way for both MFCs. The bending moment per unit length generated by each MFC patch in the vertical axis (axis 1 in Figure 1) is calculated as follows:
M bi t = γ 1 2 t c r 1 2 t c r + t mfca d 33 a Y 33 a V i t t mfce w mfca y dy = 1 2 γ d 33 a Y mfca V i t t mfce w mfca t c r t mfca + t mfca 2
where γ is the ratio of the smaller Young’s modulus to the larger one for a pair of two materials (the active part of the MFC patch and the carrier layer (ratio Yc/Ymfca for the composite carrier layer and Ymfca/Yc for the aluminum carrier layer)), and tcr is the carrier layer thickness increased by half the thickness of the passive layer in the MFC patch. It was assumed that an equivalent concentrated force is applied, which generates the value of the bending moment calculated according to (6), at the center of gravity of each MFC patch. Therefore, the equivalent concentrated force generated by the MFC patch in the direction of axis 1, acting on the cantilever beam, can be given by
P i ( t ) = M b i ( t ) 0.5 ( l m f c a + l m f c p )
The point of application of the equivalent concentrated force was also assumed at the center of gravity of the MFC patch, which is located at the 20th node (distance 50 mm from beam fixing). The matrixes of forces localization for the upper MFC (E1) and the bottom MFC (E2) [39] are calculated as follows:
E 1 = 1 2 γ d 33 a Y mfca 1 t mfce w mfca t c r t mfca + t mfca 2 Θ 1 × 38 ε 1 Θ 1 × 57 T E 2 = 1 2 γ d 33 a Y mfca 1 t mfce w mfca t c r t mfca + t mfca 2 Θ 1 × 38 ε 2 Θ 1 × 57 T
where ε1 is a coefficient showing the contribution of the stretching MFC in generating the motion of the cantilever beam (it was assumed that the value of this parameter will be 1 in simulation studies), and ε2 is a coefficient showing the contribution of the compressing MFC in generating the motion of the cantilever beam. It was determined in laboratory experiments that for the composite-based actuator ε1 = 1 and ε2 = 0.36, and for the aluminum-based actuator ε1 = 1 and ε2 = 0.38. The material properties used in the simulation tests are presented in Table 2.
Matrixes of forces localization were used to build a state space model, which had a well-known form:
x ( t ) = A x ( t ) + B u ( t ) y ( t ) = C x ( t ) + D u ( t )
where x is a state vector (containing 192 state variables), u is an input vector, and y is an output vector. The matrix dimensions are as follows:
x = d d ˙ 192 × 1 A = Θ 96 × 96 I 96 × 96 M g 1 K g M g 1 C g 192 × 192 B = Θ 96 × 1 Θ 96 × 1 M g 1 E 1 M g 1 E 2 192 × 2 C = Θ 1 × 86 1 Θ 1 × 10⁵ 1 × 192 D = 0 0 1 × 2
An output variable was the 87th state variable, which was a displacement of the 44th node in the cantilever beam structure in the direction of axis 1. The 44th node was located 110 mm from the beam fixing.
Taking into account that measurement data from the laboratory stand are available, an alternative method of modeling the actuator could be data-driven modeling [41].

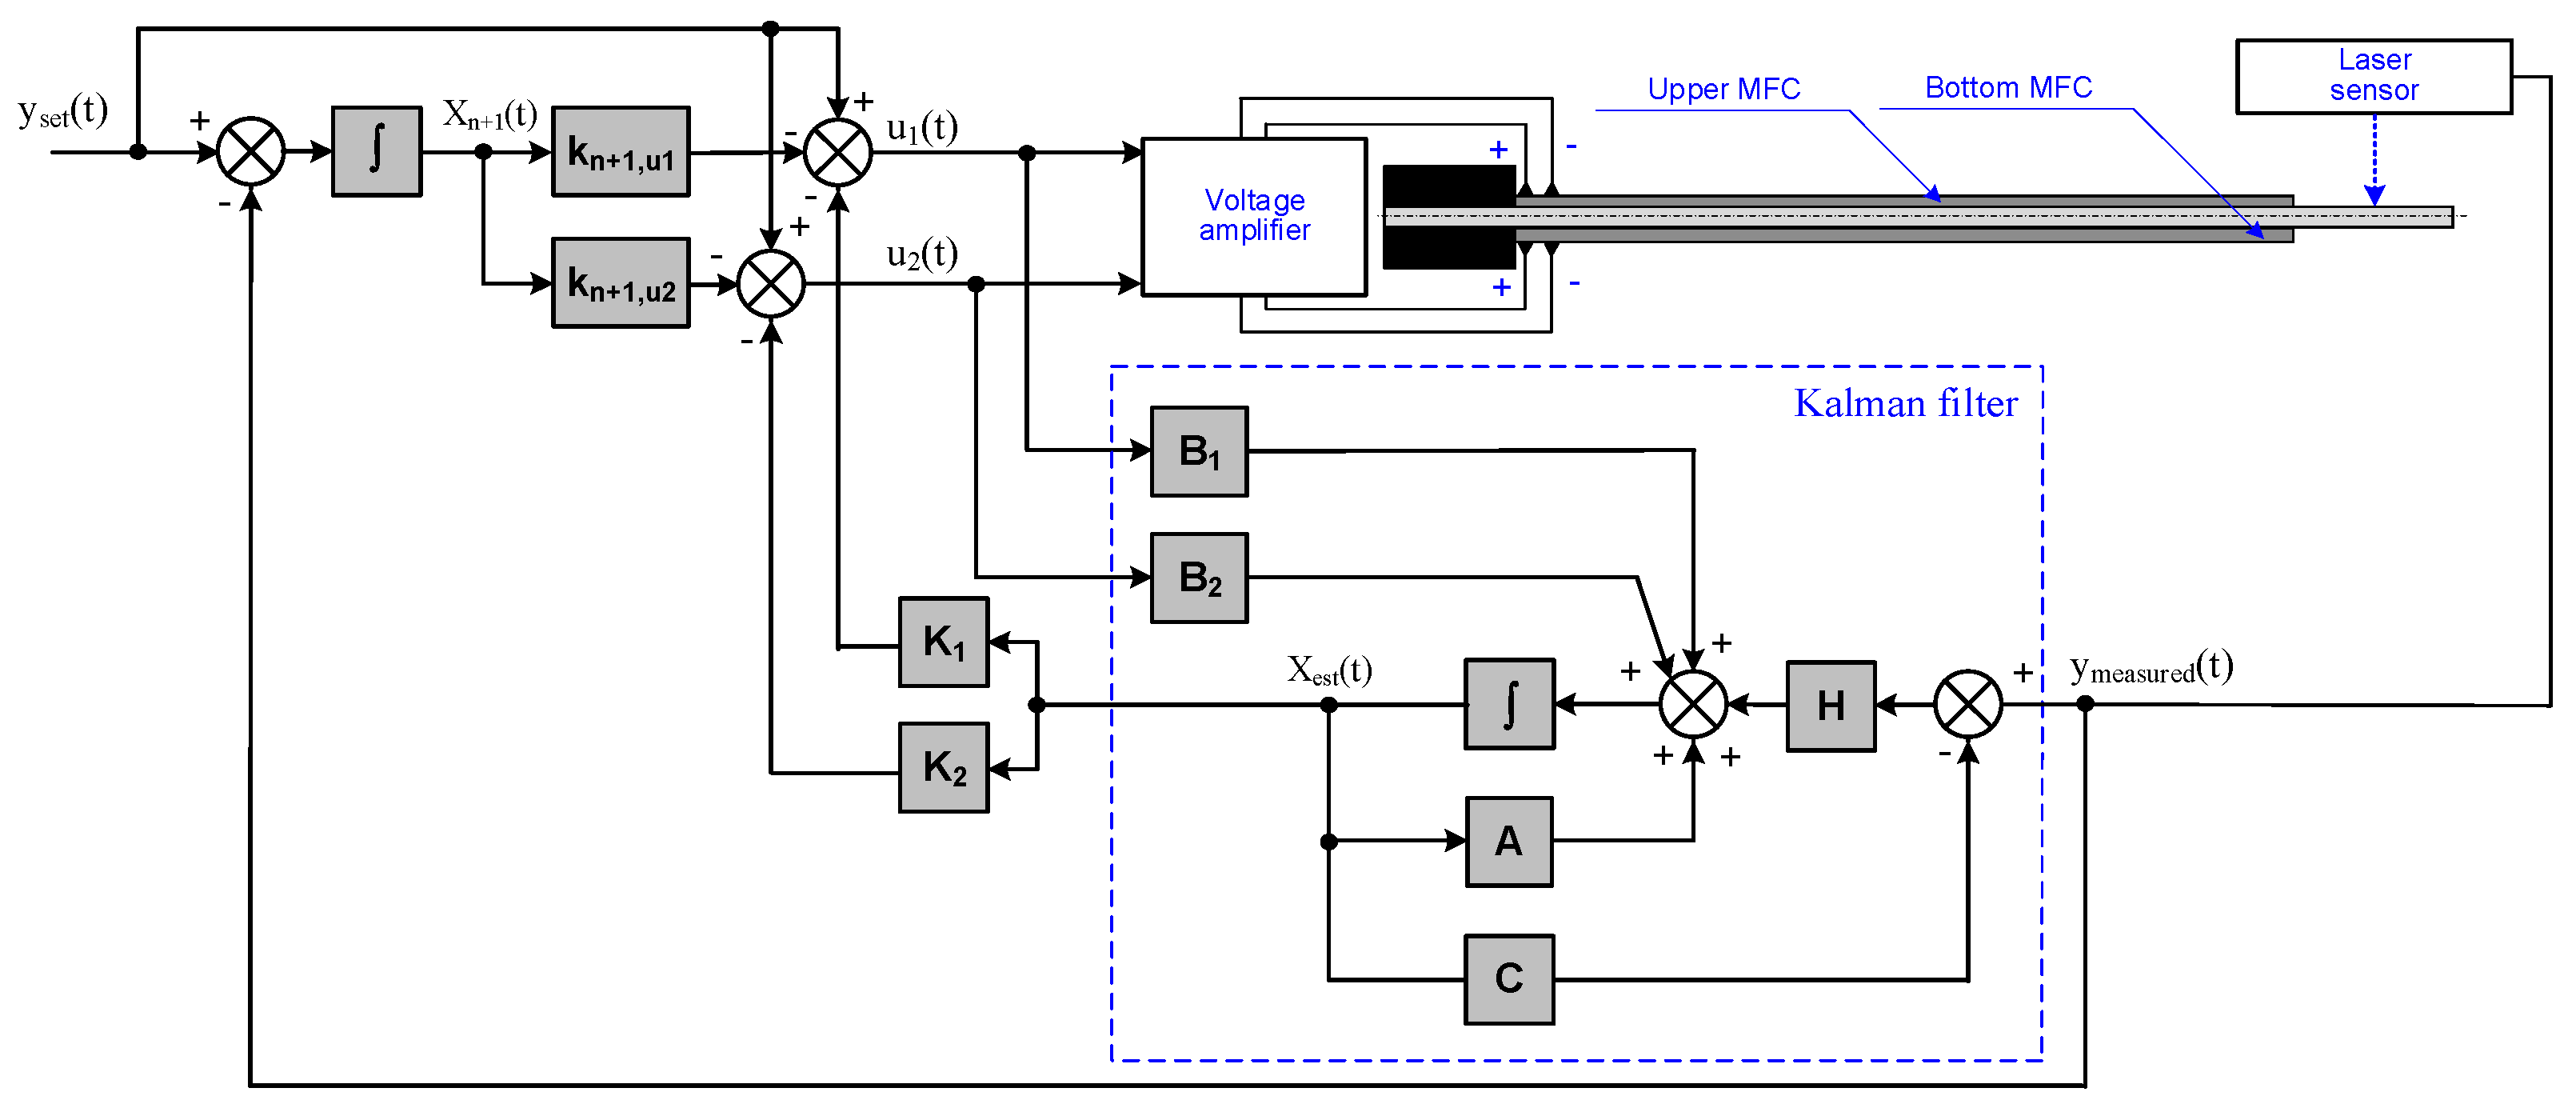
3.2. Synthesis of Control System

A Linear Quadratic Gaussian (LQG) algorithm with integral feedback was used to generate two independent control voltages. The LQG consisted of a linear quadratic regulator (LQR) and a Kalman filter used to estimate the state vector. This algorithm has been extended with integral feedback. A synthesis of the control algorithm was based on the state space model (10). The basic condition for the implementation of the LQR algorithm is full controllability of the controlled object. The actuator described by (10) is fully controllable because there is at least one non-zero element in each row of a controllability matrix Qctrb:
Q c t r b = Φ 1 B
where Φ is the truncated matrix consisting of n eigenvectors. The actuator model in state space (10) was extended by the additional state variable, which is the integral of the difference between the set value and the measured value of the beam tip displacement:
x ˙ ( t ) x ˙ n + 1 ( t ) = A Θ 192 × 1 C 0 x ( t ) x n + 1 ( t ) + B 0 u ( t ) y ( t ) = C 0 x ( t ) x n + 1 ( t ) + D u ( t )
The basic condition for implementation of the Kalman filter is full observability of the controlled object. The actuator described by (10) is fully observable because there is at least one non-zero element in each column of the observability matrix Qobsv:
Q o b s v = C Φ
The estimated state vector based on the Kalman filter is
x ˙ e st ( t ) = A x e s t ( t ) + B u ( t ) + H y m e a s u r e d ( t ) C x e s t ( t ) H D u ( t )
where xest is the estimated state vector and H is the gains matrix:
H = P C T R c 1
where Rc is the covariance matrix of measurement noise and P is the solution of the algebraic Ricatti equation:
A P + P A T P C T R c 1 C P T + Q c = 0
where Qc is the covariance matrix of state noise.
The final control law considering the estimated state vector is
u 1 t = K 1 k n + 1 , u 1 x e s t ( t ) x n + 1 ( t ) + y s e t t u 2 ( t ) = K 2 k n + 1 , u 2 x e s t ( t ) x n + 1 ( t ) + y s e t ( t )
where n is the size of the state vector, K1 and K2 are the matrixes of the state variable gains for u1 and u2, respectively, kn+1,u1 and kn+1,u2 are the gains in the integral feedback for u1 and u2, respectively, and yset is the set value of the actuator tip displacement. The gains K1, K2, kn+1,u1, kn+1,u2 were calculated by the minimization of the expanded quality index:
J = 0 x ( t ) x n + 1 ( t ) T Q x ( t ) x n + 1 ( t ) + u T ( t ) R u ( t ) dt
where Q is the positive definite or semi-definite weight matrix, and R is the positive definite weight matrix. The measurement system schema is shown in Figure 4.

4. Results

Laboratory research included experiments in which the step responses of the unimorph and the bimorph with both a composite and an aluminum carrier layer were measured. The research was divided into two stages: (1) laboratory and simulation research regarding the impact of the carrier layer material on actuator performance and (2) laboratory research regarding the control system of the actuator.

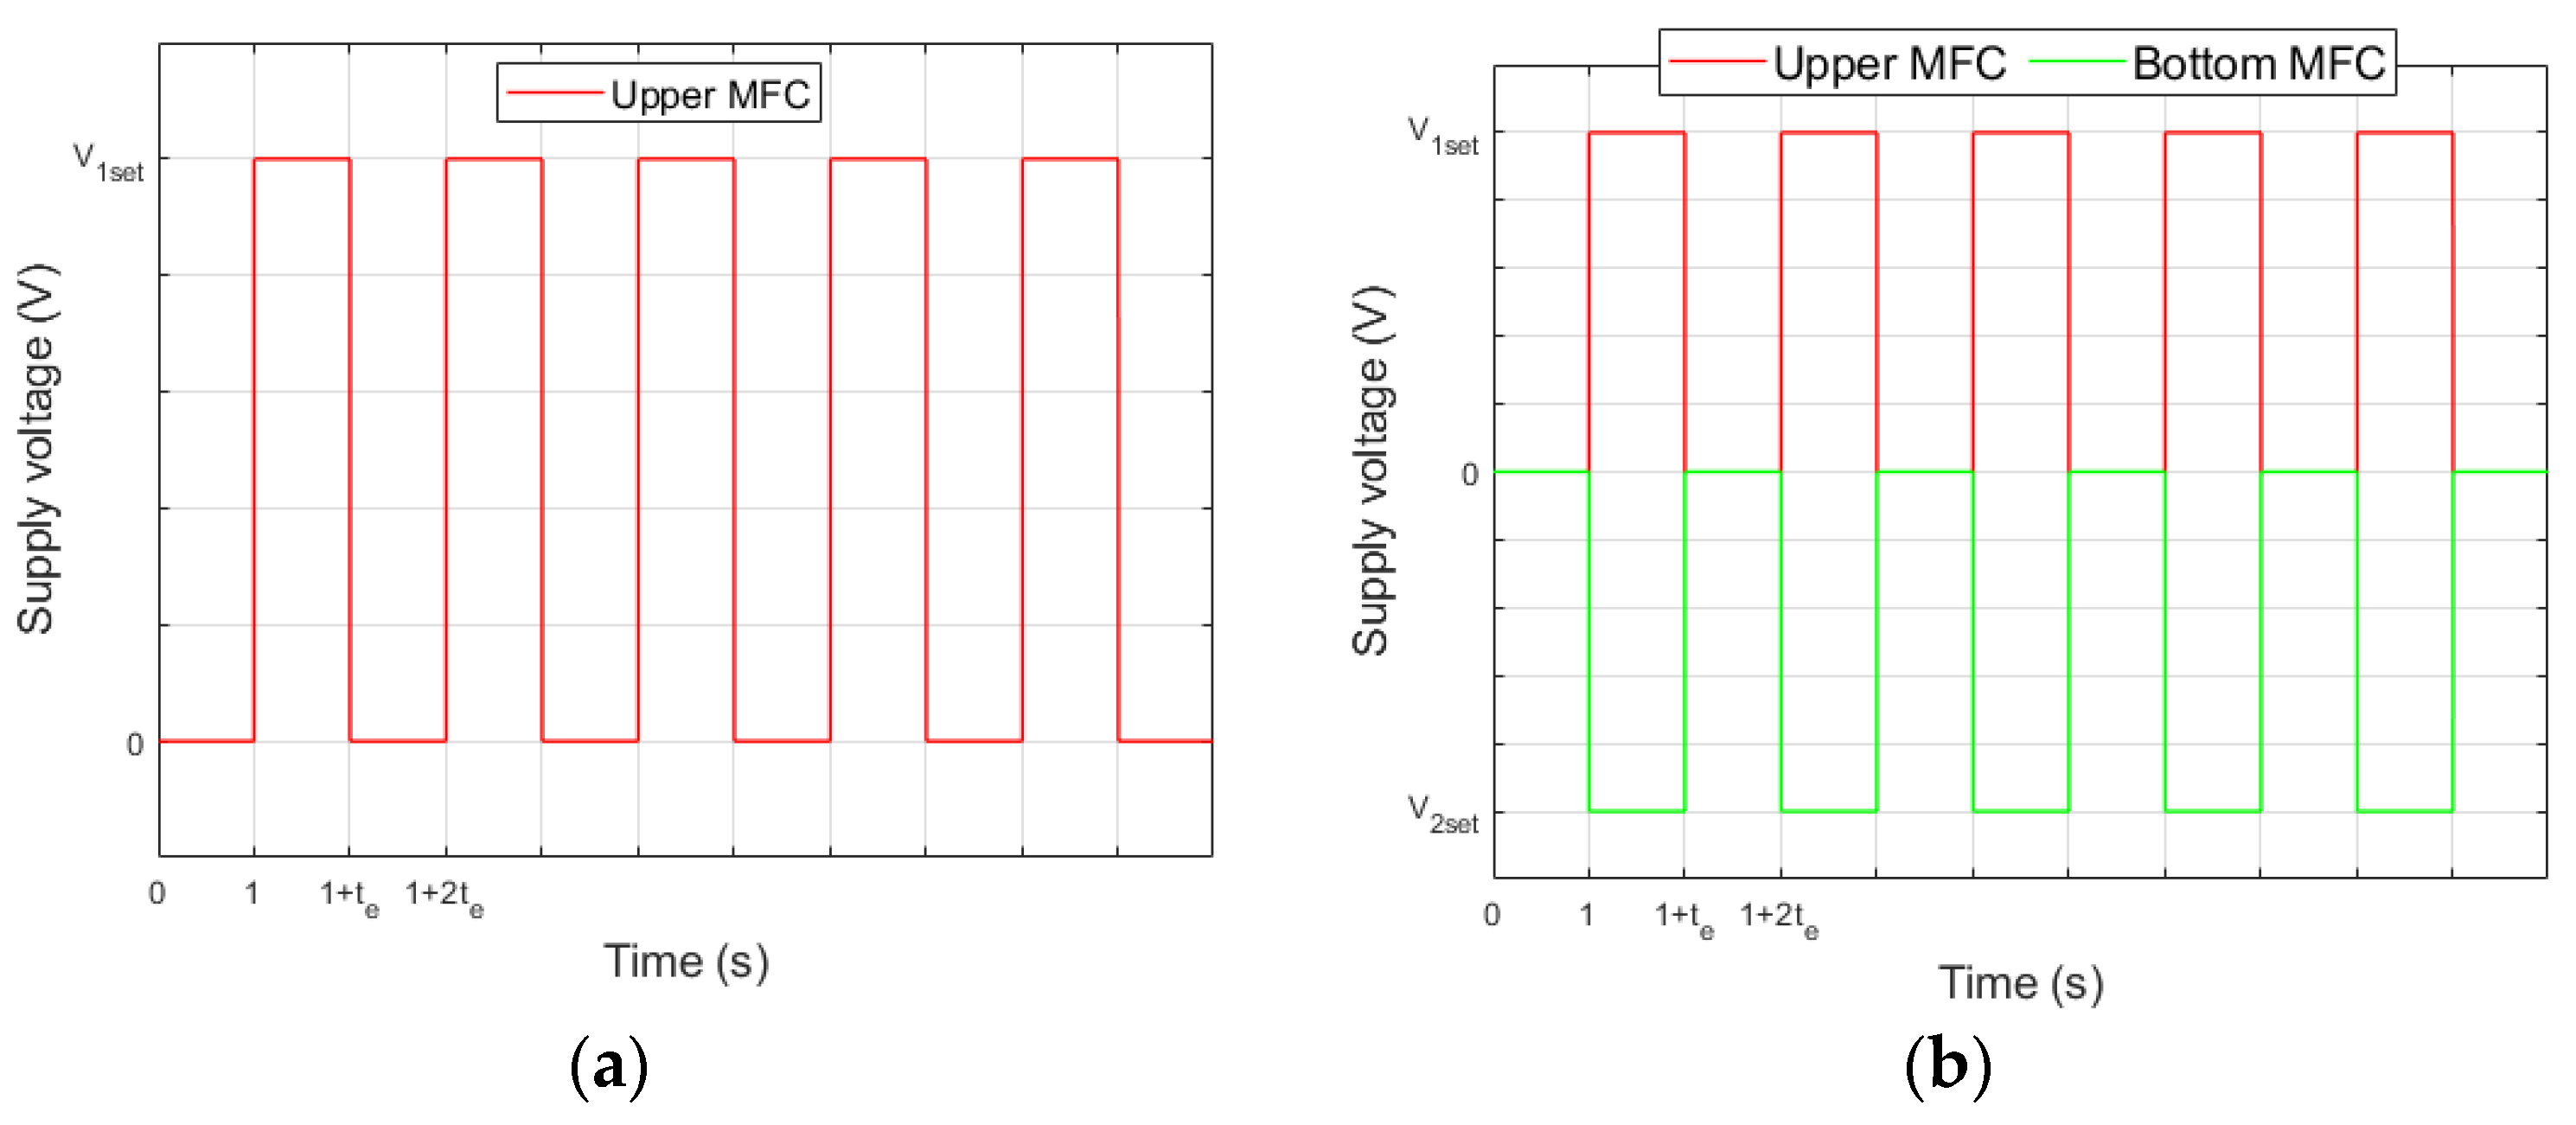
4.1. Description of First Stage of Research

The first stage of research included a determination of the duration of the transition period in the creep process and a determination of the impact of the carrier layer material on actuator performance. To determine the duration of the transition period in the creep process, step responses were measured. The measurement was performed for the spike of voltage V1 or simultaneous spikes of voltages V1 and V2 from 0 to the set value. The spike in voltage or voltages started in the first second and lasted for 2 s. The experiment conditions for both composite-based and aluminum-based actuators are presented in Table 3.
To determine the impact of carrier layer material on actuator performance, the supply voltage of the upper MFC patch was increased from 0 to the set value (both for unimorph and bimorph) and the simultaneous supply voltage of the bottom MFC patch was decreased from 0 to the set value (only for bimorph). The supply voltage waveforms are shown in Figure 5 (te is the duration time of the voltage spike). It should be noted that the upper MFC generated tensile stresses above the neutral axis (Figure 1) in the cantilever beam in both the unimorph and the bimorph. In contrast, the bottom MFC generated compressive stresses below the neutral axis in the bimorph.
Five spikes of supply voltage V1 for the unimorph as well as five spikes of V1 and simultaneous V2 for the bimorph were generated. The experiment conditions for both composite-based and aluminum-based actuators are presented in Table 4.

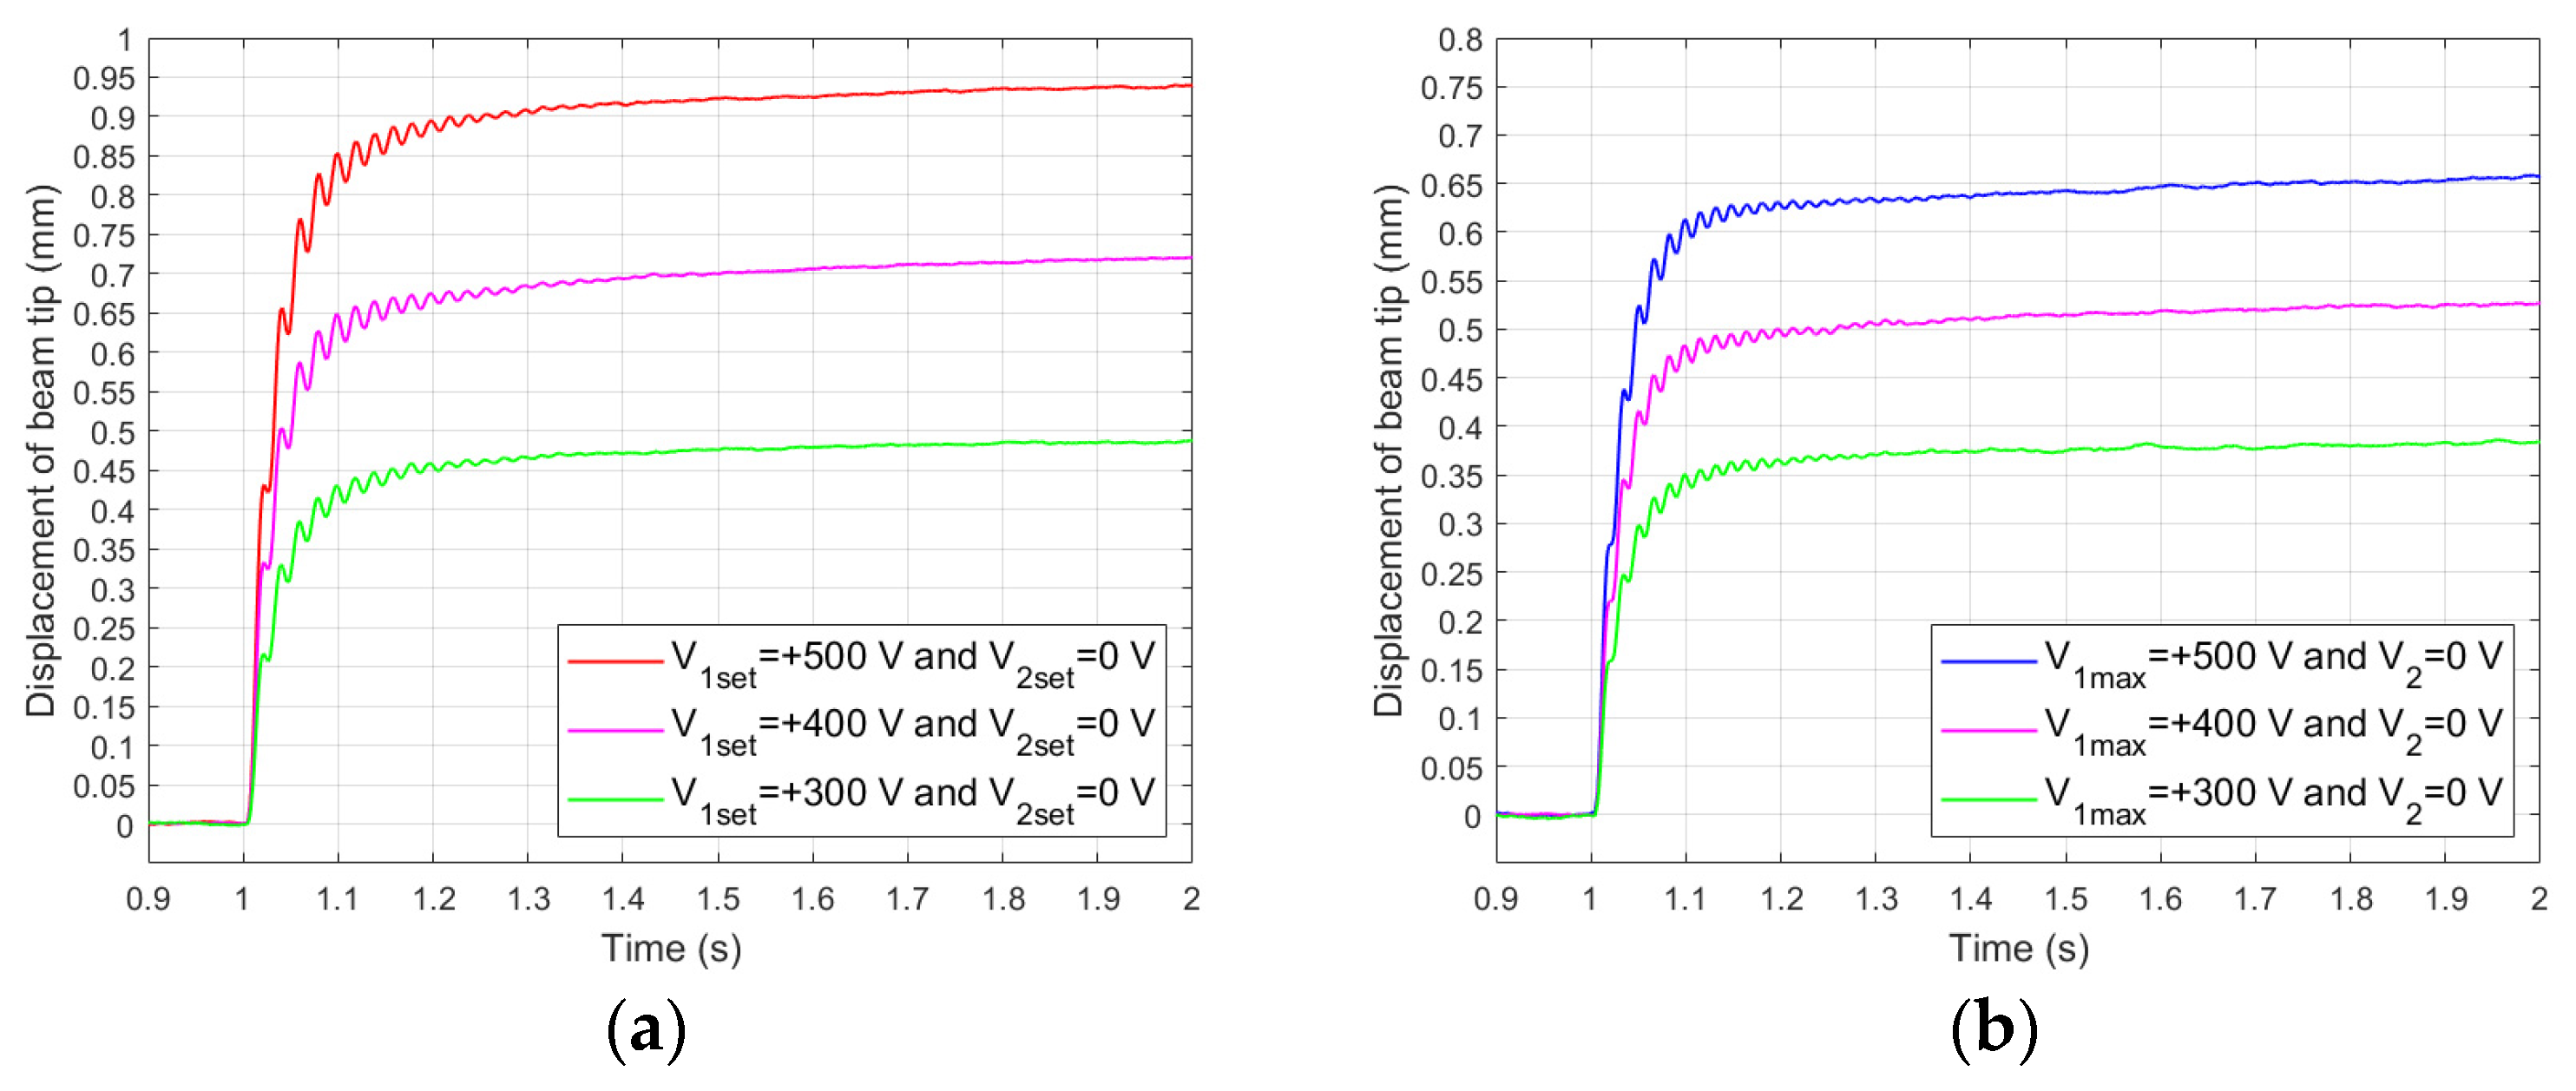
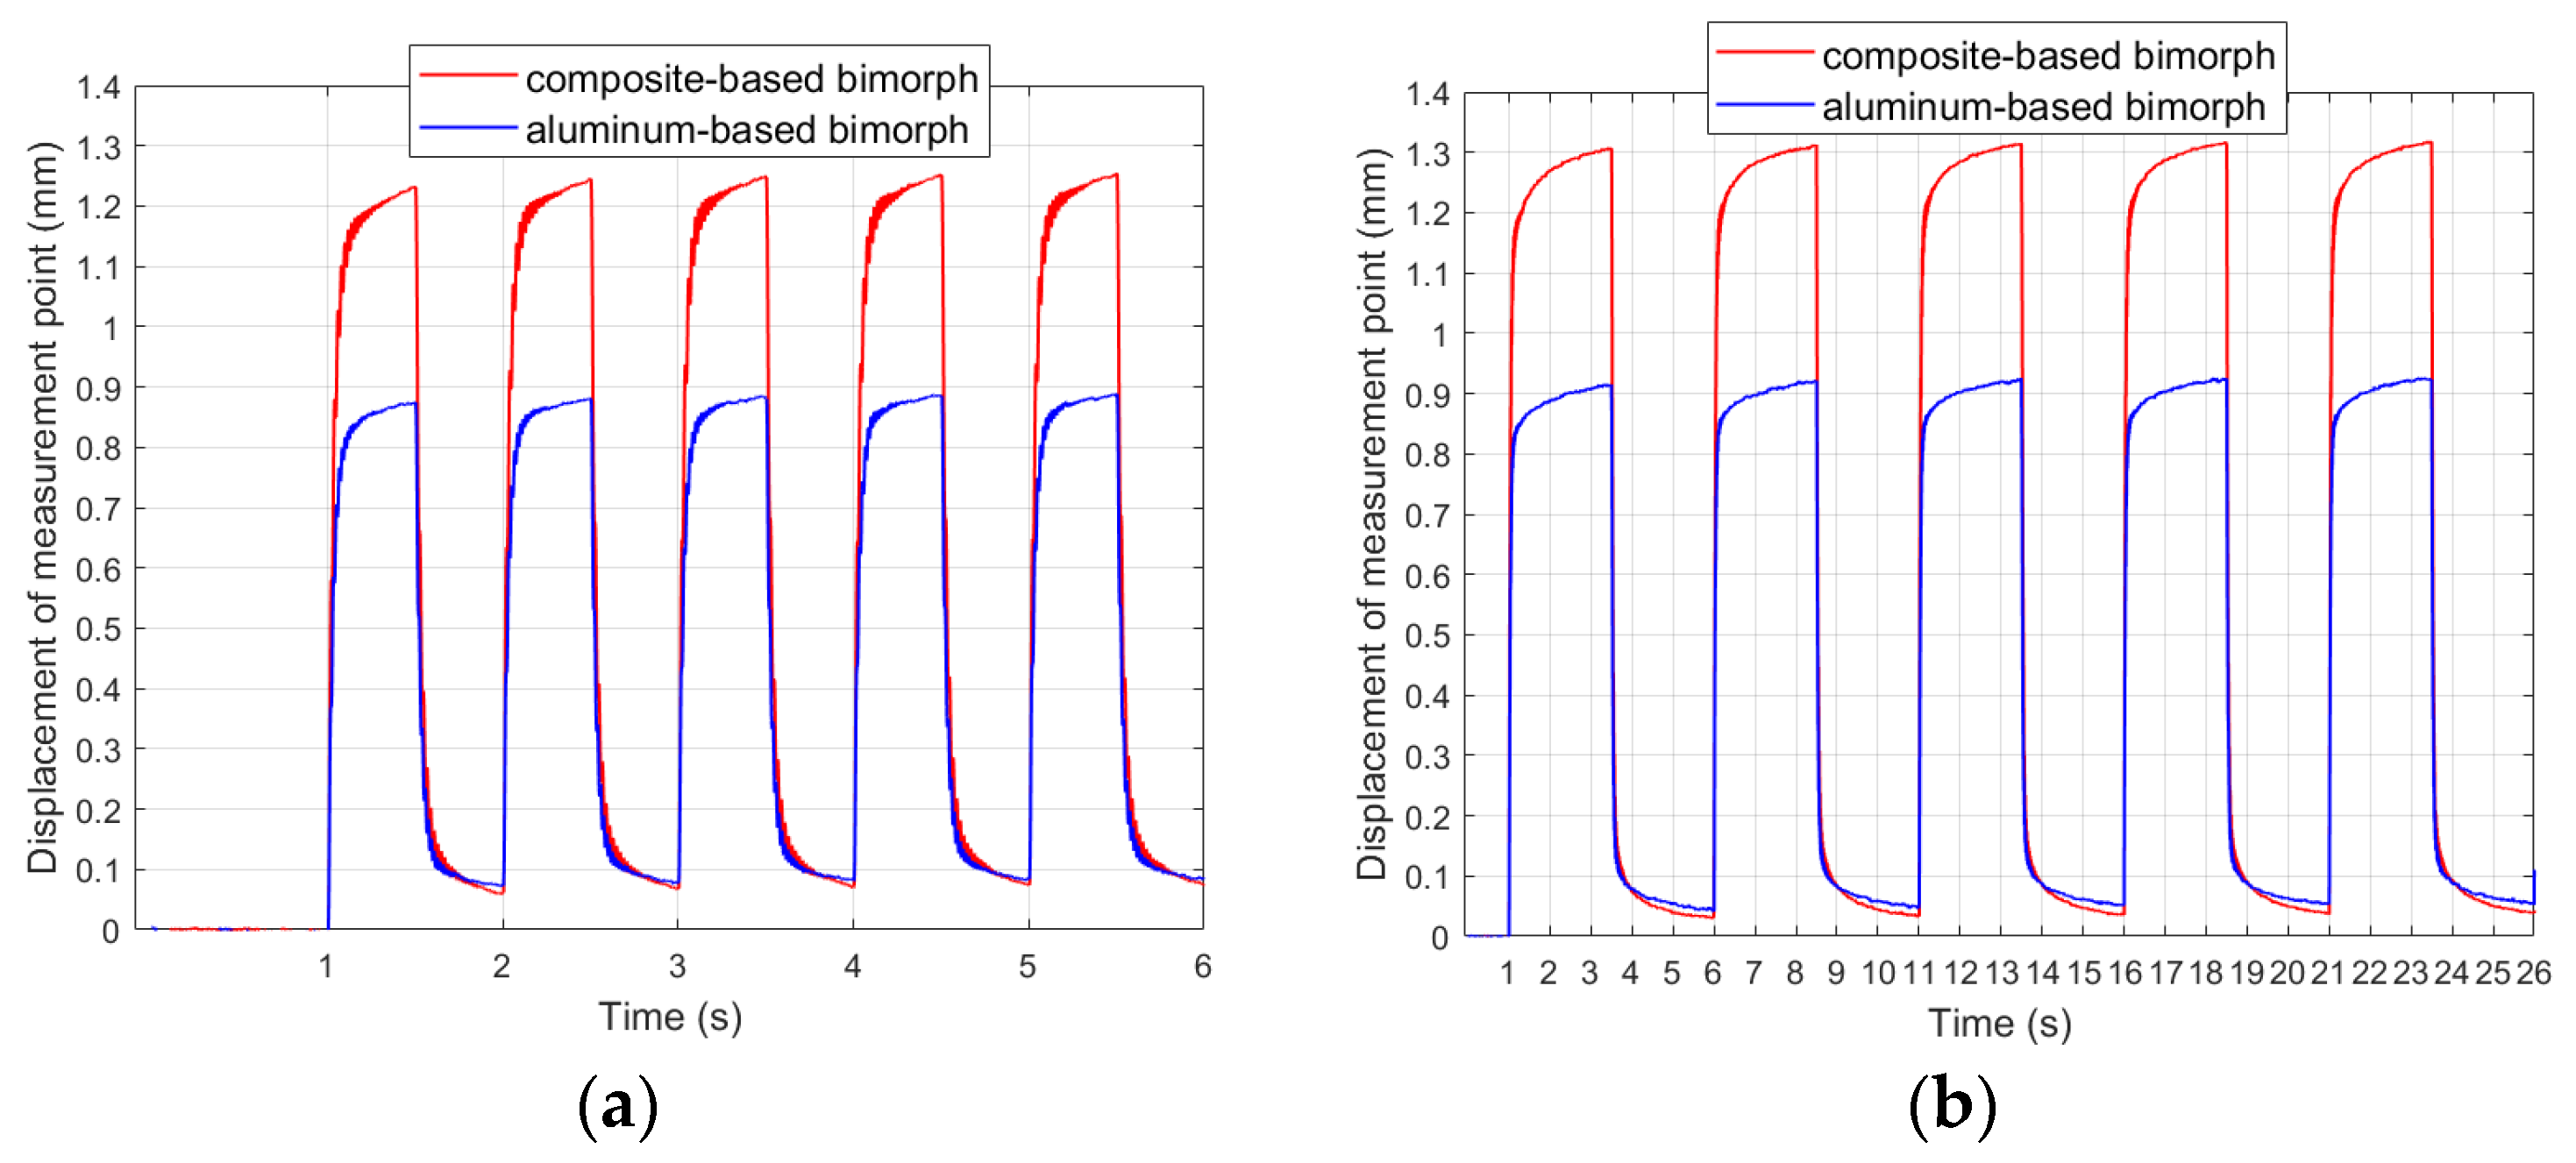
4.2. Results in First Stage of Research

Figure 6 shows the comparison of step responses obtained in laboratory experiments for both the composite and the aluminum carrier layer. In general, the duration of the transition periods is approximately the same for both the unimorph and the bimorph, as well as for the composite and aluminum carrier layers. It can be assumed that the duration of the transition periods does not exceed 0.3 s (from 1 to 1.3 s).
The creep process itself, however, varied depending on whether there was a composite or aluminum carrier layer. The percentage changes in the beam tip displacement in time from 1.3 s to 2 s are shown in Figure 7.
The actuator containing a composite carrier layer exhibited significantly larger creep-induced displacements in comparison to the actuator containing an aluminum carrier layer.
Figure 8 shows the comparison of results obtained in laboratory experiments no. 7 and no. 11 for both composite-based and aluminum-based actuators.
The first observation was that there were larger displacements of the composite-based actuator compared to the aluminum-based actuator, which is consistent with the observations of other researchers regarding the influence of stiffness on the achieved displacements [18]. In experiment no. 7, the average displacement of the actuator containing an aluminum carrier layer was 70.3% of the displacement of the actuator containing a composite carrier layer, and it was 70.7% in experiment no. 11. Figure 9 shows the comparison of the results obtained in laboratory experiments no. 22 and no. 26 for bimorphs containing a composite or aluminum carrier layer.
The composite-based actuator achieved larger displacements than the aluminum-based actuator. This difference was approximately constant for different time durations of the applied voltage spike. The average displacement of the aluminum-based actuator was 70.7% of the displacement of the composite-based actuator in experiment no. 22 and was 68.8% in experiment no. 26. On this basis, the ε2 coefficient, which is needed in the mathematical model (Section 3.1), was determined: ε2com = 0.367 for the composite carrier layer and ε2alu = 0.388 for the aluminum carrier layer.
In Figure 8 and Figure 9 it can be noticed that the actuator does not return to its initial position after the voltage spike stops. This phenomenon occurs regardless of the voltage value and the duration of the voltage spike. This is due to the phenomenon of hysteresis. Figure 10 shows the ratios of the initial positions of the composite-based actuators to the maximum displacement of these actuators.
In general, the position in the interval among voltage spikes (initial position) becomes a smaller and smaller part of the maximum actuator displacement as the duration of the voltage spike increases. Therefore, it can be concluded that changes in the initial position occur at a slightly slower rate than changes in the maximum position of the actuator. The initial position is, on average, from 4.69% to 6.07% of the maximum position in the case of the unimorph and from 5.18% to 5.79% in the case of the bimorph. It can be assumed that the initial position before the next voltage spike is linearly proportional to the maximum displacement of the actuator caused by the previous voltage spike. On this basis, the values of the new coefficient θ were determined for each condition, which specify linear correction of the simulated voltage values applied to the upper and bottom MFCs in the intervals between voltage spikes compared to laboratory values: for the unimorph, instead of V1 = 0, it should be V1= θV1set, and for the bimorph, instead of V1 = 0, it should be V1= θV1set and instead of V2 = 0, it should be V2= θV2set. A similar analysis was performed for the actuator that contains an aluminum carrier layer (Figure 11). Also, for such actuators, the initial position is an approximately constant part of the maximum position. The initial position is, on average, from 5.35% to 5.75% of the maximum position in the case of the unimorph, and from 5.94% to 6.57% in the case of the bimorph. Similarly, for the composite layer, the initial position before the next voltage spike is linearly proportional to the maximum displacement of the actuator caused by the previous voltage spike. On this basis, the coefficient values of coefficient θ were determined for each condition, which specify linear correction of the simulated voltage values applied to the upper and bottom MFCs in the intervals between voltage spikes compared to laboratory values: for the unimorph, instead of V1 = 0, it should be V1= θV1set, and for the bimorph, instead of V1 = 0, it should be V1 = θV1set and instead of V2 = 0, it should be V2 = θV2set.
To obtain simulation results consistent with the laboratory results, two more significant corrections were introduced to the linear mathematical model in comparison to models known from the literature. The first of these corrections was to consider the difference between the Young’s modulus of the piezoelectric material and the Young’s modulus of the carrier layer material. The value of the generated bending moment depends on the ratio between these Young’s moduli. This relationship was introduced by using the γ coefficient in (8). This coefficient made it possible to adapt the linear model to the materials of the carrier layer, which differ in the value of Young’s modulus. The second correction also concerned the generation of the bending moment: the thickness of only the piezoelectric fiber in the MFC patch was used in the model. Other researchers have used the thickness of the whole MFC patch [42] or half the thickness of the whole MFC patch [43]. A comparison of the results obtained in laboratory tests with the simulation results obtained on the basis of the modified linear model presented in Section 3.1 is shown in Figure 12 and Figure 13.
The introduction of the first correction to the mathematical model makes it possible to adapt this model to various materials of the carrier layer. On the basis of the research, it was noticed that compliance of the simulation results with laboratory results, for the same model in the state space but for different materials of the carrier layer, can be achieved through this correction of the bending moment calculation. The introduction of the second correction allows the calculation of the bending moment, which is more consistent with the generated bending moment in the actuator beam.

4.3. Description of Second Stage of Research

The second stage of research included a determination of the impact of the material properties of the carrier layer on the weights in the quality index in the LQG control algorithm. To reduce the computational cost in the control system in the laboratory stand, the model in state space (10) was reduced to the first mode. For this purpose, the nodal displacements vector was transformed into a reduced vector:
d = Φ m κ
where Φm is the truncated matrix and κ is the modal coordinate vector. The modal matrixes for first mode are as follows:
K g m = Φ m 1 T K g Φ m 1 M g m = Φ m 1 T M g Φ m 1 C g m = Φ m 1 T C g Φ m 1 E 1 m = Φ m 1 T E 1 E 2 m = Φ m 1 T
where Φm1 is the truncated matrix for the first mode. The model in the state space for the first mode is as follows:
x m = κ κ ˙ 2 × 1 A m = 0 1 M g m 1 K g m M g m 1 C g m 4 × 4 B m = 0 0 M g m 1 E 1 m M g m 1 E 2 m 4 × 2 C m = φ 87 0 D m = 0 0
where φ87 is 87th element of the truncated matrix Φm. The matrixes Am, Bm, Cm, and Dm were introduced to Equations (12) and (14)–(18) in the laboratory research.
The waveforms of the set value of the actuator tip displacement are shown in Figure 14 (te is the duration time of set value spike) for both the unimorph and bimorph actuators.
The first problem was to determine the set value of the actuator displacement (yset) that can be achieved for the maximum (minimum) value of the control voltage without occurrence of displacement caused by the creep phenomenon. The hardware conditions, which are described in Section 2.2, showed that the maximum and minimum control voltage values were +500 V and −500 V, respectively. Values of yset corresponding to ±500 V were determined experimentally based on the laboratory results, which are presented in Figure 6. On the basis of results presented in Figure 6, yset values corresponding to ±400 V and ±300 V were also read. In this way, three values of yset were established. In addition to these, one additional smaller value of yset was established. The experiment conditions are presented in Table 5.
In the mathematical model (6–10) that was used to prototype control voltages u1 and u2, the values of the coefficients γ, ε1, ε2com and ε2alu were equal to 1.

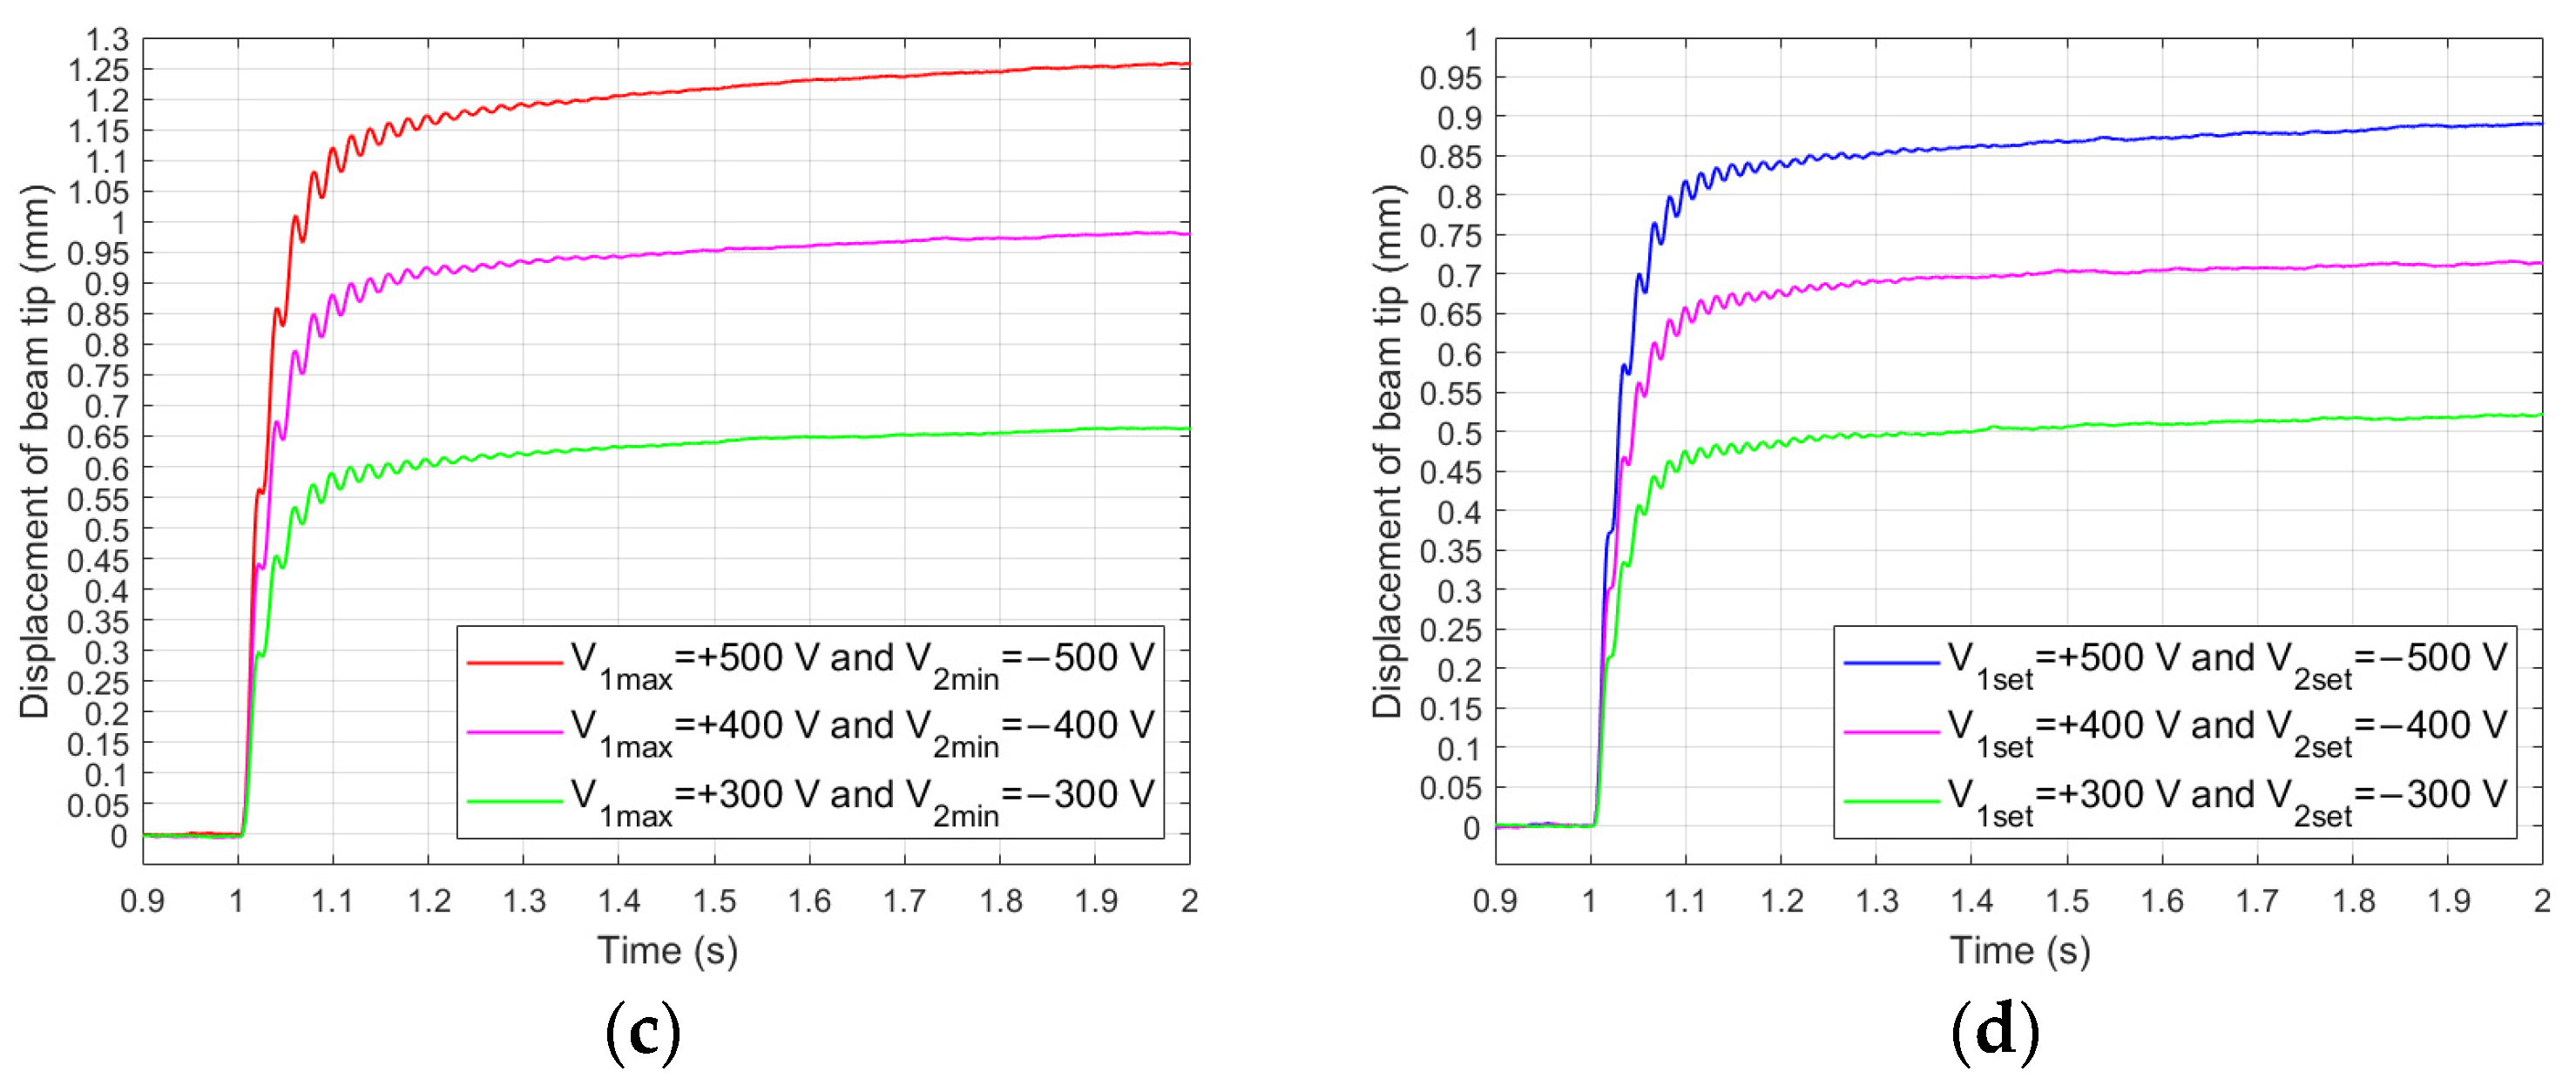
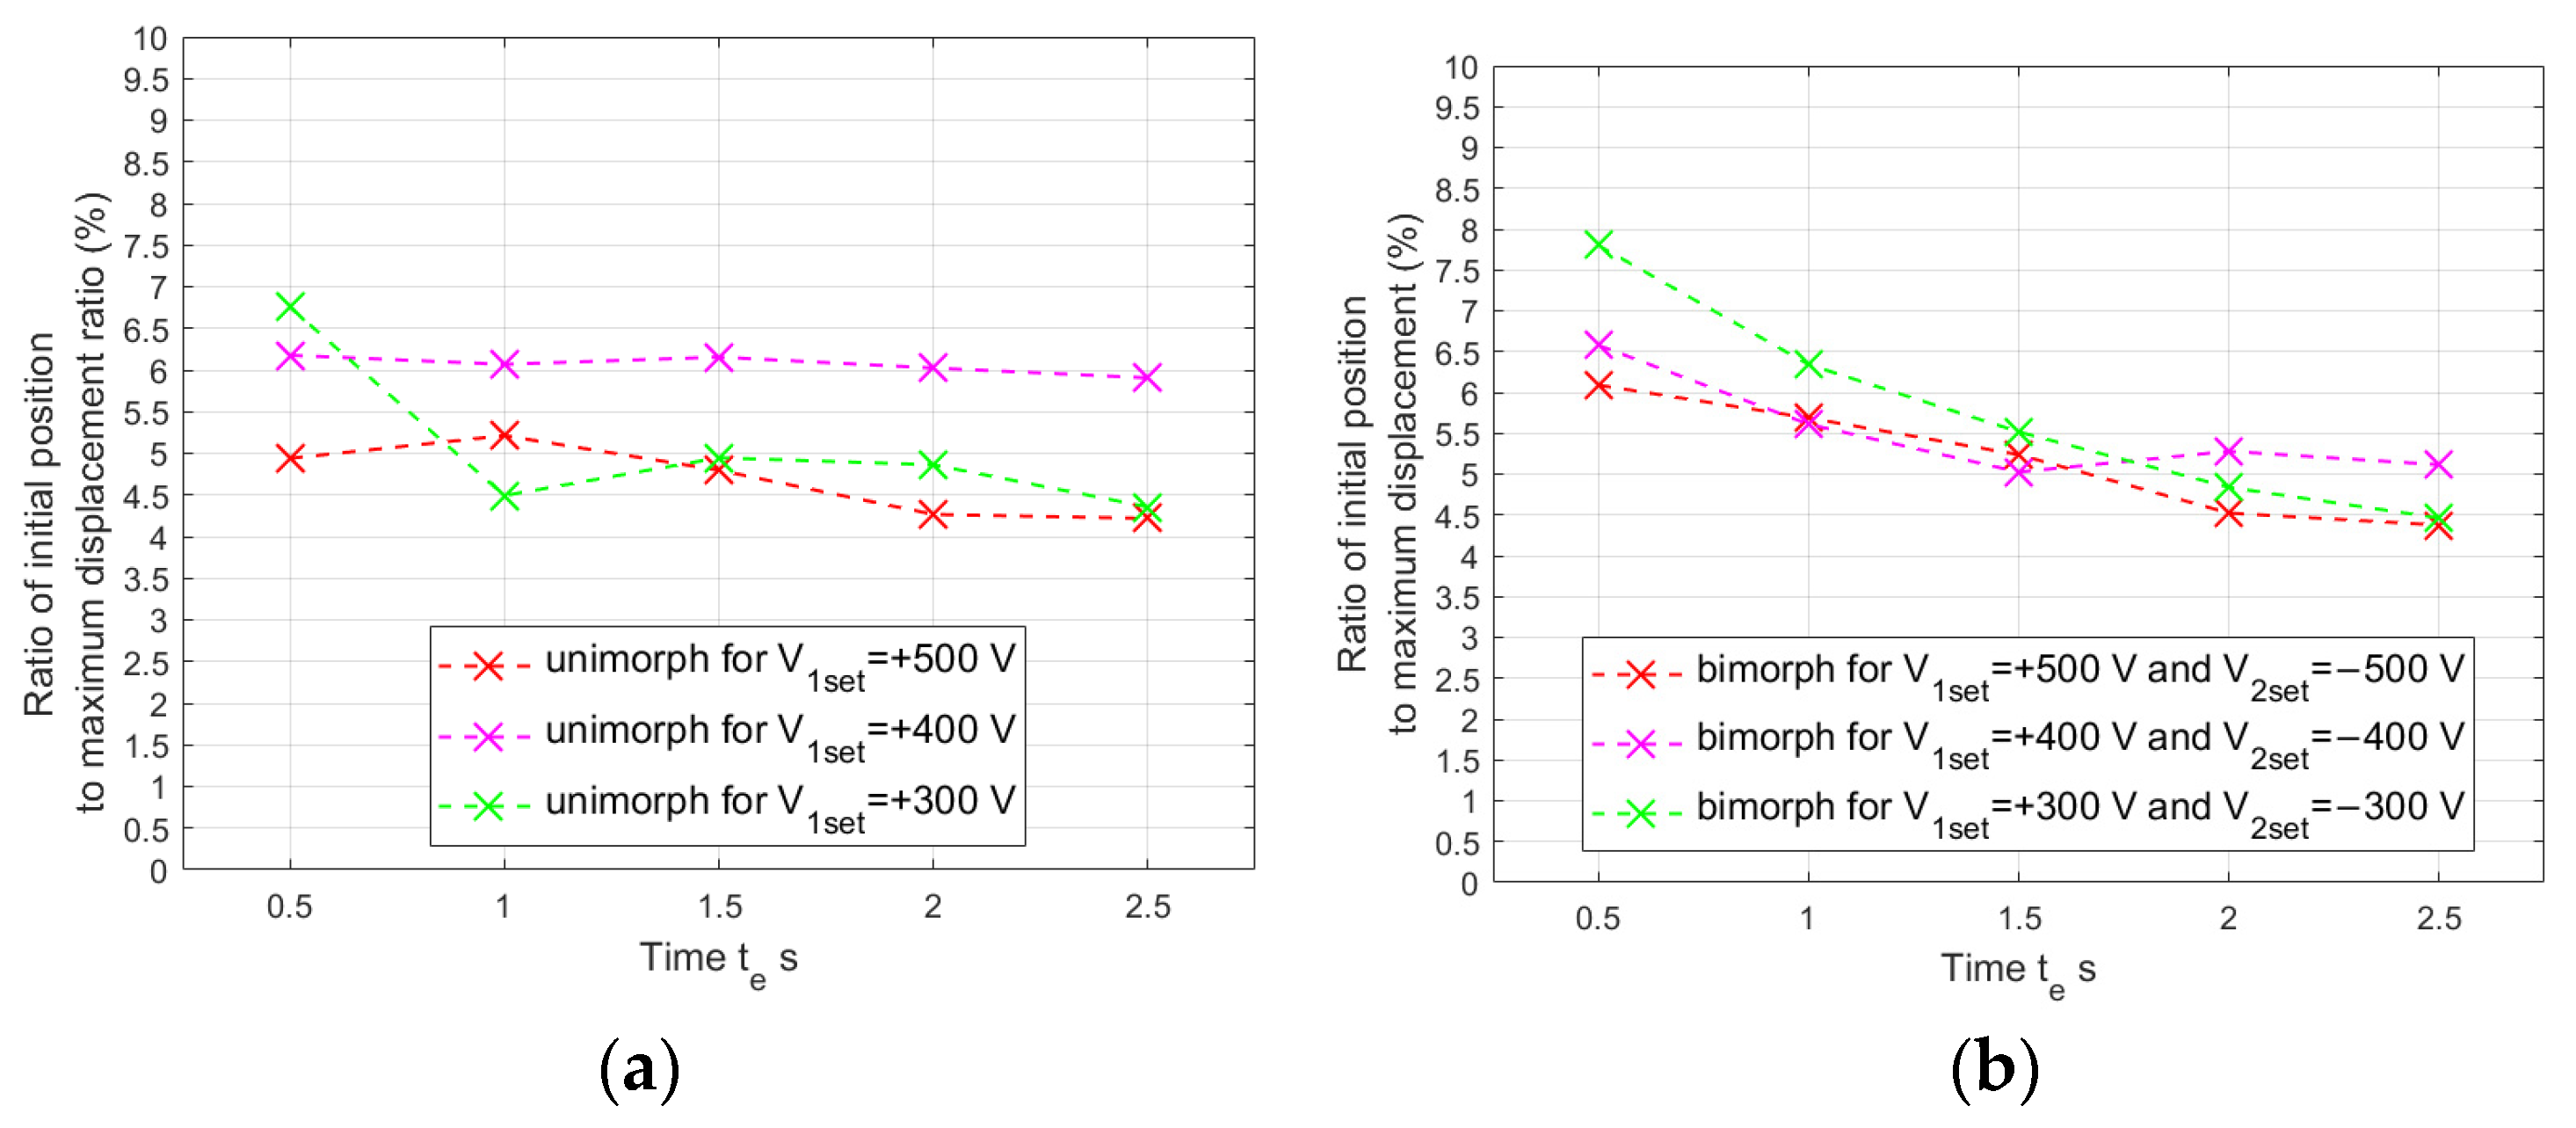
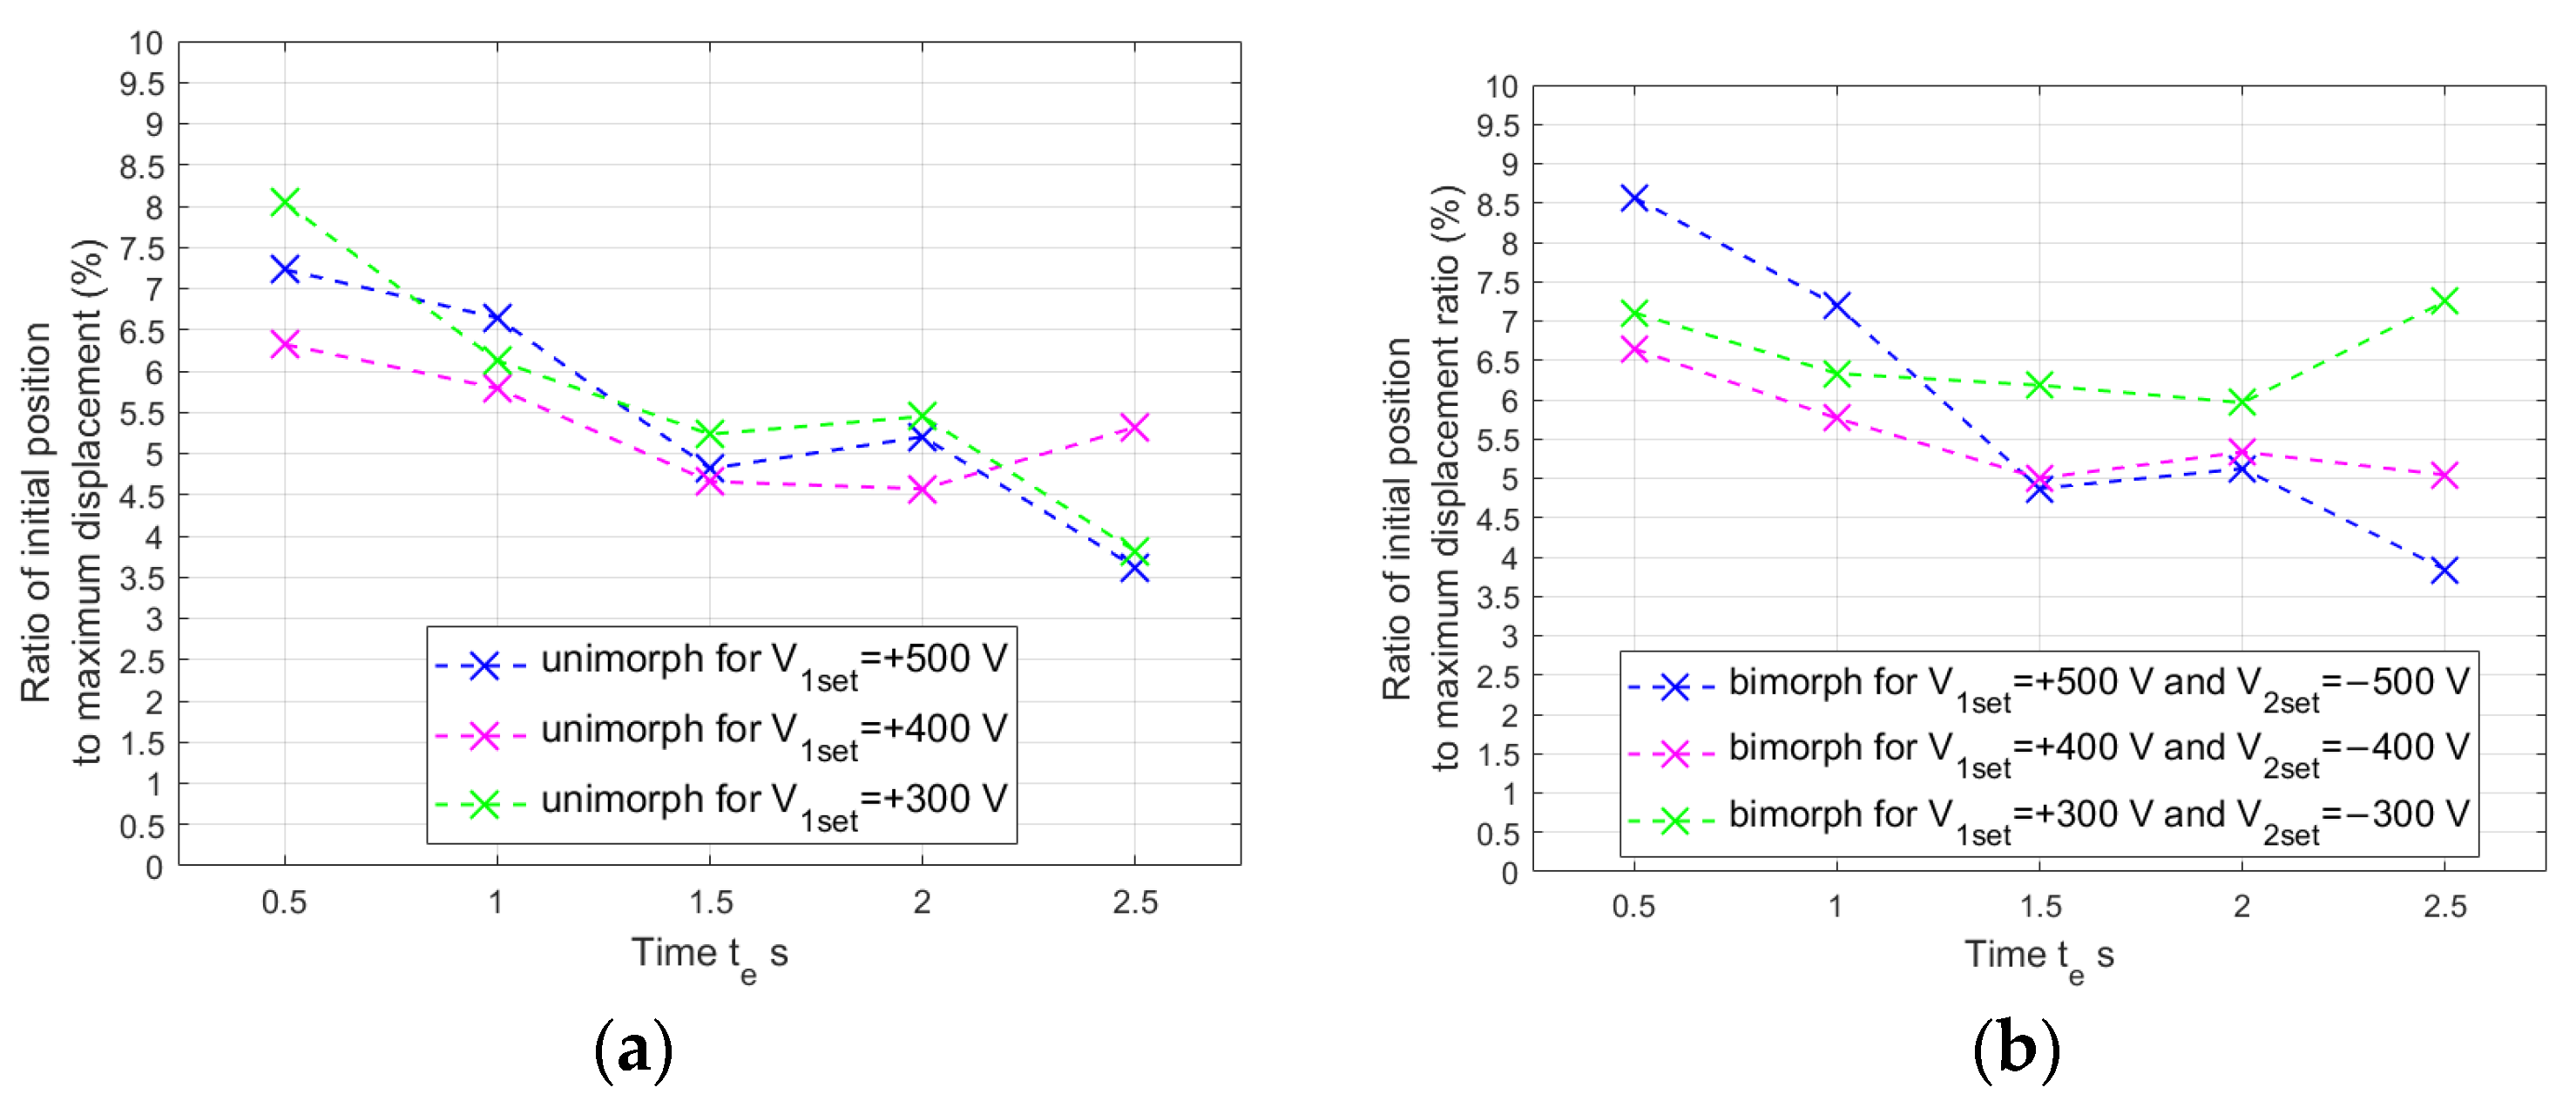
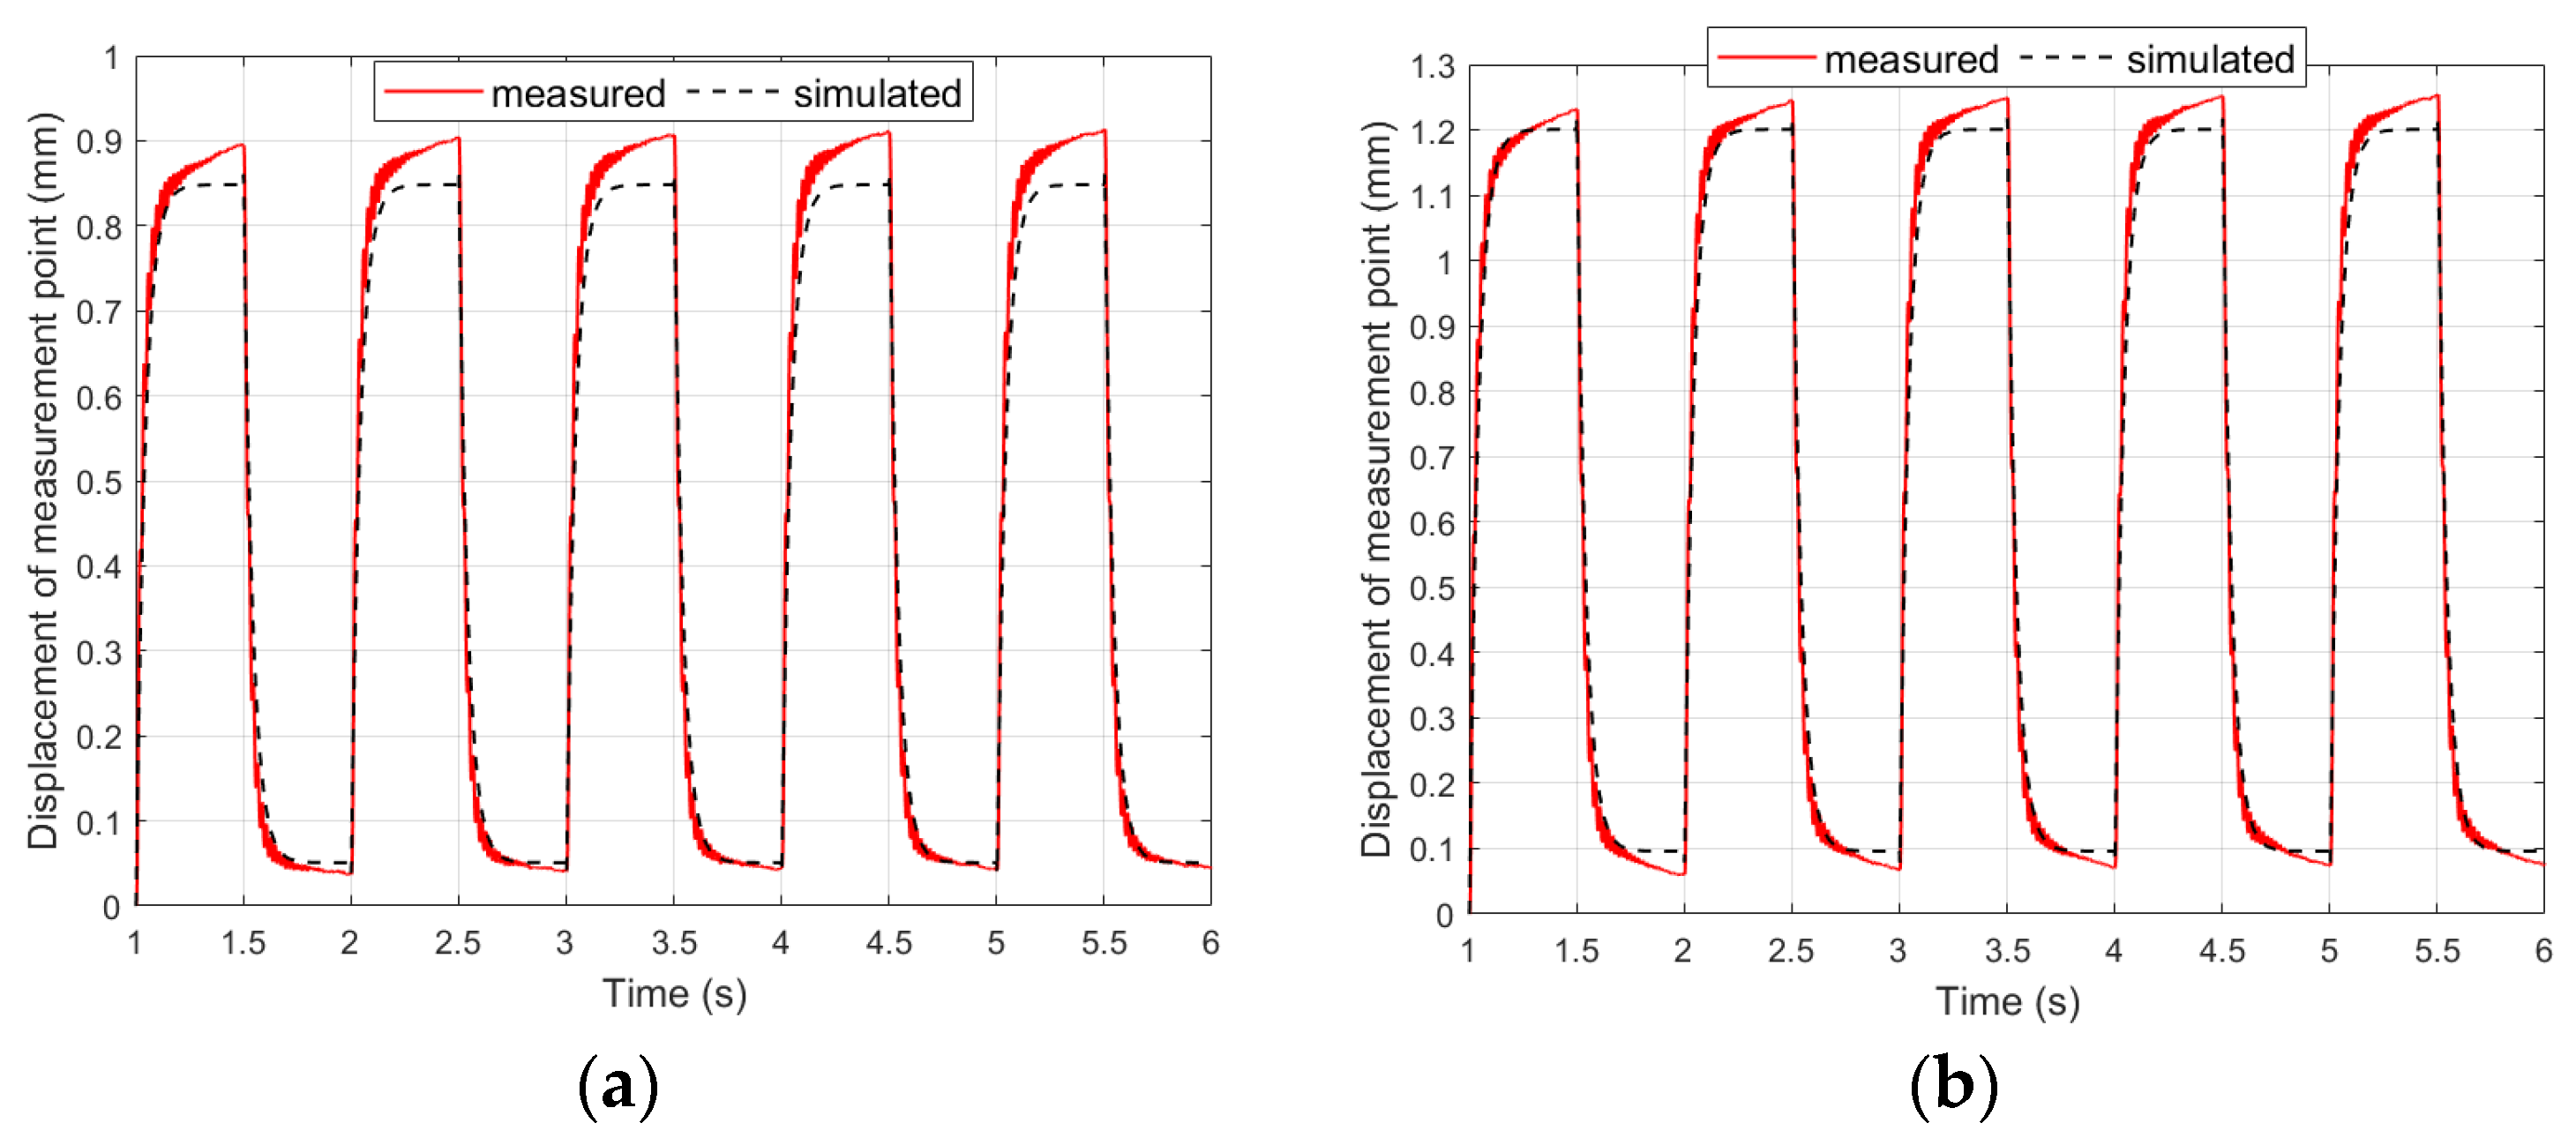
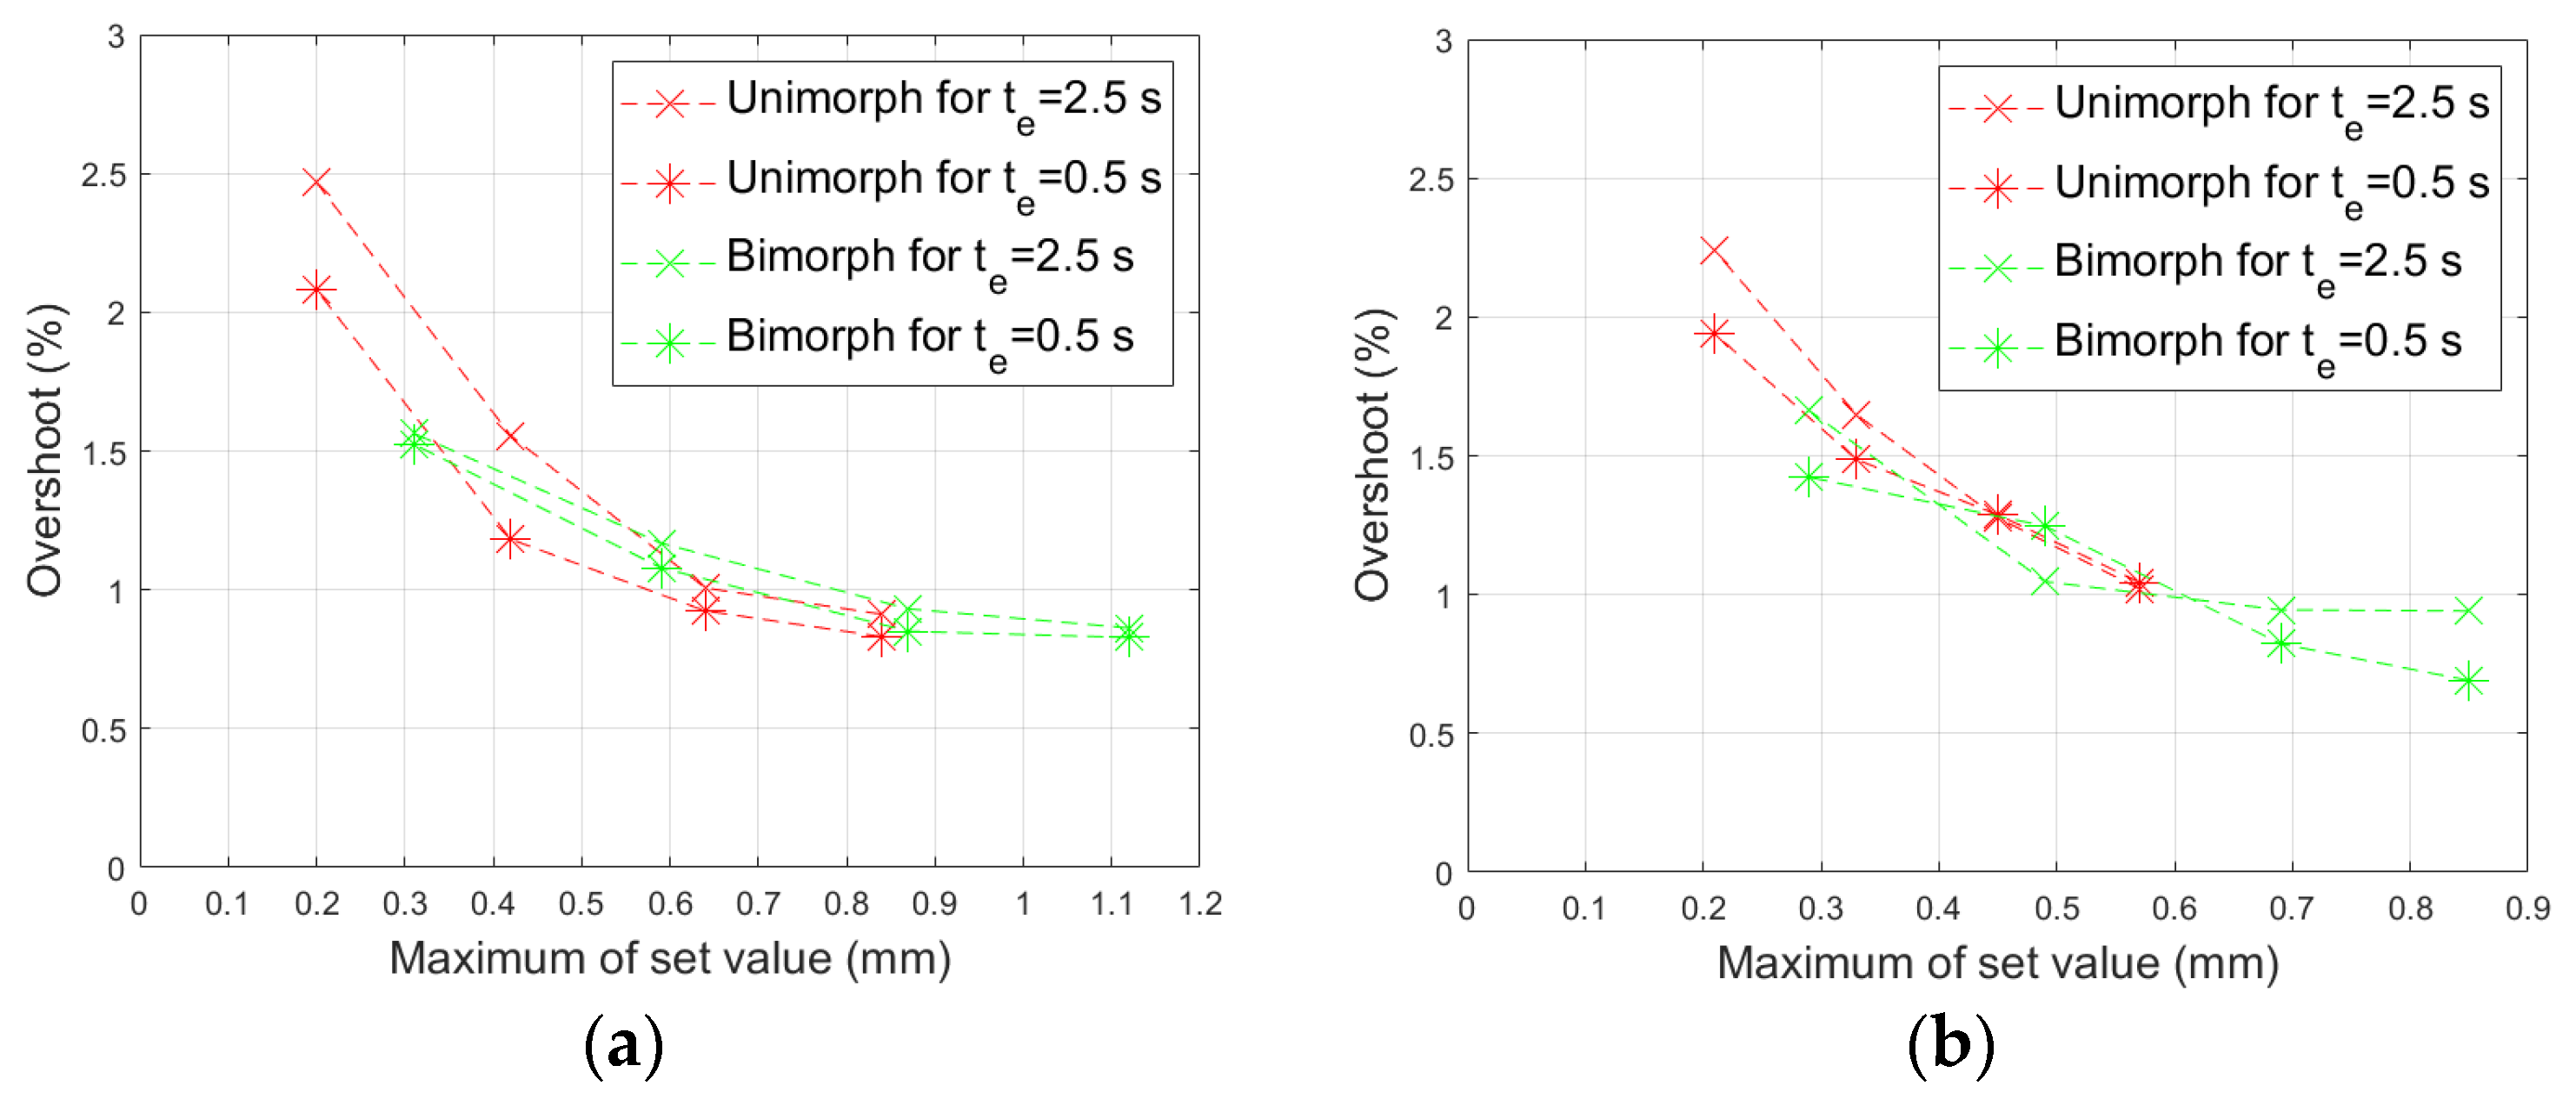
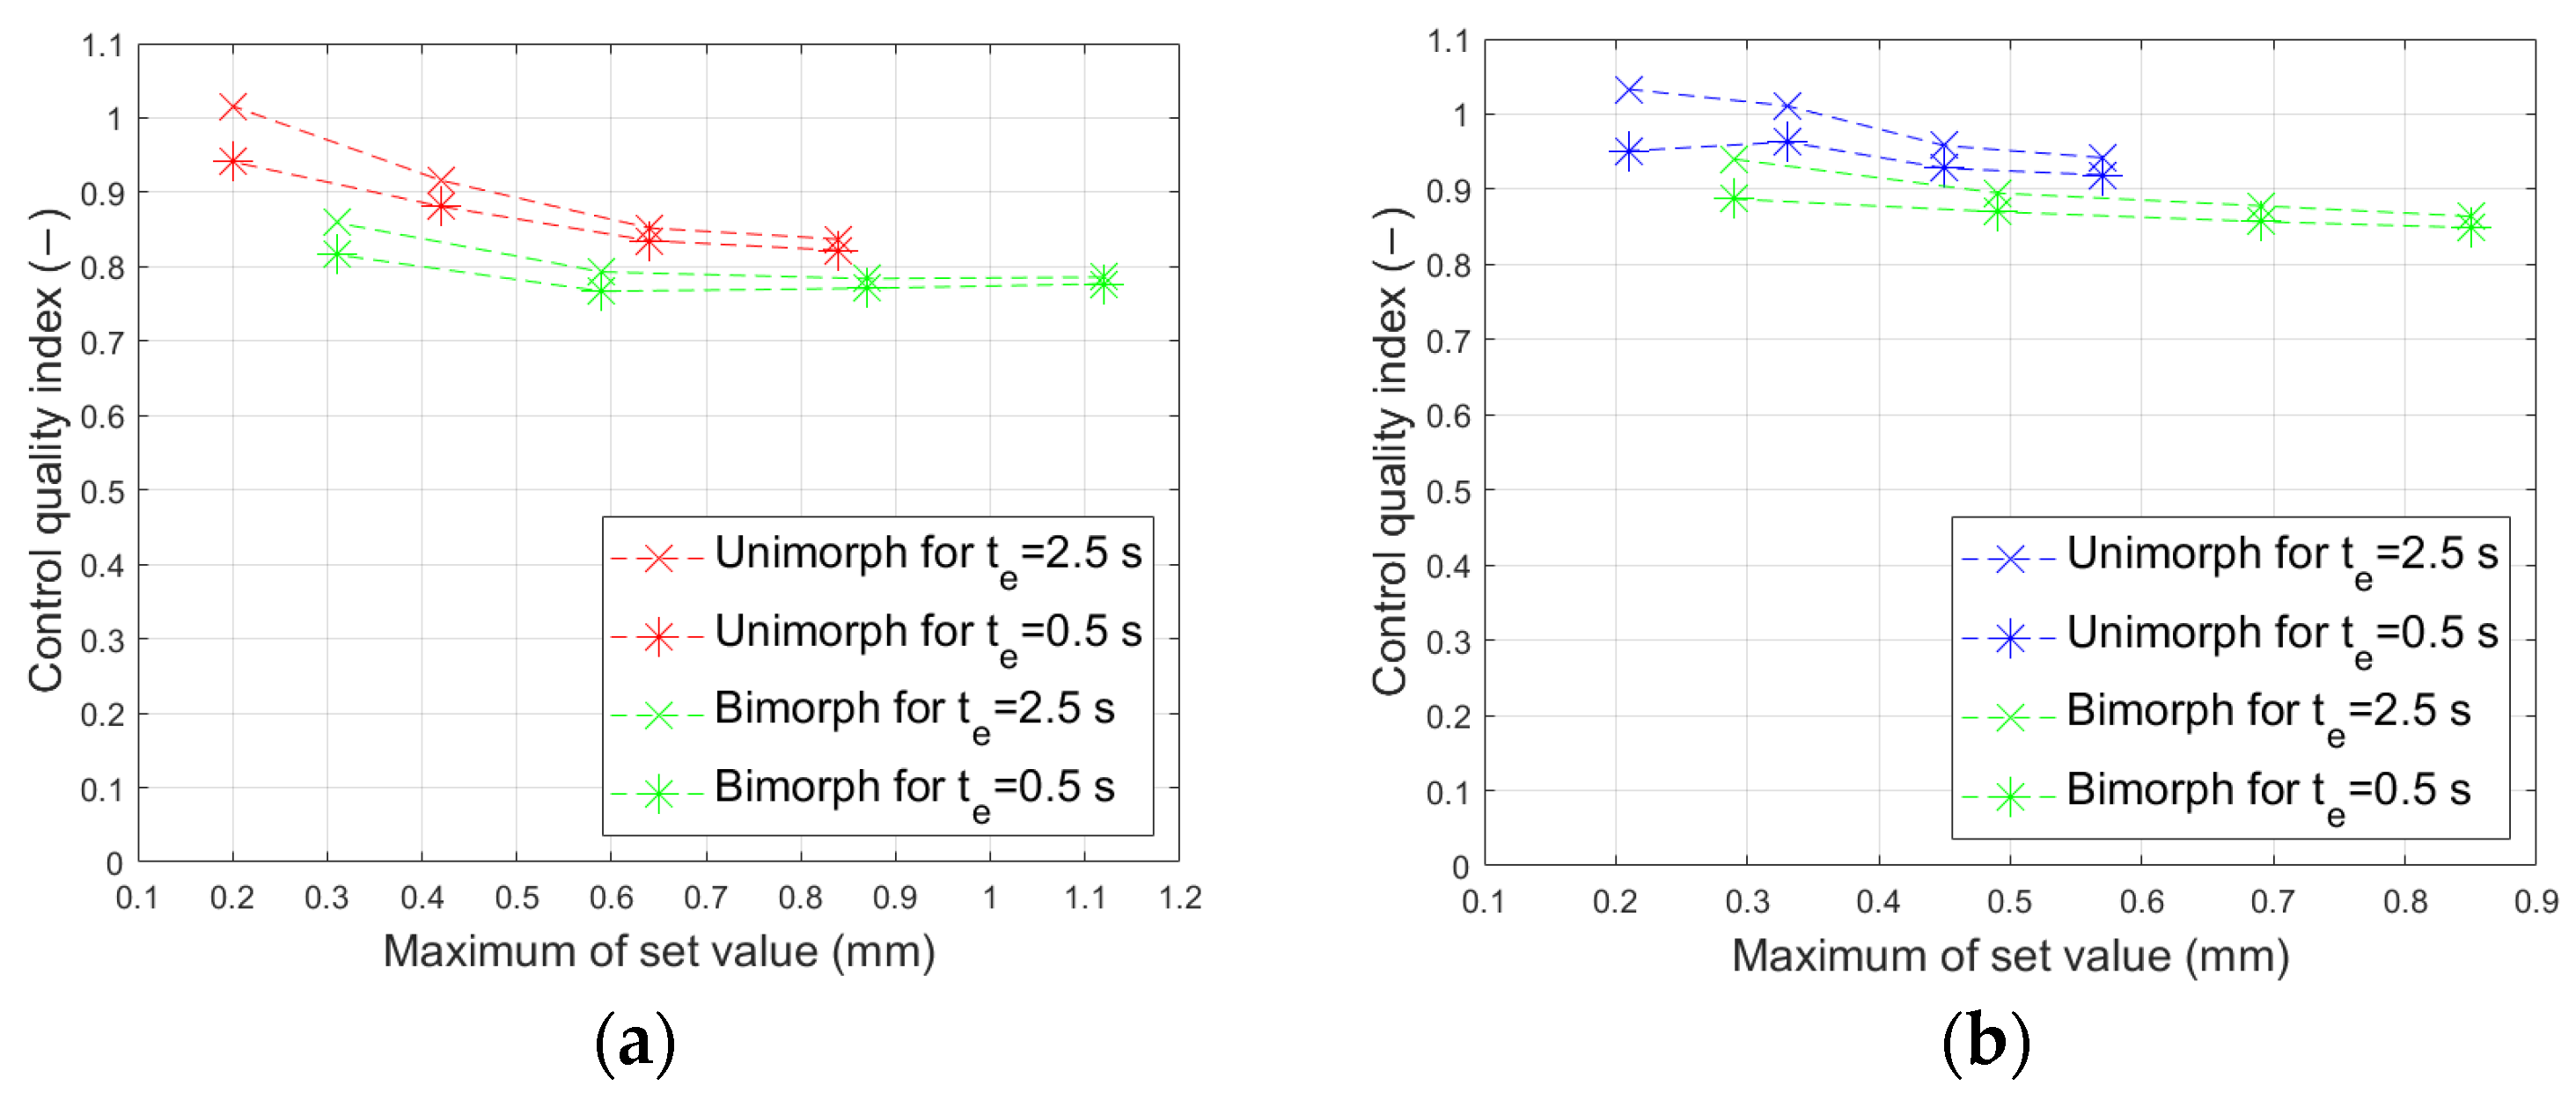
4.4. Results in Second Stage of Research

Considering Equations (18)–(21), the R matrix has the following form:
F o r   u n i m o r p h : R = r 11       F o r   b i m o r p h : R = r 11 0 0 r 22  
Bryson’s rule was adopted as the basis for the selection of weights. Taking into account the γ coefficient introduced in Equation (8), an analysis of the impact of reducing the maximum control voltage on the control quality was carried out. The course of the set value is shown in Figure 15.
The set value of the actuator displacement was equal to 0.84 mm for the composite-based unimorph, 1.12 mm for the composite-based bimorph, 0.57 mm for the aluminum-based unimorph, and 0.85 mm for the aluminum-based bimorph. The first two weights in the Q matrix were selected based on [25], and the third weight was selected using the trial-and-error method:
Q = 0.01 0 0 0 0.01 0 0 0 30.33 × 10 9  
Figure 16 shows the impact of the value of the γ coefficient on the rising time and the overshoot of the control system output.
The rising time increased as the γ coefficient value decreased (Figure 16a). However, the overshoot increased as the γ coefficient value increased (Figure 16b). Hence, the choice of the γ coefficient value should be based on a compromise: on the one hand, the purpose should be to reduce the overshoot, and on the other hand, to shorten the rising time. Additionally, in the case of a bimorph, the weight in the R matrix that corresponds to the control voltage of the compressing MFC patch should be smaller than the weight corresponding to the control voltage of the stretching MFC patch. The following modification of Bryson’s rule is proposed:
F o r   c o m p o s i t e   b a s e d   u n i m o r p h : r 11 = 1 u 1 m a x 2 γ 2 F o r   a l u m i n u m   b a s e d   u n i m o r p h : r 11 = 1 u 1 m a x 2 γ 2 F o r   c o m p o s i t e   b a s e d   b i m o r p h : r 11 = ε 1 u 1 m a x 2 γ 2       r 22 = ε 2 u 2 m a x 2 γ 2 F o r   a l u m i n u m   b a s e d   b i m o r p h : r 11 = ε 1 u 1 m a x 2 γ 2       r 22 = ε 2 u 2 m a x 2 γ 2
The larger the value of the γ coefficient, the shorter the time it takes for the actuator to achieve the set displacement. A larger value of the γ coefficient can be used in actuator control systems with a carrier layer made of a stiffer material. This is due to the fact that the displacement caused by the creep phenomenon increases more slowly stiffer the material (compare Figure 7), which leads to a smaller increase in the overshoot. It was assumed that the γ coefficient for the composite-based actuator is equal to Ys/Ymfca = 0.38 (Ys means Young’s modulus of the FR4 composite) and that the γ coefficient for the aluminum-based actuator is equal to Ymfca/Ys = 0.68 (Ys means Young’s modulus of aluminum). On the basis of laboratory experiments in first stage of research, it was determined that for the composite-based actuator ε1 = 1 and ε2 = 0.36, and for the aluminum-based actuator ε1 = 1 and ε2 = 0.38. On the basis of the trial-and-error method, it was established that the weights in the Q matrix were equal to the largest value of the material constants that appear in Equation (2), which is Ymfc for the composite-based actuator and Yc for the aluminum-based actuator:
F o r   c o m p o s i t e   b a s e d   a c t u a t o r : Q = 30.33 × 10 9 0 0 0 0 0 0 0 30.33 × 10 9   F o r   a l u m i n u m   b a s e d   a c t u a t o r : Q = 71 × 10 9 0 0 0 0 0 0 0 71 × 10 9  
In all experiments, the weights in the Qc matrix with dimensions 3 × 3 and the Rc matrix with dimensions 1 × 1, which are needed to calculate the H matrix in the Kalman filter, were the same (they were determined experimentally): Qc = diag(1 × 10⁻³, 1 × 10⁻³, 1 × 10⁻³) and Rc = 1 × 10⁻⁶.
Figure 17 shows the measured displacement of the composite-based actuator and the generated control signals waveforms, which were obtained in the control system shown in Figure 4 for the largest set values (experiments no. 37 and no. 53).
Figure 18 shows the measured displacement of the aluminum-based actuator and the generated control signals waveforms, which were obtained in the control system shown in Figure 4 for the largest set values (experiments no. 39 and no. 55).
Figure 19 shows the characteristics which were obtained in the control system shown in Figure 4 for the smallest set values of bimorph displacement (experiments no. 65 and no. 67).
To compare the control quality in all 32 laboratory experiments (Table 5), a control quality index (Iq) was determined in each of the experiments:
I q = 1 y s e t m a x y s e t ( t ) y ( t ) dt
where ysetmax is the maximum value of the set value of the actuator tip displacement. The Iq values for each experiment are presented in Table 6.

5. Discussion

As expected, the displacements of the composite-based actuator appeared larger compared to the aluminum-based actuator, but this difference did not increase as the time duration of the applied voltage spike increased: these differences did not exceed 3% (Figure 20).
Therefore, it can be concluded that displacements caused by the creep phenomenon of the composite-based actuator were approximately proportional to displacements of the aluminum-based actuator. These displacements were proportionally larger in the case of the composite carrier layer in comparison to the aluminum carrier layer (Figure 6).
The ratios of bimorph to unimorph displacement are presented in Figure 21.
It can be noticed that the difference between the bimorph and unimorph displacement increased for the largest values of voltage spikes (V1set = +500 V and V2set = −500 V), as the duration of the voltage spike increased: by 18.3% for the composite-based actuator and by 13.4% for the aluminum-based actuator. In the case of voltage spikes with other tested values (V1set = +400 V and V2set = −400 V, V1set = +300 V and V2set = −300 V), this difference decreased slightly as the duration of the voltage spike increased. The average displacement ratios were determined: with a composite carrier layer it was 136.72% and with an aluminum carrier layer it was 138.83%.
Based on the results from the first stage of research, two main observations can be distinguished, which are important in the design of a linear control system of a piezoelectric actuator:
  • The constant value of the control voltage causes undesirable actuator displacement, which is caused by the creep phenomenon. This is visible in Figure 6, Figure 8 and Figure 9;
  • The control voltage of the compressing MFC should be larger than the control voltage of the stretching MFC. This observation is based on the comparison of the displacements of the unimorph and bimorph for the same carrier layer material.
These observations lead to guidelines for the determination of the weights in the R and Q matrixes:
  • The use of Bryson’s rule to determine the weights in the R matrix is not sufficient because it leads to the generation of the maximum possible control voltage, for example ±500 V in the case of the equipment presented in this article. This article proposes a modification to the method of determining the weights by introducing the ratios of the Young’s modulus: see Equation (23). For the same purpose, in the Q matrix, the deviation from 0 of the first state variable should be limited by introducing an appropriately large weight q11. Based on the results of the laboratory experiments, the article proposes a weight value q11 equal to the larger value of Young’s modulus (either the Young’s modulus value of the carrier layer material or of the piezoelectric material);
  • The weight in the R matrix that corresponds to the control voltage of the compressing MFC patch should be smaller than the weight corresponding to the control voltage of the stretching MFC patch. This article proposes a modification to the method of determining the weights by introducing the coefficient ε2: see Equation (24).
Based on the results of the first stage of research, it was also noted that the actuator positions in the intervals between control voltage spikes, which result from the hysteresis phenomenon, are approximately linearly dependent on the maximum displacement of the actuator. Reaching position zero in the intervals between control voltage spikes is possible by the application of a control voltage with the sign opposite to the sign of the voltage in the spikes. Obtaining position zero is possible by using a suitably large value of the weight q33 in the Q matrix. Based on the results of laboratory experiments, the article proposes a weight value q33 equal to the larger value of Young’s modulus (either the Young’s modulus value of the carrier layer material or of the piezoelectric material).
The use of modified rules for determining weights in the R matrix together with experimentally selected weights in the Q matrix enabled effective linear control of actuators for both the composite and the aluminum carrier layers, and for different values of the set value of the actuator tip displacement. First of all, it was noticed that the actuator achieved yset in each of the experiments whose conditions are given in Table 5. To compare the control quality in individual experiments, the overshoot value was calculated:
κ = y m a x y s t e a d y 100 % 100 %
where ymax is the maximum value of the actuator tip displacement and ysteady is the actuator tip position in a steady state after reaching yset (given in Table 5). A comparison of the overshoot values in the individual experiments is shown in Figure 22.
The overshoot value increased slightly as the maximum set value decreased. However, in no experiment did it exceed 2.5%. The range of the overshoot changes in the bimorph case is smaller than in the unimorph case. Figure 23 shows the comparison of the control quality index Iq (25) in all laboratory experiments.
As can be seen in Figure 21, the control quality is approximately similar regardless of the material of the carrier layer, the maximum of the set value, and the duration of this maximum.

6. Conclusions

The subject of this article was an experimental analysis of the control system of a composite-based piezoelectric actuator and an aluminum-based piezoelectric actuator. Analysis was performed for both the unimorph and bimorph structures.
A modification of the method of selecting weights in the R matrix in the LQR control algorithm was proposed for a cantilever-type piezoelectric actuator. The weights in the R matrix for the actuator containing a carrier layer made of stiffer material should be smaller than those for the actuator containing a carrier layer made of less stiff material. Additionally, regardless of the carrier layer material, in the case of a bimorph, the weight in the R matrix that corresponds to the control voltage of the compressing MFC patch should be smaller than the weight corresponding to the control voltage of the stretching MFC patch.
The proposed correction of the selection of weights in the R matrix enables obtaining effective linear control, thanks to which displacements caused by the phenomenon of creep are eliminated. The quality of control remains approximately the same regardless of the material of the carrier layer, the maximum set value of the actuator displacement, and the duration of this set value at a constant level.

Funding

This research was funded by the AGH University of Krakow within the scope of the Research Program No. 16.16.130.942.

Institutional Review Board Statement

Not applicable.

Informed Consent Statement

Not applicable.

Data Availability Statement

Data are contained within the article.

Conflicts of Interest

The author declares no conflict of interest.

References

  1. Mohith, S.; Upadhya, A.R.; Karanth, N.; Kulkarni, S.M.; Rao, M. Recent trends in piezoelectric actuators for precision motion and their applications: A review. Smart Mater. Struct. 2020, 30, 013002. [Google Scholar] [CrossRef]
  2. Jin, H.; Gao, X.; Ren, K.; Liu, J.; Qiao, L.; Liu, M.; Chen, W.; He, Y.; Dong, S.; Xu, Z.; et al. Review on piezoelectric actuators based on high-performance piezoelectric materials. IEEE Trans. Ultrason. Ferroelectr. Freq. Control 2022, 69, 3057–3069. [Google Scholar] [CrossRef]
  3. Yang, C.; Youcef-Toumi, K. Principle, implementation, and applications of charge control for piezo-actuated nanopositioners: A comprehensive review. Mech. Syst. Signal Process. 2022, 171, 108885. [Google Scholar] [CrossRef]
  4. Chilibon, I.; Dias, C.; Inacio, P.; Marat-Mendes, J. PZT and PVDF bimorph actuators. J. Optoelectron. Adv. Mater. 2007, 9, 1939–1943. [Google Scholar]
  5. Ghodsi, M.; Mohammadzaheri, M.; Soltani, P. Analysis of Cantilever Triple-Layer Piezoelectric Harvester (CTLPH): Non-Resonance Applications. Energies 2023, 16, 3129. [Google Scholar] [CrossRef]
  6. Takagi, K.; Li, J.F.; Yokoyama, S.; Watanabe, R.; Almajid, A.; Taya, M. Design and fabrication of functionally graded PZT/Pt piezoelectric bimorph actuator. Sci. Technol. Adv. Mater. 2002, 3, 217–224. [Google Scholar] [CrossRef]
  7. Sumit; Kane, S.R.; Sinha, A.K.; Shukla, R. Electric field-induced nonlinear behavior of lead zirconate titanate piezoceramic actuators in bending mode. Mech. Adv. Mater. Struct. 2022, 30, 2111–2120. [Google Scholar] [CrossRef]
  8. Tan, D.; Yavarow, P.; Erturk, A. Nonlinear elastodynamics of piezoelectric macro-fiber composites with interdigitated electrodes for resonant actuation. Compos. Struct. 2018, 187, 137–143. [Google Scholar] [CrossRef]
  9. Liu, Y.Z.; Hao, Z.W.; Yu, J.X.; Zhou, X.R.; Lee, P.S.; Sun, Y.; Mu, Z.C.; Zeng, F.L. A high-performance soft actuator based on a poly (vinylidene fluoride) piezoelectric bimorph. Smart Mater. Struct. 2019, 28, 055011. [Google Scholar] [CrossRef]
  10. Akdogan, E.K.; Allahverdi, M.; Safari, A. Piezoelectric composites for sensor and actuator applications. IEEE Trans. Ultrason. Ferroelectr. Freq. Control 2005, 52, 746–775. [Google Scholar] [CrossRef]
  11. Dai, Q.; Ng, K. Investigation of electromechanical properties of piezoelectric structural fiber composites with micromechanics analysis and finite element modeling. Mech. Mater. 2012, 53, 29–46. [Google Scholar] [CrossRef]
  12. Nguyen, C.H.; Kornmann, X. A comparison of dynamic piezoactuation of fiber-based actuators and conventional PZT patches. J. Intell. Mater. Syst. Struct. 2006, 17, 45–55. [Google Scholar] [CrossRef]
  13. Wang, H.; Xie, X.; Zhang, M.; Wang, B. Analysis of the nonlinear hysteresis of the bimorph beam piezoelectric bending actuator for the deformable mirror systems. J. Astron. Telesc. Instrum. Syst. 2020, 6, 029002. [Google Scholar] [CrossRef]
  14. Mansour, S.Z.; Seethaler, R.J.; Teo, Y.R.; Yong, Y.K.; Fleming, A.J. Piezoelectric bimorph actuator with integrated strain sensing electrodes. IEEE Sens. J. 2018, 18, 5812–5817. [Google Scholar] [CrossRef]
  15. Shen, D.; Wen, J.; Ma, J.; Hu, Y.; Wang, R.; Li, J. A novel linear inertial piezoelectric actuator based on asymmetric clamping materials. Sens. Actuators A Phys. 2020, 303, 111746. [Google Scholar] [CrossRef]
  16. Davis, C.L.; Calkins, F.T.; Butler, G.W. High-frequency jet nozzle actuators for noise reduction. In Smart Structures and Materials 2003: Industrial and Commercial Applications of Smart Structures Technologies; Anderson, E.H., Ed.; Proceedings of SPIE; SPIE: Bellingham, WA, USA, 2003; Volume 5054, pp. 34–44. [Google Scholar]
  17. Wood, R.J.; Steltz, E.; Fearing, R.S. Optimal energy density piezoelectric bending actuators. Sens. Actuators A Phys. 2005, 119, 476–488. [Google Scholar] [CrossRef]
  18. Wang, Q.M.; Cross, L.E. Performance analysis of piezoelectric cantilever bending actuators. Ferroelectrics 1998, 215, 187–213. [Google Scholar] [CrossRef]
  19. Wang, H. Analytical analysis of a beam flexural-mode piezoelectric actuator for deformable mirrors. J. Astron. Telesc. Instrum. Syst. 2015, 1, 049001. [Google Scholar] [CrossRef]
  20. Mtawa, A.N.; Sun, B.; Gryzagoridis, J. An investigation of the influence of substrate geometry and material properties on the performance of the C-shape piezoelectric actuator. Smart Mater. Struct. 2007, 16, 1036. [Google Scholar] [CrossRef]
  21. LaCroix, B.W.; Ifju, P.G. Investigating potential substrates to maximize out-of-plane deflection of piezoelectric macro-fiber composite actuators. J. Intell. Mater. Syst. Struct. 2015, 26, 781–795. [Google Scholar] [CrossRef]
  22. Gan, J.; Zhang, X. A review of nonlinear hysteresis modeling and control of piezoelectric actuators. AIP Adv. 2019, 9, 040702. [Google Scholar] [CrossRef]
  23. Jung, H.; Gweon, D.G. Creep characteristics of piezoelectric actuators. Rev. Sci. Instrum. 2000, 71, 1896–1900. [Google Scholar] [CrossRef]
  24. Yang, Y.L.; Wei, Y.D.; Lou, J.Q.; Fu, L.; Tian, G.; Wu, M. Hysteresis modeling and precision trajectory control for a new MFC micromanipulator. Sens. Actuators A Phys. 2016, 247, 37–52. [Google Scholar] [CrossRef]
  25. Ebrahimi-Tirtashi, A.; Mohajerin, S.; Zakerzadeh, M.R.; Nojoomian, M.A. Vibration control of a piezoelectric cantilever smart beam by 1 adaptive control system. Syst. Sci. Control Eng. 2021, 9, 542–555. [Google Scholar] [CrossRef]
  26. Wang, X.; Zhou, W.; Zhang, Z.; Jiang, J.; Wu, Z. Theoretical and experimental investigations on modified LQ terminal control scheme of piezo-actuated compliant structures in finite time. J. Sound Vib. 2021, 491, 115762. [Google Scholar] [CrossRef]
  27. Tsushima, N.; Su, W. Concurrent active piezoelectric control and energy harvesting of highly flexible multifunctional wings. J. Aircr. 2017, 54, 724–736. [Google Scholar] [CrossRef]
  28. Roundy, S.; Wright, P.K.; Rabaey, J.M. Energy Scavenging for Wireless Sensor Networks; Springer: New York, NY, USA, 2004. [Google Scholar]
  29. Tian, J.; Guo, Q.; Shi, G. Laminated piezoelectric beam element for dynamic analysis of piezolaminated smart beams and GA-based LQR active vibration control. Compos. Struct. 2020, 252, 112480. [Google Scholar] [CrossRef]
  30. Smart Material—Home of the MFC. Available online: https://www.smart-material.com/MFC-product-mainV2.html (accessed on 30 July 2022).
  31. 3M™ Scotch-Weld™ Structural Adhesives. Available online: https://multimedia.3m.com/mws/media/1989908O/04-productselectionguide-epx-en.pdf (accessed on 10 September 2023).
  32. RT-DAC/Zynq User’s Manual. Available online: http://www.inteco.com.pl/Docs/Rtdac_Zynq.pdf (accessed on 30 July 2023).
  33. Koo, K.Y.; Park, S.; Lee, J.J.; Yun, C.B. Automated impedance-based structural health monitoring incorporating effective frequency shift for compensating temperature effects. J. Intell. Mater. Syst. Struct. 2009, 20, 367–377. [Google Scholar] [CrossRef]
  34. Huynh, T.C.; Kim, J.T. Quantification of temperature effect on impedance monitoring via PZT interface for prestressed tendon anchorage. Smart Mater. Struct. 2017, 26, 125004. [Google Scholar] [CrossRef]
  35. Lining, S.; Changhai, R.; Weibin, R.; Liguo, C.; Minxiu, K. Tracking control of piezoelectric actuator based on a new mathematical model. J. Micromech. Microeng. 2004, 14, 1439. [Google Scholar] [CrossRef]
  36. Hosea, M.E.; Shampine, L.F. Analysis and implementation of TR-BDF2. Appl. Numer. Math. 1996, 20, 21–37. [Google Scholar] [CrossRef]
  37. Ismail, M.R.; Omar, F.K.; Ajaj, R.; Ghodsi, M. On the accuracy of lumped parameter model for tapered cantilever piezoelectric energy harvesters with tip mass. In Proceedings of the 2020 Advances in Science and Engineering Technology International Conferences (ASET), Dubai, United Arab Emirates, 4 February–9 April 2020; pp. 1–6. [Google Scholar]
  38. Wang, B.; Luo, X.; Liu, Y.; Yang, Z. Thickness-variable composite beams for vibration energy harvesting. Compos. Struct. 2020, 244, 112232. [Google Scholar] [CrossRef]
  39. Grzybek, D. Control System for Multi-Input and Simple-Output Piezoelectric Beam Actuator Based on Macro Fiber Composite. Energies 2022, 15, 2042. [Google Scholar] [CrossRef]
  40. Deraemaeker, A.; Nasser, H.; Benjeddou, A.; Preumont, A. Mixing rules for the piezoelectric properties of macro fiber composites. J. Intell. Mater. Syst. Struct. 2009, 20, 1475–1482. [Google Scholar] [CrossRef]
  41. Ghodsi, M.; Mohammadzaheri, M.; Soltani, P.; Ziaifar, H. A new active anti-vibration system using a magnetostrictive bimetal actuator. J. Magn. Magn. Mater. 2022, 557, 169463. [Google Scholar] [CrossRef]
  42. Li, C.; Shen, L.; Shao, J.; Fang, J. Simulation and experiment of active vibration control based on flexible piezoelectric MFC composed of PZT and PI layer. Polymers 2023, 15, 1819. [Google Scholar] [CrossRef]
  43. Xu, P.; Lan, X.; Zeng, C.; Zhang, X.; Liu, Y.; Leng, J. Dynamic characteristics and active vibration control effect for shape memory polymer composites. Compos. Struct. 2023, 322, 117327. [Google Scholar] [CrossRef]
Figure 1. Schema of a cross-section of a cantilever beams: 1—longitudinal axis of the beam, 3—transverse axis of the beam.
Materials 17 00096 g001
Figure 2. Produced cantilever beam containing aluminum carrier layer.
Materials 17 00096 g002
Figure 3. Schema of measurement system.
Materials 17 00096 g003
Figure 4. Schema of control system: B1—first column of B matrix, B2—second column of B matrix.
Materials 17 00096 g004
Figure 5. Supply voltage waveforms in laboratory research: (a) unimorph, (b) bimorph.
Materials 17 00096 g005
Figure 6. Step responses: (a) composite-based unimorph, (b) aluminum-based unimorph, (c) composite-based bimorph, (d) aluminum-based bimorph.
Materials 17 00096 g006aMaterials 17 00096 g006b
Figure 7. Percentage change in the position of the cantilever beam tip caused by the creep process.
Materials 17 00096 g007
Figure 8. Step responses of unimorph for V1set = +500 V: (a) te = 0.5 s, (b) te = 2.5 s.
Materials 17 00096 g008
Figure 9. Step responses of bimorphs for V1set = +500 V and V2set = −500 V: (a) te = 0.5 s, (b) te = 2.5 s.
Materials 17 00096 g009
Figure 10. Ratio of initial position to maximum displacement of composite-based actuator: (a) unimorph, (b) bimorph.
Materials 17 00096 g010
Figure 11. Ratio of initial position to maximum displacement of aluminum-based actuator: (a) unimorph, (b) bimorph.
Materials 17 00096 g011
Figure 12. Comparison of simulation results and laboratory results for composite-based actuator: (a) unimorph, (b) bimorph.
Materials 17 00096 g012
Figure 13. Comparison of simulation results and laboratory results for aluminum-based actuator: (a) unimorph, (b) bimorph.
Materials 17 00096 g013
Figure 14. Waveforms of set value of actuator tip displacement for five spikes.
Materials 17 00096 g014
Figure 15. Waveforms of set value of actuator tip displacement for one spike.
Materials 17 00096 g015
Figure 16. Impact of γ coefficient on quality indexes of control system: (a) on rising time, (b) on overshoot.
Materials 17 00096 g016
Figure 17. Control system characteristics for composite-based actuator: (a) unimorph displacement for yset = 0.57 mm, (b) control voltage of unimorph, (c) bimorph displacement for yset = 1.12 mm, (d) control voltages of bimorph.
Materials 17 00096 g017aMaterials 17 00096 g017b
Figure 18. Control system characteristics for aluminum-based actuator: (a) unimorph displacement for yset = 0.84 mm, (b) control voltage of unimorph, (c) bimorph displacement for yset = 0.85 mm, (d) control voltages of bimorph.
Materials 17 00096 g018
Figure 19. Control system characteristics for bimorph: (a) displacement of composite-based actuator for yset = 0.31 mm, (b) control voltages of composite-based actuator, (c) displacement of composite-based actuator for yset = 0.29 mm, (d) control voltages of composite-based actuator.
Materials 17 00096 g019
Figure 20. Aluminum-based actuator to composite-based actuator displacement ratio: (a) unimorph, (b) bimorph.
Materials 17 00096 g020
Figure 21. Bimorph actuator to unimorph actuator displacement ratio: (a) composite-based, (b) aluminum-based.
Materials 17 00096 g021
Figure 22. Overshoot: (a) composite-based actuators, (b) aluminum-based actuators.
Materials 17 00096 g022
Figure 23. Quality index: (a) composite-based actuators, (b) aluminum-based actuators.
Materials 17 00096 g023
Table 1. Dimensions of manufactured cantilever beams (in mm).
MFC PatchCarrier Layer
DimensionSymbolValueDimensionSymbolValue
Total lengthlmfc100Lengthlc120
Total widthwmfc20Widthwc20
Total thicknesstmfc0.3Thicknesstc1
Active part lengthlmfca85
Active part widthwmfca14
Active part thicknesstmfca0.18
Passive part lengthlmfcp15
Passive part thicknesstmfcp0.12
Distance between electrodestmfce0.5
Table 2. Material properties of manufactured cantilever beams.
Parameter Composite-Based
Actuator
Aluminum-Based
Actuator
Young’s modulus of carrier layerYc18.6 × 109 Pa [38]71 × 109 Pa [26]
Density of carrier layerρc1850 kg/m3 [38]2710 kg/m3 [26]
Young’s modulus of MFC patchYmfc30.336 × 109 Pa [30]
Young’s modulus of MFC of piezoceramic fibers in MFC patchYmfca48.3 × 109 Pa [40]
Density of active part of MFC patchρmfca5400 kg/m3 [26]
Piezoelectric constant of MFC patchd33400 × 10−12 C/N [30]
Piezoelectric constant of piezoceramic fibers in MFC patchd33a440 × 10−12 C/N [40]
Table 3. Conditions of laboratory experiments to determine the duration of a transition period in creep process.
Experiment No.123456
Set voltage V1set (V)+500+400+300+500+400+300
Set voltage V2set (V)000−500−400−300
Table 4. Conditions of laboratory and simulation experiments to determine impact of carrier layer material on actuator performance.
Experiment No.V1set (V)V2set (V)te (s)
Unimorph7 to 11+50000.511.522.5
12 to 16+40000.511.522.5
17 to 21+30000.511.522.5
Bimorph22 to 26+500−5000.511.522.5
27 to 31+400−4000.511.522.5
32 to 36+300−3000.511.522.5
Table 5. Conditions of laboratory experiments in second stage of research.
Experiment No.Composite-Based ActuatorExperiment No.Aluminum-Based Actuator
yset (mm)te (s)yset (mm)te (s)
Unimorph37 to 380.842.50.539 to 400.572.50.5
41 to 420.642.50.543 to 440.452.50.5
45 to 460.422.50.547 to 480.332.50.5
49 to 500.202.50.551 to 520.212.50.5
Bimorph53 to 541.122.50.555 to 560.852.50.5
57 to 580.872.50.559 to 600.692.50.5
61 to 620.592.50.563 to 640.492.50.5
65 to 660.312.50.567 to 680.292.50.5
Table 6. Value of quality index Iq.
Experiment No.Composite-BasedExperiment No.Aluminum-Based
Iq (−)Iq (−)
Unimorph37 to 380.8370.82239 to 400.9420.919
41 to 420.8520.83543 to 440.9580.928
45 to 460.9160.88147 to 481.0110.963
49 to 501.0160.94151 to 521.0330.951
Bimorph53 to 540.7860.77755 to 560.8640.849
57 to 580.7840.77159 to 600.8780.857
61 to 620.7930.76763 to 640.8950.870
65 to 660.8590.81667 to 680.9400.887
The lower the value of the Iq index, the better the control quality.
Disclaimer/Publisher’s Note: The statements, opinions and data contained in all publications are solely those of the individual author(s) and contributor(s) and not of MDPI and/or the editor(s). MDPI and/or the editor(s) disclaim responsibility for any injury to people or property resulting from any ideas, methods, instructions or products referred to in the content.

