Article

Cumulative Fatigue Damage of Composite Laminates: Engineering Rule and Life Prediction Aspect

by
Nikolaos D. Batsoulas
* and
Georgios I. Giannopoulos
*
Mechanics and Materials Laboratory, Department of Mechanical Engineering, School of Engineering, University of the Peloponnese, 26334 Patras, Greece
*
Authors to whom correspondence should be addressed.
Materials 2023, 16(8), 3271; https://doi.org/10.3390/ma16083271
Submission received: 20 March 2023 / Revised: 9 April 2023 / Accepted: 18 April 2023 / Published: 21 April 2023
(This article belongs to the Special Issue Analysis and Design of Structures and Materials)

Abstract

:
The analysis of cumulative fatigue damage is an important factor in predicting the life of composite elements and structures that are exposed to field load histories. A method for predicting the fatigue life of composite laminates under varying loads is suggested in this paper. A new theory of cumulative fatigue damage is introduced grounded on the Continuum Damage Mechanics approach that links the damage rate to cyclic loading through the damage function. A new damage function is examined with respect to hyperbolic isodamage curves and remaining life characteristics. The nonlinear damage accumulation rule that is presented in this study utilizes only one material property and overcomes the limitations of other rules while maintaining implementation simplicity. The benefits of the proposed model and its correlation with other relevant techniques are demonstrated, and a broad range of independent fatigue data from the literature is used for comparison to investigate its performance and validate its reliability.

1. Introduction

In engineering structures that use composite materials, fatigue damage is a major cause of failure. The most crucial characteristic for designers and users of composite materials is their ability to withstand fatigue. Composite materials have several advantages over traditional metallic materials, such as higher specific strength and stiffness, particularly in the aerospace industry. Fiber-reinforced composites are generally known to have excellent fatigue resistance. As the number of applied cycles rises, fatigue damage may cause fractures. It is essential to evaluate the damage caused by cycling loading as well as damage accumulation because of changes in amplitude, which is referred to as cumulative fatigue damage. This problem in many of its aspects remains challenging and unclear [1,2,3,4,5,6,7,8,9,10]. When a structural part undergoes repeated mechanical loads, it gradually accumulates damage through a complex sequence of processes such as fiber fracture, matrix cracking, debonding along the fiber-matrix interface, void growth, plus full separation into layers, i.e., delamination. These microscopic aspects of failure under cyclic loading are highly complex, and while there has been progress in understanding the micro-mechanics of fatigue failure, it is mostly used for diagnostic purposes. However, the diversity of service conditions often makes it impossible to obtain design data under identical conditions, so the design of new components for long-term operations is typically based on models. While many fatigue damage rules have been developed, none has received overall acclaim.
The Linear Damage Rule (LDR), also known as the Miner’s Rule or the Palmgren–Miner (P–M) Rule, remains the most commonly used model. The LDR is based on the Palmgren–Miner–Robinson hypothesis of linear summation of damage contributions [11,12,13]. It states that failure occurs when the sum Σni/Ni reaches one, where ni represents the number of cycles at σi stress level, while Ni represents the life at this stress level. For two stages, the rule takes the form n 1 / N 1 + n 2 / N 2 = 1 (P–M rule). However, this rule often leads to inaccurate and non-conservative life predictions, especially for composite materials under cyclic loading. While the simplicity of the formulations that are based on LDR is attractive for metallic structures, such approximations usually fail to predict the fatigue life of laminated structures due to various reasons that have been thoroughly analyzed elsewhere [14]. Several attempts have been made to create a model by assuming that the accumulation of fatigue damage behaves in a nonlinear manner. An initial attempt to establish a nonlinear model for metals has been made by Marko and Starkey via the introduction of a power rule form [15], expressed by the formula n 1 / N 1 a 1 / a 2 + n 2 / N 2 = 1 for two stages of loading, where the exponent terms a1 and a2 are functions of the first and second stress levels, respectively. It has been noted that this model is highly adaptable for composite materials [16]. However, determining the exponent’s dependence on stress requires experimental means which is not a simple task. For the Miner Rule, only the S-N curve is necessary. Many theories aim to improve prediction accuracy by adding some information beyond the S-N curve. Numerous nonlinear damage rules have been suggested [4,17,18,19,20,21,22]. Nevertheless, the current theories on cumulative damage were originally developed for metals and may not be entirely suitable for composite materials. Therefore, modifications to these theories are required for composite materials. Various expressions of fatigue damage and cumulative damage have been suggested, with elastic modulus, strength, and fatigue life being the most commonly used factors to assess material damage both qualitatively and quantitatively [23,24,25,26]. However, these models rely heavily on experimental data to estimate important control factors and are difficult to adapt to different conditions [27].
Continuum Damage Mechanics (CDM), introduced by Kachanov and Rabotnov [28,29,30,31], deals with the mechanical behavior of a decaying structure in the continuum scale and gives a better understanding of the fatigue damage process for composite materials [32,33,34,35,36,37,38,39]. In this macroscopic science of continuous damage, the damage variable D is normalized at zero for the initial undamaged state and at unity for the failure (n = N). An advantage of nonlinear models is that they can deal with the effect of the loading sequence, which linear models cannot. Therefore, a nonlinear model of fatigue damage accumulation is formed by selecting and identifying the structure of the function D(n/N). Nonetheless, it is important to note that the major issue of CDM, which is identifying the damage concept and constructing the appropriate evolutionary equation for the damage function, continues to be unresolved. Moreover, it is important to establish a suitable damage growth equation that can accurately reflect the character of the damage in composite materials [40].
The focus of this study is to create a theory capable of predicting the damage and fatigue life of different composite laminates under varying loads. Obviously, there are some differences between composites and metals in terms of fatigue damage. At a macroscopic level, however, composites and metals present distinct similarities regarding their fatigue damage behavior, and these are revealed in the present work with the radical concept of hyperbolic isodamage curves, introduced for the first time by the first author [40]. The theory utilizes CDM and considers remaining life aspects, with failure occurring when the total damage surpasses a critical limit. The resulting fatigue damage accumulation rule is nonlinear but may be straightforwardly applied in design using input data from typical S-N curves. Independent experimental results have confirmed the validity of this model, which offers several advantages over existing approaches. The study concludes with the fact that several well-known fatigue damage rules may be generated from this model as a special case, and it is emphasized that utilizing the proposed model is no more demanding than using the original LDR.

2. Damage Function

The accumulation of damage is a phenomenon that relies on a failure path procedure, and its evolution is determined by an equation that involves the damage function D and a number of i = 1, 2, ..., n quantities qi influencing the process of damage accumulation. These quantities qi are dependent on a parameter that characterizes the path of the failure procedure and is denoted as λ. The damage evolutionary equation may be expressed by the following structure [38]:
d D d λ = f q 1 λ , q 2 λ , , q i ( λ )
In the occurrence of fatigue in composite laminates, the number of fatigue cycles n is a crucial parameter that characterizes the failure process. Based on the number of cycles n, the equation for the evolution of fatigue damage may be rewritten as:
d D d n = f q 1 n , q 2 n , , q i ( n )
where qi are now defined as functions of n.
For composite laminates fatigue, the above relationship may take the following form [26]:
d D d n = f ( D , n , σ , R , f n , ξ , T )
where σ denotes the maximum value of stress, R represents the stress ratio, fn stands for the loading frequency, ξ indicates the stacking sequence effect, and, lastly, T symbolizes the temperature, all applied via the same fatigue damage process in a pristine composite medium to create the damage D.
For many failure problems, it is a common tactic to assume that the relative degradation of structural integrity is linearly proportional to the loading evolution. For example, in the case of creep [39], which is a time-dependent phenomenon, it is usually assumed that the relative damage is proportional to the time. Similarly, for the fatigue problem under investigation, which is a cycle-dependent phenomenon, it is realistic to assume that the relative increase in damage is linearly proportional to the relative increase in cycle number. Given such a supposition, the last equation may be reformed as:
d D D = φ ( σ ) d n n
where φ is a whole function of factors R, fn, ξ, and T.
A first-order approximation results in a simplified differential equation [39]. Considering that the number of cycles to failure N is related to the maximum stress σ, the stress ratio R, the frequency fn, the stacking parameter ξ, and the temperature T as well as that the accumulated damage D reaches the critical threshold Df (D = Df) for a particular number of cycles to failure n = N(σ, R, fn, ξ, T), the above differential equation is reformed to:
D D f = n N ( σ , R , f n , ξ , T ) φ ( σ )
Considering that Df = 1 is the critical failure value, the last equation yields the following damage function:
D = n N φ ( σ )
The factor φ(σ) as well as the damage concept still needs to be determined.
The identification of the fatigue damage concept of composite laminates may be achieved by using a curve that associates the loading conditions with the number of cycles to failure. This curve, known as the S-N curve, relates cyclic stress with the number of cycles to failure. In addition, the slope of the S-N curve is affected by the factors of the mean stress, temperature, fn, and ξ.
Extensive experimental efforts have been made to determine the relationship between σ and N for various composite laminates and loading conditions. The resulting curve line in a double logarithmic plot is concave downward and does not represent a fatigue limit. This curve can be described by a simple hyperbolic expression [14,41], which is more effective in describing the experimental data than other curves. The expression is given by:
l o g σ σ f 1 = c l o g N N m 1
where σf is the fatigue strength coefficient, i.e., the fatigue strength at one cycle, while Nm is the minimum number of cycles that are required in order for the damage to be initiated (number of normalization cycles), and C is a constant.
Fatigue failure occurs at each point along the [log(σ/σf)]−1 vs. log(N/Nm) curve, while damage occurs without failure at each point along the [log(σ/σf)]−1 vs. log(n/Nm) curve. Each of the three curves, which are depicted in Figure 1, represents one member of an isodamage lines family. As depicted in Figure 1, the upper bound of the fatigue damage zone is defined by the log(σ/σf) vs. log(N/Nm) curve. In Figure 1, the B and B’ points belong to the [log(σ/σf)]−1 vs. log(n/Nm) curve while the D point lies on the [log(σ/σf)]−1 vs. log(N/Nm) curve. The A point denotes the normalized stress that corresponds to the B as well as D curve points. In addition, the A’ point represents the normalized stress corresponding to the B’ curve point. Finally, the C, E and C’ points indicate the normalized cycles that correspond to the B, D and B’ curve points, respectively. The isodamage curves of this family have a unique feature where their points are vertices of equivalent rectangles. For instance, in Figure 1, the area (0ABC) of the rectangle 0ABC is equal to the area (0A’B’C’) of the rectangle 0A’B’C’ due to Equation (7). The equality of the specific areas is due to the hyperbolic behavior of the isodamage curves, a characteristic that also reflects the experimentally observed hyperbolic damage evolution.
As a result, it is reasonable to classify the fatigue damage concept by means of the magnitude:
D = ( 0 A B C ) ( 0 A D E ) = log σ σ f 1 · log n N m log σ σ f 1 · log N N m
where (0ADE) denotes the area of the rectangle 0ADE. This definition of magnitude D satisfies the boundary conditions D = 1 if n = N as well as D = 0 if n = Nm.
It should be noted that Equation (6) expresses the damage evolution, while Equation (8) proposes a new approach regarding the fatigue damage concept. However, here, it is proved that the combination of these two expressions, which are certainly not contradictory to each other, may lead to the development of a generalized theoretical model that provides better approximations in comparison with other nonlinear damage rules.
The description of the damage concept by Equation (8) is in agreement with the experimental reality since the S-N curves, independently of their type, are essentially failure curves.

3. Damage Analysis under Step Loading

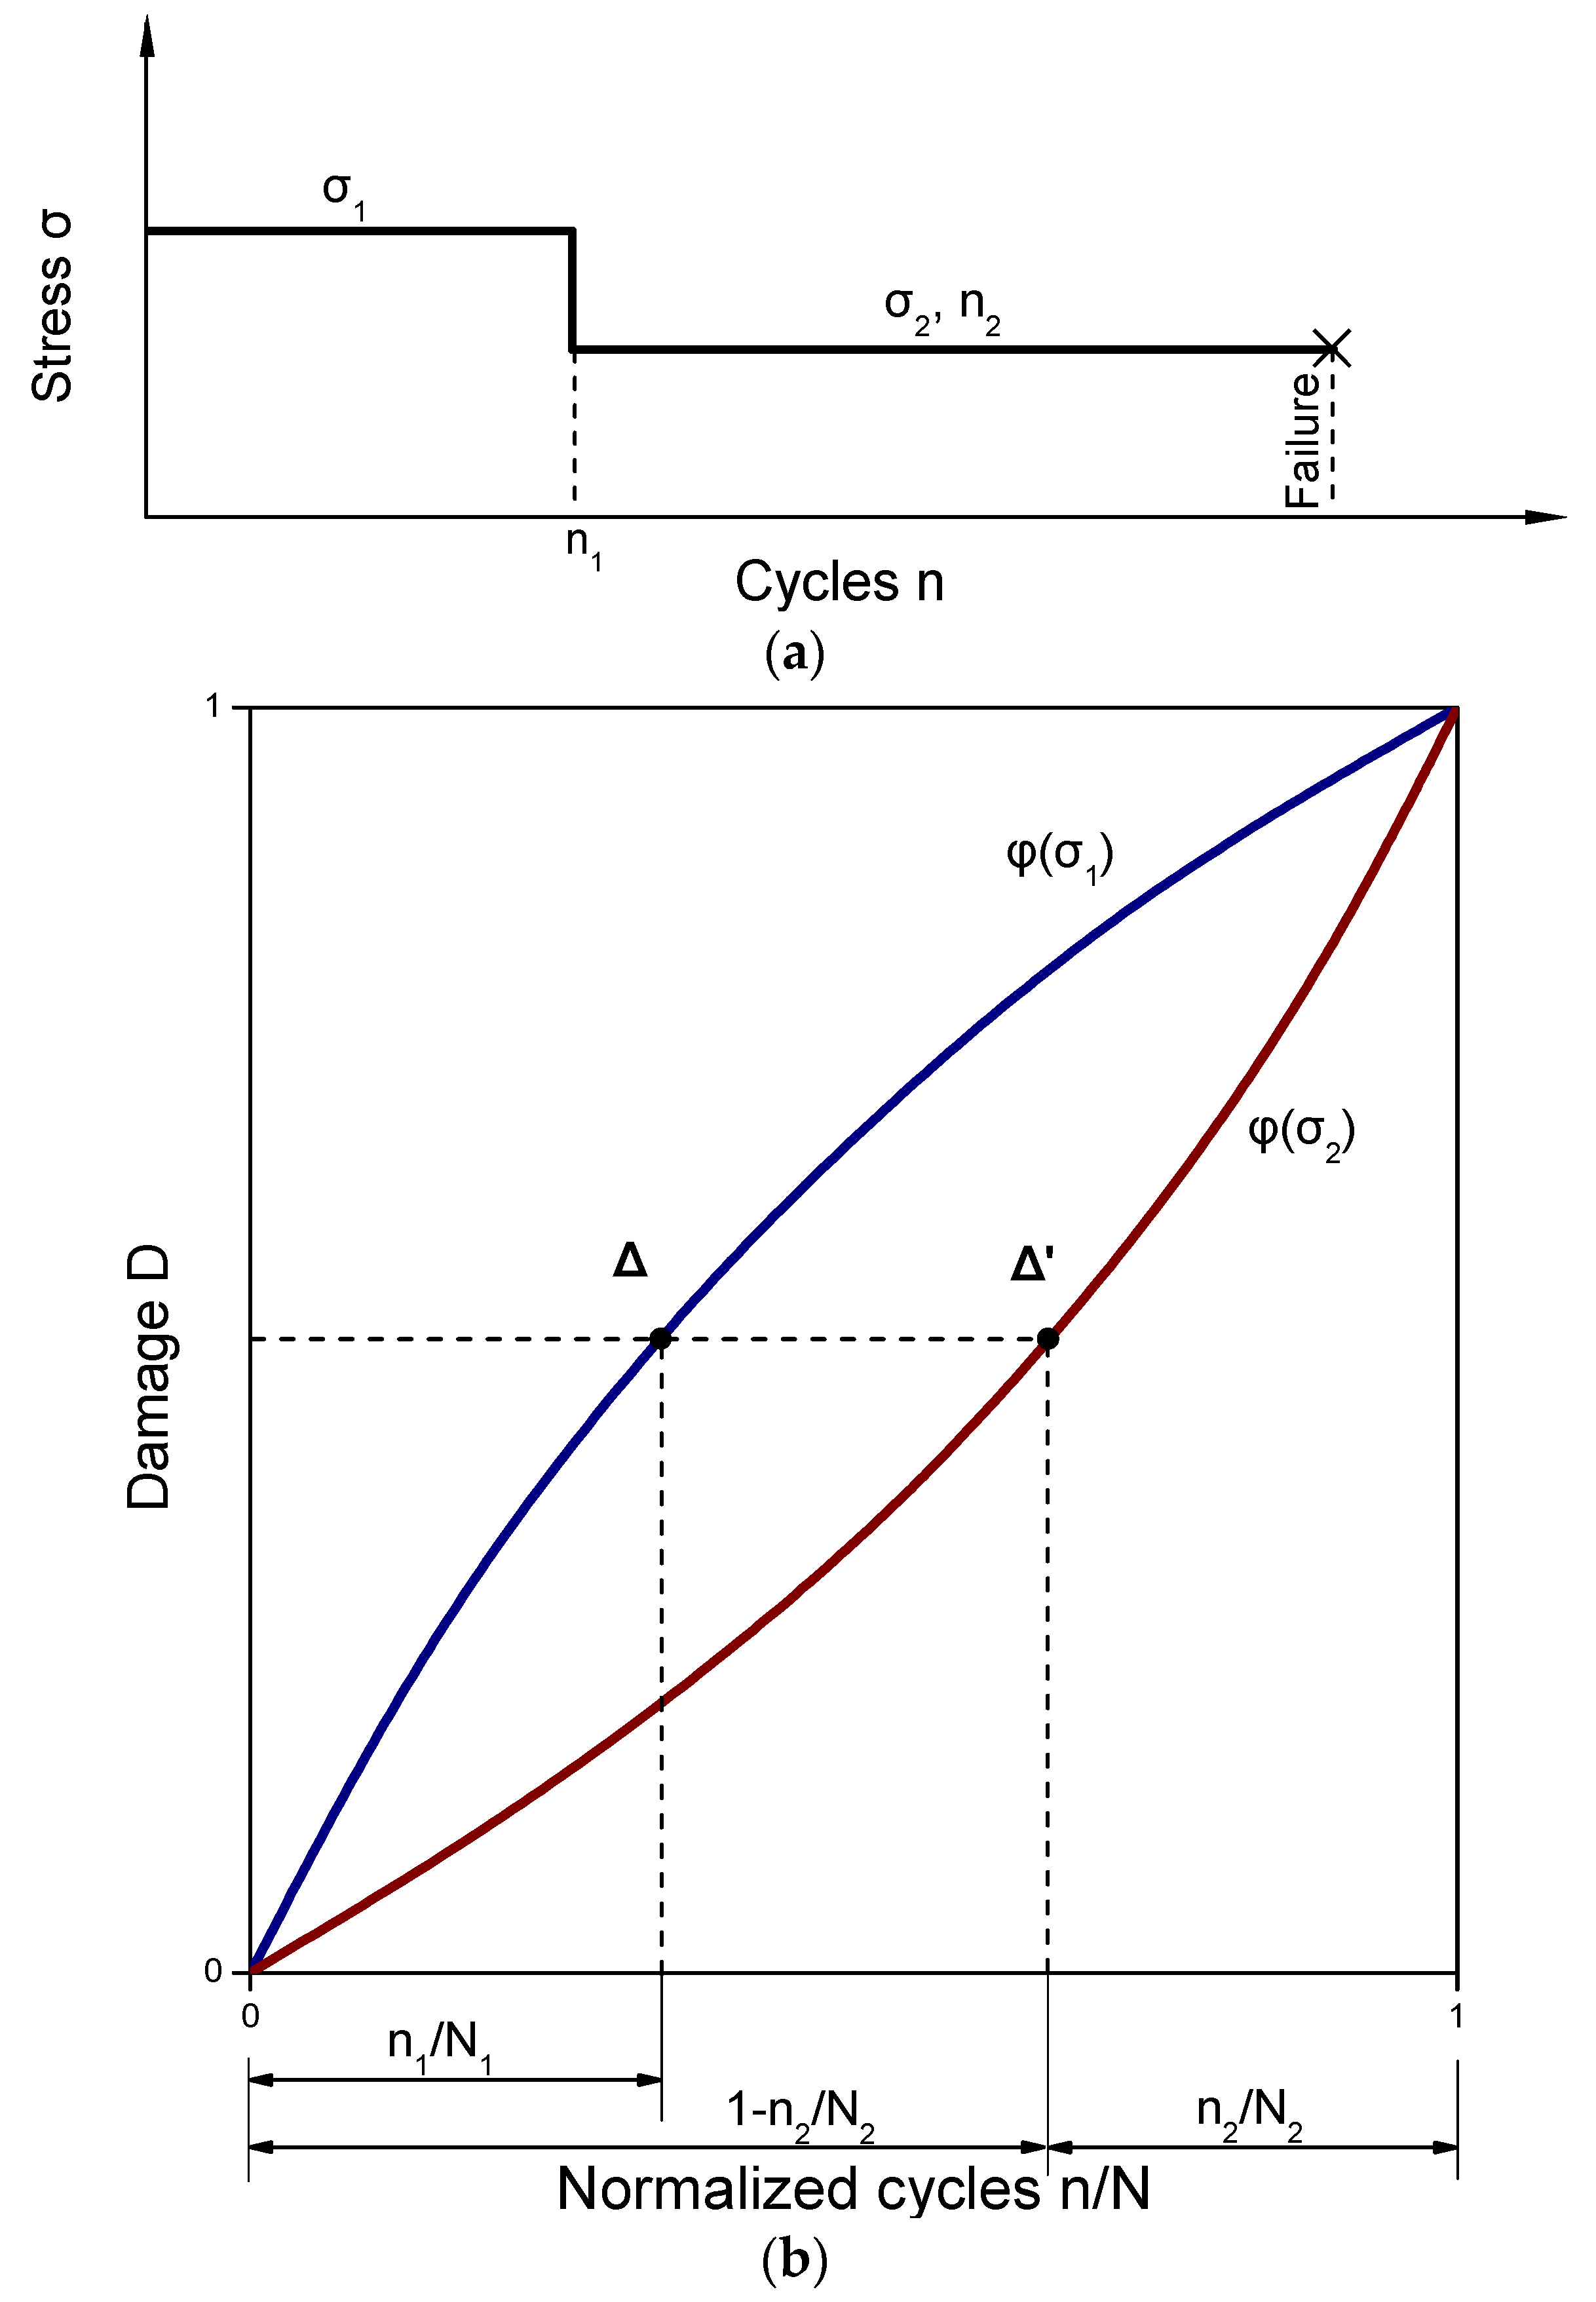
Figure 2 illustrates the curves for various exponents φ(σ) based on Function (6). Assume that the (n1, σ1) conditions are applied during the first step. At the finalization of the first step, the accumulated damage level D can be represented by the point Δ, which corresponds to the life at the σ1 level, denoted as N1. Moving to the second load level described by (n2, σ2) conditions, the point Δ shifts to Δ′, where the life N2 of the σ2 level is located. The loading continues until D equals one, which results in failure. By knowing the damage curves for different φ(σ) values, the lives can be estimated. As the damage defined by points Δ and Δ′ in Figure 2b is the same, the following equation can be derived:
n 1 N 1 φ ( σ 1 ) = 1 n 2 N 2 φ ( σ 2 )
or
n 1 N 1 φ 1,2 + n 2 N 2 = 1
where
φ 1,2 = φ ( σ 1 ) φ ( σ 2 )
Equation (10) may take the form:
n 2 N 2 = 1 n 1 N 1 φ ( σ 1 ) / φ ( σ 2 )
From this equation, it is seen that the term (n1/N1)φ(σ1)/φ(σ2) is an equivalent cycle ratio at the second stress level, due to a cycle ratio n1/N1 run at the first stress level. Therefore, the total number of equivalent cycles n2q at the end of the second level is given by:
n 2 q N 2 = n 1 N 1 φ ( σ 1 ) / φ ( σ 2 ) + n 2 N 2
We can now treat the equivalent number of cycles n2q at σ2 and n3 at σ3 as a two-stage loading. It is:
n 2 q N 2 φ ( σ 2 ) / φ ( σ 3 ) + n 3 N 3 = 1
Substituting Equation (12b) into Equation (12c), we obtain the following relationship:
n 1 N 1 φ ( σ 1 ) / φ ( σ 2 ) + n 2 N 2 φ ( σ 2 ) / φ ( σ 3 ) + n 3 N 3 = 1
or
n 1 N 1 φ 1,2 + n 2 N 2 φ 2,3 + n 3 N 3 = 1
where n1/N1 and n2/N2 are the cycle ratios that hold for the first and second steps, respectively, n3/N3 is the estimated remaining cycle ratio that corresponds to the final third step, and φ2,3 = φ(σ2)/φ(σ3).
Evidently, when a multistep loading is considered, then the equivalent form of the aforementioned equation is:
n 1 N 1 φ 1,2 + n 2 N 2 φ 2,3 + n 3 N 3 φ 3,4 + n ν 1 N ν 1 φ ν 1 , ν + n ν N ν = 1
where subscript ν denotes the final step, while:
φ ν 1 , ν = φ ( σ ν 1 ) φ ( σ ν )
Note that the above exponent φν−1,ν is yet to be determined.
Let us assume a composite specimen under a loading defined by the (n1, σ1) conditions. The damage D is equal to the ratio of the (ABGO) area to the (ACKO) area, both depicted in Figure 3. In the specific figure, the B and E points belong to the curve for D1 = D2 while the C and F points lie on the curve for D = 1. The A point denotes the normalized stress that corresponds to the B as well as C curve points whereas the D point denotes the normalized stress that corresponds to the E as well as F curve points. Finally, the G, H, K, and L points indicate the normalized cycles that correspond to the B, E, C and F curve points, respectively. Moreover, assume that the failure occurs after a second loading step governed by the (n2, σ2) conditions. The cycles n2 at the second step may be expressed as:
n 2 = N 2 n *
where n* represents the number of additional cycles that are required within the second load step in order to yield an amount of damage that is equivalent to the one corresponding to the first step (n1, σ1). Now, Equation (15) may take the form:
n * N 2 + n 2 N 2 = 1
The following equations may be obtained from Figure 3 regarding the areas (ABGO) and (DEHO) shown in Figure 3, respectively:
A B G O = log σ 1 σ f 1 · log n 1 N m
D E H O = log σ 2 σ f 1 · log n 1 N m
Since these two areas are equal, the above equations lead to the following expression:
log n * N m = log n 1 N m · log σ 1 σ f 1 log σ 2 σ f 1
or
n * N m = 10 log n 1 N m · log σ 2 σ f log σ 1 σ f
or
n * N m = n 1 N m log σ 2 σ f log σ 1 σ f
In addition, regarding the areas (ACKO) and (DFLO) illustrated in Figure 3, it may be written as:
A C K O = log σ 1 σ f 1 · log N 1 N m
( D F L O ) = log σ 2 σ f 1 · log N 2 N m
The areas defined by Equations (19a) and (19b) are equal as well and thus:
log N 2 N m = log N 1 N m · log σ 1 σ f 1 log σ 2 σ f 1
or
N 2 N m = 10 log N 1 N m · log σ 2 σ f log σ 1 σ f
or
N 2 N m = N 1 N m log σ 2 σ f log σ 1 σ f
By substituting Equations (18c) and (20c) into Equation (16), the following relationship is derived:
n 1 N 1 log ( σ 2 / σ f ) log σ 1 / σ f + n 2 N 2 = 1
By comparing Equations (10) and (21), it is concluded that:
φ 1,2 = log ( σ 2 / σ f ) log σ 1 / σ f
Generalization of the above equation leads to:
φ ν 1 , ν = log ( σ ν / σ f ) log σ ν 1 / σ f
Hence, Equation (12) for multistep loading may be written in a generalized form expressing a damage accumulation rule for multilevel fatigue:
n 1 N 1 log ( σ 2 / σ f ) log σ 1 / σ f + n 2 N 2 log ( σ 3 / σ f ) log σ 2 / σ f + n 3 N 3 log ( σ 4 / σ f ) log 3 / σ f + + n ν 1 Ν ν 1 log ( σ ν / σ f ) log σ ν 1 / σ f + n ν N ν = 1
From the arisen generalized rule (24), it becomes evident that the damage accumulation is not solely based on the stress applied but also on the order in which the loading conditions occur.

4. Results and Discussion

Rule (24) shares a similar functional form with several well-known fatigue damage rules commonly used in composite materials. Some of these rules can actually be derived as a specific case of formula (24). For instance, LDR may be obtained by using the simplified condition φν−1,ν = 1 in Equation (24). Additionally, by setting φ ν 1 , ν = α 2 / α 1 , where the exponent is determined experimentally [16], we obtain the power rule proposed by Marko and Starkey. Similarly, assuming φ ν 1 , ν = ( Ν ν 1 / Ν ν ) 0.4 , we obtain the rule suggested by Manson and Halford [42]. Incorporating φ ν 1 , ν = ( 1 S ν ) / ( 1 S ν 1 ) , where Sν = σνu and Sν−1 = σν−1u, where σu is the tensile static strength, we obtain the rule proposed by Hashin and Rotem [16,43]. Lastly, utilizing φ ν 1 , ν = log w ν t / l o g ( w ν 1 t ) , where wt is the total strain energy density, we obtain the rule proposed by Golos and Ellyin [19].
Besides the above, values to the exponent have been defined in many different ways: entirely experimentally or involving fitting parameters to be determined from experiments [44,45,46,47,48]. It should be noted that the proposed model is grounded on a unique property, i.e., σf, which reflects the material dynamic characteristics. This feature of the presented rule is the main advantage against the other ones, which almost always employ more parameters, some of which result from sophisticated experiments.
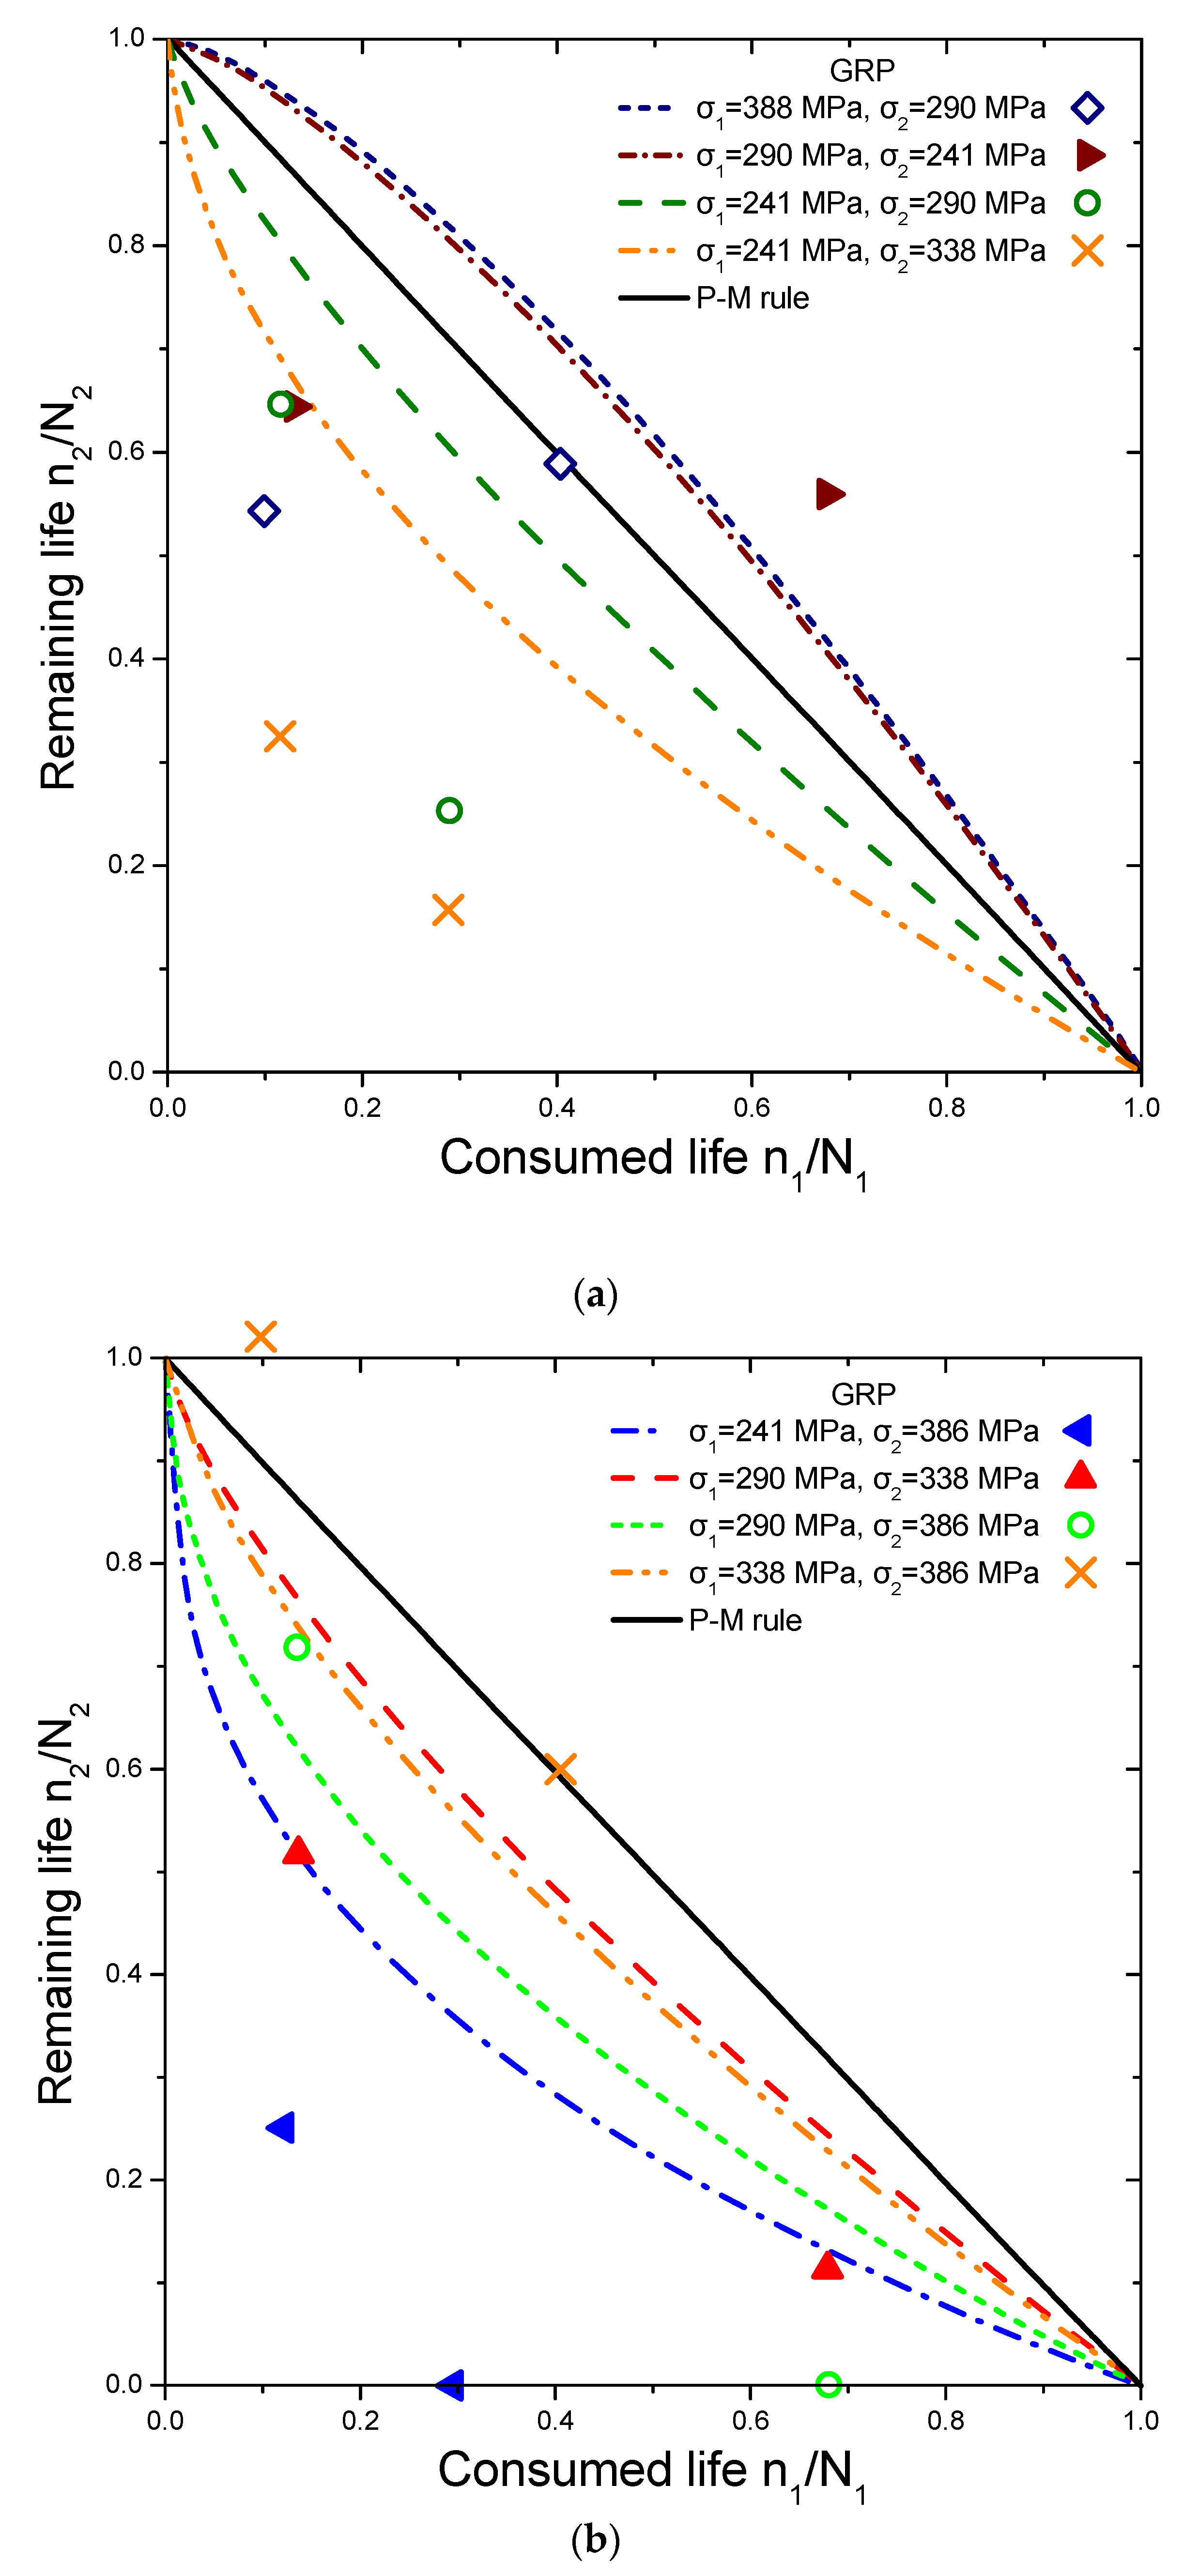
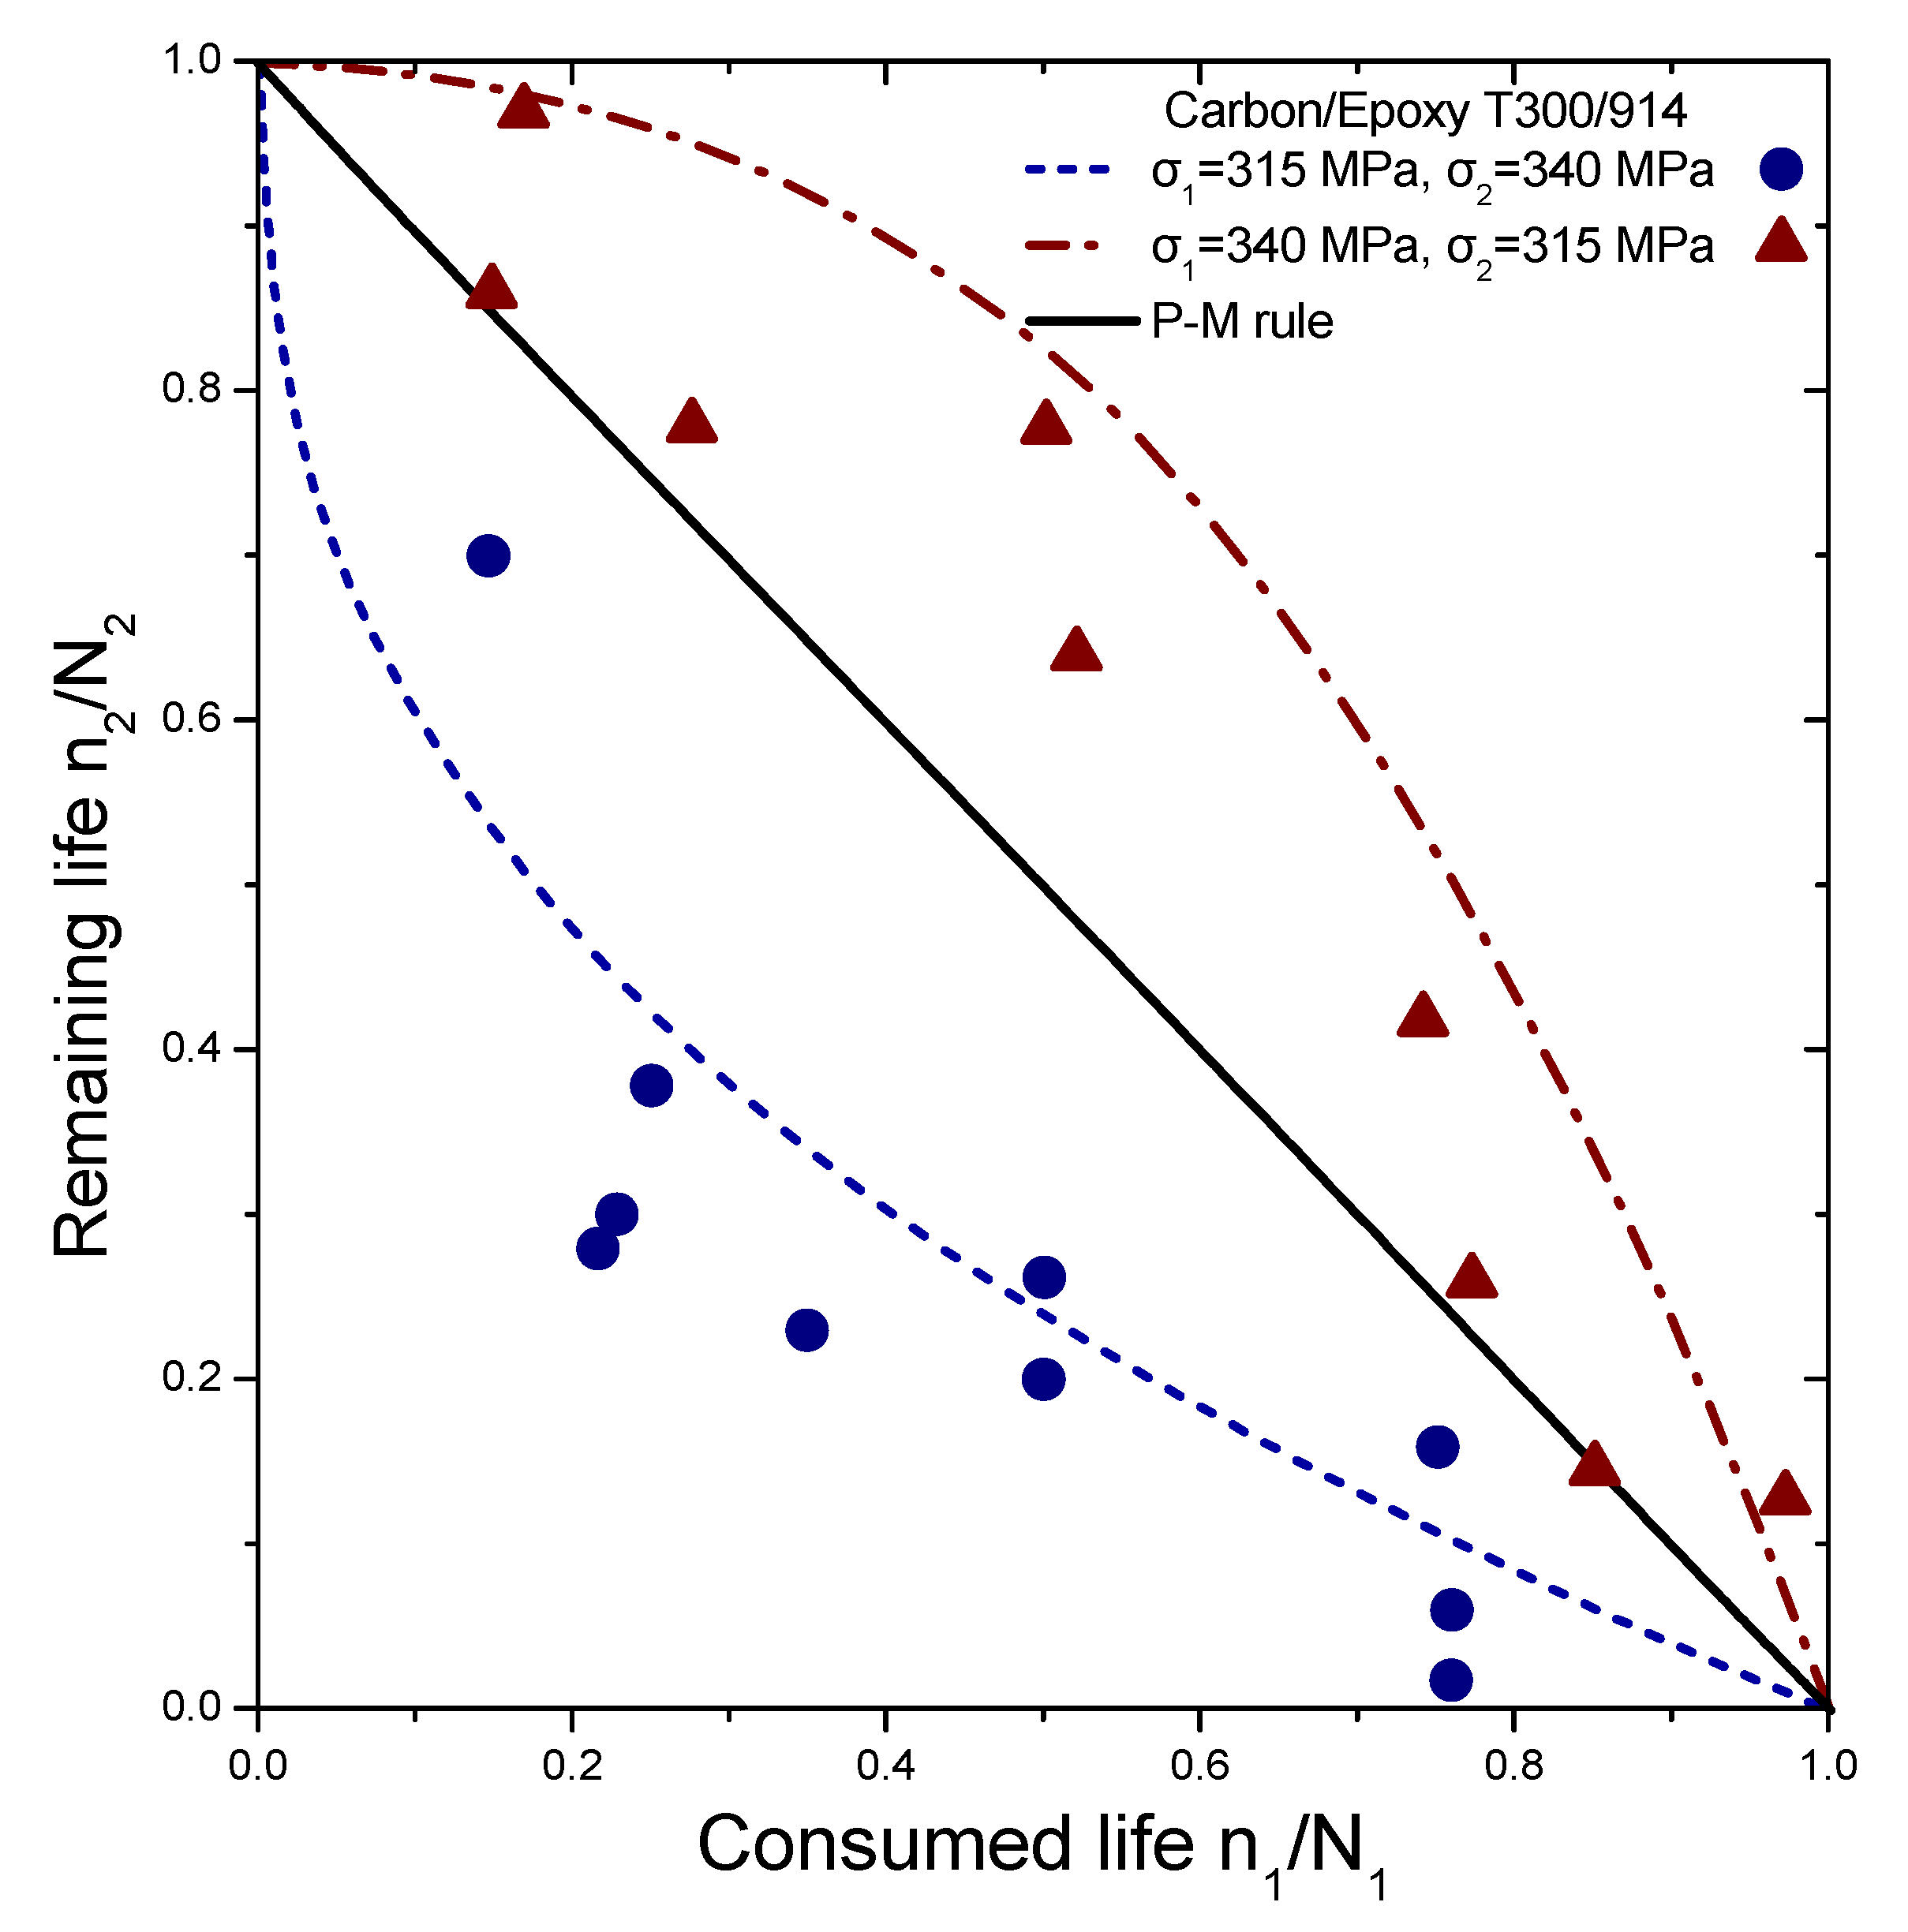
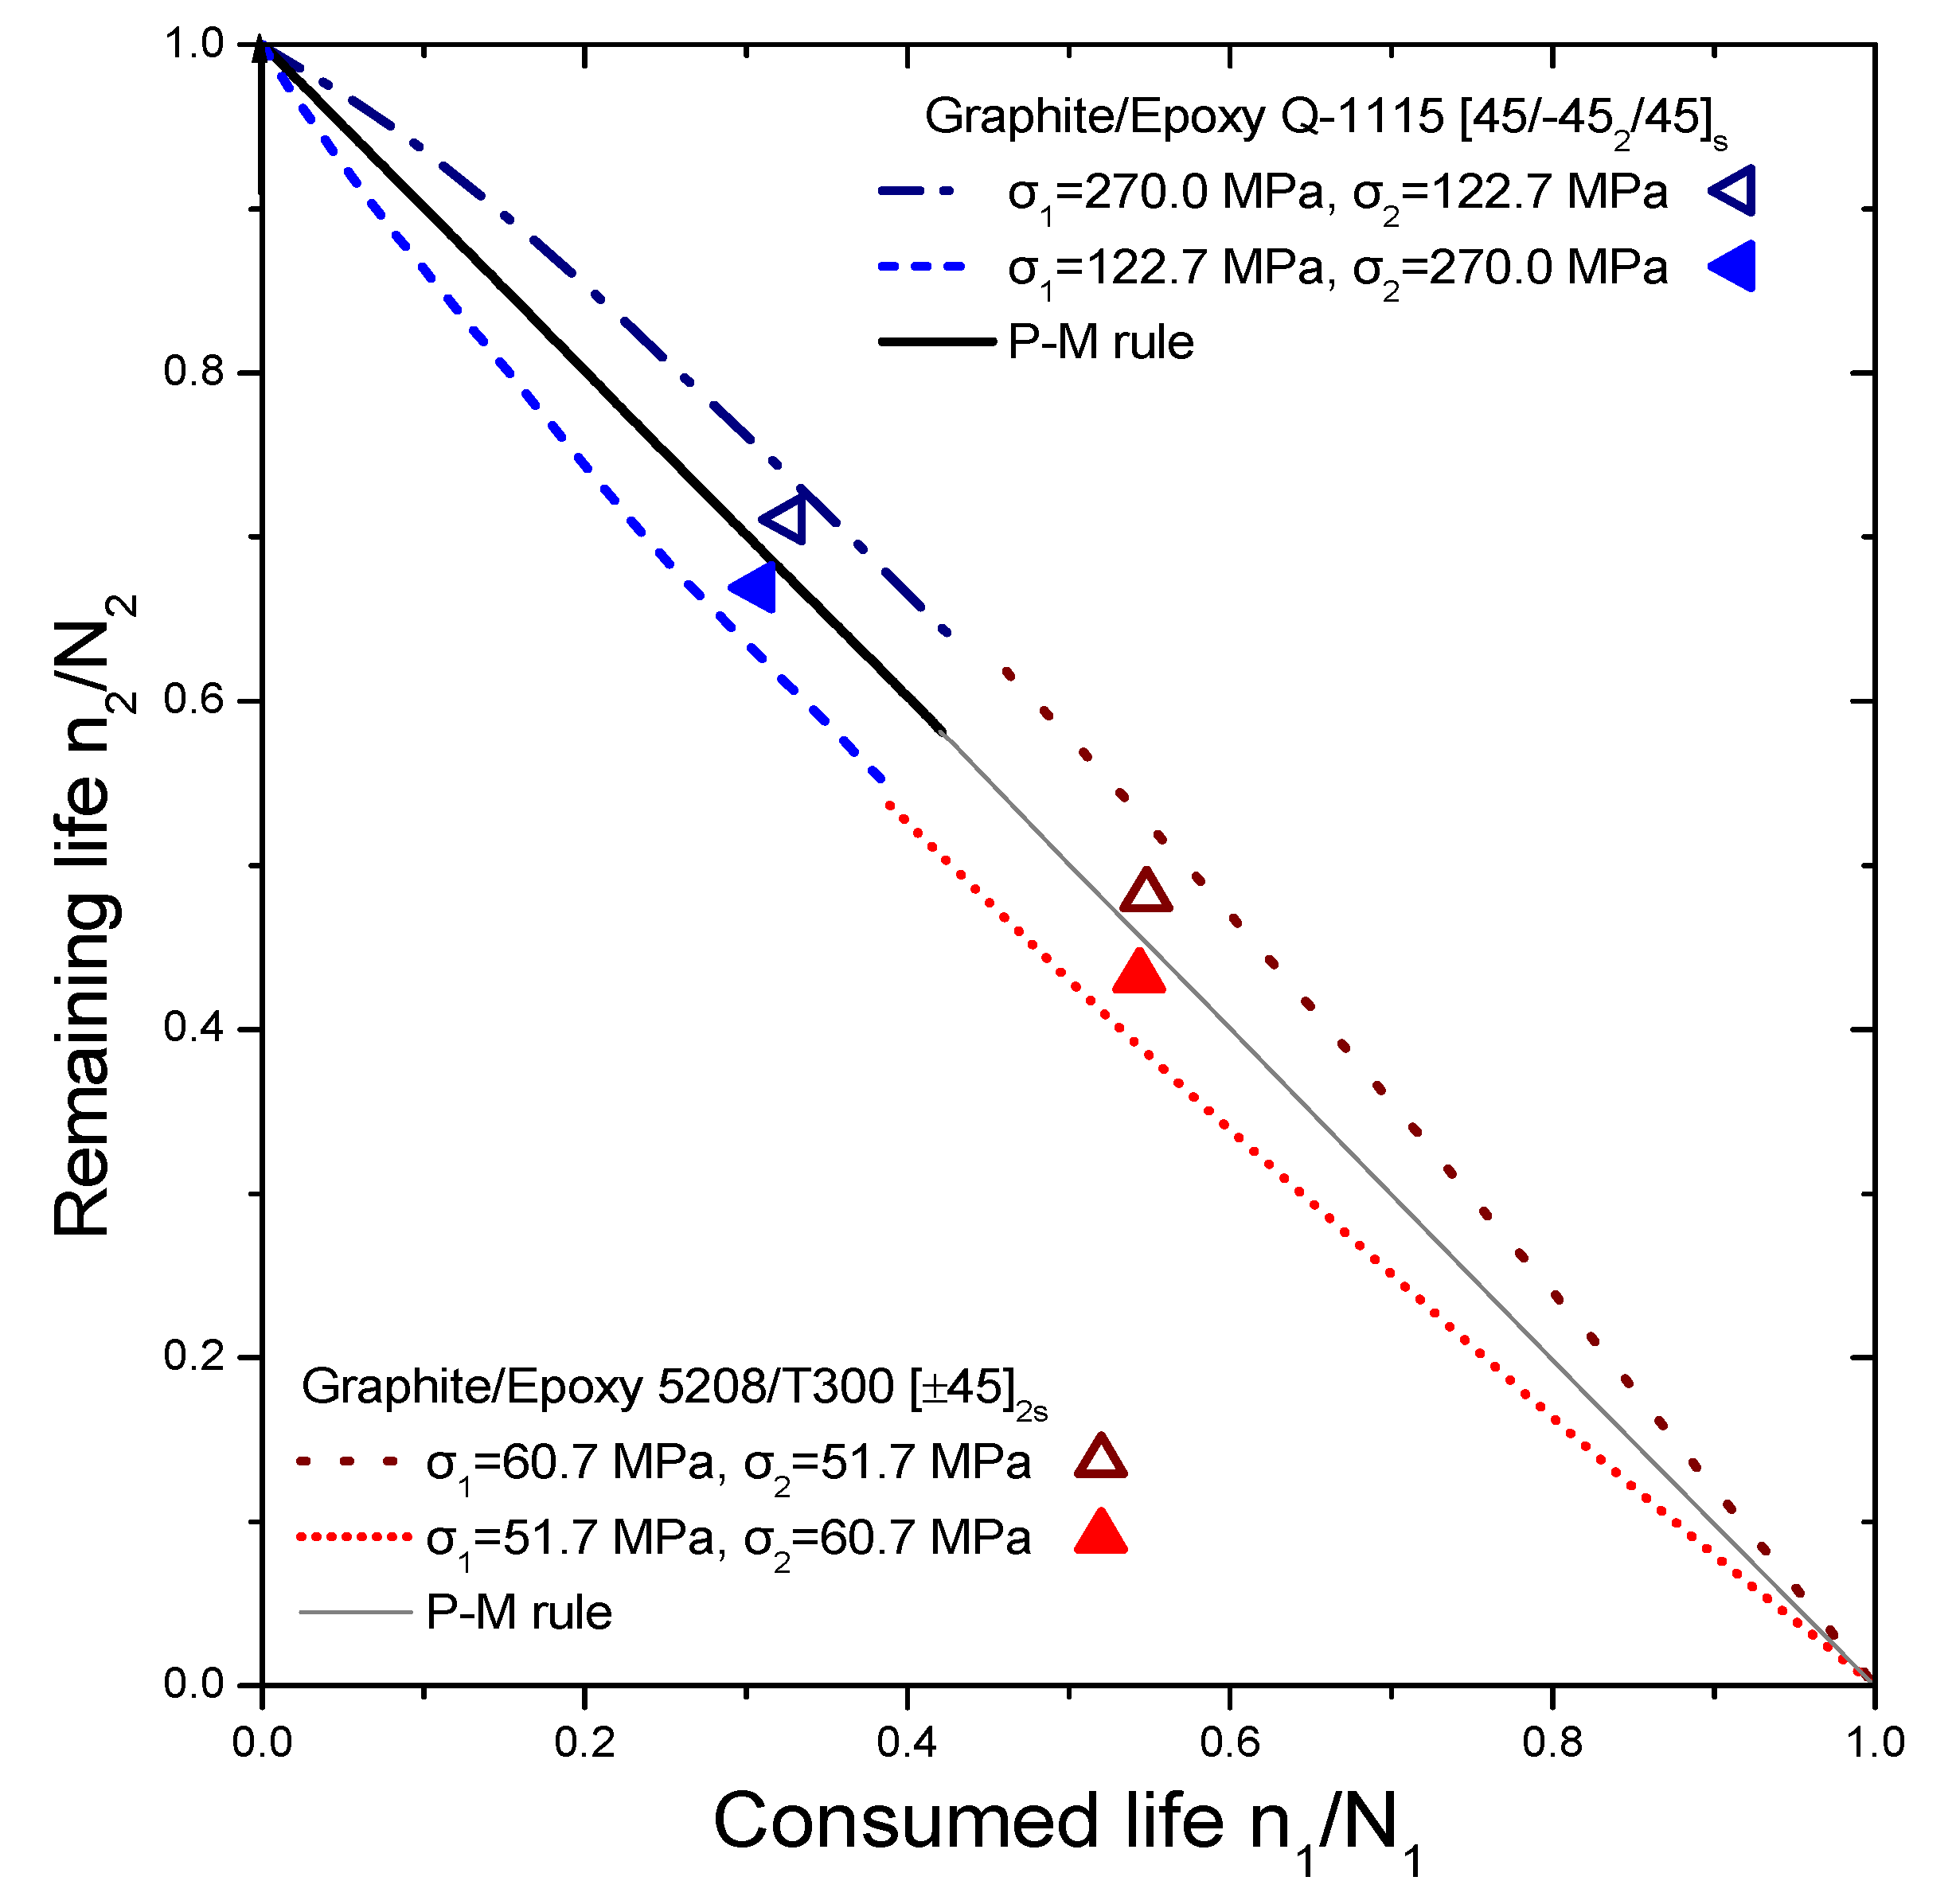
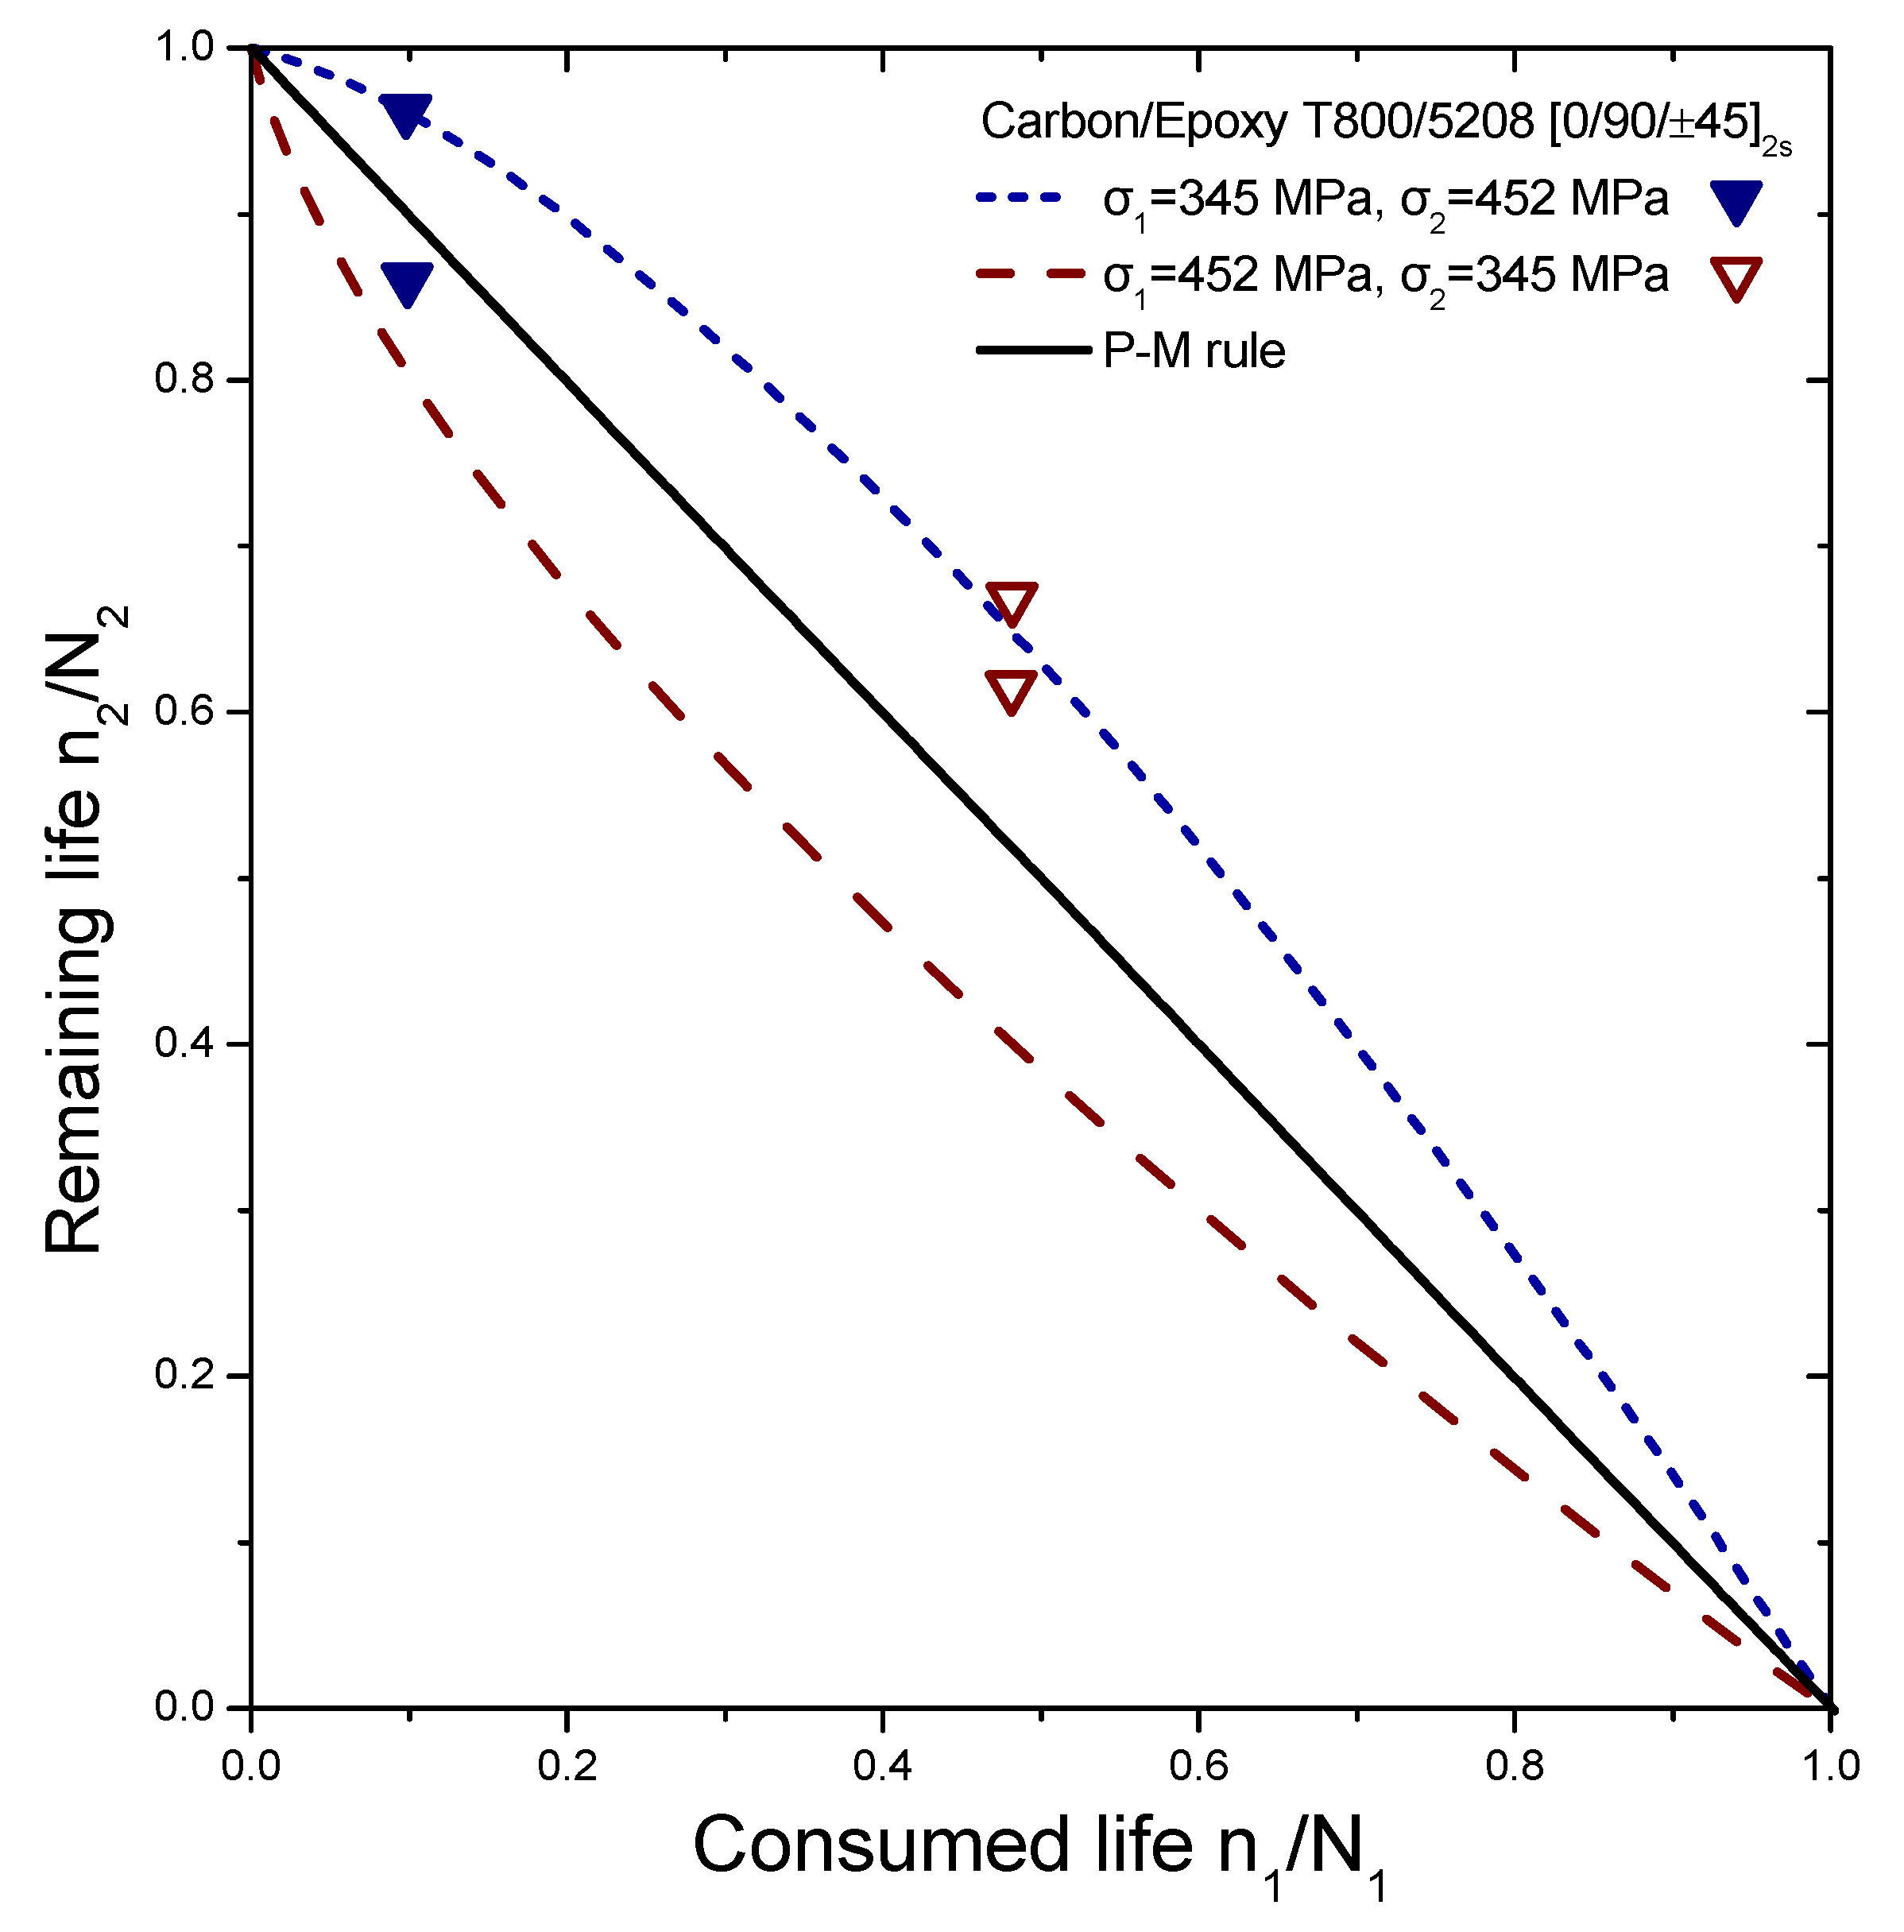
The reliability of the proposed model is tested by comparing its prediction results with independent experimental data from different composite laminates and loadings, demonstrating its versatility. This data set contains various experiments conducted on different types of laminates, including cross-ply glass/epoxy (GRP), woven carbon fibre/epoxy resin (carbon-epoxy T300/914C), graphite/epoxy (5208/T300 and T300/5208), and composite laminates (Q-1115). The experiments involve step loadings and stress ratios, with the results presented in Figure 4, Figure 5, Figure 6 and Figure 7. The first step of loading involves n1 cycles at stress σ1 normalized by lifetime N1, while the second one involves σ2 with remaining lifetime n2 normalized by lifetime N2.
The selected experiments used for comparisons include data under step loadings for cross-ply glass/epoxy laminates (GRP) [44], [0/90/± 4 5 2 /10/90]S quasi-isotropic woven carbon fibre/epoxy resin laminate (carbon-epoxy T300/914C) at stress ratio R = 0.05 [16], T300/5208 graphite/epoxy [ ± 45 2 ] laminates at stress ratio R = 0.1 [49], T800/5208 graphite/epoxy quasi-isotropic laminates of [0/90/ ± 45 2 ]S at stress ratio R = 0.05 [41], and graphite/epoxy (Q-1115) of eight-layer [45/−452/45]S composite laminates [50]. The criterion for the selection of the experimental data was to cover a wide range of composite materials in order to demonstrate the generality of the model and its applicability to treat significantly different materials. The values of the fatigue strength coefficient σf of all the materials under investigation are presented in Table 1. Generally, it is realistic to assume a 5% variance regarding the estimation of these values. Details about the type of loading may be found in Table 2. The curves shown in Figure 4, Figure 5, Figure 6 and Figure 7 depict the predictions of Equation (21). The P–M rule-based predictions are included in all the following figures for reasons of qualitative comparison. Relatively good agreement between the present prediction and the experimental results may be noticed. The current rule requires the same input as any cumulative damage analysis, and no additional data are needed. All the above results point out that for two-stage loading, a low-to-high loading sequence is generally more damaging than a high-to-low sequence. For many metallic materials, the reverse situation occurs in terms of the sequence of the two-stage loading. In a few cases, only a more damaging effect of the high-to-low sequence has been reported for composite laminates. In these cases, the S-N curves are concave upward, and the rule takes the form [40]:
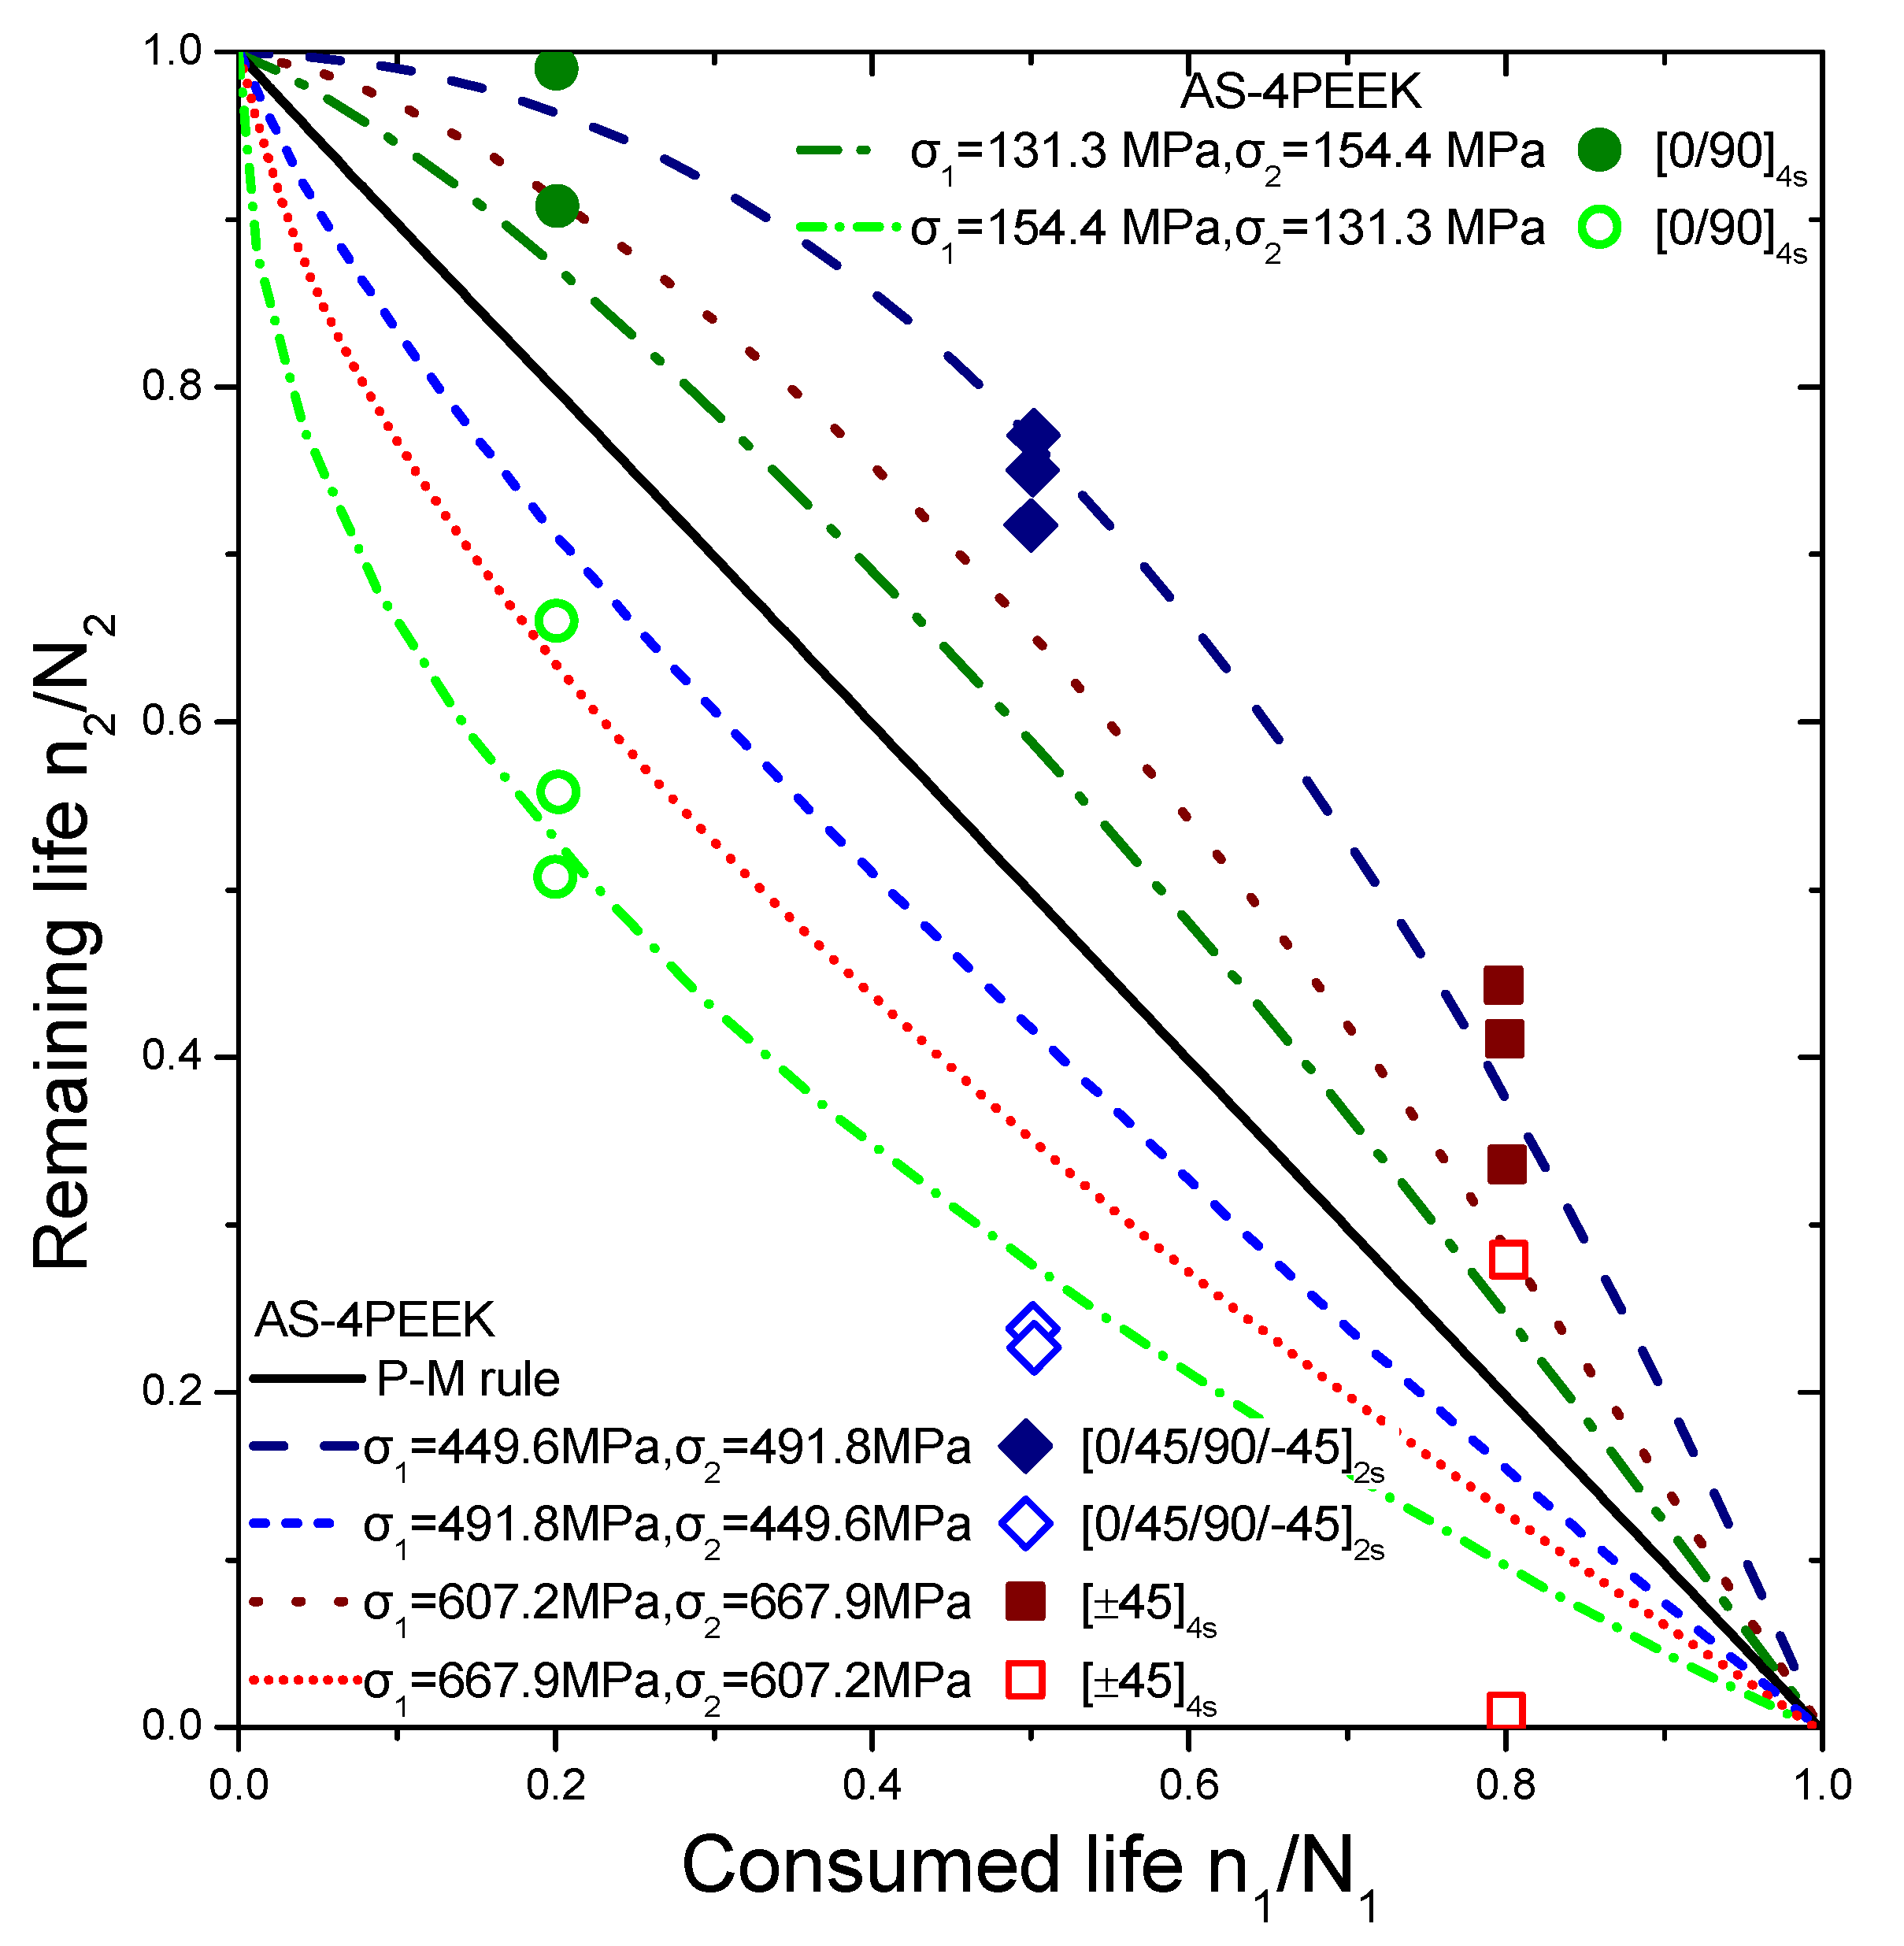
n 1 N 1 log ( σ 1 / σ f ) log ( σ 2 / σ f ) + n 2 N 2 = 1
In these cases also, the selected experiments provide measurements under step loading concerning continuous carbon fibers reinforced PEEK thermoplastic matrix composite (AS-4/PEEK). The specific composite material has three layups of [0,90]4S, [0/45/90/−45]2S, and [±45]4S, while its performance is tested under two stress ratios, R1 = 0 and R2 = 0.2, and two frequencies, f1 = 25 Hz and f2 = 5 Hz [45]. The curves that are depicted in Figure 8 are graphical representations of Equation (25). The reasonable agreement between the present results and experimental ones may be seen here as well. A discrepancy may be observed between the present theoretical and other corresponding experimental estimations regarding the GRP case. However, due to the inherent significant variance of the experimental measurements regarding GRP composites, additional experimental evidence combined with statistical analysis is required in future work to reach more coherent conclusions and find the exact limitations of the proposed model. Evidently, more complex loadings including triaxial stress state problems require further investigation.

5. Conclusions

This study focuses on a new damage mechanics theory for evaluating fatigue damage and predicting the fatigue life of composite laminates under varying load conditions. The theory is grounded on the hyperbolic isodamage curve family concept, which encompasses any fatigue loading series. Its analytical structure is developed similarly to S-N curve representations, with a failure criterion that relates isodamage curve areas to the number of cycles until failure. With only one material property, a nonlinear cumulative damage rule is fully specified. Some established fatigue damage rules can be derived as special cases of this model. The proposed cumulative damage rule is dependent on stress and sequence and does not require fitting parameters to be evaluated from experiments. The S-N curve establishment is enough for estimating life in loading histories characterized by multiple levels of stress. Various independent tests have been analyzed, and the model’s predictions have a good correlation with the experimental outcomes.

6. Future Developments

Due to its general nature, the demonstrated rule may be proposed and evaluated for the representation of the fatigue behavior of composite laminates reinforced with typical graphitic phases, carbon nanomaterials, or metallic nanoparticles. Furthermore, a very interesting goal for future research is the development of the current formulation for the characterization of fatigue damage, considering triaxial stress state and/or phase anisotropy.

Author Contributions

Conceptualization, N.D.B.; methodology, N.D.B.; software, N.D.B. and G.I.G.; validation, N.D.B. and G.I.G.; formal analysis, N.D.B. and G.I.G.; investigation, N.D.B. and G.I.G.; resources, N.D.B. and G.I.G.; data curation, N.D.B. and G.I.G.; writing—original draft preparation, N.D.B. and G.I.G.; writing—review and editing, N.D.B. and G.I.G.; visualization, N.D.B. and G.I.G. All authors have read and agreed to the published version of the manuscript.

Funding

This research received no external funding.

Institutional Review Board Statement

Not applicable.

Informed Consent Statement

Not applicable.

Data Availability Statement

The data that support the findings of this article are available from the corresponding author, upon reasonable request.

Conflicts of Interest

The authors declare no conflict of interest.

References

  1. Faidzi, M.K.; Abdullah, S.; Abdullah, M.F.; Singh, S.S.K.; Hui, D. Geometrical effects of different core designs on metal sandwich panel under static and fatigue condition. J. Braz. Soc. Mech. Sci. 2022, 44, 111. [Google Scholar] [CrossRef]
  2. Li, X.; Sun, Q. Simplification approaches for multi-level load spectra by using equivalent damage rule. Chin. J. Aeronaut. 2021, 34, 119–130. [Google Scholar] [CrossRef]
  3. Gan, L.; Zhao, X.; Wu, H.; Zhong, Z. Estimation of remaining fatigue life under two-step loading based on kernel-extreme learning machine. Int. J. Fatigue 2021, 148, 106190. [Google Scholar] [CrossRef]
  4. Hectors, K.; De Waele, W. Cumulative damage and life prediction models for high-cycle fatigue of metals: A review. Metals 2021, 11, 204. [Google Scholar] [CrossRef]
  5. Xia, F.-L.; Zhu, S.-P.; Liao, D.; Correia, J.A.F.O.; De Jesus, A.M.P. Isodamage curve-based fatigue damage accumulation model considering the exhaustion of static toughness. Eng. Fail. Anal. 2020, 115, 104575. [Google Scholar] [CrossRef]
  6. Li, Y.; Zhu, C.; Chen, X.; Tan, J. Fatigue reliability analysis of wind turbine drivetrain considering strength degradation and load sharing using survival signature and FTA. Energies 2020, 13, 2108. [Google Scholar] [CrossRef]
  7. Jia, P.; Liu, H.; Zhu, C.; Wu, W.; Lu, G. Contact fatigue life prediction of a bevel gear under spectrum loading. Front. Mech. Eng. 2020, 15, 123–132. [Google Scholar] [CrossRef]
  8. Zhu, S.-P.; Liao, D.; Liu, Q.; Correia, J.A.F.O.; De Jesus, A.M.P. Nonlinear fatigue damage accumulation: Isodamage curve-based model and life prediction aspects. Int. J. Fatigue 2019, 128, 105185. [Google Scholar] [CrossRef]
  9. Zhu, S.-P.; Hao, Y.-Z.; de Oliveira Correia, J.A.F.; Lesiuk, G.; de Jesus, A.M.P. Nonlinear fatigue damage accumulation and life prediction of metals: A comparative study. Fatigue Fract. Eng. Mater. Struct. 2019, 42, 1271–1282. [Google Scholar] [CrossRef]
  10. Jie, Z.; Li, Y.; Wei, X.; Zhuge, P. Fatigue life prediction of welded joints with artificial corrosion pits based on continuum damage mechanics. J. Constr. Steel Res. 2018, 148, 542–550. [Google Scholar] [CrossRef]
  11. Palmgren, A. Die Lebensdauer von Kugellagern. Z. Ver. Dtsch. Ing. 1924, 68, 339–341. [Google Scholar]
  12. Robinson, E.L. Effect of temperature variation on the creep strength of steels. Trans. ASME 1938, 60, 253–259. [Google Scholar] [CrossRef]
  13. Miner, M.A. Cumulative damage in fatigue. J. Appl. Mech. 1945, 67, A159–A164. [Google Scholar] [CrossRef]
  14. Aghazadeh Mohandesi, J.; Majidi, B. Fatigue damage accumulation in carbon/epoxy laminated composites. Mater. Des. 2009, 30, 1950–1956. [Google Scholar] [CrossRef]
  15. Marco, S.M.; Starkey, W.L. A concept of fatigue damage. Trans. ASME 1954, 76, 627–632. [Google Scholar] [CrossRef]
  16. Found, M.S.; Quaresinin, M. Two-stage fatigue loading of woven carbon fibre reinforced laminates. Fatigue Fract. Eng. Mater. Struct. 2002, 26, 17–26. [Google Scholar] [CrossRef]
  17. Fissolo, A.; Gourdin, C.; Chen, Y.; Perez, G.; Stelmaszyk, J.M. Investigations into the cumulative fatigue life of an AISI 304L austenitic stainless steel used for pressure water reactors: Application of a double linear damage rule. Int. J. Fatigue 2015, 77, 199–209. [Google Scholar] [CrossRef]
  18. Huffman, P.J.; Beckman, S.P. A non-linear damage accumulation fatigue model for predicting strain life at variable amplitude loading based on constant amplitude fatigue data. Int. J. Fatigue 2013, 48, 165–169. [Google Scholar] [CrossRef]
  19. Golos, K.M. A total strain energy density model of metal fatigue. Strength Mater. 1995, 27, 32–41. [Google Scholar] [CrossRef]
  20. Liu, Y.; Mahadevan, S. Stochastic fatigue damage modeling under variable amplitude loading. Int. J. Fatigue 2007, 29, 1149–1161. [Google Scholar] [CrossRef]
  21. Stepanskiy, L.G. Cumulative model of very high cycle fatigue. Fatigue. Fract. Eng Mater. Struct. 2012, 35, 513–522. [Google Scholar] [CrossRef]
  22. Fatemi, A.; Yang, L. Cumulative fatigue damage and life prediction theories: A survey of the state of the art for homogeneous materials. Int. J. Fatigue 1998, 20, 9–34. [Google Scholar] [CrossRef]
  23. Hwang, W.; Han, K.S. Fatigue of composites-fatigue modules concept and life prediction. Composites 1986, 20, 154–164. [Google Scholar]
  24. Whitworth, H.A. Modelling stiffness reduction of Gr/ep composite laminates. J. Compos. Mater. 1987, 21, 362–372. [Google Scholar] [CrossRef]
  25. Brutman, L.J.; Sahu, S.A. New theory to predict cumulative fatigue damage ln: Fiberglass reinforced plastics, composite materials: Testing and design. ASTM STP 1972, 497, 170–188. [Google Scholar]
  26. Lee, C.-H.; Jen, M.-H.R. Fatigue Response and modelling of variable stress amplitude and frequency in AS-4/PEEK composite laminates, part 2: Analysis and formulation. J. Compos. Mater. 2000, 34, 950–953. [Google Scholar] [CrossRef]
  27. Epaarachchi, J.A.; Clauseu, P.D. A new cumulative fatigue damage model for glass fibre reinforced plastic composites under step/discrete loading. Compos. Part A 2005, 36, 1236–1245. [Google Scholar] [CrossRef]
  28. Kachanov, L.M. Time to creep fracture. Izv. Akad. Nauk. SSSR Otd Tekh. Nauk. 1958, 8, 26–31. [Google Scholar]
  29. Rabotnov, Y.N. The mechanism of delayed fracture. In: Problems of strength of materials and structures. Izv. Akad. Nauk SSSR Mosc. 1959, 5–7. [Google Scholar]
  30. Rabotnov, Y.N. Creep Problems in Structural Members; North Holland Publishers: Amsterdam, The Netherlands, 1969. [Google Scholar]
  31. Kachanov, L.M. Introduction to Continuum Damage Mechanics; Martinus Nijhoff: Dordrecht, The Netherlands, 1986. [Google Scholar]
  32. Lemaitre, J.; Chaboche, J.L. Mechanics of Solid Materials; Cambridge University Press: Cambridge, UK, 1990. [Google Scholar]
  33. Desmorat, R.; Lemaitre, J. Engineering Damage Mechanics; Springer: Berlin/Heidelberg, Germany, 2005. [Google Scholar]
  34. Fan, Z.C.; Chen, X.D.; Chen, L.; Jiang, J.L. A CDM-based study of fatigue-creep interaction behavior. Int. J. Press Vessels Pip. 2009, 86, 628–632. [Google Scholar] [CrossRef]
  35. Dattoma, V.; Giancane, S.; Nobile, R.; Panella, F.W. Fatigue life prediction under variable loading based on a new non-linear continuum damage mechanics model. Int. J. Fatigue. 2006, 28, 89–95. [Google Scholar] [CrossRef]
  36. Hult, J. Continuum damage mechanics–a new design tool. In Materials and Engineering Design: The Next Decade; Dyson, B.F., Hayhurst, D.R., Eds.; Maney Publishing: Leeds, UK, 1989; pp. 199–204. [Google Scholar]
  37. Chaboch, J.L. Fracture mechanics and damage mechanics: Complementarity of approaches. In Numerical Methods of Fracture Mechanics, Proceedings of the Fourth International Conference, San Antonio, TX, USA, 23–27 March 1987; Luxmoore, A.R., Owen, D.R.J., Rajapakse, Y.P.D., Kanninen, M.F., Eds.; Pineridge Press: Swansea, UK, 1987; pp. 309–324. [Google Scholar]
  38. Golup, V.P. The nonlinear mechanics of continual damage and its application to problems of creep and fatigue. Int. Appl. Mech. 2000, 36, 303–342. [Google Scholar] [CrossRef]
  39. Batsoulas, N.D. Creep damage assessment and lifetime predictions for metallic materials under variable loading conditions in elevated temperature applications. Steel Res. Int. 2009, 80, 152–159. [Google Scholar]
  40. Batsoulas, N.D. Cumulative Fatigue Damage: CDM-based engineering rule and life prediction aspect. Steel Res. Int. 2016, 87, 1670–1677. [Google Scholar] [CrossRef]
  41. Jen, M.H.R.; Kau, Y.S.; Wu, I.C. Fatigue damage in a centrally notched composite laminate due to two-step spectrum loading. Fatigue 1994, 16, 193–201. [Google Scholar] [CrossRef]
  42. Manson, S.S.; Halford, G.R. Practical implementation of the double linear change rule and damage curve approach for treating cumulative fatigue damage. Int. J. Fract. 1981, 17, 169–192. [Google Scholar] [CrossRef]
  43. Hashin, Z.; Rotem, A. A cumulative damage theory of fatigue failure. Mater. Sci. Eng. 1978, 34, 147–160. [Google Scholar] [CrossRef]
  44. Yao, W.X.; Himmel, N. A new cumulative fatigue damage model for fibre-reinforced plastics. Compos Sci Technol. 2000, 60, 59–64. [Google Scholar] [CrossRef]
  45. Lee, C.-H.; Jen, M.-H.R. Fatigue Response and modelling of variable stress amplitude and frequency in AS-4/PEEK composite laminates, part 1: Experiments. J. Compos. Mater. 2000, 34, 906–929. [Google Scholar] [CrossRef]
  46. Gamstedt, E.K.; Sjogre, B.A. An experimental investigation of the sequence effect in block amplitude loading of cross-ply composite laminates. Int. J. Fatigue 2002, 24, 437–466. [Google Scholar] [CrossRef]
  47. Wu, F.; Yoo, W. A fatigue model of composite materials. Int. J. Fatigue 2010, 32, 134–138. [Google Scholar] [CrossRef]
  48. Shiri, S.; Pourgol-Mohammed, M.; Yazdani, M. Effect of strength dispersion on fatigue life prediction of composites under two-stage loading. Mater. Des. 2015, 65, 1189–1195. [Google Scholar] [CrossRef]
  49. Yang, J.N.; Jones, P.l. Effect of load sequence on the statistical fatigue of composites. AIAA J. 1980, 18, 1525–1531. [Google Scholar] [CrossRef]
  50. Kam, T.Y.; Tsai, S.Y.; Chu, K.H. Fatigue reliability analysis of composite laminates under spectrum stress. Int. J Solids Struct. 1997, 34, 1441–1461. [Google Scholar] [CrossRef]
Figure 1. Fatigue damage concept of composite laminates schematically.
Materials 16 03271 g001
Figure 2. Schematic illustration of fatigue growth until failure: (a) loading conditions with respect to cycles; (b) fatigue damage with respect to normalized cycles.
Materials 16 03271 g002
Figure 3. Schematic representation of fatigue damage accumulation regarding a two-stage loading.
Materials 16 03271 g003
Figure 4. (a,b) Analytical prediction of the remaining life versus consumed life for the case of glass/epoxy (GRP). The experimental data points are taken from Ref. [44].
Materials 16 03271 g004
Figure 5. Analytical prediction of remaining life versus consumed life for the case of carbon/epoxy (T300/914). The experimental data points are taken from Ref. [16].
Materials 16 03271 g005
Figure 6. Analytical prediction of remaining life versus consumed life for the case of graphite epoxy (T300/5208) and graphite epoxy (G-1115). The experimental data points are taken from Refs. [49,50].
Materials 16 03271 g006
Figure 7. Analytical prediction of the remaining life versus consumed life for the case of carbon/epoxy (T800/5208). The experimental data points are taken from Ref. [41].
Materials 16 03271 g007
Figure 8. Remaining life versus consumed life analytical predictions for the case of AS-4/PEEK composite laminates. The experimental data points are taken from Ref. [45].
Materials 16 03271 g008
Table 1. List of the composite materials under investigation, including the corresponding fatigue strength coefficient values.
Materialσf (MPa)
GRP506
Carbon/Epoxy T300/914450
Graphite/Epoxy T300/5208 [±45]2s94
Graphite/Epoxy Q-1115 [45/−452/45]s300
Carbon/Epoxy T800/5208 [0/90/±45]2s846
AS-4/PEEK [0/90]4s454
AS-4/PEEK [0/45/90/−45]2s752
AS-4/PEEK [±45]4s967
Table 2. Loading conditions for the composite materials under investigation.
Applied Stresses (MPa)
GRPσ1388290241241241290290338
σ2290241290338386338386386
Carbon/Epoxy T300/914σ1315340
σ2340315
Graphite/Epoxy T300/5208 [±45]2sσ160.751.7
σ251.760.7
Graphite/Epoxy
Q-1115 [45/−452/45]s
σ1270.0122.7
σ2122.7270.0
Carbon/Epoxy
T800/5208 [0/90/±45]2s
σ1345452
σ2452345
AS-4PEEK
[0/90]4s
σ1131.3154.4
σ2154.4131.3
AS-4PEEK
[0/45/90/−45]2s
σ1449.6491.8
σ2491.8449.6
AS-4PEEK
[±45]4s
σ1607.2667.9
σ2667.9607.2
Disclaimer/Publisher’s Note: The statements, opinions and data contained in all publications are solely those of the individual author(s) and contributor(s) and not of MDPI and/or the editor(s). MDPI and/or the editor(s) disclaim responsibility for any injury to people or property resulting from any ideas, methods, instructions or products referred to in the content.