1. Introduction
Despite a wealth of materials reported in the literature as potential candidates for optically stimulated luminescence (OSL) dosimetry, only two OSL materials, BeO and
, are routinely used for personal dosimetry [
1]. This stems from the difficulty in satisfying the many requirements in dosimetry; see Yukihara et al. [
2] for common pitfalls.
There are, however, areas in which those two materials have shown limitations and where the need for a new material was identified. Laser-scanning spatially-resolved dosimetry using OSL, for example, requires a material with a fast luminescence lifetime (of the order of microseconds, depending on the readout resolution and speed needed) to prevent pixel bleeding during fast laser scanning readout [
3]. The rapid increase in particle therapy centers worldwide [
4] requires detectors with a response independent of the linear energy transfer (LET) [
5].
quenches at high LET values and has an effective atomic number
; therefore, it is not tissue equivalent. BeO is not produced specifically for dosimetry, and it has dosimetric properties that are not controlled during production. Furthermore, it is acutely toxic when inhaled, and, because of this, it is not suitable to be developed in versatile mediums where particles could come loose.
To address these issues,
:Ce,Li has been put forward as a suitable candidate in response to these challenges, as it exhibits a luminescence lifetime of 31.5 ns and a reduced quenching at high LET values; in addition, its matrix is tissue equivalent (
), it has not shown effects of aging, can be reused, and it is not toxic [
6,
7,
8]. Additionally, De Souza et al. [
9] tested the OSL dose response of
:Ce,Li irradiated in photon beams (6 MV and 10 MV), in the dose range (0.1–100) Gy, and found a response proportional to the absorbed dose at those energies. Despite its novelty, there is now a substantial amount of information in the literature from different laboratories reporting on the synthesis of this material, its properties and its potential.
This contribution focuses on painting a comprehensive picture of the properties of :Ce,Li, combining results from the literature with new experimental results to fill in the gaps. The dosimetric performance of :Ce,Li will be weighted against those of . Finally, where properties and understanding of the material were not satisfactory, future research directions are outlined. This helps us to assess whether :Ce,Li can respond the needs in areas where a new OSL material is needed. By doing so, we wil try to answer to the question: “What is the added value of :Ce,Li to luminescence dosimetry, compared with existing solutions?”.
2. Reported Materials Developed for Luminescence Dosimetry
:Dy,Tm was first introduced as a new material for thermoluminescence (TL) dosimetry in 1980 [
10]. With a sensitivity seven times higher than that of TLD-100, near tissue equivalence and a fading of less than 10% over 60 days, it exhibited a clear potential for dosimetry. From there on, the
matrix was found capable of hosting a number of dopants, mostly from the lanthanide series. The luminescence properties for a range of doped and co-doped
samples have been reported (see
Table 1).
A systematic search for the best dopants in
was carried out by Yukihara et al. [
11]. In their work, the luminescence properties of lanthanide-doped
samples were juxtaposed with theoretical models, predicting the energy levels created by their introduction in the matrix. From this work,
:Ce,Li was singled out for its bright signal featuring an intense TL peak with few shallow traps. The TL signal of
compound with various dopants has been proposed for applications in personal dosimetry [
12] and temperature sensing [
13,
14].
Several materials based on an
matrix have subsequently been developed for optically stimulated luminescence (OSL) dosimetry (see
Table 1). For a comparison of the luminescence properties of
materials with different dopants, we refer to Yukihara et al. [
11]. However, amongst those,
:Ce,Li showed favorable characteristics in terms of OSL properties. Adding up to 10 % Li enhanced the brightness of the OSL signal by a factor of 10 [
15]. Besides its signal brightness, the short lifetime (31.5 ns) of its luminescence signal originating from Ce
meant it was a suitable candidate for spatially resolved dosimetry [
6,
15]. Finally, recent work showed less ionization quenching in ion beams compared with other dosimeters [
8].
Table 1.
List of materials using an matrix tested for their TL or OSL signal, as reported in the literature.
Table 1.
List of materials using an matrix tested for their TL or OSL signal, as reported in the literature.
| Dopants | Author | Measurement Method Tested |
|---|
| Ce,Li | Gustafson et al. [6], De Souza et al. [9], Yukihara et al. [11, 15], Souza et al. [16], Kitagawa et al. [17] | TL, OSL |
| Dy,Li | Yukihara et al. [11], Souza et al. [16] | TL, OSL |
| Pr,Li | Yukihara et al. [11] | TL |
| Nd,Li | Yukihara et al. [11] | TL |
| Sm,Li | Yukihara et al. [11] | TL |
| Eu,Li | Yukihara et al. [11] | TL |
| Tb,Li | Yukihara et al. [11] | TL |
| Ho,Li | Yukihara et al. [11] | TL |
| Er,Li | Yukihara et al. [11] | TL |
| Tm,Li | Yukihara et al. [11] | TL |
| Yb,Li | Yukihara et al. [11] | TL |
| Gd,Li | Yukihara et al. [11], Annalakshmi et al. [18] | TL |
| Dy,Na | Karali et al. [19], Bahl et al. [20], Kitis et al. [21], De Oliveira et al. [22] | TL |
| Dy,Tm | Prokić [10], Souza et al. [13], Karali et al. [19] | TL |
| Ce,Gd | Altunal et al. [23] | TL, OSL |
| Ce,Na | Ozdemir et al. [24] | TL, OSL |
| Pr,Dy | Ozdemir et al. [25] | TL |
| Mn,Tb | Sahare et al. [26] | TL |
| Dy,Tb | Karali et al. [19] | TL |
| Nd,Dy | Souza et al. [13] | TL |
| Tm,Ag | González et al. [27] | TL |
| Dy,Mn | Zhijian et al. [28] | TL |
| Ag | Palan et al. [29] | TL, OSL |
| Ce | Dogan and Yazici [30] | TL |
| Mn | Prokic [31] | TL |
| Tb | Kawashima et al. [32] | TL |
| Dy | Barbina et al. [33], Campos and Fernandes Filho [34], Lochab et al. [35], Legorreta-Alba et al. [36], De Souza et al. [37], Iflazoğlu et al. [38] | TL |
| Tm | Porwal et al. [39] | TL |
| undoped glass | Bakhsh et al. [40] | TL |
3. Prospective Applications
:Ce,Li has been proposed for the following applications, where its properties could complement the existing materials for OSL dosimetry.
3.1. Spatially-Resolved Dosimetry
Spatially-resolved dosimetry based on laser scanning requires an OSL material with a fast luminescence lifetime (<
s) for faster scanning [
7]. The luminescence emission of
exhibits a longer lifetime component (35 ms) that persists after the laser has moved away from the respective part of the film. In spatially-resolved dosimetry, for example, where the laser is scanned across a sheet of materials at a reasonable speed (ca 2
s, see Crijns et al. [
41]), this needs to be accounted for, subtracted and corrected using pixel bleeding algorithms [
3]. Although BeO exhibits a lifetime of 27
s [
42], its toxicity means that it is confined to a ceramic form, and producing films at low cost can be challenging [
43].
In contrast, the luminescence emission of
:Ce,Li is dominated by a fast component (31.5 ns). This not only means that
:Ce,Li requires fewer corrections when used for laser-scanning spatially resolved dosimetry [
7], but also that the proportion of signal usable for spatially-resolved dosimetry is de facto greater for
:Ce,Li compared with
.
3.2. Dosimetry in the kGy Range
Doses in the kGy range may have to be measured for medical sterilization [
44,
45,
46], food processing [
47,
48] or tomography imaging of biological samples [
49,
50,
51]. In those contexts, luminescence dosimetry offers many advantages compared with other dosimetry methods. It is dose-rate independent [
52,
53,
54], and detectors can be produced as small as 1 mm
to be fitted in narrow fields or at the sample’s position. However, the two materials currently used for OSL dosimetry,
and BeO, each exhibit a saturation limit of the order of 100s Gy [
2], hindering their use in the high dose range.
3.3. Dosimetry for Ion Beam Therapy
Although commercially available OSL detectors present many advantages for ion beam dosimetry (e.g., practicality, spatially-resolved dosimetry, insensitivity to dose-rate and magnetic fields), they are not exempt from the reduced relative response with increasing linear energy transfer (LET) exhibited by solid state detectors, the so-called ionization quenching [
5,
55,
56,
57,
58,
59]. To circumvent this, the possibility of measuring the LET of the incident particle using
and the ratio of its two emission bands has been used to apply LET correction factors [
57,
60]. As already hinted by its high saturation limit [
15],
:Ce,Li exhibits a reduced quenching to high-LET compared with
and provides a negligible LET-correction for dosimetry in clinically relevant proton beams [
8].
4. Material and Methods
The original measurements presented here were obtained using
:Ce (0.3%), Li (10%) samples synthesized through solution synthesis, solid state synthesis or glass synthesis, where the dopant concentration is the nominal concentration in mol% with respect to the Mg concentration added to the initial reagents. The samples were produced from a mixture of H
BO
(Alfa Aesar, 5N5), Mg(NO
)
× 6H
O (Alfa Aesar, 5N), LiNO
(ROTH, 2N5) and Ce(NO
)
× 6H
O (Thermo scientific 2N5) in 1:6:0.1:0.003 molar ratio. The starting materials were thoroughly ground in agate mortar, and the resulting mixture was split into three parts and used for glass synthesis (according to Kitagawa et al. [
17]), solution synthesis (according to Gustafson et al. [
6], except that the urea was omitted, as it was not found to significantly enhance the brightness of the signal), and solid state reaction. The samples were hence produced from the same mixture of starting reagents, reducing the variation in the properties due to contamination of the reagents.
The luminescence measurements were carried out using a Risø TL/OSL reader TL/OSL-DA-20 (DTU Nutech, Denmark). The TL and OSL signals were detected using a bi-alkali photomultiplier tube (PMT) (model 9235QB, Electron Tubes Ltd., Uxbridge, UK). TL emission spectra were collected using an Andor iXon Ultra 888 EMCCD attached to Andor’s Kymera 193i spectrometer (grating 150 lines/mm with a center wavelength at 500 nm, CCD pre-cooled to −60 C). A spectral correction obtained using a calibration lamp (Bentham, CL2 irradiance standard) was applied. The system was also equipped with a photon timer (Photon Timer PicoQuant TimeHarp 260, 0.25 ns base resolution, deadtime <2 ns) for time-stamped time-resolved OSL measurements. Hoya U-340 filters (7.5 mm thickness, Hoya Corp. Tokyo, Japan), Edmund Optics UV/VIS neutral density filters (ND OD 2.0, 3.0 mm, EO 47-210) or a silica window were placed in front of the PMT during OSL or TL readouts. The detection setup specific to each measurement is indicated in the caption of each figure. Continuous-wave OSL measurements (CW-OSL) were conducted at a stimulation power of 90% (LEDs: 470 nm 2xSMBB470-1100-TINA-RS GG420 maximal power: 90 mW/cm) over 300 s, linear-modulated OSL (LM-OSL) measurements were conducted by linearly ramping up the power of the diodes from 0% to 90% over 1000 s of stimulation, and the TL measurements were recorded at a rate of 1 C/s. UV (365 nm, 11 W) and green (525 nm, 40 mW/cm) LEDs were also used to bleach the samples. Irradiations were performed using a 1.48 GBq Sr/Y beta source integrated in the Risø reader. The source was calibrated in air kerma for :Ce,Li films relative to a Cs reference irradiation.
The
:Ce,Li film samples used to assess the dose response were prepared by Agfa (Belgium) by mixing samples prepared by the solution method with a binder and spreading onto a plastic film, in a fashion similar to that described by Shrestha et al. [
7]. The 22
m median particle size phosphor was dispersed in Kraton FG1901 in a toluene solution. The lacquer was coated on white PET with a bar coater and dried to obtain phosphor coatings with thicknesses between 50 and 100
m. The OSL signal of
:Ce,Li was compared with that of similar
films, as described by Ahmed et al. [
3].
The mass energy absorption coefficient of
:Ce,Li was calculated for different nominal concentrations of cerium by adding up the mass energy absorption coefficient of each one of the elements present, weighted by their respective atomic weight fraction. This was divided by the mass energy coefficient of water, obtained in a similar way, to get a response respective to that of water. The mass absorption energy coefficients were obtained from the NIST database [
61].
5. State-of-the-Art
5.1. Luminescence Properties
5.1.1. Luminescence Spectroscopy
:Ce,Li radioluminescence (RL) emission spectra reported by Gustafson et al. [
6] showed a peak at 350 nm for samples synthesized through solution combustion. They attributed this to the Ce
emission. This emission band was also found in OSL, TL and photoluminescence spectra and ascribed to the 5d-4f transition of Ce
. This is consistent with the RL spectra obtained by Kitagawa et al. [
17] for glass synthesis samples (340 nm peak) but differs from those reported by Souza et al. [
16] for samples synthesized using solid stated synthesis, where a 412 nm emission was predominant. As the only apparent difference between the three samples listed above appeared to be the synthesis route, we gathered TL spectra for samples synthesized for the present study using solution synthesis, solid state synthesis and glass synthesis.
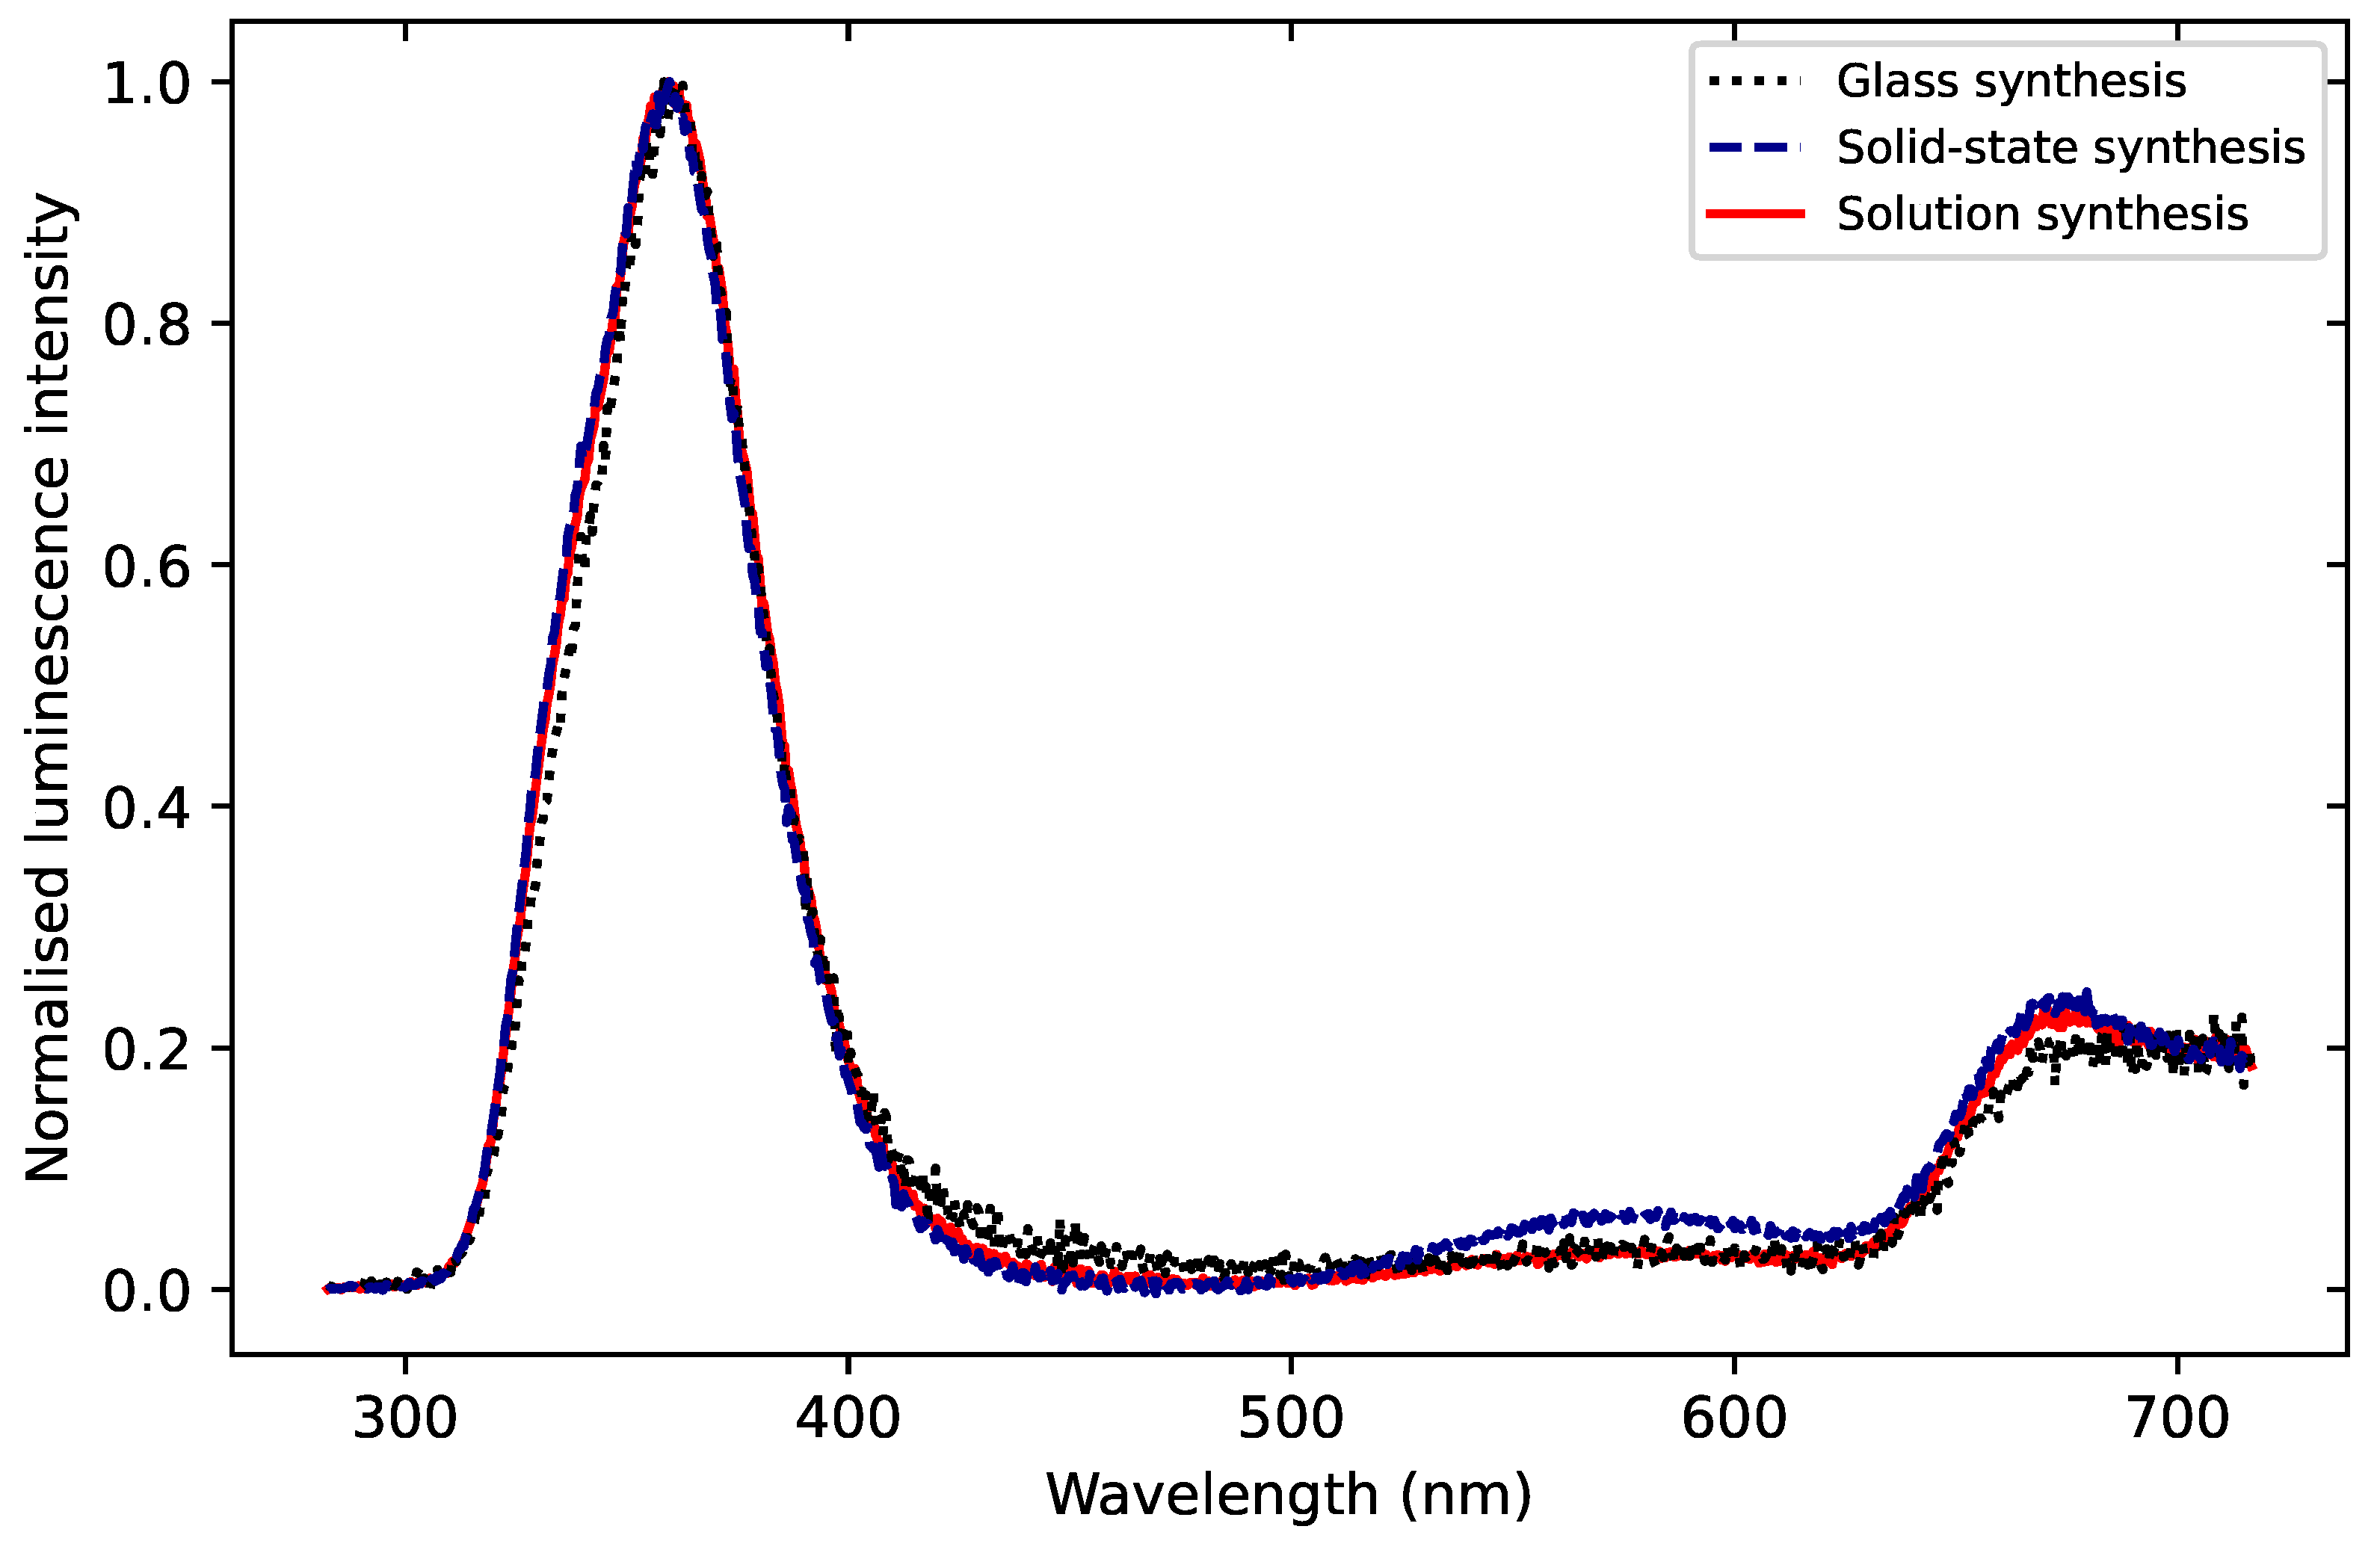
Figure 1 shows the emission spectra of the main TL glow peak (integrated over the temperature range 225–275
C) for
:Ce,Li synthesized by the three different routes (solution synthesis, solid state synthesis and glass synthesis), as described in
Section 4. The emission is similar in all three samples, with a main peak at 360 nm across all three samples. These data are consistent with those of Gustafson et al. [
6] and Kitagawa et al. [
17]. Furthermore, we did not observe a shift in the UV emission as a function of the synthesis route, indicating the emission was not synthesis-dependent and that Ce
was incorporated in the matrix.
5.1.2. Signal Intensity
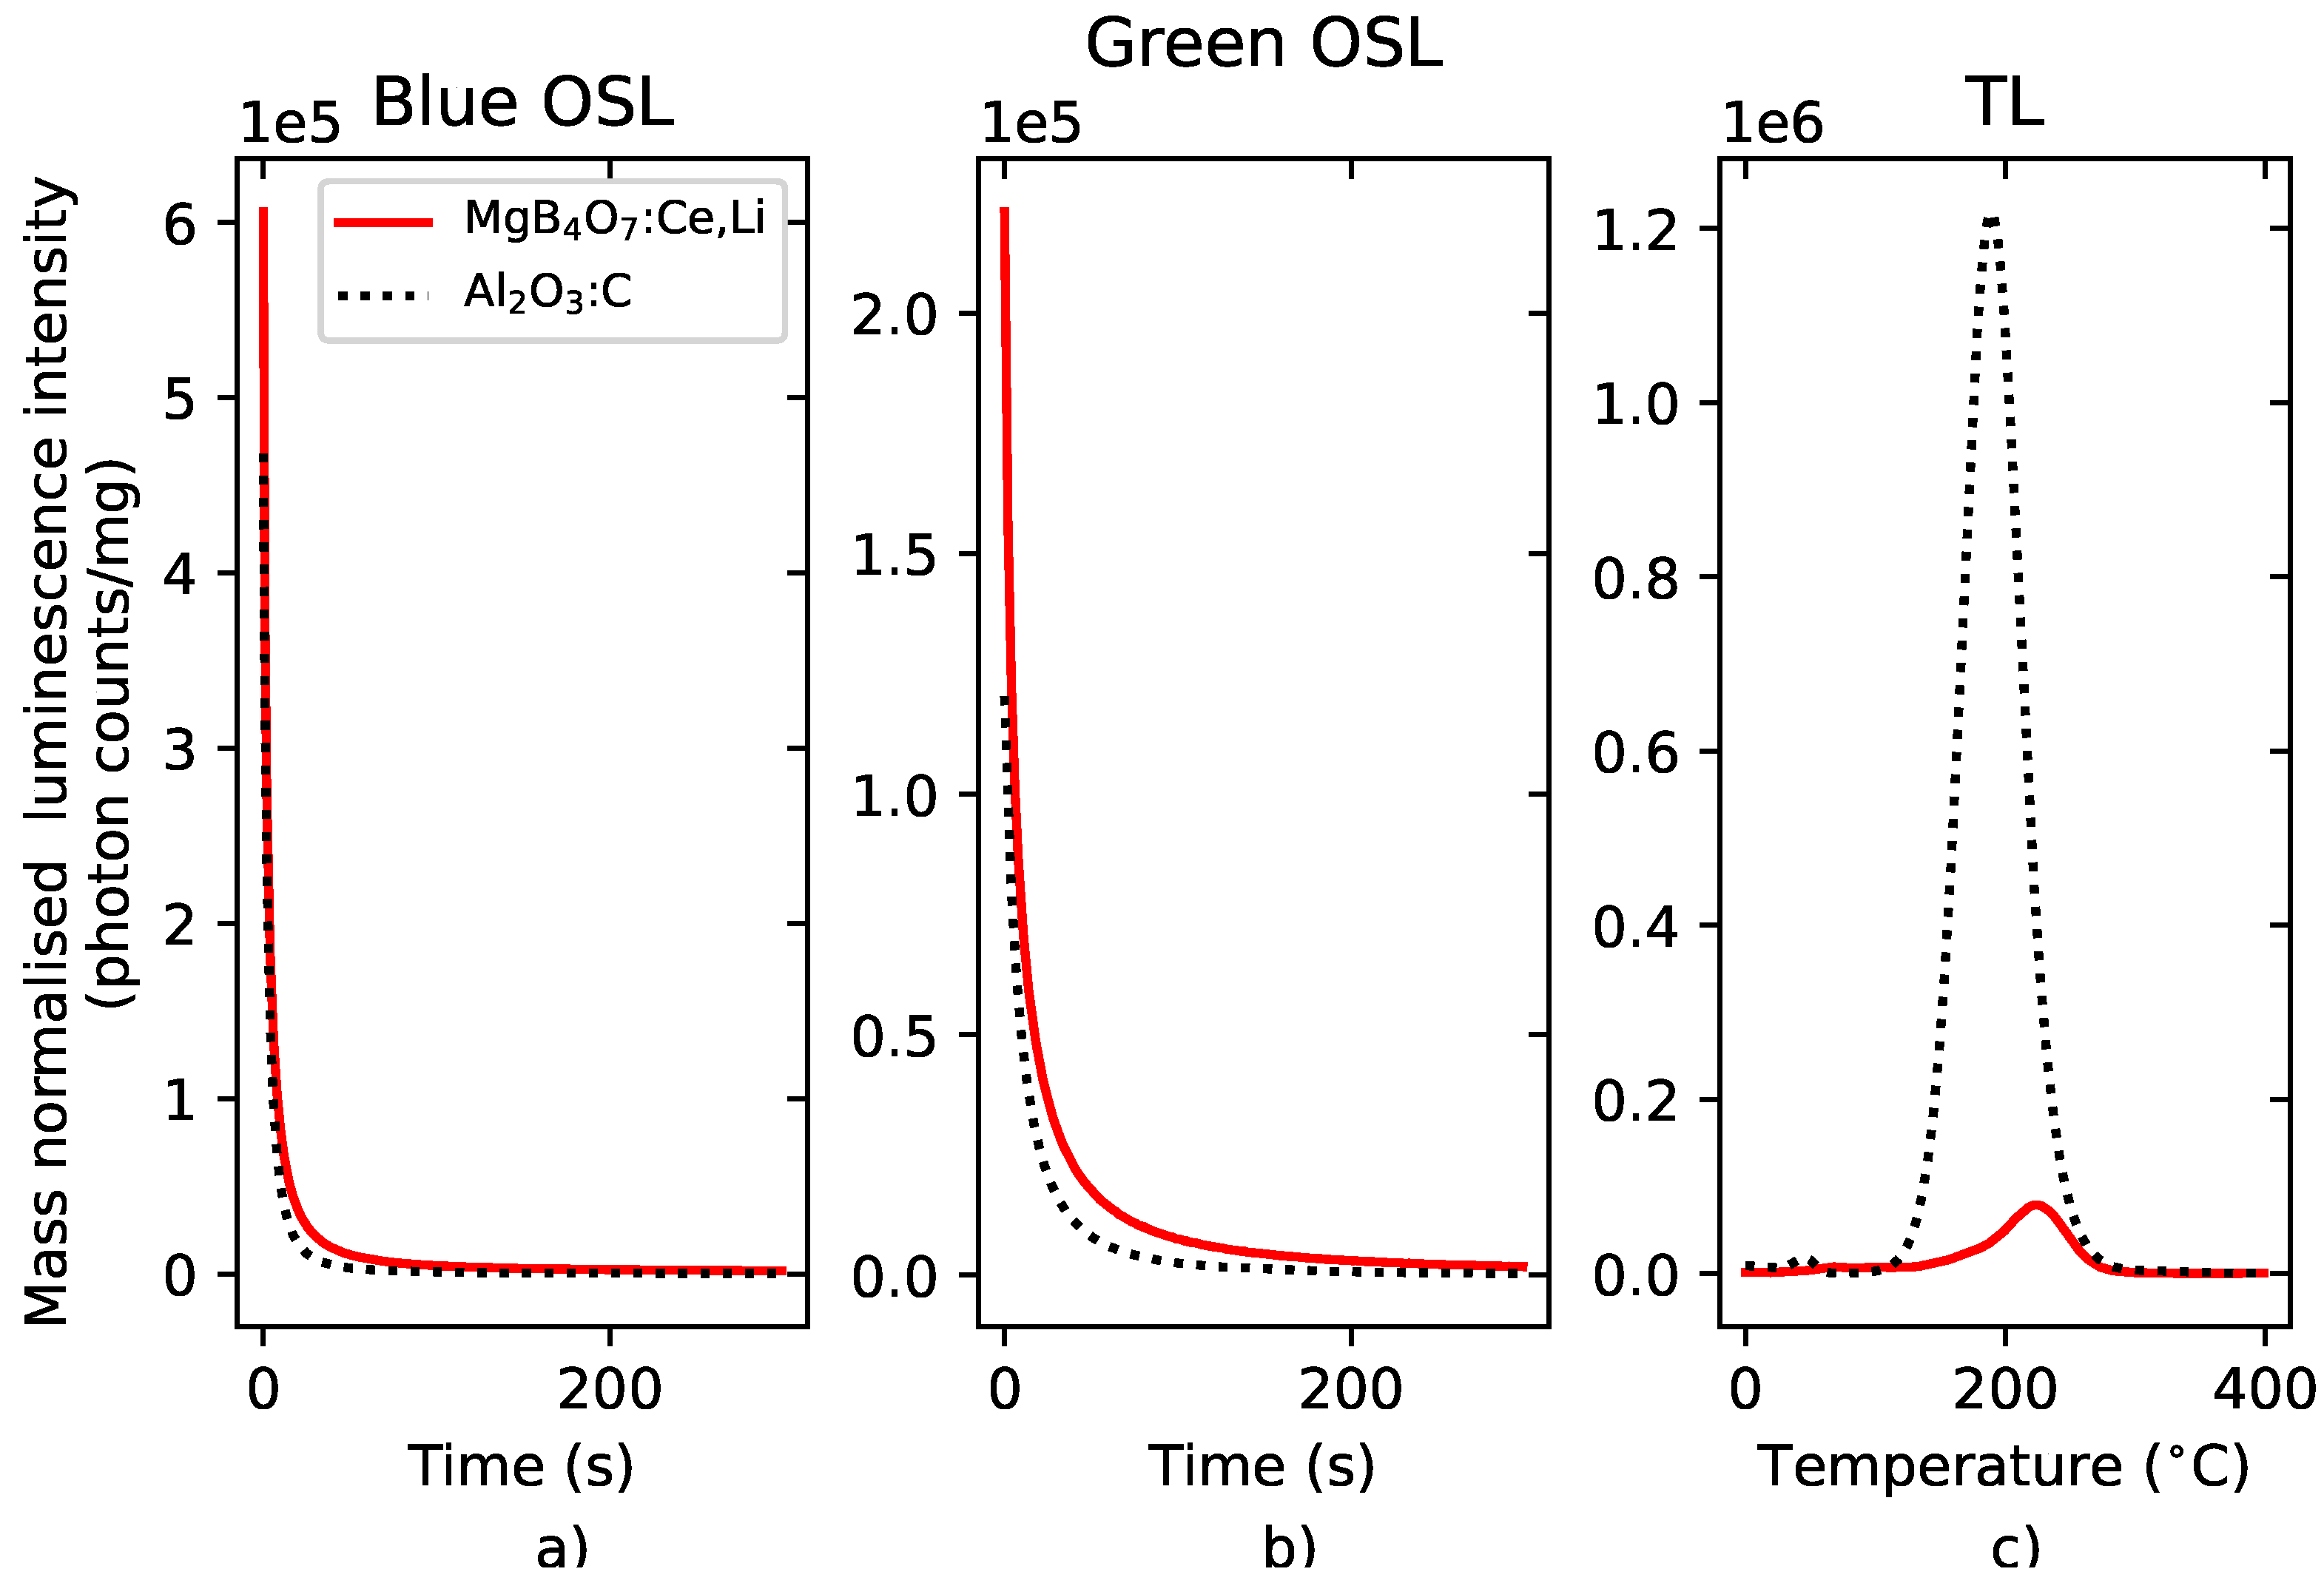
Figure 2 compares the intensity of the luminescence signal per milligram of powder sample under blue stimulation, green stimulation and thermal stimulation with that of
. Regardless of the light stimulation source, the
:Ce,Li brightness is comparable to that of
. However, if a broad BG-39 filter is used for TL measurements,
’s signal is brighter than that of
:Ce,Li, because the Hoya U-340 filter blocks most of the main emission of
, which is a broad band centered at 420 nm. The OSL and TL signals of BeO and
:Ce,Li also show similar brightness under blue light stimulation (
Supplementary Materials Figure S1). The prototype
:Ce,Li films produced by Agfa NV yielded a signal 25% weaker than
films under blue light stimulation and 40% weaker under green light stimulation, if the signal is taken as the integral of the first 100 s of illumination. Although the exact amount of powder for both of those films is not known and differs from the two films, the results are intended to demonstrate that comparable performances can be achieved.
5.1.3. Step-Annealing
Step-annealing measurements were conducted by irradiating :Ce,Li and samples with a dose of 35 mGy, preheating the sample to a temperature in the range 30–350 C and recording the subsequent OSL signal.
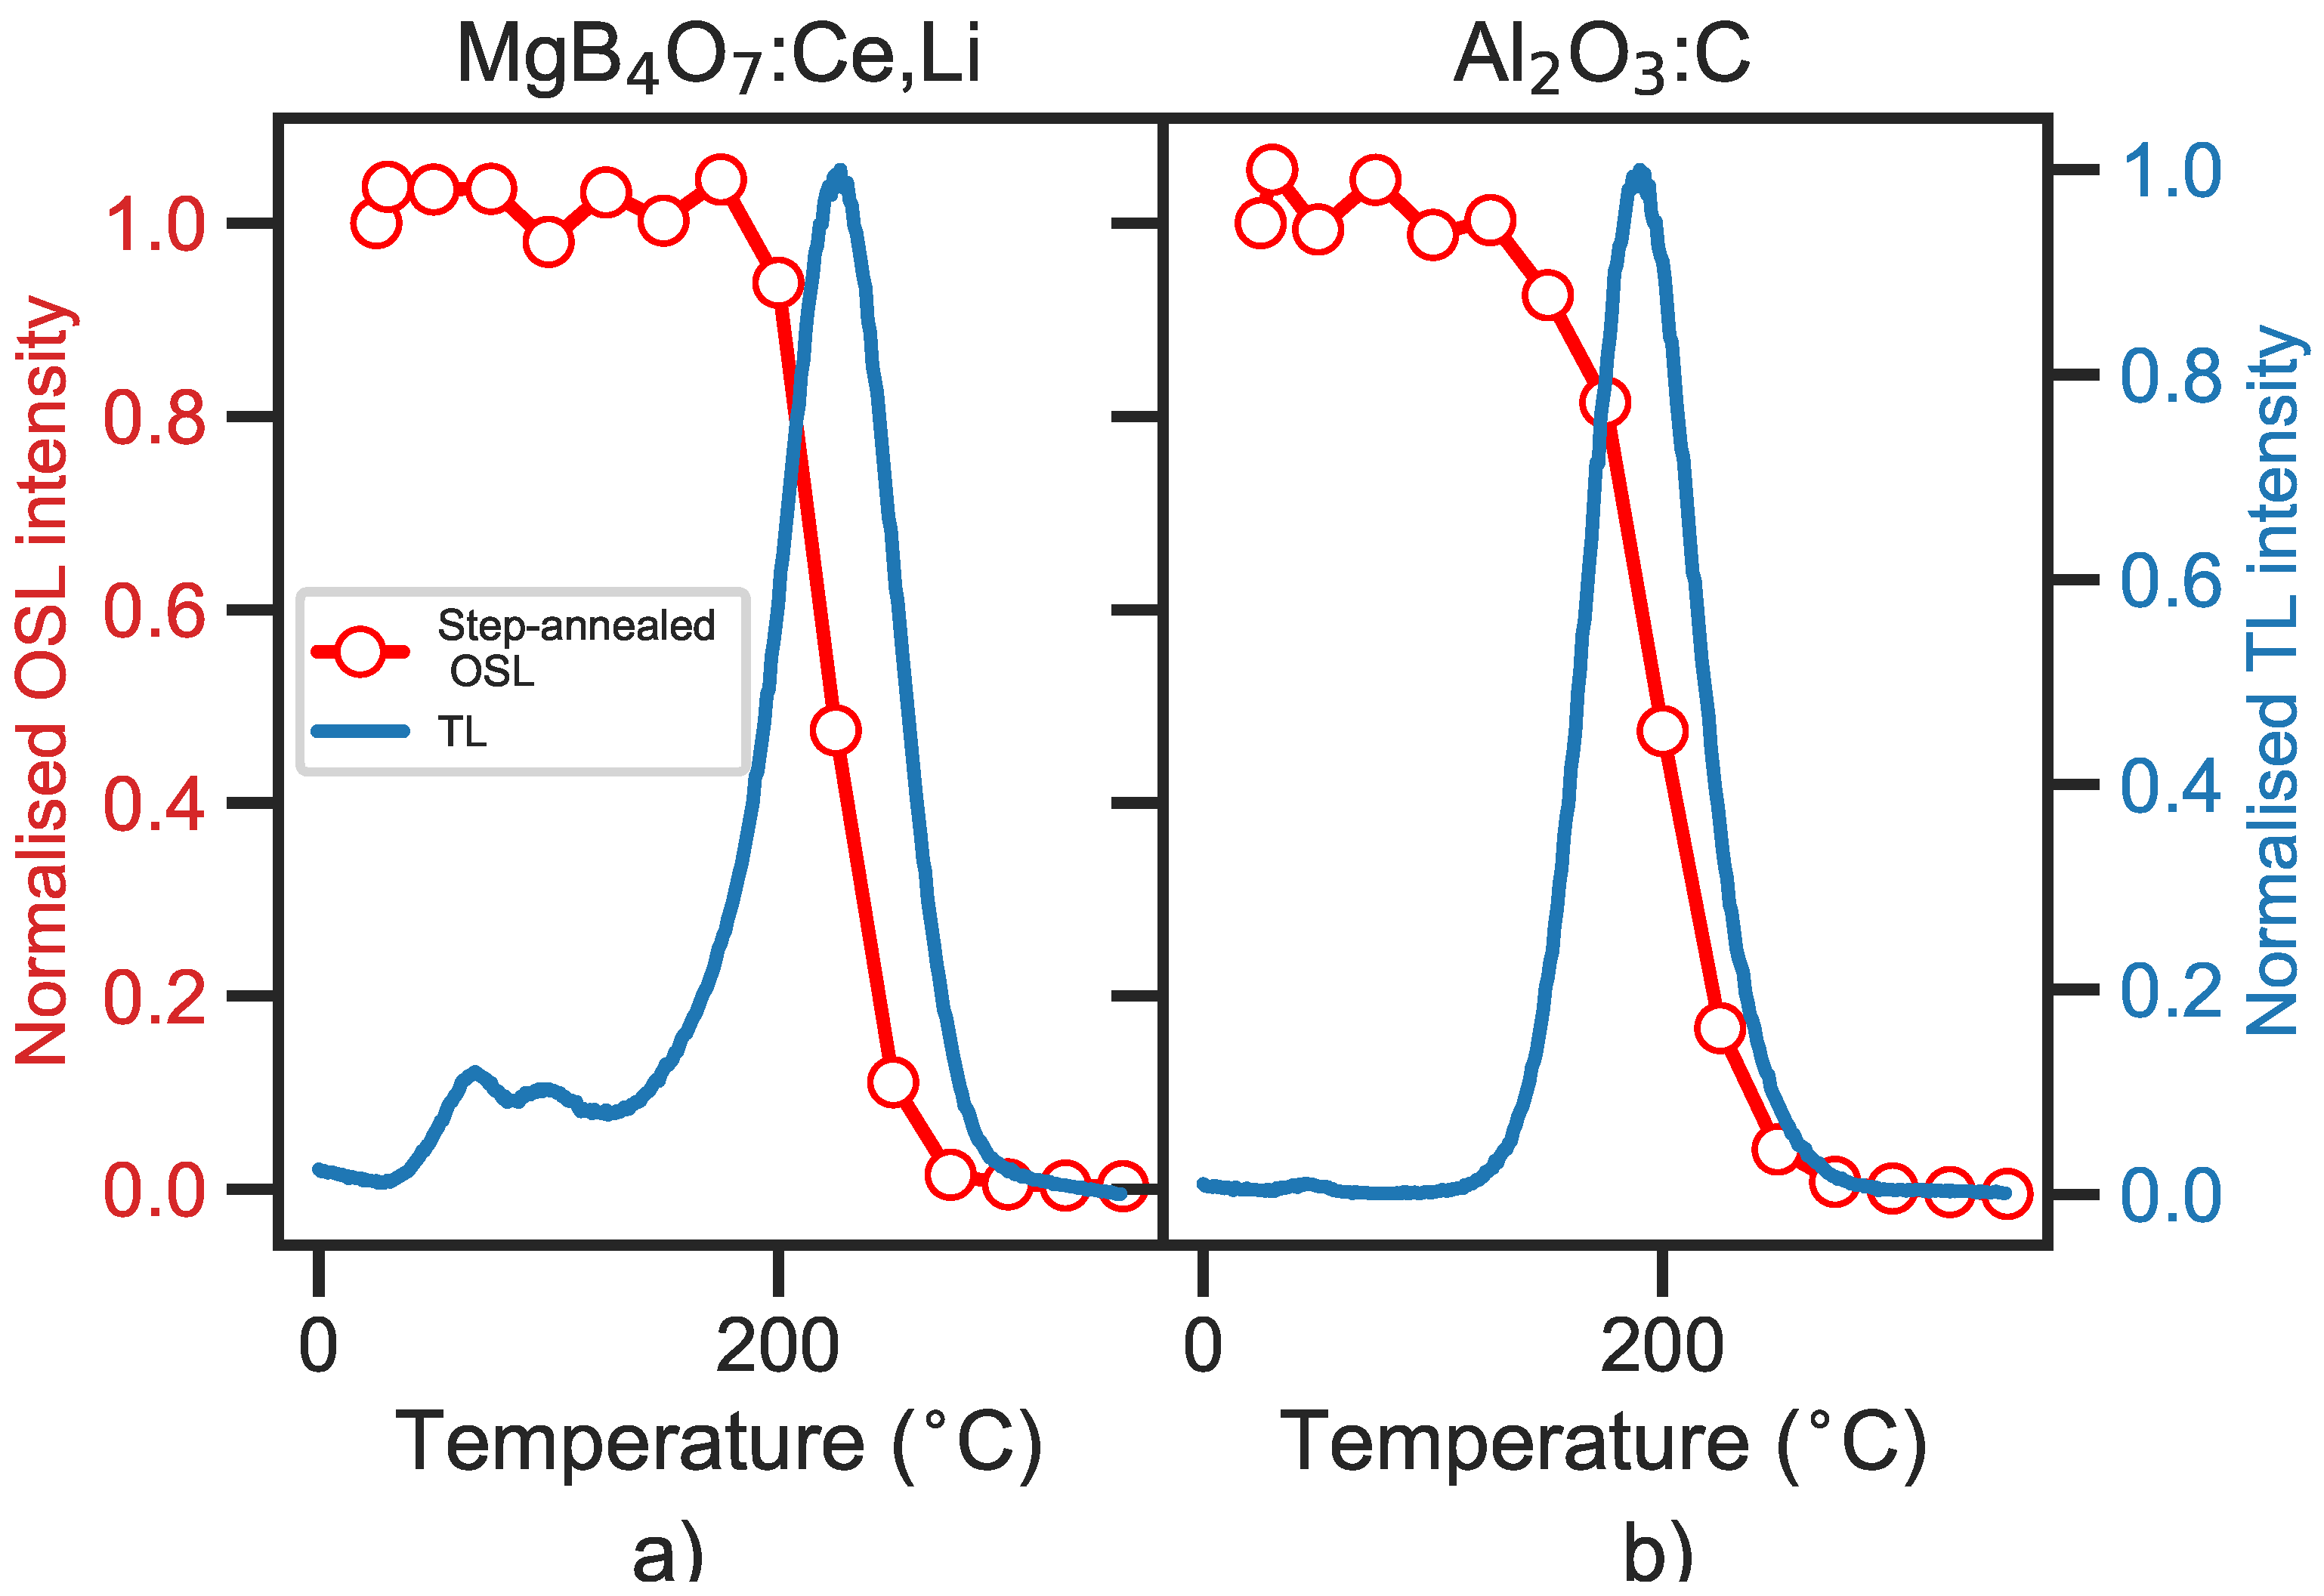
Figure 3 shows the results, normalized by the OSL intensity measured at room temperature (25
C). The sharp drop in OSL intensity at 200
C for
:Ce,Li indicates that the OSL signal originates mostly from traps associated to the main TL peak and not from shallower traps (
Figure 3a). This is similar to the behavior observed in
, where the OSL signal also appears to be associated with traps linked to a 200
C temperature region, corresponding to its main TL peak (
Figure 3b).
5.1.4. Time-Resolved Luminescence
Whereas
is characterized by a fast and a slow component (7 ns and 35 ms respectively),
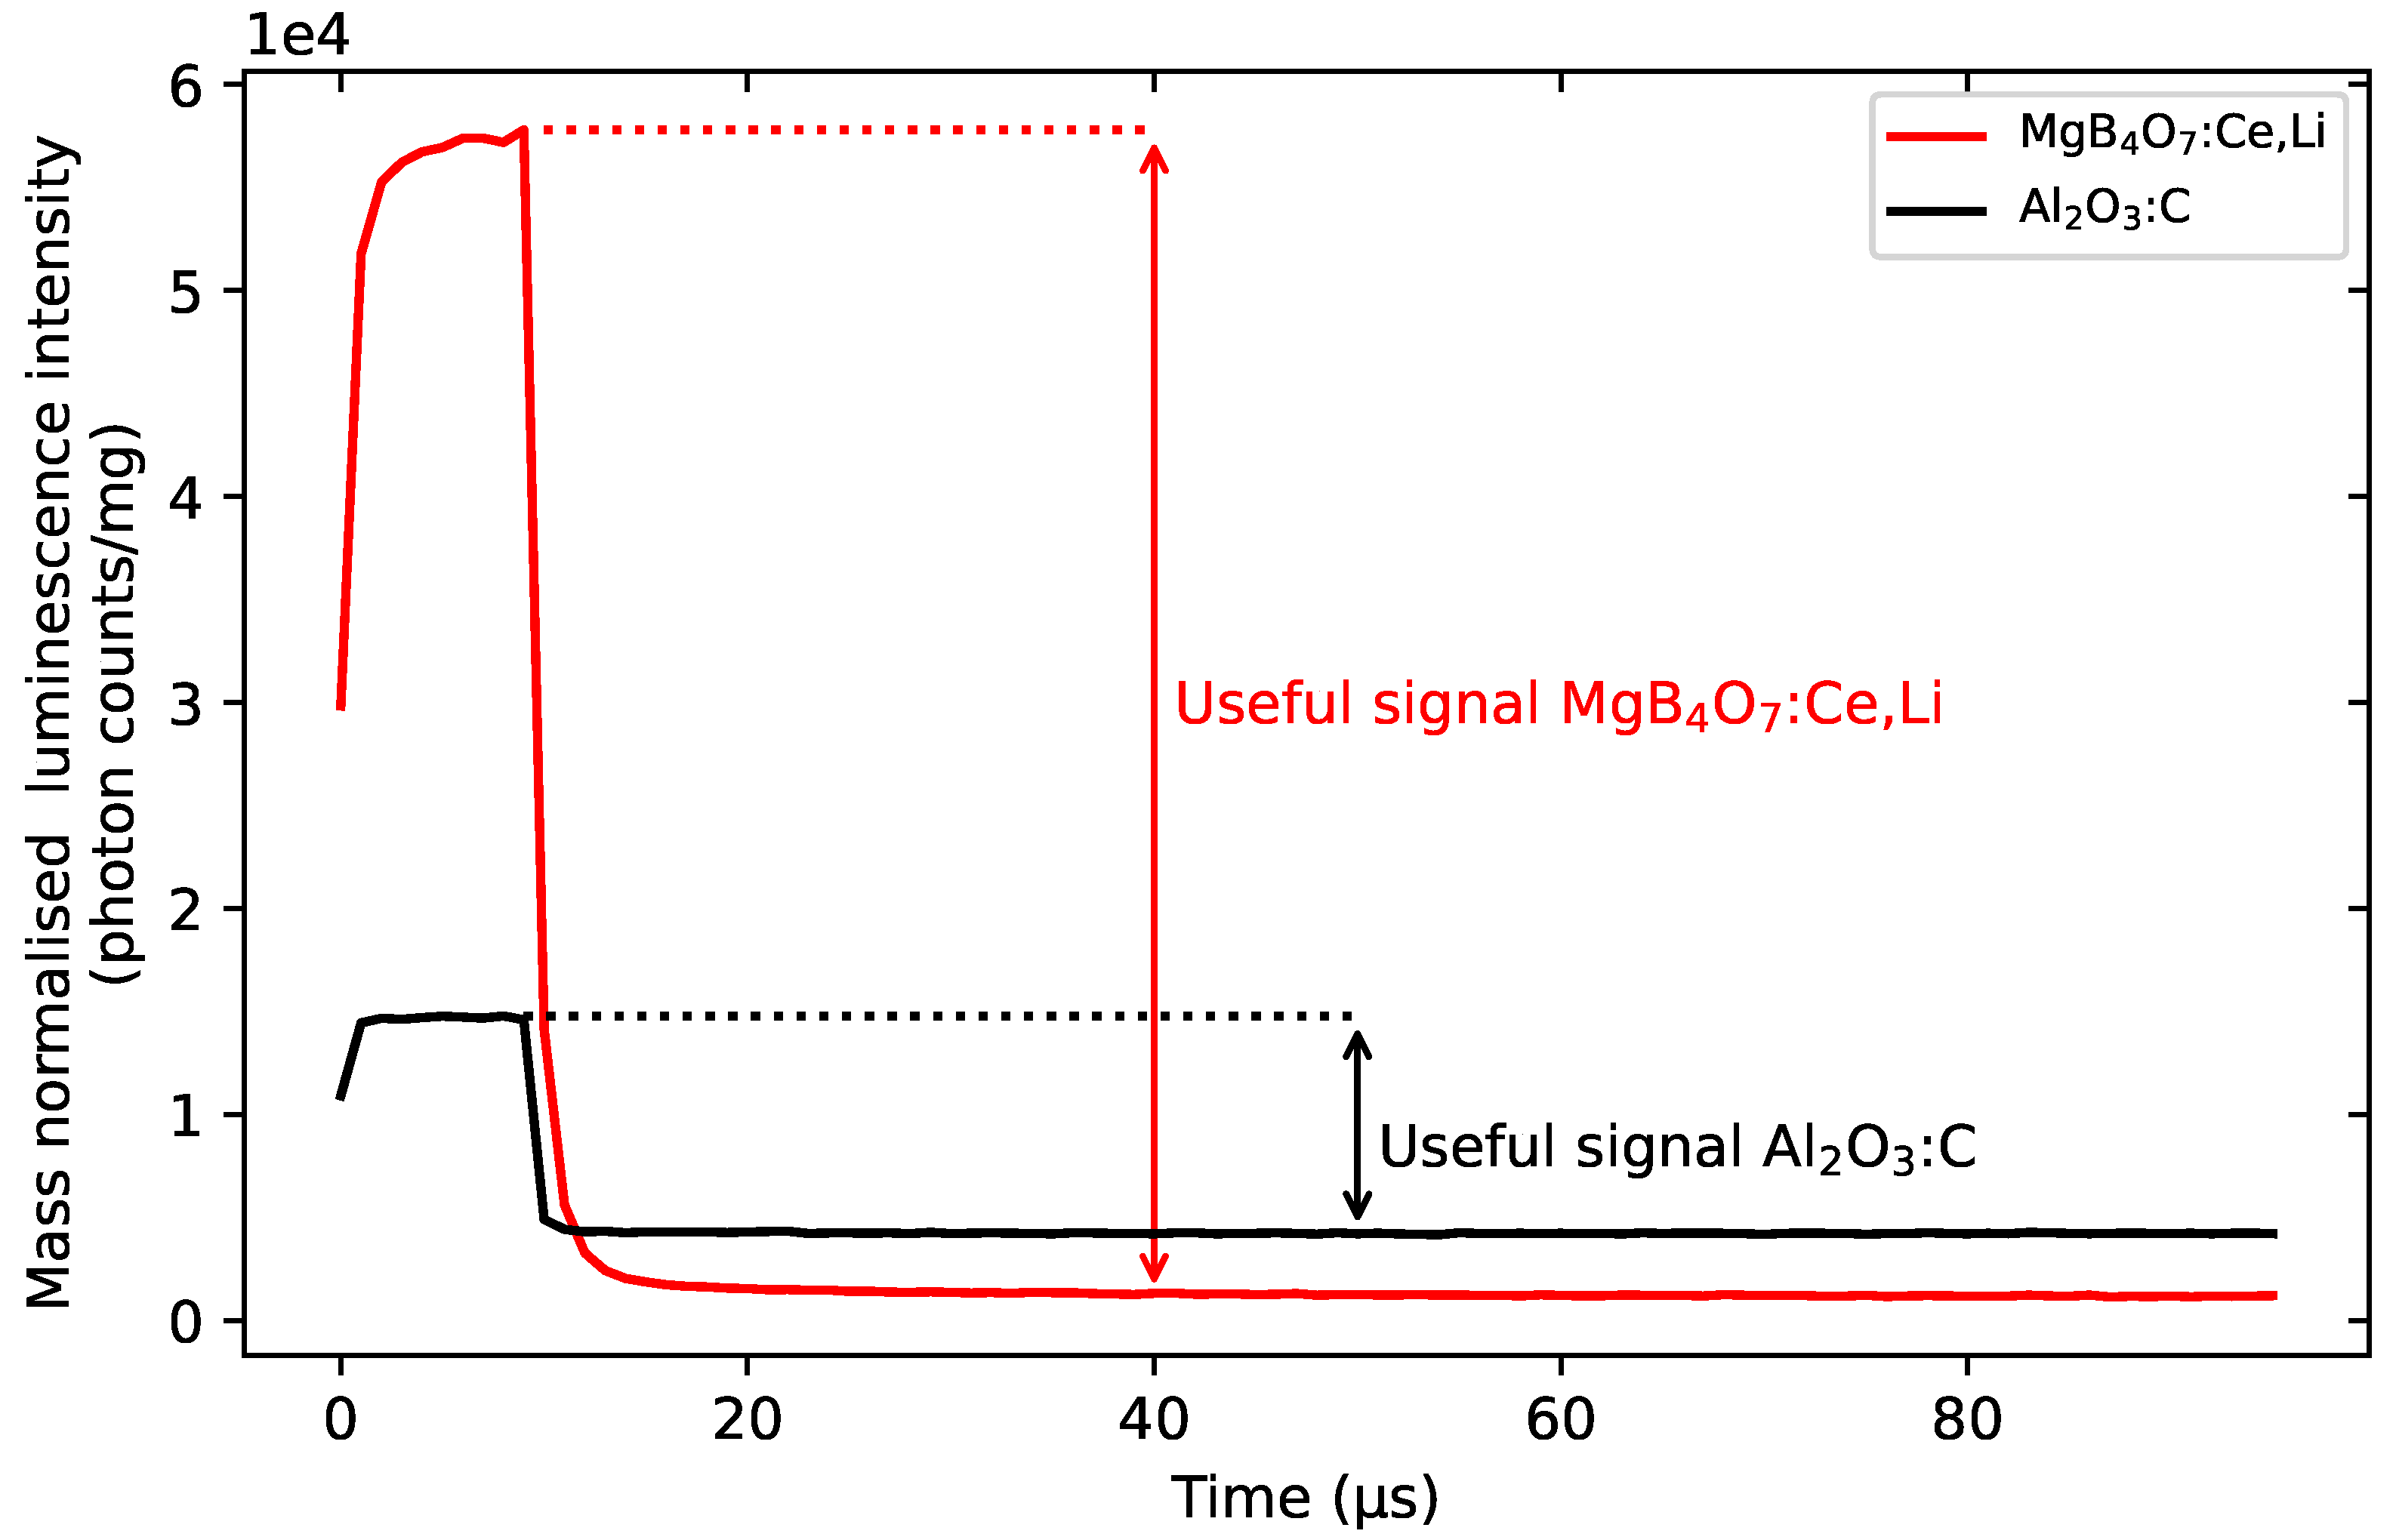
:Ce,Li’s luminescence signal exhibits one dominating component of the order of ns, associated with the Ce
’s emission. This is illustrated in
Figure 4, where the photon arrival time distribution curves are shown for both materials under stimulation pulses of 10
s. The timing of the pulses and stimulation period does not allow for a full decay of the slow component of
, and this results in a higher background during the off time. In contrast,
:Ce,Li’s signal decays within the time resolution of the LEDs following the end of the pulse, which produces a lower background in comparison to
. The luminescence lifetime could not be extracted from this data, as the LED rise and fall time was too slow compared with the Ce
lifetime. The portion of the signal that would be accounted for in spatially resolved dosimetry is displayed as the difference in intensity between the signal as the end of the stimulation pulse and the background and is around five times greater for
:Ce,Li than for
. Similarly, the OSL signal of BeO exhibits a much longer lifetime than
:Ce,Li, which would extend the duration of measurements and reduce the portion of useful signal (
Supplementary Materials Figure S2).
5.1.5. Dose Response
Contrasting data exists regarding the dose-response behavior of
:Ce,Li. Where the results from Souza et al. [
16] indicate saturation around 100 Gy, those of Yukihara et al. [
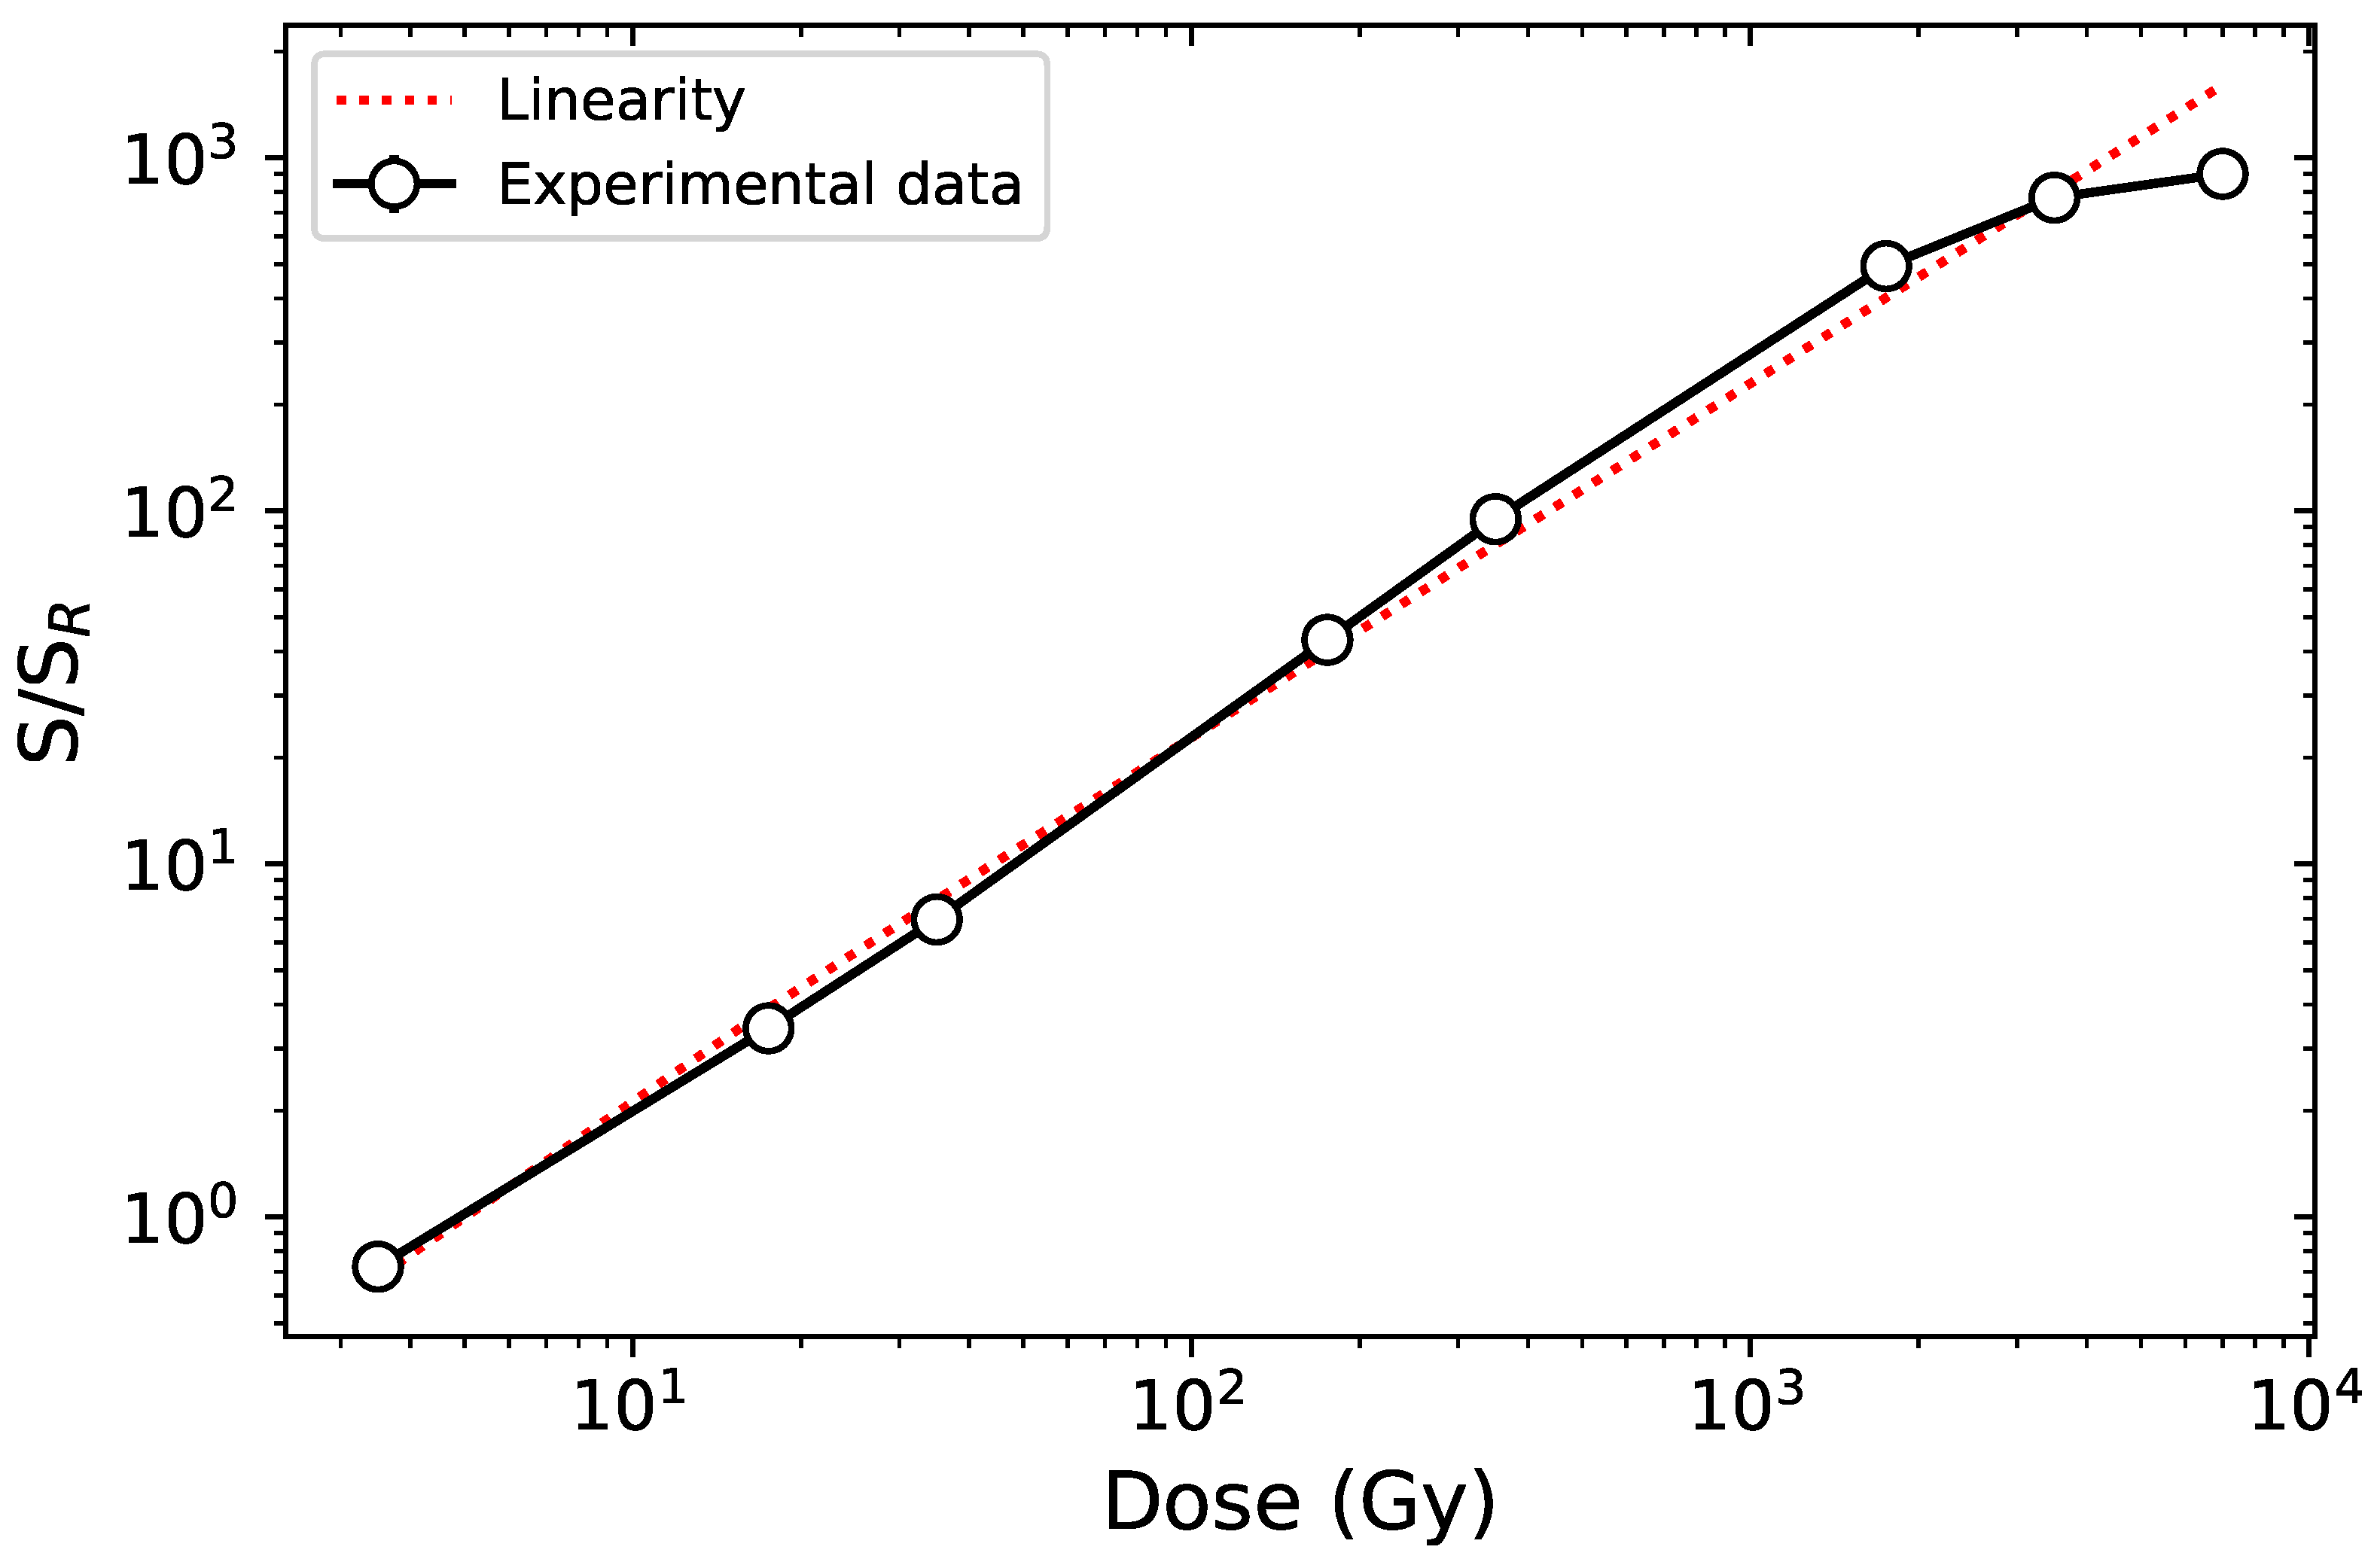
15] indicate supralinearity above 100 Gy and no saturation up to 1000 Gy. Samples produced using the solution method were selected to test the dose response, as they exhibited the highest intensity. They were tested in the framework of this study under linear-modulated stimulation (LM-OSL) to prevent the saturation of the PMT.
The dose-response behavior is shown in
Figure 5. As indicated by the dotted line representing the linearity region, the dose response is linear up to 100 Gy before exhibiting a supra-linear behavior above 100 Gy and saturating around 7000 Gy. This is in agreement with the data reported by Gustafson et al. [
6] for samples prepared using solution combustion.
5.1.6. Fading
Differing fading behaviors have been reported in the literature, and it is unclear whether they result from different synthesis routes. Yukihara et al. [
15] observed an OSL signal that decays 10–15% in the first 72 h following irradiation, stabilizing afterwards. Since the OSL is associated with the 200
C TL peak (see
Section 5.1.3), this would indicate anomalous fading. Souza et al. [
16] reported less than 1% fading of the OSL signal following 40 days of storage in the dark. TL fading has so far only been presented by Kitagawa et al. [
17] for samples synthesized through glass synthesis, for which anomalous fading, in the temperature region >200
C of the TL glow curve, was not detected.
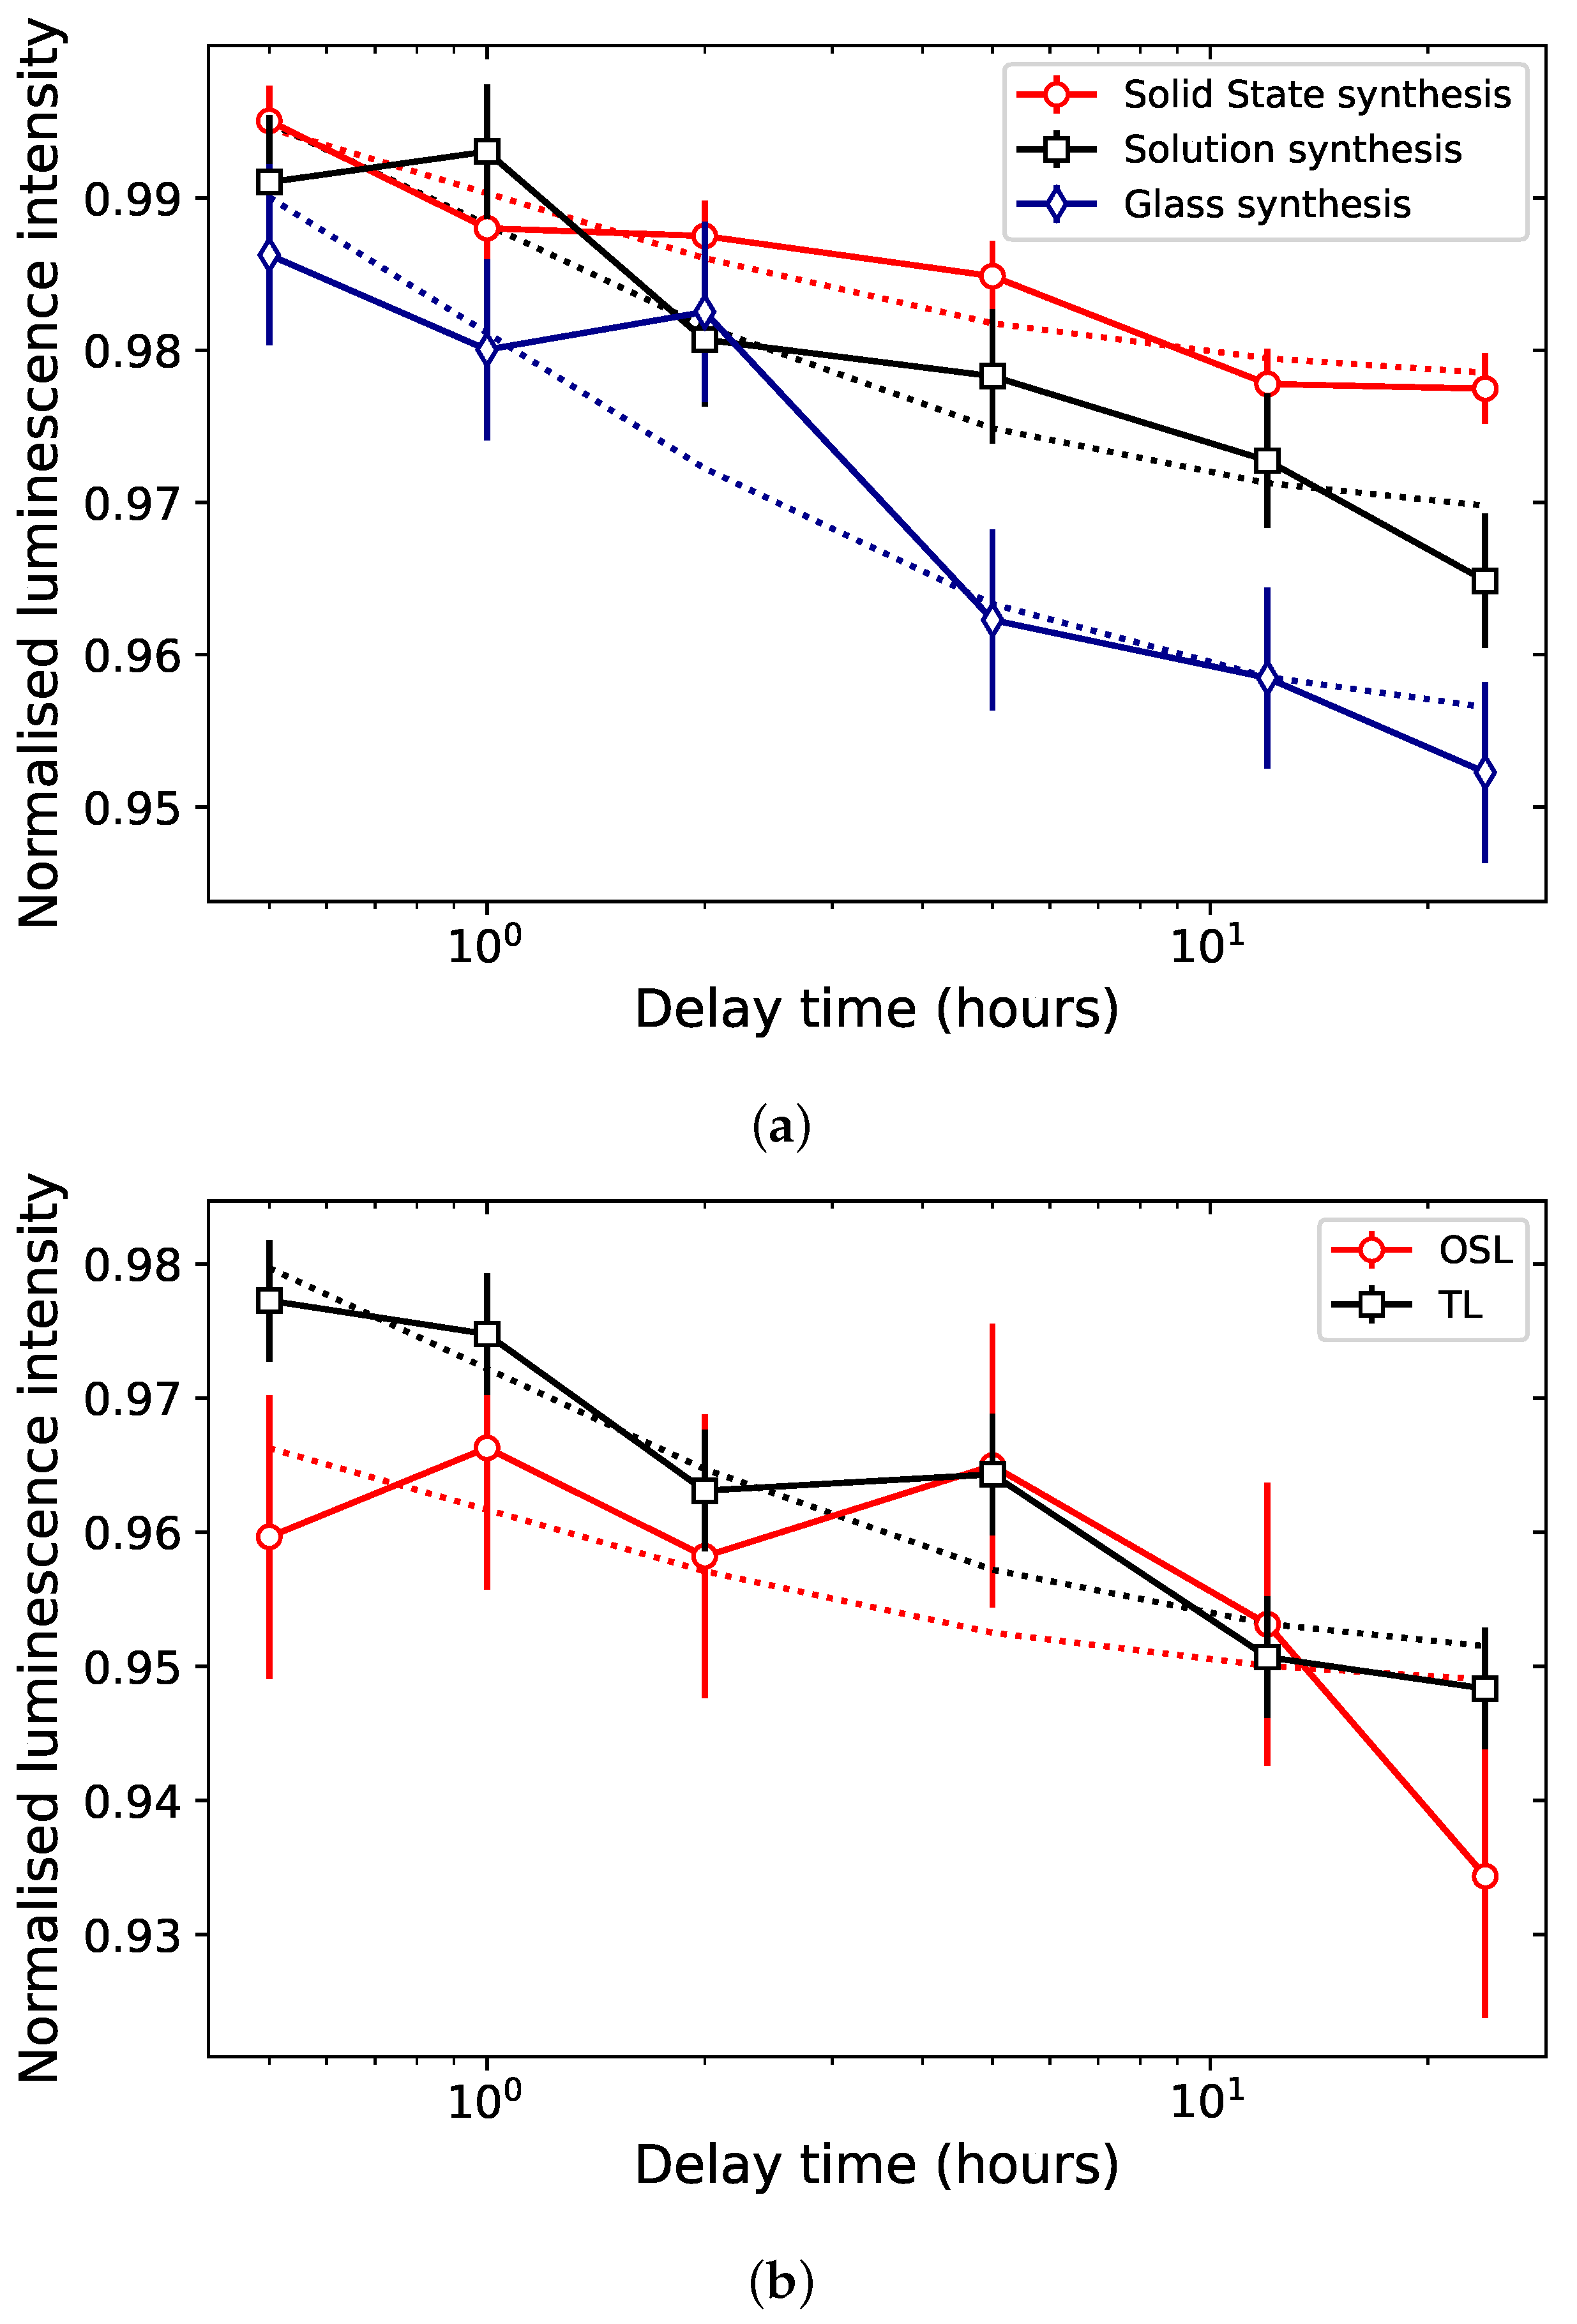
Preliminary results were obtained for the TL fading of the main peak (200–300
C) of samples synthesized through solid state, solution and glass synthesis. The fading data of the integral of the main TL peak (200–300
C), shown in
Figure 6a, points towards a difference in loss of signal of 3% after 24 h between the sample with the least fading (solid state synthesis) and the one with the most (glass synthesis), and longer fading measurements would be needed to better constrain this difference. Thermal fading for TL peaks in the 200–300
C region is not expected for samples stored at room temperature in the dark. Therefore, this therefore points towards the occurrence of anomalous fading in all three samples.
Furthermore, the comparison of the TL and OSL fading of a sample synthesized through solution synthesis corroborates an OSL signal originating from the 175–250
C region of the TL glow curve. In the data displayed in
Figure 6b, the OSL signal was calculated as the integral over the entire OSL curve, and its fading behavior is plotted alongside the TL fading in the TL region 175–250
C, as pulse-anneal measurements had indicated traps in this TL region as also responsible for the OSL signal (
Section 5.1.3). The fading behaviors of the OSL and TL signals in the corresponding regions are identical, within uncertainties. Further measurements of multiple aliquots over extended periods of time will be conducted to confirm those results.
5.1.7. Bleachability
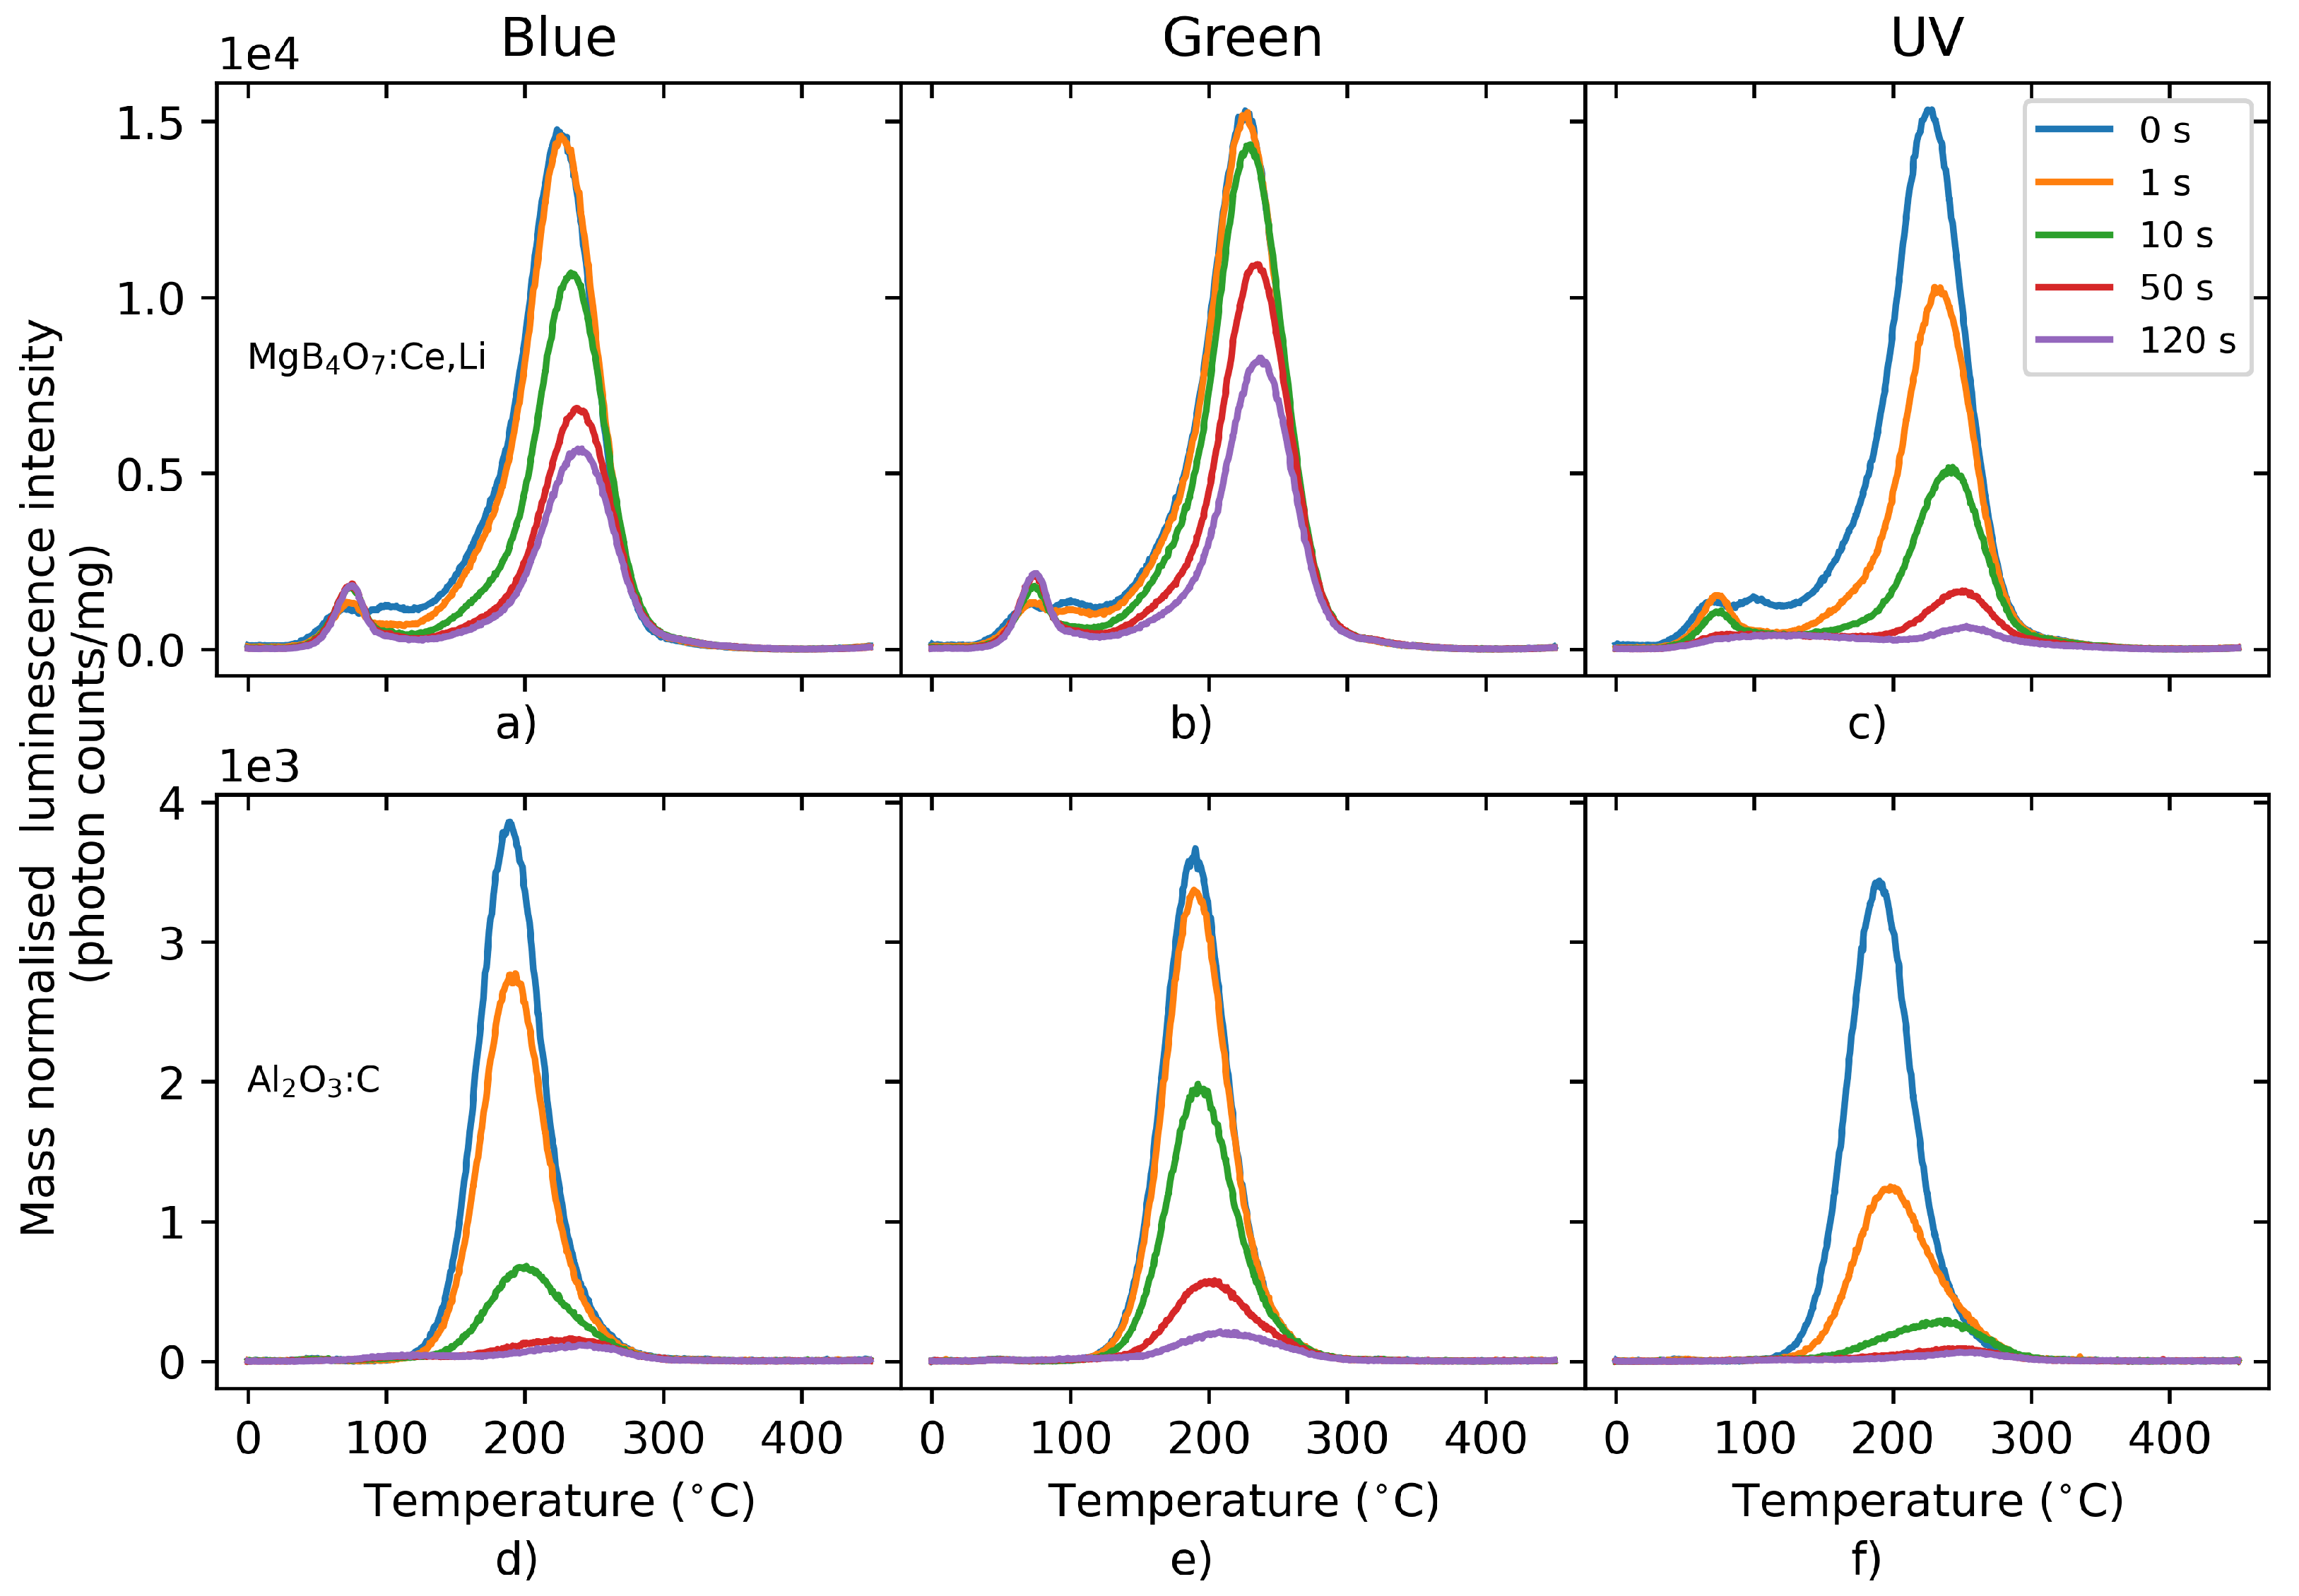
Figure 7 illustrates the behavior of the TL signal of
:Ce,Li and
following bleaching with either blue, green or UV light for various durations (0–120 s). From these graphs, it is clear that, regardless of the wavelength of the bleaching light, the main
:Ce,Li trap has a lower optical cross-section than
, which results in a harder-to-bleach signal. Whereas 50 s of blue illumination was sufficient to bleach the main dosimetric trap of
, it only resulted in a loss of signal of 55% in
:Ce,Li. Furthermore, exposure to light resulted in a photo-transfer process in
:Ce,Li, giving rise to a peak at 75
C. The reduced bleachability indicates an OSL process of reduced efficiency.
In practice, this means that, for applications in personal dosimetry, for example, :Ce,Li dosimeters will have to be subjected to a more aggressive (e.g., longer and/or at shorter wavelengths) bleaching to be zeroed and re-used. It also indicates that the same amount of stimulation energy is capable of releasing less trapped charges in than in , which can be a disadvantage for laser-scanning readouts. On the other hand, neighboring pixels may be bleached less by scattered light when scanning neighboring regions of the film.
5.1.8. Photon Energy Response
The photon energy response reported by De Souza et al. [
9] for
:Ce,Li pellets synthesized by solid-state synthesis shows an over-response of a maximum of 20% below 83 keV and close to unity above this threshold (83–1250 keV). Barbina et al. [
33] and Prokić [
10] found an energy over-response for
:Dy of ca 1.5 and 2 at 50 keV, respectively.
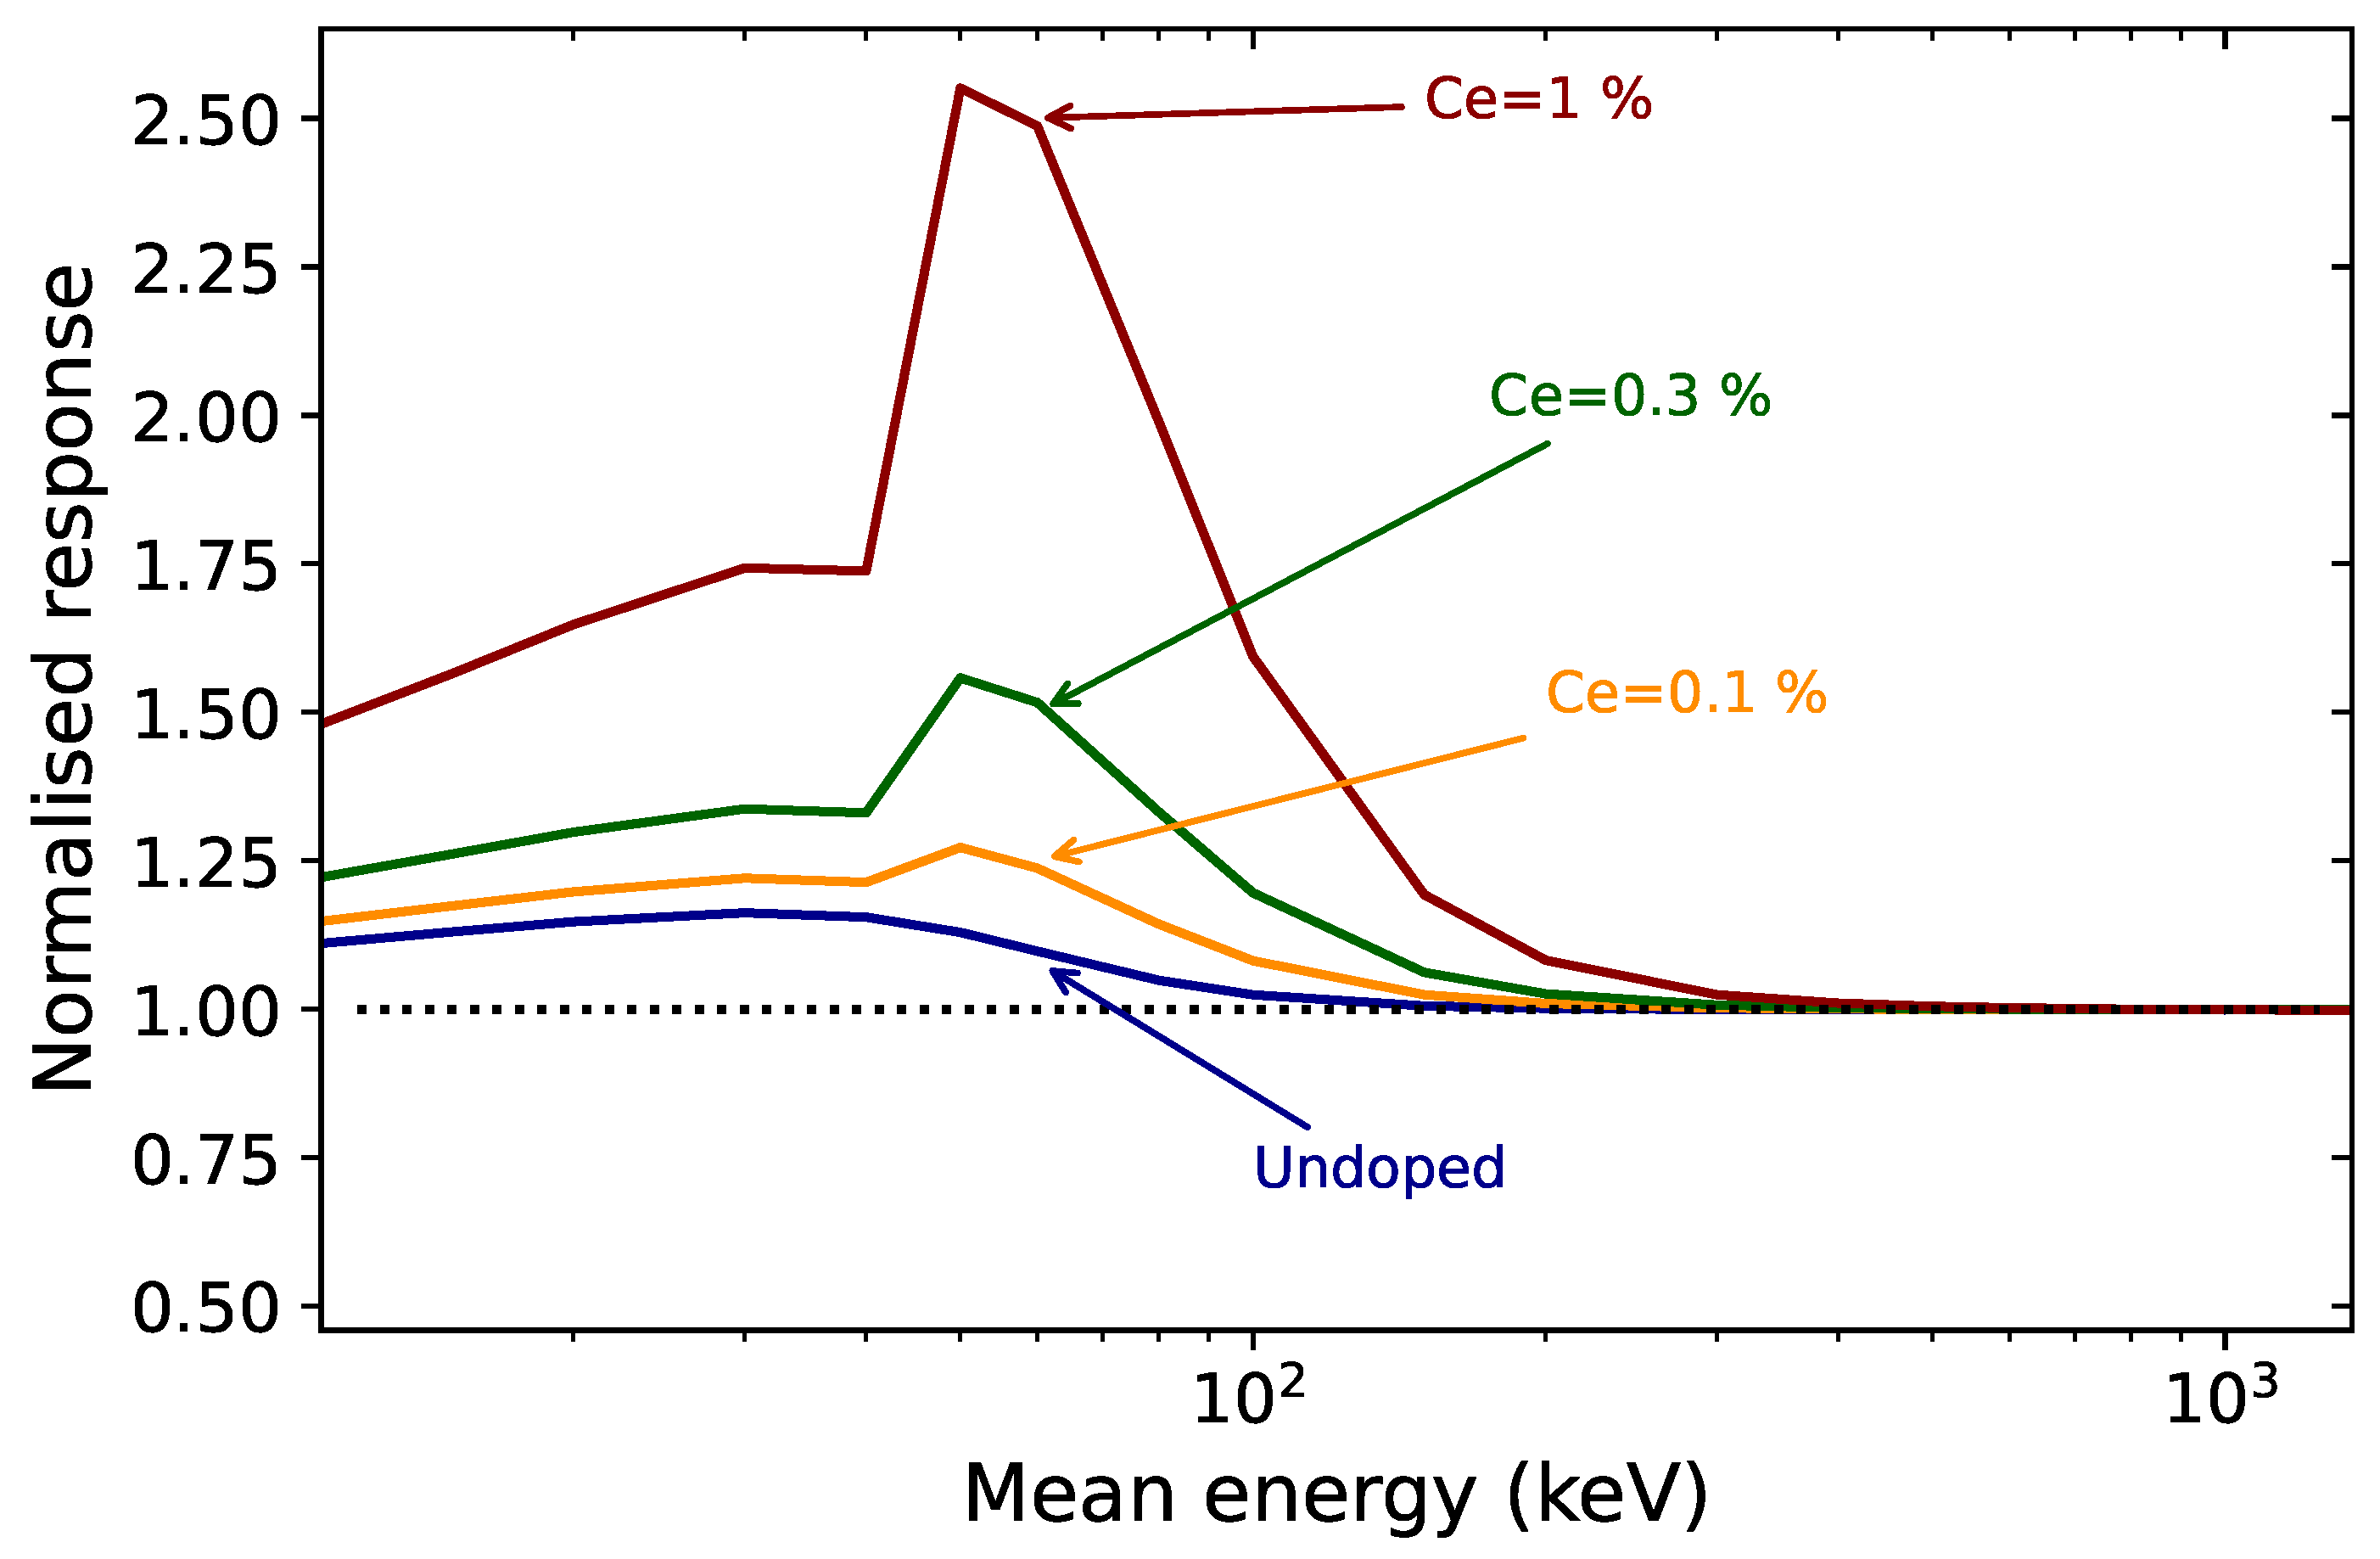
We calculated mass energy absorption coefficients of
:Ce,Li for various contents of cerium (0–1%). Normalized by the water mass energy absorption coefficients, they can be used as a predictor of the absorbed dose energy response (see Ch. 3, p. 123 in Yukihara and McKeever [
62]), which is illustrated in
Figure 8. The peak around 50–60 keV is caused by the presence of cerium—an element with a higher atomic number, and whose K-edge absorption occurs at 40 keV.
Although these results remain to be experimentally confirmed, they show that, even in small proportion, the presence of cerium causes an over-response with a maximum at 60 keV. For a cerium content of 0.3%, this is calculated to be of a factor of 1.5. Moreover, a relatively small increase in the concentration of cerium significantly impacts the energy response. For example, for a cerium concentration of 1%, our calculations predict an over-response by a factor of 2.5, compared with 1.5 for 0.3% cerium.
It is therefore recommended to keep the cerium concentration as low as possible, while guaranteeing the desired luminescent and dosimetric properties.
6. Current Challenges and Avenues of Research
6.1. Current Challenges
6.1.1. Eliminating Shallow Traps
The TL signal of
:Ce,Li is composed of a main TL peak centered around 220
C and shallower traps between 50–150
C. Although step-annealing data shows that the latter traps do not directly contribute to the OSL signal (
Figure 3), they could delay the luminescence emission by re-trapping charges or acting as competing centers. This is supported by the bleaching of the TL glow curve (
Figure 7), where a photo-transfer peak is produced upon blue and green light exposure, in the shallow trap region.
At the present stage, the exact nature of the trapping centers in :Ce,Li is unknown, and therefore the species introducing those traps remain unidentified. It is possible that they originate from amorphous regions, or grain boundaries, as the samples produced so far are not single crystals.
6.1.2. Reducing the Fading
The data presented in
Figure 6 indicates the presence of anomalous fading for samples synthesized through three different routes, whether it is for the main TL peak or OSL. Longer-term fading and isothermal decay experiments will be carried out to better constrain the differences in fading between samples, and linking this with a deeper material characterization could pinpoint why this fading rate differs from one sample to another.
One can correct for the loss of the signal when the delay time between irradiation and measurement is known. Alternatively, one could delay each measurement for approximately two days following the administration of a dose for the stable component to dominate the signal, although this would increase the overall delay to final dose results.
6.1.3. Improving the Bleachability
:Ce,Li samples exhibit poorer bleachability compared with
(
Figure 7). In terms of operationability, this means that the material will have to be subjected to prolonged bleaching treatment or the use of a shorter wavelength in order to be reused, and that a given amount of stimulation energy releases less signal. This may be an intrinsic property of
:Ce,Li, resulting from a lower optical cross-section of the trapping centers. Further measurements will aim at testing the bleachability of the OSL signal under UV light.
6.2. Future Research Directions
6.2.1. Understanding the Material
The results presented here are purely empirical, and a complete comprehensive theoretical framework is yet to be built. This would help not only in further optimizing the material but would also guide the design of future OSL materials.
In general, there seems to be a lack of understanding from the material properties’ side. For example, this includes the nature of the defects giving rise to the trapping centers, as Ce only acts as a recombination center. X-ray absorption data could help to constrain the local environment of the cerium ions and evaluate the degree of crystallinity in the samples. The nature of the role of lithium also remains obscure; the 10% added as dopant is unlikely to enter the lattice in its entirety.
It has been reported that an excess of boric acid is essential to obtain the pure phase [
11]. Evaporation has been advanced as an explanation for high-temperature glass synthesis [
17], but the same observation has been made for synthesis requiring temperature below the evaporation threshold of boric acid.
6.2.2. Investigating the Role of the Synthesis Route
Although the data in
Figure 1 has shown that the synthesis route does not influence the TL emission spectra, more research is needed to understand the influence of the synthesis on the luminescent and dosimetric properties of
:Ce,Li.
The preliminary results of the TL spectra for three samples synthesized through solid state synthesis, solution synthesis and glass synthesis did not seem to indicate an influence of the synthesis route on the emission spectra (
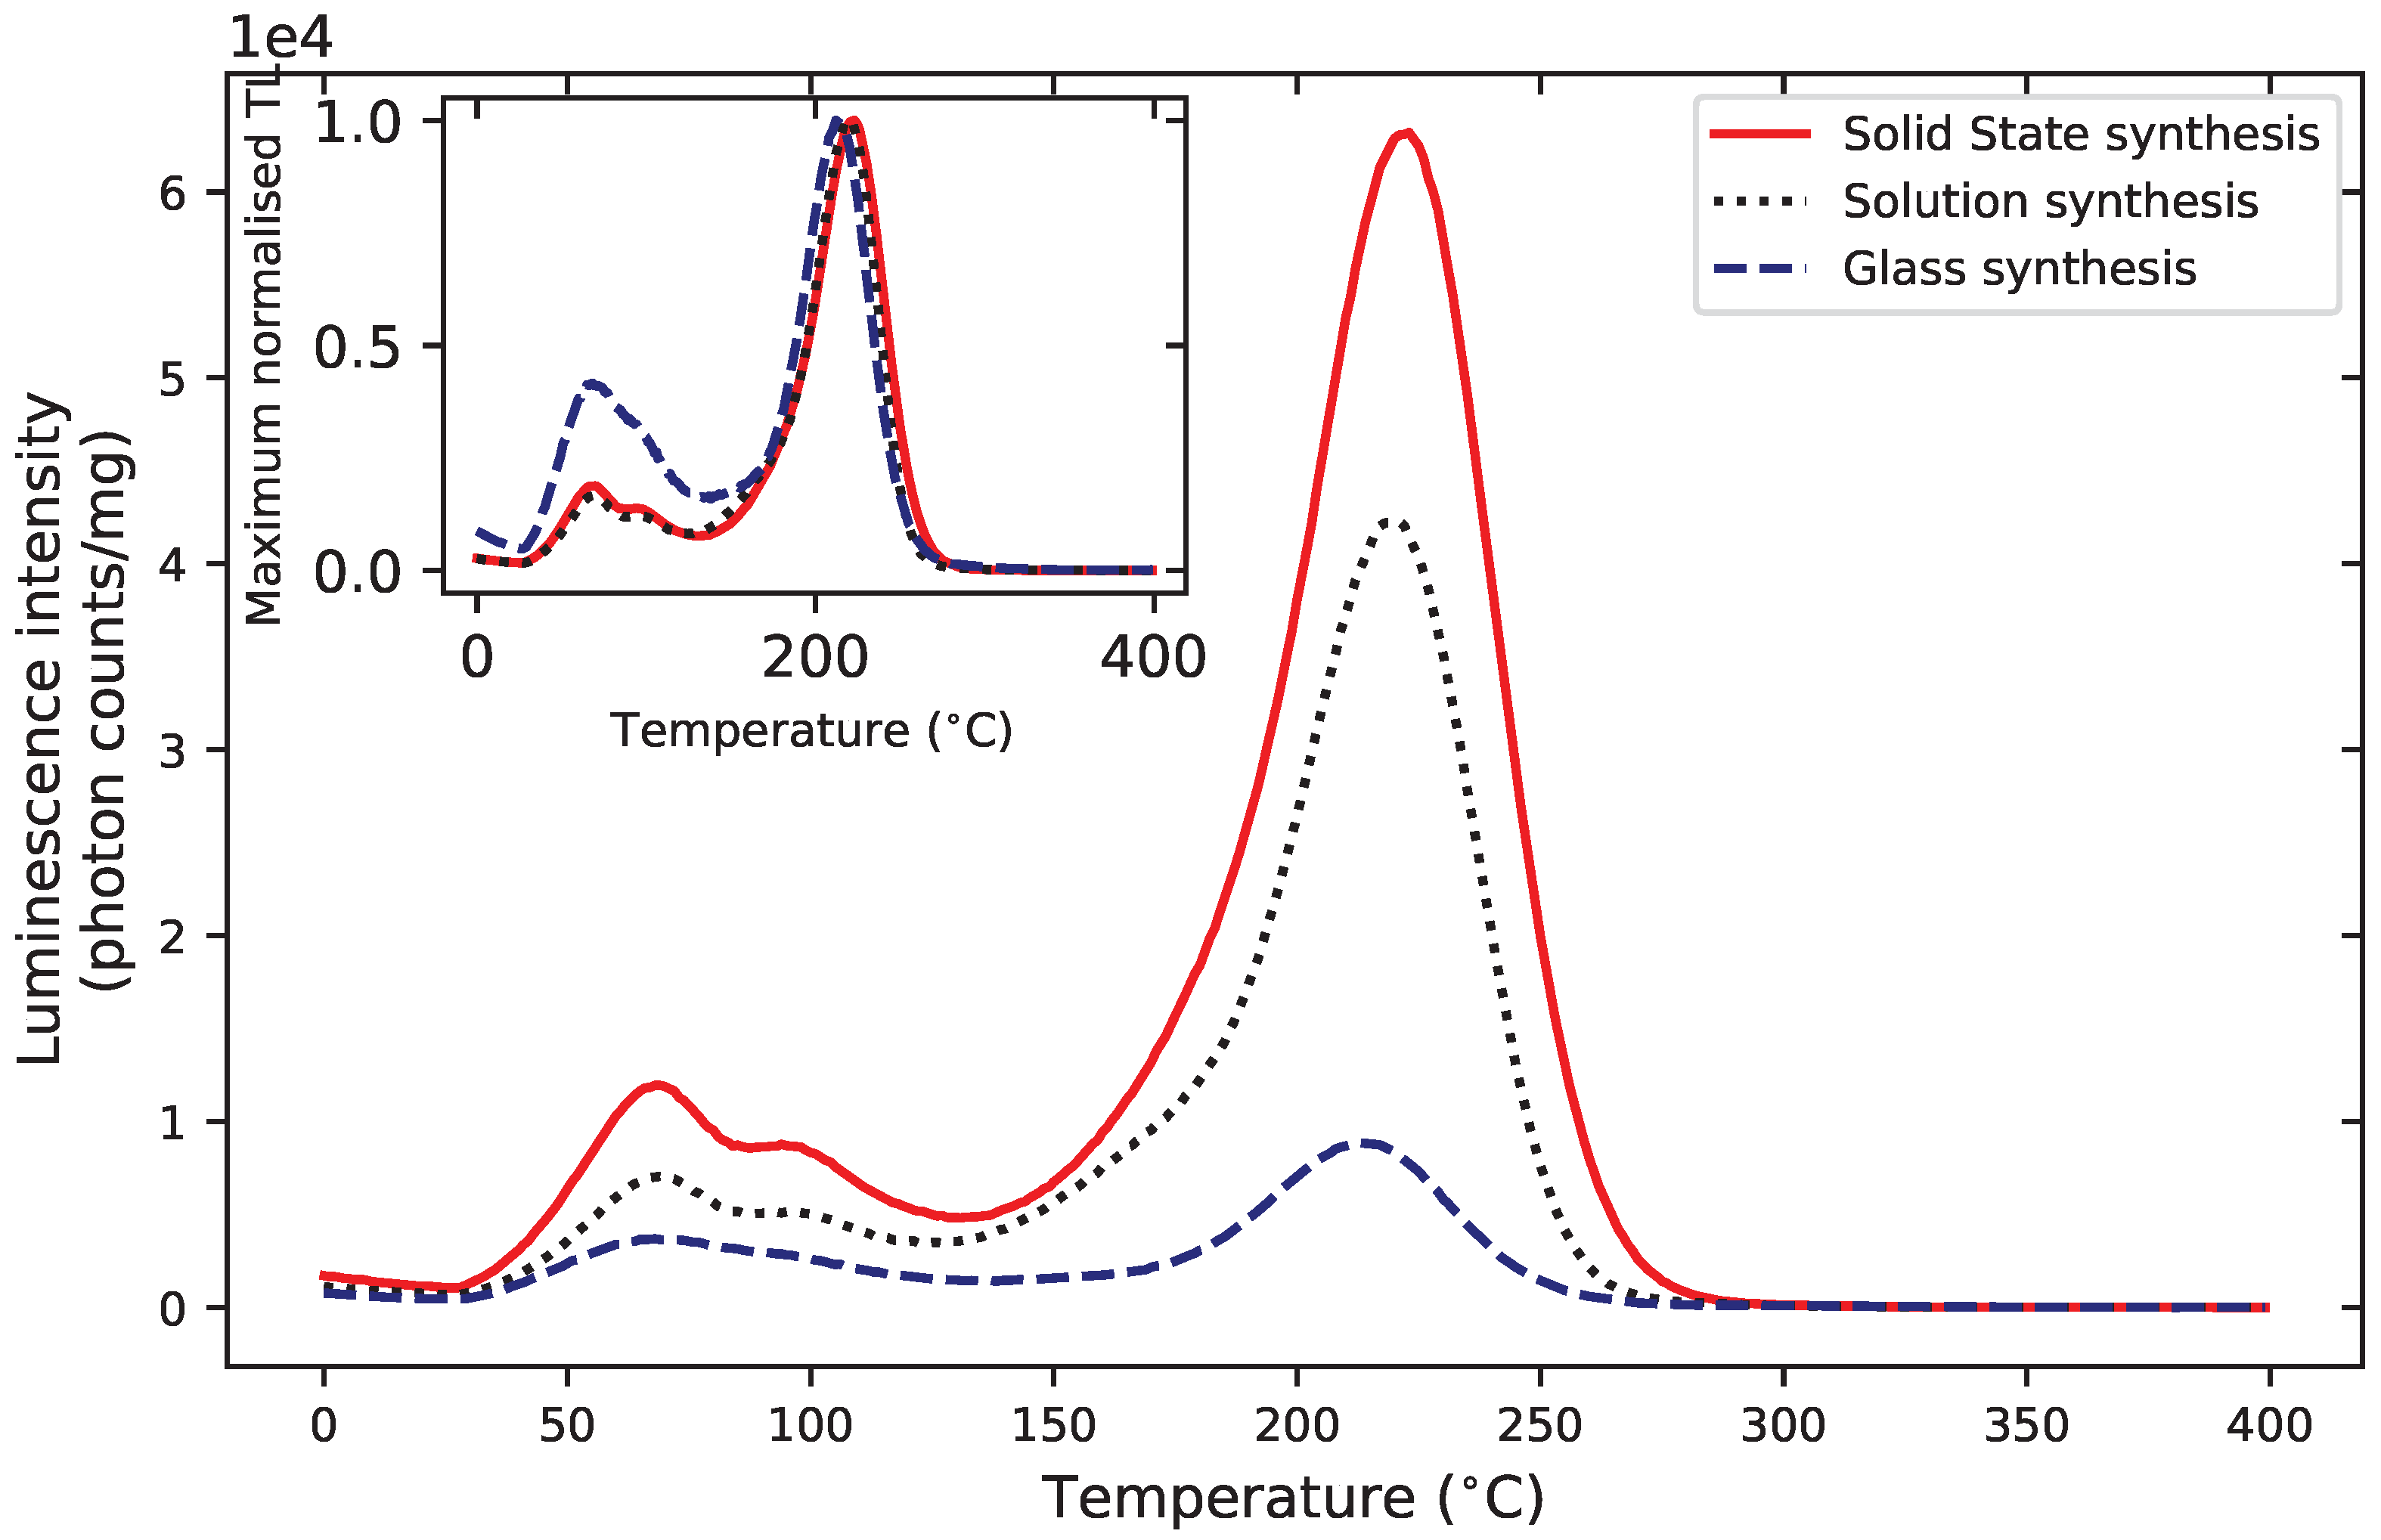
Figure 1). However, the mass normalized TL glow curves for glass, solid-state and solution syntheses shown in
Figure 9 exhibit differences, which may be related to the synthesis route. Glass synthesis, for example, appeared to produce a relative larger amount of shallower traps that resulted in a weaker 200
C peak, compared with solution synthesis or solid-state synthesis.
Differences in TL curves for
:Dy samples synthesized either through solid-state or precipitation methods have already been reported by De Souza et al. [
37]. They found significant differences in the TL glow curve, with an additional higher temperature peak being created through precipitation synthesis.
Finally, samples synthesized through solid state synthesis appeared to exhibit less fading than samples synthesized through glass synthesis (
Figure 6). Further work will focus on building a more complete picture of the influence of the synthesis route on the luminescence properties but also on understanding the structural differences causing possible variation in luminescence properties.
6.2.3. Photon Energy Response
If the calculations shown in
Figure 8 are experimentally confirmed, they will indicate that, despite the
matrix being tissue equivalent and the cerium concentration being low, it can result in an over-response for low photon energies. This should be investigated for samples with different cerium concentrations to determine the optimum cerium concentration that increases the photon energy response as little as possible, while preserving the luminescent and dosimetric properties.
7. Conclusions
In this work, we summarized the dosimetric properties of :Ce,Li, outlining and comparing literature results and complementing them by original measurements, using as a reference material. The comparison of literature results highlighted some discrepancies, for example, in terms of fading or emission spectroscopy. We hypothesized that this could be caused by differences in synthesis routes. A side-by-side comparison of samples through solid-state, solution or glass did not show differences in terms of emission spectra, but a slight variability in terms of fading behavior. Overall, whereas the OSL signal of :Ce,Li is comparable to that of in terms of brightness, it under-performs in terms of bleachability and fading. Although the OSL signal of :Ce,Li appears to originate from traps associated with a similar temperature region of the TL glow curve, anomalous fading seems to cause a loss of signal of 2–6% within a day. However, :Ce,Li also exhibits a saturation limit in the kGy range and a higher useful signal in time-resolved measurement, confirming its potential for dosimetry in the kGy range and spatially-resolved dosimetry.
Future work will focus on better understanding whether the luminescence properties differ from one synthesis route to another and experimentally assessing the influence of the cerium content on the energy response. Finally, material characterization tools will be applied to gain a better understanding of the structural properties.
Author Contributions
Conceptualization, L.B. and E.G.Y.; methodology, L.B., I.P., D.J.G., Y.K., S.T. and E.G.Y.; formal analysis, L.B. and I.P.; investigation, L.B., I.P. and D.J.G.; resources, L.B., I.P., D.J.G., P.L., D.V. and E.G.Y.; data curation, L.B. and I.P.; writing—original draft preparation, L.B.; writing—review and editing, L.B., I.P., J.B.C., D.J.G., Y.K., P.L., S.T., D.V. and E.G.Y.; supervision, L.B., D.J.G. and E.G.Y.; project administration, D.J.G.; funding acquisition, L.B. and D.J.G. All authors have read and agreed to the published version of the manuscript.
Funding
This work was funded by a Paul Scherrer Institute research grant (no. 2021 01346). The Risø TL/OSL-DA-20365 reader (DTU Nutech, Denmark) was acquired with partial support from the Swiss National Science Foundation (R’Equip project 206021 177028).
Institutional Review Board Statement
Not applicable.
Informed Consent Statement
Not applicable.
Data Availability Statement
The data that support the findings of this study are available from the corresponding author upon reasonable request.
Conflicts of Interest
The authors declare no conflict of interest.
References
- Yukihara, E.G.; McKeever, S.W.; Andersen, C.E.; Bos, A.J.; Bailiff, I.K.; Yoshimura, E.M.; Sawakuchi, G.O.; Bossin, L.; Christensen, J.B. Luminescence dosimetry. Nat. Rev. Methods Prim. 2022, 2, 1–21. [Google Scholar] [CrossRef]
- Yukihara, E.G.; Bos, A.J.; Bilski, P.; McKeever, S.W. The quest for new thermoluminescence and optically stimulated luminescence materials: Needs, strategies and pitfalls. Radiat. Meas. 2022, 158, 106846. [Google Scholar] [CrossRef]
- Ahmed, M.; Schnell, E.; Ahmad, S.; Yukihara, E. Image reconstruction algorithm for optically stimulated luminescence 2D dosimetry using laser-scanned Al2O3:C and Al2O3:C,Mg films. Phys. Med. Biol. 2016, 61, 7484. [Google Scholar] [CrossRef] [PubMed]
- Grau, C.; Durante, M.; Georg, D.; Langendijk, J.A.; Weber, D.C. Particle therapy in Europe. Mol. Oncol. 2020, 14, 1492–1499. [Google Scholar] [CrossRef]
- Yukihara, E.G.; Doull, B.A.; Ahmed, M.; Brons, S.; Tessonnier, T.; Jäkel, O.; Greilich, S. Time-resolved optically stimulated luminescence of Al2O3: C for ion beam therapy dosimetry. Phys. Med. Biol. 2015, 60, 6613. [Google Scholar] [CrossRef]
- Gustafson, T.D.; Milliken, E.; Jacobsohn, L.; Yukihara, E. Progress and challenges towards the development of a new optically stimulated luminescence (OSL) material based on MgB4O7:Ce,Li. J. Lumin. 2019, 212, 242–249. [Google Scholar] [CrossRef]
- Shrestha, N.; Vandenbroucke, D.; Leblans, P.; Yukihara, E. Feasibility studies on the use of MgB4O7:Ce,Li-based films in 2D optically stimulated luminescence dosimetry. Phys. Open 2020, 5, 100037. [Google Scholar] [CrossRef]
- Yukihara, E.; Christensen, J.; Togno, M. Demonstration of an optically stimulated luminescence (OSL) material with reduced quenching for proton therapy dosimetry: MgB4O7:Ce,Li. Radiat. Meas. 2022, 152, 106721. [Google Scholar] [CrossRef]
- De Souza, L.F.; Souza, D.N.; Rivera, G.B.; Vidal, R.M.; Caldas, L.V. Dosimetric characterization of MgB4O7:Ce,Li as an optically stimulated dosimeter for photon beam radiotherapy. Perspect. Sci. 2019, 12, 100397. [Google Scholar] [CrossRef]
- Prokić, M. Development of highly sensitive CaSO4: Dy/Tm and MgB4O7: Dy/Tm sintered thermoluminescent dosimeters. Nucl. Instrum. Methods 1980, 175, 83–86. [Google Scholar] [CrossRef]
- Yukihara, E.; Milliken, E.; Doull, B. Thermally stimulated and recombination processes in MgB4O7 investigated by systematic lanthanide doping. J. Lumin. 2014, 154, 251–259. [Google Scholar] [CrossRef]
- Prokić, M. Individual monitoring based on magnesium borate. Radiat. Prot. Dosim. 2007, 125, 247–250. [Google Scholar] [CrossRef]
- Souza, L.F.; Antonio, P.L.; Caldas, L.V.; Souza, D.N. Neodymium as a magnesium tetraborate matrix dopant and its applicability in dosimetry and as a temperature sensor. Nucl. Instrum. Methods Phys. Res. Sect. A Acceler. Spectrom. Detect. Assoc. Equipm. 2015, 784, 9–13. [Google Scholar] [CrossRef]
- Yukihara, E.; Coleman, A.; Bastani, S.; Gustafson, T.; Talghader, J.; Daniels, A.; Stamatis, D.; Lightstone, J.; Milby, C.; Svingala, F. Particle temperature measurements in closed chamber detonations using thermoluminescence from Li2B4O7:Ag,Cu,MgB4O7: Dy,Li and CaSO4: Ce, Tb. J. Lumin. 2015, 165, 145–152. [Google Scholar] [CrossRef]
- Yukihara, E.; Doull, B.; Gustafson, T.; Oliveira, L.; Kurt, K.; Milliken, E. Optically stimulated luminescence of MgB4O7:Ce,Li for gamma and neutron dosimetry. J. Lumin. 2017, 183, 525–532. [Google Scholar] [CrossRef]
- Souza, L.; Silva, A.; Antonio, P.; Caldas, L.; Souza, S.; d’Errico, F.; Souza, D. Dosimetric properties of MgB4O7:Dy,Li and MgB4O7:Ce,Li for optically stimulated luminescence applications. Radiat. Meas. 2017, 106, 196–199. [Google Scholar] [CrossRef]
- Kitagawa, Y.; Yukihara, E.G.; Tanabe, S. Development of Ce3+ and Li+ co-doped magnesium borate glass ceramics for optically stimulated luminescence dosimetry. J. Lumin. 2021, 232, 117847. [Google Scholar] [CrossRef]
- Annalakshmi, O.; Jose, M.; Madhusoodanan, U.; Venkatraman, B.; Amarendra, G. Synthesis and thermoluminescence characterization of MgB4O7. Radiat. Meas. 2013, 59, 15–22. [Google Scholar] [CrossRef]
- Karali, T.; Rowlands, A.P.; Prokic, M.D.; Townsend, P.; Halmagean, E. Thermoluminescent spectra of rare earth doped MgB4O7 dosemeters. Radiat. Protect. Dosim. 2002, 100, 333–336. [Google Scholar] [CrossRef]
- Bahl, S.; Pandey, A.; Lochab, S.; Aleynikov, V.; Molokanov, A.; Kumar, P. Synthesis and thermoluminescence characteristics of gamma and proton irradiated nanocrystalline MgB4O7:Dy,Na. J. Lumin. 2013, 134, 691–698. [Google Scholar] [CrossRef]
- Kitis, G.; Polymeris, G.S.; Sfampa, I.K.; Prokic, M.; Meric, N.; Pagonis, V. Prompt isothermal decay of thermoluminescence in MgB4O7: Dy, Na and LiB4O7: Cu, In dosimeters. Radiat. Meas. 2016, 84, 15–25. [Google Scholar] [CrossRef]
- De Oliveira, L.S.S.; De Souza, L.F.; Donald, G.G.; D’Emidio, M.F.S.; Novais, A.d.L.F.; Souza, D. Challenges in personal and clinical dosimetry using Li2B4O7 and MgB4O7 as TLD and OSLD. Braz. J. Radiat. Sci. 2022, 10, 2A. [Google Scholar] [CrossRef]
- Altunal, V.; Abusaid, W.; Guckan, V.; Ozdemir, A.; Yegingil, Z. Luminescence characterization of Ce and Gd doped MgB4O7 phosphors. J. Lumin. 2022, 246, 118815. [Google Scholar] [CrossRef]
- Ozdemir, A.; Altunal, V.; Guckan, V.; Kurt, K.; Yegingil, Z. Luminescence characteristics of newly-developed MgB4O7:Ce3+,Na+ phosphor as an OSL dosimeter. J. Alloys Comp. 2021, 865, 158498. [Google Scholar] [CrossRef]
- Ozdemir, A.; Guckan, V.; Altunal, V.; Kurt, K.; Yegingil, Z. Thermoluminescence in MgB4O7:Pr,Dy dosimetry powder synthesized by solution combustion synthesis method. J. Lumin. 2021, 230, 117761. [Google Scholar] [CrossRef]
- Sahare, P.; Singh, M.; Kumar, P. Synthesis and TL characteristics of MgB4O7:Mn,Tb phosphor. J. Lumin. 2015, 160, 158–164. [Google Scholar] [CrossRef]
- González, P.; Ávila, O.; Mendoza-Anaya, D.; Escobar-Alarcón, L. Effect of sintering temperature on sensitivity of MgB4O7:Tm,Ag obtained by the solution combustion method. Appl. Radiat. Isotopes 2021, 167, 109459. [Google Scholar] [CrossRef]
- Tan, Z.; Lan, T.; Gao, L.; Zhang, C.; Liu, X.; Luo, D.; Tang, Q. Comparison of thermoluminescence spectra of MgB4O7 doped with dysprosium and manganese. J. Rare Earths 2013, 31, 1039–1042. [Google Scholar] [CrossRef]
- Palan, C.; Chauhan, A.; Sawala, N.; Bajaj, N.; Omanwar, S. Thermoluminescence and optically stimulated luminescence properties of MgB4O7:Ag phosphor. Int. J. Lumin. Appl. 2015, 5, 408–410. [Google Scholar]
- Dogan, M.; Yazici, A. Thermoluminescence properties of Ce-doped MgB4O7 phosphor. J. Optoelectron. Adv. Mater. 2009, 11, 1783. [Google Scholar]
- Prokic, M. MgB4O7: Mn as a new TL dosemeter. Radiat. Protect. Dosim. 1993, 47, 191–193. [Google Scholar] [CrossRef]
- Kawashima, Y.S.; Gugliotti, C.F.; Yee, M.; Tatumi, S.H.; Mittani, J.C.R. Thermoluminescence features of MgB4O7:Tb phosphor. Radiat. Phys. Chem. 2014, 95, 91–93. [Google Scholar] [CrossRef]
- Barbina, V.; Contento, G.; Furetta, C.; Malisan, M.; Padovani, R. Preliminary results on dosimetric properties op MgB4O7:Dy. Radiat. Effects 1982, 67, 55–62. [Google Scholar] [CrossRef]
- Campos, L.; Fernandes Filho, O. Thermoluminescent characterisation of MgB4O7:Dy sintered pellets. Radiat. Protect. Dosim. 1990, 33, 111–113. [Google Scholar] [CrossRef]
- Lochab, S.; Pandey, A.; Sahare, P.; Chauhan, R.; Salah, N.; Ranjan, R. Nanocrystalline MgB4O7:Dy for high dose measurement of gamma radiation. Phys. Status Solidi A 2007, 204, 2416–2425. [Google Scholar] [CrossRef]
- Legorreta-Alba, O.; Cruz-Zaragoza, E.; Díaz, D.; Marcazzó, J. Synthesis of MgB4O7:Dy3+ and thermoluminescent characteristics at low doses of beta radiation. J. Nucl. Phys. Mater. Sci. Radiat. Appl. 2018, 6, 71–76. [Google Scholar] [CrossRef]
- De Souza, L.F.; Caldas, L.V.; Junot, D.O.; Silva, A.M.; Souza, D.N. Thermal and structural properties of magnesium tetraborate produced by solid state synthesis and precipitation for use in thermoluminescent dosimetry. Radiat. Phys. Chem. 2019, 164, 108382. [Google Scholar] [CrossRef]
- İflazoğlu, S.; Yılmaz, A.; Kafadar, V.E.; Topaksu, M.; Yazıcı, A. Neutron+ Gamma response of undoped and Dy doped MgB4O7:Dy thermoluminescence dosimeter. Appl. Radiat. Isotopes 2019, 147, 91–98. [Google Scholar] [CrossRef]
- Porwal, N.; Kadam, R.; Seshagiri, T.; Natarajan, V.; Dhobale, A.; Page, A. EPR and TSL studies on MgB4O7 doped with Tm: Role of in TSL glow peak at 470 K. Radiat. Meas. 2005, 40, 69–75. [Google Scholar] [CrossRef]
- Bakhsh, M.; Wan Abdullah, W.S.; Mustafa, I.S.; Al Musawi, M.S.A.; Razali, N.A.N. Synthesis, characterisation and dosimetric evaluation of MgB4O7 glass as thermoluminescent dosimeter. Radiat. Effects Defects Solids 2018, 173, 446–460. [Google Scholar] [CrossRef]
- Crijns, W.; Dirk, V.; Paul, L.; Tom, D. A reusable OSL-film for 2D radiotherapy dosimetry. Phys. Med. Biol. 2017, 62, 8441. [Google Scholar]
- Yukihara, E.G. Luminescence properties of BeO optically stimulated luminescence (OSL) detectors. Radiat. Meas. 2011, 46, 580–587. [Google Scholar] [CrossRef]
- Schalch, D.; Scharmann, A.; Weiß, A. Characterization of reactively sputtered BeO films. Thin Solid Films 1985, 124, 351–358. [Google Scholar] [CrossRef]
- Sadat, T.; Morisseau, M.; Ross, M. Electron beam sterilisation of heterogeneous medical devices. Radiat. Phys. Chem. 1993, 42, 491–494. [Google Scholar] [CrossRef]
- Eagle, M.; Rooney, P.; Lomas, R.; Kearney, J. Validation of radiation dose received by frozen unprocessed and processed bone during terminal sterilisation. Cell Tissue Bank. 2005, 6, 221–230. [Google Scholar] [CrossRef]
- Alariqi, S.A.; Kumar, A.P.; Rao, B.; Singh, R. Biodegradation of γ-sterilised biomedical polyolefins under composting and fungal culture environments. Polym. Degrad. Stab. 2006, 91, 1105–1116. [Google Scholar] [CrossRef]
- Kumar, S.; Saxena, S.; Verma, J.; Gautam, S. Development of ambient storable meal for calamity victims and other targets employing radiation processing and evaluation of its nutritional, organoleptic, and safety parameters. LWT Food Sci. Technol. 2016, 69, 409–416. [Google Scholar] [CrossRef]
- Marathe, S.; Deshpande, R.; Khamesra, A.; Ibrahim, G.; Jamdar, S.N. Effect of radiation processing on nutritional, functional, sensory and antioxidant properties of red kidney beans. Radiat. Phys. Chem. 2016, 125, 1–8. [Google Scholar] [CrossRef]
- Le Cann, S.; Tudisco, E.; Turunen, M.J.; Patera, A.; Mokso, R.; Tägil, M.; Belfrage, O.; Hall, S.A.; Isaksson, H. Investigating the mechanical characteristics of bone-metal implant interface using in situ synchrotron tomographic imaging. Front. Bioeng. Biotechnol. 2019, 6, 208. [Google Scholar] [CrossRef]
- Yan, L.; Cinar, A.; Ma, S.; Abel, R.; Hansen, U.; Marrow, T.J. A method for fracture toughness measurement in trabecular bone using computed tomography, image correlation and finite element methods. J. Mech. Behav. Biomed. Mater. 2020, 109, 103838. [Google Scholar] [CrossRef]
- Dejea, H.; Schlepütz, C.M.; Méndez-Carmona, N.; Arnold, M.; Garcia-Canadilla, P.; Longnus, S.L.; Stampanoni, M.; Bijnens, B.; Bonnin, A. A tomographic microscopy-compatible Langendorff system for the dynamic structural characterization of the cardiac cycle. Front. Cardiovasc. Med. 2022, 9, 3682. [Google Scholar] [CrossRef]
- Karsch, L.; Beyreuther, E.; Burris-Mog, T.; Kraft, S.; Richter, C.; Zeil, K.; Pawelke, J. Dose rate dependence for different dosimeters and detectors: TLD, OSL, EBT films, and diamond detectors. Med. Phys. 2012, 39, 2447–2455. [Google Scholar] [CrossRef]
- Christensen, J.B.; Togno, M.; Nesteruk, K.P.; Psoroulas, S.; Meer, D.; Weber, D.C.; Lomax, T.; Yukihara, E.G.; Safai, S. Al2O3:C optically stimulated luminescence dosimeters (OSLDs) for ultra-high dose rate proton dosimetry. Phys. Med. Biol. 2021, 66, 085003. [Google Scholar] [CrossRef]
- Motta, S.; Christensen, J.B.; Togno, M.; Schäfer, R.M.; Safai, S.; Lomax, A.J.; Yukihara, E.G. Characterization of LiF:Mg,Ti thermoluminescence detectors in low-LET proton beams at ultra-high dose rates. Phys. Med. Biol. 2023. [Google Scholar] [CrossRef]
- Yasuda, H.; Kobayashi, I. Optically stimulated luminescence from Al2O3:C irradiated with relativistic heavy ions. Radiat. Prot. Dosim. 2001, 95, 339–343. [Google Scholar] [CrossRef]
- Edmund, J.M.; Andersen, C.E.; Greilich, S.; Sawakuchi, G.; Yukihara, E.; Jain, M.; Hajdas, W.; Mattsson, S. Optically stimulated luminescence from Al2O3:C irradiated with 10–60 MeV protons. Nucl. Instrum. Methods Phys. Res. Sect. A Acceler. Spectrom. Detect. Assoc. Equipm. 2007, 580, 210–213. [Google Scholar] [CrossRef]
- Sawakuchi, G.O.; Yukihara, E.; McKeever, S.; Benton, E.; Gaza, R.; Uchihori, Y.; Yasuda, N.; Kitamura, H. Relative optically stimulated luminescence and thermoluminescence efficiencies of Al2O3: C dosimeters to heavy charged particles with energies relevant to space and radiotherapy dosimetry. J. Appl. Phys. 2008, 104, 124903. [Google Scholar] [CrossRef]
- Kerns, J.R.; Kry, S.F.; Sahoo, N. Characteristics of optically stimulated luminescence dosimeters in the spread-out Bragg peak region of clinical proton beams. Med. Phys. 2012, 39, 1854–1863. [Google Scholar] [CrossRef]
- Teichmann, T.; Torres, M.G.; van Goethem, M.; van der Graaf, E.; Henniger, J.; Jahn, A.; Kiewiet, H.; Sommer, M.; Ullrich, W.; Weinhold, C.; et al. Dose and dose rate measurements in proton beams using the luminescence of beryllium oxide. J. Instrument. 2018, 13, P10015. [Google Scholar] [CrossRef]
- Christensen, J.B.; Togno, M.; Bossin, L.; Pakari, O.V.; Safai, S.; Yukihara, E.G. Improved simultaneous LET and dose measurements in proton therapy. Sci. Rep. 2022, 12, 1–10. [Google Scholar] [CrossRef]
- Hubbell, J.; Seltzer, S. NIST Standard Reference Database 126; National Institute of Standards and Technology: Gaithersburg, MD, USA, 1996. [Google Scholar]
- Yukihara, E.G.; McKeever, S.W. Optically Stimulated Luminescence: Fundamentals and Applications; John Wiley & Sons: Hoboken, NJ, USA, 2011. [Google Scholar]
Figure 1.
TL spectra of :Ce,Li samples prepared through solution synthesis, solid state synthesis and glass synthesis, following irradiation 35 Gy. The spectra were normalized by their respective maximum intensity and were obtained through integration over the temperature range 225–275 C, corresponding to the TL peak maximum. The 360 nm emission corresponds to the Ce emission. The spectra were corrected for instrument response. Detection unit: Andor spectrometer; silica window; heating rate: 1 C/s.
Figure 2.
Intensity comparison of the mass normalized signals of :Ce,Li and under continuous-wave blue stimulation (a), green stimulation (b) and thermal stimulation (c) following a 350 mGy irradiation. Detection unit: PMT 9235QB; (a,b) Hoya U-340 filter, (c) Schott BG-39 filter.
Figure 2.
Intensity comparison of the mass normalized signals of :Ce,Li and under continuous-wave blue stimulation (a), green stimulation (b) and thermal stimulation (c) following a 350 mGy irradiation. Detection unit: PMT 9235QB; (a,b) Hoya U-340 filter, (c) Schott BG-39 filter.
Figure 3.
OSL signal of :Ce,Li (a) and (b) following 35 mGy irradiation and preheat to 30–350 C (open red circles). The OSL signal, taken as the integral of the OSL decay curve minus a background subtraction, was normalized by the signal at room temperature (25 C, no preheat). These data are compared with the TL glow curve of each material (blue continuous line). The TL was recorded following a 35 mGy irradiation, at a heating rate of 1 C/s, and each curve was normalized by its respective maximal intensity. Detection unit: PMT 9235QB; Hoya U-340 filter.
Figure 4.
Photon arrival time distribution curves of :Ce,Li and following blue stimulation pulse 10 s, following a 350 mGy irradiation. Detection unit: PMT 9235QB; Hoya U-340 filter.
Figure 4.
Photon arrival time distribution curves of :Ce,Li and following blue stimulation pulse 10 s, following a 350 mGy irradiation. Detection unit: PMT 9235QB; Hoya U-340 filter.
Figure 5.
Blue LM-OSL dose response of :Ce,Li synthesized through solution method following irradiation with doses in the 3.5–7000 Gy range. Each datapoint represents the average response of three samples (open circles), the continuous lines, the interpolation between experimental datapoints. The response to dose was calculated as the integrated LM-OSL signal over the first 200 s of stimulation (S), normalized to the sample-specific LM-OSL response to a test dose of 3.5 Gy (). The test dose response was measured before the administration and measurement of the nominal dose, to minimize sensitivity changes induced by a hard-to-bleach component. The samples were readout one week following irradiation, to avoid signal originating from the shallower traps. The dotted line indicates linearity. Detection unit: PMT 9235QB; Hoya U-340 and ND OD 2 filters. The uncertainties were evaluated as the standard deviation of the signal from three samples, but are too small to be visible on the graph.

Figure 6.
(
a) Normalized loss of signal of the main TL peak of
:Ce,Li samples synthesized through solid state synthesis (red circles), solution synthesis (black squares) and glass synthesis (blue diamonds). The signal was calculated as the integral in the temperature region 200–300
C. (
b) Comparison of the loss of OSL signal (red circles) of a sample synthesized through solution synthesis, as calculated integrating over the entire OSL decay curve and the loss of TL signal (black squares) of the same sample, calculated as the integral in the region 175–250
C, to which the OSL signal was associated by pulse-annealed data (see
Section 5.1.3). The TL and OSL signals were obtained following a 0.35 Gy
irradiation and storage in the dark (0.5–24 h) and normalized to the signals following a similar irradiation and readout within 5 min. The dotted lines indicates a function
fitted to the experimental datapoints. The uncertainties were evaluated as the fits’ residuals standard deviation. Detection unit: PMT 9235QB; Hoya U-340 filter.

Figure 7.
TL signal of :Ce,Li (a–c) and (d–f) following bleaching using blue (a,d), green (b,e) or UV (c,f) LEDs for 0–120 s. Detection unit: PMT 9235QB; Hoya U-340 filter.
Figure 7.
TL signal of :Ce,Li (a–c) and (d–f) following bleaching using blue (a,d), green (b,e) or UV (c,f) LEDs for 0–120 s. Detection unit: PMT 9235QB; Hoya U-340 filter.
Figure 8.
Calculated mass energy absorption coefficients of :Ce,Li for various contents of cerium (0–1%) normalized to those of water, .
Figure 8.
Calculated mass energy absorption coefficients of :Ce,Li for various contents of cerium (0–1%) normalized to those of water, .
Figure 9.
Mass normalized TL intensity of :Ce,Li samples prepared through solution synthesis, solid state synthesis and glass synthesis, following a 350 mGy irradiation. The inset shows the TL glow curves normalized by their maximum. Detection unit: PMT 9235QB; Hoya U-340 filter.
Figure 9.
Mass normalized TL intensity of :Ce,Li samples prepared through solution synthesis, solid state synthesis and glass synthesis, following a 350 mGy irradiation. The inset shows the TL glow curves normalized by their maximum. Detection unit: PMT 9235QB; Hoya U-340 filter.
| Disclaimer/Publisher’s Note: The statements, opinions and data contained in all publications are solely those of the individual author(s) and contributor(s) and not of MDPI and/or the editor(s). MDPI and/or the editor(s) disclaim responsibility for any injury to people or property resulting from any ideas, methods, instructions or products referred to in the content. |
© 2023 by the authors. Licensee MDPI, Basel, Switzerland. This article is an open access article distributed under the terms and conditions of the Creative Commons Attribution (CC BY) license (https://creativecommons.org/licenses/by/4.0/).


 ,
, 


