Article

Gaussian Model of Anti-Radar Properties for Coatings Based on Carbonyl Iron Powder

by
Wojciech Przybył
1,*,
Robert Mazurczuk
1,
Artur Kalinowski
2 and
Krzysztof A. Bogdanowicz
1,*
1
Military Institute of Engineer Technology, Obornicka 136, 50-961 Wrocław, Poland
2
Faculty of Mechatronics and Mechanical Engineering, Kielce University of Technology, Al. 1000-lecia P. P. 7, 25-314 Kielce, Poland
*
Authors to whom correspondence should be addressed.
Materials 2023, 16(8), 3050; https://doi.org/10.3390/ma16083050
Submission received: 7 March 2023 / Revised: 30 March 2023 / Accepted: 11 April 2023 / Published: 12 April 2023

Abstract

:
The article presents the Gaussian model of the electromagnetic radiation attenuation properties of two resin systems containing 75% or 80% of a carbonyl iron load as an absorber in the 4–18 GHz range. For the attenuation values obtained in the laboratory, mathematical fitting was performed in the range of 4–40 GHz to visualize the full curve characteristics. The simulated curves fitted up to a 0.998 R2 value of the experimental results. The in depth analysis of the simulated spectra allowed a thorough evaluation of the influence of the type of resin, absorber load, and layer thickness on reflection loss parameters such as the maximum attenuation, peak position, half-height width, and base slope of the peak. The simulated results were convergent with the literature findings, allowing a much deeper analysis. This confirmed that the suggested Gaussian model could provide additional information, useful in terms of comparative analyses of datasets.

1. Introduction

Today’s armed conflicts, especially full-scale ones, confirm that the use of armored weapons, gun and rocket artillery, and aviation is essential to achieve operational and tactical goals. The basis for the effectiveness of these types of weapons is effective reconnaissance [1]. Thanks to the widespread use of various sensors, recognition is carried out with a wide range of electromagnetic radiation (Figure 1).
Optical and thermal bands are usually used for closer ranges, whilst radar bands are commonly used for longer ranges. The radar range covers wavelengths from a few millimeters to several meters and is divided into a number of bands, depending on the propagation properties (Table 1).
Several bands are used in applications related to military reconnaissance; mainly, C (4–8 GHz), X (8–12 GHz), and Ku (12–18 GHz). Thus, the authors focused on the radar properties of materials for these frequency bands. The aim of the authors was to build a mathematical model that, for a material with radio wave-damping properties for the above-mentioned ranges, would make it possible to determine the frequency for which the maximum attenuation would occur and its level, depending on the parameters of the paint coating; i.e., the thickness, percentage share, and type of binder. A number of radiation absorbers are now known. These are metals (nickel, iron–nickel alloys, and iron), carbon-based non-metals (graphite, graphene, and their nanotubes, nanoparticles, nanofibers, and flakes) [3,4,5,6,7], ceramic materials (magnetite), conductive polymers (PEDOT:PSS [8]), and composites.
The total attenuation of materials can be described by the shielding efficiency SE (dB), which is described by the following equation [9]:
SE = 10 log|PI/PT| = 20 log|EI/ET| = 10 log|HI/HT|
where PI and PT are the incident power (I) and emitted power (T), respectively; EI and ET are the intensity of the incident (I) and emitted (T) electric field, respectively; and HI and HT are the intensity of the incident (I) and emitted (T) magnetic fields, respectively.
Shielding effectiveness can be broken down into a factor of reflection, absorption, and multiple internal reflections:
SE = SER + SEA + SEMR
where SER is the factor caused by reflection (dB), SEA is the factor caused by absorption (dB), and SEMR is the factor caused by multiple reflections.
The factor due to reflection can be described by the following equation [10]:
SER = −10 log(σT/16ωε0μr)
where σT is the total material conductivity, μr is the relative magnetic permeability, ω is the frequency, and ε0 is the electric permeability of the vacuum.
The factor caused by the absorption is described by the following equation [10]:
SEA = −8.68t(σTωμT/2)1/2
where σT is the total material conductivity, μr is the relative magnetic permeability, and ω is the frequency.
On the other hand, the factor caused by internal reflection for shells larger than the so-called skin depth can be described by the following equation [10]:
SEMR = 20 log|(1 − 10SEA/10)|
The last equation shows that, for materials with good absorbing properties, the factor caused by internal reflection from external surfaces can be neglected, which is the case in practice.
Carbonyl iron with spherical particle sizes of 3–4 μm was used in this work. This was suspended in epoxy resin, forming a paste to be applied as a varnish coating for painting masking military equipment.
In the literature on the subject [11,12,13], one can find reports detailing that the microwave permeability for systems built of dispersed ferromagnetic material (carbonyl iron) in a dielectric (epoxy resin) also depends on the size and proportion of the ferromagnetic particles and may be periodic in the frequency domain, which may result, for example, in the mutual interference of the absorber particles suspended in the binder.
Thus, modelling the attenuation values for wide frequency ranges and for two and more phase systems is quite complicated. In this paper, the authors used the radar equation and attempted to determine the relationship for the frequencies most often used in military reconnaissance; i.e., 4–18 GHz.
P R X = P T X · G T X · G R X · σ · λ 2 4 π 3 R 4
where GRX is the gain of the receiving antenna, GTX is the gain of the transmitting antenna, PRX is the signal strength of the receiving antenna, PTX is the signal strength of the transmitting antenna, λ is the wavelength, σ is the effective reflection area, and R is the distance of the object from the antenna (assuming that we are dealing with a monostatic system, where the transmitting and receiving antennas are at the same distance).
Using Equation (1) and transforming Equation (6) and treating the sample as a wave emitter, we obtained:
SE = 10   log | P I / P T | = S E = 10   l o g P I P T = 10 log 4 π 3 R 4 G T X · G R X · σ · λ 2
Assuming that the tests would be carried out in the same conditions, for samples of the same size, Equation (7) may take the form:
S E = 10   log | k / ( σ · λ 2 ) | ,
where k is a constant and σ depends on the size and geometry of the object, type of material, layer thickness, and wavelength λ. For constant sizes of the tested object and the standard one, the factor related to the geometry of the object was constant. Thus, by measuring the SE for known wavelengths λ and the thickness of the layer, one can obtain a model of dependence of the attenuation of the frequency f, the thickness d of the absorber layer, and the share of the absorber:
σ(f, d, λ) = f(SE, 10 log(λ2))
In this study, we analyzed a set of four anti-radar paint compositions based on two different resins, a chemical hardener, an improver, and two absorber contents. The paints were used for thin coatings. For each composition, four different layers with thicknesses of 0.5 mm, 1.0 mm, 1.5 mm, and 2.0 mm were made on an aluminum sheet with dimensions of 300 mm × 300 mm × 3 mm. The aims of this article were to propose, for the first time, a Gaussian model to characterize the anti-radar properties, and to perform an evaluation of mathematical model in terms of the curve factors (signal width, maximum attenuation, and frequency of the maximum attenuation) in relation to the layer composition and layer thickness. The aim of modeling was also to determine the influence and trends of the physical parameters of paints on their attenuation in the microwave range of 4–40 GHz, based on experimental values obtained for the range of 4–18 GHz.

2. Materials and Methods

Sets of pastes were prepared, differing in the content of the absorber (carbonyl iron, purchased from BASF Aktiengesellschaft, and Carbonyleisenpulver EB, marked as EB) and the binder used (epoxy resin with a chemical hardener and, if necessary, an improver, viscosity-reducing agent, and plasticizer), as shown in Table 2. It is worth noting that the sizes of the absorber particles (EB) was 3–4 μm.
For each composition, four different layers with thicknesses of 0.5 mm, 1.0 mm, 1.5 mm, and 2.0 mm were made on an aluminum sheet with dimensions of 300 mm × 300 mm × 3 mm.
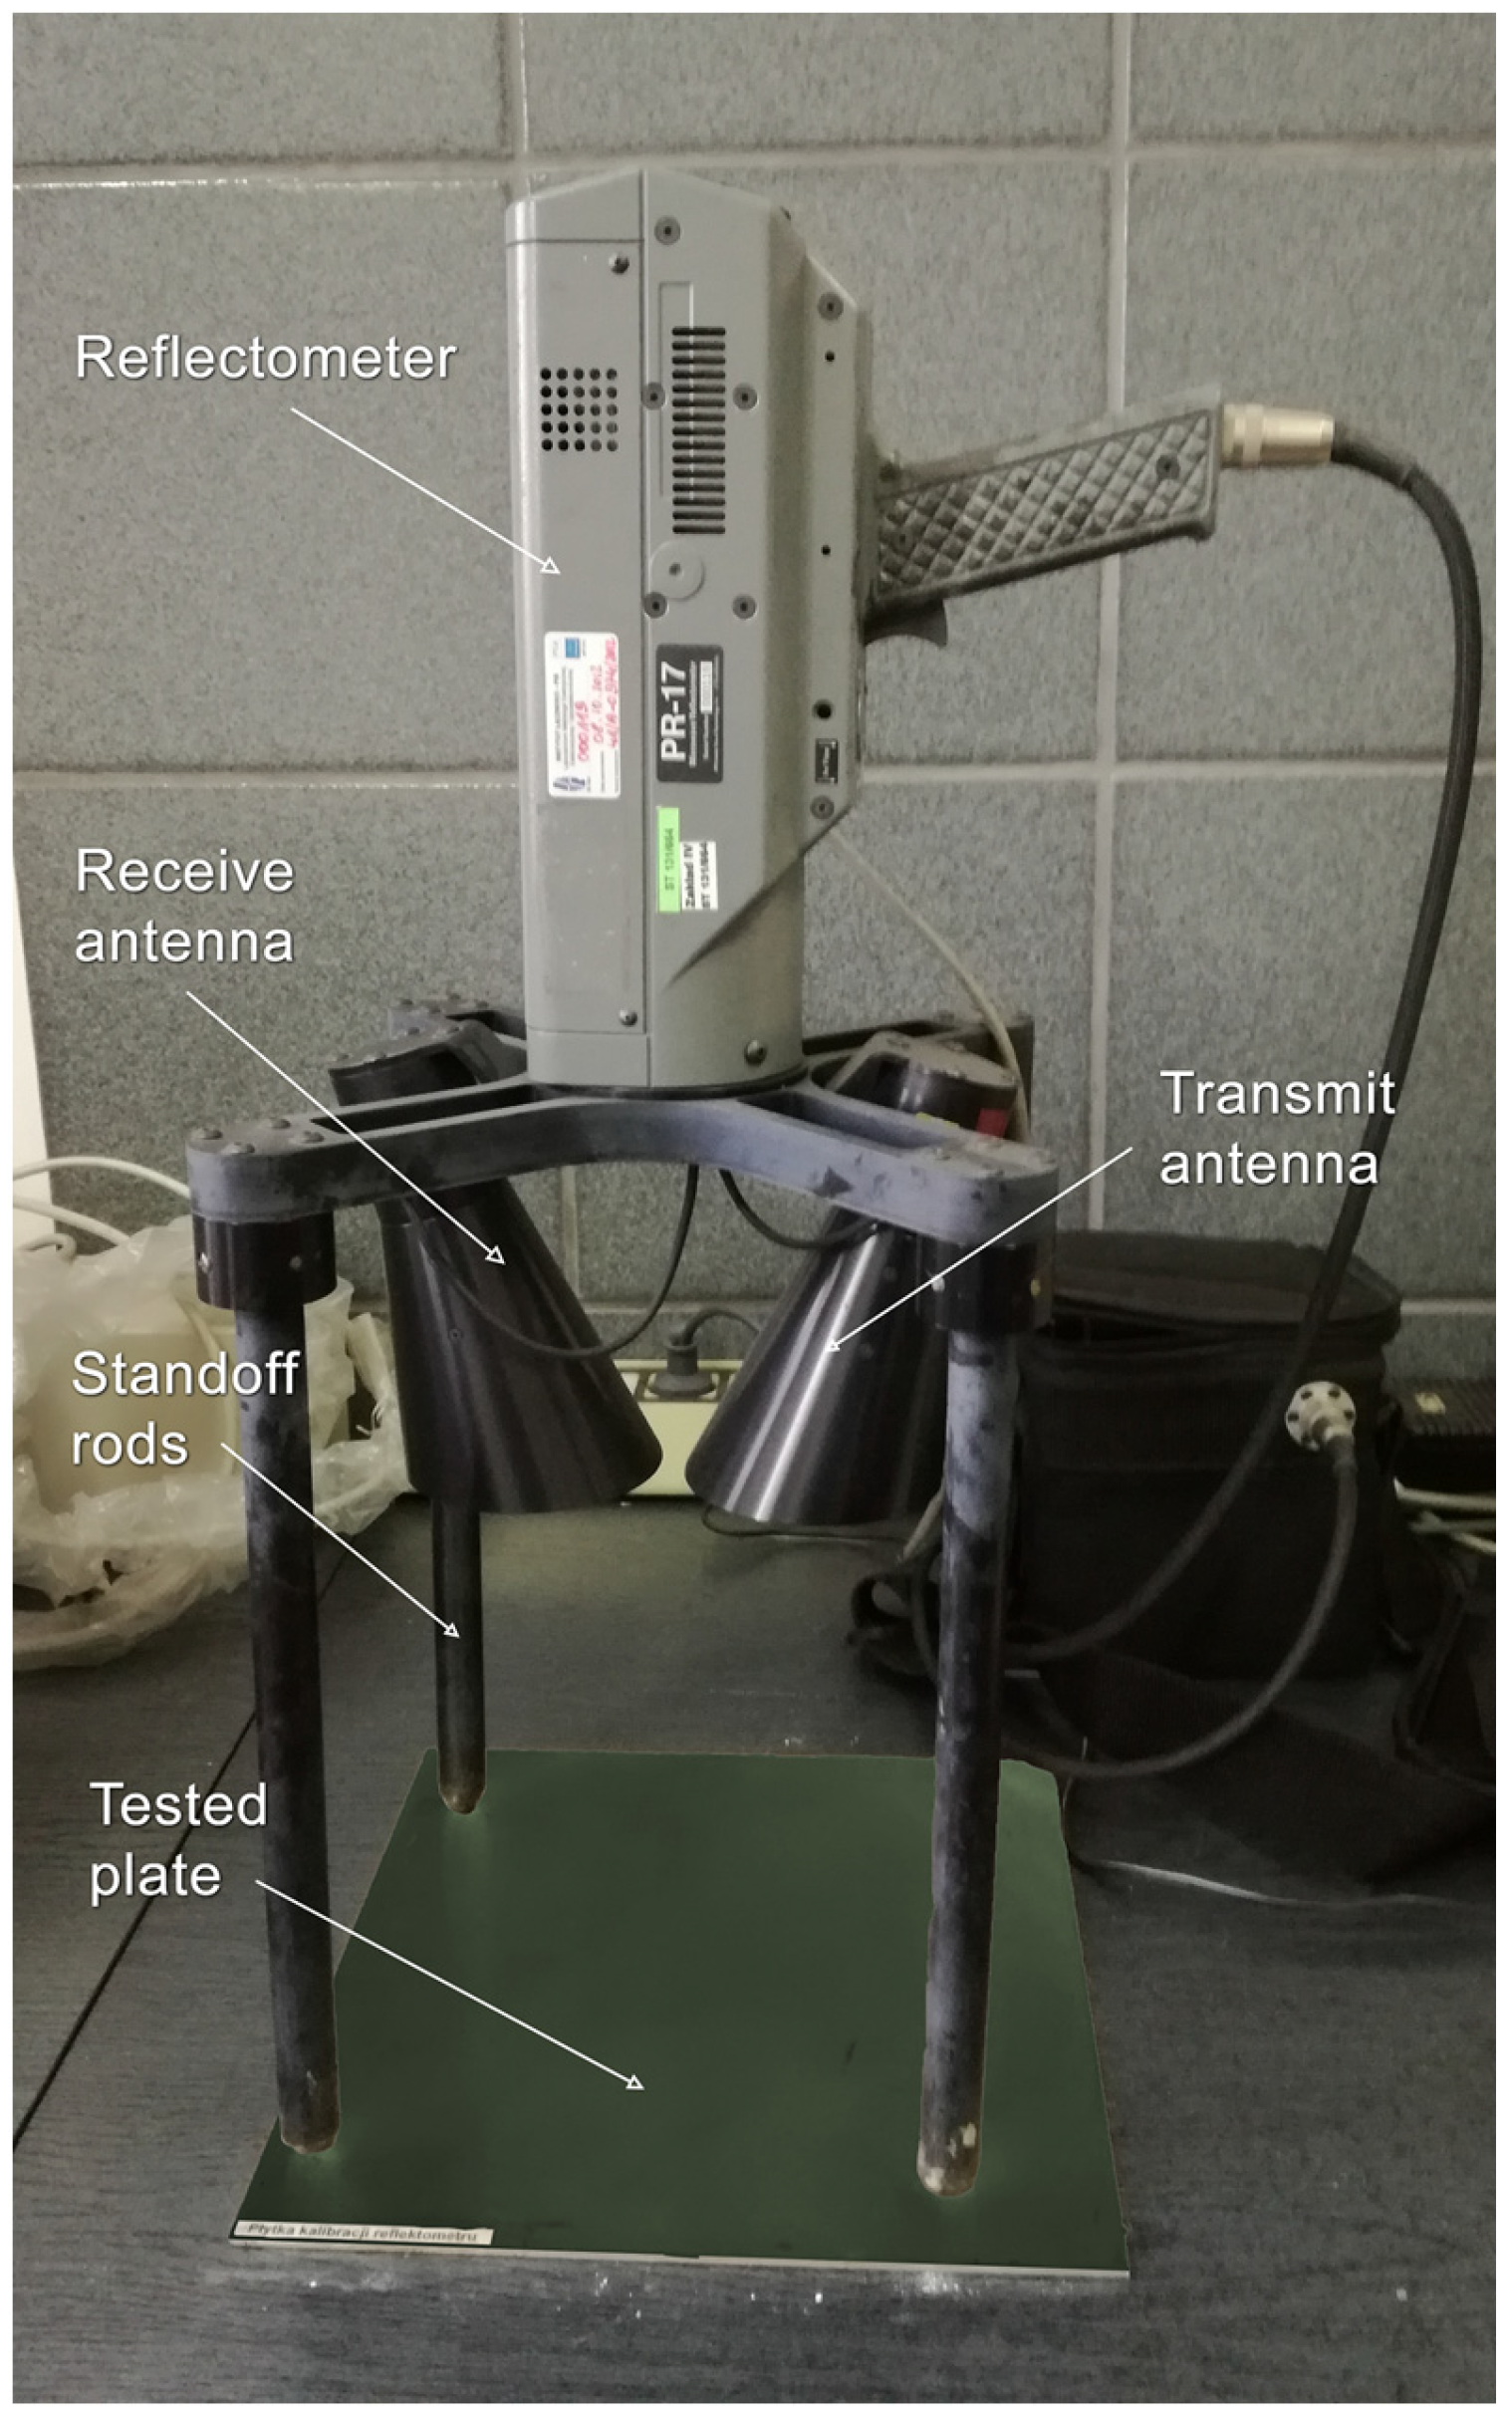
The attenuation tests were carried out on a measuring stand using a PR-17 CXKU reflectometer (Milimeter Wave Technology INC, Marietta, GA, USA) operating in a range from 4 to 18 GHz (Figure 2).
The result of the tests was the attenuation level of the samples expressed in dB and related to the reference aluminum plate without any coating. Details of the research are presented in Table 3 and [14].

3. Results and Discussion

All tested samples containing the absorber showed attenuation characteristics with one dominant maximum and were similar to the shape of the Gaussian curve.
In order to simulate the attenuation characteristics of electromagnetic radiation in the microwave range, the following assumptions were made:
  • A frequency range from 4 GHz to 40 GHz was adopted for the model attenuation calculations;
  • Based on the experimental data, one dominant damping maximum was assumed for the simulated model;
  • A damping model with Gaussian curve characteristics was adopted for each sample;
  • A simulation was made for the maximum attenuation, preceded by the minimum recorded in the range from 4 to 18 GHz;
  • Due to the location of the measurement points with maximum attenuation near the limits of the 4 GHz and 18 GHz measurement ranges for several samples, an additional approximation correction was introduced. The first point with the maximum attenuation level after the minimum was considered to be the maximum for which each subsequent point assumed an attenuation value equal to the maximum value with a tolerance of ±0.3 dB.
A script created in the Python programming language was used to calculate the mathematical model. The leastsq function from the optimize programming library belonging to the SciPy module was used. The leastsq function is an iterative function using Jacobians based on the difference between the observed objective data (measurements for x) and a defined non-linear function of the parameters f(x, coefficients), where the least squares approach is used to minimize [15].
The mathematical model was used to calculate the formula of the Gaussian curve function described by Formula (10):
f x = B + A   e x p x μ δ 2
where x is the variable frequency value; the equation coefficient B is the noise value, the baseline defining the minimum attenuation value; A is the amplitude, the highest attenuation value measured from the baseline; δ is the conventional peak width, satisfying the relation to a half-width FWHM ≈ 2.35 δ; and μ is the peak midpoint, the frequency for the maximum attenuation value.
In order to compare and normalize the indication of one universal best absorbing composition determined by the share of the absorber, the thickness of the coating, and the type of binder in the frequency range of 4–18 GHz, a statistical analysis of samples meeting the following exemplary conditions was also performed:
  • Attenuation level exceeding 12 dB;
  • Range with maximum attenuation in the range of 8–12 GHz (X band).

Mathematical Simulation

Based on the experimental data for samples of various thicknesses made with paints consisting of two binder systems based on different epoxy resins and containing 75% and 80% carbonyl iron as an absorber, all tested samples showed damping characteristics with one dominant maximum and taking the shape of a Gaussian curve.
It was also noticed that the curves in the graphs had a shape similar to Gaussian curves with different amplitudes, midpoints, and peak widths. Therefore, mathematical simulations were performed to determine the dependence of the attenuation value on the frequency for each measurement sample. This made it possible to obtain the coefficients of the Gaussian curve equation, which had their reference in the physical properties of the tested samples. It was, therefore, assumed that the model Gaussian curve was described by Equation (9).
In the first stage of the simulation, the initial values of the equation coefficients were determined, assuming B0 = 0, A0 was the value of the maximum attenuation derived from the measurements for a given sample, δ0 was the entire width of the tested range, and μ0 was the frequency for which the maximum attenuation occurred. The implemented Levenberg–Marquardt algorithm using the method of successive approximations, changing the coefficients of the equation and minimizing the value of the mismatch based on the sum of the least squares of difference between the values from the measurements and the model curve, determined the equation coefficients for the model curve.
In accordance with the assumptions, the occurrence of one damping maximum in the considered range was assumed, which was used for further analyses.
Similarly, when the measurement points with maximum attenuation occurred near the limits of the 4 GHz and 18 GHz measurement ranges, an additional approximation correction was introduced, taking as the maximum the first point with the maximum attenuation level following the minimum for which each subsequent point had an attenuation value equal to a maximum value of ±0.3 dB.
In addition, due to the adopted model, the Gaussian curve, and its symmetry, in the case of a clear maximum attenuation within the measurement range, the part of the data that corresponded with a larger number of measurement points was used for modelling.
The results of fitting the model curves to the measurement results along with the correlation coefficients are presented in Table 4.
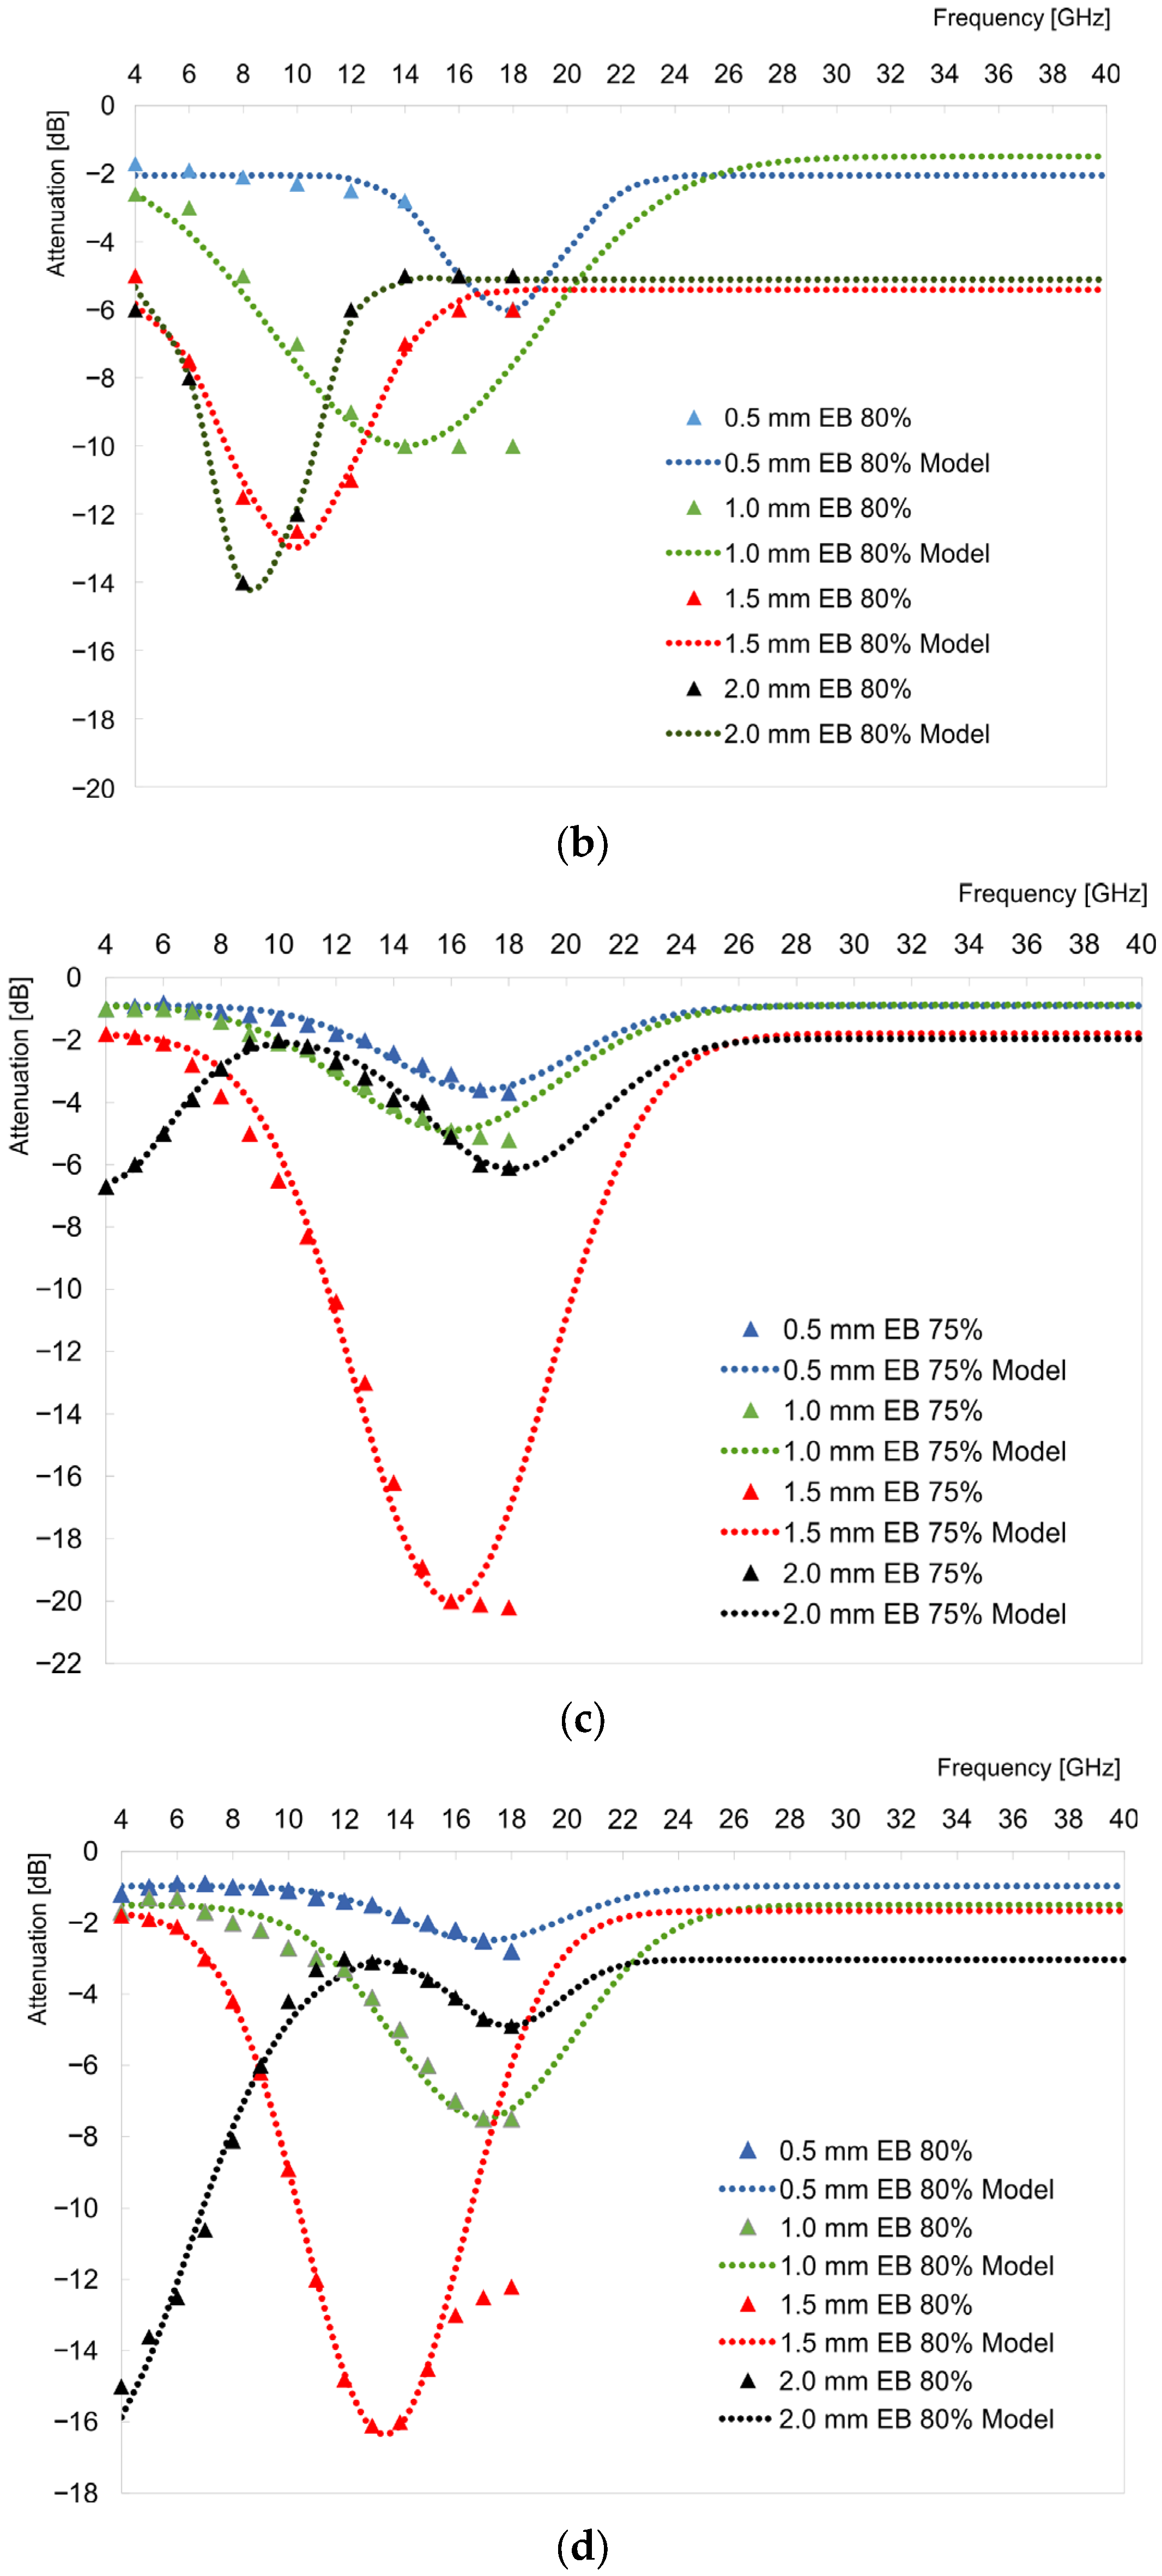
The graphs in Figure 3 show the measurement values in the 4–18 GHz range and model curves in the wider range of 4–40 GHz in order to visualize and adjust the Gaussian curve to the measurements whose maxima were within the measurement range. The extended characteristics were beyond the experimental range (Figure 3).
The samples made of both L1 and L2 resins tended to display a broad attenuation signal and only slight changes in the width of the peak depending on the thickness were noticed. All layers showed a similar trend of peak slope change, consisting of an increase in the peak slope value depending on the layer thickness; however, for the layer with the L2 resin, it reached a maximum for a thickness of 1.5 mm and then decreased.
With regard to the noise level, a tendency was observed; in the system with the L1 resin where additional components were included, i.e., plasticizers and viscosity-lowering agents, there was no clear trend in relation to the layer thickness and the corresponding noise level. On the other hand, in the case of the L2 set based on a monomer (resin) and an activating agent (curing agent), there was a relationship between the increase in the noise level and the increase in the thickness of the coating (Figure 3). Additionally, a difference in the shape of the observed curves was noticed; in the case of the 2 mm thick layer and the L2 resin only, two signals were noticed instead of one, similar to the layers below 2 mm thick and the L1 resin systems. This might have been related to the uneven distribution of the absorber in the layer. The system behaved as if it contained an additional layer of a spacer or an absorber of a poorer section. A similar behavior was observed by Yuping et al. [16] for a system containing polyurethane–carbonyl iron particles (PU-CIP)/polyvinyl chloride(PVC)/aluminum. It was observed that there was one sharp and one broad signal, approximately located at frequencies 2–4 GHz and 8–16 GHz, respectively. The authors also noticed that the reflection losses were similar for both variations with a fixed thickness of PVC or PU-CIP.
The layers showed a similar tendency to change the maximum attenuation value, consisting of an increase in the attenuation level with an increase in the layer thickness. This tendency was visible in the case of the layers containing 80% absorber in the coating composition (Figure 3b,c). In the case of 75% absorber content, the tendency was not so clear (Figure 3a,d). In the case of the L1 resin with 75% absorber, the result for the 1.5 mm thickness did not fit the expected trend, showing slightly lower values of attenuation in relation to the 1 mm sample.
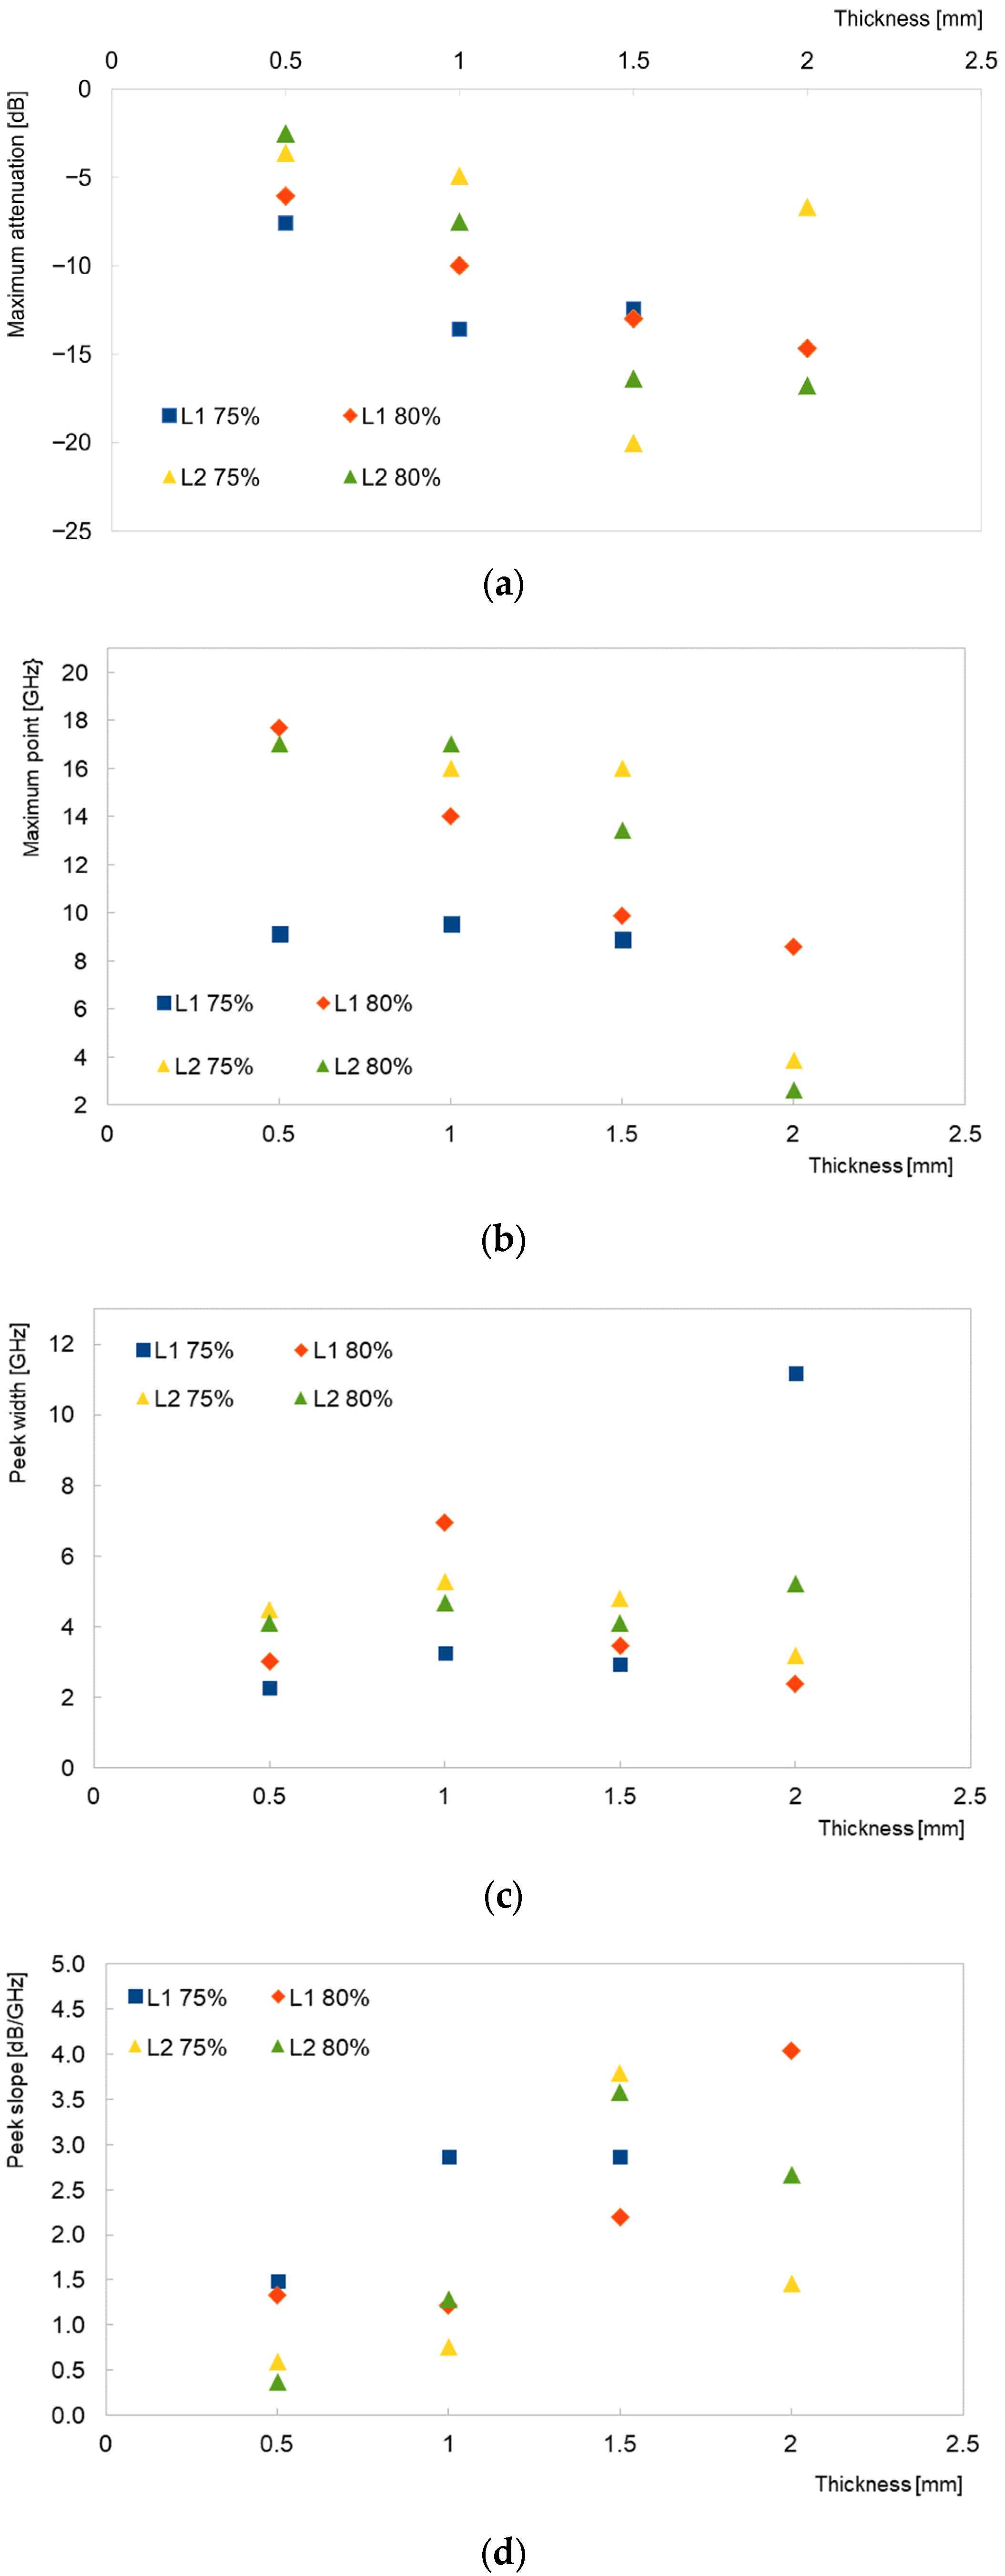
The visualized trends of changes in the coating parameters according to the model curves are shown in Figure 4. As anticipated, the increment in the thickness of the coating resulted in an increment of the attenuation of the initial signal (Figure 4a). From the microwave absorption theory, it is known that when the electromagnetic wave strikes a material, the incident power can be divided into reflection, absorption, and transmission. The reflection occurs on the surface of the conductive layer, generating multiple internal reflections. In the case of absorbing materials, the energy can be absorbed by the absorber or can bypass the external coating, reaching the lower surface and causing multiple internal reflections [17]. Our understanding was that the high content of carbonyl iron as an absorber resulted in a good transmission of the signal into the layer, which was absorbed via conductivity and magnetic dipoles dispersed in the resin matrix, as described in the literature [2].
When the position of the maximum was evaluated in the case of the L1 and L2 resins and 75% load only, the signal remained centered around 10 GHz and 16 GHz, respectively, for the layer thicknesses in the range of 0.5 to 1.5 mm. For the 2 mm thick layer, the expected maximal signal was located below 4 GHz and was not simulated. The difference in the layer thicker than 1.5 mm might suggest that for 2 mm layers, the arrangement of the carbonyl iron load in the resin matrix could form a few aggregates; hence, there was a step change in the position of the maximum of the reflection loss.
In Figure 4c, the relationship between the width of the peak at the half-height is present. It could be observed that, for most of the samples, this parameter did not significantly change with the thickness of the layer. The same result was observed in the literature; however, no comments were given on the subject [16].

4. Conclusions

In conclusion, the radar-absorbing properties of composite coatings based on a carbonyl iron-coated Al sheet were studied in the 2–18 GHz range. To simulate the reflection losses, a Gaussian mathematical model was employed to simulate the absorption characteristics of the material in wider frequency spectra of up to 40 GHz. The obtained mathematical model fitted very well with the experimental results, reaching R2 values between 0.891 and 0.998. The simulated curves allowed a more accurate comparison of the obtained experimental results.
The analysis of the simulated signals confirmed the typical spectral characteristics of reflection losses typical for carbonyl iron observed in the literature. Moreover, the correlation between the thickness of the layer for two resin systems and two different payloads of absorbers showed that the attenuation value increased with the increasing layer thickness, slightly shifting the maximum peak towards longer wavelengths. Furthermore, peak parameters such as the width at the half-height were maintained at the same level, increasing with the level thickness peak slope.
All the above-mentioned findings confirmed the validity of Gaussian curve modelling for carbonyl iron-based systems with high accuracy.

Author Contributions

Conceptualization, W.P. and K.A.B.; methodology, W.P.; software, W.P.; investigation, R.M. and A.K.; writing—original draft preparation, W.P.; writing—review and editing, K.A.B. All authors have read and agreed to the published version of the manuscript.

Funding

This research received no external funding.

Institutional Review Board Statement

Not applicable.

Informed Consent Statement

Not applicable.

Data Availability Statement

The original data are stored at the Military Institute of Engineer Technology and are available upon request.

Conflicts of Interest

The authors declare no conflict of interest.

References

  1. Wu, Y.; Tan, S.; Zhao, Y.; Liang, L.; Zhou, M.; Ji, G. Broadband multispectral compatible absorbers for radar, infrared and visible stealth application. Prog. Mater. Sci. 2023, 135, 101088. [Google Scholar] [CrossRef]
  2. Sista, K.S.; Dwarapudi, S.; Kumar, D.; Sinha, G.R.; Moon, A.P. Carbonyl iron powders as absorption material for microwave interference shielding: A review. J. Alloy. Compd. 2021, 853, 157251. [Google Scholar] [CrossRef]
  3. Luo, X.; Chung, D.D.L. Electromagnetic interference shielding reaching 130 dB using flexible graphite. Carbon 1996, 34, 1293–1294. [Google Scholar] [CrossRef]
  4. Deng, L.; Zhang, J.; Shu, R. Fabrication of three-dimensional nitrogen-doped reduced graphene oxide/tin oxide composite aerogels as high-performance electromagnetic wave absorbers. J. Colloid Interface Sci. 2021, 602, 282–290. [Google Scholar] [CrossRef] [PubMed]
  5. Shu, X.; Yan, S.; Fang, B.; Song, Y.; Zhao, Z. A 3D multifunctional nitrogen-doped RGO-based aerogel with silver nanowires assisted self-supporting networks for enhanced electromagnetic wave absorption. Chem. Eng. J. 2023, 451, 138825. [Google Scholar] [CrossRef]
  6. Huang, L.; Liu, X.; Yu, R. Enhanced microwave absorption properties of rod-shaped Fe2O3/Fe3O4/MWCNTs composites. Prog. Nat. Sci. Mater. Int. 2018, 28, 288–295. [Google Scholar] [CrossRef]
  7. Zhou, Y.; Xie, H.; Zhou, W.; Ren, Z. Enhanced antioxidation and microwave absorbing properties of SiO 2 -coated flaky carbonyl iron particles. J. Magn. Magn. Mater. 2018, 446, 143–149. [Google Scholar] [CrossRef]
  8. Xia, Y.; Fang, J.; Li, P.; Zhang, B.; Yao, H.; Chen, J.; Ding, J.; Ouyang, J. Solution-processed highly superparamagnetic and conductive PEDOT:PSS/Fe3O4 nanocomposite films with high transparency and high mechanical flexibility. ACS Appl. Mater. Interfaces 2017, 9, 19001–19010. [Google Scholar] [CrossRef]
  9. Sankaran, S.; Deshmukh, K.; Ahamed, M.B.; Khadheer Pasha, S.K. Recent advances in electromagnetic interference shielding properties of metal and carbon filler reinforced flexible polymer composites: A review. Compos. Part A Appl. Sci. Manuf. 2018, 114, 49–71. [Google Scholar] [CrossRef]
  10. Pawar, S.P.; Biswas, S.; Kar, G.P.; Bose, S. High frequency millimetre wave absorbers derived from polymeric nanocomposites. Polymer 2016, 84, 398–419. [Google Scholar] [CrossRef]
  11. Ibrahim, I.R.; Matori, K.A.; Ismail, I.; Awang, Z.; Rusly, S.N.A.; Nazlan, R.; Idris, F.M.; Zulkimi, M.M.M.; Abdullah, N.H.; Mustaffa, M.S.; et al. A Study on Microwave Absorption Properties of Carbon Black and Ni0.6Zn0.4Fe2O4 Nanocomposites by Tuning the Matching-Absorbing Layer Structures. Sci. Rep. 2020, 10, 3135. [Google Scholar] [CrossRef] [PubMed] [Green Version]
  12. Raad, S.H.; Atlasbaf, Z.; Zapata, C.J. Broadband absorption using all-graphene grating-coupled nanoparticles on a reflector. Sci. Rep. 2020, 10, 19060. [Google Scholar] [CrossRef] [PubMed]
  13. Adenot-Engelvin, A.L.; Dudek, C.; Toneguzzo, P.; Acher, O. Microwave properties of ferromagnetic composites and metamaterials. J. Eur. Ceram. Soc. 2007, 27, 1029–1033. [Google Scholar] [CrossRef]
  14. Przybył, W.; Januszko, A.; Radek, N.; Szczepaniak, M.; Bogdanowicz, K.A.; Plebankiewicz, I.; Szczodrowska, B.; Mazurczuk, R. Microwave absorption properties of carbonyl iron-based paint coatings for military applications. Def. Technol. 2022. [Google Scholar] [CrossRef]
  15. More, J.J. The Levenberg-Marquardt Algorithm: Implementation and Theory. In Numerical Analysis; Watson, G.A., Ed.; Lecture Notes in Mathematics 630; Springer: Berlin/Heidelberg, Germany, 1977; pp. 105–116. [Google Scholar]
  16. Yuping, D.; Guangli, W.; Shuchao, G.; Shuqing, L.; Guojia, M. Study on microwave absorbing properties of carbonyl–iron composite coating based on PVC and Al sheet. Appl. Surf. Sci. 2012, 258, 5746–5752. [Google Scholar] [CrossRef]
  17. Elmahaishi, M.F.; Azis, R.S.; Ismail, I.; Muhammad, F.D. A review on electromagnetic microwave absorption properties: Their materials and performance. J. Mater. Res. Technol. 2022, 20, 2188–2220. [Google Scholar] [CrossRef]
Figure 1. Scheme of the spectrum of electromagnetic radiation.
Materials 16 03050 g001
Figure 2. Scheme of the testing setup.
Materials 16 03050 g002
Figure 3. Visualization of results from measurements and modeling for resin L1 and 75% absorber content (a), resin L1 and 80% absorber content (b), resin L2 and 75% absorber content (c), and resin L1 and 80% absorber content (d).
Materials 16 03050 g003aMaterials 16 03050 g003b
Figure 4. Relationship of layer thickness vs. selected factors: maximum attenuation (a); frequency of maximum of attenuation (b); signal width (c); and curve slope (d).
Materials 16 03050 g004
Table 1. Frequency division into bands [2].
Band NameFrequency (GHz)Wavelength (cm)Band Symbol
VHF0.1–0.3300–100A
UHF0.3–0.5100–60B
0.5–1.060–30C
L1–230–15D
S2–315–10E
3–410–7.5F
C4–67.5–5G
6–85–3.75H
X8–103.75–3I
10–123–2.5J
Ku12–182.5–1.67J
K18–26.51.67–1.1J (to 20 GHz)
Ka26.5–401.1–0.75K
Millimeter waves40–1000.75–0.3L (to 60 GHz)
M (>60 GHz)
Table 2. List of paint compositions.
No.ResinChemical
Hardener
Viscosity-Reducing Agent/
Plasticizer
Absorber Content
1Shell Epikote 828 (L1)Ancamine 1618AX-R/AX-S75%
2Shell Epikote 828 (L1)Ancamine 1618AX-R/AX-S80%
3Epidian 112 (L2)Saduramid 10/50—/—75%
4Epidian 112 (L2)Saduramid 10/50—/—80%
Table 3. Comprehensive list of attenuation values (dB).
Frequency
(GHz)
Absorber Content 75%Absorber Content 80%Resin
0.5 mm1.0 mm1.5 mm2.0 mm0.5 mm1.0 mm1.5 mm2.0 mm
4−4.5−5−4.5−18−1.7−2.6−5−6L1
6−4.5−7−7−12.5−1.9−3−7.5−8L1
8−7−12−12−9−2.1−5−11.5−14L1
10−7−13−11−7−2.3−7−12.5−12L1
12−5−10−7−5−2.5−9−11−6L1
14−4.5−5−4.5−4−2.8−10−7−5L1
16−4−4.5−4−4−5−10−6−5L1
18−4−4.5−4−4−6−10−6−5L1
4−1−1−1.8−6.7−1.2−1.7−1.8−15L2
5−0.9−1−1.9−6−1−1.3−1.9−13.6L2
6−0.8−1−2.1−5−0.9−1.3−2.1−12.5L2
7−1−1.1−2.8−3.9−0.9−1.7−3−10.6L2
8−1.1−1.4−3.8−2.9−1−2−4.2−8.1L2
9−1.2−1.8−5−2.1−1−2.2−6.2−6L2
10−1.3−2.1−6.5−2−1.1−2.7−8.9−4.2L2
11−1.5−2.3−8.3−2.2−1.3−3−12−3.3L2
12−1.8−2.9−10.4−2.7−1.4−3.3−14.8−3L2
13−2−3.5−13−3.2−1.5−4.1−16.1−3.1L2
14−2.4−4.1−16.2−3.9−1.8−5−16−3.2L2
15−2.8−4.5−18.9−4−2−6−14.5−3.6L2
16−3.1−4.9−20−5.1−2.2−7−13−4.1L2
17−3.6−5.1−20.1−6−2.5−7.5−12.5−4.7L2
18−3.7−5.2−20.2−6.1−2.8−7.5−12.2−4.9L2
Table 4. Results of fitting the model curve (Gaussian) to the measurement results.
ResinAbsorber Content (%)Thickness (mm)Noise
B
(dB)
Amplitude
A
(dB)
Maximum Value
B + A
(dB)
Width
Δ
(GHz)
Max. Frequency
μ
(GHz)
Slope
A/δ
(dB/GHz)
R2 Value
L1750.5−4.21−3.38−7.592.279.101.490.970
L1751−4.30−9.28−13.583.249.512.860.988
L1751.5−4.01−8.42−12.442.948.882.870.996
L1752−3.62−59.77−63.3911.18−9.365.350.998
L1800.5−2.06−3.99−6.053.0017.701.330.980
L1801−1.50−8.50−10.006.9514.001.220.901
L1801.5−5.42−7.58−12.993.469.892.190.971
L1802−5.11−9.56−14.672.378.594.030.993
L2750.5−0.89−2.71−3.604.5017.000.600.973
L2751−0.87−4.03−4.905.2916.000.760.967
L2751.5−1.80−18.20−20.004.8016.003.790.981
L2752−1.97−4.68−6.653.193.881.470.985
−1.95−4.19−6.144.1418.111.470.985
L2800.5−0.98−1.52−2.504.1017.000.370.939
L2801−1.50−6.00−7.504.6717.001.290.983
L2801.5−1.67−14.70−16.364.1113.453.570.891
L2802−2.87−13.90−16.775.222.652.660.989
2−3.03−1.87−4.912.6117.922.660.989
Disclaimer/Publisher’s Note: The statements, opinions and data contained in all publications are solely those of the individual author(s) and contributor(s) and not of MDPI and/or the editor(s). MDPI and/or the editor(s) disclaim responsibility for any injury to people or property resulting from any ideas, methods, instructions or products referred to in the content.