
Bismuth−Antimony Alloy Embedded in Carbon Matrix for Ultra-Stable Sodium Storage


Abstract
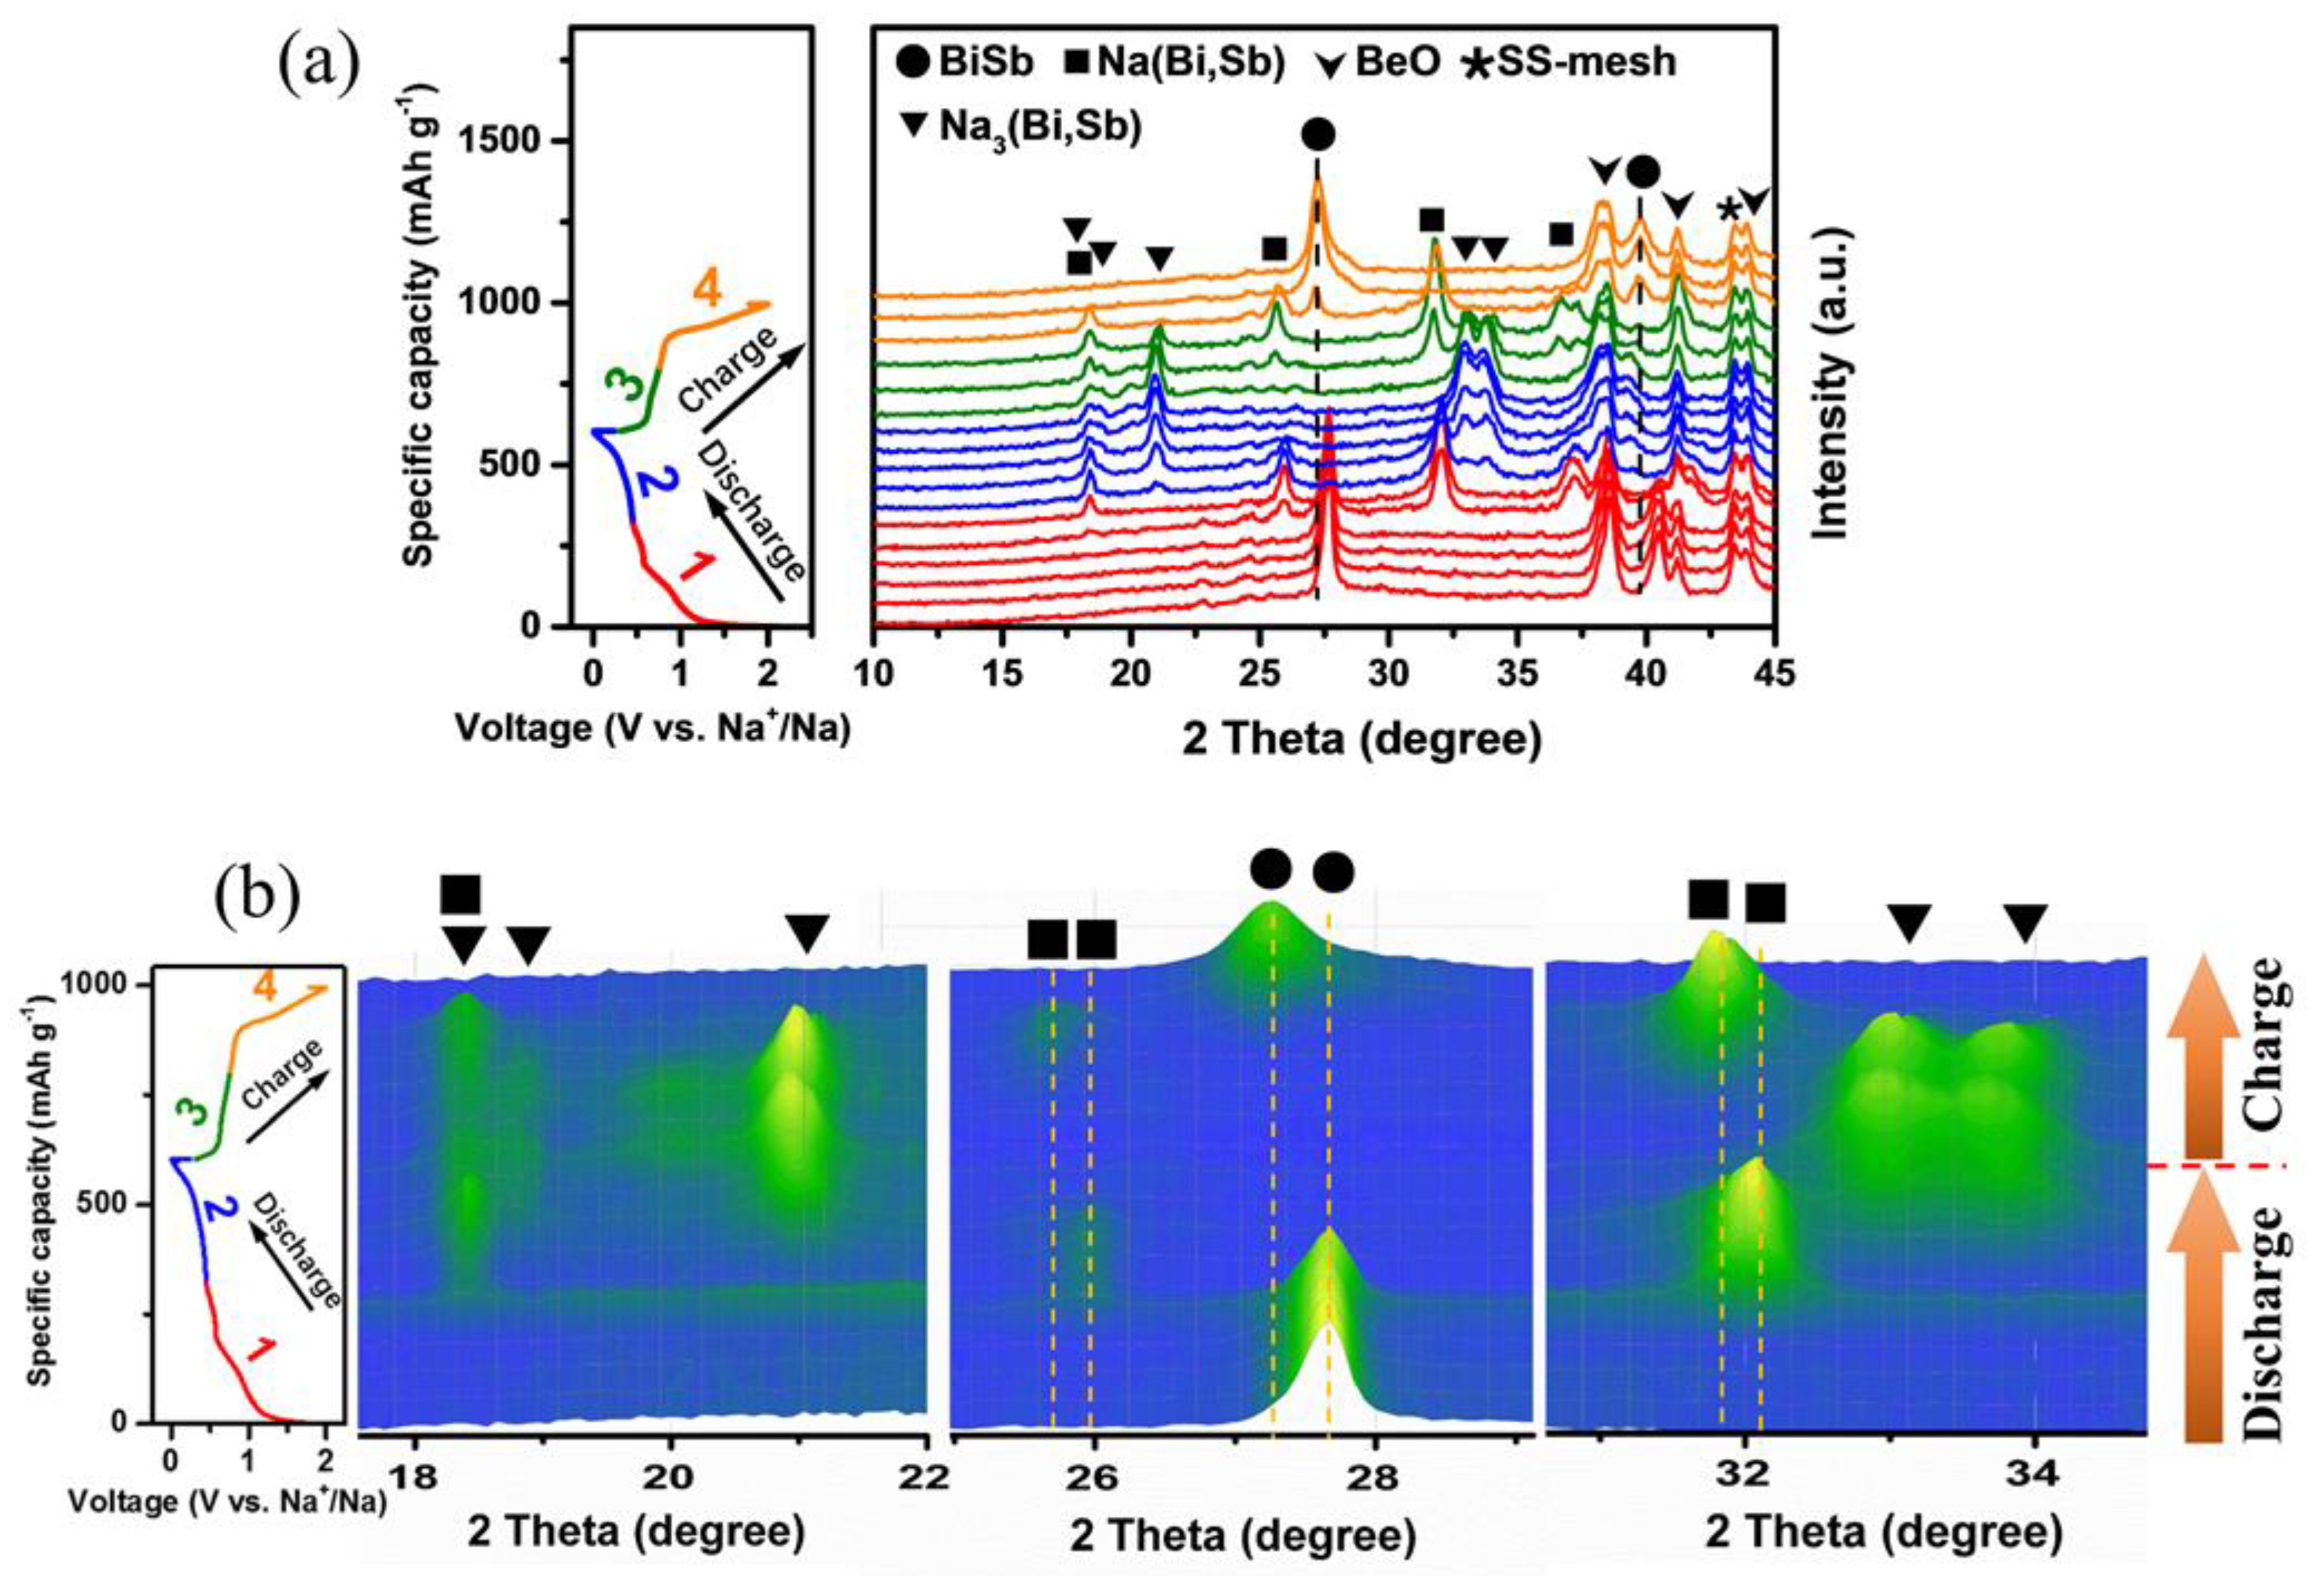
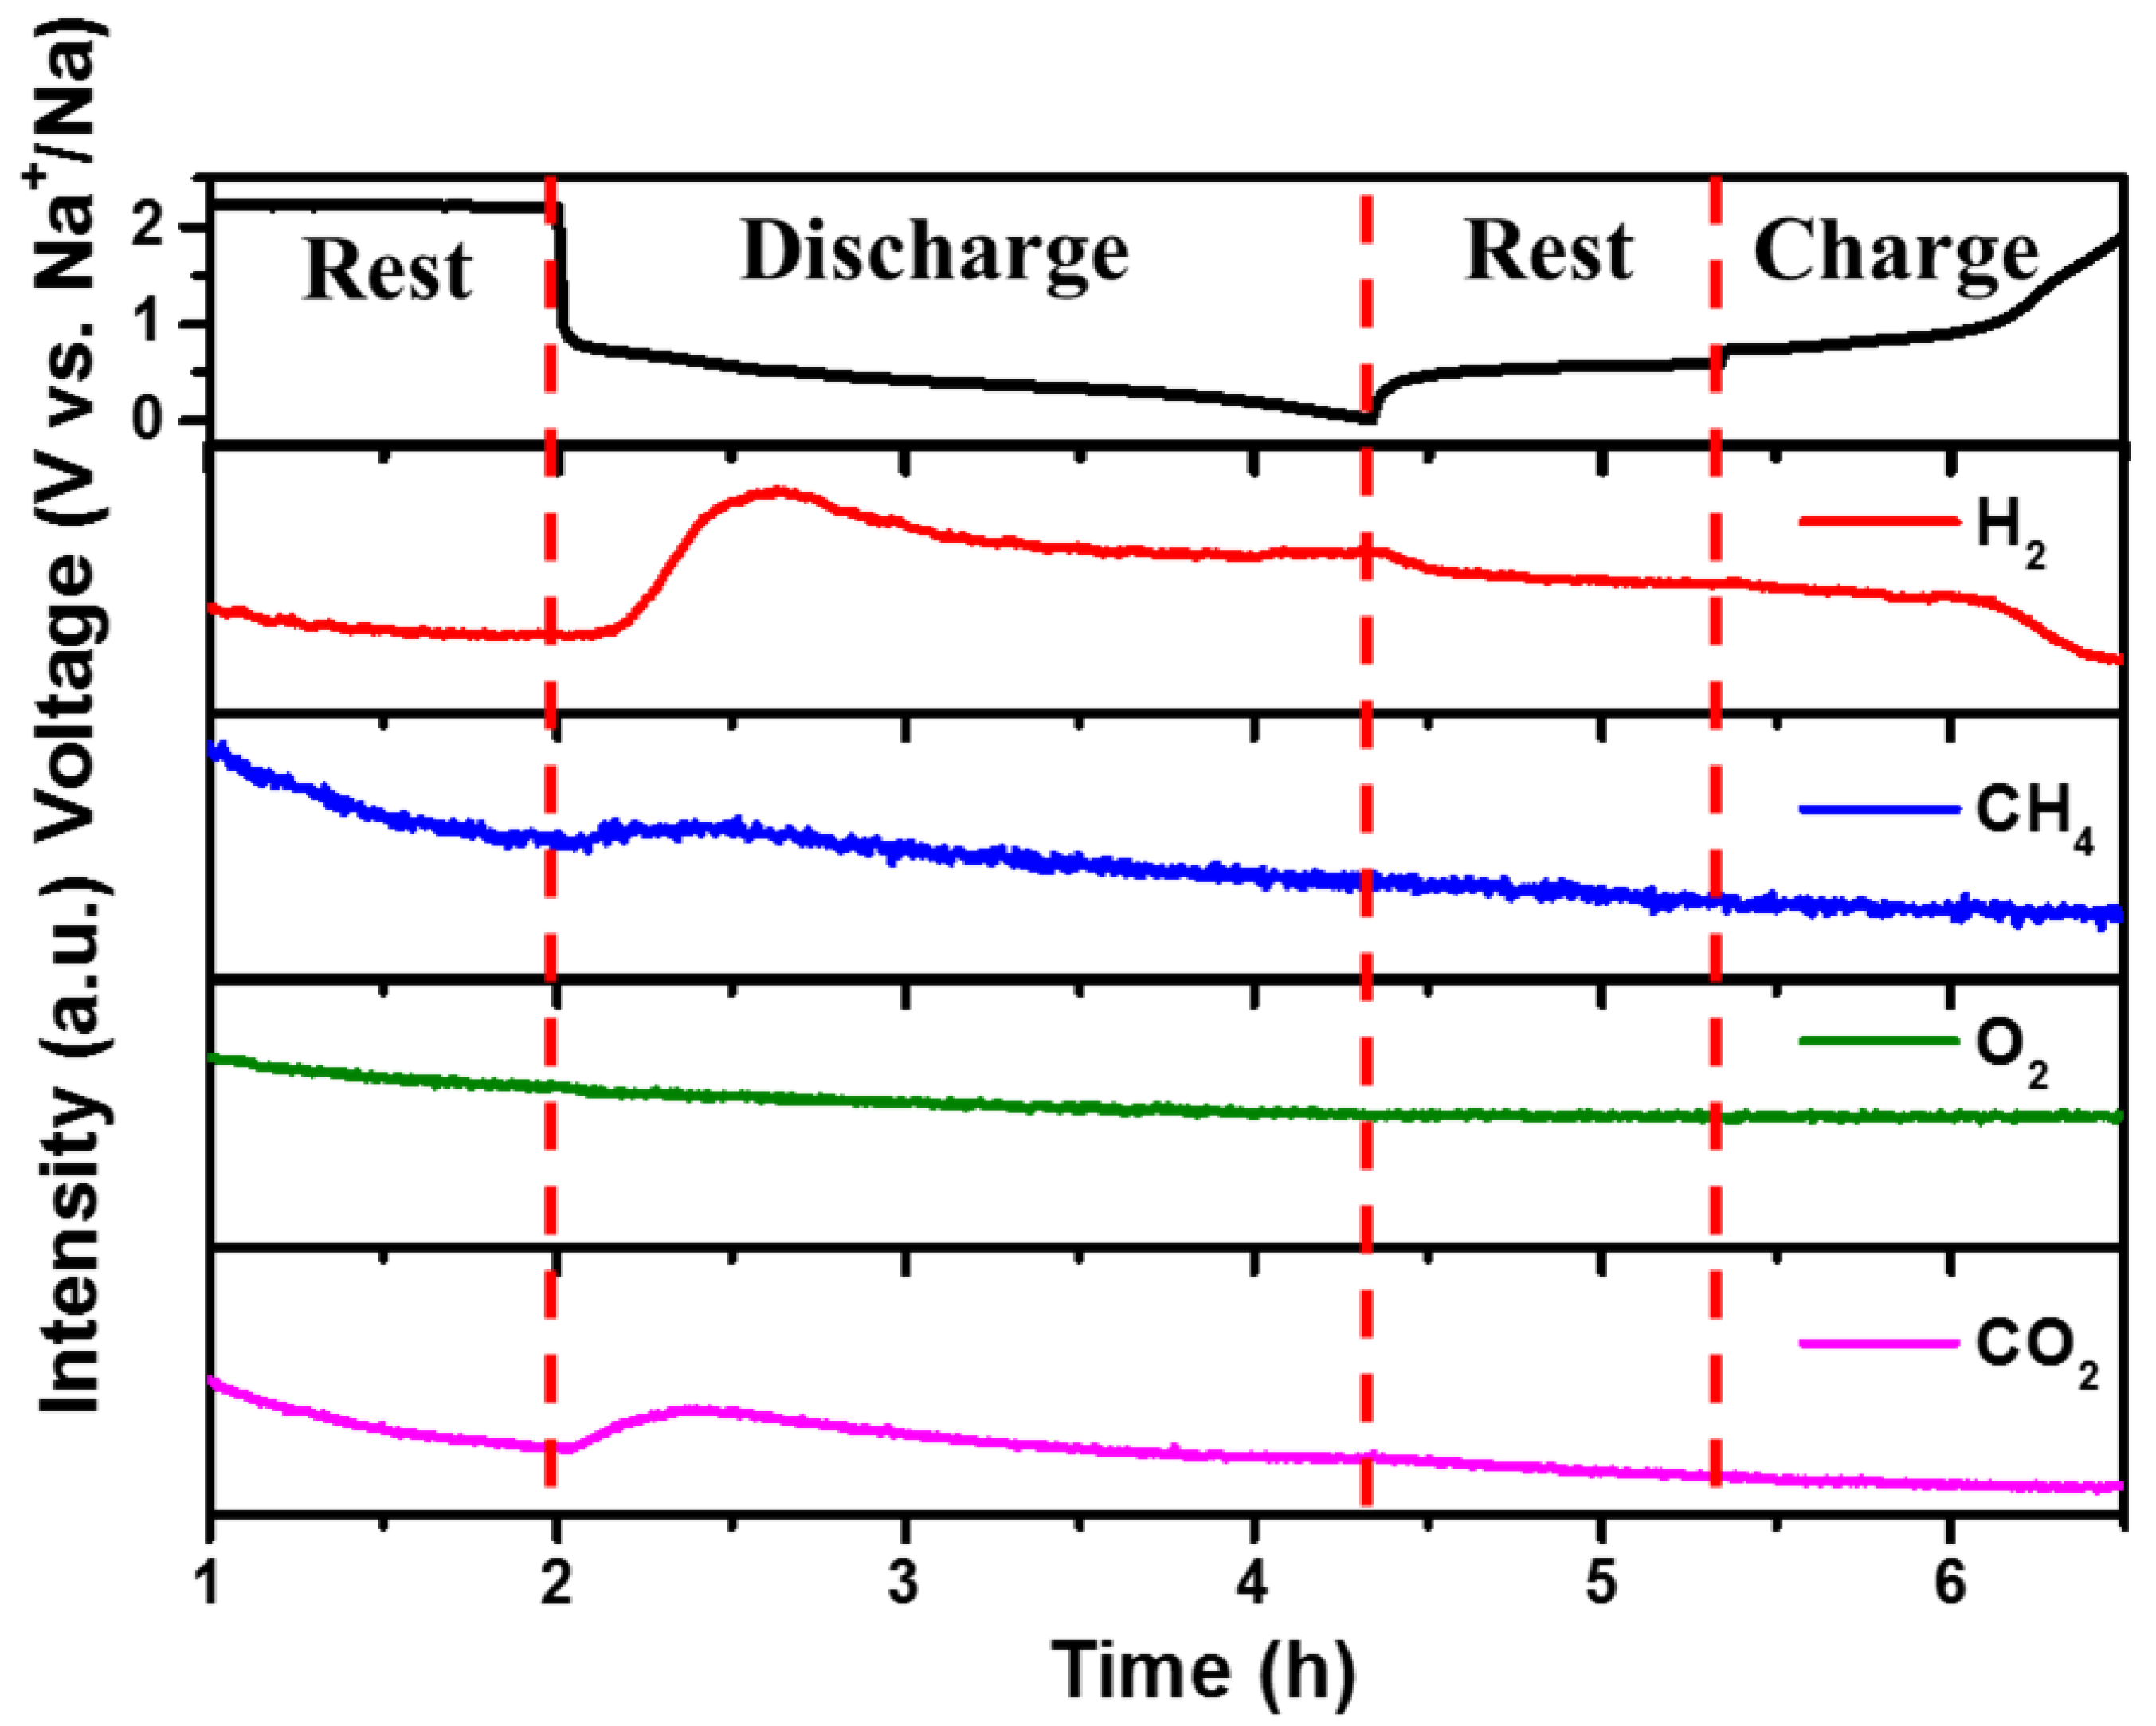
 Na(Bi,Sb) Na3(Bi,Sb). Furthermore, online electrochemical mass spectrometry unveils the evolution of gas products of the Bi1Sb1@C electrode during the cell operation.
1. Introduction
2. Experimental Section
2.1. Materials Synthesis
2.2. Materials Characterization
2.3. Electrochemical Measurement
3. Results and Discussion
4. Conclusions
Supplementary Materials
Author Contributions
Funding
Institutional Review Board Statement
Informed Consent Statement
Data Availability Statement
Conflicts of Interest
References
- Slater, M.D.; Kim, D.; Lee, E.; Johnson, C.S. Sodium-Ion Batteries. Adv. Funct. Mater. 2013, 23, 947–958. [Google Scholar] [CrossRef]
- Lao, M.; Zhang, Y.; Luo, W.; Yan, Q.; Sun, W.; Dou, S.X. Alloy-Based Anode Materials toward Advanced Sodium-Ion Batteries. Adv. Mater. 2017, 29, 1700622. [Google Scholar] [CrossRef] [PubMed]
- Tan, H.; Chen, D.; Rui, X.; Yu, Y. Peering into Alloy Anodes for Sodium-Ion Batteries: Current Trends, Challenges, and Opportunities. Adv. Funct. Mater. 2019, 29, 1808745. [Google Scholar] [CrossRef]
- Sengodu, P.; Li, C.H.; Wei, C.F.; Bendi, R.; Chen, C.C. Morphology Controlled Synthesis of SnS2-Based Nanoflowers, and Nanoplates and Their Comparative Na Storage Properties. ChemistrySelect 2016, 1, 3328–3334. [Google Scholar] [CrossRef]
- Ni, J.; Li, X.; Sun, M.; Yuan, Y.; Liu, T.; Li, L.; Lu, J. Durian-Inspired Design of Bismuth-Antimony Alloy Arrays for Robust Sodium Storage. ACS Nano 2020, 14, 9117–9124. [Google Scholar] [CrossRef]
- Liu, Y.; Zhou, B.; Liu, S.; Ma, Q.; Zhang, W.H. Galvanic Replacement Synthesis of Highly Uniform Sb Nanotubes: Reaction Mechanism and Enhanced Sodium Storage Performance. ACS Nano 2019, 13, 5885–5892. [Google Scholar] [CrossRef]
- Ou, X.; Yang, C.; Xiong, X.; Zheng, F.; Pan, Q.; Jin, C.; Liu, M.; Huang, K. A New rGO-Overcoated Sb2Se3 Nanorods Anode for Na+ Battery: In Situ X-Ray Diffraction Study on a Live Sodiation/Desodiation Process. Adv. Funct. Mater. 2017, 27, 1606242. [Google Scholar] [CrossRef]
- Xiong, P.; Bai, P.; Li, A.; Li, B.; Cheng, M.; Chen, Y.; Huang, S.; Jiang, Q.; Bu, X.H.; Xu, Y. Bismuth Nanoparticle@Carbon Composite Anodes for Ultralong Cycle Life and High-Rate Sodium-Ion Batteries. Adv. Mater. 2019, 31, 1904771. [Google Scholar] [CrossRef]
- Zhang, M.; Li, Q.; Nong, Y.; Pan, Q.; Hu, S.; Zheng, F.; Huang, Y.; Wang, H.; Li, Q. Dual Carbon Enables Highly Reversible Alloying/Dealloying Behavior of Ultra-Small Bi Nanoparticles for Ultra-Stable Li Storage. Electrochim. Acta 2022, 436, 141405. [Google Scholar] [CrossRef]
- Yang, K.; Tang, J.; Liu, Y.; Kong, M.; Zhou, B.; Shang, Y.; Zhang, W.H. Controllable Synthesis of Peapod-Like Sb@C and Corn-Like C@Sb Nanotubes for Sodium Storage. ACS Nano 2020, 14, 5728–5737. [Google Scholar] [CrossRef]
- Park, J.-S.; Kang, Y.C. Uniquely Structured Sb Nanoparticle-Embedded Carbon/Reduced Graphene Oxide Composite Shell with Empty Voids for High Performance Sodium-Ion Storage. Chem. Eng. J. 2019, 373, 227–237. [Google Scholar] [CrossRef]
- Wang, D.; Ma, Q.; Tian, K.; Wang, Z.; Sun, H.; Liu, Y. Nanosized CoSb Alloy Confined in Honeycomb Carbon Framework toward High-Property Potassium-Ion and Sodium-Ion Batteries. Energy Technol. 2021, 9, 2100095. [Google Scholar] [CrossRef]
- Jing, W.T.; Yang, C.C.; Jiang, Q. Recent Progress on Metallic Sn- and Sb-Based Anodes for Sodium-Ion Batteries. J. Mater. Chem. A 2020, 8, 2913–2933. [Google Scholar] [CrossRef]
- Wang, X.; Feng, B.; Huang, L.; Fu, Q.; Li, W.; Zhu, C.; Chen, P.; Yang, C.; Ding, Y.-L. Superior Electrochemical Performance of Sb–Bi Alloy for Sodium Storage: Understanding from Alloying Element Effects and New Cause of Capacity Attenuation. J. Power Sources 2022, 520, 230826. [Google Scholar] [CrossRef]
- Ud Din, M.A.; Li, C.; Zhang, L.; Han, C.; Li, B. Recent Progress and Challenges on the Bismuth-Based Anode for Sodium-Ion Batteries and Potassium-Ion Batteries. Mater. Today Phys. 2021, 21, 100486. [Google Scholar] [CrossRef]
- Guo, S.; Li, H.; Lu, Y.; Liu, Z.; Hu, X. Lattice Softening Enables Highly Reversible Sodium Storage in Anti-Pulverization Bi–Sb Alloy/Carbon Nanofibers. Energy Storage Mater. 2020, 27, 270–278. [Google Scholar] [CrossRef]
- Xiong, P.; Wu, J.; Zhou, M.; Xu, Y. Bismuth-Antimony Alloy Nanoparticle@Porous Carbon Nanosheet Composite Anode for High-Performance Potassium-Ion Batteries. ACS Nano 2020, 14, 1018–1026. [Google Scholar] [CrossRef]
- Yang, H.; Chen, L.W.; He, F.; Zhang, J.; Feng, Y.; Zhao, L.; Wang, B.; He, L.; Zhang, Q.; Yu, Y. Optimizing the Void Size of Yolk-Shell Bi@Void@C Nanospheres for High-Power-Density Sodium-Ion Batteries. Nano Lett. 2020, 20, 758–767. [Google Scholar] [CrossRef]
- Streletskiy, O.; Perevedentseva, E.; Zavidovskiy, I.; Karmenyan, A.; Sychev, V.; Sadykova, V.; Kuvarina, A.; Cheng, C.-L. Amorphous Carbon Films with Embedded Well-Dispersed Nanodiamonds: Plasmon-Enhanced Analysis and Possible Antimicrobial Applications. Magnetochemistry 2022, 8, 171. [Google Scholar] [CrossRef]
- Yang, L.; Hong, W.; Tian, Y.; Zou, G.; Hou, H.; Sun, W.; Ji, X. Heteroatom-Doped Carbon Inlaid with Sb2X3 (X = S, Se) Nanodots for High-Performance Potassium-Ion Batteries. Chem. Eng. J. 2020, 385, 123838. [Google Scholar] [CrossRef]
- Streletskiy, O.A.; Zavidovskiy, I.A.; Balabanyan, V.Y.; Tsiskarashvili, A.V. Antibacterial Properties of Modified a-C and Ta-C Coatings: The Effects of the Sp2/Sp3 Ratio, Oxidation, Nitridation, and Silver Incorporation. Appl. Phys. A 2022, 128, 929. [Google Scholar] [CrossRef]
- Shen, W.; Wang, C.; Xu, Q.; Liu, H.; Wang, Y. Nitrogen-Doping-Induced Defects of a Carbon Coating Layer Facilitate Na-Storage in Electrode Materials. Adv. Energy Mater. 2015, 5, 1400982. [Google Scholar] [CrossRef]
- Sun, Y.; Xiao, H.; Li, H.; He, Y.; Zhang, Y.; Hu, Y.; Ju, Z.; Zhuang, Q.; Cui, Y. Nitrogen/Oxygen Co-Doped Hierarchically Porous Carbon for High-Performance Potassium Storage. Chemistry 2019, 25, 7359–7365. [Google Scholar] [CrossRef] [PubMed]
- Hong, W.; Wang, A.; Li, L.; Qiu, T.; Li, J.; Jiang, Y.; Zou, G.; Peng, H.; Hou, H.; Ji, X. Bi Dots Confined by Functional Carbon as High-Performance Anode for Lithium Ion Batteries. Adv. Funct. Mater. 2020, 31, 2000756. [Google Scholar] [CrossRef]
- Li, Q.; Jiao, Q.; Yan, Y.; Li, H.; Zhou, W.; Gu, T.; Shen, X.; Lu, C.; Zhao, Y.; Feng, C.; et al. Optimized Co–S Bonds Energy and Confinement Effect of Hollow Mxene@CoS2/NC for Enhanced Sodium Storage Kinetics and Stability. Chem. Eng. J. 2022, 450, 137922. [Google Scholar] [CrossRef]
- Zhang, Y.; Li, M.; Huang, F.; Li, Y.; Xu, Y.; Wang, F.; Yao, Q.; Zhou, H.; Deng, J. 3D Porous Sb-Co Nanocomposites as Advanced Anodes for Sodium-Ion Batteries and Potassium-Ion Batteries. Appl. Surf. Sci. 2020, 499, 143907. [Google Scholar] [CrossRef]
- Zhao, Y.; Manthiram, A. High-Capacity, High-Rate Bi–Sb Alloy Anodes for Lithium-Ion and Sodium-Ion Batteries. Chem. Mater. 2015, 27, 3096–3101. [Google Scholar] [CrossRef]
- Jing, W.T.; Zhang, Y.; Gu, Y.; Zhu, Y.F.; Yang, C.C.; Jiang, Q. N-Doped Carbon Nanonecklaces with Encapsulated Sb as a Sodium-Ion Battery Anode. Matter 2019, 1, 720–733. [Google Scholar] [CrossRef]
- Liu, H.; Wang, Z.; Wu, Z.; Zhang, S.; Ge, S.; Guo, P.; Hua, M.; Lu, X.; Wang, S.; Zhang, J. Direct Tuning of Meso-/Micro-Porous Structure of Carbon Nanofibers Confining Sb Nanocrystals for Advanced Sodium and Potassium Storage. J. Alloys Compd. 2020, 833, 155127. [Google Scholar] [CrossRef]
- Wang, Z.; Duan, C.; Wang, D.; Dong, K.; Luo, S.; Liu, Y.; Wang, Q.; Zhang, Y.; Hao, A. BiSb@Bi2O3/SbOx Encapsulated in Porous Carbon as Anode Materials for Sodium/Potassium-Ion Batteries with a High Pseudocapacitive Contribution. J. Colloid Interface Sci. 2020, 580, 429–438. [Google Scholar] [CrossRef]
- Wang, X.; Wu, Y.; Huang, P.; Chen, P.; Wang, Z.; Xu, X.; Xie, J.; Yan, J.; Li, S.; Tu, J.; et al. A Multi-Layered Composite Assembly of Bi Nanospheres Anchored on Nitrogen-Doped Carbon Nanosheets for Ultrastable Sodium Storage. Nanoscale 2020, 12, 23682–23693. [Google Scholar] [CrossRef] [PubMed]
- Cho, Y.-D.; Fey, G.T.-K.; Kao, H.-M. The Effect of Carbon Coating Thickness on the Capacity of LiFePO4/C Composite Cathodes. J. Power Sources 2009, 189, 256–262. [Google Scholar] [CrossRef]
- Wang, J.; Lin, F.; Jia, H.; Yang, J.; Monroe, C.W.; NuLi, Y. Towards a Safe Lithium-Sulfur Battery with a Flame-Inhibiting Electrolyte and a Sulfur-Based Composite Cathode. Angew. Chem. Int. Ed. 2014, 53, 10099–10104. [Google Scholar] [CrossRef] [PubMed]
- Shen, Z.; Cao, L.; Rahn, C.D.; Wang, C.-Y. Least Squares Galvanostatic Intermittent Titration Technique (LS-GITT) for Accurate Solid Phase Diffusivity Measurement. J. Electrochem. Soc. 2013, 160, A1842–A1846. [Google Scholar] [CrossRef]
- Huang, H.; Xu, R.; Feng, Y.; Zeng, S.; Jiang, Y.; Wang, H.; Luo, W.; Yu, Y. Sodium/Potassium-Ion Batteries: Boosting the Rate Capability and Cycle Life by Combining Morphology, Defect and Structure Engineering. Adv. Mater. 2020, 32, 1904320. [Google Scholar] [CrossRef]
- Song, J.; Yan, P.; Luo, L.; Qi, X.; Rong, X.; Zheng, J.; Xiao, B.; Feng, S.; Wang, C.; Li, X.; et al. Yolk-Shell Structured Sb@C Anodes for High Energy Na-Ion Batteries. Nano Energy 2017, 40, 504–511. [Google Scholar] [CrossRef]
- Gao, H.; Niu, J.; Zhang, C.; Peng, Z.; Zhang, Z. A Dealloying Synthetic Strategy for Nanoporous Bismuth-Antimony Anodes for Sodium Ion Batteries. ACS Nano 2018, 12, 3568–3577. [Google Scholar] [CrossRef]
- Jusys, Z.; Binder, M.; Schnaidt, J.; Behm, R.J. A Novel Dems Approach for Studying Gas Evolution at Battery-Type Electrode|Electrolyte Interfaces: High-Voltage LiNi0.5Mn1.5O4 Cathode in Ethylene and Dimethyl Carbonate Electrolytes. Electrochim. Acta 2019, 314, 188–201. [Google Scholar] [CrossRef]
- Metzger, M.; Strehle, B.; Solchenbach, S.; Gasteiger, H.A. Origin of H2 evolution in LIBs: H2O Reduction Vs. Electrolyte Oxidation. J. Electrochem. Soc. 2016, 163, A798–A809. [Google Scholar] [CrossRef]
- Klein, F.; Pinedo, R.; Berkes, B.B.; Janek, J.; Adelhelm, P. Kinetics and Degradation Processes of CuO as Conversion Electrode for Sodium-Ion Batteries: An Electrochemical Study Combined with Pressure Monitoring and Dems. J. Phys. Chem. C 2017, 121, 8679–8691. [Google Scholar] [CrossRef]
- Vogt, L.O.; El Kazzi, M.; Jämstorp Berg, E.; Pérez Villar, S.; Novák, P.; Villevieille, C. Understanding the Interaction of the Carbonates and Binder in Na-Ion Batteries: A Combined Bulk and Surface Study. Chem. Mater. 2015, 27, 1210–1216. [Google Scholar] [CrossRef]


Disclaimer/Publisher’s Note: The statements, opinions and data contained in all publications are solely those of the individual author(s) and contributor(s) and not of MDPI and/or the editor(s). MDPI and/or the editor(s) disclaim responsibility for any injury to people or property resulting from any ideas, methods, instructions or products referred to in the content. |
© 2023 by the authors. Licensee MDPI, Basel, Switzerland. This article is an open access article distributed under the terms and conditions of the Creative Commons Attribution (CC BY) license (https://creativecommons.org/licenses/by/4.0/).
Share and Cite
Ma, W.; Yu, B.; Tan, F.; Gao, H.; Zhang, Z. Bismuth−Antimony Alloy Embedded in Carbon Matrix for Ultra-Stable Sodium Storage. Materials 2023, 16, 2189. https://doi.org/10.3390/ma16062189
Ma W, Yu B, Tan F, Gao H, Zhang Z. Bismuth−Antimony Alloy Embedded in Carbon Matrix for Ultra-Stable Sodium Storage. Materials. 2023; 16(6):2189. https://doi.org/10.3390/ma16062189
Chicago/Turabian StyleMa, Wensheng, Bin Yu, Fuquan Tan, Hui Gao, and Zhonghua Zhang. 2023. "Bismuth−Antimony Alloy Embedded in Carbon Matrix for Ultra-Stable Sodium Storage" Materials 16, no. 6: 2189. https://doi.org/10.3390/ma16062189
APA StyleMa, W., Yu, B., Tan, F., Gao, H., & Zhang, Z. (2023). Bismuth−Antimony Alloy Embedded in Carbon Matrix for Ultra-Stable Sodium Storage. Materials, 16(6), 2189. https://doi.org/10.3390/ma16062189