
Effect of Heat Treatment Processes on the Microstructure and Mechanical Properties of High-Strength Aluminum Alloy Deposited Layers Processed by Fused Arc Additive Manufacturing

Abstract
:1. Introduction
2. Materials and Methods
2.1. Test Materials
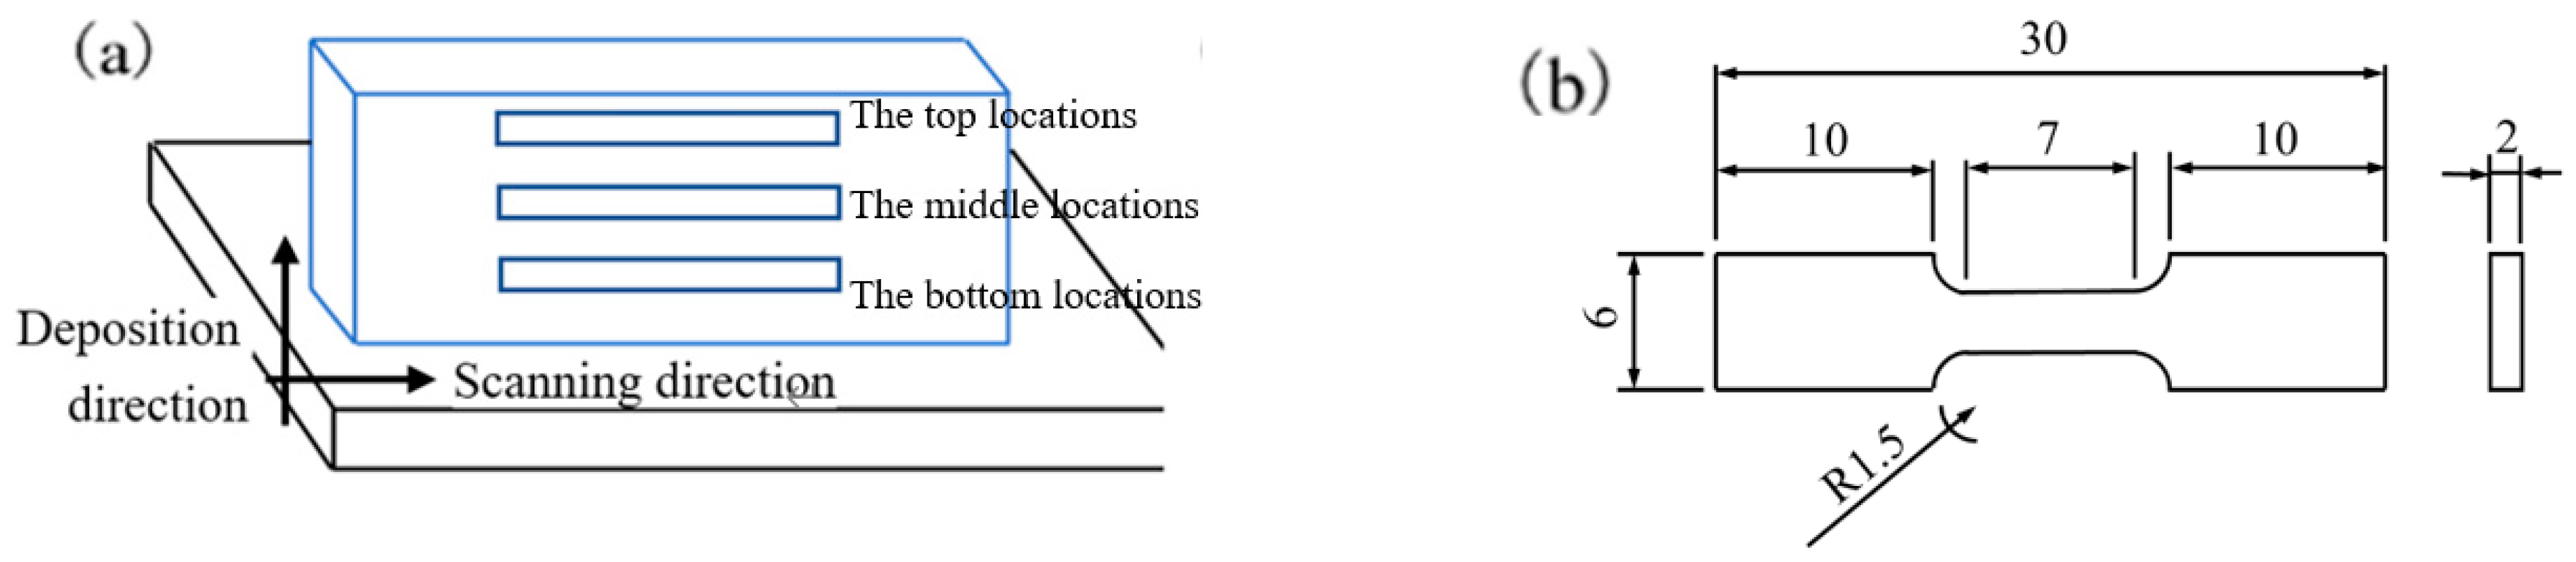
2.2. Test Method
2.2.1. WAAM Equipment
2.2.2. Heat Treatment
2.3. Analysis and Test Methods
2.3.1. Morphology and Microstructure
2.3.2. Mechanical Test
2.3.3. Grain Morphology
2.3.4. Electrochemical Test
3. Results and Discussion
3.1. Macroforming Characteristics
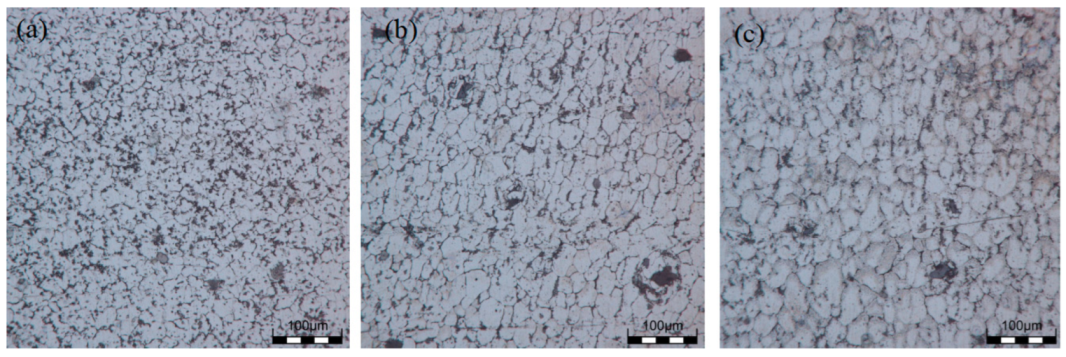
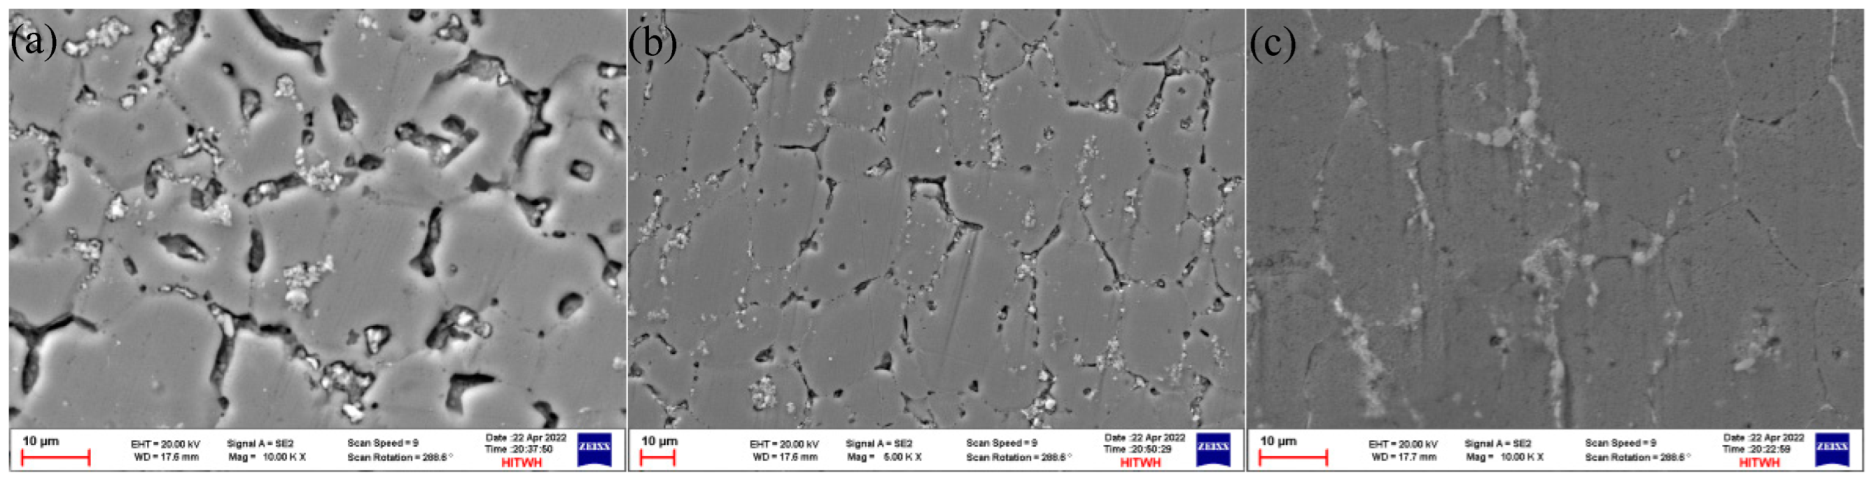
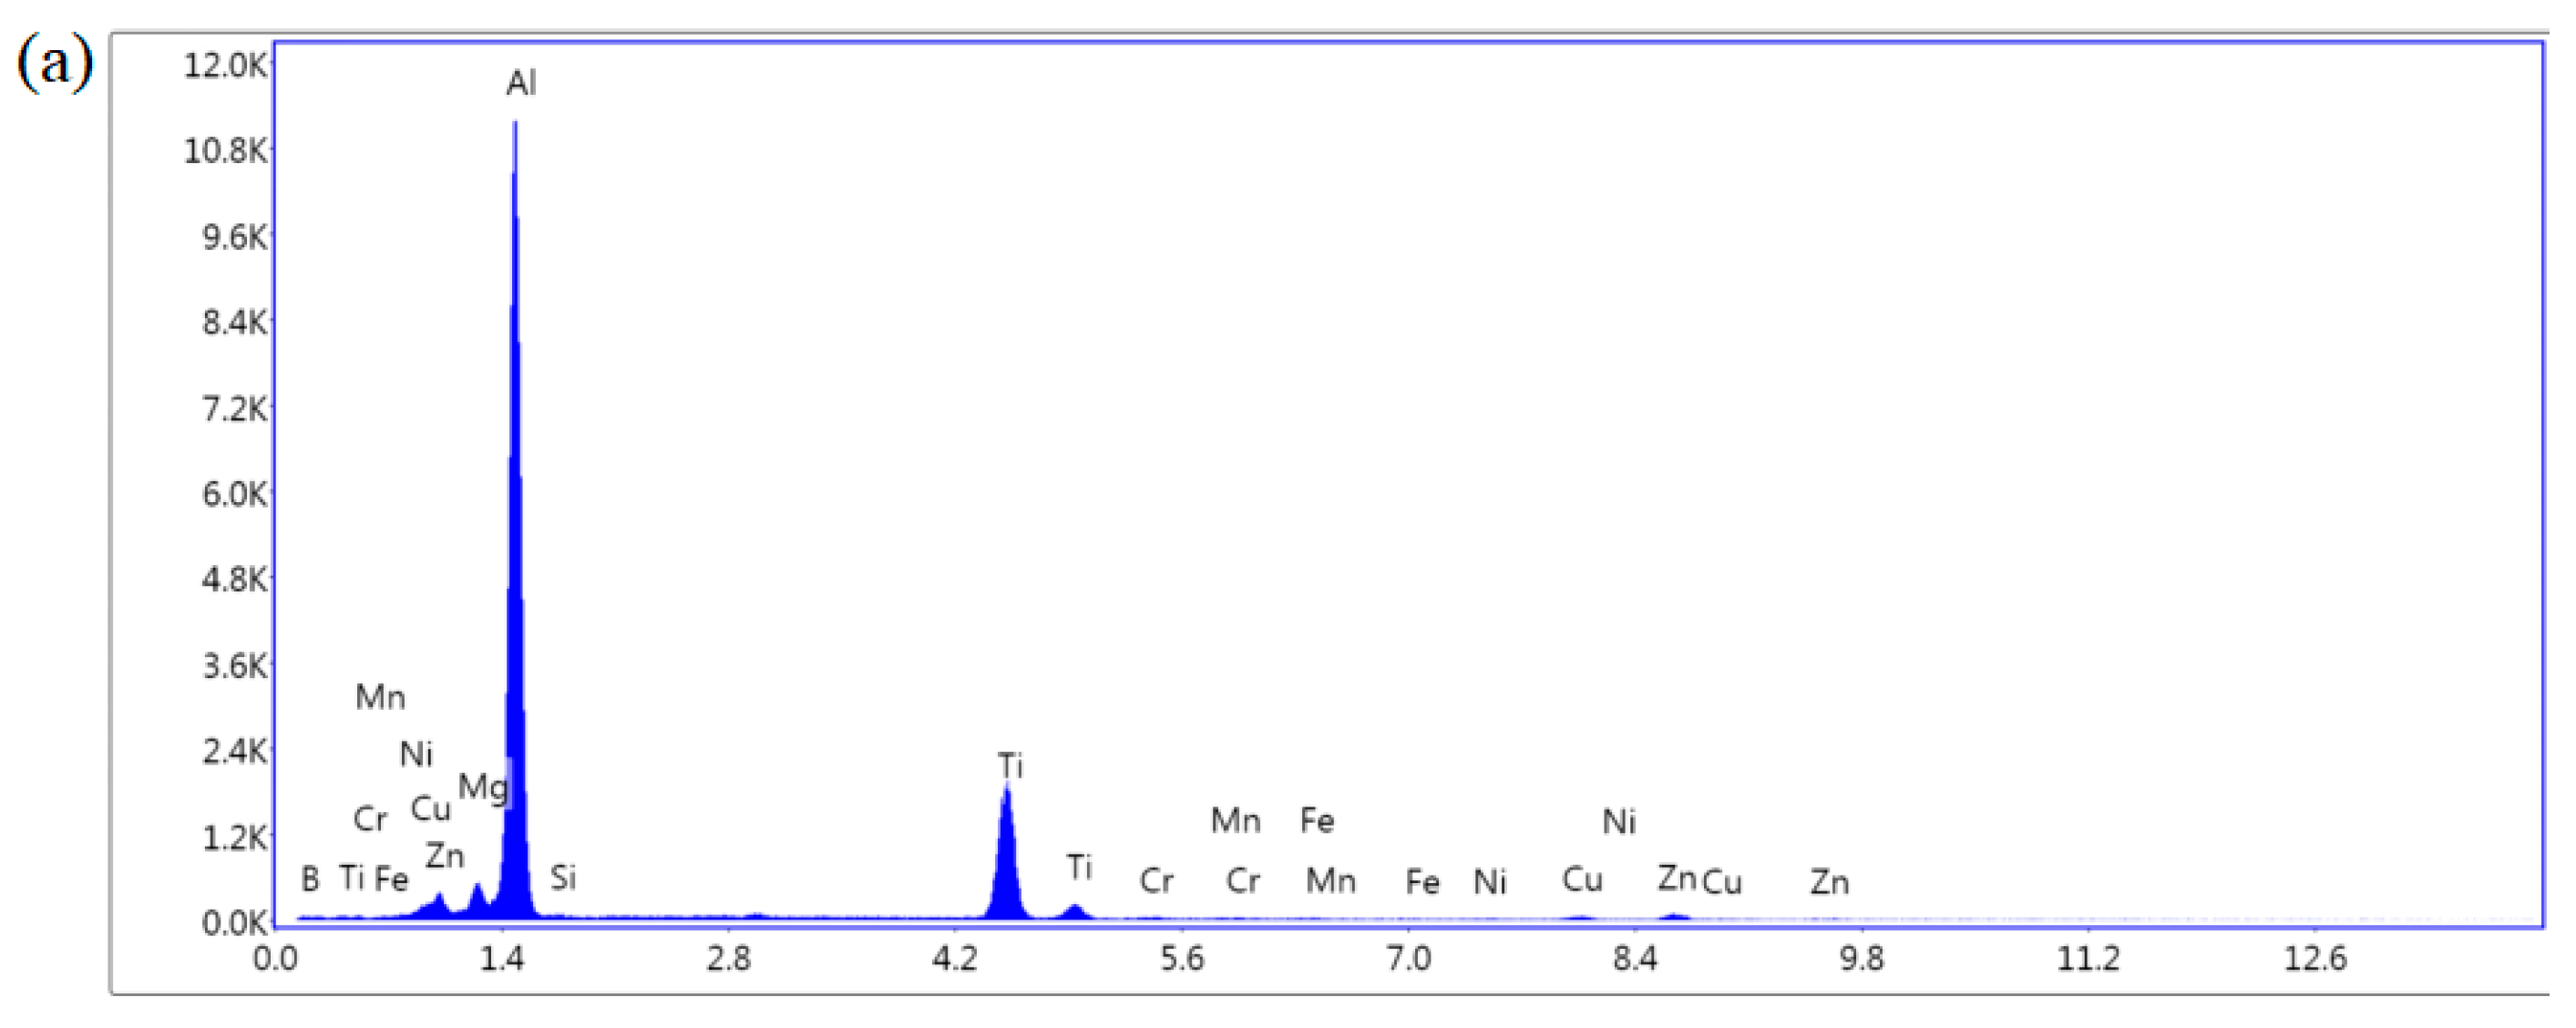
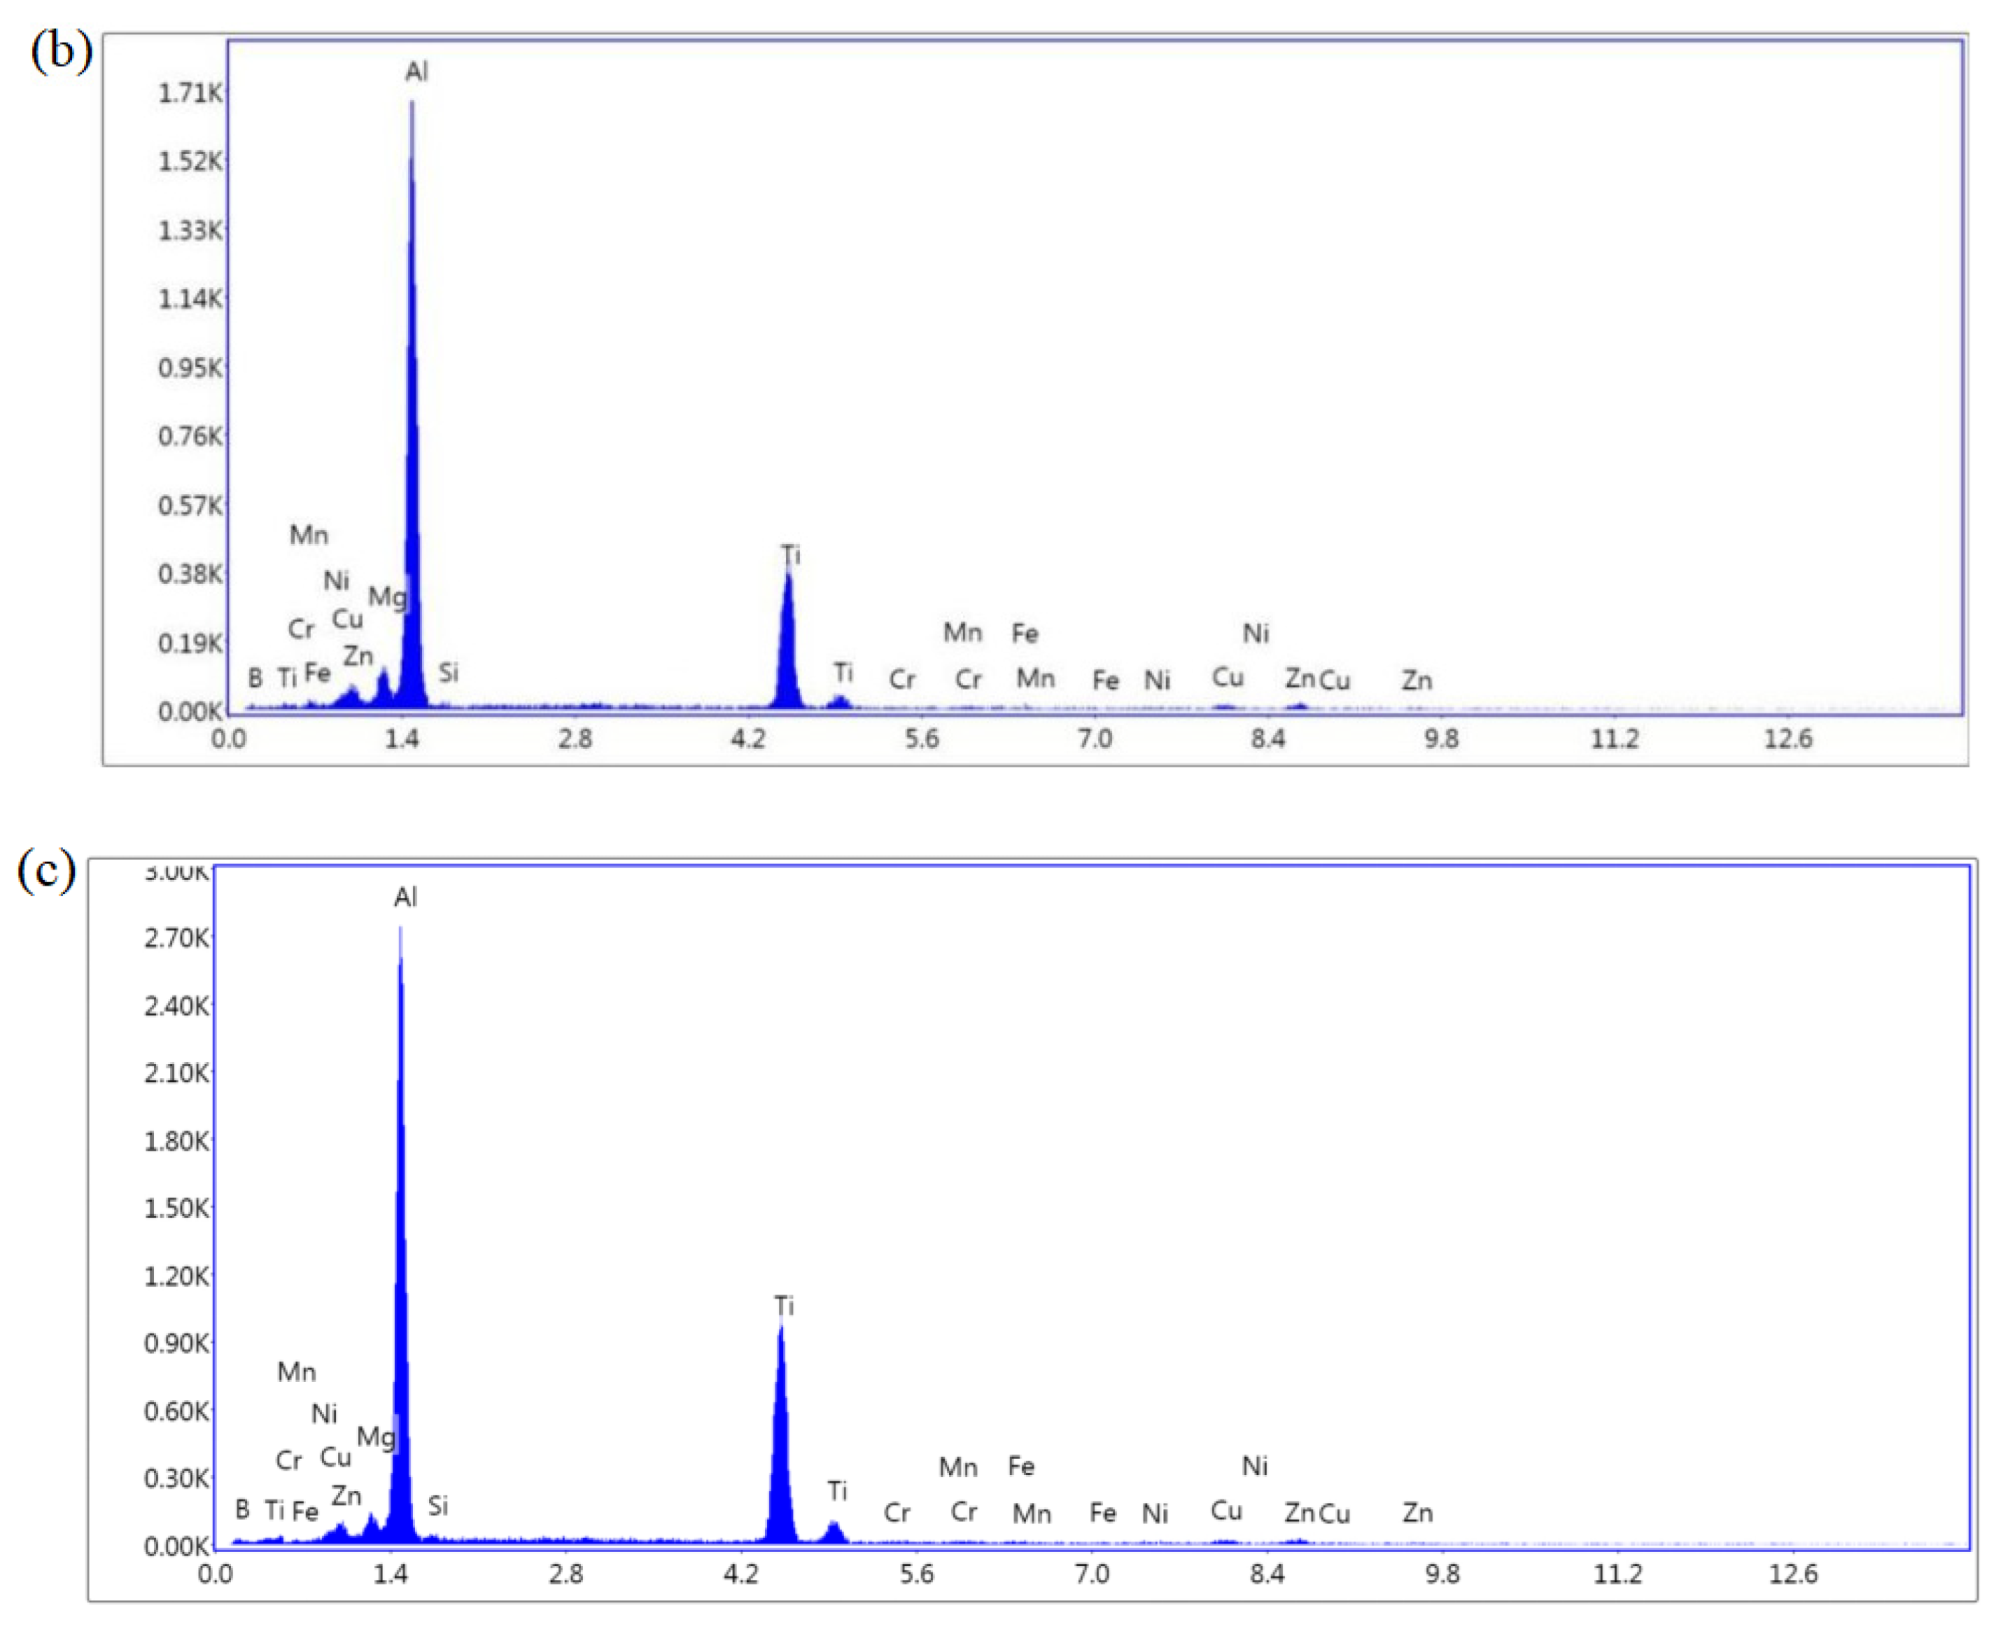
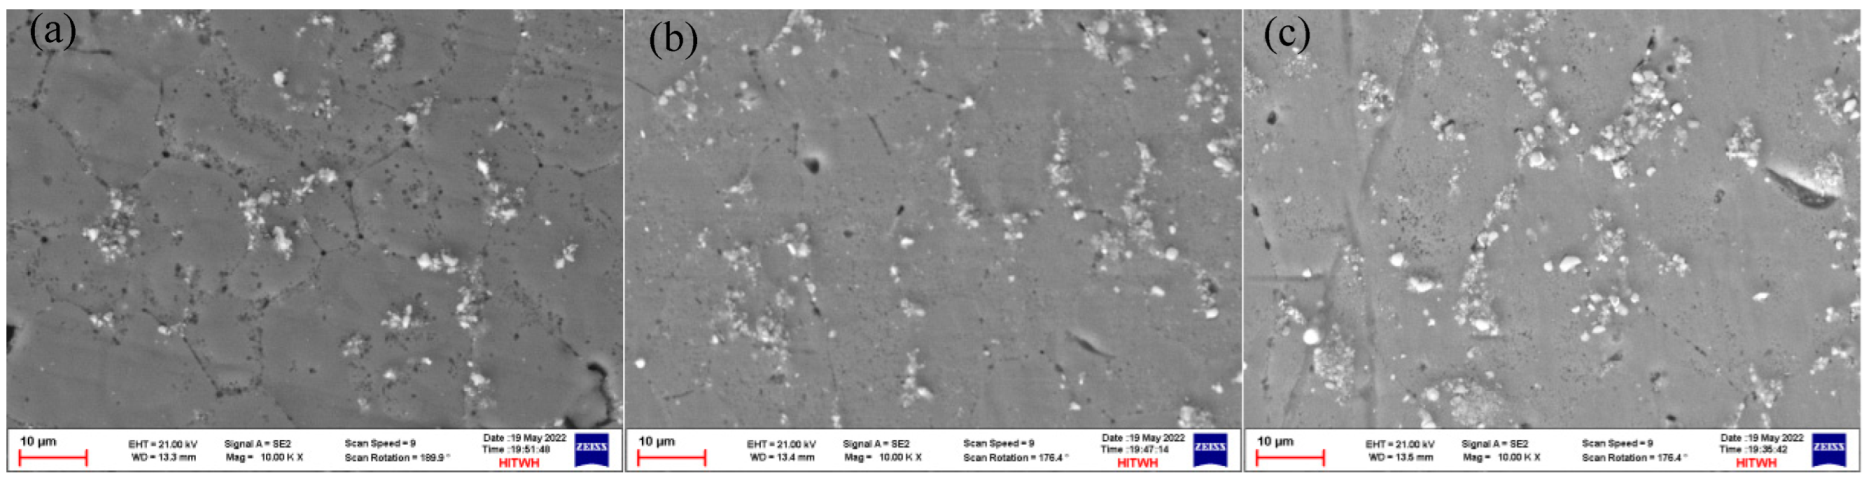
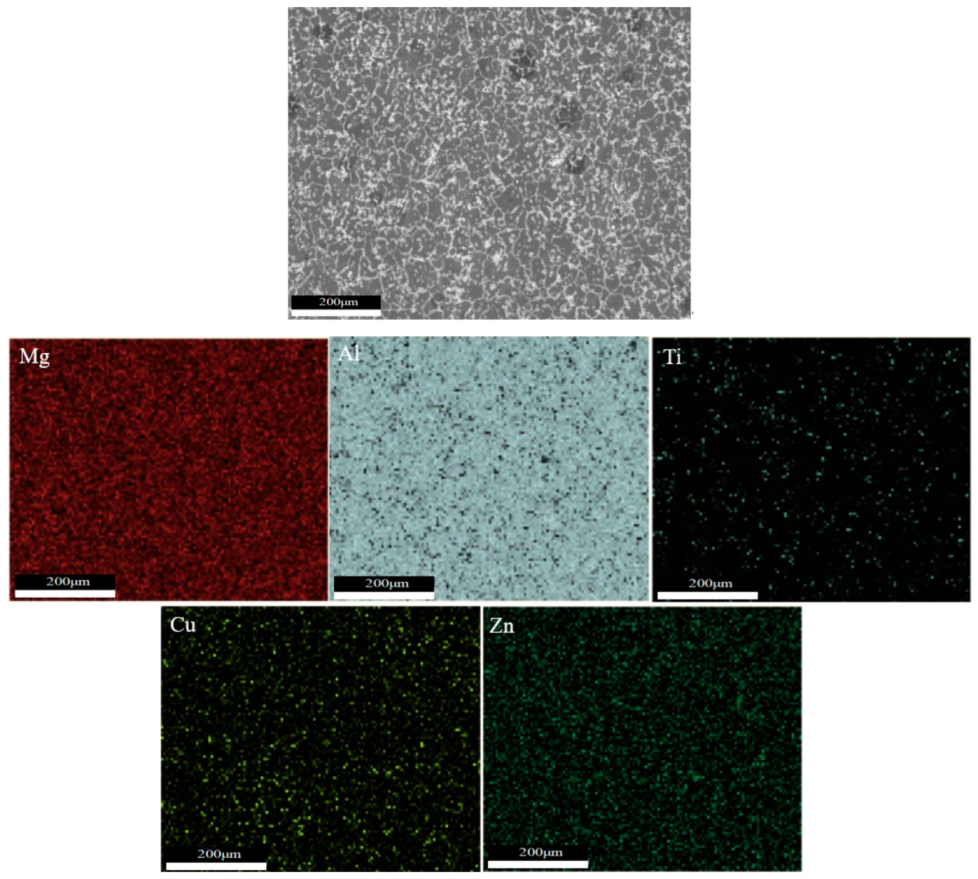
3.2. Microstructure of Sedimentary Layer
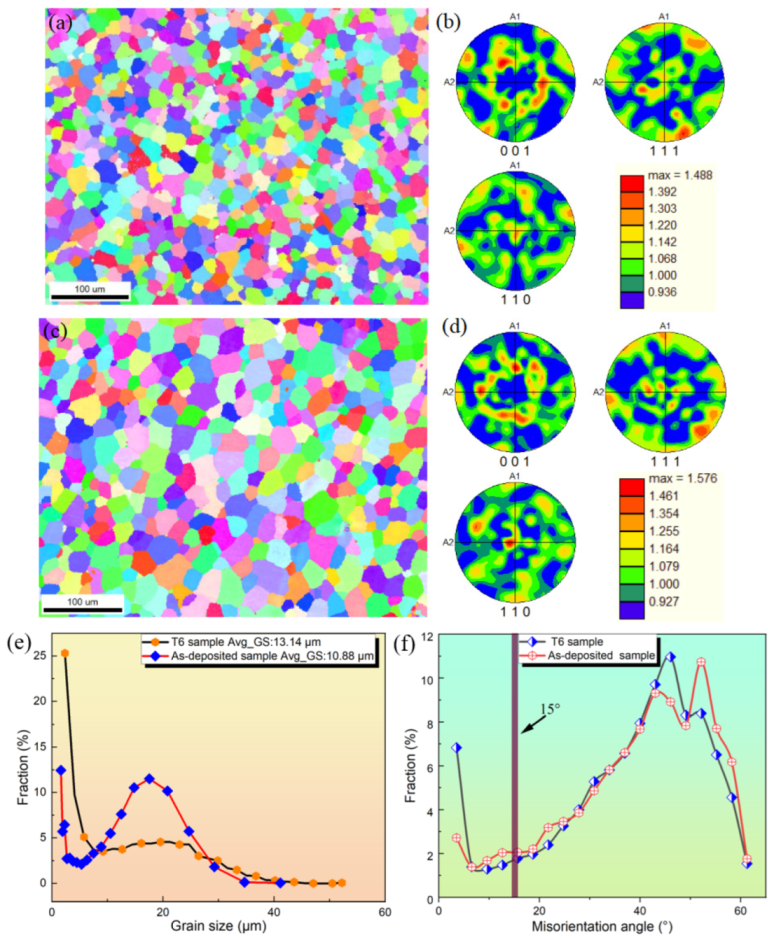
3.3. Grain Morphology
3.4. Mechanical Tests
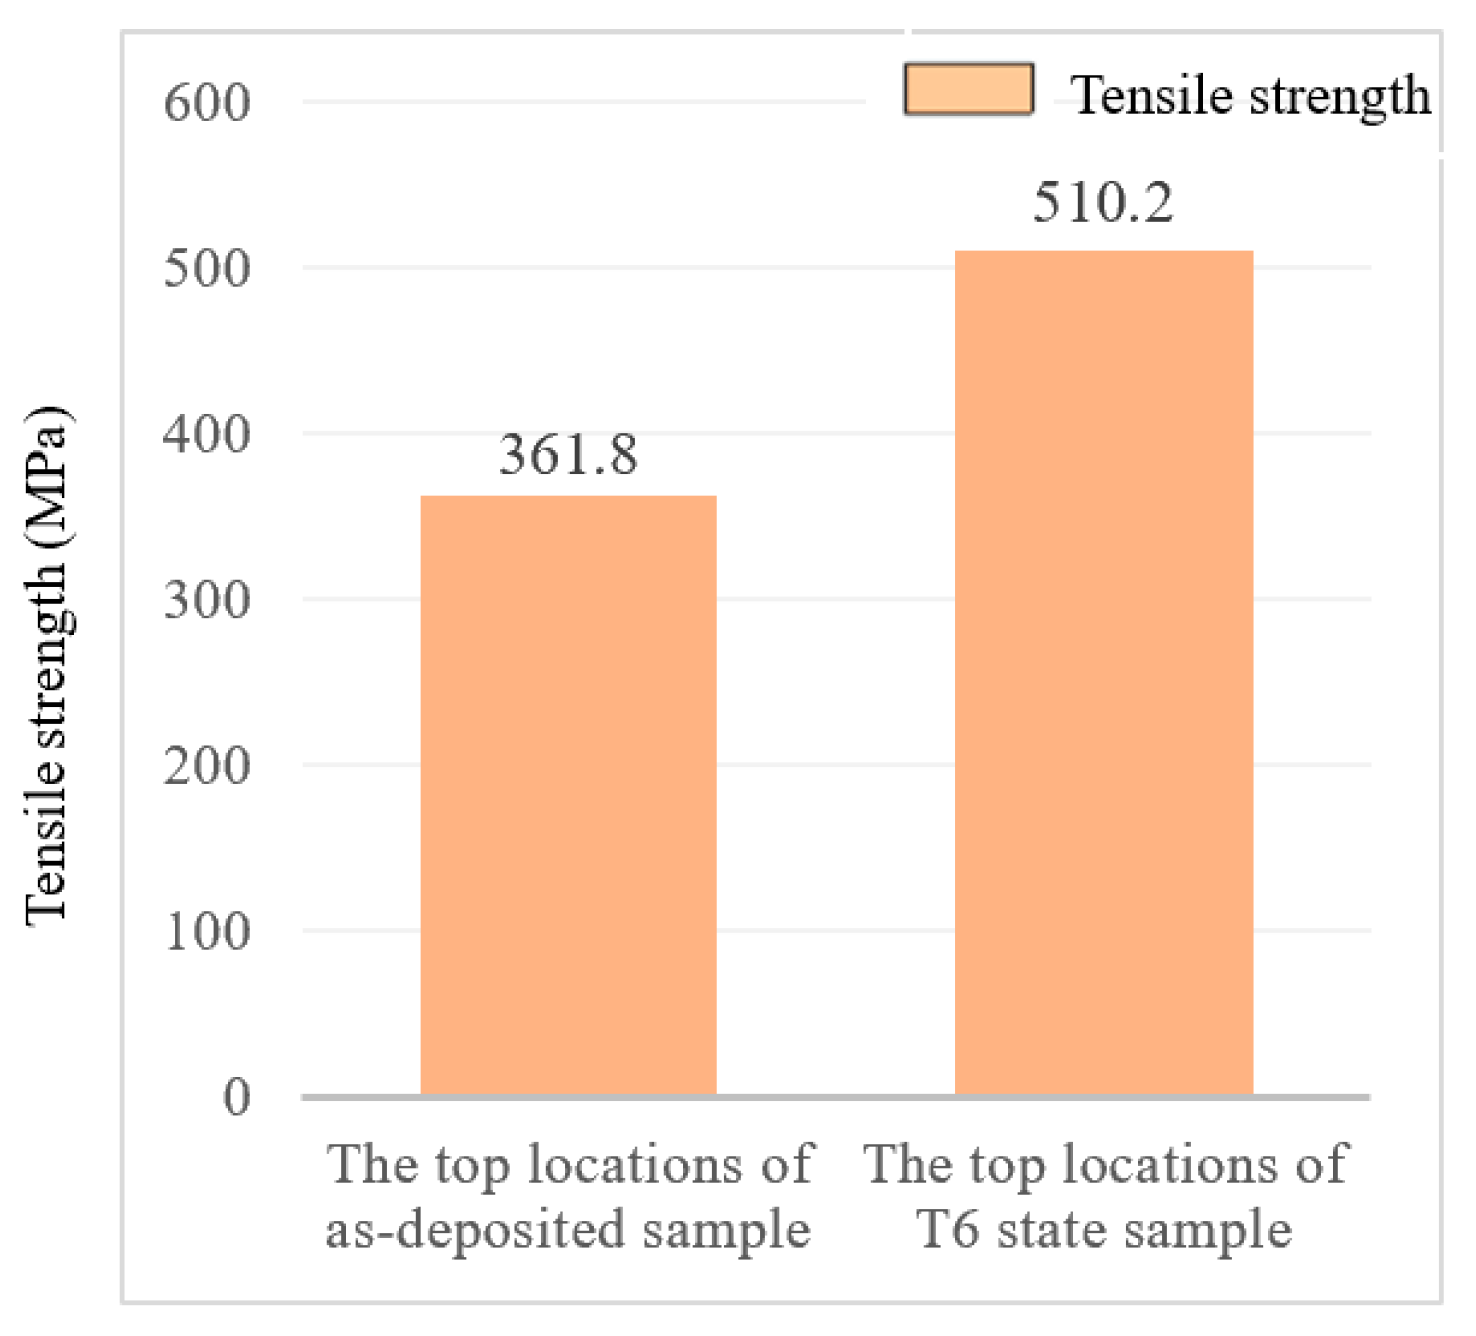
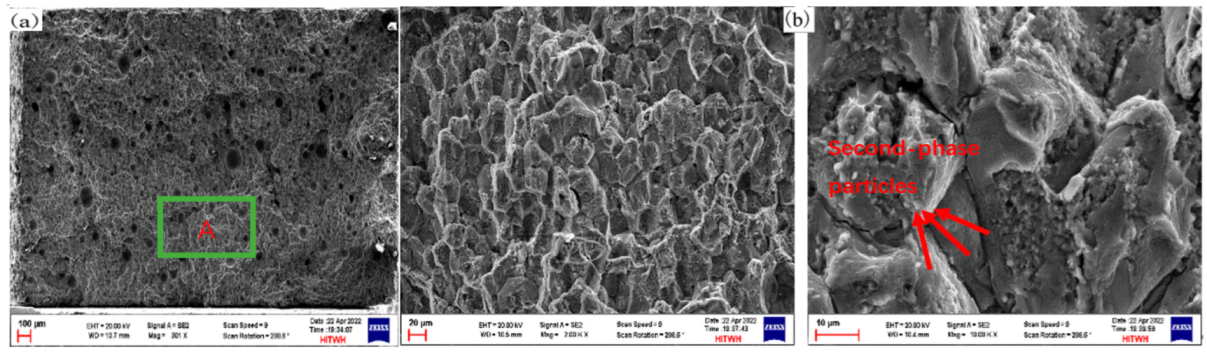
3.4.1. Tensile Properties
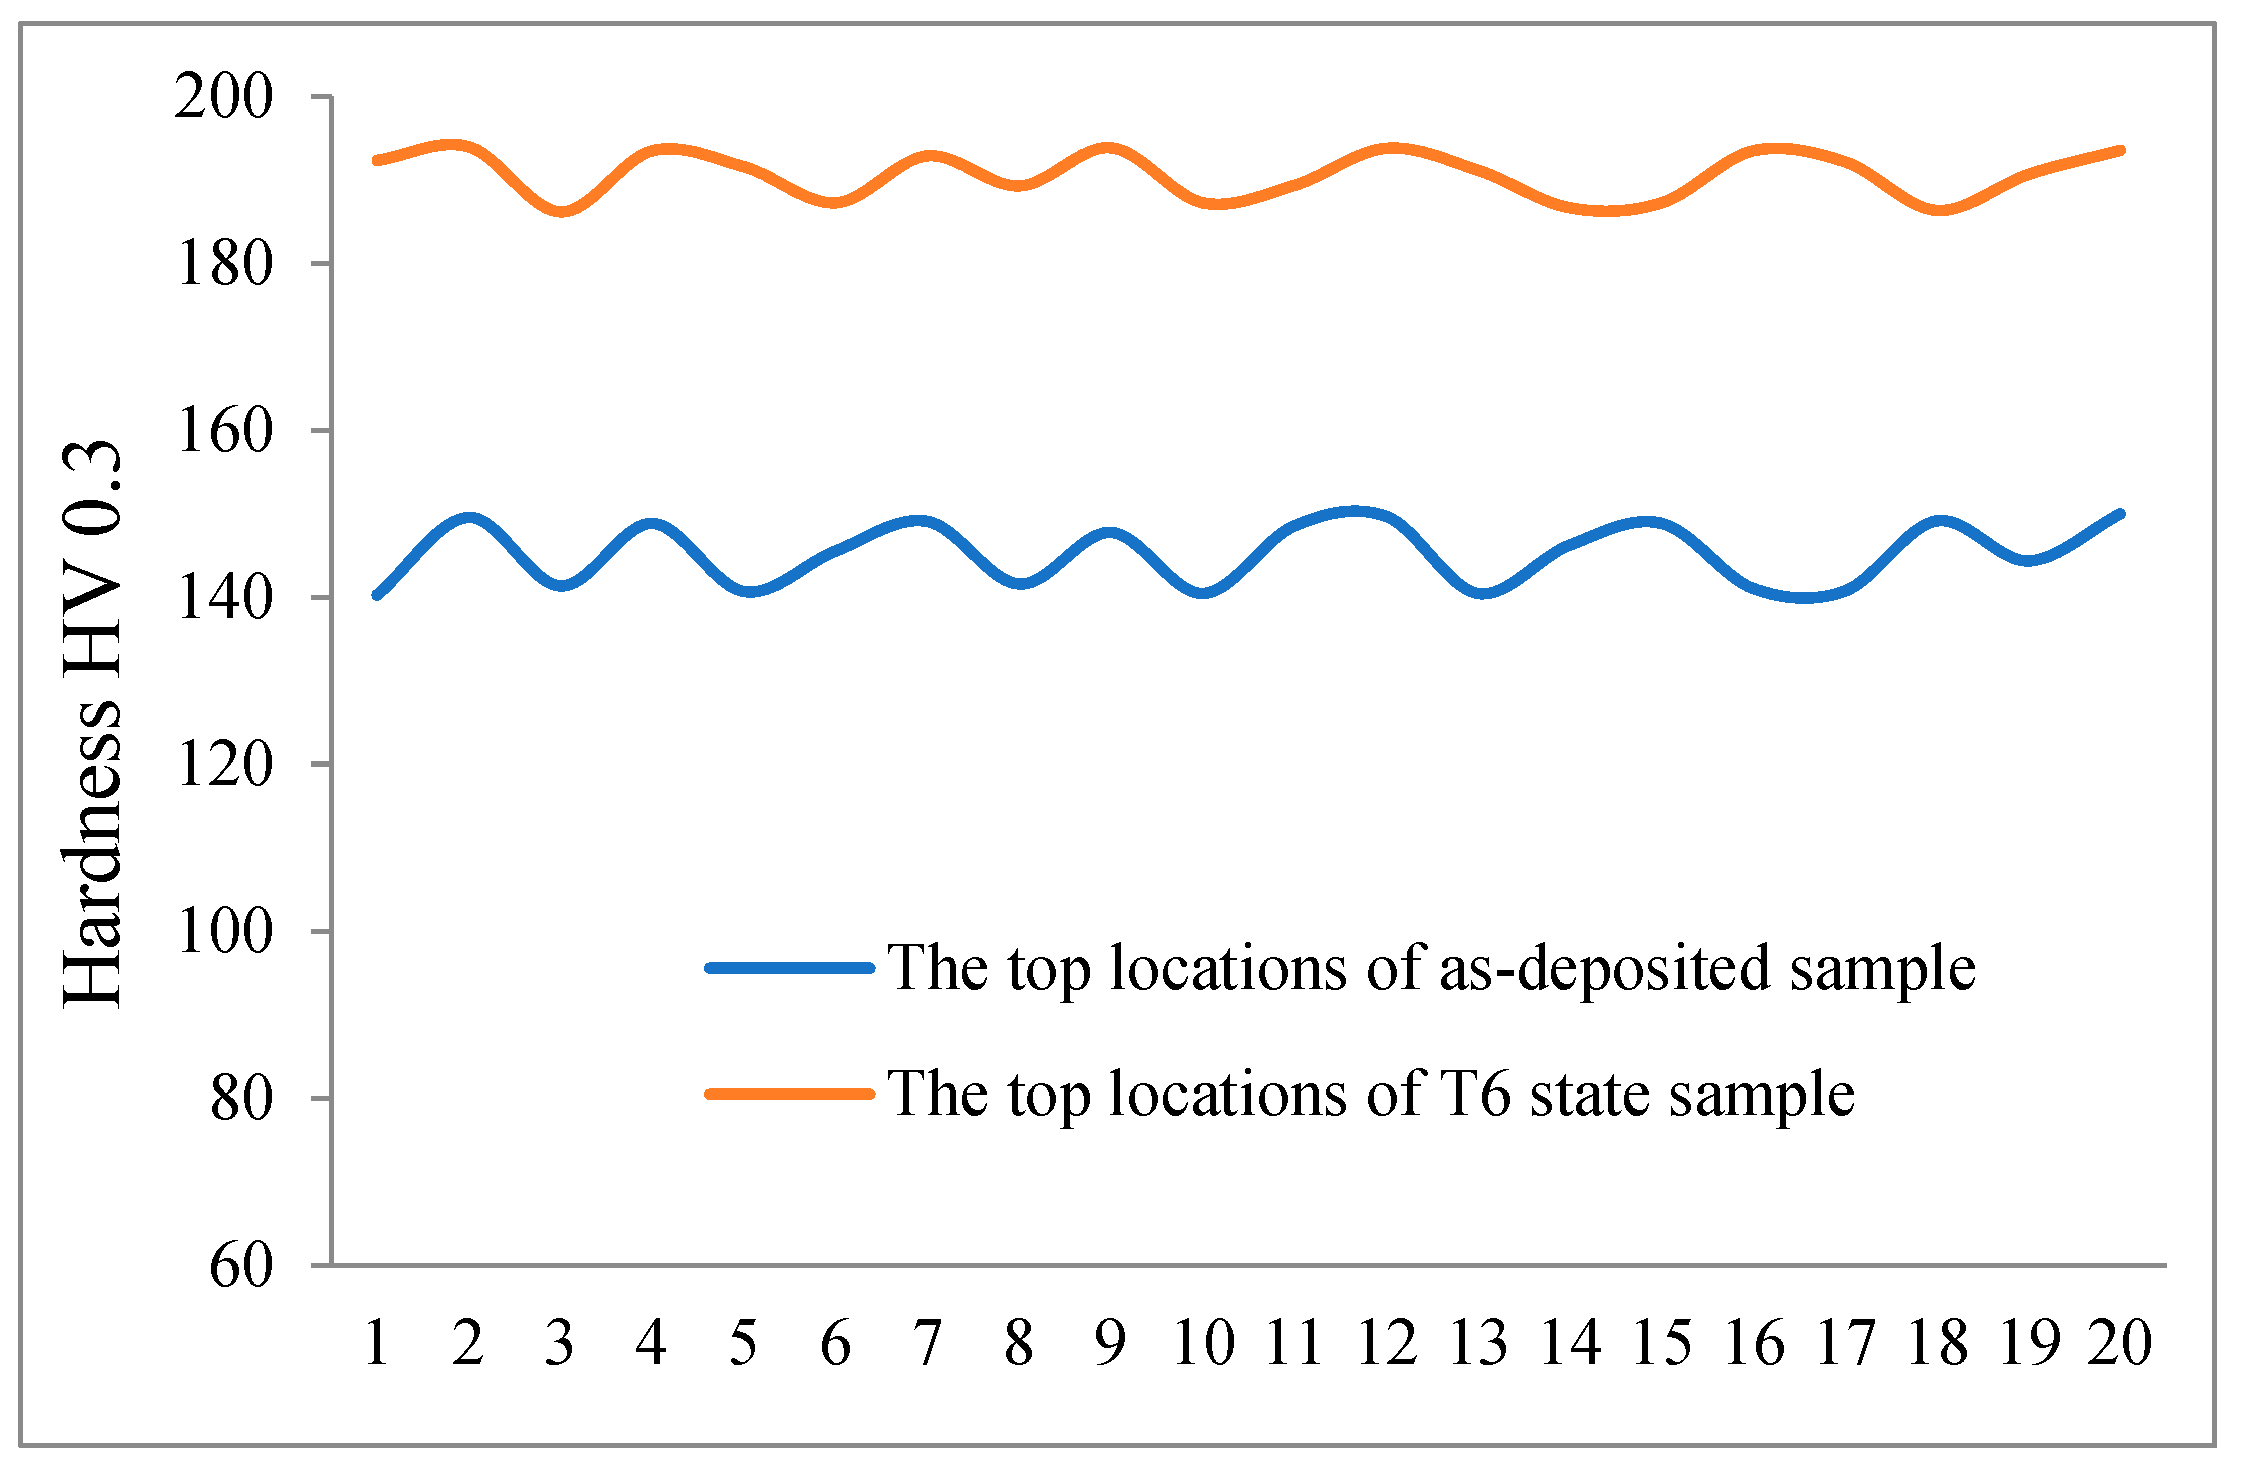
3.4.2. Microhardness
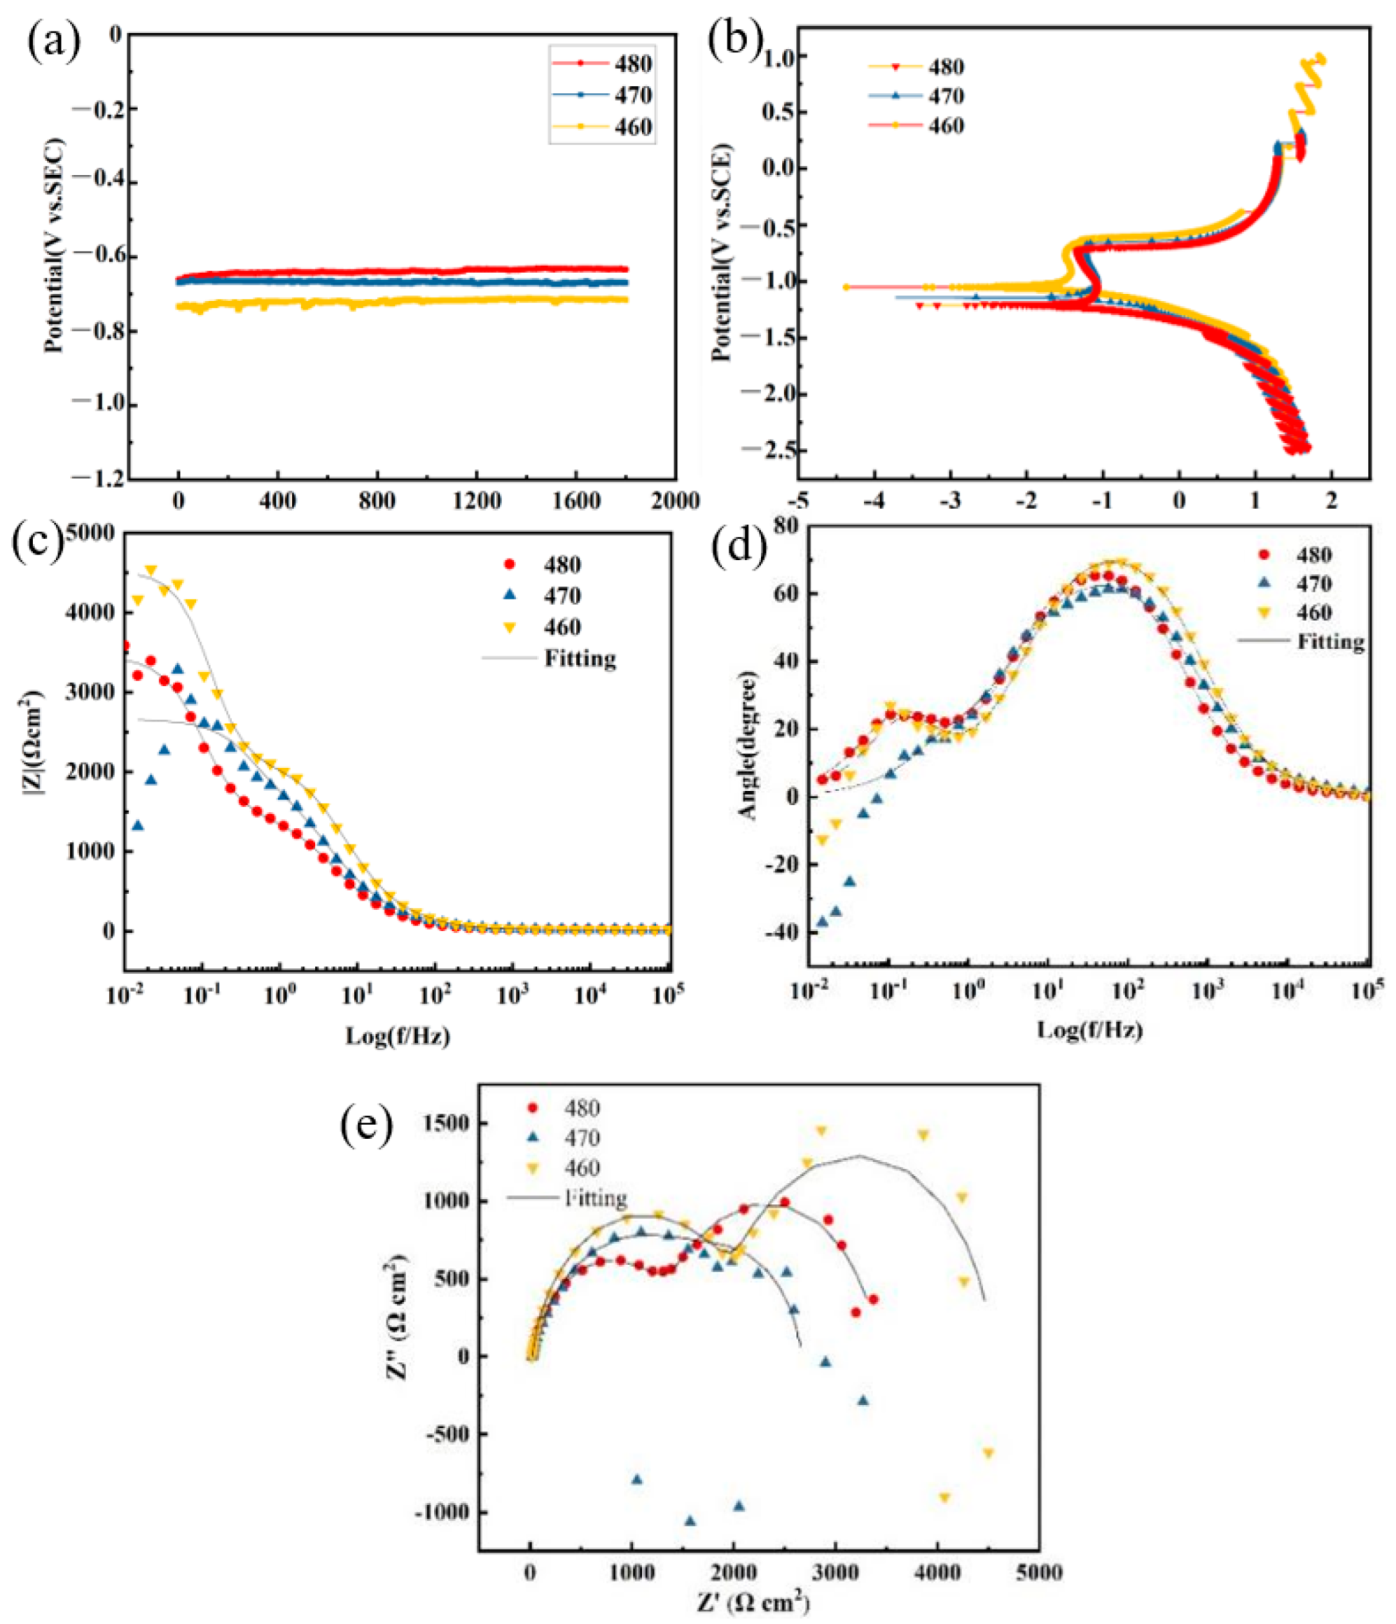
3.4.3. Corrosion Resistance
4. Conclusions
Author Contributions
Funding
Institutional Review Board Statement
Informed Consent Statement
Data Availability Statement
Conflicts of Interest
References
- Azarniya, A.; Taheri, A.K.; Taheri, K.K. Recent advances in ageing of 7xxx series aluminum alloys: A physical metallurgy perspective. J. Alloys Compd. 2019, 781, 945–983. [Google Scholar] [CrossRef]
- Shin, J.; Kim, T.; Kim, D.E.; Kim, D.; Kim, K. Castability and mechanical properties of new 7xxx aluminum alloys for automotive chassis/body applications. J. Alloys Compd. 2016, 698, 577–590. [Google Scholar] [CrossRef]
- Ngo, T.D.; Kashani, A.; Imbalzano, G.; Nguyen, K.T.Q.; Hui, D. Additive manufacturing (3D printing): A review of materials, methods, applications and challenges. J. Compos. B Eng. 2018, 143, 172–196. [Google Scholar] [CrossRef]
- Taşdemir, A.; Nohut, S. An overview of wire arc additive manufacturing (WAAM) in shipbuilding industry. J. Ships Offshore Struct. 2020, 16, 797–814. [Google Scholar] [CrossRef]
- Suarez, A.; Aldalur, E.; Veiga, F.; Artaza, T.; Tabernero, I.; Lamikiz, A. Wire arc additive manufacturing of an aeronautic fitting with different metal alloys: From the design to the part. J. Manuf. Process. 2021, 64, 188–197. [Google Scholar] [CrossRef]
- Dursun, T.; Soutis, C. Recent developments in advanced aircraft aluminium alloys. J. Mater. Des. 2014, 56, 862–871. [Google Scholar] [CrossRef]
- Starke, J.C.W.E.A. Progress in structural materials for aerospace systems. J. Acta Mater. 2003, 51, 5775–5799. [Google Scholar] [CrossRef]
- Dong, B.; Cai, X.; Lin, S.; Li, X.; Fan, C.; Yang, C.; Sun, H. Wire arc additive manufacturing of Al-Zn-Mg-Cu alloy: Microstructures and mechanical properties. J. Addit. Manuf. 2020, 36, 101447. [Google Scholar] [CrossRef]
- Klein, T.; Schnall, M.; Gomes, B.; Warczok, P.; Fleischhacker, D.; Morais, P.J. Wire-arc additive manufacturing of a novel high-performance Al-Zn-Mg-Cu alloy: Processing, characterization and feasibility demonstration. J. Addit. Manuf. 2021, 37, 101663. [Google Scholar] [CrossRef]
- Shen, Z.; Wu, Z.; Wang, T.; Jia, T.; Liu, C. Research on Technology of 7075 Aluminum Alloy Processed by Variable Polarity TIG Additive Manufacturing Utilizing Nanoparticle-Reinforced Welding Wire with TiB2. J. Crystals 2023, 13, 399. [Google Scholar] [CrossRef]
- Liu, M.; Ma, G.; Liu, D.; Yu, J.; Niu, F.; Wu, D. Microstructure and mechanical properties of 7075 aluminum alloy prepared by wire and arc additive manufacturing. J. Aeronaut. Manuf. Technol. 2022, 65, 14–19. [Google Scholar] [CrossRef]
- Morais, P.J.; Gomes, B.; Santos, P.; Gomes, M.; Kozeschnik, E.J.M. Characterisation of a high-performance Al–Zn–Mg–Cu alloy designed for wire arc additive manufacturing. J. Mater. 2020, 13, 1610. [Google Scholar] [CrossRef] [PubMed]
- Tan, Z.E.; Pang, J.H.L.; Kaminski, J.; Pepin, H. Characterisation of porosity, density, and microstructure of directed energy deposited stainless steel AISI 316L. Addit. Manuf. 2019, 25, 289–296. [Google Scholar] [CrossRef]
- Ramkumar, K.R.; Sivasankaran, S.; Al-Mufadi, F.A.; Siddharth, S.; Raghu, R. Investigations on microstructure, mechanical and tribological behaviour of AA 7075-x wt.% TiC composites for aerospace applications. J. Arch. Civ. Mech. Eng. 2019, 19, 428–438. [Google Scholar] [CrossRef]
- Kubiak, M.; Piekarska, W.; Saternus, Z.; Domański, T. Numerical Prediction of Fusion Zone and Heat Affected Zone in Hybrid Yb:YAG laser + GMAW Welding Process with Experimental Verification. J. Procedia Eng. 2016, 136, 88–94. [Google Scholar] [CrossRef]
- Buchanan, K.; Colas, K.; Ribis, J.; Lopez, A.; Garnier, J. Analysis of the metastable precipitates in peak-hardness aged Al-Mg-Si(-Cu) alloys with differing Si contents. J. Acta Mater. 2017, 132, 209–221. [Google Scholar] [CrossRef]
- Klein, T.; Graf, G.; Staron, P.; Stark, A.; Clemens, H.; Spoerk-Erdely, P. Microstructure evolution induced by the intrinsic heat treatment occurring during wire-arc additive manufacturing of an Al-MgZn-Cu crossover alloy. J. Mater Lett. 2021, 303, 130500. [Google Scholar] [CrossRef]
- Mathers, G. The Welding Aluminium and Its Alloys, 1st ed.; CRC Press LLC: Boca Raton, FL, USA, 2002. [Google Scholar] [CrossRef]
- Zhong, Q.; Zhao, Z. Fractography; Higher Education Press: Beijing, China, 2006. [Google Scholar]
- Li, J.; Cheng, X.; Li, Z.; Zong, X.; Zhang, S.-Q.; Wang, H.-M. Improving the mechanical properties of Al–5Si–1Cu–Mg aluminum alloy produced by laser additive manufacturing with post-process heat treatments. J. Mater. Sci. Eng. A 2018, 735, 408–417. [Google Scholar] [CrossRef]
- Yang, F. Research on the Manufacturing Process and Properties of TiB2 Reinforced Aluminum Matrix Composite Arc Additives; Shenyang University of Technology: Shenyang, China, 2022. [Google Scholar]


| Zn/wt.% | TiB2/wt.% | Mg/wt.% | Ti/wt.% | Cu/wt.% | Mn/wt.% | Cr/wt.% | Si/wt.% | Al/wt.% | |
|---|---|---|---|---|---|---|---|---|---|
| Welding wire | 5.52 | 3.5–4 | 2.3 | 0.1 | 1.4 | 0.3 | 0.22 | 0.2 | Bal. |
| Sample | Current (A) | Traveling Speed (mm/min) | Wire Feeding Speed (cm/min) | Current Model | Quantity of Position Layer |
|---|---|---|---|---|---|
| 1# | 180 | 220 | 100 | AC square wave | 40 |
Disclaimer/Publisher’s Note: The statements, opinions and data contained in all publications are solely those of the individual author(s) and contributor(s) and not of MDPI and/or the editor(s). MDPI and/or the editor(s) disclaim responsibility for any injury to people or property resulting from any ideas, methods, instructions or products referred to in the content. |
© 2023 by the authors. Licensee MDPI, Basel, Switzerland. This article is an open access article distributed under the terms and conditions of the Creative Commons Attribution (CC BY) license (https://creativecommons.org/licenses/by/4.0/).
Share and Cite
Shen, Z.; Wu, Z.; Wang, T.; Jia, T.; Liu, C. Effect of Heat Treatment Processes on the Microstructure and Mechanical Properties of High-Strength Aluminum Alloy Deposited Layers Processed by Fused Arc Additive Manufacturing. Materials 2023, 16, 6801. https://doi.org/10.3390/ma16206801
Shen Z, Wu Z, Wang T, Jia T, Liu C. Effect of Heat Treatment Processes on the Microstructure and Mechanical Properties of High-Strength Aluminum Alloy Deposited Layers Processed by Fused Arc Additive Manufacturing. Materials. 2023; 16(20):6801. https://doi.org/10.3390/ma16206801
Chicago/Turabian StyleShen, Zhigang, Zhisheng Wu, Ting Wang, Tuosheng Jia, and Cuirong Liu. 2023. "Effect of Heat Treatment Processes on the Microstructure and Mechanical Properties of High-Strength Aluminum Alloy Deposited Layers Processed by Fused Arc Additive Manufacturing" Materials 16, no. 20: 6801. https://doi.org/10.3390/ma16206801
APA StyleShen, Z., Wu, Z., Wang, T., Jia, T., & Liu, C. (2023). Effect of Heat Treatment Processes on the Microstructure and Mechanical Properties of High-Strength Aluminum Alloy Deposited Layers Processed by Fused Arc Additive Manufacturing. Materials, 16(20), 6801. https://doi.org/10.3390/ma16206801