Article

Role of Native Defects in Fe-Doped β-Ga2O3

1
College of Science, Hunan University of Science and Engineering, Yongzhou 425199, China
2
College of Materials Science and Engineering, Hunan University, Changsha 410082, China
3
Fujian Provincial Key Laboratory of Semiconductors and Applications, Collaborative Innovation Center for Optoelectronic Semiconductors and Efficient Devices, Department of Physics, Xiamen University, Xiamen 361005, China
4
College of Science, Jimei University, Xiamen 361021, China
*
Authors to whom correspondence should be addressed.
Materials 2023, 16(20), 6758; https://doi.org/10.3390/ma16206758
Submission received: 12 September 2023 / Revised: 17 October 2023 / Accepted: 17 October 2023 / Published: 19 October 2023

Abstract

:
Iron impurities are believed to act as deep acceptors that can compensate for the n-type conductivity in as-grown Ga2O3, but several scientific issues, such as the site occupation of the Fe heteroatom and the complexes of Fe-doped β-Ga2O3 with native defects, are still lacking. In this paper, based on first-principle density functional theory calculations with the generalized gradient approximation approach, the controversy regarding the preferential Fe incorporation on the Ga site in the β-Ga2O3 crystal has been addressed, and our result demonstrates that Fe dopant is energetically favored on the octahedrally coordinated Ga site. The structural stabilities are confirmed by the formation energy calculations, the phonon dispersion relationships, and the strain-dependent analyses. The thermodynamic transition level Fe3+/Fe2+ is located at 0.52 eV below the conduction band minimum, which is consistent with Ingebrigtsen’s theoretical conclusion, but slightly smaller than some experimental values between 0.78 eV and 1.2 eV. In order to provide direct guidance for material synthesis and property design in Fe-doped β-Ga2O3, the defect formation energies, charge transitional levels, and optical properties of the defective complexes with different kinds of native defects are investigated. Our results show that VGa and Oi can be easily formed for the Fe-doped β-Ga2O3 crystals under O-rich conditions, where the +3 charge state FeGaGai and −2 charge state FeGaOi are energetically favorable when the Fermi level approaches the valence and conduction band edges, respectively. Optical absorption shows that the complexes of FeGaGai and FeGaVGa can significantly enhance the optical absorption in the visible-infrared region, while the energy-loss function in the β-Ga2O3 material is almost negligible after the extra introduction of various intrinsic defects.

1. Introduction

Gallium oxides (Ga2O3) have received a lot of attention due to their exceptional physical and chemical features with a variety of applications such as solar-blind ultraviolet photodetectors [1,2], high-power transistors [3,4], Schottky diodes [5,6], as well as photocatalysts [7]. Due to the inevitable insertion of native defects (such as Gai [8,9]) and extrinsic impurities (such as Si [10], H [11]) during the growth of materials, perfect Ga2O3 exhibits n-type conductivity, which severely impedes its further applications. Doping engineering, in general, can be a valuable approach to manipulating conductivity, which influences electrical and optical performance by modifying the microscopic crystalline structure [12,13,14,15,16]. As a result, studies of acceptors in β-Ga2O3 materials are required. The n-type conductivity in perfect β-Ga2O3 can be compensated by the introduction of deep acceptors, such as Fe dopant. Fe impurity is one of the most attractive dopants because it not only exists unintentionally during the synthesis of β-Ga2O3 crystals but also possesses the same tri-valence states with comparable ionic radii as host Ga3+ [17].
β-Ga2O3 exhibits a monoclinic structure with two nonequivalent tetrahedrally and octahedrally coordinated Ga sites. Regarding the replacement of Ga by Fe dopant in the β-Ga2O3 system, one general question would be what is the preferential substitution location for Fe, the tetrahedrally or the octahedrally coordinated Ga sites? Previous studies showed that the specified site location and local symmetry may determine the microscopic structure as well as the optical and electronic properties [18]. Zhang et al. reported the preferential occupation of Fe3+ ions in the octahedral over the tetrahedral sites in the Fe-doped β-Ga2O3 crystal based on electron paramagnetic resonance (EPR) analyses [19]. Trooster et al. reported that Fe-doped Ga2-xFexO3 powder with high doping concentrations (i.e., x = 0.8, 0.9, 1.08, and 1.15) grown with the flux method of Remeika exhibited ferrimagnetic spin configuration. Based on the Mossbauer measurements of 57Fe in different compositions, they concluded that Fe3+ ions mainly replaced Ga3+ in the octahedral sites, with only a small fraction of Fe ions at the tetrahedral Ga sites [20]. Büscher et al. revealed the occupation of Fe3+ in distorted tetrahedral sites in single β-Ga2O3 crystals for the first time by employing EPR measurements [21]. Recently, Bhandari et al. showed that the Fe-replaced tetrahedral and octahedral Ga sites were not distinguished since the photon-induced changes at two different Ga sites were the same based on steady-state photo-EPR measurements [22]. This controversy over the specified Fe location in β-Ga2O3 will be addressed theoretically as below. In addition, native defects are inevitable in Fe-doping in the β-Ga2O3 system. Zhang et al. revealed that, different from the as-grown Fe-doped β-Ga2O3 system, the air-annealing treatment can efficiently increase the crystalline quality and reduce oxygen vacancies, along with decreasing the conductivity and halving the spin susceptibility [19]. Zhou et al. found that for the Fe substituting of the Ga site in the β-Ga2O3 lattice, the main defects originated from oxygen vacancies at room temperatures, as suggested by the EPR spectra, which led to the high resistivity and the potential application for x-ray detection [23]. Hany et al. also reported the existence of VO and VGa in Fe-doped β-Ga2O3 single crystals using optical absorption and temperature-dependent cathodoluminescence (CL) measurements [24].
In terms of the electronic structure variation due to Fe3+ substitution, a deep level between (0.78–1.2) eV relative to the conduction band minimum (CBM) has been reported. Ingebrigtsen et al. unfolded two similar deep levels located at 0.78 eV and 0.75 eV, which can be associated with Fe impurities and intrinsic defects, respectively, for both bulk β-Ga2O3 crystal growth by hydride vapor phase epitaxy and molecular beam epitaxy methods [25]. Lenyk et al. studied the Fe3+/Fe2+ level in Fe-doped β-Ga2O3 crystals and observed a value of ~0.84 eV below the conduction band using noncontact spectroscopy methods including EPR, infrared absorption, and thermoluminescence [17]. Polyakov et al. ascertained that the Fermi level (Ef) in Fe-doped β-Ga2O3 crystals was pinned by the Fe acceptor level near the CBM of ~0.80 eV [26]. Bhandari et al. showed that Fe dopants act as deep acceptors, and the first optically induced change in Fe3+ occurred at 1.2 eV in a Fe-doped β-Ga2O3 single crystal [22].
To corroborate the experimentally resolved two similar deep levels, Ingebrigtsen et al. performed Heyd-Scuseria-Ernzerhof (HSE) hybrid functional calculations. Their results show that the Fe-replaced Ga site is energetically favored on the octahedral Ga site (FeGaII), while Fe substituted for the tetrahedral site (FeGaI) exhibits a slightly higher formation energy both under O-rich and Ga-rich conditions compared with the FeGaII state. Moreover, the thermodynamic transition level for the Fe3+/Fe2+ is located at 0.61 eV below the CBM; the level falls to 0.40 eV if assuming the lower screening [25]. We can hardly find more theoretically calculated results for Fe-doped β-Ga2O3 to the best of our knowledge. Therefore, it is highly desirable to provide a fundamental understanding of the relationships between the local crystal structure in Fe-doped β-Ga2O3 and other electronic properties from different theoretical approaches. Aside from the Fe dopant, intrinsic defects, including vacancies and interstitials, have significant impacts on their physical properties. However, the correlations among the Fe-doped β-Ga2O3 with native defects, the local crystal structure, and the electronic and optical properties have not been extensively studied.
Herein, we performed density functional theory (DFT) calculations to investigate the defect formation energies, charge transitional levels, electronic structures, and optical properties of Fe-doped β-Ga2O3, as well as Fe-doped β-Ga2O3 with different kinds of native defects. Our results address the controversies regarding the preferential Fe incorporation on the tetrahedrally or octahedrally coordinated Ga site, as mentioned above. Moreover, since the absence of relevant reports in Fe-doped β-Ga2O3 lattices with native defects from theoretical studies, the defect formation energies, charge transitional levels, and optical properties of the defective complexes of Fe-doped β-Ga2O3 with different kinds of native defects, i.e., oxygen vacancy (VO), gallium vacancy (VGa), oxygen interstitial (Oi), and gallium interstitial (Gai), are investigated. Our studies are beneficial for understanding the ground state properties of Fe-doped β-Ga2O3, as well as for providing theoretical guidance on the design of β-Ga2O3-based functional materials and the promising applications of β-Ga2O3 for innovative spin-electronic and optoelectronic devices.

2. Calculation Methods

2.1. Computational Details

To implement the first-principles calculations, we use the Vienna ab initio Simulation Package (VASP) [27,28] based on DFT [29] with projected augmented wave (PAW) potentials. To characterize the exchange-correlation interactions, the generalized gradient approximation (GGA) parameterized by Perdew-Burke-Ernzerhof (PBE) [30] is used. The kinetic energy cutoff for the plane-wave basis set is 450 eV, the energy convergence criterion for the calculations is set to 1 × 10⁻⁵ eV/atom for the interactions between the electrons and ions, and all the atomic positions are fully optimized. When all components of the residual forces are less than 0.01 eV/Å, the relaxation will be terminated. A 4 × 4 × 2 Monkhost-Pack grid is utilized for structural relaxation, whereas a 9 × 9 × 4 Monkhost-Pack grid is used for the calculations of density of states (DOS) and optical properties. The so-called density function perturbation (DFPT) calculated method for phonon calculations is adopted in this work. Usually, phonon dispersion is needed to expand the supercell. However, we do not enlarge the supercell in this work considering the time-consuming nature, which may not influence our conclusions qualitatively. A 2 × 4 × 2 Monkhost-Pack grid and a 1 × 10⁻⁶ eV/atom energy criterion have been used for the calculation of phonon dispersion and mechanical properties. The valence electronic configurations for Ga, O, and Fe are [Ar] 3d104s24p1, [He] 2s22p4, and [Ar] 3d74s1, respectively.
A 1 × 2 × 2 β-Ga2O3 supercell of 32 Ga atoms and 48 O atoms is modeled in this study, with one Fe impurity replacing the Ga atom, corresponding to a doping concentration of 3.125%, as shown in Figure 1a. β-Ga2O3 possesses two inequivalent Ga positions. Fe impurity incorporation on the tetrahedrally and octahedrally coordinated Ga sites is labeled 1 and 2, respectively. Different kinds of native defects in terms of oxygen vacancy, gallium vacancy, oxygen interstitial, and gallium interstitial in the β-Ga2O3 supercell are considered, which are denoted as VO, VGa, Oi, and Gai, respectively. For the atomic positions of VO and VGa, we use the results by Dong et al. [31], i.e., the positions of 3 and 4 in Figure 1a, respectively. For the low-energy Oi and Gai doping sites in gallium oxide, we adopt the results given by Zacherle et al. [32], where the two interstitial sites are located at the same position (0.683, 0.500, 0.459) in the supercell before relaxation and labeled as 5 in Figure 1a. For simplicity, Fe impurities replacing tetrahedral and octahedral Ga atoms are named FeGaI and FeGaΠ, respectively. Thus, their complexes of FeGaI with VO, VGa, Oi, and Gai configurations are named FeGaIVO, FeGaIVGa, FeGaIOi, and FeGaIGai, respectively, while complexes of FeGaΠ with VO, VGa, Oi, and Gai configurations are labeled as FeGaΠVO, FeGaΠVGa, FeGaΠOi, and FeGaΠGai, respectively. Besides, we also employ the value of U in accordance with the experimental band gap for the perfect β-Ga2O3 [33], and the U value of 4.09 eV is adopted for the 3d orbital of the Fe dopant as suggested by the literature [34].

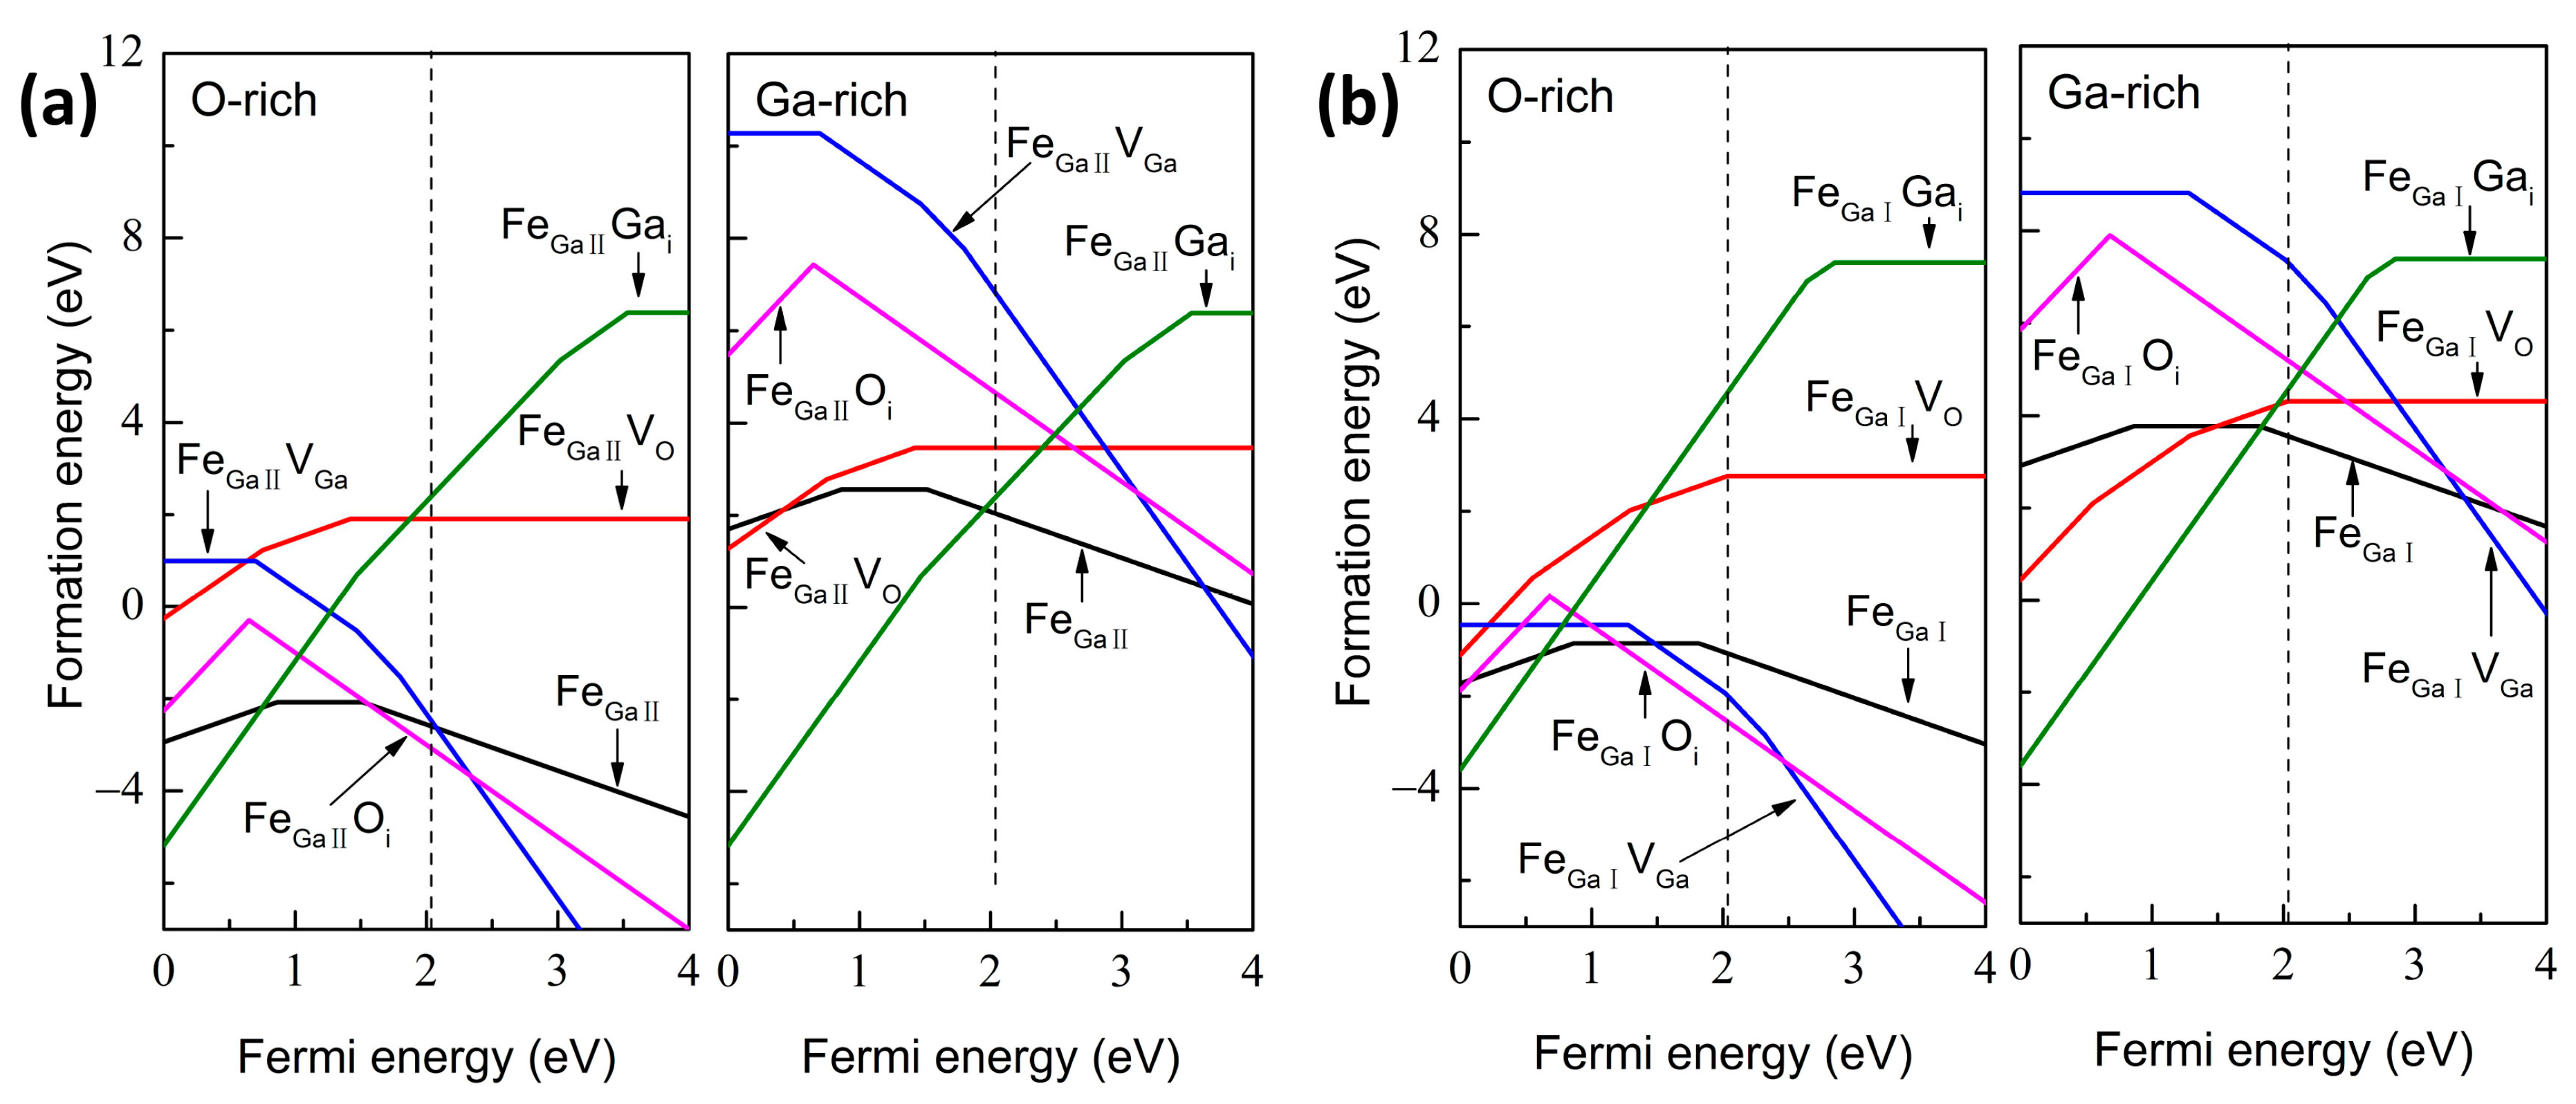
2.2. Formation Energies, Transitional Levels and Optical Calculations

The formation energy of the defect D in the charge state q is calculated as [36,37]
H D , q ( E f , μ ) = [ E D , q E p ] + i n i μ i + q ( E V B M + E f ) + E c o r r
where E D , q and E p denote the total energy of the defect and perfect supercell, respectively. n i represents the number of i atoms added ( n i < 0 ) or removed ( n i > 0 ) from the perfect supercell, and μ i is the corresponding chemical potential. E V B M is energy of the valence band maximum (VBM) for bulk Ga2O3. E f is Fermi level, which is referenced to the VBM in the bulk. E c o r r is the term that accounts for the finite-size corrections, which is determined by the potential alignment and is given as [36]
E c o r r = q ( V D , q r V p r )
where the potential difference between the charged defect Ga2O3 supercell ( V D , q r ) and perfect Ga2O3 supercell ( V p r ) are calculated from the atomic-sphere-averaged potentials at the atomic sites farther away from the defect employed by the software of VASPKIT Standard Edition 1.3.5 [38].
Note that the chemical potential satisfies the boundary conditions as follows:
2 μ G a + 3 μ O = μ G a 2 O 3 ,                 μ G a μ G a M e t a l ,                       μ O 1 2 μ O 2
Chemical potential varies according to different growth conditions. Under O-rich growth condition:
μ O = 1 2 μ O 2 ,                               μ Ga = 1 2 ( μ G a 2 O 3 3 2 μ O 2 )
Under Ga-rich growth condition:
μ G a = μ G a M e t a l ,                               μ O = 1 3 ( μ G a 2 O 3 2 μ G a )
where, μ G a 2 O 3 is the chemical potential of the bulk β-Ga2O3. The chemical potential of μ G a M e t a l and μ Fe are calculated from the energies of the most stable bulk crystal of the Ga and Fe atoms, respectively. μ O represents the chemical potential of O obtained from the energy of O2. The chemical potentials of μ O , μ Ga and μ Fe under O-rich condition are −4.92 eV, −7.55 eV, −8.24 eV, respectively, while the corresponding values are −8.01 eV, −2.90 eV, −8.24 eV for Ga-rich atmosphere.
The transition energy ε ( q 1 / q 2 ) between charge state q1 and q2 for defect D doping configuration is calculated as [39]
ε ( q 1 / q 2 ) = E D q 1 | E f = 0 E D q 2 | E f = 0 q 2 q 1
Here, the E D q | E f = 0 represents the formation energy of the defect D in charge state q evaluated at E f = 0 . The ε ( q 1 / q 2 ) denotes the Fermi-level position where the charge states q1 and q2 have equal formation energy.
The absorption coefficients in optical properties can be described as [31,40]
α ( ω ) = 2 ω ε 1 2 ( ω ) + ε 2 2 ( ω ) ε 1 ( ω )   1 / 2
where ε 1 ( ω ) and ε 2 ( ω ) indicate the real and imaginary parts of the dielectric function, respectively. The ε 2 ( ω ) can be calculated by summing up the transitions between occupied and unoccupied states using the following equation
ε 2 ( ω ) = 4 π 2 e 2 m ω 2 i , j i M j 2 f i ( 1 f i ) × δ ( E j k E i k ω ) d 3 k
Here, m , e , M , and ω denote the mass of free electrons, the electron charge, the dipole matrix, and the frequency of incident photons, respectively. i , j , f i , and k represent the initial state, the final state, the Fermi distribution function, and the wave function vector, respectively. The ε 2 ( ω ) is related to the absorption of light and dielectric loss of energy, while ε 1 ( ω ) is associated with the stored energy.
The energy loss function (ELF) can be described by the following equation [41]
L ( ω ) = Im [ 1 ε ( ω ) ] = ε 2 ( ω ) ε 1 2 ( ω ) + ε 2 2 ( ω )

3. Results and Discussions

3.1. Structural Stability

The calculated lattice parameters of perfect β-Ga2O3 are a = 12.412 Å, b = 3.076 Å, c = 5.872 Å, and the unique angle β = 103.702°, which are in excellent accordance with the theoretically calculated values obtained by PBE [41] and B3PW [42] approaches, as well as with the experimental values [43], as shown in Table 1. The optimized structural parameters for the Fe-doped cases are also summarized in Table 1. The lattice constants of Fe-doped β-Ga2O3 exhibit a slight decrease, which can be ascribed to the comparable ionic radii and local structures between Fe and Ga atoms. The relative difference of the radii between Fe3+ (Fe2+) and Ga3+ ions is −1.61% (−11.3%). FeGaΠ is endowed with smaller lattice parameter variations in terms of all three lattice vectors and the unique angle β compared with FeGaI, implying that small distortions may be easily formed in the experimental growth.
To study the structural stability of Fe-doped β-Ga2O3 supercells, the defect formation energies under different conditions are calculated, as shown in Figure 2. Meanwhile, the transition levels are also employed to assess the ionization energies and the effectiveness of the doped systems. Our calculated value of the band gap for perfect β-Ga2O3 is 2.04 eV, as denoted by the dashed line in Figure 1b, which is consistent with the values obtained by the DFT calculated method but smaller than the experimental values [44]. The underestimated band gap for DFT calculation is a common phenomenon; however, it does not affect our conclusions qualitatively [45,46]. In addition, Figure 1c illustrates the calculated total density of states (TDOS) and partial density of states (PDOS) for perfect β-Ga2O3; the VBM is predominantly composed of O 2p orbital-derived states with minor hybridization with Ga 3d and 4p orbitals, while the CBM is mainly formed by Ga 4s orbitals.
Figure 2a indicates the formation energies for Fe-doped β-Ga2O3 under O-rich conditions. FeGaΠ case has lower formation energy, suggesting the preferential occupation of FeGa at the octahedrally coordinated Ga site, which is in agreement with Ingebrigtsen’s conclusion by theoretical calculation [25] and other experimental results [19,20]. The thermodynamic transition level Fe3+/Fe2+ for FeGaΠ, i.e., ε(0/−), is located at 0.52 eV below CBM, which is comparable to the theoretical value calculated by HSE hybrid functions (0.61 eV or 0.40 eV [25]), but slightly smaller than the reported experimental values (0.78 eV [25], 0.80 eV [26], 0.84 eV [17], 1.2 eV [22]). The transition level Fe3+/Fe2+ for FeGaI measured from VBM is 0.24 eV below CBM, thus deep acceptors are expected for both Fe-doped β-Ga2O3 configurations in the n-type β-Ga2O3 conditions, which can compensate for the free electrons caused by native defects or extrinsic impurities. In addition, the transition level ε(+/0) for both FeGaI and FeGaΠ is 0.86 eV above the VBM, which demonstrates that both doping cases generate deep donors even in the p-type β-Ga2O3 crystals. For the Ga-rich condition, i.e., the O-poor condition, as shown in Figure 2b, the tendency is the same as for the O-rich atmosphere, with the exception of higher formation energies. This suggests that Fe impurity is more easily substituted for Ga sites under O-rich conditions.
The mechanical characteristics of β-Ga2O3 are evaluated by employing a complete set of elastic constants. There are thirteen independent elastic constants (C11, C22, C33, C44, C55, C66, C12, C13, C23, C15, C25, C35, and C46) in the monoclinic symmetry crystal. The mechanical stability criteria of β-Ga2O3 are described as follows [47]:
C i i > 0 ,       i = 1 6 .
[ C 11 + C 22 + C 33 + 2 ( C 12 + C 13 + C 23 ) ] > 0
( C 33 C 55 C 35 2 ) > 0
( C 44 C 66 C 46 2 ) > 0
( C 22 + C 33 2 C 23 ) > 0
[ C 22 ( C 33 C 55 C 35 2 ) + 2 C 23 C 25 C 35 C 23 2 C 55 C 25 2 C 33 ] > 0
Ω = 2 [ C 15 C 25 ( C 33 C 12 C 13 C 23 ) + C 15 C 35 ( C 22 C 13 C 12 C 23 ) + C 25 C 35 ( C 11 C 23 C 12 C 13 ) ] [ C 15 2 ( C 22 C 33 C 23 2 ) + C 25 2 ( C 11 C 33 C 13 2 ) + C 35 2 ( C 11 C 22 C 12 2 ) ] + C 55 g > 0
g = C 11 C 22 C 33 C 11 C 23 2 C 22 C 13 2 C 33 C 12 2 + 2 C 12 C 13 C 23
In this study, the mechanical property calculations are carried out for the perfect and energetically favorable FeGaΠ doping configuration. The calculated elastic stiffness constants of prefect and Fe-doped β-Ga2O3 are shown in Table 2. For comparisons, available theoretical and experimental results are also listed. The elastic stiffness of prefect and Fe-doped β-Ga2O3 meets the mechanical stability criteria presented above, suggesting that prefect and Fe-doped β-Ga2O3 are mechanically stable at ambient conditions.
The formation energies as a function of the biaxial strain with q = 0 under O-rich conditions are shown in Figure 3a to assess the mechanical stability of FeGaΠ as well. It can be seen that the unstrained FeGaΠ is endowed with the smallest formation energy of −2.07 eV, indicating the FeGaΠ structure is in a stable state. Moreover, the formation energies are strongly dependent on the biaxial strain. As the tensile or compressive stress increases, it increases dramatically. When the compressive strain is greater than 2% or the tensile strain is higher than 3%, the defect formation energy is greater than 0, denoting that it may be difficult to materialize in the experiment. The defect formation energy increases more rapidly under compressive strain, which indicates that the defect is more difficult to realize under compressive strain.
Phonon analysis has proven to be an effective approach to predicting structural stability [51]. The phonon dispersion calculation for FeGaΠ doping structure is shown in Figure 3b. We observe three small imaginary frequencies, i.e., 0.64, 0.78, and 1.10 cm−1, locating at the non-gamma point (G). In general, imaginary frequencies at the gamma point can be related to structural instability, whereas the presence of imaginary frequencies at the non-gamma point can be responsible for the finite size of the simulation crystal cell, which can be eliminated by expanding the calculated supercell. Therefore, the Fe-doped β-Ga2O3 with small imaginary frequencies at the non-gamma point is predicted to be structurally stable, which agrees well with the results as suggested by the low formation energies.
Figure 4a shows the complexes of FeGaΠ and FeGaI with native defects under different growth condition limits. For these defective FeGaΠ complexes under O-rich conditions, positively charged FeGaΠGai and negatively charged FeGaΠOi are energetically favorable when the Ef approaches the VBM and CBM, respectively, while positively charged FeGaΠGai is expected throughout the whole band gap under Ga-rich condition. Moreover, the formation energies of FeGaΠGai (Ga-rich condition) and FeGaΠOi (O-rich condition) are lower compared with those of FeGaΠ case, suggesting that FeGaΠGai and FeGaΠOi complexes are easily formed under Ga-rich and O-rich conditions during experimental growth, respectively. For the FeGaΠVO case, under O-rich conditions, the transition levels ε(+2/+1) and ε(+1/0) are 1.29 and 0.62 eV below CBM, respectively, indicating that the complex acts as a deep donor and cannot contribute to n-type conductivity. Different from the intrinsic Vo defect investigated in literature [10], we observe the +1 charge state rather than +2 and 0 charge states, which may be attributed to the combination of −1 charge state Fe dopant and +2 charge state VO. The similar results are inspected under Ga-rich conditions except for the lower formation energies, suggesting the FeGaΠVO complex is easily formed in the O-poor growth atmosphere. For the FeGaΠVGa case, the transition levels ε(0/−2), ε(−2/−3) and ε(−3/−4) are located at 1.34, 0.57, and 2.04 eV below CBM, which demonstrate that the complexes act as deep acceptors with −4 or −3 charge state, respectively. Compared with the Ga-rich condition, the FeGaΠVGa complex possesses lower formation energies in n-type Ga2O3 materials, which demonstrates that the VGa is more likely produced in Fe-doped Ga2O3 under an O-rich growth atmosphere in experiments. It is in excellent agreement with the reported experimental result by Hany et al. [24]. Either under O-rich or Ga-rich conditions, positively charged and negatively charged FeGaΠOi is energetically favorable when the Fermi level approaches the VBM and CBM, respectively. Moreover, FeGaΠOi complex is more susceptible to being produced under O-rich conditions. For the FeGaΠGai case, both under O-rich and Ga-rich conditions, positively charged are energetically favorable when the Ef is located throughout the whole band gap, which demonstrates that the complex exhibits n-type conductivity. The transition levels ε(+4/+3) and ε(+3/+2) are 1.47 and 3.02 eV above the VBM under O-rich condition and Ga-rich condition, which indicates that the +3 charge state for the FeGaΠGai complex is expected. In addition, the higher formation energies under the O-rich condition for the FeGaΠGai illustrate that the complex is more likely to be found under the Ga-rich conditions. It is worth mentioning that the Gai is the main origin of the native defect to form the n-type conductive β-Ga2O3 crystal, as illustrated in Refs. [8,9], while a low formation energy is gained for the FeGaΠGai complex. The Ef always tends to be positioned at the higher region of the bandgap in β-Ga2O3 and gives rise to the n-type conduction characteristic due to unintentionally introduced native defects during the growth of β-Ga2O3. Therefore, our calculated results illustrate that the +3 charge state FeGaΠGai under O-poor condition and −2 charge state FeGaΠOi under O-rich condition are easily formed for the growth of β-Ga2O3 crystals.
Figure 4b shows the defect formation energies for the complexes of FeGaI with native defects. Different from the case of FeGaΠ complexes, under O-rich conditions, +4 charge state FeGaIGai and −2 charge state FeGaIOi are dominated when the Ef is located near the VBM and CBM, respectively, while −4 charge state FeGaIGai is easily generated throughout the whole band gap under Ga-rich conditions. Thus, different local structures can influence the electron transfer. As shown in Figure 4b, these defective complexes are characterized by similar tendencies with those of FeGaΠ complexes in exception for different formation energies both under O-rich and Ga-rich conditions.

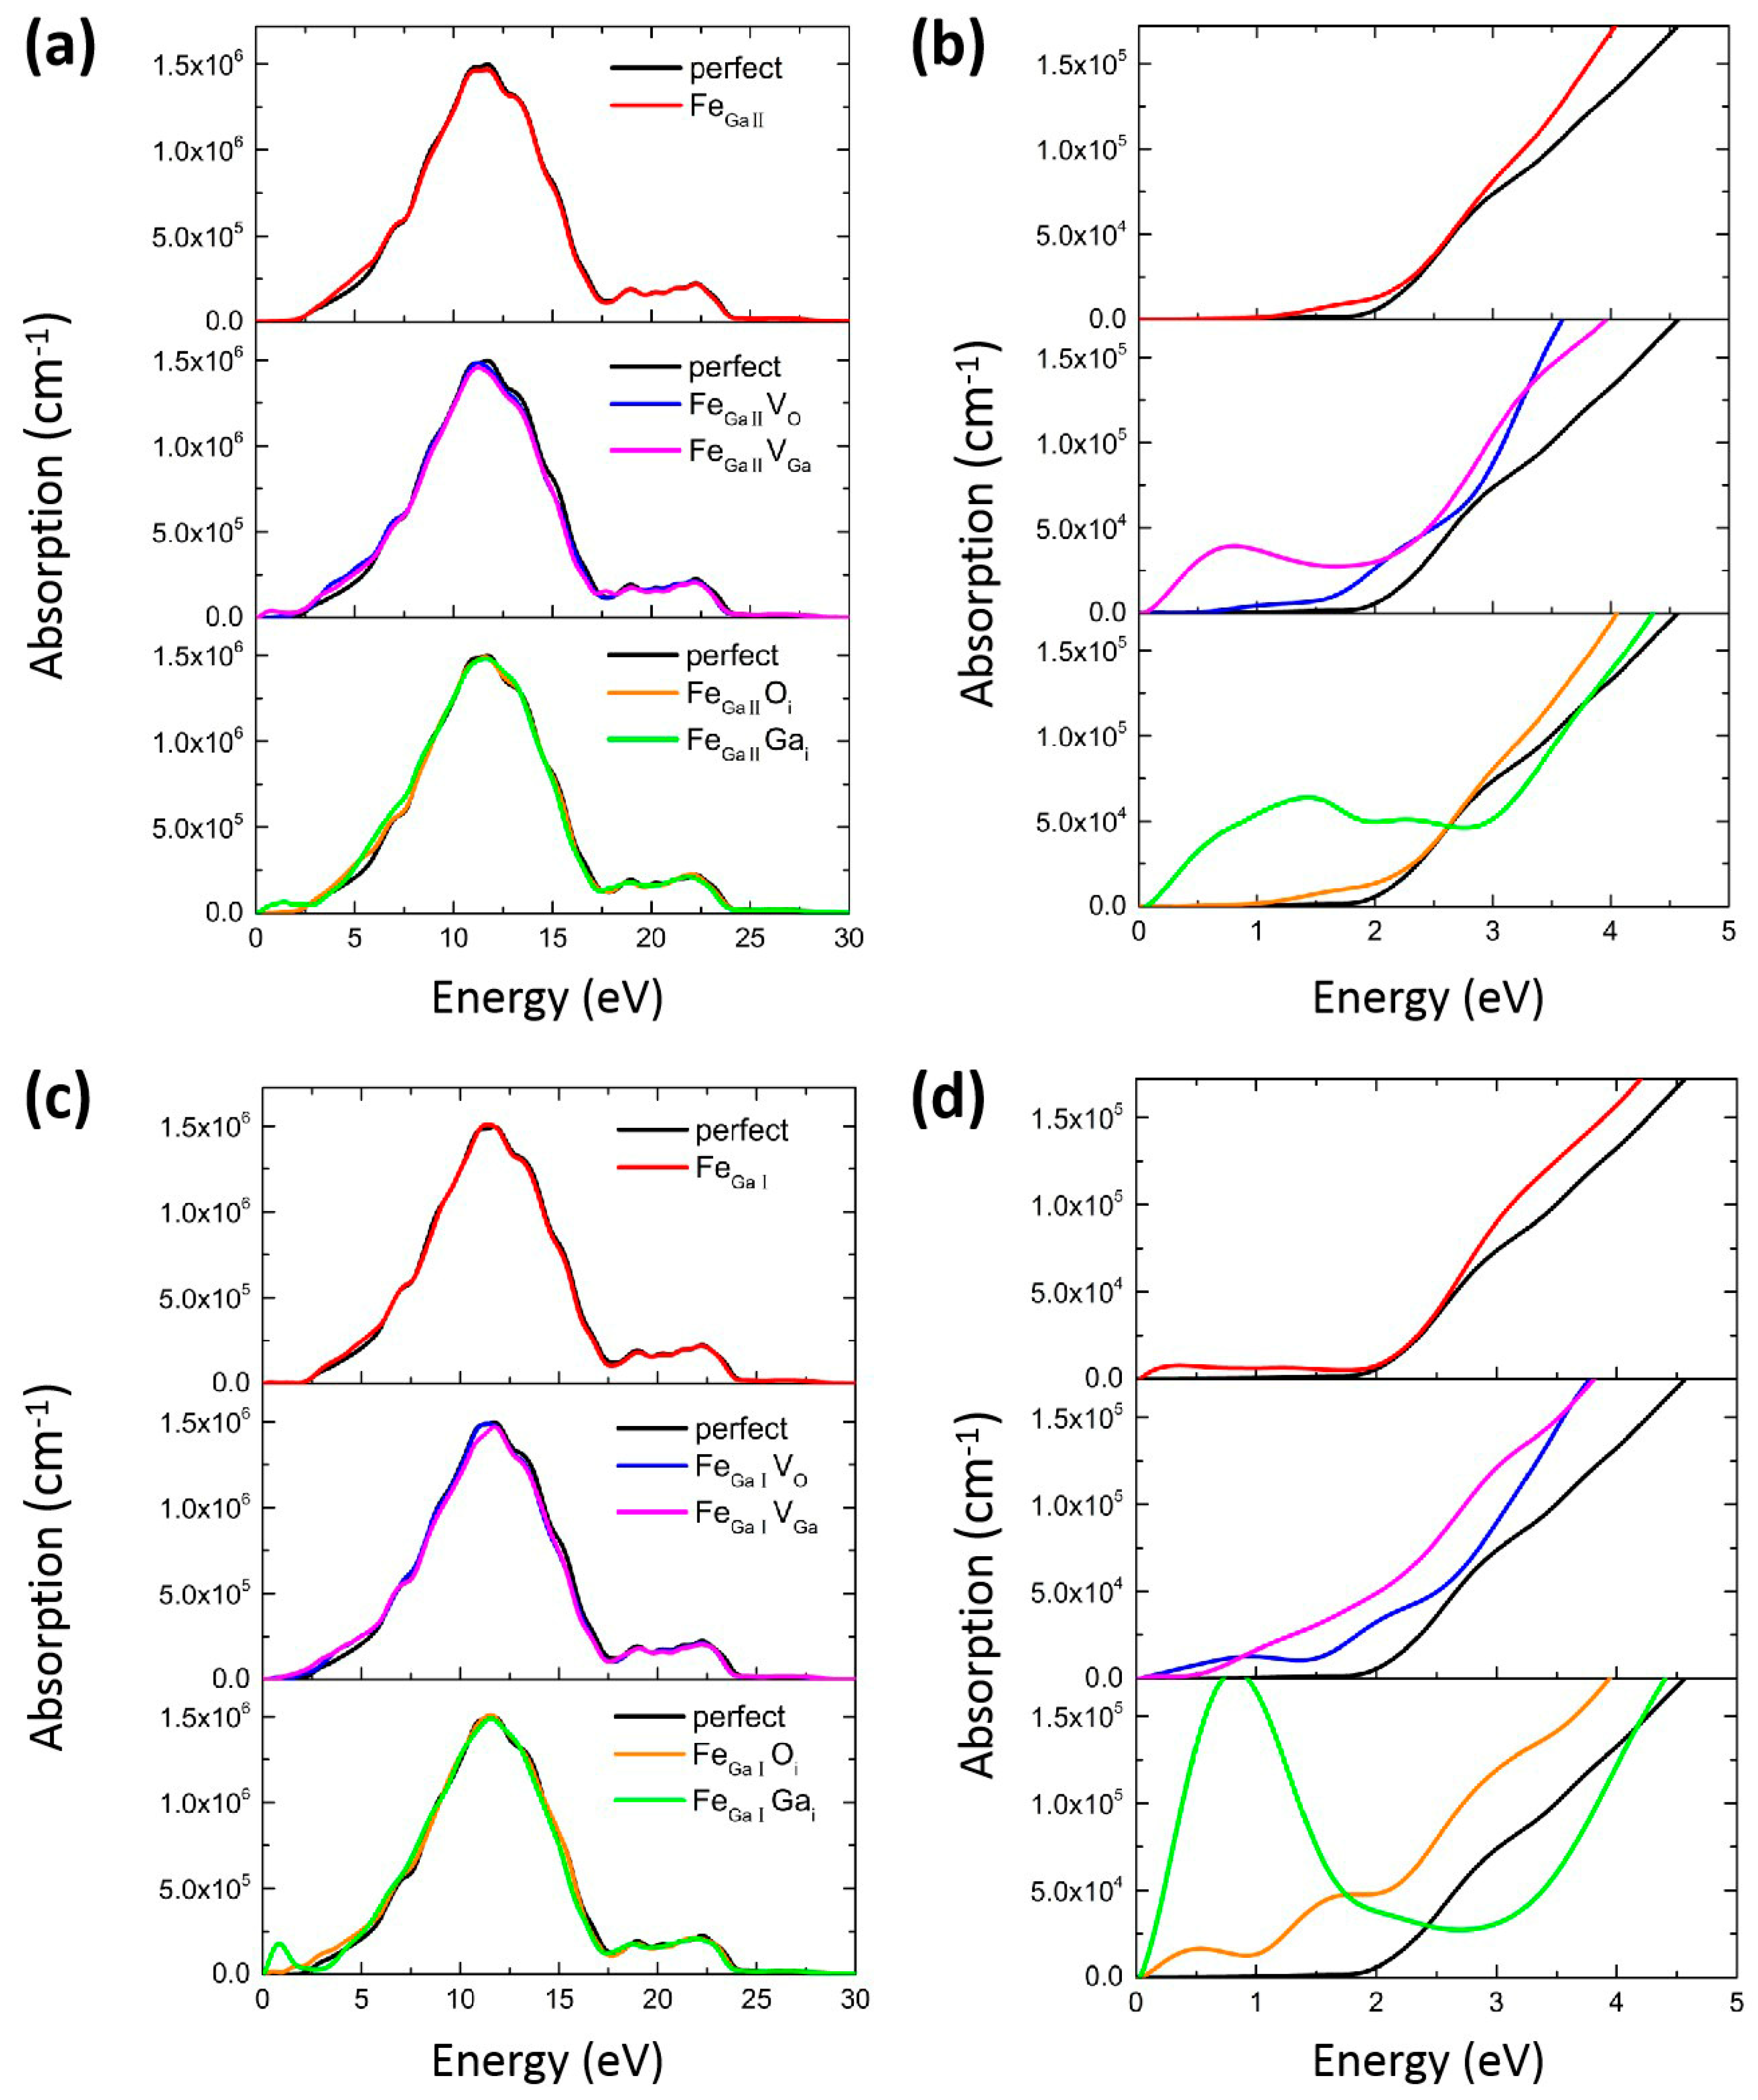
3.2. Optical Property
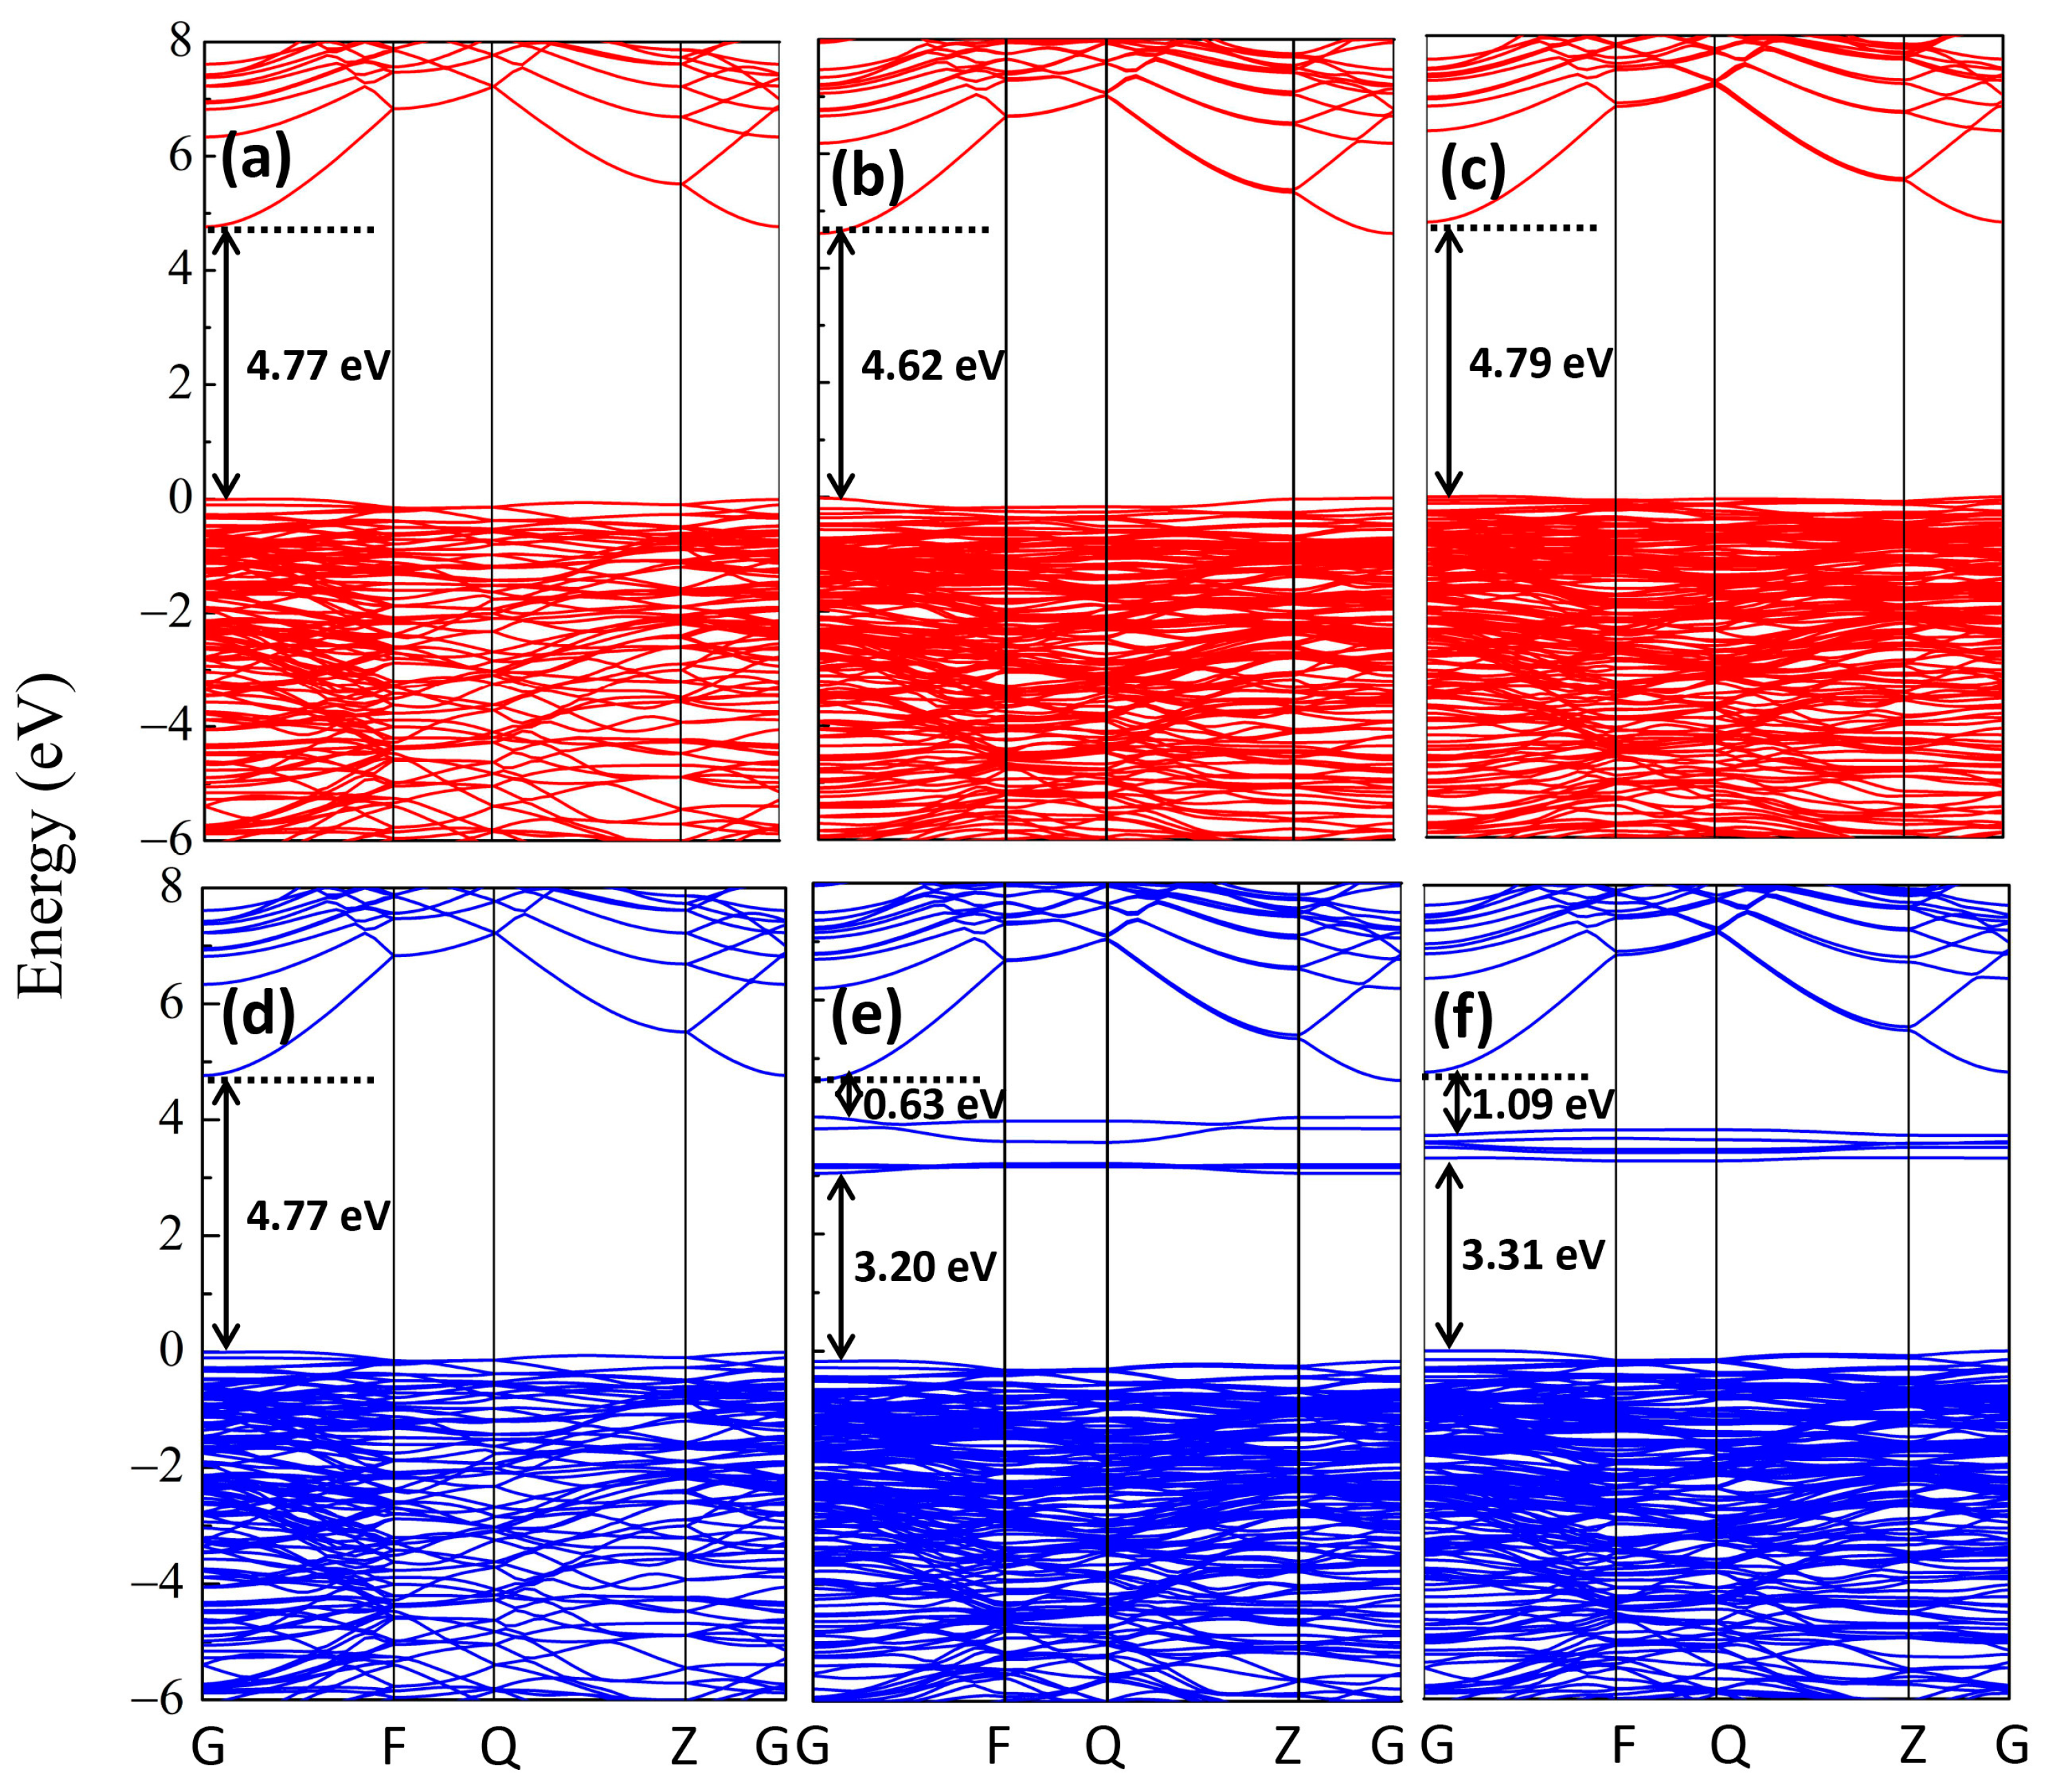
For wide-band gap semiconductor materials, optical parameters of dielectric function ε ( ω ) can be employed to clarify the linear response of the system to electromagnetic radiation, which is crucial to assessing the interactions between photons and electrons. The imaginary part ε 2 ( ω ) of the dielectric constant is related to the absorption of light and the dielectric energy-loss function, while ε 1 ( ω ) is associated with the stored energy. Figure 5 denotes the optical absorption coefficient of perfect, Fe-doped, and various FeGaΠ/FeGaI complexes in the energy range between 0 and 30 eV. Figure 5b,d exhibits the enlarged plots at the (0–5) eV region. The strong absorption peaks are located at 11.8 and 10.9 eV for perfect β-Ga2O3, as shown in Figure 5a, which originate from the inter-band transitions from O 2p states to Ga 4s states, illustrating that the bulk material is characterized by its deep ultraviolet properties. The calculated data is consistent with Yan and Pan’s results [52,53]. Compared with perfect β-Ga2O3, the profiles of Fe-doped β-Ga2O3 and various complexes in Figure 5a,c are endowed with similar absorption peaks in the high-energy ultraviolet region, indicating that these dopants can hardly decrease the optical absorption coefficients of β-Ga2O3 in the deep ultraviolet region. The slightly red shift for FeGaΠVGa, FeGaIVGa, FeGaΠOi, and FeGaIOi can be ascribed to hole doping, while the blue shift for the FeGaΠGai, FeGaIGai cases can be associated with the introduction of electrons, which is consistent with our formation energy calculations above. In addition, one can obviously notice that new peaks appear in the low-energy region for these FeGaΠ/FeGaI complexes, as shown in the amplified plots shown in Figure 5b,d.
The perfect β-Ga2O3 possesses an optical band gap of about 2 eV, which is in good agreement with the value observed from electronic structure calculations in Figure 1b. For the FeGaΠ and FeGaI cases, the optical absorption spectra remain almost unchanged in the visible region, which can be associated with the deep acceptor doping for the Fe foreigner atom. When introducing extra VO into the β-Ga2O3 crystal, the absorption coefficients become relatively low for both FeGaΠVO and FeGaIVO cases in the low-energy region (0–5 eV), whereas a new wide peak for FeGaΠVGa configuration is generated, leading to the optical migration from the ultraviolet light region to the visible-infrared region. The new peak for FeGaΠVGa configuration originated from the inter-band transitions of O 2p from the VBM to the induced impurity levels. Similarly, a new peak appears at a high energy level of ~1.42 eV and ~0.84 eV for FeGaΠGai and FeGaIGai complexes, respectively, which are originated by the transitions from impurity levels to Ga 4s orbitals. These new peaks are expected to benefit the optical transformation from ultraviolet light to the visible-infrared region. In the low-energy region in Figure 5b,d, the FeGaΠOi case exhibits the absence of a clear optical absorption peak, while a few small oscillation peaks are present for the FeGaIOi combination. Therefore, FeGaΠGai, FeGaIGai, and FeGaΠVGa complexes can significantly enhance the optical absorption in the visible-infrared region.
The energy-loss function (ELF) is calculated based on Equation (9) from the dynamic dielectric constant at small scattering angles, which can determine the energy loss of free electrons across the material. This ELF function allows a direct comparison between theoretical conclusions and experimental spectroscopy measurements such as EELS [54]. Figure 6 shows the ELF spectra for FeGaΠ and FeGaI complexes. The major peak for perfect β-Ga2O3 is located at 16.7 eV. The peak positions remain at the same locations for FeGaΠ and FeGaI, while accompanying with higher ELF value. This indicates that the induced Fe dopant tends to increase its energy loss and decreases its emission of peak energy efficiency under the high energy region in the material. The changes in the primary peaks for these FeGaΠ and FeGaI complexes are also minor, showing that the energy loss in the β-Ga2O3 material is almost negligible after the extra introduction of various native defects. Additionally, a seemingly little peak develops in the low-energy region for the FeGaIGai case, which may be attributed to the optical absorption peak of ~0.84 eV in Figure 5d.

3.3. GGA + U

We further carried out the GGA + U calculations to gain insight into the influences on the electronic structure of Fe-doped β-Ga2O3, considering the strong electron-electron interactions. GGA + U calculations are usually applied to deal with strong correlations in localized d- or f- electron systems and thus partially solve the band gap underestimation. We employ the values of U in the literature to accord with the experimental band-gap for the perfect β-Ga2O3 [33]. Besides, the U value of 4.09 eV has been chosen for the 3d orbital of the Fe dopant based on the literature [34].
The GGA + U calculated spin-up and spin-down band structures of the perfect β-Ga2O3 configuration are shown in Figure 7a,d. The perfect β-Ga2O3 is endowed with a band gap of 4.77 eV accompanied by a direct semiconductor structure, which is in good agreement with the experimental band-gap value of 4.78 eV [55]. The much flat valence bands illustrate a large effective mass and low mobility, which prevent the formation of p-type β-Ga2O3. The main orbital compositions of the VBM and CBM are consistent with those from GGA calculations, as mentioned before. Figure 7b,c,e,f show the spin-up and spin-down band structures of FeGaΠ and FeGaI structures, respectively, where the Fe impurity bands of 3d characters are located above the Ef near CBM. The FeGaΠ and FeGaI exhibit semiconductor ferromagnetic ground states. The magnetic moment mainly originates from the uncompensated spin-down orbitals of Fe impurities, where no extra band has been observed in the spin-up channel. In the spin-down channel, several isolated bands originated from Fe 3d orbitals are located above the Ef, which exhibit deep acceptor levels and give rise to a magnetic moment of 5 μB. The induced deep acceptor levels of Fe 3d orbitals are 0.63 eV lower than the CBM and 3.20 eV higher than the VBM in the FeGaΠ structure. For the FeGaI configuration, in the spin-down channel, several isolated bands originated from Fe 3d orbitals are located at 3.31 eV, 3.49 eV, 3.57 eV, 3.59 eV, and 3.70 eV above the Ef. The induced deep acceptor levels of Fe 3d orbitals are 1.09 eV lower than the CBM. The larger values below CBM compared with these of GGA calculations can be attributed to the more localized Ga and Fe 3d orbitals under GGA + U calculations, which are reasonable compared with the experimentally measured results, i.e., the EPR results of 0.84 eV observed from Polyakov et al. [26] and 1.2 eV from Bhandari et al. [22].

3.4. Conclusions

Based on first-principle DFT calculations with the GGA approach, we illustrate that Fe dopant is energetically favored for the octahedrally coordinated Ga site in Fe-doped Ga2O3 material. The controversy regarding the preferential Fe incorporation on the Ga site in the β-Ga2O3 crystal has been addressed; our result demonstrates that Fe dopant is energetically favored for the octahedrally coordinated Ga site, while analyses based on phonon dispersion mechanical characteristics, strain-dependent analyses, and formation energies are used to confirm the structural stability. Moreover, Fe impurities are more easily substituted for Ga sites under O-rich conditions. Our calculated results illustrate that the +3 charge state FeGaΠGai under O-poor conditions and −2 charge state FeGaΠOi under O-rich conditions are easily formed for the growth of β-Ga2O3 crystals. The formation energy calculations predict that the VGa and Oi in Fe-doped Ga2O3 are more likely to be formed under an O-rich growth environment. When the Ef approaches the valence and conduction band edges, the +3 charge state FeGaGai and −2 charge state FeGaOi are energetically advantageous, respectively. Moreover, VO and Gai are expected under Ga-rich conditions with the preferred −4 charge sate FeGaGai complex throughout the whole band gap. FeGaΠGai, FeGaIGai, and FeGaΠVGa complexes can significantly enhance the optical absorption in the visible-infrared region. The changes in the primary peaks for these FeGaΠ and FeGaI complexes are all minor, showing that the energy loss in the β-Ga2O3 material is almost negligible after the introduction of various native defects. The GGA + U calculations show that the induced deep acceptor levels of Fe 3d orbitals are 0.63 eV and 1.09 eV lower than the CBM for FeGaΠ and FeGaI configurations, respectively, which are reasonable compared with the experimentally measured results, i.e., the EPR results of 0.84 eV observed from Polyakov et al. [26] and 1.2 eV from Bhandari et al. [22].

Author Contributions

H.Z. performed the calculations; H.Z. and M.W. supervised the project; H.Z. and M.W. conducted intensive data analysis and discussions; Q.L. provided support of methodology and software; H.Z. and M.W. reviewed the research results; H.Z. prepared the draft manuscript; M.W., H.G., Y.W., H.X., M.C. and Q.L. helped with the revision of the manuscript. All authors have read and agreed to the published version of the manuscript.

Funding

This project was funded by talent research project for Hunan University of Science and Engineering (Grant No. 11102515006), Scientific Research Projects of Hunan Provincial Department of Public Education (Grant No. 21C0701), Fundamental Research Funds for Central Universities (Grant No. 20720210018), and the National Natural Science Foundation of China (Grant No. 11704317).

Institutional Review Board Statement

Not applicable.

Informed Consent Statement

Not applicable.

Data Availability Statement

No new data were created or analyzed in this study. Data sharing is not applicable to this article.

Conflicts of Interest

The authors declare no conflict of interest.

References

  1. Tang, R.; Li, G.; Li, C.; Li, J.; Zhang, Y.; Huang, K.; Ye, J.; Li, C.; Kang, J.Y.; Zhang, R.; et al. Localized surface plasmon enhanced Ga2O3 solar blind photodetectors. Opt. Express 2020, 28, 5731–5740. [Google Scholar] [CrossRef] [PubMed]
  2. Jiang, Z.X.; Wu, Z.Y.; Ma, C.C.; Deng, J.N.; Zhang, H.; Xu, Y.; Ye, J.D.; Fang, Z.L.; Zhang, G.Q.; Kang, J.Y.; et al. P-type β-Ga2O3 metal-semiconductor-metal solar-blind photodetectors with extremely high responsivity and gain-bandwidth product. Mater. Today Phys. 2020, 14, 100226. [Google Scholar] [CrossRef]
  3. Tadjer, M.J. Toward gallium oxide power electronics. Science 2022, 378, 724–725. [Google Scholar] [CrossRef] [PubMed]
  4. Zhang, J.; Dong, P.; Dang, K.; Zhang, Y.; Yan, Q.; Xiang, H.; Su, J.; Liu, Z.; Si, M.; Gao, J.; et al. Ultra-wide bandgap semiconductor Ga2O3 power diodes. Nat. Commun. 2022, 13, 3900. [Google Scholar] [CrossRef] [PubMed]
  5. Harada, T.; Ito, S.; Tsukazaki, A. Electric dipole effect in PdCoO2/β-Ga2O3 Schottky diodes for high-temperature operation. Sci. Adv. 2019, 5, eaax5733. [Google Scholar] [CrossRef]
  6. Harada, T.; Tsukazaki, A. Dynamic characteristics of PdCoO2/β-Ga2O3 Schottky junctions. Appl. Phys. Lett. 2020, 116, 232104. [Google Scholar] [CrossRef]
  7. Pang, R.; Teramura, K.; Morishita, M.; Asakura, H.; Hosokawa, S.; Tanaka, T. Enhanced CO evolution for photocatalytic conversion of CO2 by H2O over Ca modified Ga2O3. Commun. Chem. 2020, 3, 137. [Google Scholar] [CrossRef]
  8. Kyrtsos, A.; Matsubara, M.; Bellotti, E. Migration mechanisms and diffusion barriers of vacancies in Ga2O3. Phys. Rev. B 2017, 95, 245202. [Google Scholar] [CrossRef]
  9. Deák, P.; Ho, Q.D.; Seemann, F.; Aradi, B.; Lorke, M.; Frauenheim, T. Choosing the correct hybrid for defect calculations: A case study on intrinsic carrier trapping in β-Ga2O3. Phys. Rev. B 2017, 95, 075208. [Google Scholar] [CrossRef]
  10. Varley, J.B.; Weber, J.R.; Janotti, A.; Van de Walle, C.G. Oxygen vacancies and donor impurities in β-Ga2O3. Appl. Phys. Lett. 2010, 97, 142106. [Google Scholar] [CrossRef]
  11. Jiang, Q.; Meng, J.; Shi, Y.; Yin, Z.; Chen, J.; Zhang, J.; Wu, J.; Zhang, X. Electrical and optical properties of hydrogen plasma treated β-Ga2O3 thin films. J. Semicond. 2022, 43, 092802. [Google Scholar] [CrossRef]
  12. Simon, J.; Protasenko, V.; Lian, C.; Xing, H.; Jena, D. Polarization-Induced Hole Doping in Wide-Band-Gap Uniaxial Semiconductor Heterostructures. Science 2010, 327, 60–64. [Google Scholar] [CrossRef] [PubMed]
  13. Werner, P.; Casula, M.; Miyake, T.; Aryasetiawan, F.; Millis, A.J.; Biermann, S. Satellites and large doping and temperature dependence of electronic properties in hole-doped BaFe2As2. Nat. Phys. 2012, 8, 331–337. [Google Scholar] [CrossRef]
  14. Zeng, H.; Wu, M.; Wang, H.Q.; Zheng, J.C.; Kang, J.Y. Tuning the Magnetism in Boron-Doped Strontium Titanate. Materials 2020, 13, 5686. [Google Scholar] [CrossRef] [PubMed]
  15. Euvrard, J.; Yan, Y.; Mitzi, D.B. Electrical doping in halide perovskites. Nat. Rev. Mater. 2021, 6, 531–549. [Google Scholar] [CrossRef]
  16. Zeng, H.; Wu, M.; Wang, H.Q.; Zheng, J.C.; Kang, J.Y. Tuning the magnetic and electronic properties of strontium titanate by carbon doping. Front. Phys. 2021, 16, 43501. [Google Scholar] [CrossRef]
  17. Lenyk, C.A.; Gustafson, T.D.; Halliburton, L.E.; Giles, N.C. Deep donors and acceptors in β-Ga2O3 crystals Determination of the Fe2+/3+ level by a noncontact method. J. Appl. Phys. 2019, 126, 245701. [Google Scholar] [CrossRef]
  18. Gunsser, W.; Rohwer, K. Determination of the correlation between the crystal field axis system and the crystallographic axes in chromium-doped β-Ga2O3 by EPR. Phys. Status Solidi B 1983, 116, 275–278. [Google Scholar] [CrossRef]
  19. Zhang, N.; Liu, H.; Sai, Q.; Shao, C.; Xia, C.; Wan, L.; Feng, Z.C.; Mohamed, H.F. Structural and electronic characteristics of Fe-doped β-Ga2O3 single crystals and the annealing effects. J. Mater. Sci. 2021, 56, 13178–13189. [Google Scholar] [CrossRef]
  20. Tbooster, J.M.; Dymanus, A. Mossbauer Mössbauer effect in Ga2-xFexO3 and related compounds. Phys. Status Solidi B 1967, 24, 487–499. [Google Scholar] [CrossRef]
  21. Büscher, R.; Lehmann, G. Correlation of zero-field splittings and site distortions. IX. Fe3+ and Cr3+ in β-Ga2O3. Z. Naturforsch. A 1987, 42, 67–71. [Google Scholar] [CrossRef]
  22. Bhandari, S.; Zvanut, M.E.; Varley, J.B. Optical absorption of Fe in doped Ga2O3. J. Appl. Phys. 2019, 126, 165703. [Google Scholar] [CrossRef]
  23. Zhou, L.; Chen, L.; Ruan, J.; Lu, X.; Liu, B.; Gao, R.; Li, Y.; Geng, L.; Ouyang, X. Pulsed X-ray detector based on Fe doped β-Ga2O3 single crystal. J. Phys. D Appl. Phys. 2021, 54, 274001. [Google Scholar] [CrossRef]
  24. Hany, I.; Yang, G.; Zhou, C.E.; Sun, C.; Gundogdu, K.; Seyitliyev, D.; Danilov, E.O.; Castellano, F.N.; Sun, D.; Vetter, E. Low temperature cathodoluminescence study of Fe-doped β-Ga2O3. Mater. Lett. 2019, 257, 126744. [Google Scholar] [CrossRef]
  25. Ingebrigtsen, M.E.; Varley, J.B.; Kuznetsov, A.Y.; Svensson, B.G.; Alfieri, G.; Mihaila, A.; Badstübner, U.; Vines, L. Iron and intrinsic deep level states in Ga2O3. Appl. Phys. Lett. 2018, 112, 04210. [Google Scholar] [CrossRef]
  26. Polyakov, A.Y.; Smirnov, N.B.; Schemerov, I.V.; Chernykh, A.V.; Yakimov, E.B.; Kochkova, A.I.; Tereshchenko, A.N.; Pearton, S.J. Electrical Properties, Deep Levels and Luminescence Related to Fe in Bulk Semi-Insulating β-Ga2O3 Doped with Fe. ECS J. Solid State Sci. Technol. 2019, 8, Q3091–Q3096. [Google Scholar] [CrossRef]
  27. Kresse, G.; Furthmuller, J. Efficiency of ab-initio total energy calculations for metals and semiconductors using a plane-wave basis set. Comp. Mater. Sci. 1996, 6, 15–50. [Google Scholar] [CrossRef]
  28. Kresse, G.; Furthmuller, J. Efficient iterative schemes for ab initio total-energy calculations using a plane-wave basis set. Phys. Rev. B 1996, 54, 169–186. [Google Scholar] [CrossRef]
  29. Kohn, W.; Sham, L.J. Self-Consistent Equations Including Exchange and Correlation Effects. Phys. Rev. 1965, 140, A1133–A1138. [Google Scholar] [CrossRef]
  30. Perdew, J.P.; Burke, K.; Ernzerhof, M. Generalized Gradient Approximation Made Simple. Phys. Rev. Lett. 1996, 77, 3865–3868. [Google Scholar] [CrossRef]
  31. Dong, L.; Jia, R.; Li, C.; Xin, B.; Zhang, Y. Ab initio study of N-doped β-Ga2O3 with intrinsic defects: The structural, electronic and optical properties. J. Alloys Compd. 2017, 712, 379–385. [Google Scholar] [CrossRef]
  32. Zacherle, T.; Schmidt, P.C.; Martin, M. Ab initio calculations on the defect structure of β-Ga2O3. Phys. Rev. B 2013, 87, 235206. [Google Scholar] [CrossRef]
  33. Dong, L.; Jia, R.; Xin, B.; Peng, B.; Zhang, Y. Effects of oxygen vacancies on the structural and optical properties of β-Ga2O3. Sci. Rep. 2017, 7, 40160. [Google Scholar] [CrossRef] [PubMed]
  34. Muratahan, A.; Wolverton, C. Local environment dependent GGA + Umethod for accurate thermochemistry of transition metal compounds. Phys. Rev. B 2014, 90, 115105. [Google Scholar]
  35. Momma, K.; Izumi, F. VESTA 3 for three-dimensional visualization of crystal, volumetric and morphology data. J. Appl. Cryst. 2011, 4, 1272–1276. [Google Scholar] [CrossRef]
  36. Goyal, A.; Gorai, P.; Peng, H.; Lany, S.; Stevanović, V. A computational framework for automation of point defect calculations. Comput. Mater. Sci. 2017, 130, 1–9. [Google Scholar] [CrossRef]
  37. Kobayashi, T.; Gake, T.; Kumagai, Y.; Oba, F.; Matsushita, Y.-I. Energetics and electronic structure of native point defects in α-Ga2O3. Appl. Phys. Express 2019, 12, 091001. [Google Scholar] [CrossRef]
  38. Wang, V.; Xu, N.; Liu, J.-C.; Tang, G.; Geng, W.-T. VASPKIT: A user-friendly interface facilitating high-throughput computing and analysis using VASP code. Comput. Phys. Commun. 2021, 267, 108033. [Google Scholar] [CrossRef]
  39. Sun, D.; Gao, Y.; Xue, J.; Zhao, J. Defect stability and electronic structure of doped β-Ga2O3: A comprehensive ab initio study. J. Alloys Compd. 2019, 794, 374–384. [Google Scholar] [CrossRef]
  40. Mondal, A.K.; Mohamed, M.A.; Ping, L.K.; Mohamad Taib, M.F.; Samat, M.H.; Mohammad Haniff, M.A.S.; Bahru, R. First-principles studies for electronic structure and optical properties of p-type calcium doped α-Ga2O3. Materials 2021, 14, 604. [Google Scholar] [CrossRef]
  41. Kean Ping, L.; Mohamed, M.A.; Kumar Mondal, A.; Mohamad Taib, M.F.; Samat, M.H.; Berhanuddin, D.D.; Menon, P.S.; Bahru, R. First-Principles Studies for Electronic Structure and Optical Properties of Strontium Doped β-Ga2O3. Micromachines 2021, 12, 348. [Google Scholar] [CrossRef] [PubMed]
  42. Usseinov, A.; Platonenko, A.; Koishybayeva, Z.; Akilbekov, A.; Zdorovets, M.; Popov, A.I. Pair vacancy defects in β-Ga2O3 crystal: Ab initio study. Opt. Mater. X 2022, 16, 100200. [Google Scholar] [CrossRef]
  43. Mykhaylyk, V.B.; Kraus, H.; Kapustianyk, V.; Rudko, M. Low temperature scintillation properties of Ga2O3. Appl. Phys. Lett. 2019, 115, 081103. [Google Scholar] [CrossRef]
  44. Yan, H.; Guo, Y.; Song, Q.; Chen, Y.; Shi, Y. Electronic Structure and Magnetic Interactions in Ti-Doped and Ti-VO-Co-Doped β-Ga2O3 from First-Principles Calculations. J. Supercond. Nov. Magn. 2016, 29, 2607–2613. [Google Scholar] [CrossRef]
  45. Ao, L.; Pham, A.; Xiang, X.; Li, S.; Zu, X. Defect induced charge trapping in C-doped α-Al2O3. J. Appl. Phys. 2017, 122, 025702. [Google Scholar] [CrossRef]
  46. Goyal, A.; Gorai, P.; Toberer, E.S.; Stevanović, V. First-principles calculation of intrinsic defect chemistry and self-doping in PbTe. NPJ Comput. Mater. 2017, 3, 42. [Google Scholar] [CrossRef]
  47. Wu, Z.-j.; Zhao, E.-j.; Xiang, H.-p.; Hao, X.-f.; Liu, X.-j.; Meng, J. Crystal structures and elastic properties of superhard IrN2 and IrN3 from first principles. Phys. Rev. B 2007, 76, 054115. [Google Scholar] [CrossRef]
  48. Osipov, A.V.; Grashchenko, A.S.; Kukushkin, S.A.; Nikolaev, V.I.; Osipova, E.V.; Pechnikov, A.I.; Soshnikov, I.P. Structural and elastoplastic properties of β-Ga2O3 films grown on hybrid SiC/Si substrates. Contin. Mech. Thermodyn. 2018, 30, 1059–1068. [Google Scholar] [CrossRef]
  49. Usseinov, A.; Koishybayeva, Z.; Platonenko, A.; Pankratov, V.; Suchikova, Y.; Akilbekov, A.; Zdorovets, M.; Purans, J.; Popov, A.I. Vacancy Defects in Ga2O3: First-Principles Calculations of Electronic Structure. Materials 2021, 14, 7384. [Google Scholar] [CrossRef]
  50. Miller, W.; Böttcher, K.; Galazka, Z.; Schreuer, J. Numerical Modelling of the Czochralski Growth of β-Ga2O3. Crystals 2017, 7, 26. [Google Scholar] [CrossRef]
  51. Wei, Y.; Wang, T.; Zhang, Y.; Qi, C.; Luan, J.; Ma, G.; Tsai, H.-S.; Liu, C.; Huo, M. Effects of carbon related defects on opto-electronic properties of β-Ga2O3: The first principle calculation. J. Appl. Phys. 2020, 17, 103060. [Google Scholar] [CrossRef]
  52. Yan, H.; Guo, Y.; Song, Q.; Chen, Y. First-principles study on electronic structure and optical properties of Cu-doped β-Ga2O3. Phys. B 2014, 434, 181–184. [Google Scholar] [CrossRef]
  53. Pan, Y. First-principles investigation of the influence of point defect on the electronic and optical properties of α-Ga2O3. Int. J. Energy Res. 2022, 46, 13070–13078. [Google Scholar] [CrossRef]
  54. He, H.; Orlando, R.; Blanco, M.A.; Pandey, R.; Amzallag, E.; Baraille, I.; Rérat, M. First-principles study of the structural, electronic, and optical properties of Ga2O3 in its monoclinic and hexagonal phases. Phys. Rev. B 2006, 74, 195123. [Google Scholar] [CrossRef]
  55. Zachinskis, A.; Grechenkov, J.; Butanovs, E.; Platonenko, A.; Piskunov, S.; Popov, A.I.; Purans, J.; Bocharov, D. Ir impurities in α- and β-Ga2O3 and their detrimental effect on p-type conductivity. Sci. Rep. 2023, 13, 8522. [Google Scholar] [CrossRef]
Figure 1. (a) The calculated complex model of a Fe-doped β-Ga2O3 supercell with native defects obtained from VESTA [35]. 1 and 2 denote the tetrahedrally and octahedrally coordinated Ga sites substituted by an iron atom, respectively. 3 and 4 show the vacancy sites for Ga and O, respectively, while 5 represents the interstitial positions for both Ga and O. The a, b, and c axes refer to the crystallographic a, b, and c directions, respectively. (For interpretation of the references to color in this figure legend, the reader is referred to the web version of this article.) (b,c) exhibit the band structure and the density of states for perfect β-Ga2O3, respectively.
Materials 16 06758 g001
Figure 2. The defect formation energies of Fe-doped β-Ga2O3 under (a) the O-rich and (b) Ga-rich conditions. The dash line represents the calculated band gap of perfect β-Ga2O3.
Materials 16 06758 g002
Figure 3. (a) The formation energies of FeGaΠ as a function of the biaxial strain with q = 0 under O-rich conditions. (b) The phonon dispersion calculations for the FeGaΠ doping configuration.
Materials 16 06758 g003
Figure 4. The defect formation energies under the O-rich and Ga-rich conditions for the complexes of (a) FeGaΠ and (b) FeGaI with native defects. The dash line represents the calculated band gap of perfect β-Ga2O3.
Materials 16 06758 g004
Figure 5. Comparison of the optical absorption spectra of perfect, Fe-doped, as well as various FeGaΠ and FeGaI complexes in energy range from 0–30 eV (a,c). Panels (b,d) show the corresponding amplified spectra at the low-energy region (0–5 eV).
Materials 16 06758 g005
Figure 6. The energy-loss function (ELF) for (a) FeGaΠ and (b) FeGaI complexes.
Materials 16 06758 g006
Figure 7. GGA + U calculated the band structures of (a) spin-up channel and (d) spin-down channel for perfect β-Ga2O3, (b) spin-up channel and (e) spin-down channel for FeGaΠ structure, as well as (c) spin-up channel and (f) spin-down channel for perfect FeGaI structure.
Materials 16 06758 g007
Table 1. The calculated lattice constants for perfect and Fe-doped β-Ga2O3. The values in parentheses indicate the changes in lattice parameters compared with these of the perfect β-Ga2O3.
Lattice ConstantsPerfect (This Work)Perfect (Literature)FeGaIFeGaΠ
a (Å)12.41212.494 [41]/12.28 [42]/12.214 [43]12.387 (−0.20%)12.393 (−0.15%)
b (Å)3.0763.096 [41]/3.05 [42]/3.037 [43]3.076 (0.02%)3.075 (−0.05%)
c (Å)5.8725.898 [41]/5.82 [42]/5.798 [43]5.888 (0.28%)5.868 (−0.07%)
β (°)103.702103.705 [41]/103.83 [43]103.835 (0.13%)103.700 (0%)
Table 2. Calculated elastic coefficients Cij, bulk modulus BH, Yong modulus EH and shear modulus GH (all in GPa) for perfect and FeGaΠ structures, as well as the literature values for comparison. The subscript H is responding to Voigt-Reuss-Hill notation.
C11C12C13C15C22C23C25C33
PerfectThis work
(PBE)
215109119–153177214312
PBE [48]2081181460335830318
B3LYP [49]235124138−13357767357
Exp [50]238130152−4359782346
FeGaΠ 217107118−17322729315
C35C44C46C55C66BHEHGH
PerfectThis work
(PBE)
64814649415918872
PBE [48]19509779617119273
B3LYP [49]1255158110117921482
Exp [50]194969110718421382
FeGaΠ 75118679016019073
Disclaimer/Publisher’s Note: The statements, opinions and data contained in all publications are solely those of the individual author(s) and contributor(s) and not of MDPI and/or the editor(s). MDPI and/or the editor(s) disclaim responsibility for any injury to people or property resulting from any ideas, methods, instructions or products referred to in the content.

