
Study of Chloride Ion Diffusion in Coral Aggregate Seawater Concrete with Different Water–Cement Ratios under Load

Abstract
:1. Introduction
2. Test Materials and Methods
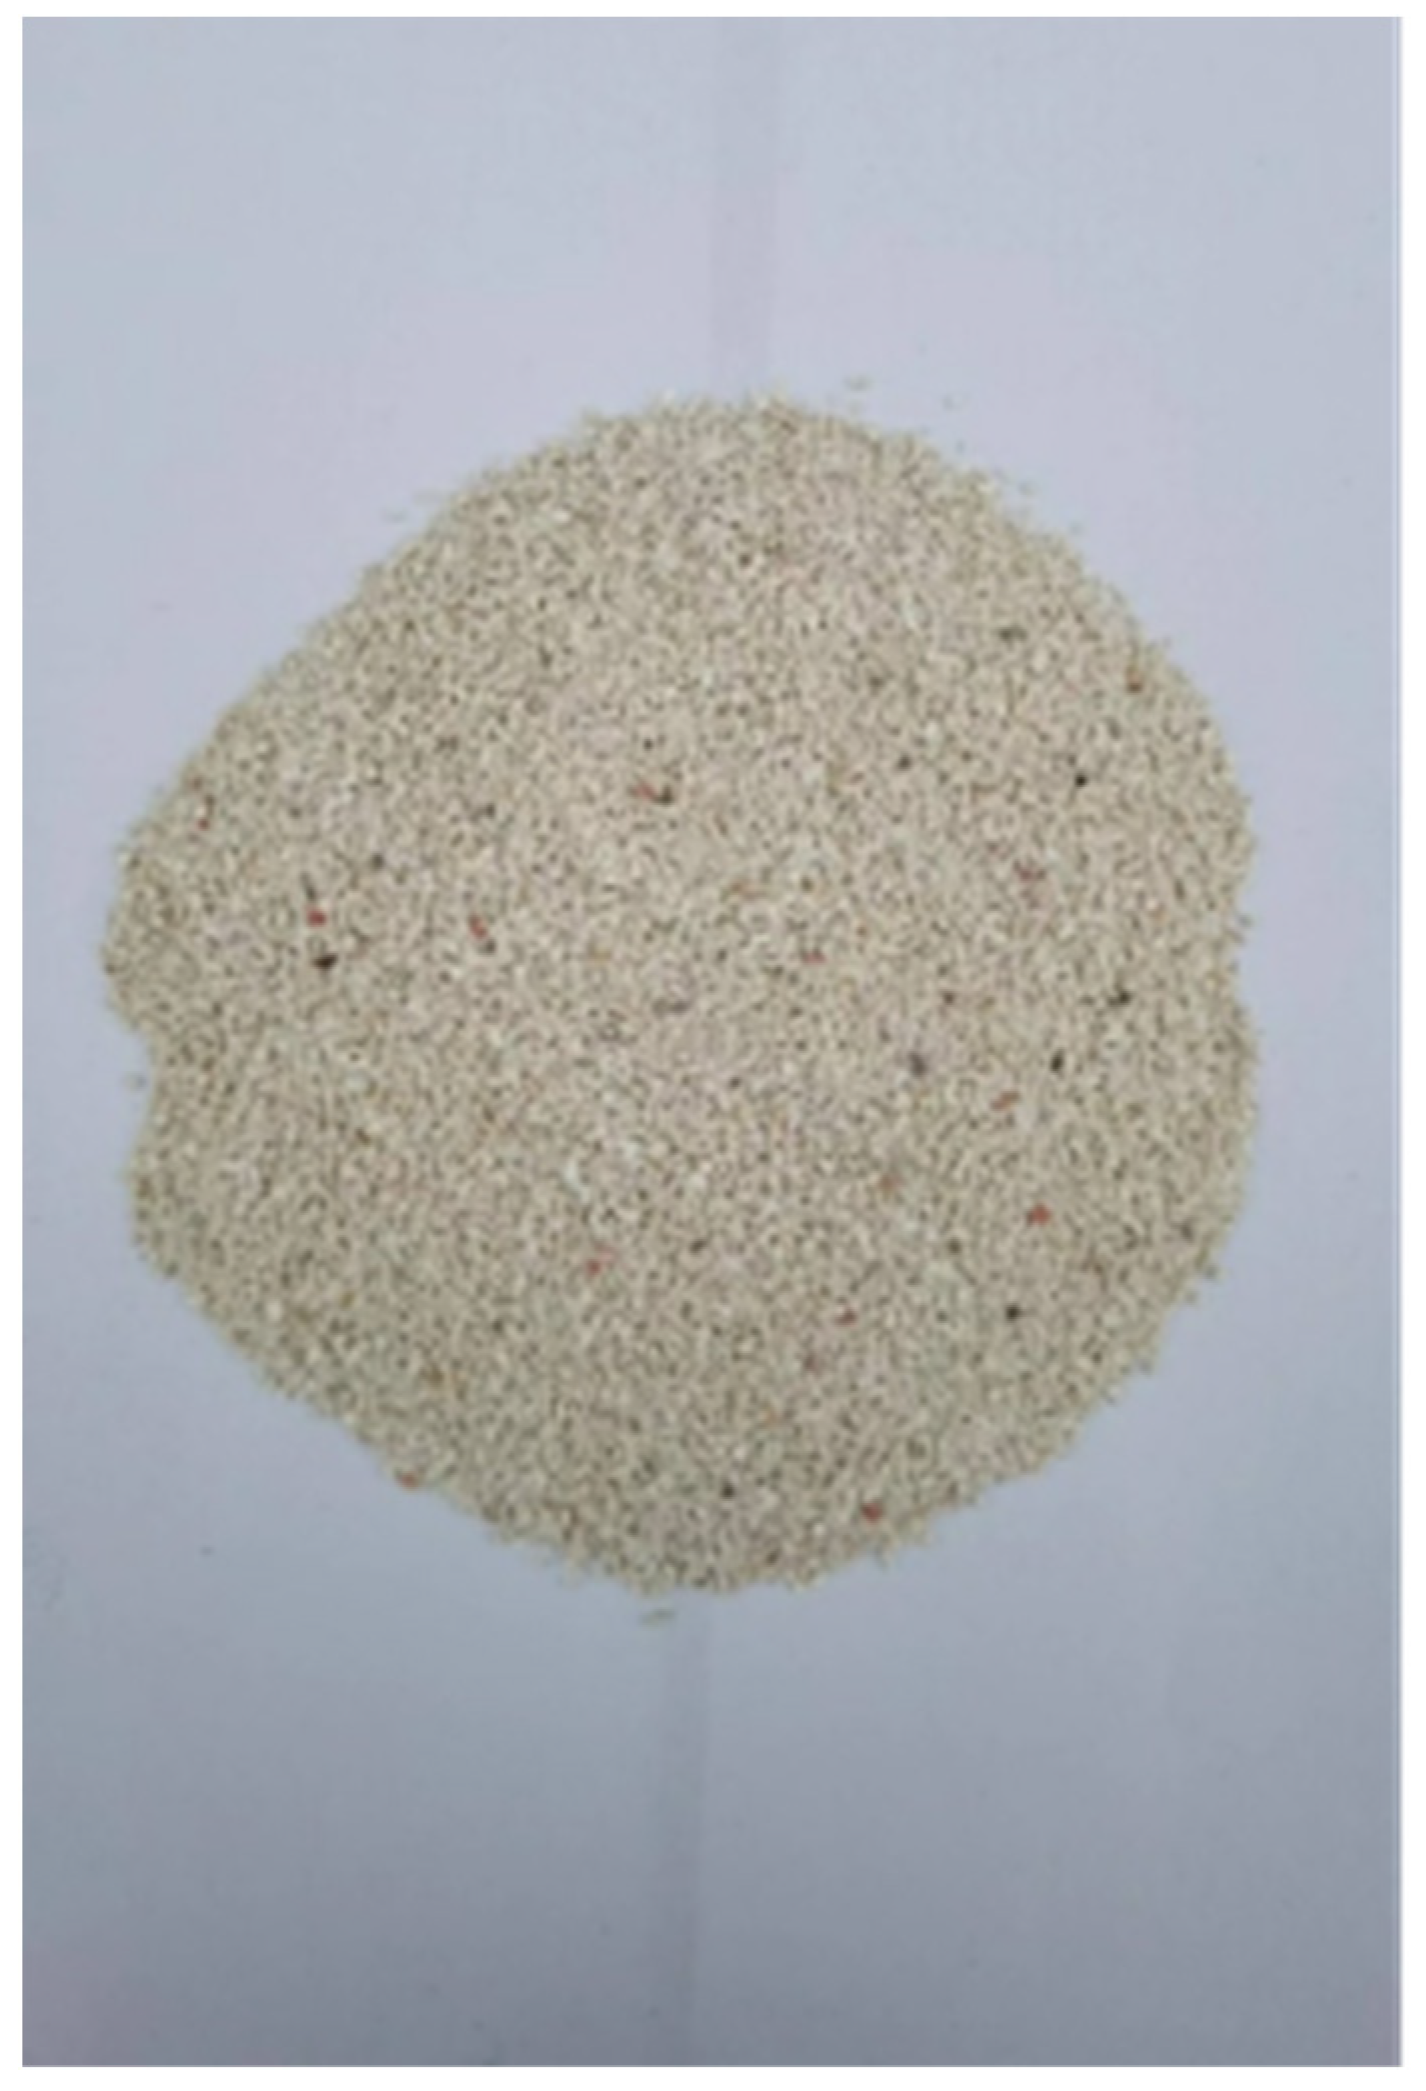
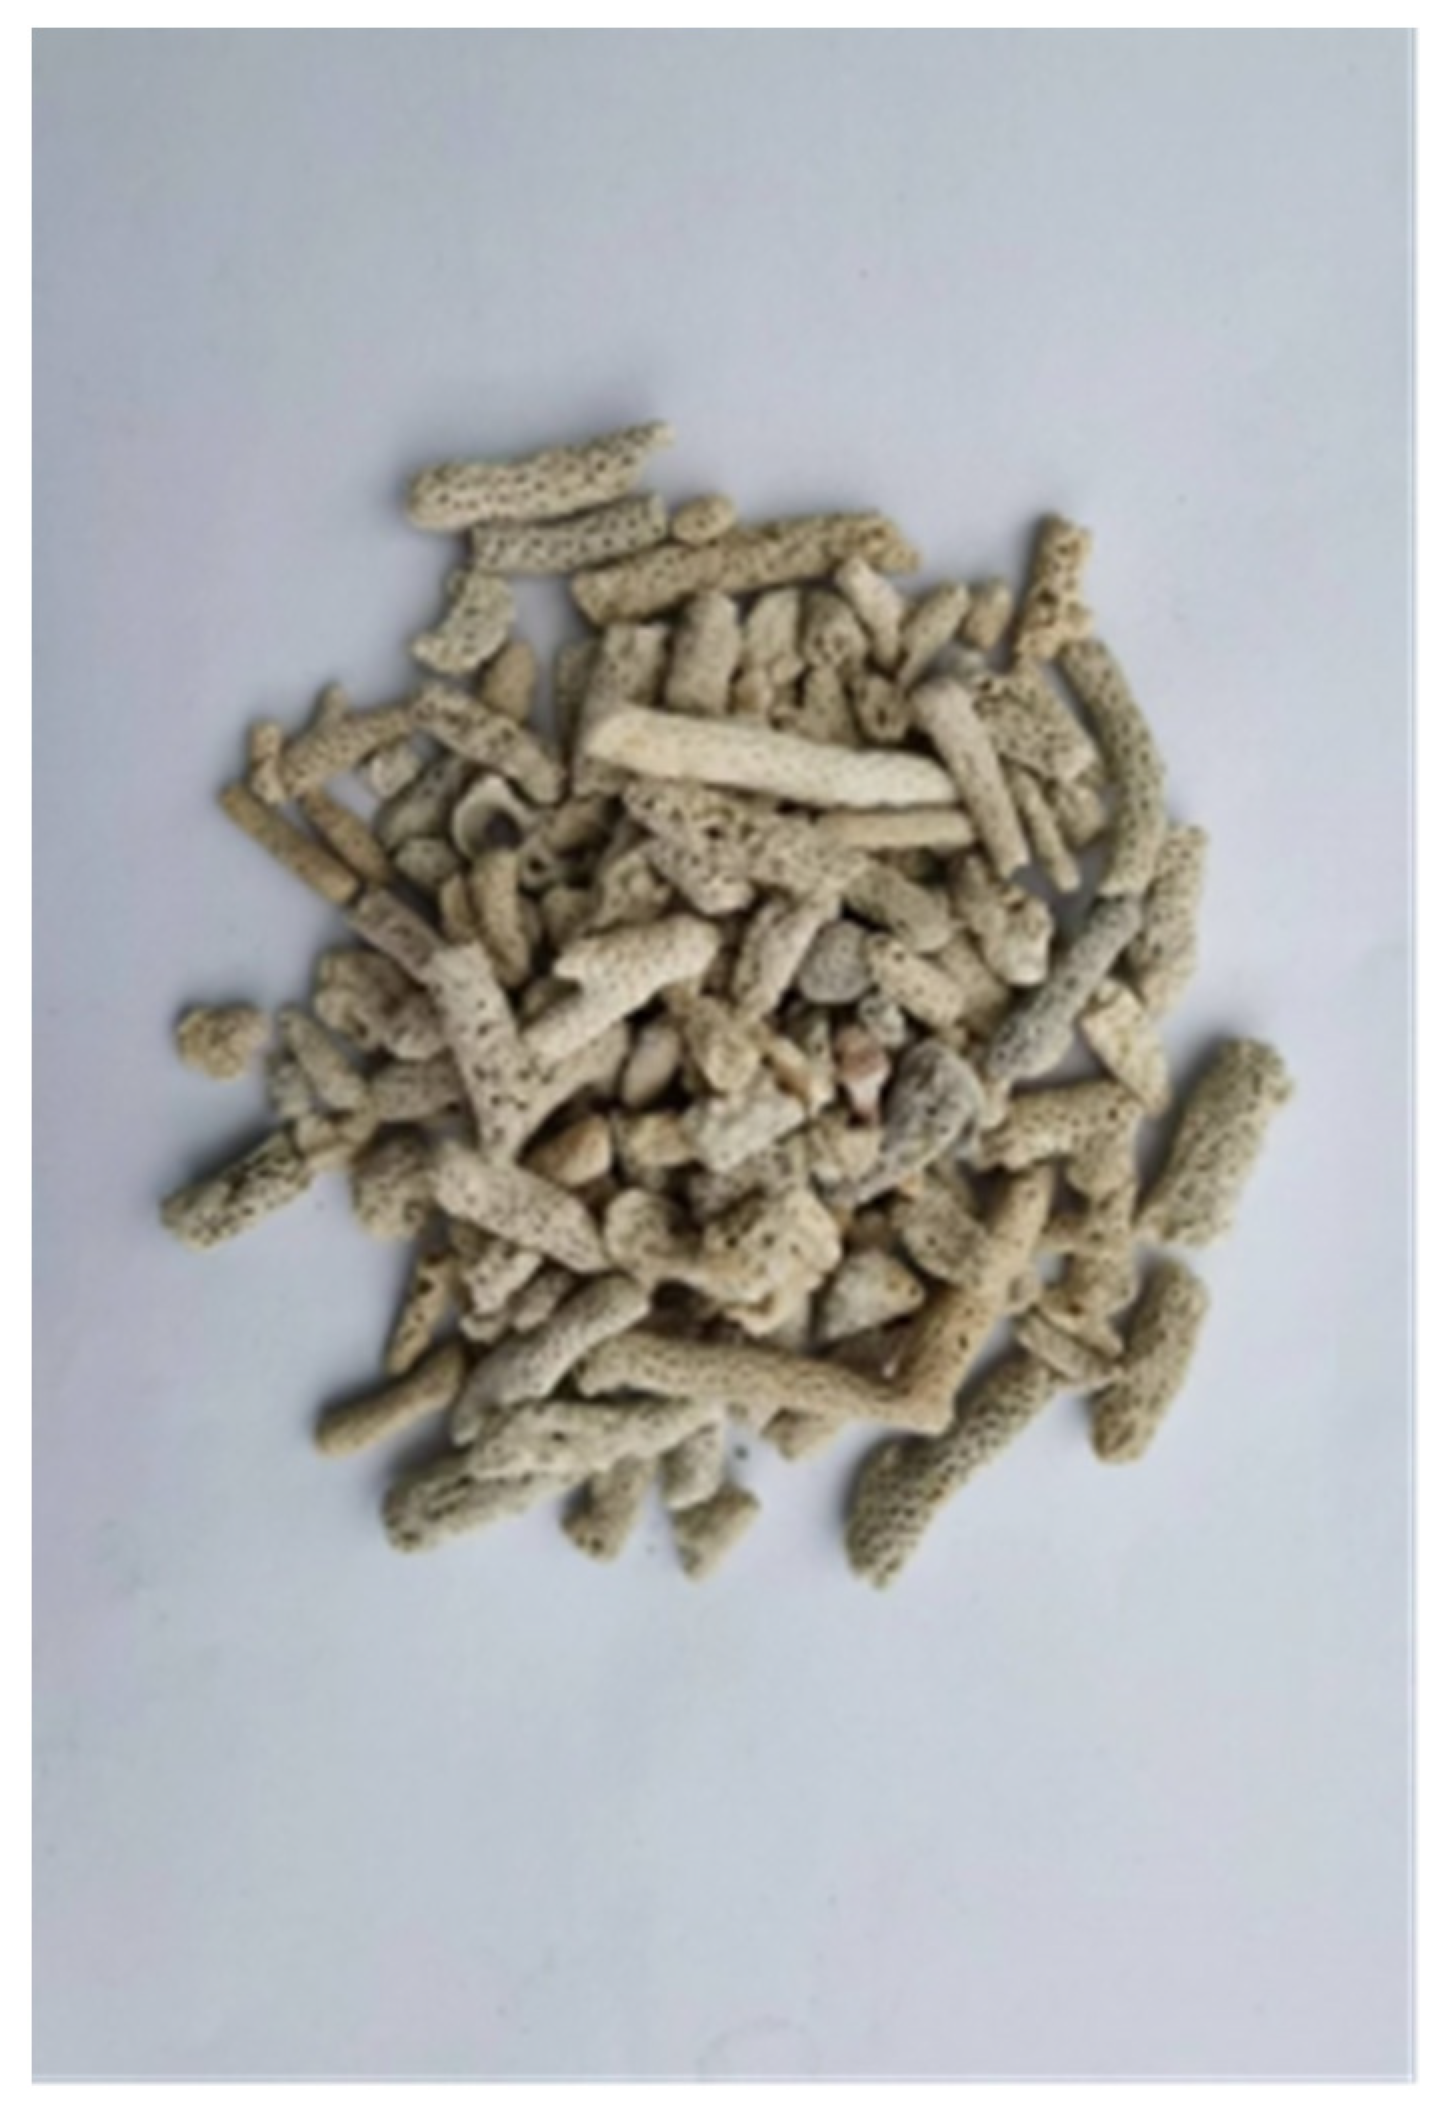
2.1. Test Materials
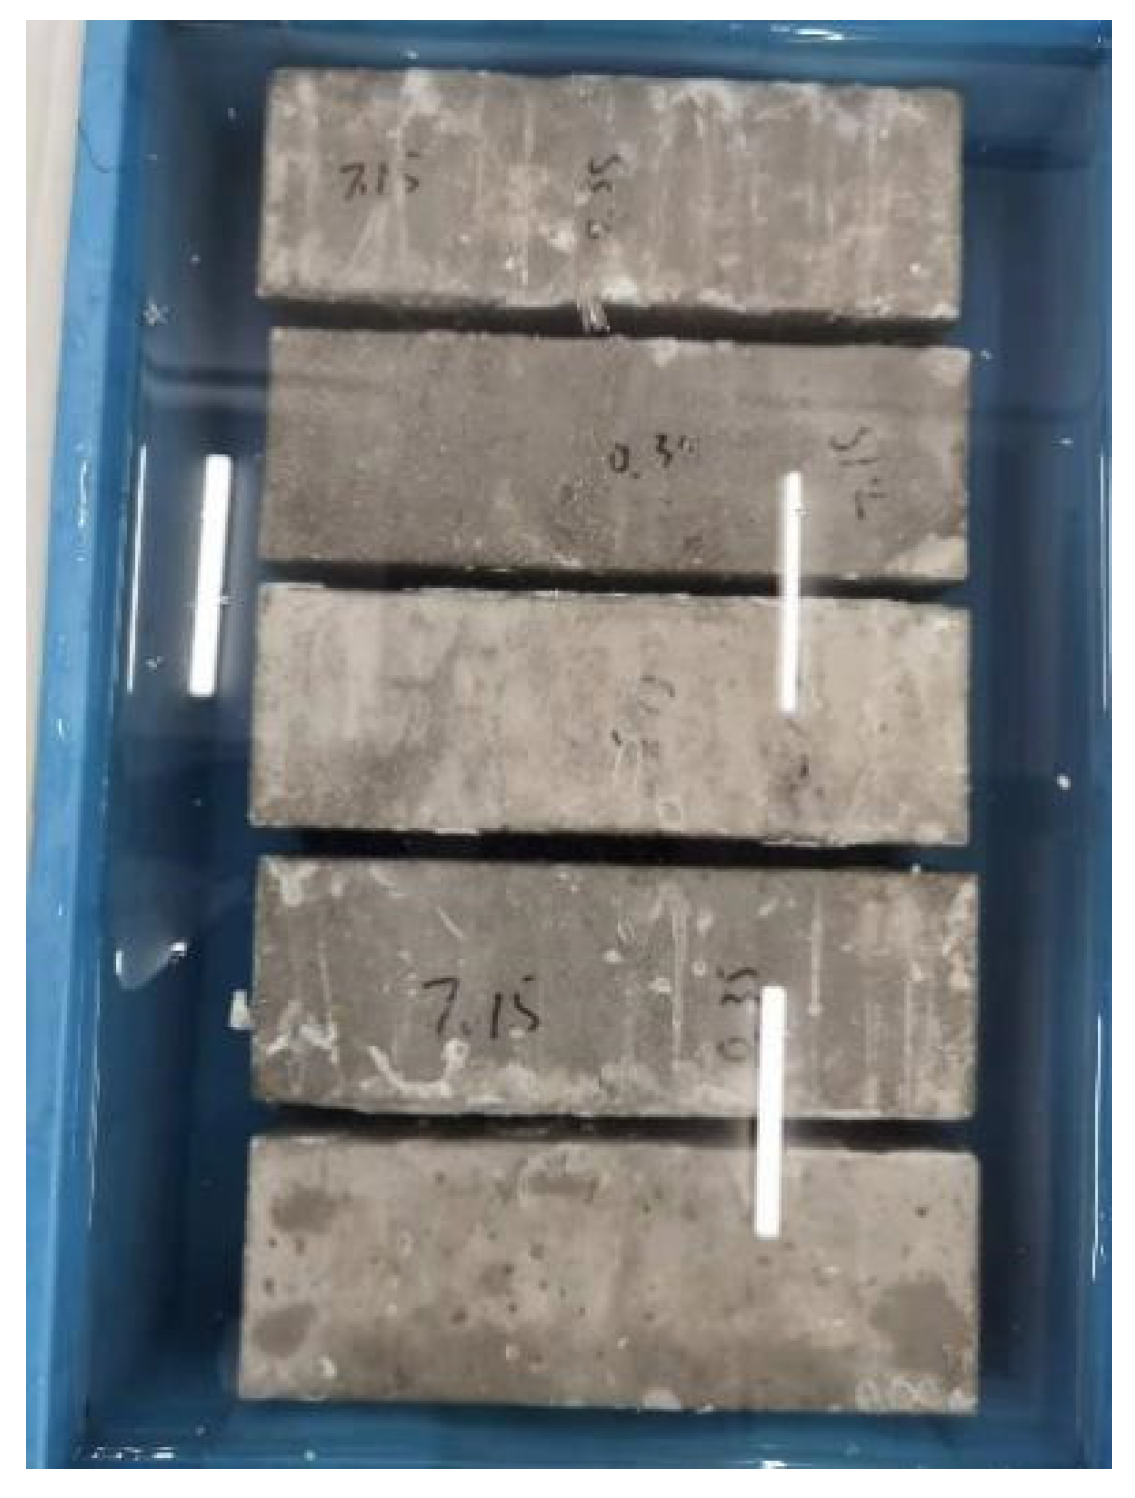
2.2. Preparation of Specimens
2.3. Test Method
2.3.1. Concrete Cube Compressive Strength Test
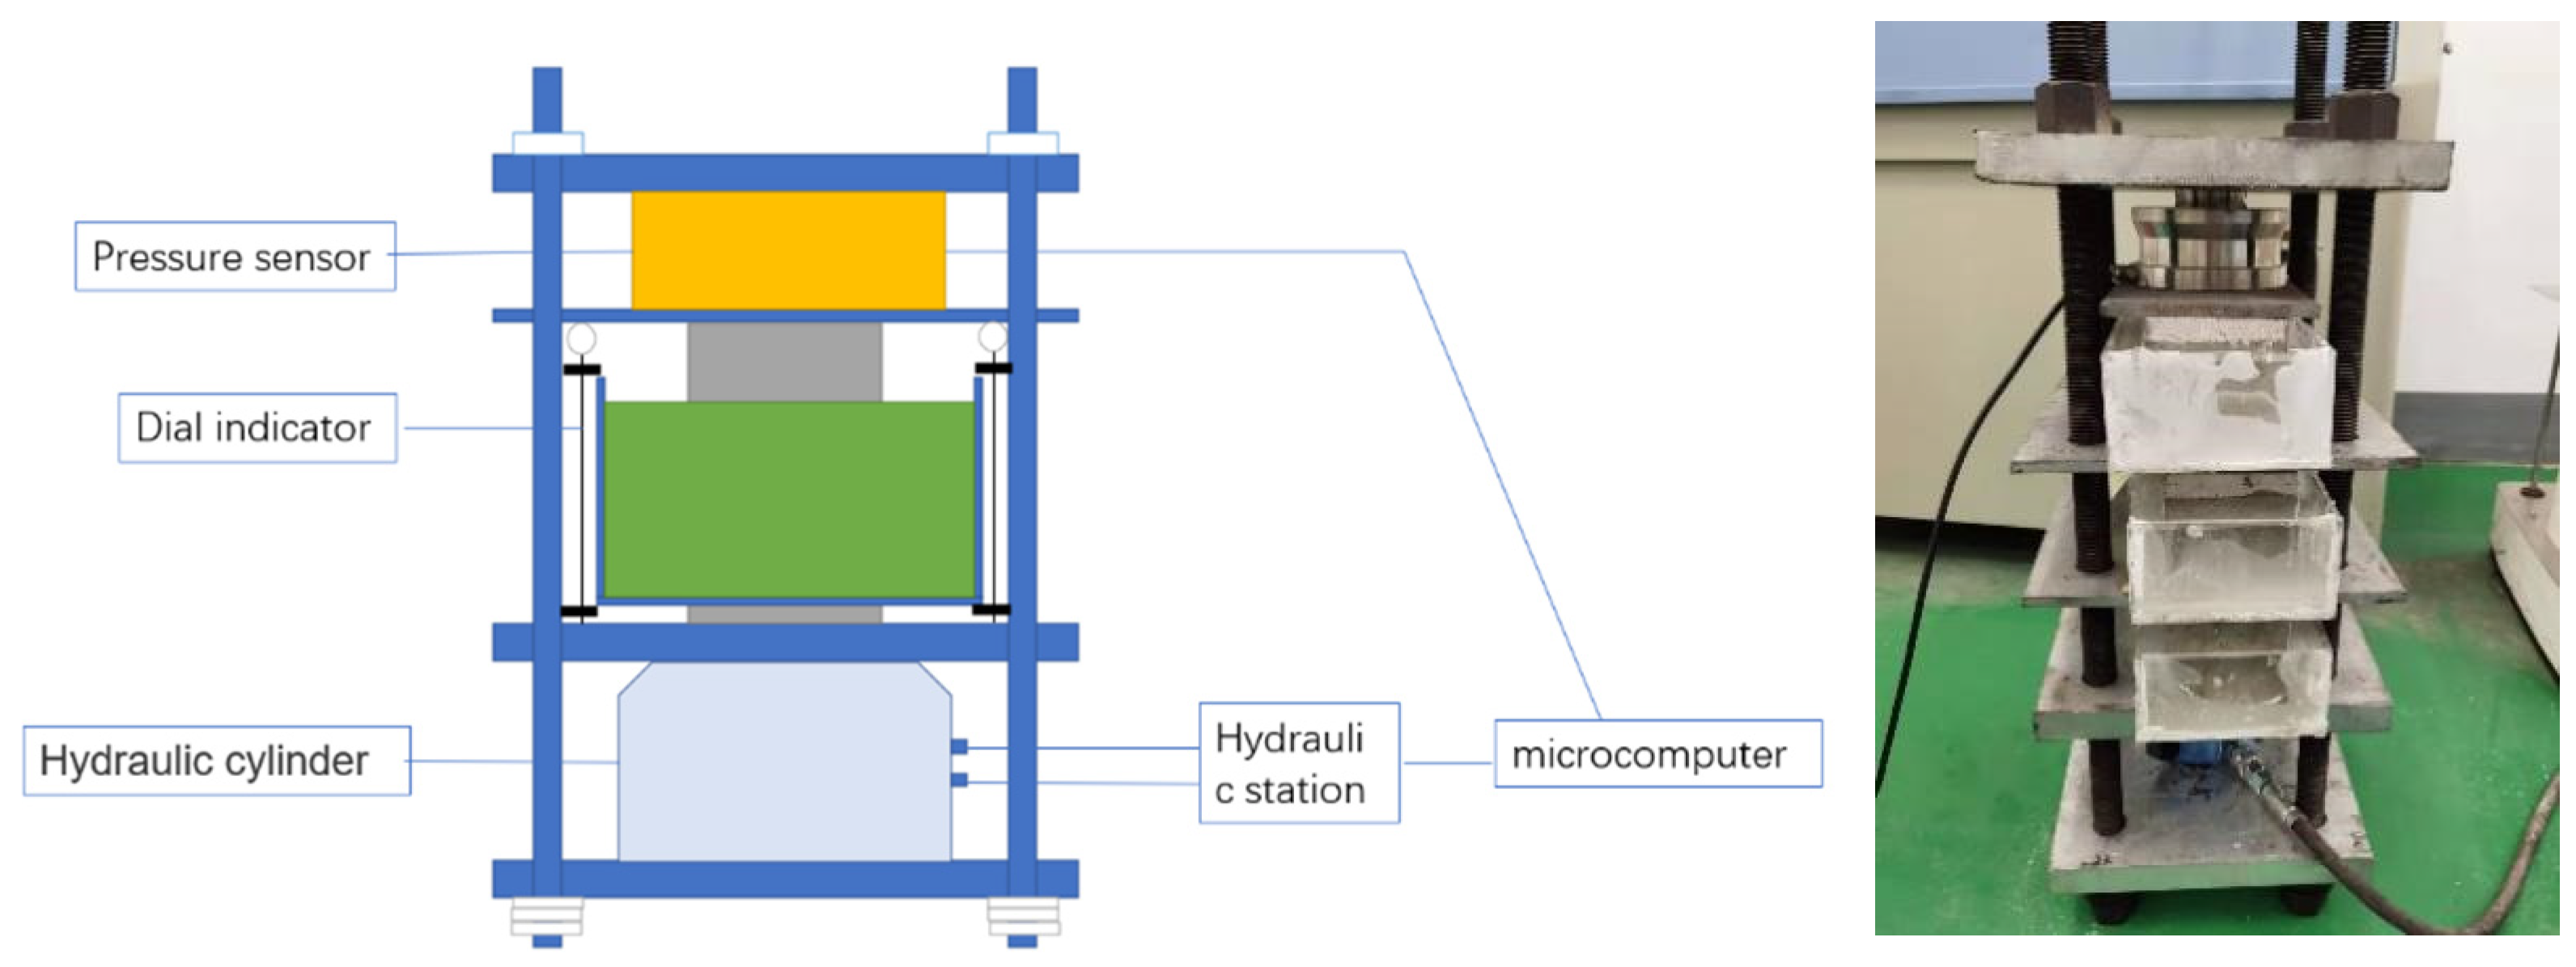
2.3.2. Test Method for Chloride Ion Concentration in CASC under Load
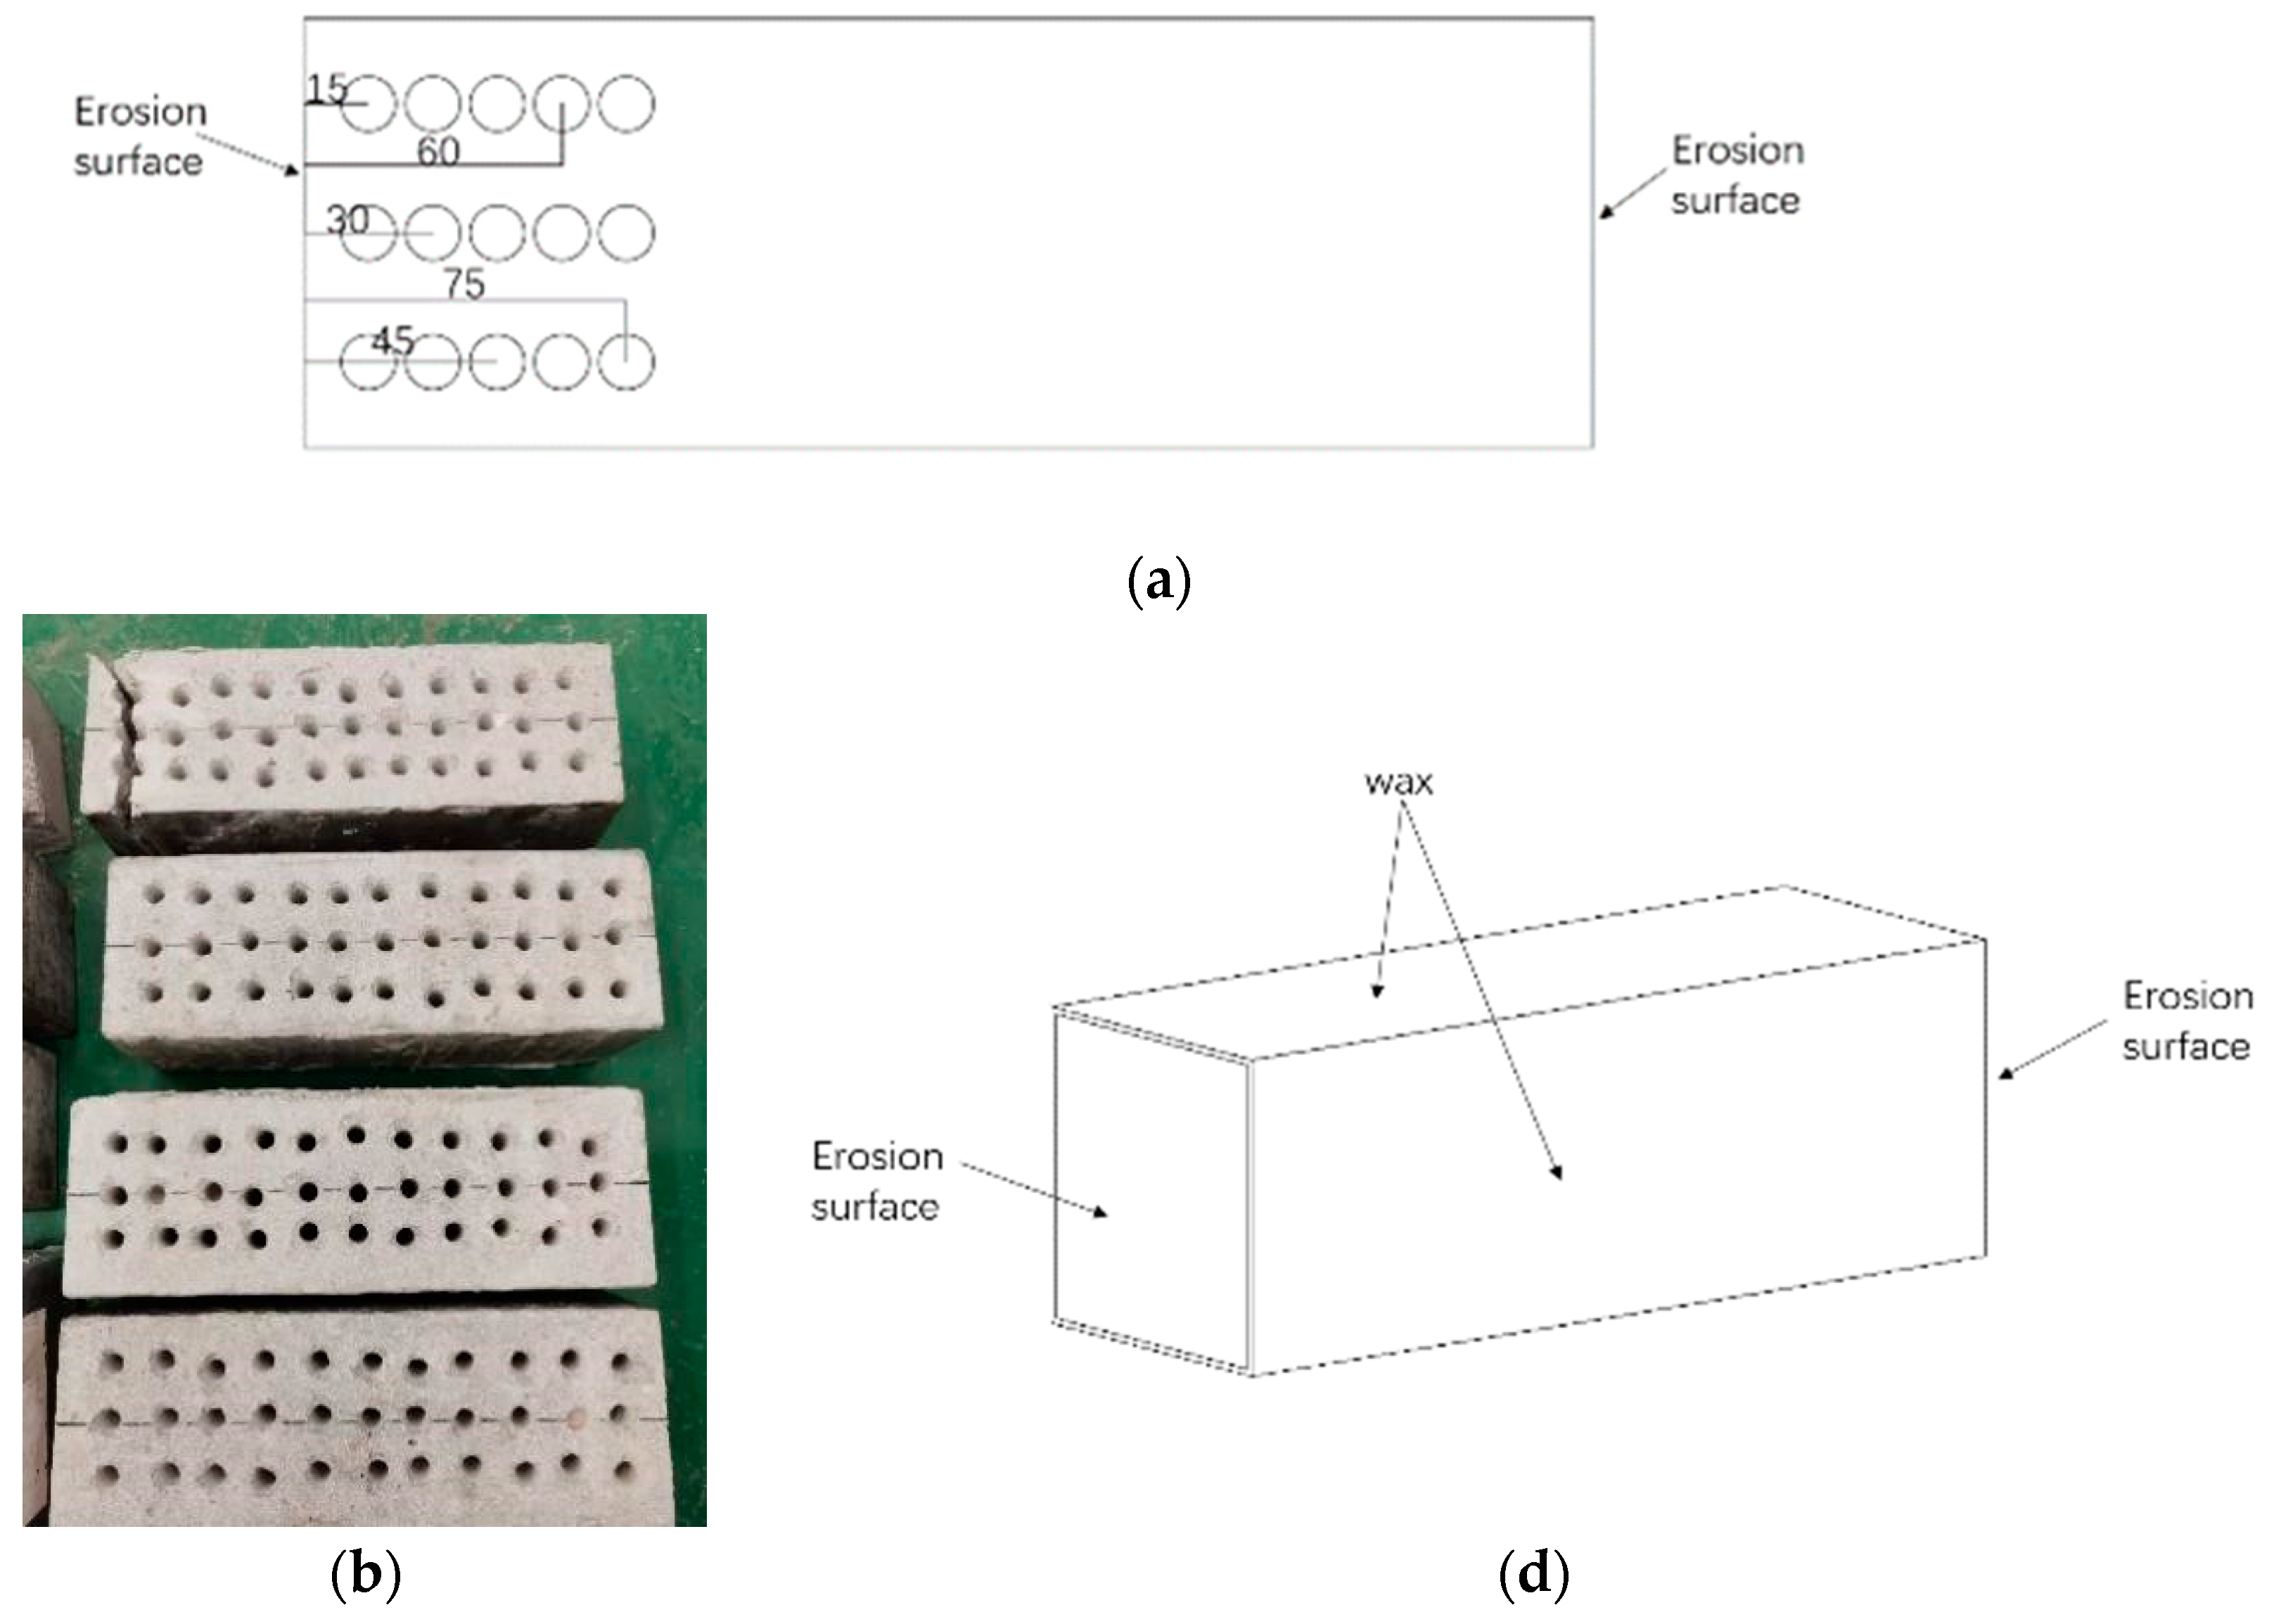
Sampling Method
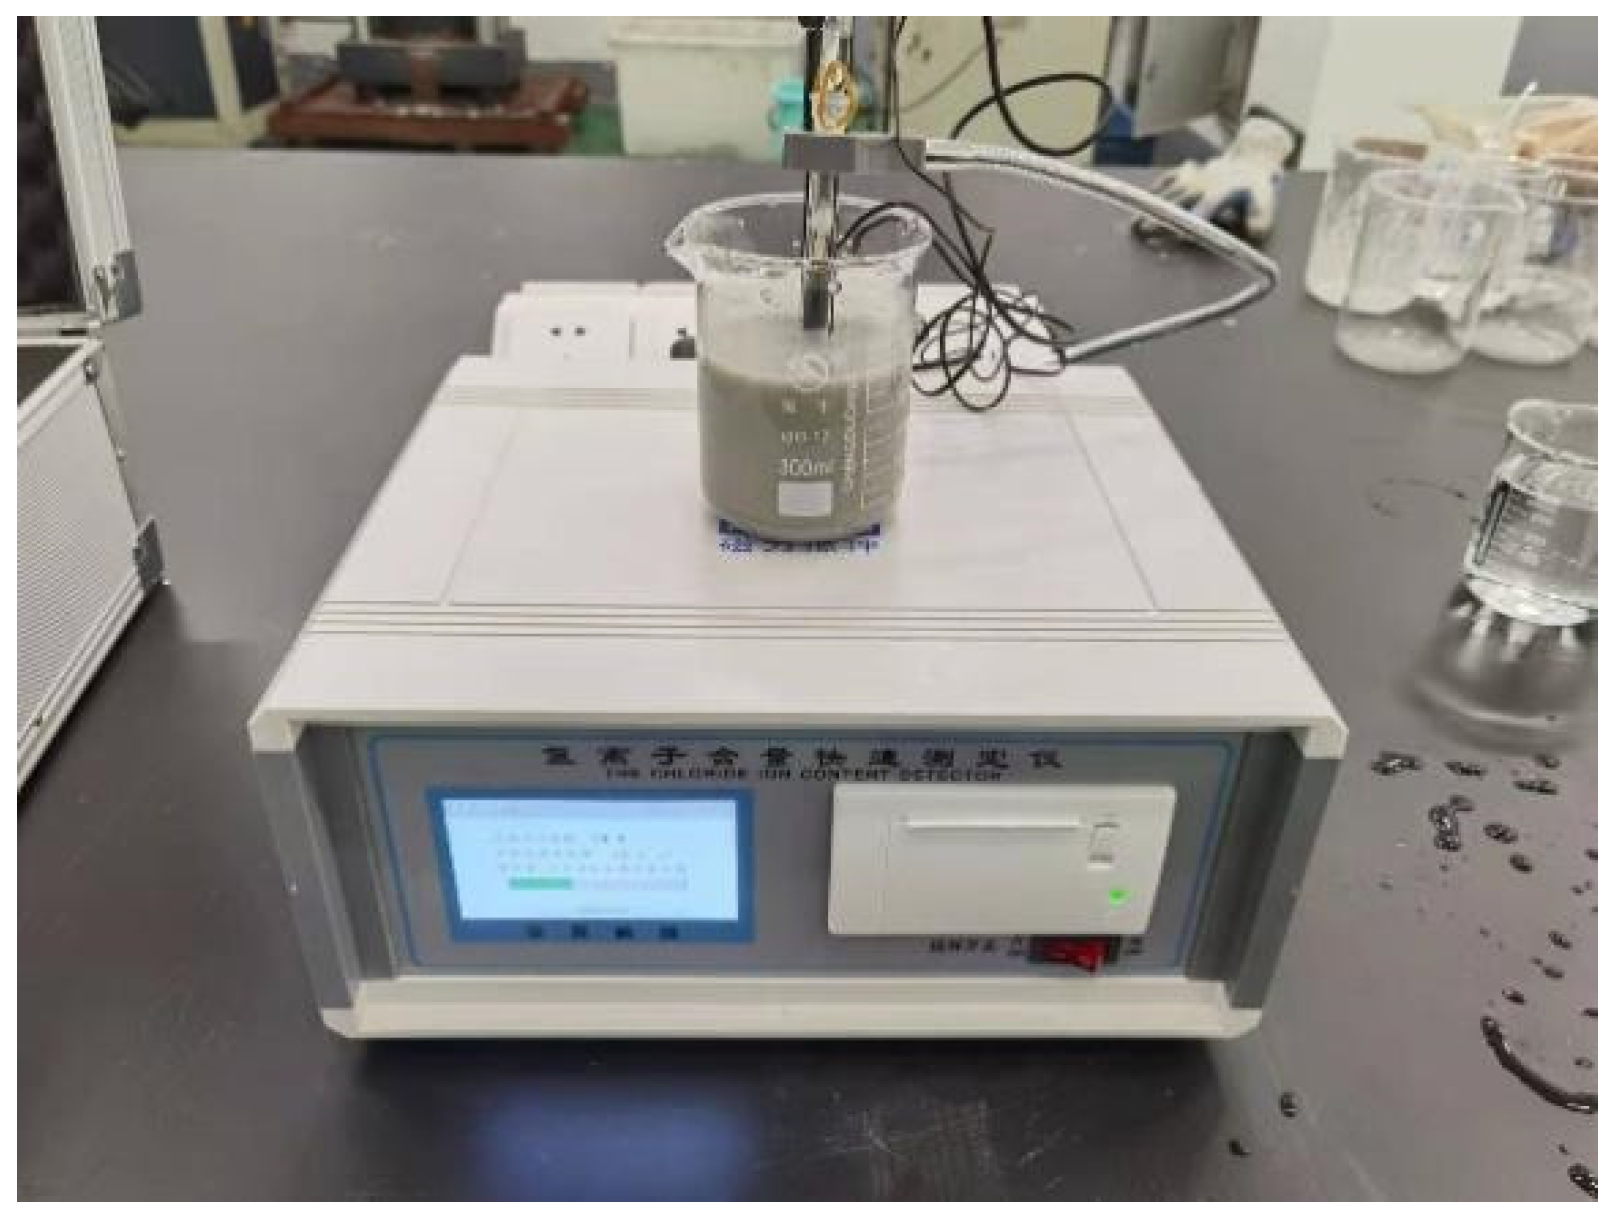
Test Method
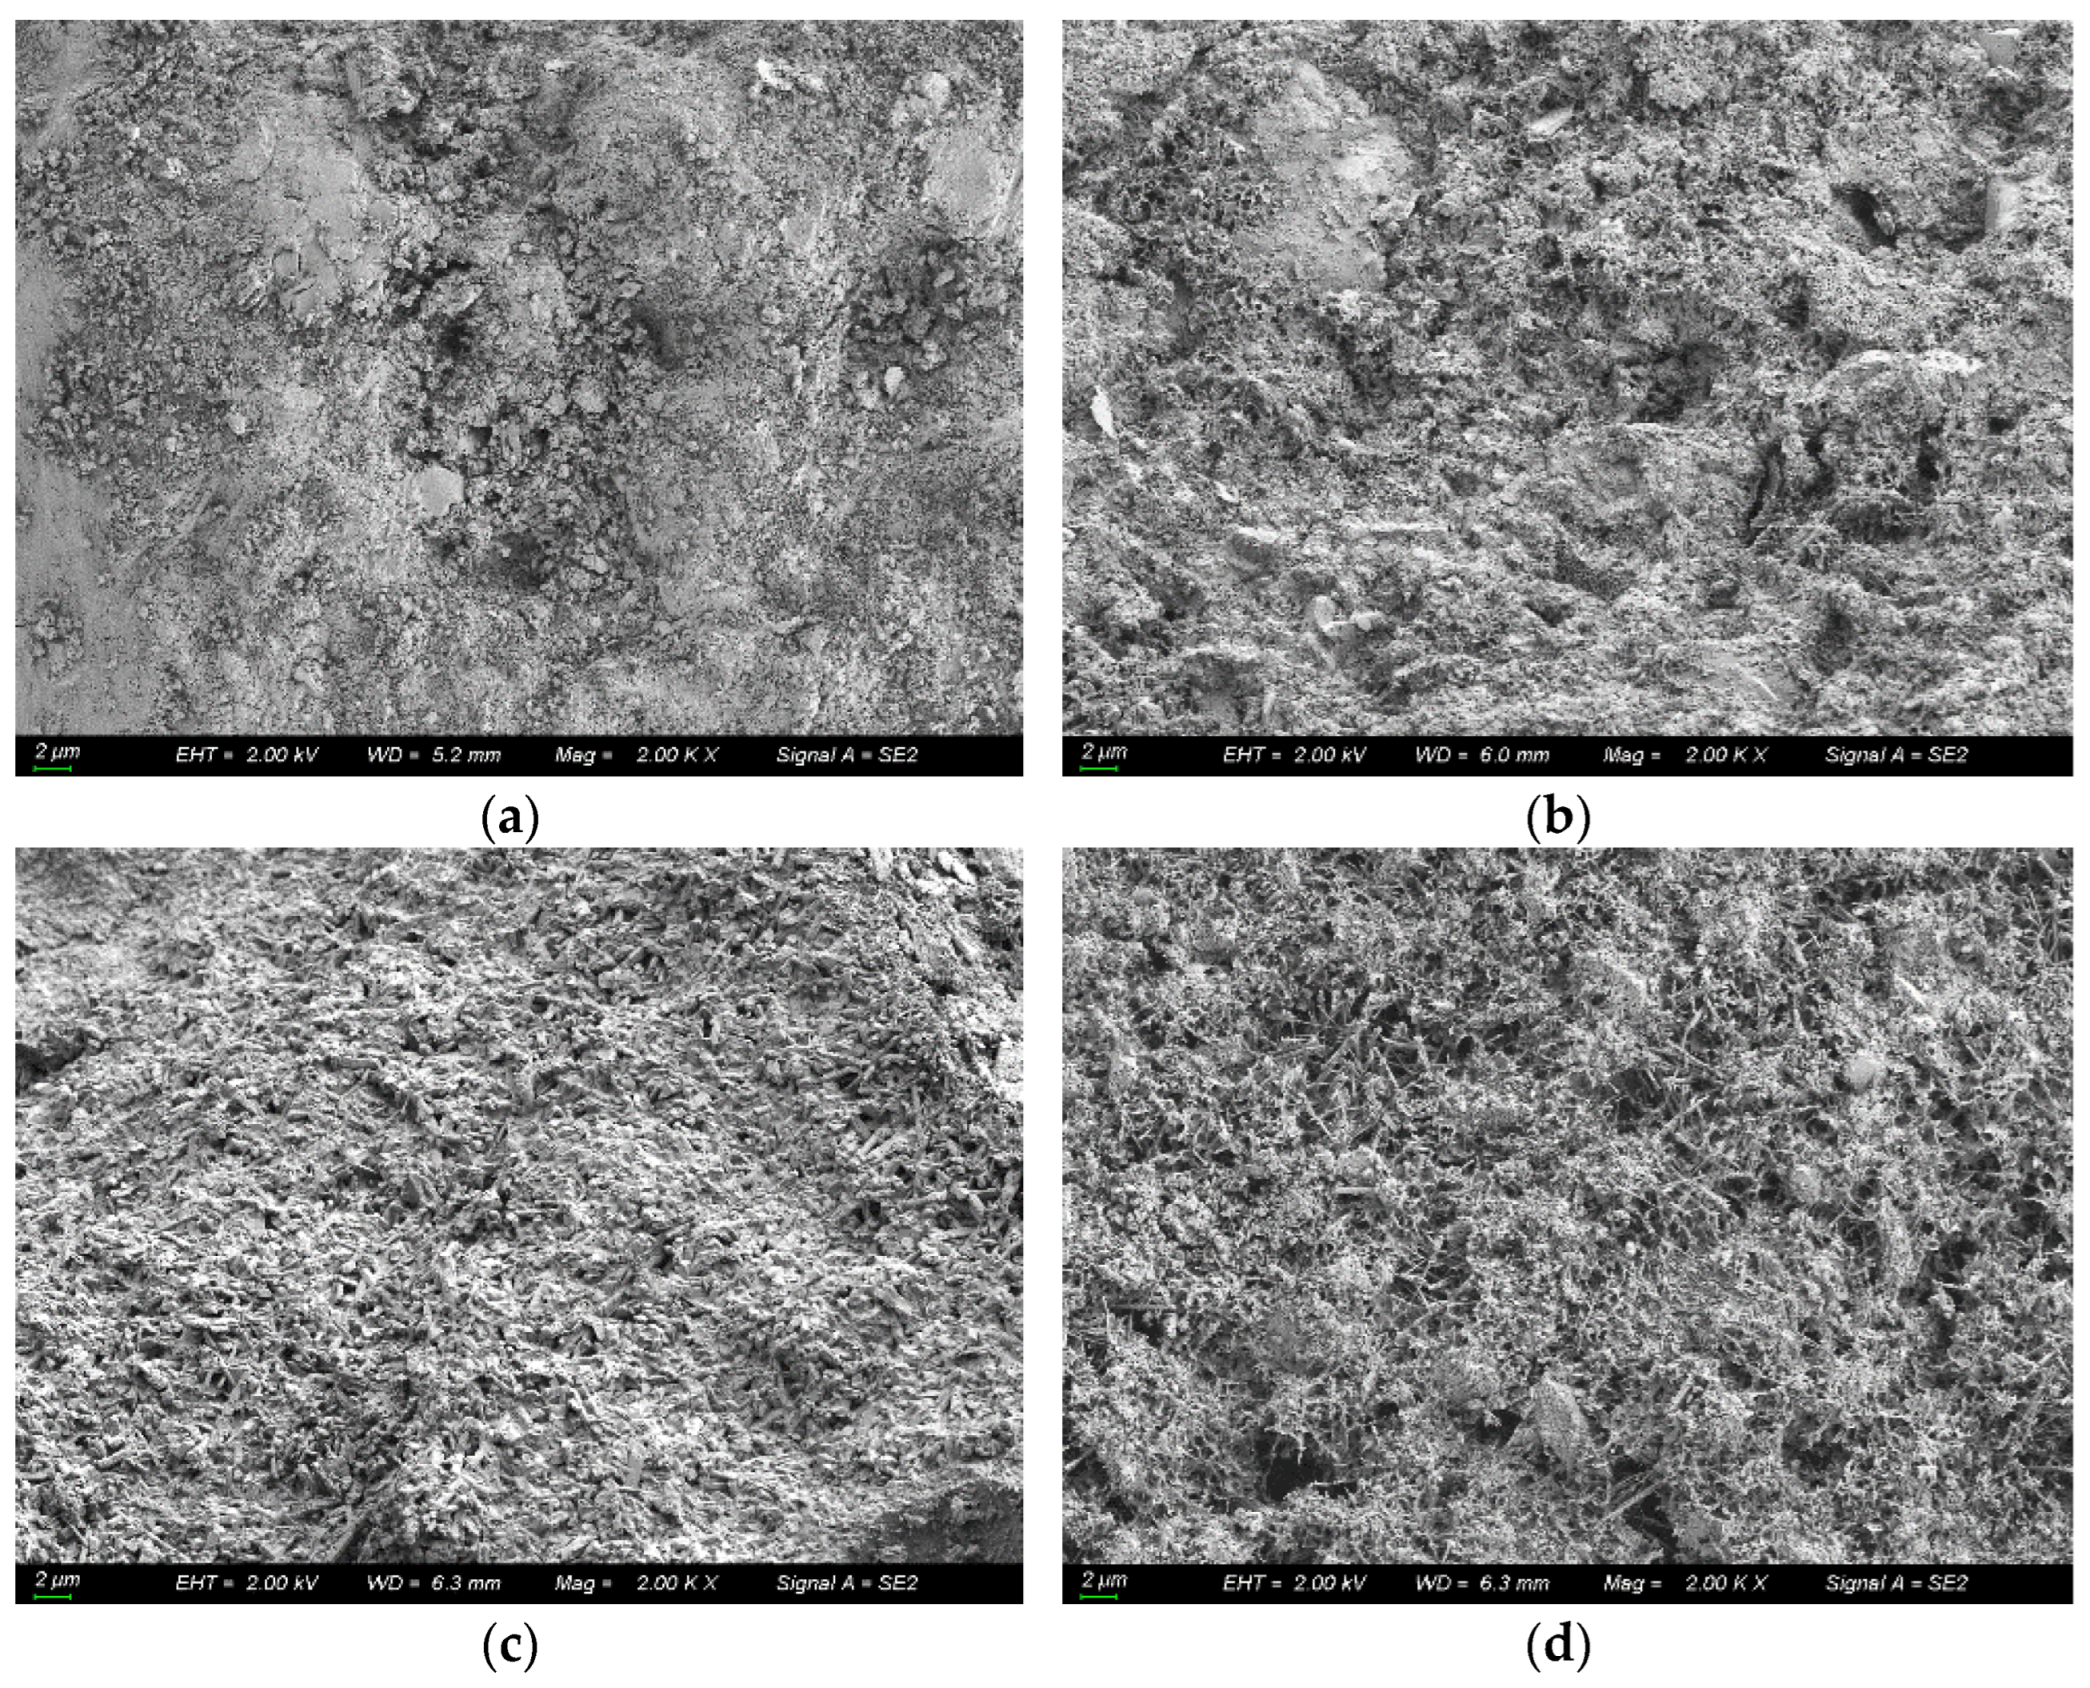
Microscopic Testing
2.3.3. Calculation Method for Parameters
- (1)
- Surface free chloride ion content and chloride ion diffusion coefficient
- (2)
- Time dependence of chloride ion diffusion coefficient
- (3)
- Time dependence of surface free chloride ion content
3. Results and Discussions
3.1. Ultimate Compressive Strength of CASC
3.2. Distribution Pattern of Chloride Ion Content
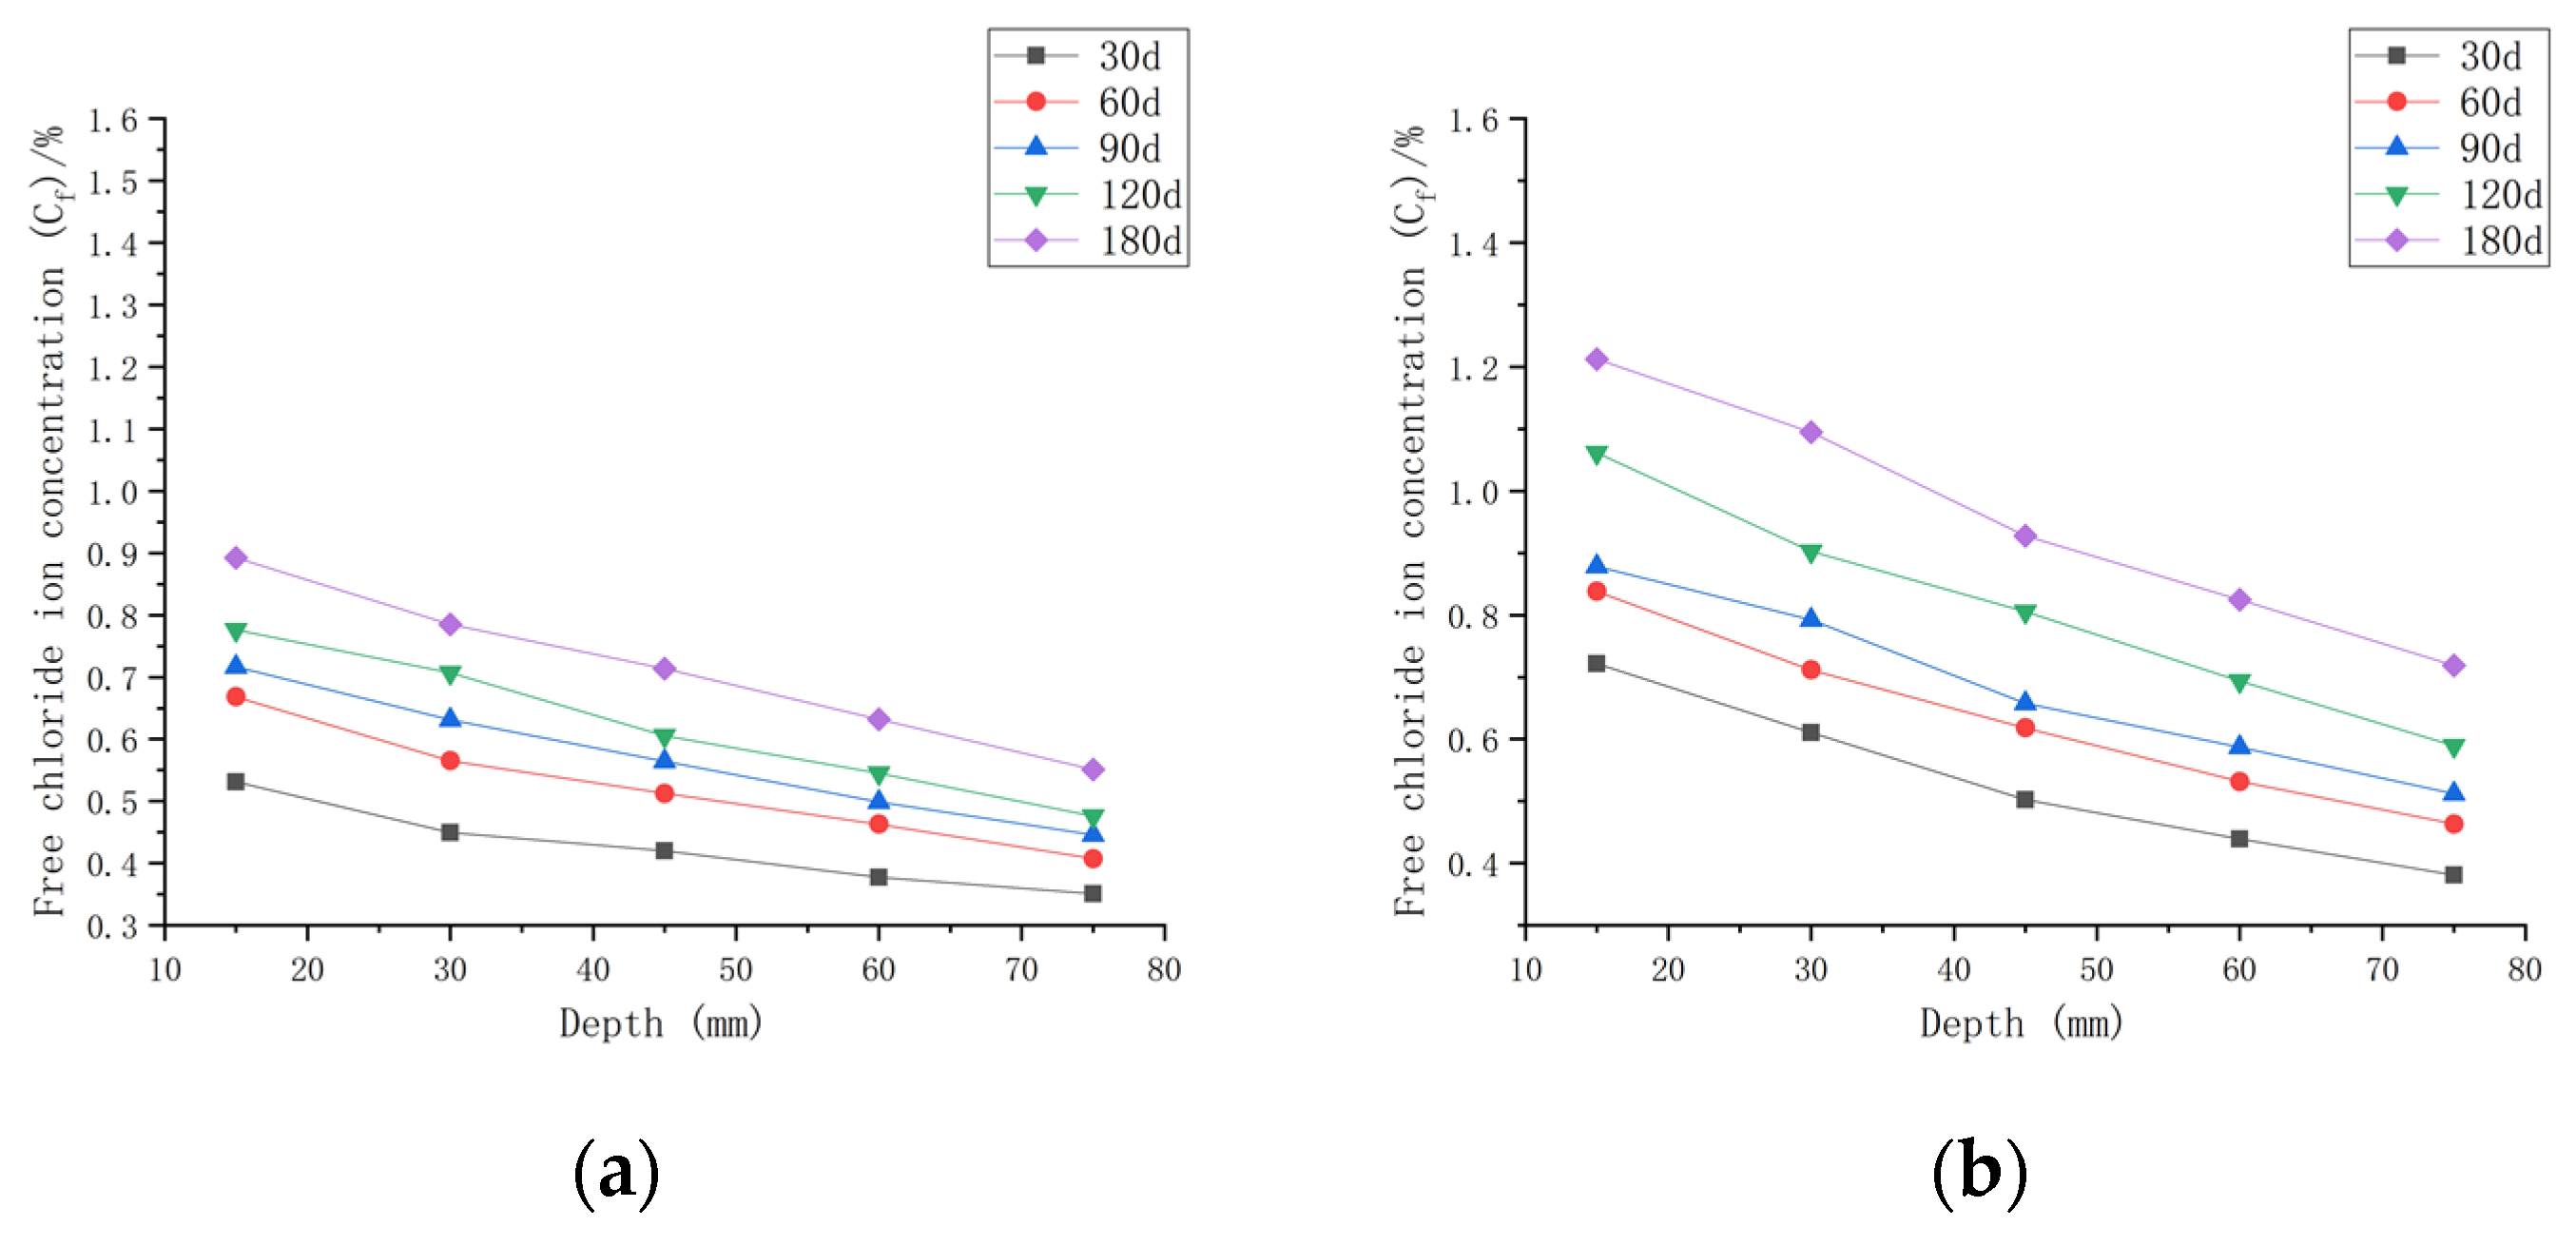
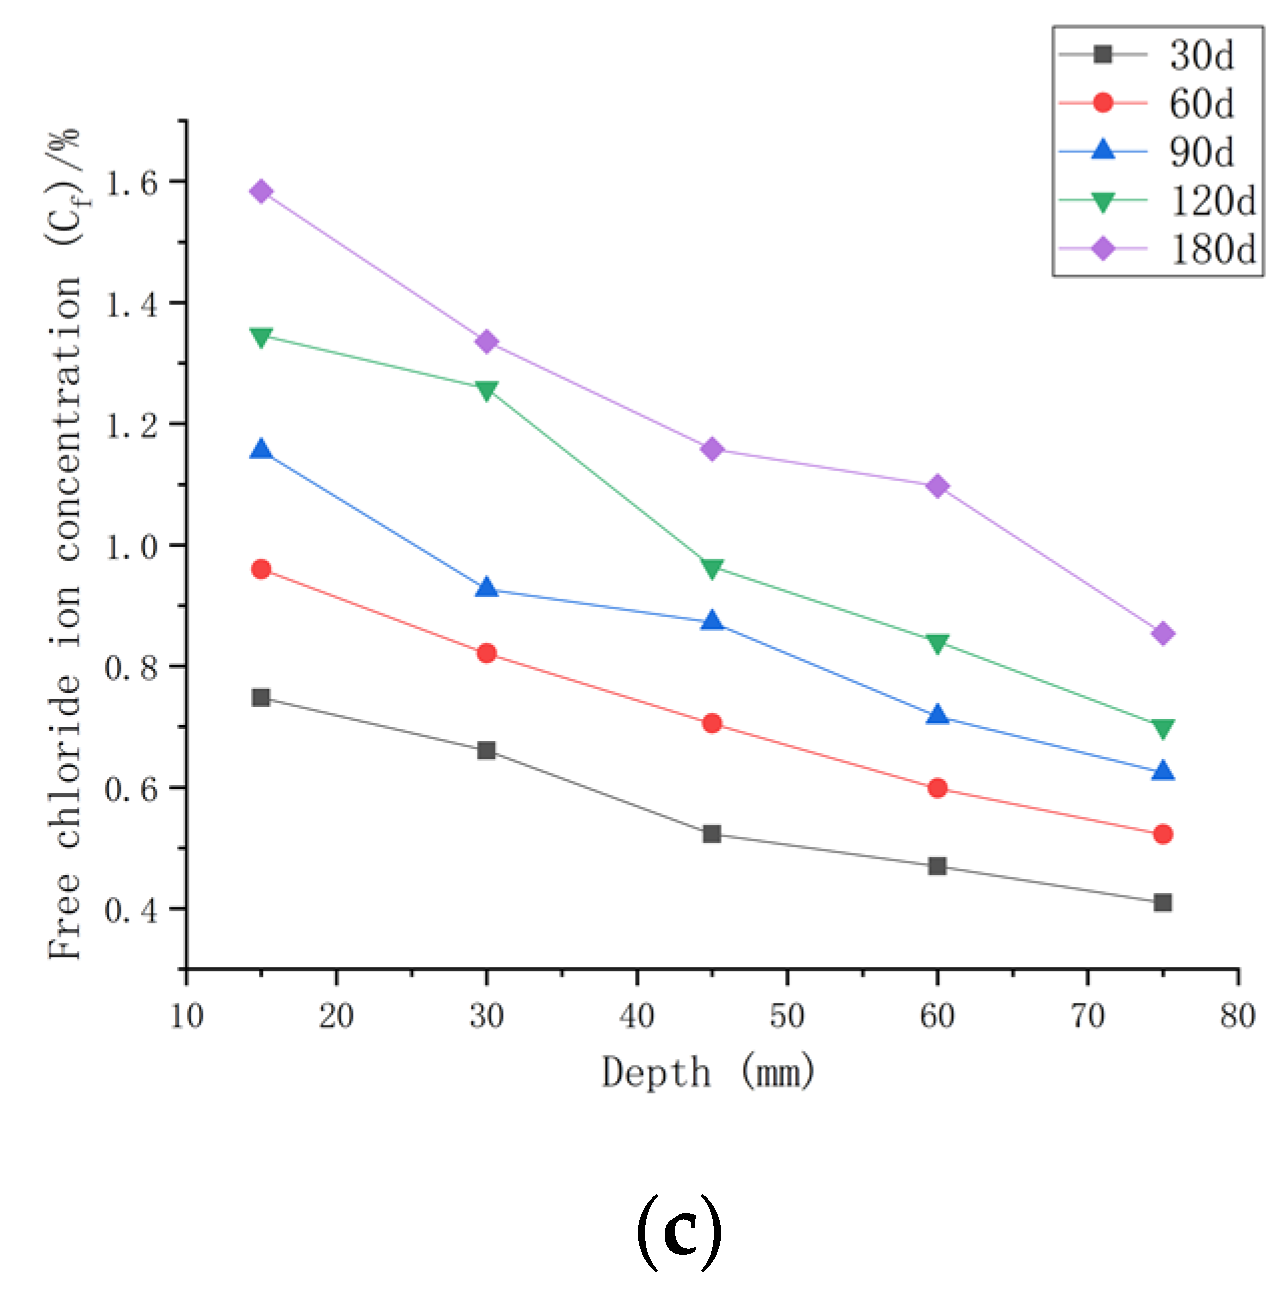
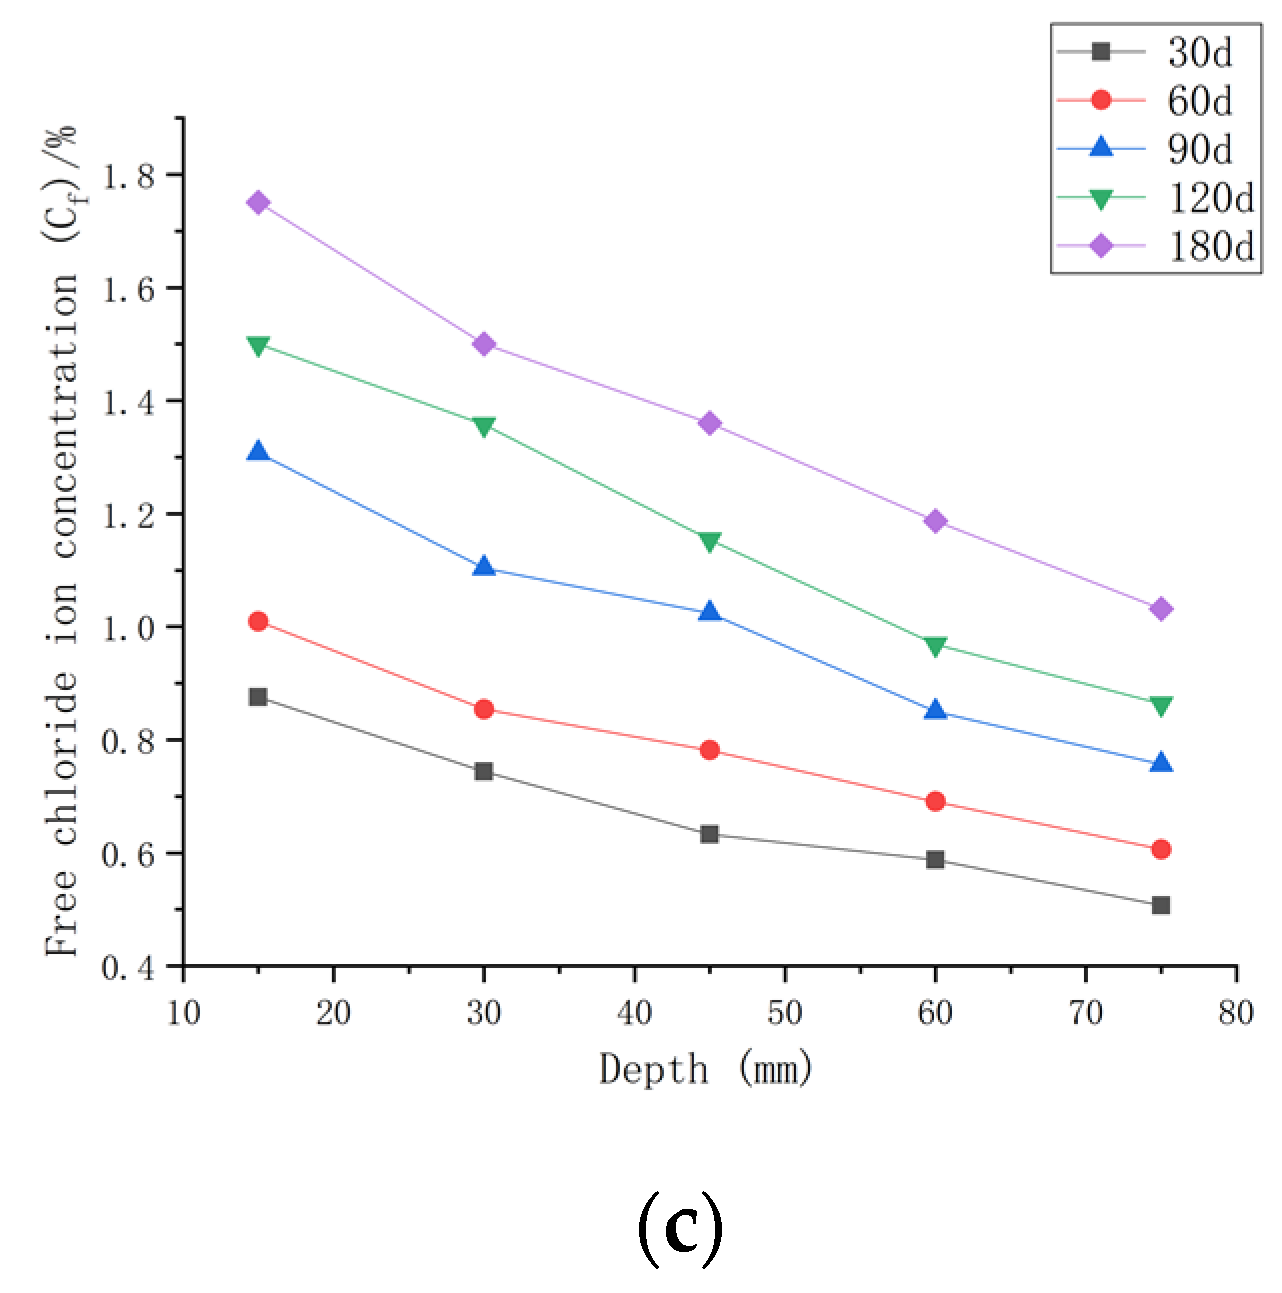
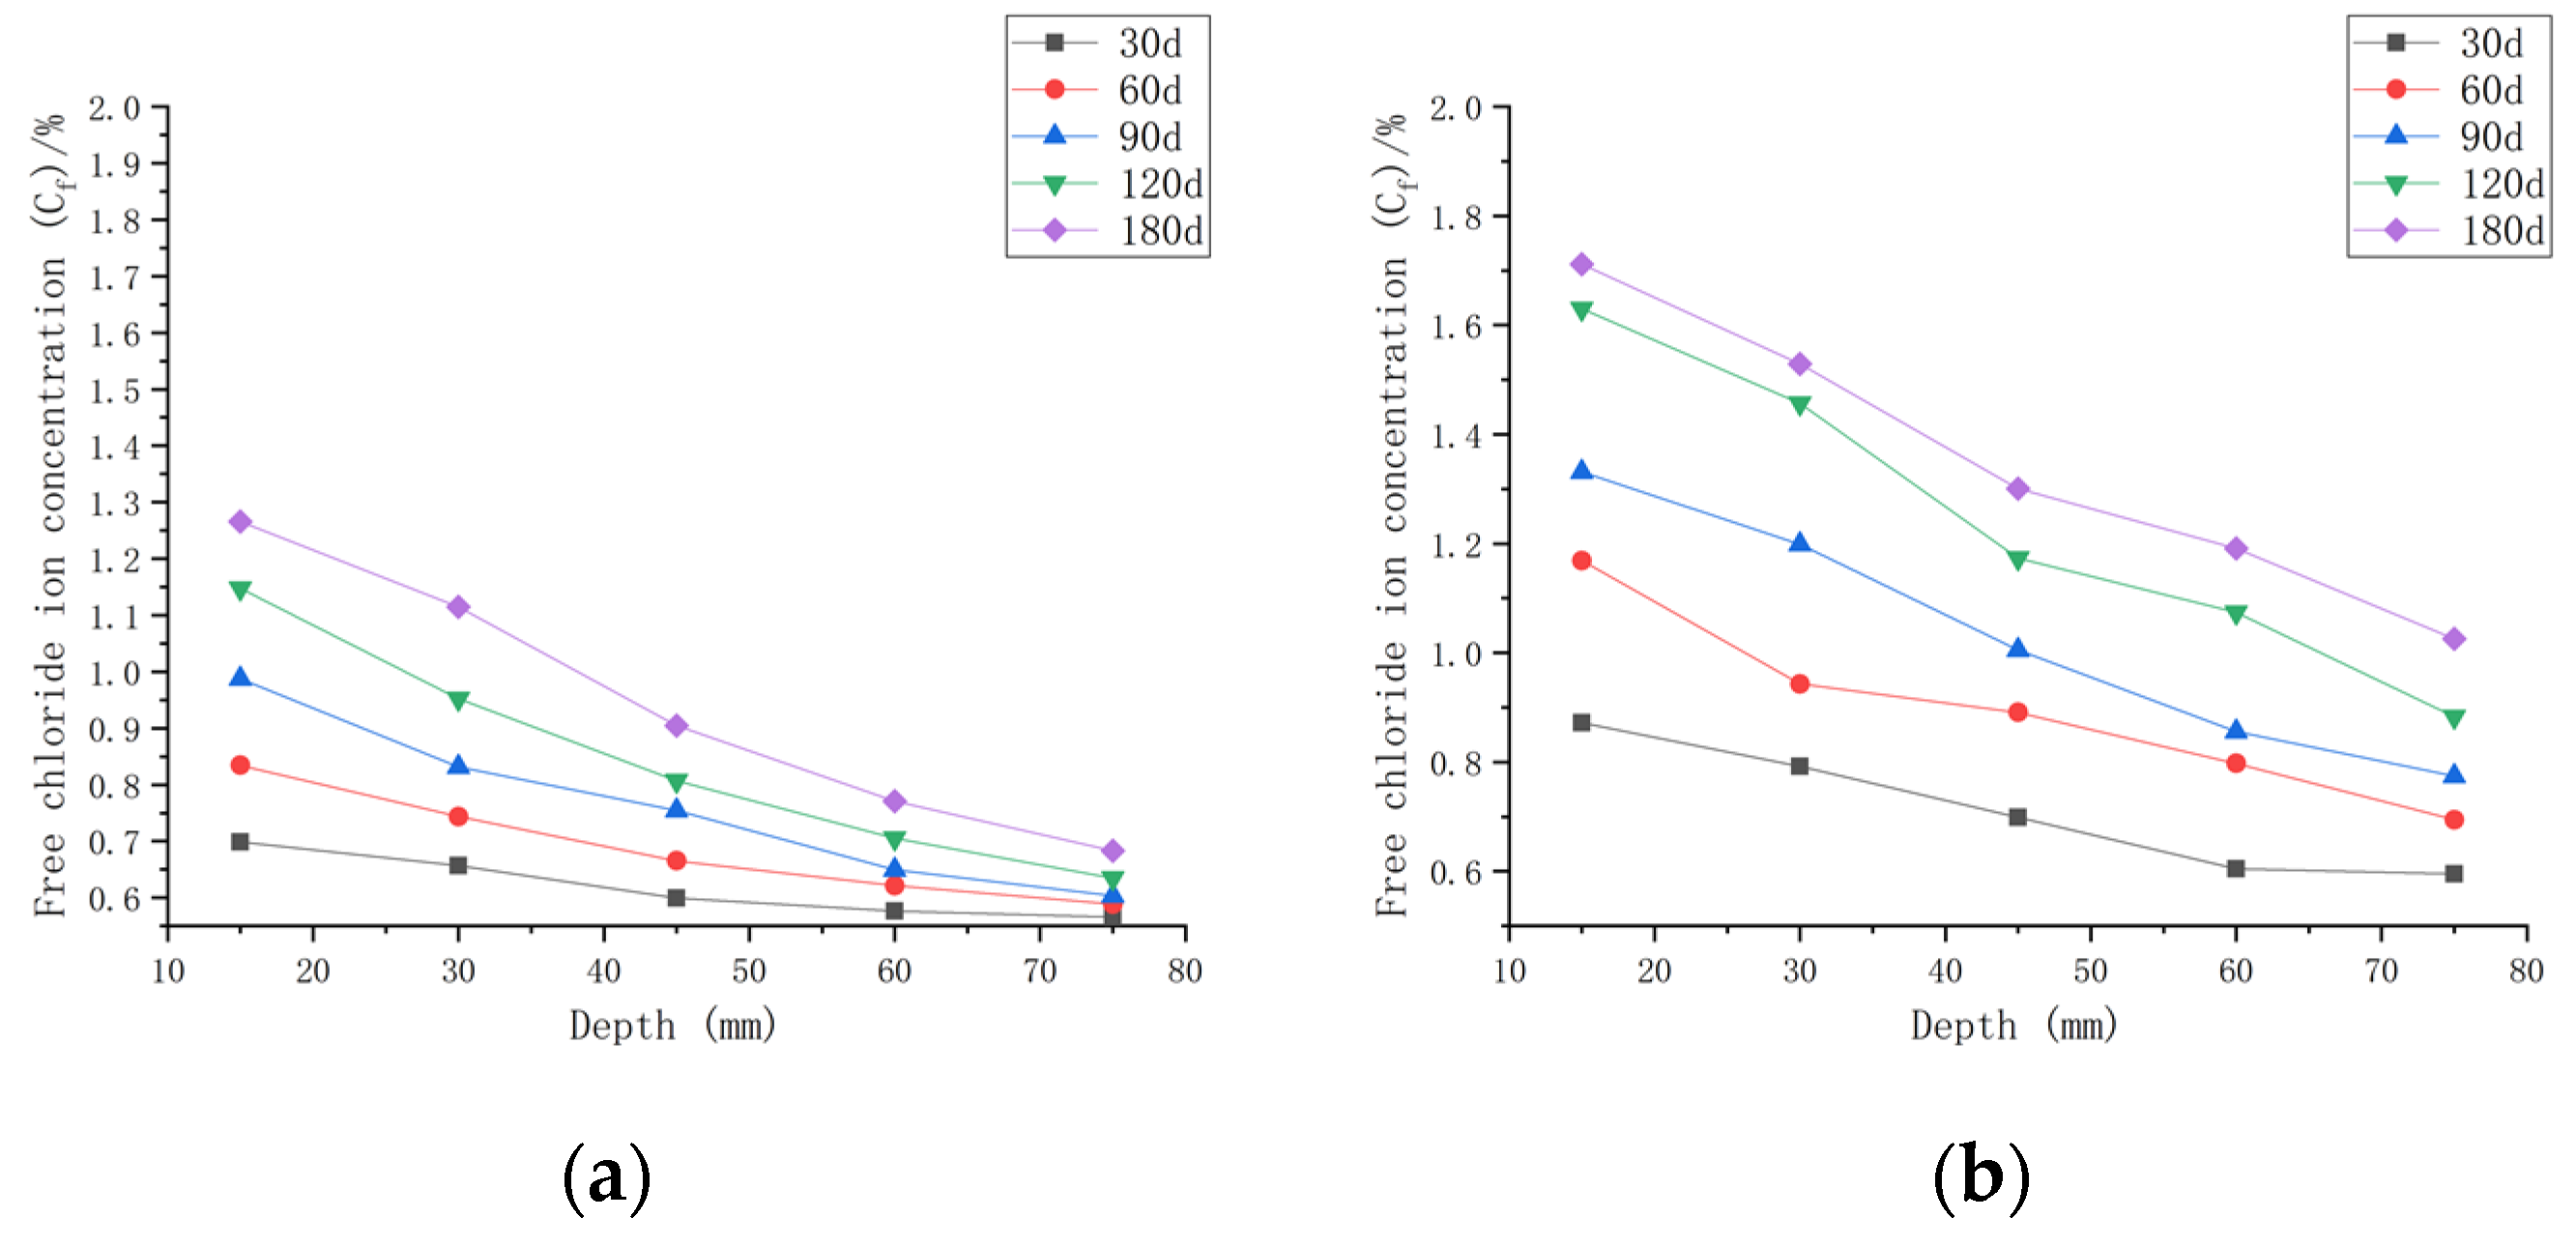
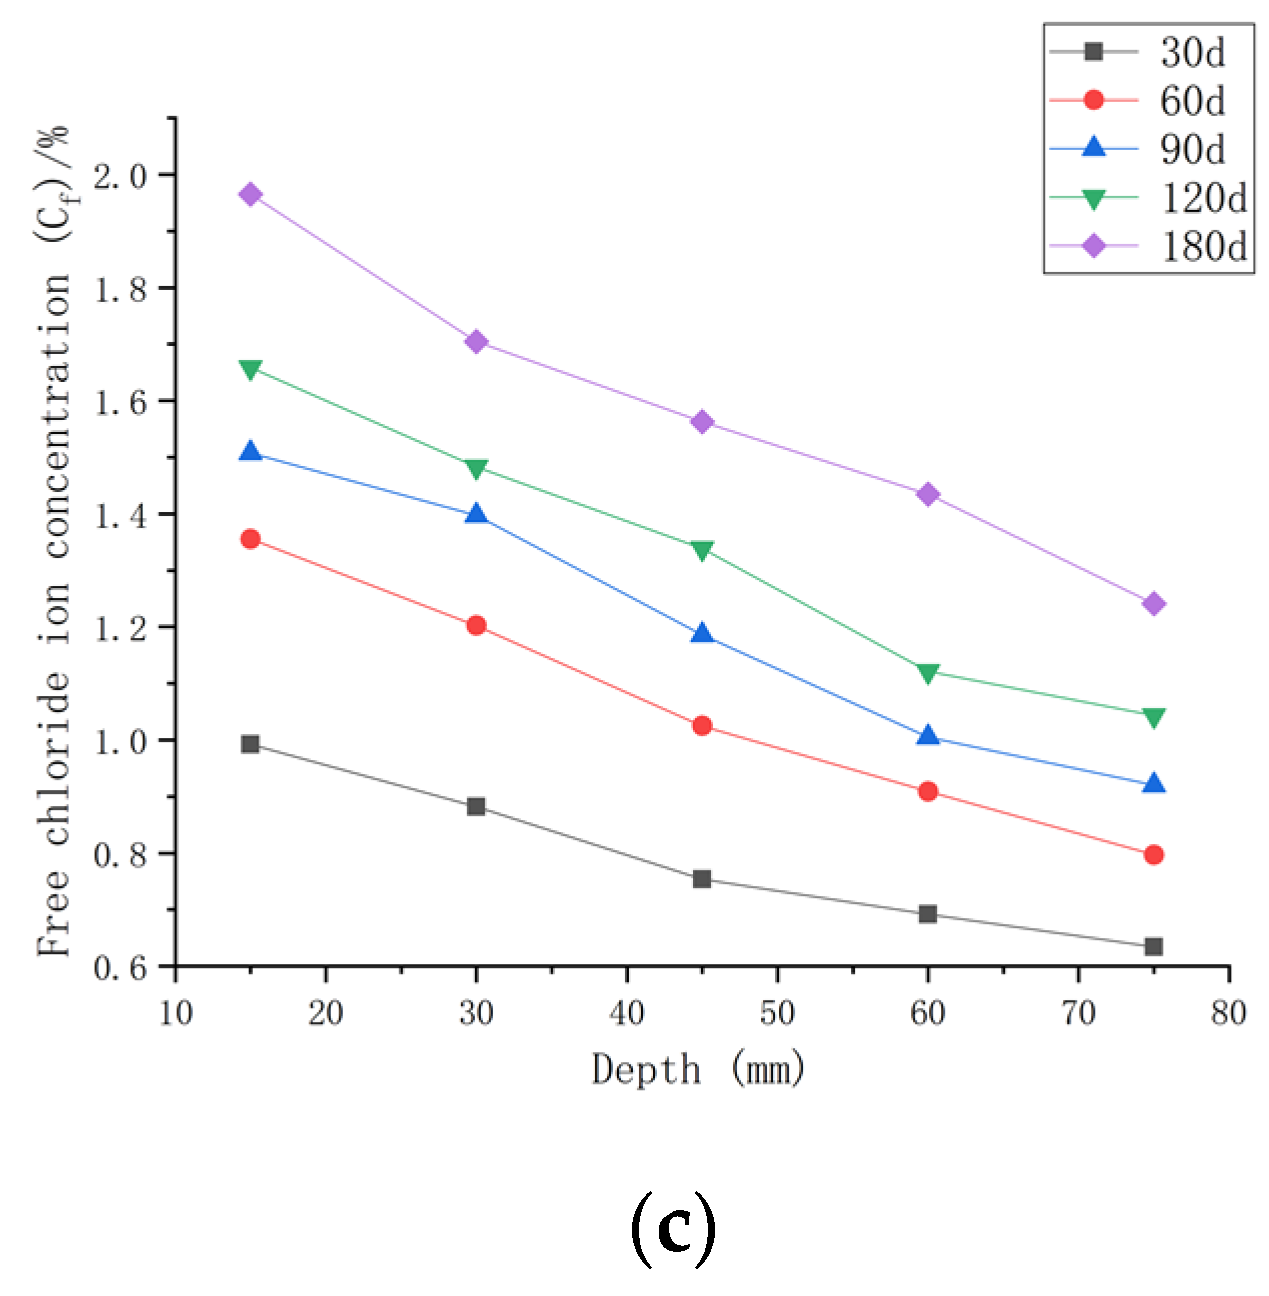
3.2.1. The Free Chloride Ion Concentration (Cf)
The Chloride Ion Transport Law with the Same Water–Cement Ratio and Load
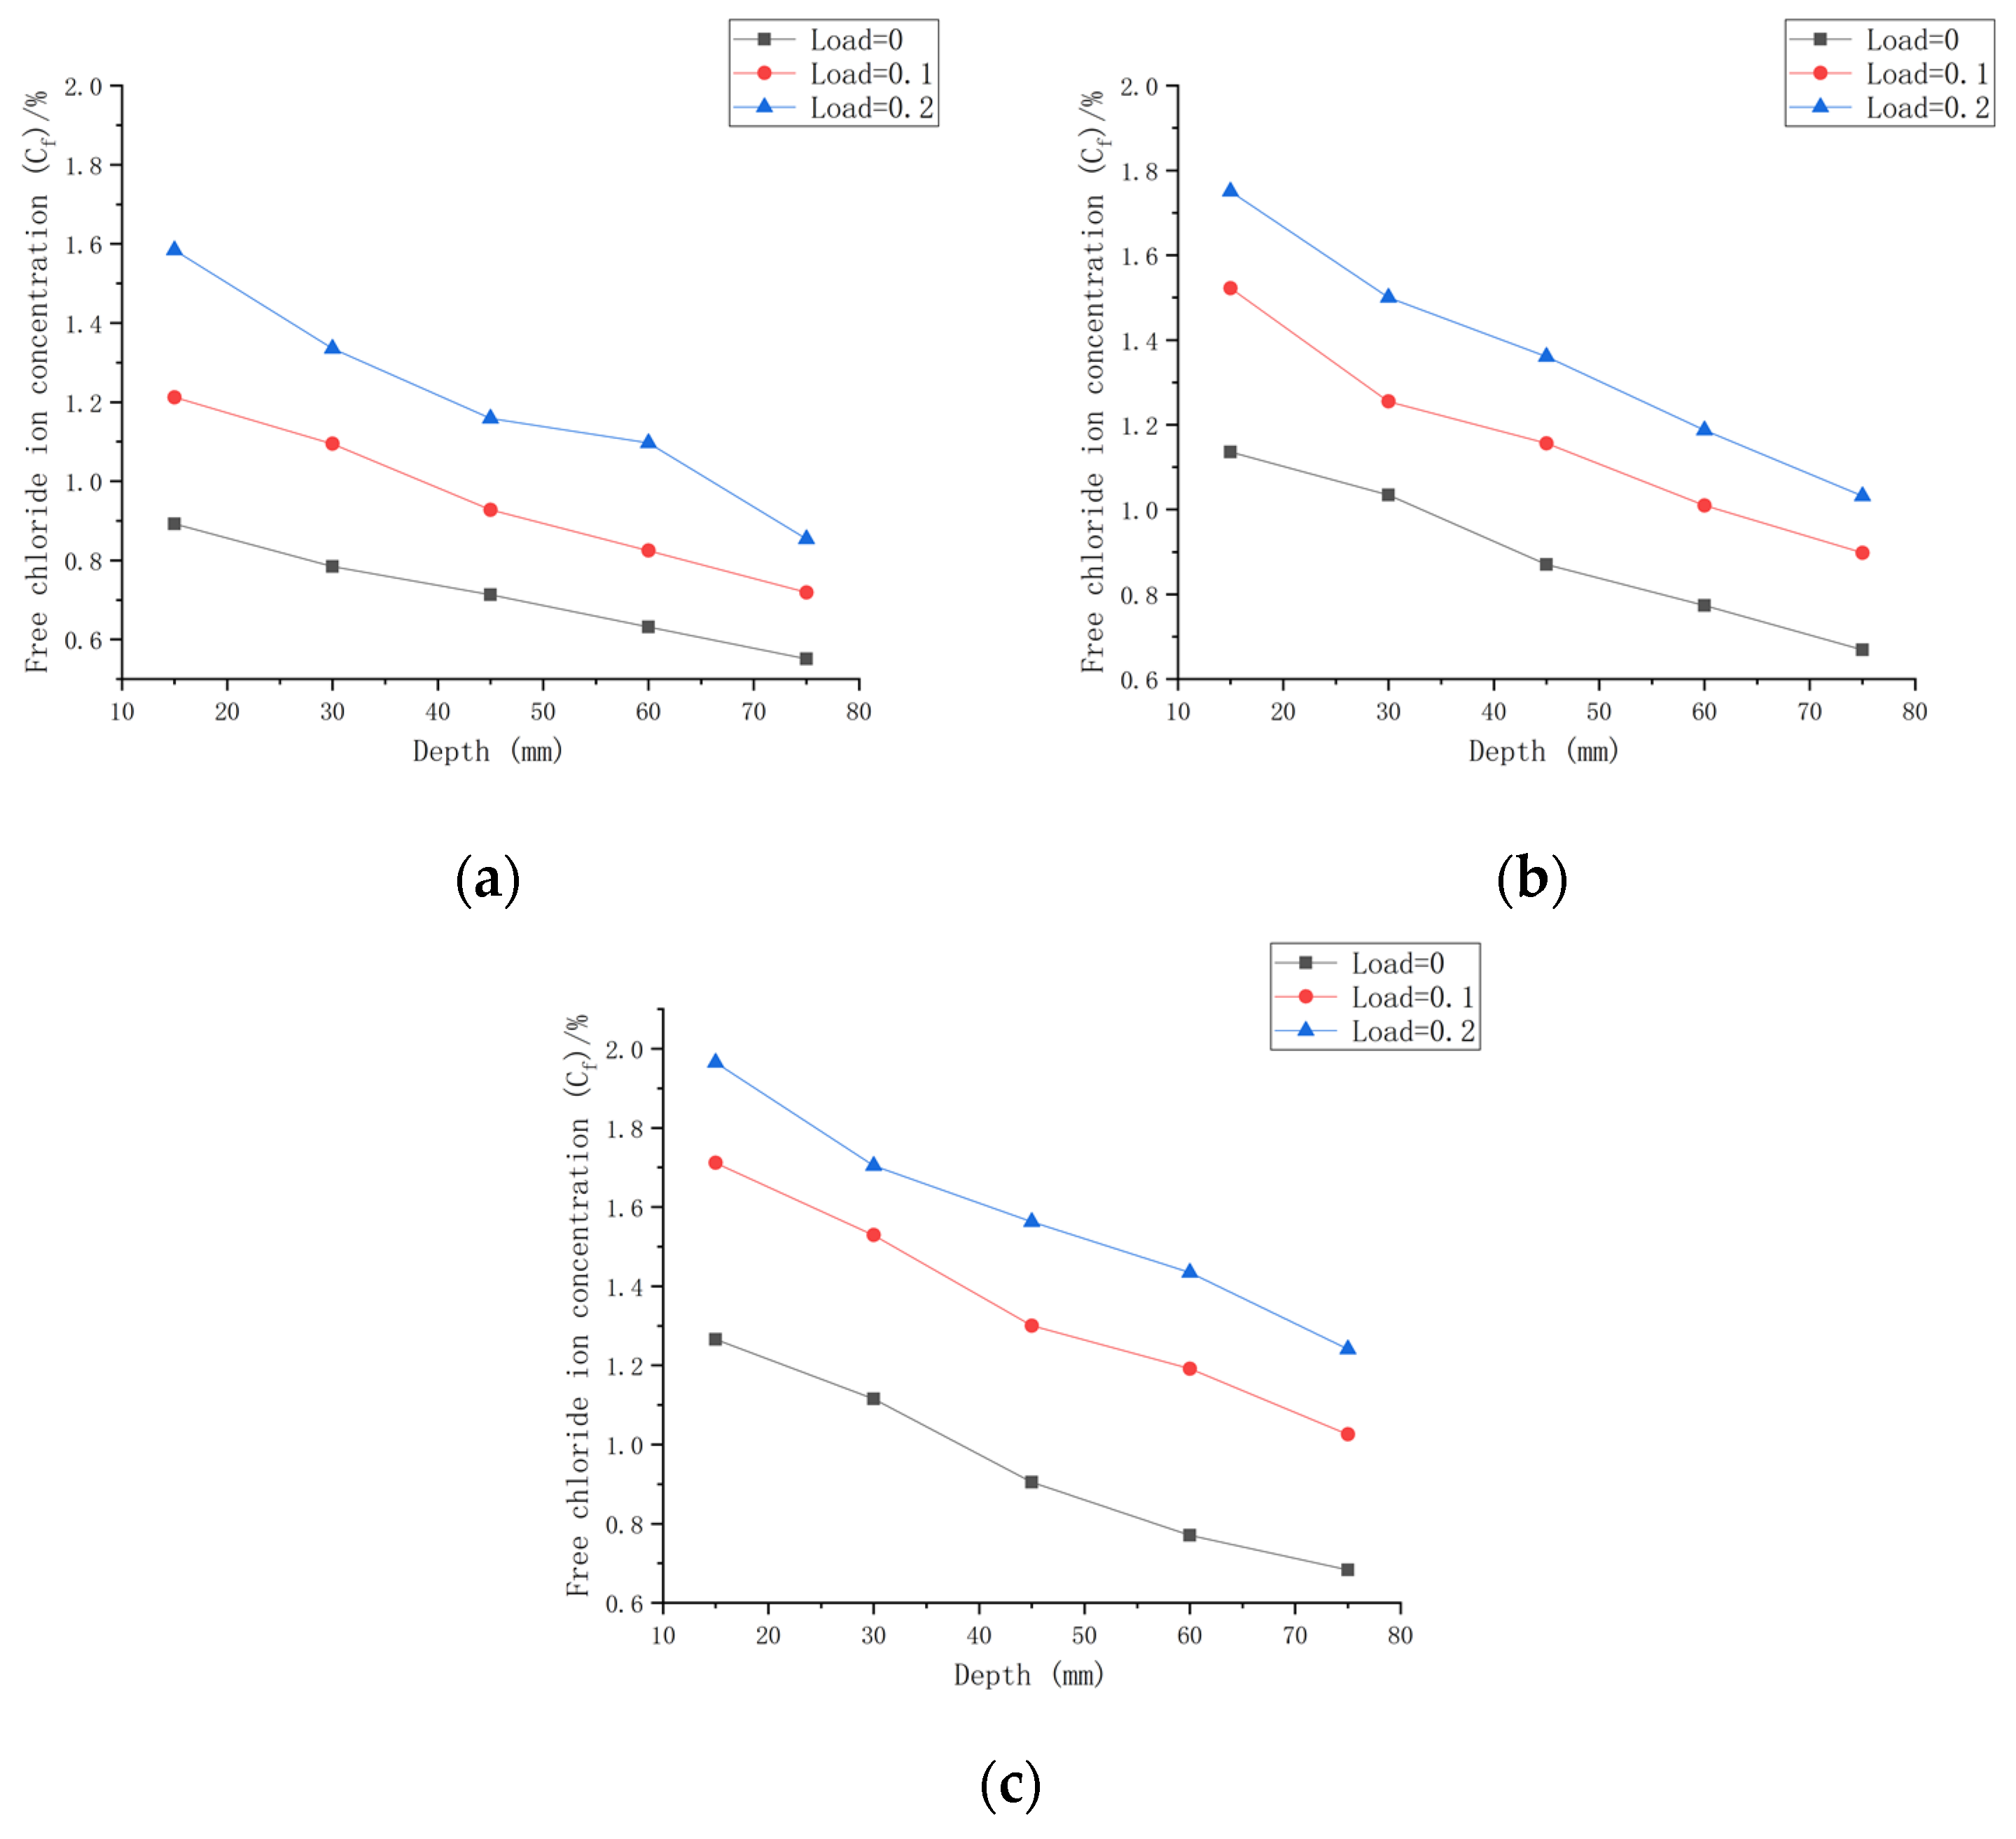
The Chloride Ion Transport Law under the Same Water–Cement Ratio and Different Loads
3.2.2. Calculation of Apparent Chloride Concentration (CS)
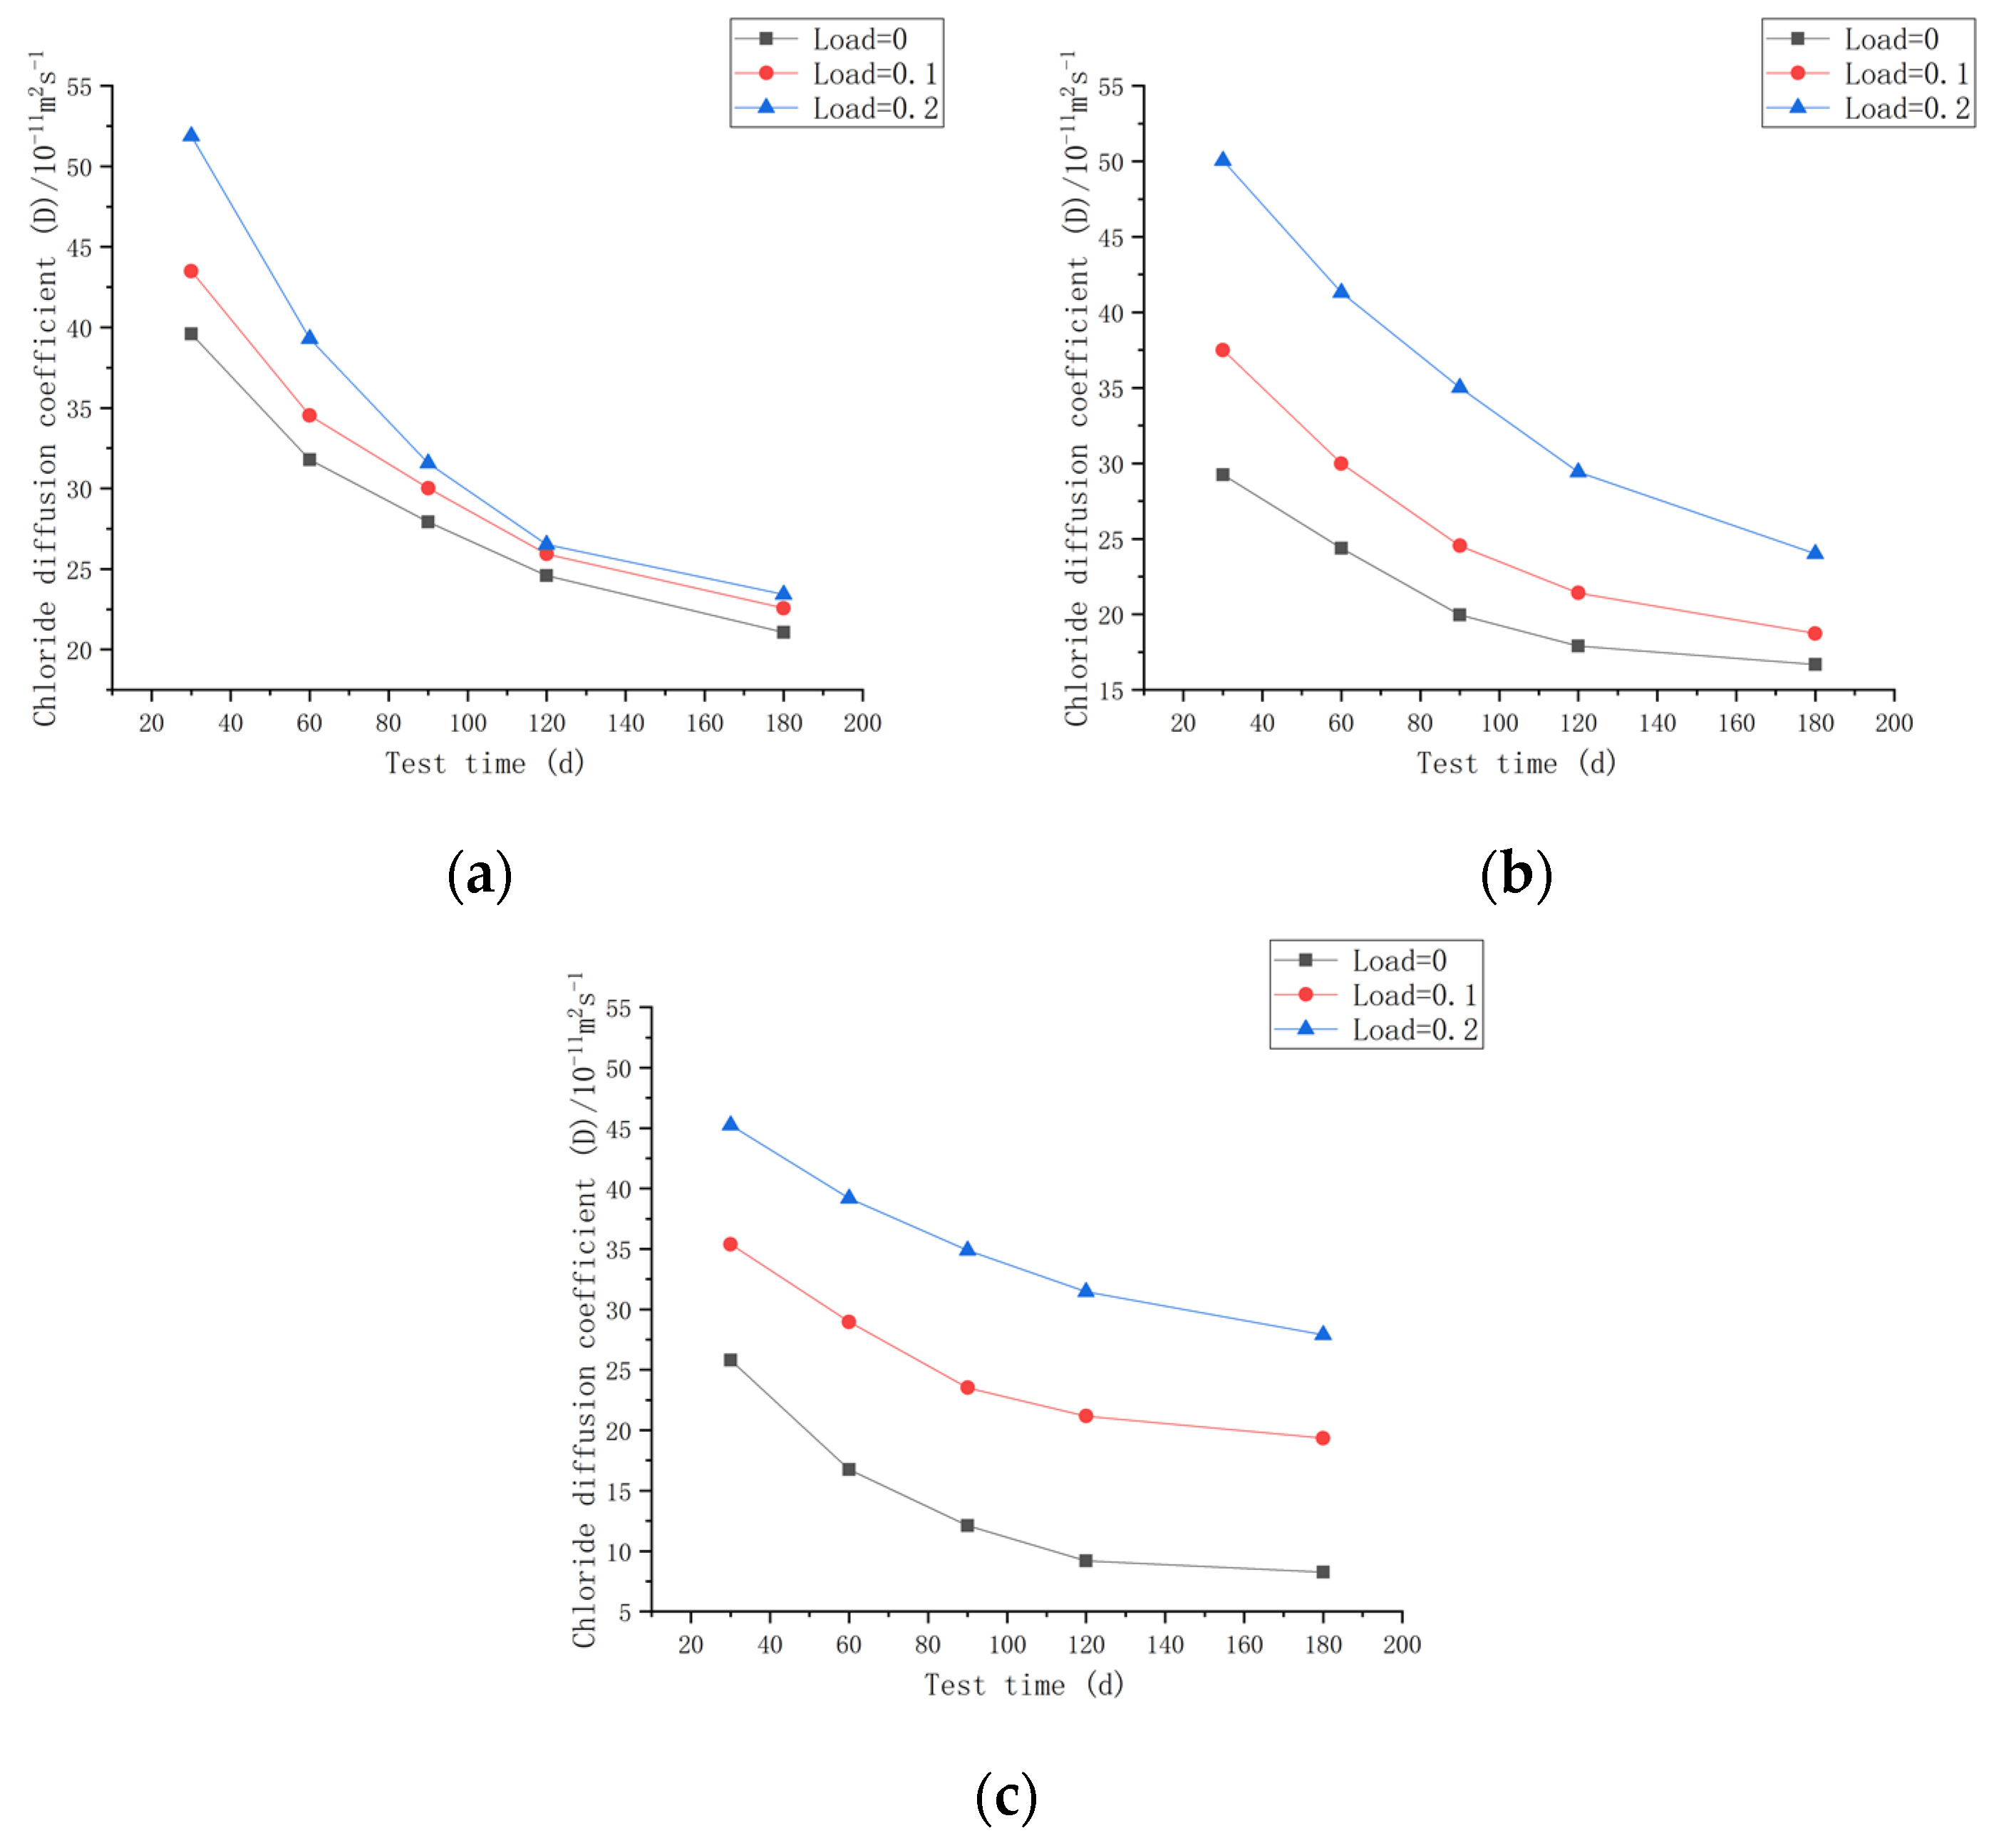
3.2.3. Chloride Ion Diffusion Coefficient (D)
Calculation and Analysis of Chloride Ion Diffusion Coefficient (D)
Chloride Ion Diffusion Coefficient (D) Fitting
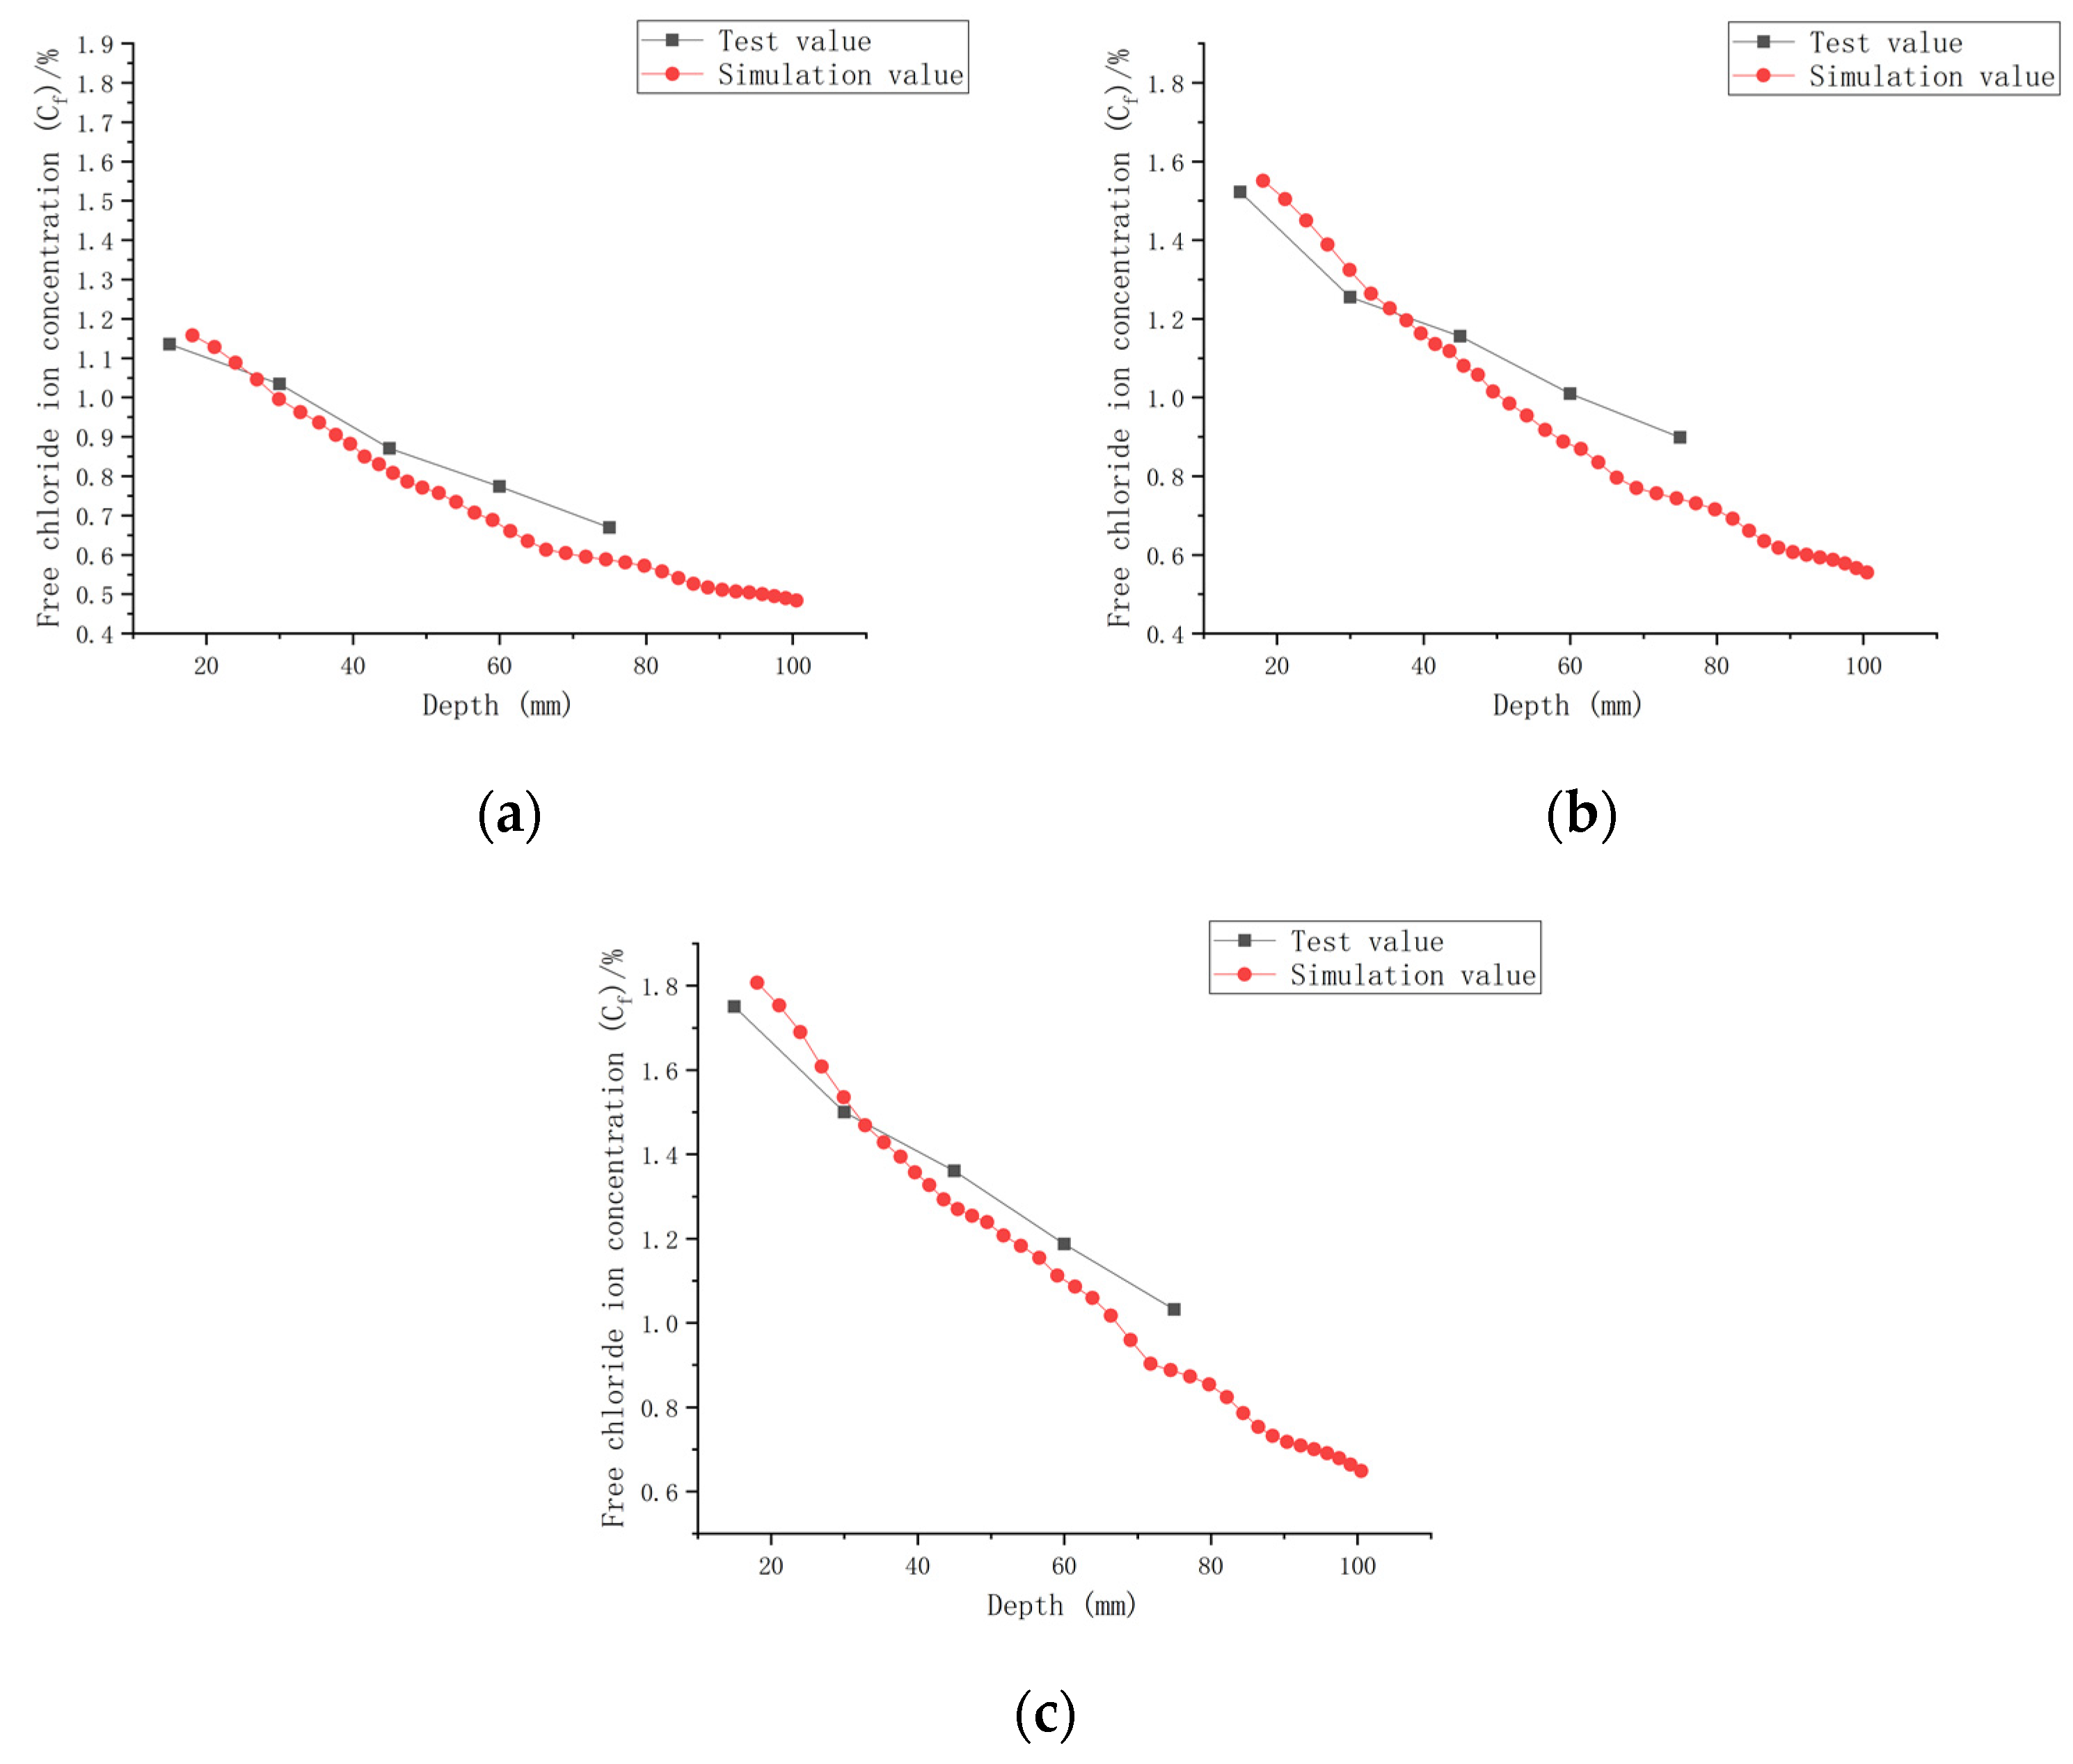
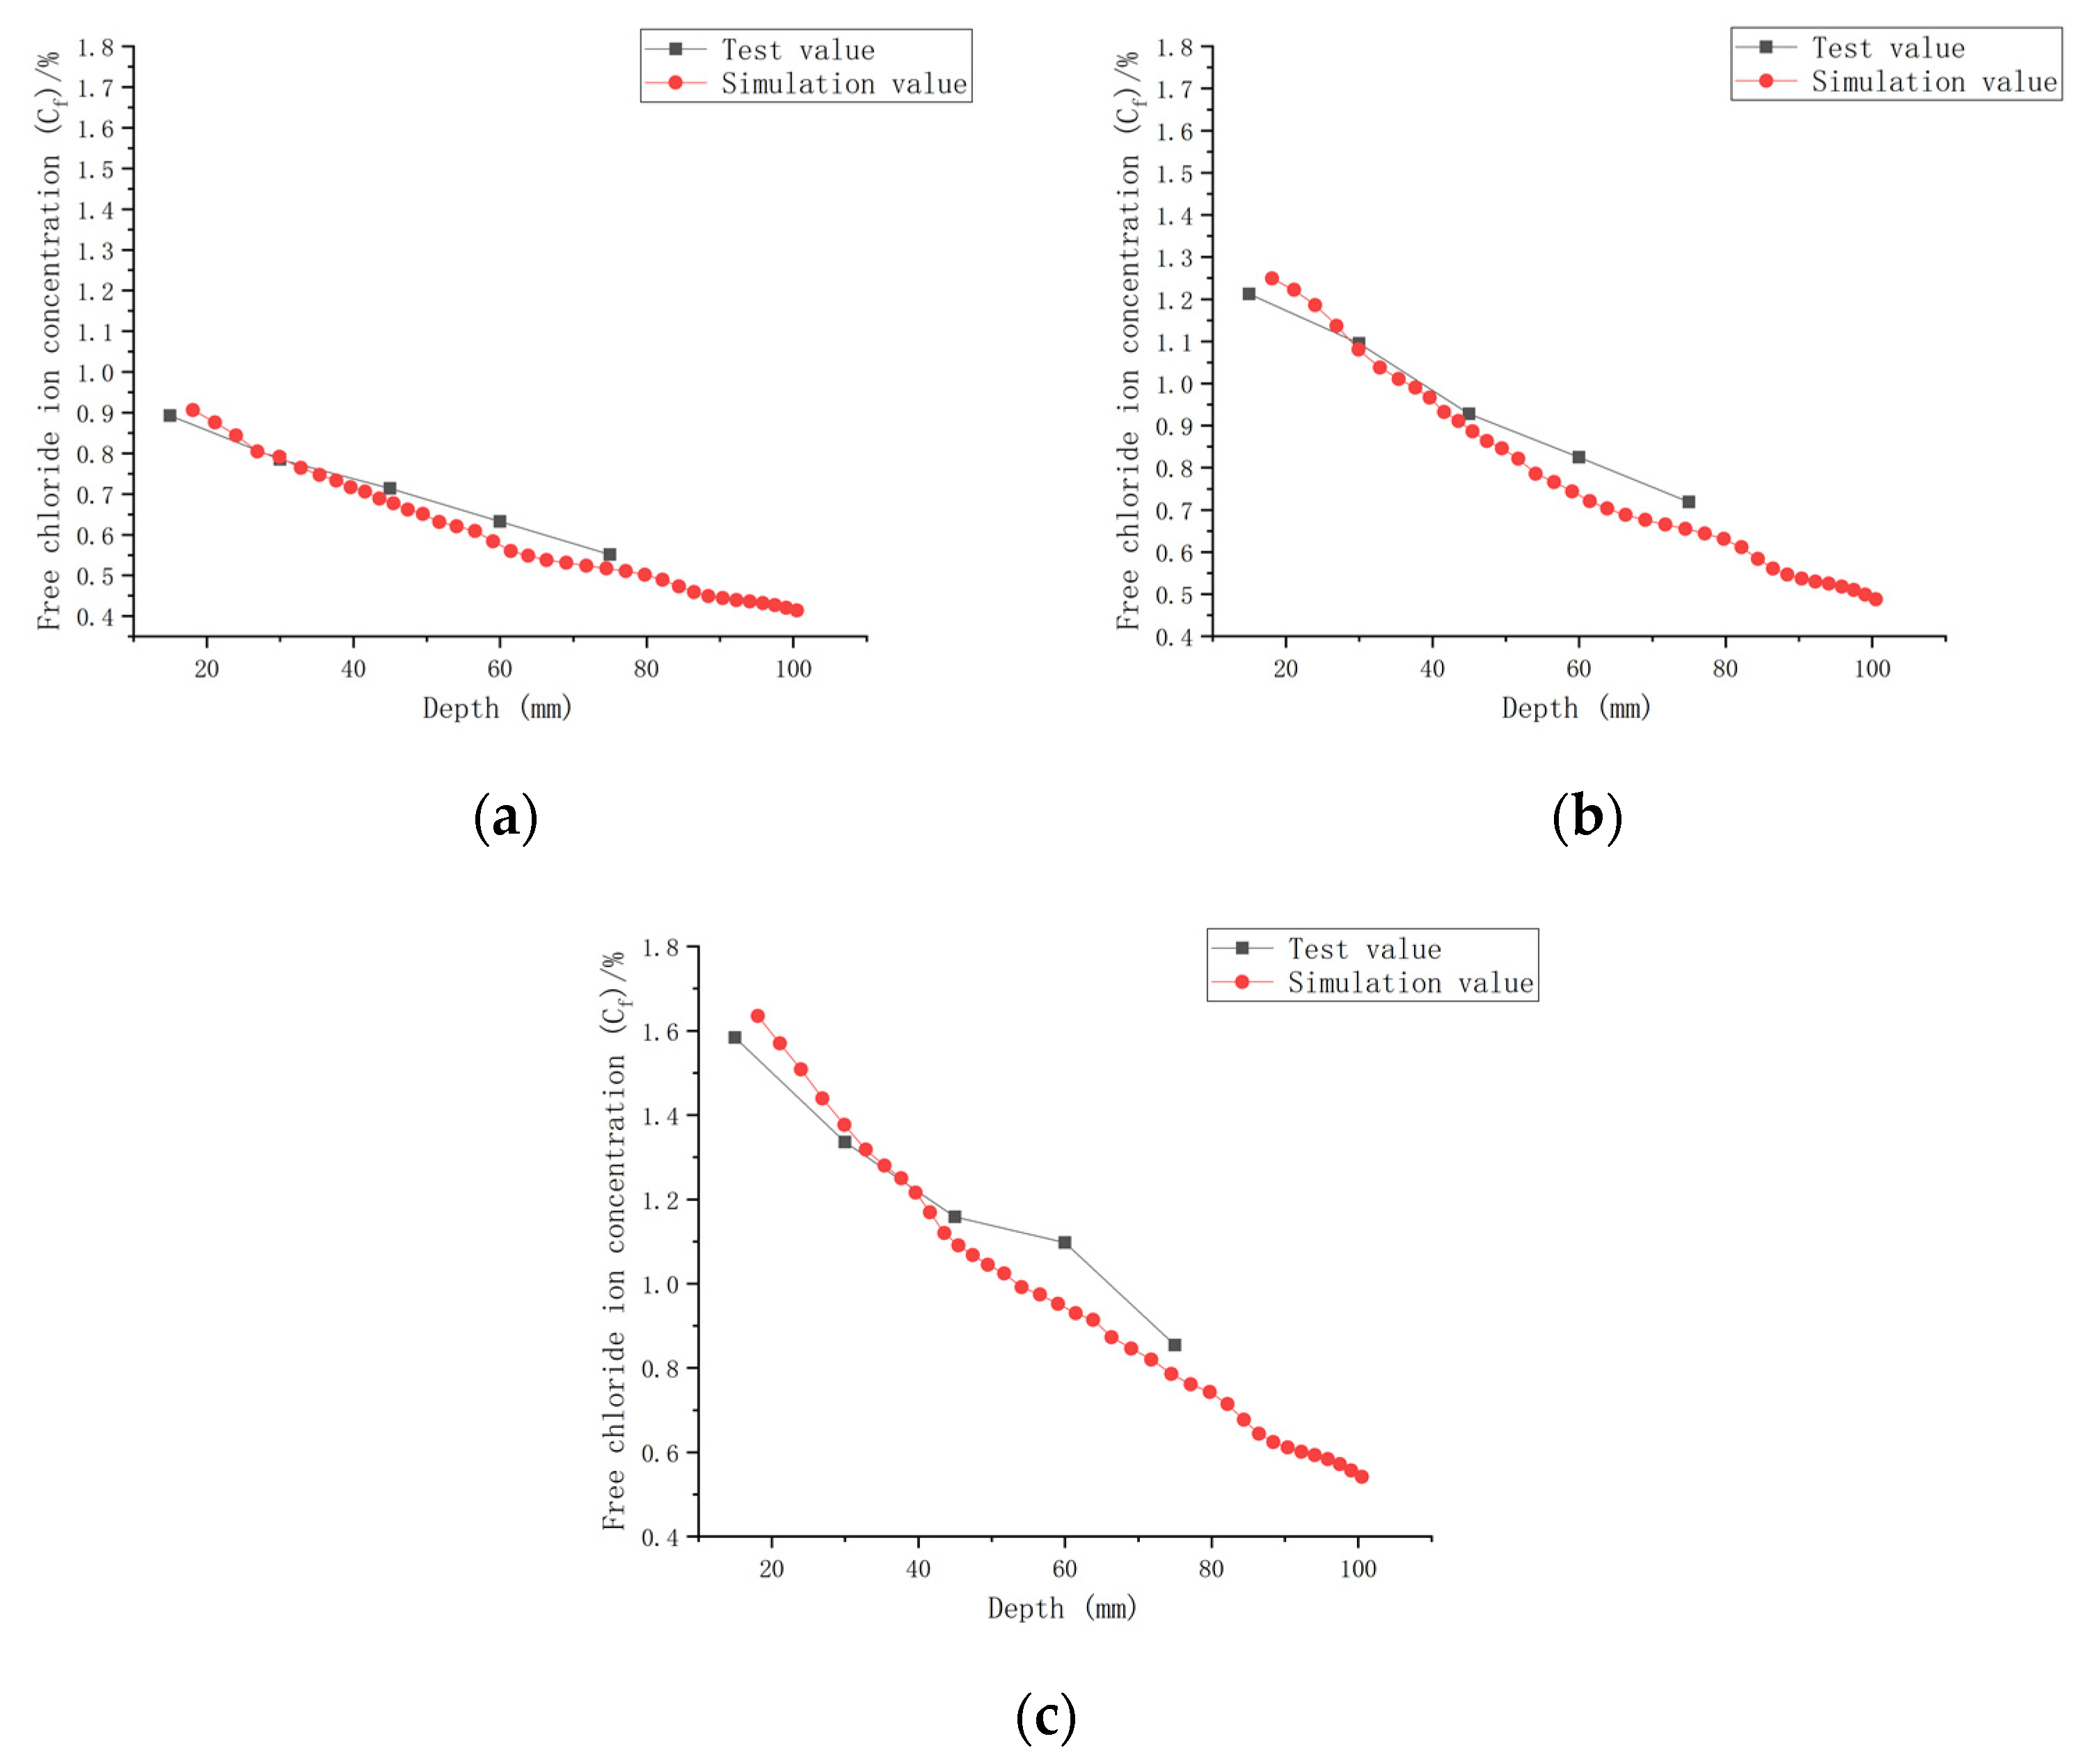
3.3. COMSOL Software Chloride Ion Transport Simulation
3.3.1. Transport Model
- (1)
- Theoretical equations of chloride ion transport
- (2)
- Initial conditions
- (3)
- Boundary conditions and oxygen diffusion concentration
- (4)
- Chloride ion diffusion coefficient
3.3.2. Analysis of COMSOL Results
4. Conclusions
- (1)
- The applied load has a significant impact on the performance of CASC. With the increase in applied load, CASC internal pores expanded, leading to the acceleration of chloride ion transport.
- (2)
- The water–cement ratio not only affects the strength of CASC, but also has a direct impact on chloride ion transport. Variation in the water–cement ratio altered the initial chloride ion concentration in CASC, producing different concentration gradients. A decrease in the water–cement ratio decreased the initial chloride ion concentration; however, it increased the concentration gradient and the transport speed.
- (3)
- Under the combined study of the water–cement ratio and load, when the water–cement ratio was decreased, the strength of CASC improved, while the diffusion coefficient decreased at a faster rate under the same load. Conversely, when the water–cement ratio was increased, the strength of CASC decreased, while the diffusion coefficient decreased at a slower rate under the same load.
- (4)
- Numerical simulation methods in COMSOL software were applied to the established chloride ion transport model for CASC, and it was concluded that the calculated model values correlated well with the physical test values. The variation curve for the chloride ion concentration with time was in good agreement with the simulated data curve. It was proved that the model has good applicability and accuracy for simulating chloride ion transport in CASC and simultaneously clarifying the chloride ion transport process in CASC.
Author Contributions
Funding
Institutional Review Board Statement
Informed Consent Statement
Data Availability Statement
Conflicts of Interest
References
- Zuquan, J.; Xia, Z.; Tiejun, Z.; Jianqing, L. Chloride ions transportation behavior and binding capacity of concrete exposed to different marine corrosion zones. Constr. Build. Mater. 2018, 177, 170–183. [Google Scholar] [CrossRef]
- Liu, Q.; Sun, L.; Zhu, X.; Xu, L.; Zhao, G. Chloride transport in the reinforced concrete column under the marine environment: Distinguish the atmospheric, tidal-splash and submerged zones. Structures 2022, 39, 365–377. [Google Scholar] [CrossRef]
- Touil, B.; Ghomari, F.; Khelidj, A.; Bonnet, S.; Amiri, O. Durability assessment of the oldest concrete structure in the Mediterranean coastline: The Ghazaouet harbour. Mar. Struct. 2022, 81, 103121. [Google Scholar] [CrossRef]
- Wang, Z.Z.; Jiang, S.H. Characterizing geotechnical site investigation data: A comparative study using a novel distribution model. Acta Geotech. 2022, 1–19. [Google Scholar] [CrossRef]
- Li, K.Q.; Li, D.Q.; Liu, Y. Meso-scale investigations on the effective thermal conductivity of multi-phase materials using the finite element method. Int. J. Heat. Mass. Tran. 2020, 151, 119383. [Google Scholar] [CrossRef]
- Ju, X.; Wu, L.; Lin, C.; Yang, X.; Yang, C. Prediction of chloride concentration with elevation in concrete exposed to cyclic drying-wetting conditions in marine environments. Constr. Build. Mater. 2021, 278, 122370. [Google Scholar] [CrossRef]
- Pasupathy, K.; Sanjayan, J.; Rajeev, P.; Law, D. The effect of chloride ingress in reinforced geopolymer concrete exposed in the marine environment. J. Build. Eng. 2021, 39, 102281. [Google Scholar] [CrossRef]
- Zhang, J.J. Characteristic of Chloride ion Transport in Concrete under Loading Effect; Shijiazhuang Tiedao University: Shaoxing, China, 2019. (In Chinese) [Google Scholar]
- Sun, P.P.; Zhao, T.J.; Jin, Z.Q.; Gao, X.; Xu, J. Rules of Chloride Iron Ingression in Concrete under Marine Environment. Tunn. Constr. 2011, 31, 573–574. (In Chinese) [Google Scholar]
- Wang, S.N. Development and current situation for durability technology of marine concrete in China. Port Waterw. Eng. 2010, 10, 17–118. (In Chinese) [Google Scholar]
- Da, B.; Chen, Y.; Yu, H.; Ma, H.; Chen, D.; Wu, Z.; Liu, J.; Li, Y. Preparation technology, mechanical properties and durability of coral aggregate seawater concrete in the island-reef environment. J. Clean. Prod. 2022, 339, 130572. [Google Scholar] [CrossRef]
- Huang, D.; Niu, D.; Su, L.; Pan, D.; Liu, Y. Durability of coral aggregate concrete under coupling action of sulfate, chloride and drying-wetting cycles. Case Stud. Constr. Mater. 2022, 16, e01003. [Google Scholar] [CrossRef]
- Yu, H.; Da, B.; Ma, H.; Dou, X.; Wu, Z. Service life prediction of coral aggregate concrete structure under island reef environment. Constr. Build. Mater. 2020, 246, 118390. [Google Scholar] [CrossRef]
- Niu, D.; Zhang, L.; Fu, Q.; Wen, B.; Luo, D. Critical conditions and life prediction of reinforcement corrosion in coral aggregate concrete. Constr. Build. Mater. 2020, 238, 117685. [Google Scholar] [CrossRef]
- Wang, A.; Lyu, B.; Zhang, Z.; Liu, K.; Xu, H.; Sun, D. The development of coral concretes and their upgrading technologies: A critical review. Constr. Build. Mater. 2018, 187, 1004–1019. [Google Scholar] [CrossRef]
- Zhou, W.; Feng, P.; Lin, H. Constitutive relations of coral aggregate concrete under uniaxial and triaxial compression. Constr. Build. Mater. 2020, 251, 118957. [Google Scholar] [CrossRef]
- Wu, Z.; Yu, H.; Ma, H.; Zhang, J.; Da, B.; Zhu, H. Rebar corrosion in coral aggregate concrete: Determination of chloride threshold by LPR. Corros. Sci. 2020, 163, 108238. [Google Scholar] [CrossRef]
- Wang, A.; Zhang, Z.; Liu, K.; Xu, H.; Shi, L.; Sun, D. Coral aggregate concrete: Numerical description of physical, chemical and morphological properties of coral aggregate. Cem. Concr. Compos. 2019, 100, 25–34. [Google Scholar]
- Yang, S.; Zhang, X.; Yu, M.; Yao, J. An analytical approach to predict fracture parameters of coral aggregate concrete immersed in seawater. Ocean Eng. 2019, 191, 106508. [Google Scholar] [CrossRef]
- Tang, J.; Cheng, H.; Zhang, Q.; Chen, W.; Li, Q. Development of properties and microstructure of concrete with coral reef sand under sulphate attack and drying-wetting cycles. Constr. Build. Mater. 2018, 165, 647–654. [Google Scholar] [CrossRef]
- Wu, J.; Li, H.; Wang, Z.; Liu, J. Transport model of chloride ions in concrete under loads and drying-wetting cycles. Constr. Build. Mater. 2016, 112, 733–738. [Google Scholar] [CrossRef]
- Xu, X.Y. Study on chloride transport in concrete under load. Concrete 2021, 2, 47–67. (In Chinese) [Google Scholar]
- Fu, Q.; Bu, M.; Zhang, Z.; He, J.; Li, D.; Xu, W.; Niu, D. Chloride ion transport performance of lining concrete under coupling the action of flowing groundwater and loading. Cem. Concr. Compos. 2021, 123, 104166. [Google Scholar] [CrossRef]
- Wang, Y.; Lin, C.; Cui, Y. Experiments of chloride ingression in loaded concrete members under the marine environment. J. Mater. Civ. Eng. 2014, 26, 04014012. [Google Scholar] [CrossRef]
- Chen, X.D.; Liu, G.Y.; Yu, A.P.; Chen, P.; Liang, Q.Q. Numerical Simulation of Chloride Diffusion Based on 2D Concrete Random Mesoscopic Model. J. Mater. Sci. Eng. 2020, 38, 669–673. (In Chinese) [Google Scholar]
- Liu, Z.R.; Yuan, C.K.; Li, S.S.; Wang, Y.Z. Micro-scale numerical simulation of chloride diffusion in concrete under load effect. J. Waterw. Harb. 2021, 42, 94–103. (In Chinese) [Google Scholar]
- Xu, J.; Peng, C.; Wan, L.; Wu, Q. Effect of crack self-healing on concrete diffusivity: Mesoscale dynamics simulation study. J. Mater. Civ. Eng. 2020, 32, 04020149. [Google Scholar] [CrossRef]
- ASTM D1141; Standard Practice for the Preparation of Substitute Ocean Water. American Society for Testing and Materials: Conshohocken, PA, USA, 2013.
- GBT50081-201; Standard for Test Method of Mechanical Properties of Ordinary Concrete. China Construction Industry Press: Beijing, China, 2019. (In Chinese)
- JGJ/T 322-2013; Standard for Technical Specification for text of Chloride ion Content in Concrete. China Construction Industry Press: Beijing, China, 2013. (In Chinese)
- Dou, X.M.; Yu, H.F.; Ma, H.Y.; Da, B.; Yuan, Y.F.; Mi, R.J.; Zu, H.W. Experiment on chloride diffusion coefficient of CASC exposed to marine environment. Ocean. Eng. 2017, 35, 129–135. (In Chinese) [Google Scholar]


| Components | SiO2 | Al2O3 | Fe2O3 | CaO | MgO | SO3 | Cl− | LOSS |
|---|---|---|---|---|---|---|---|---|
| Content (%) | 24.99 | 8.26 | 4.03 | 51.42 | 3.71 | 2.51 | 0.043 | 3.31 |
| Apparent Density kg/m3 | Stacking Density kg/m3 | Cylinder Compression Strength MPa | Porosity % | Natural Water Content % | 1 h Water Absorption Rate% | Mud Content % |
|---|---|---|---|---|---|---|
| 1865 | 928 | 1.6 | 55 | 0.1 | 17.1 | 0.58 |
| Apparent Density kg/m3 | Stacking Density kg/m3 | Void Ratio % | Natural Water Content % | 1 h Water Absorption Rate % | Mud Content % |
|---|---|---|---|---|---|
| 2450 | 1163 | 48 | 0.3 | 13.2 | 0.58 |
| Name | Molecular Formula | Quality (g/L) |
|---|---|---|
| Sodium chloride | NaCl | 46.934 |
| Magnesium chloride | MgCl2 | 9.962 |
| Sodium sulfate | Na2SO4 | 7.834 |
| Calcium chloride | CaCl2 | 2.204 |
| Potassium chloride | KCl | 1.328 |
| Concrete Strength Grade | Water– Cement Ratio | Artificial Seawater (kg/m3) | Cementitious Material (kg/m) | Coral Sand (kg/m3) | Coral Reef (kg/m3) | Water Reducing Agent (kg/m3) |
|---|---|---|---|---|---|---|
| C30 | 0.30 | 167 | 557 | 765 | 762 | 4 |
| C30 | 0.35 | 195 | 557 | 749 | 749 | 4 |
| C30 | 0.40 | 223 | 557 | 733 | 736 | 4 |
| W/C = 0.30 | W/C = 0.35 | W/C = 0.40 | |||||||
|---|---|---|---|---|---|---|---|---|---|
| Compressive strength/MPa | 38.0 | 33.2 | 35.8 | 37.1 | 34.2 | 31.2 | 34.2 | 30.3 | 36.1 |
| Average strength/MPa | 35.67 | 34.17 | 33.53 | ||||||
| Number | a | b | c | Relevance |
|---|---|---|---|---|
| Cs,0.30,0 | 0.01118 | −0.0065 | 10,061,300 | 0.99297 |
| Cs,0.30,0.1 | 0.02064 | −0.01351 | 23,015,700 | 0.99971 |
| Cs,0.30,0.2 | 0.02086 | −0.01603 | 9,275,530 | 0.99057 |
| Cs,0.35,0 | 0.02421 | −0.01952 | 28,566,900 | 0.99988 |
| Cs,0.35,0.1 | 0.02082 | −0.01621 | 9,915,150 | 0.99258 |
| Cs,0.35,0.2 | 0.03044 | −0.02369 | 19,083,800 | 0.99939 |
| Cs,0.40,0 | 0.01867 | −0.0141 | 11,025,700 | 0.99498 |
| Cs,0.40,0.1 | 0.02159 | −0.017 | 6,953,770 | 0.97481 |
| Cs,0.40,0.2 | 0.02472 | −0.01719 | 9,255,250 | 0.9905 |
| Water to Cement Ratio | Load | Cs (%) | ||||
|---|---|---|---|---|---|---|
| 30 d | 60 d | 90 d | 120 d | 180 d | ||
| 0.30 | 0 | 0.6033 | 0.7594 | 0.8062 | 0.8707 | 0.9872 |
| 0.1 | 0.8618 | 0.9734 | 1.11 | 1.203 | 1.376 | |
| 0.2 | 0.8916 | 1.118 | 1.326 | 1.568 | 1.778 | |
| 0.35 | 0 | 0.6392 | 0.7975 | 0.9185 | 1.077 | 1.286 |
| 0.1 | 0.8296 | 1.1273 | 1.346 | 1.5 | 1.748 | |
| 0.2 | 1.021 | 1.141 | 1.478 | 1.734 | 1.97 | |
| 0.40 | 0 | 0.7717 | 0.9503 | 1.146 | 1.377 | 1.502 |
| 0.1 | 1.005 | 1.329 | 1.543 | 1.881 | 1.941 | |
| 0.2 | 1.147 | 1.553 | 1.714 | 1.868 | 2.172 | |
| Water to Cement Ratio | Load | D (10−11m2s−1) | ||||
|---|---|---|---|---|---|---|
| 30 d | 60 d | 90 d | 120 d | 180 d | ||
| 0.30 | 0 | 39.601 | 0.30 | 0 | 39.601 | 0.30 |
| 0.1 | 43.494 | 34.531 | 0.1 | 43.494 | 22.570 | |
| 0.2 | 51.889 | 39.307 | 0.2 | 51.889 | 23.432 | |
| 0.35 | 0 | 29.234 | 0.35 | 0 | 29.234 | 0.35 |
| 0.1 | 37.501 | 29.988 | 0.1 | 37.501 | 18.740 | |
| 0.2 | 50.059 | 41.301 | 0.2 | 50.059 | 24.023 | |
| 0.40 | 0 | 25.813 | 0.40 | 0 | 25.813 | 0.40 |
| 0.1 | 35.395 | 28.970 | 0.1 | 35.395 | 19.353 | |
| 0.2 | 45.247 | 39.177 | 0.2 | 45.247 | 27.893 | |
| Number | A | m | Relevance |
|---|---|---|---|
| D0.30,0 | 9.368 × 10⁻⁸ | −0.36324 | 0.99836 |
| D0.30,0.1 | 1.24 × 10⁻⁷ | −0.39218 | 0.99837 |
| D0.30,0.2 | 6.68 × 10⁻⁸ | −0.35438 | 0.99836 |
| D0.35,0 | 4.00 × 10⁻⁸ | −0.33245 | 0.99836 |
| D0.35,0.1 | 1.24 × 10⁻⁷ | −0.39218 | 0.99837 |
| D0.35,0.2 | 1.50 × 10⁻⁷ | −0.3845 | 0.99837 |
| D0.40,0 | 6.03 × 10⁻⁶ | −0.68085 | 0.99859 |
| D0.40,0.1 | 6.68 × 10⁻⁸ | −0.35438 | 0.99836 |
| D0.40,0.2 | 2.28 × 10⁻⁸ | −0.26446 | 0.99836 |
| Parameters | Symbols | Numerical Value |
|---|---|---|
| Geometric model length | La | 100 mm |
| Geometric model width | Lb | 150 mm |
| Diffusion coefficient (m2/s) | D | Equations (19) to (27) |
| Initial chloride ion concentration (%) | C0 | 0.3216%, 0.4204%, 0.5579% |
Disclaimer/Publisher’s Note: The statements, opinions and data contained in all publications are solely those of the individual author(s) and contributor(s) and not of MDPI and/or the editor(s). MDPI and/or the editor(s) disclaim responsibility for any injury to people or property resulting from any ideas, methods, instructions or products referred to in the content. |
© 2023 by the authors. Licensee MDPI, Basel, Switzerland. This article is an open access article distributed under the terms and conditions of the Creative Commons Attribution (CC BY) license (https://creativecommons.org/licenses/by/4.0/).
Share and Cite
Dai, G.; Wu, Q.; Lu, K.; Ma, S.; Wang, W.; Zhou, H.; Cai, C.; Han, Z.; Chen, J. Study of Chloride Ion Diffusion in Coral Aggregate Seawater Concrete with Different Water–Cement Ratios under Load. Materials 2023, 16, 869. https://doi.org/10.3390/ma16020869
Dai G, Wu Q, Lu K, Ma S, Wang W, Zhou H, Cai C, Han Z, Chen J. Study of Chloride Ion Diffusion in Coral Aggregate Seawater Concrete with Different Water–Cement Ratios under Load. Materials. 2023; 16(2):869. https://doi.org/10.3390/ma16020869
Chicago/Turabian StyleDai, Guangmin, Qing Wu, Kailong Lu, Shiliang Ma, Wei Wang, Hao Zhou, Chenggong Cai, Zuocheng Han, and Jiaming Chen. 2023. "Study of Chloride Ion Diffusion in Coral Aggregate Seawater Concrete with Different Water–Cement Ratios under Load" Materials 16, no. 2: 869. https://doi.org/10.3390/ma16020869
APA StyleDai, G., Wu, Q., Lu, K., Ma, S., Wang, W., Zhou, H., Cai, C., Han, Z., & Chen, J. (2023). Study of Chloride Ion Diffusion in Coral Aggregate Seawater Concrete with Different Water–Cement Ratios under Load. Materials, 16(2), 869. https://doi.org/10.3390/ma16020869