

Low-Temperature Synthesis of Cu-Doped Anatase TiO2 Nanostructures via Liquid Phase Deposition Method for Enhanced Photocatalysis


Abstract
1. Introduction
2. Materials and Methods
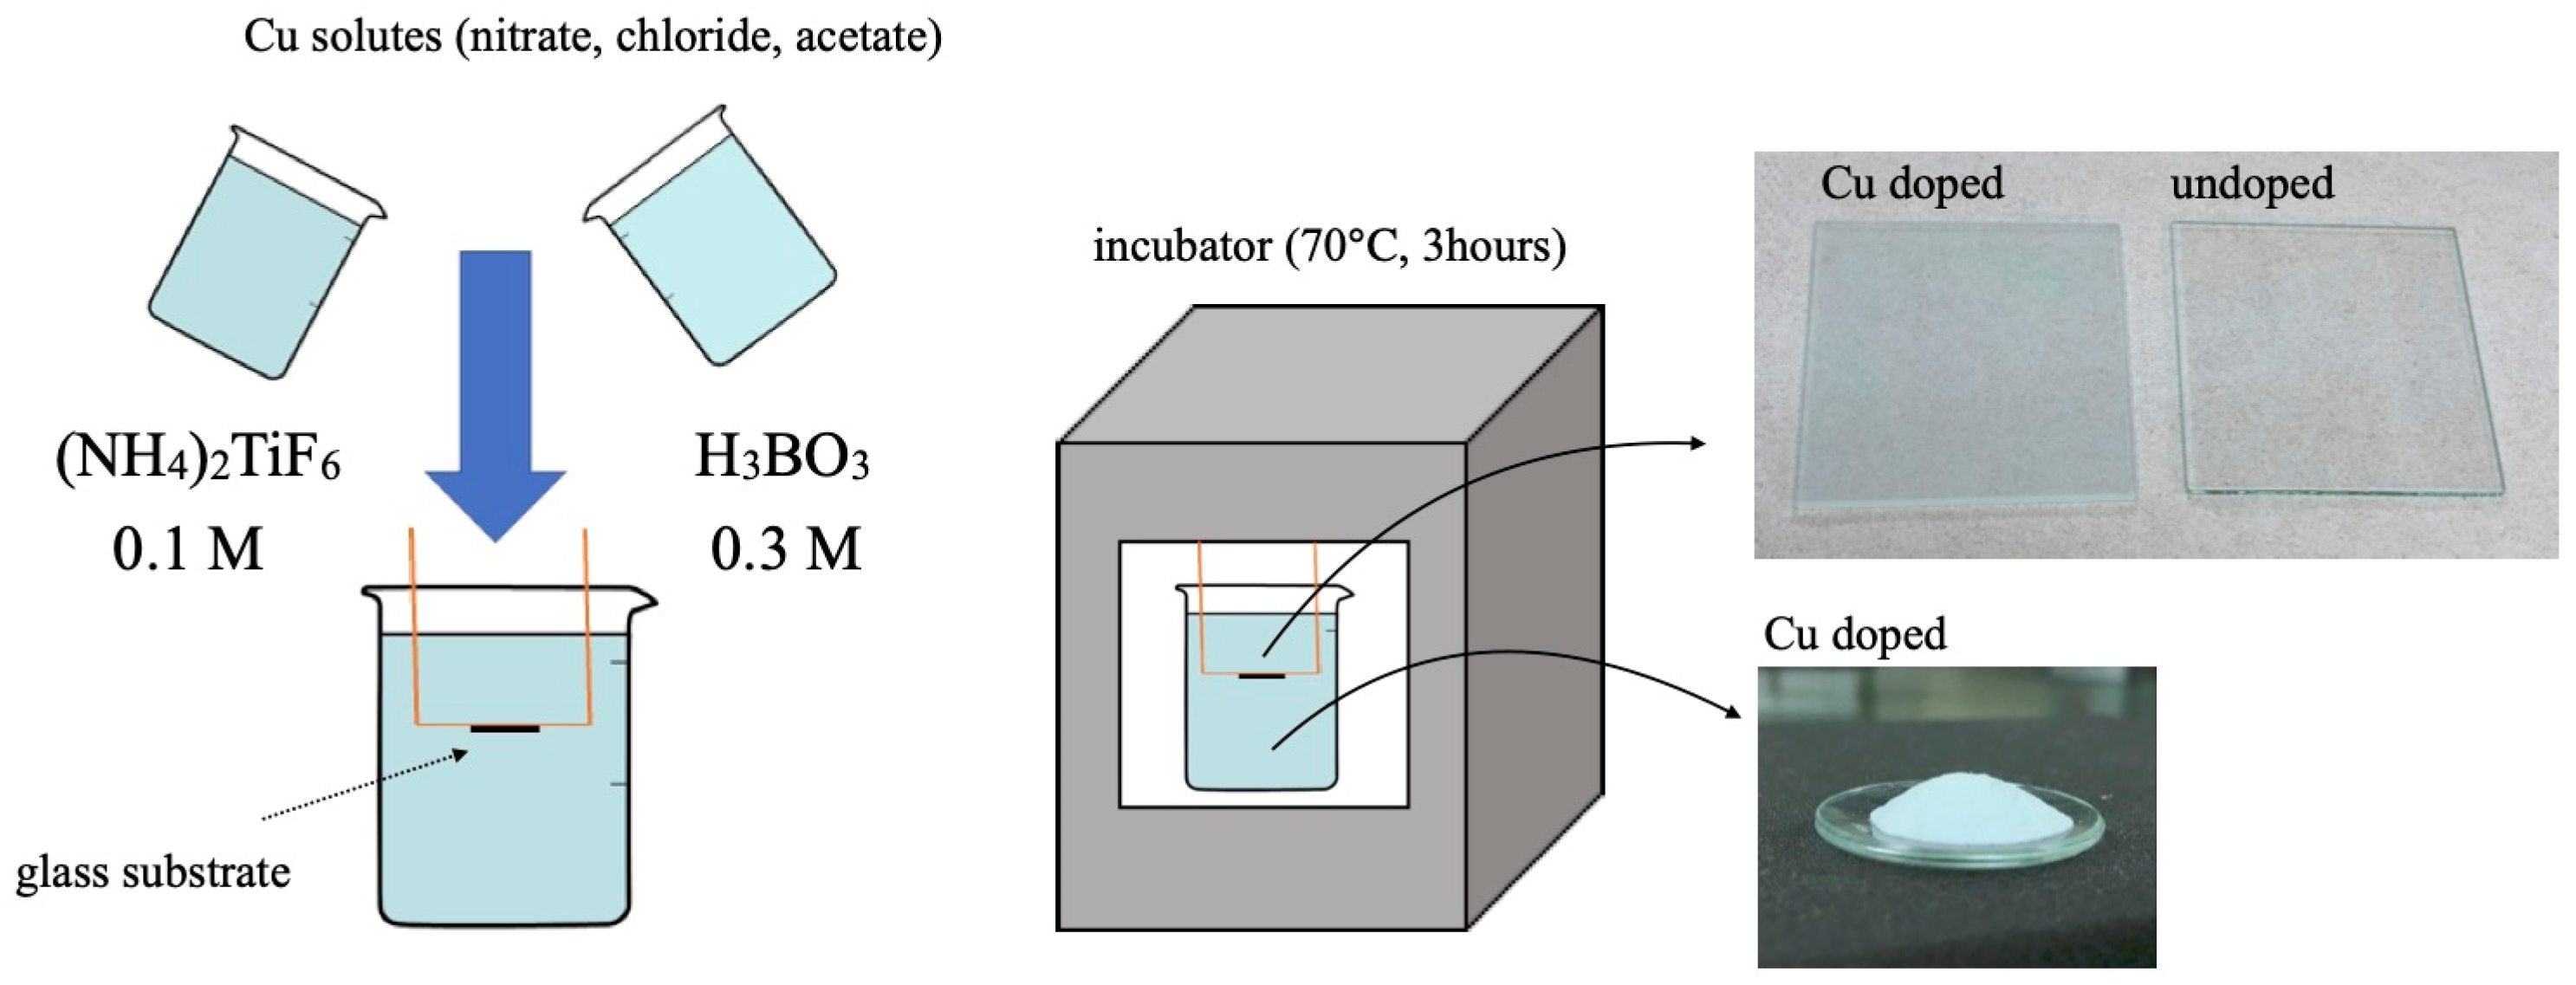
2.1. Sample Preparation
2.2. Characterization
2.3. Photocatalysis
3. Results and Discussion
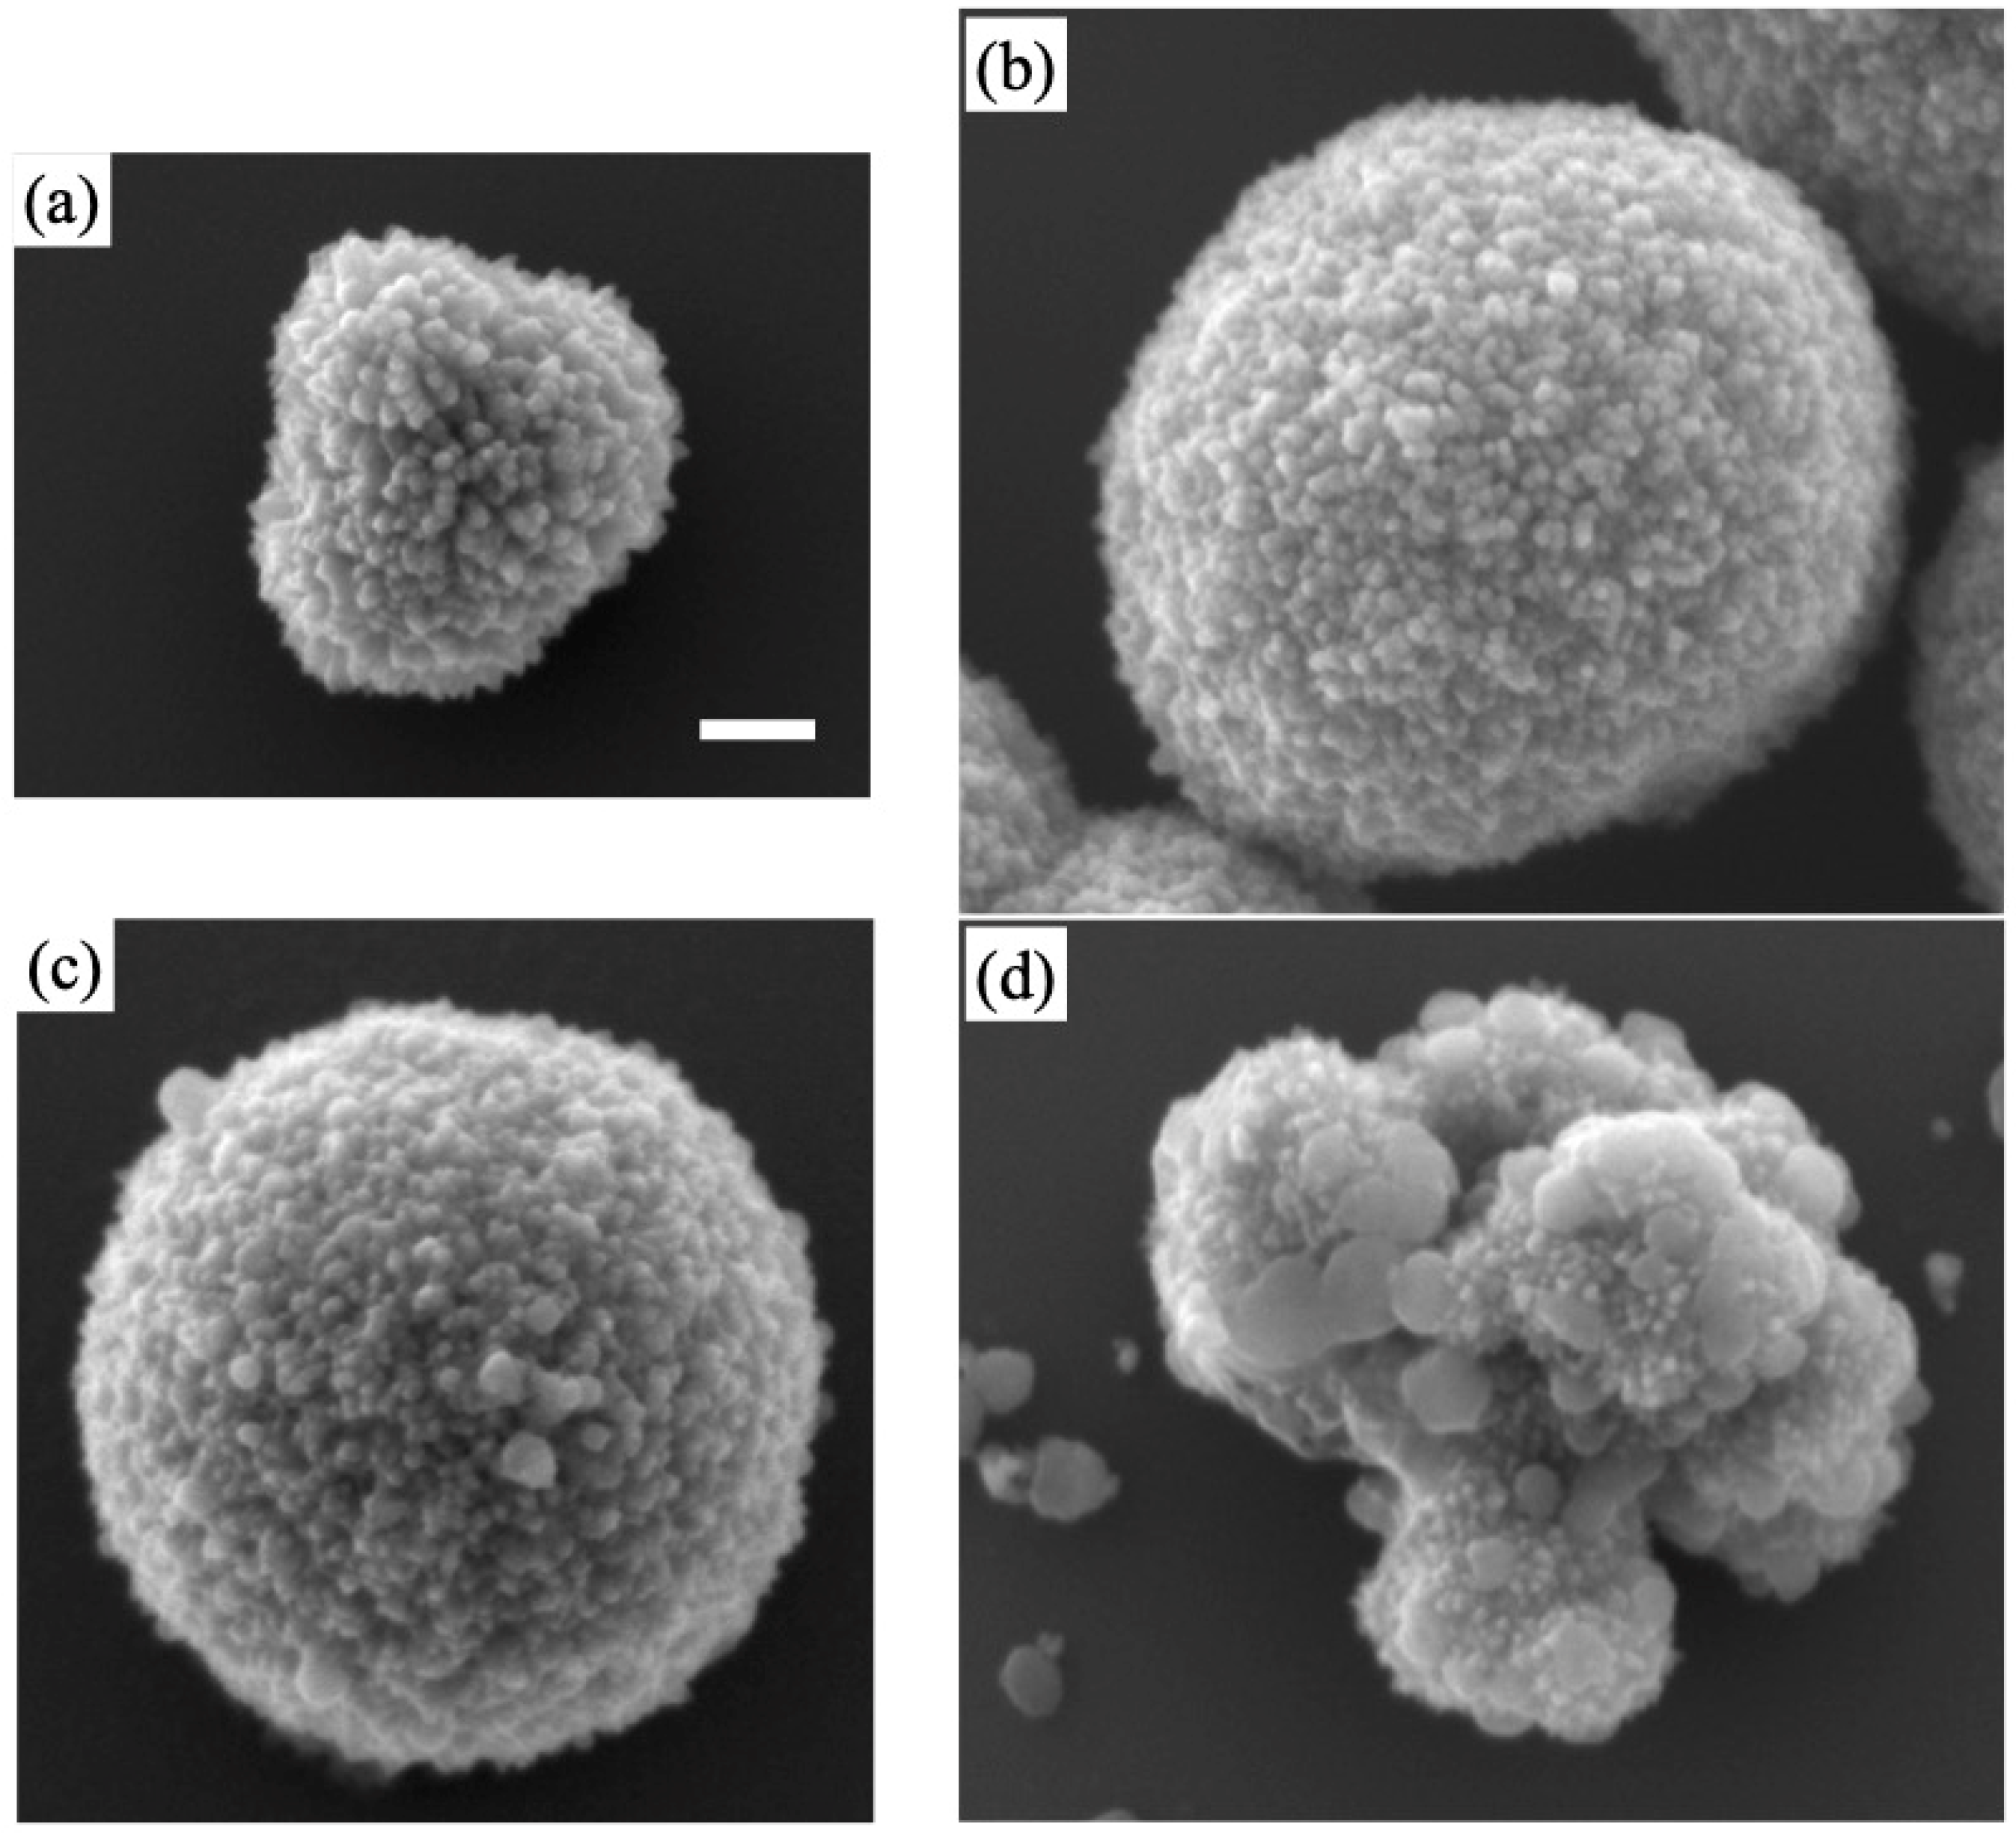
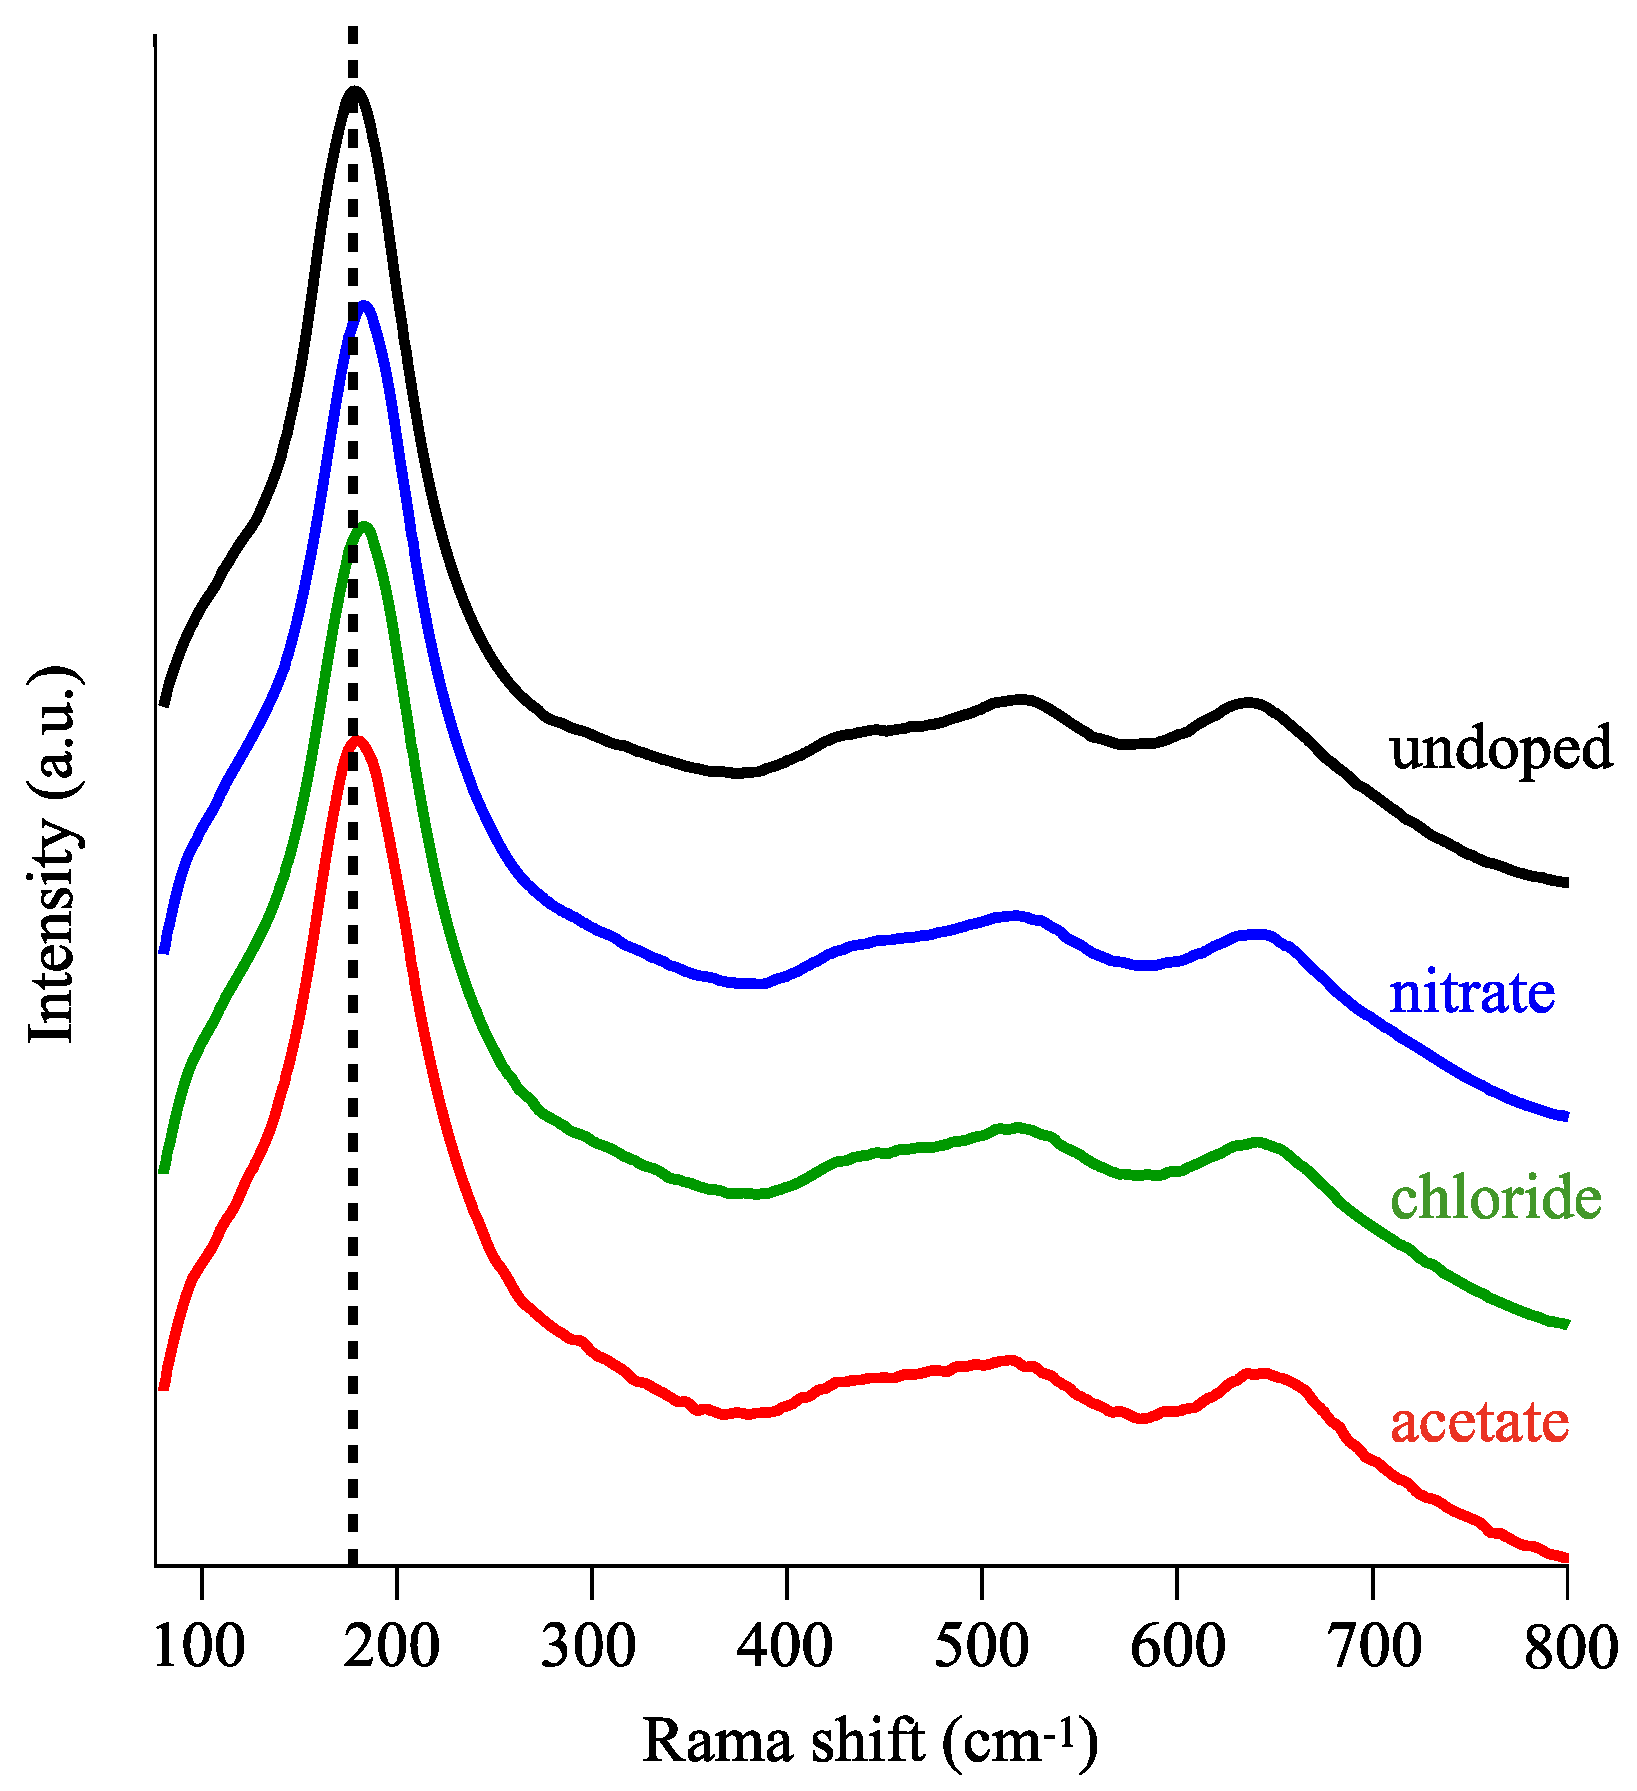
3.1. Choice of Cu Salts for Doping
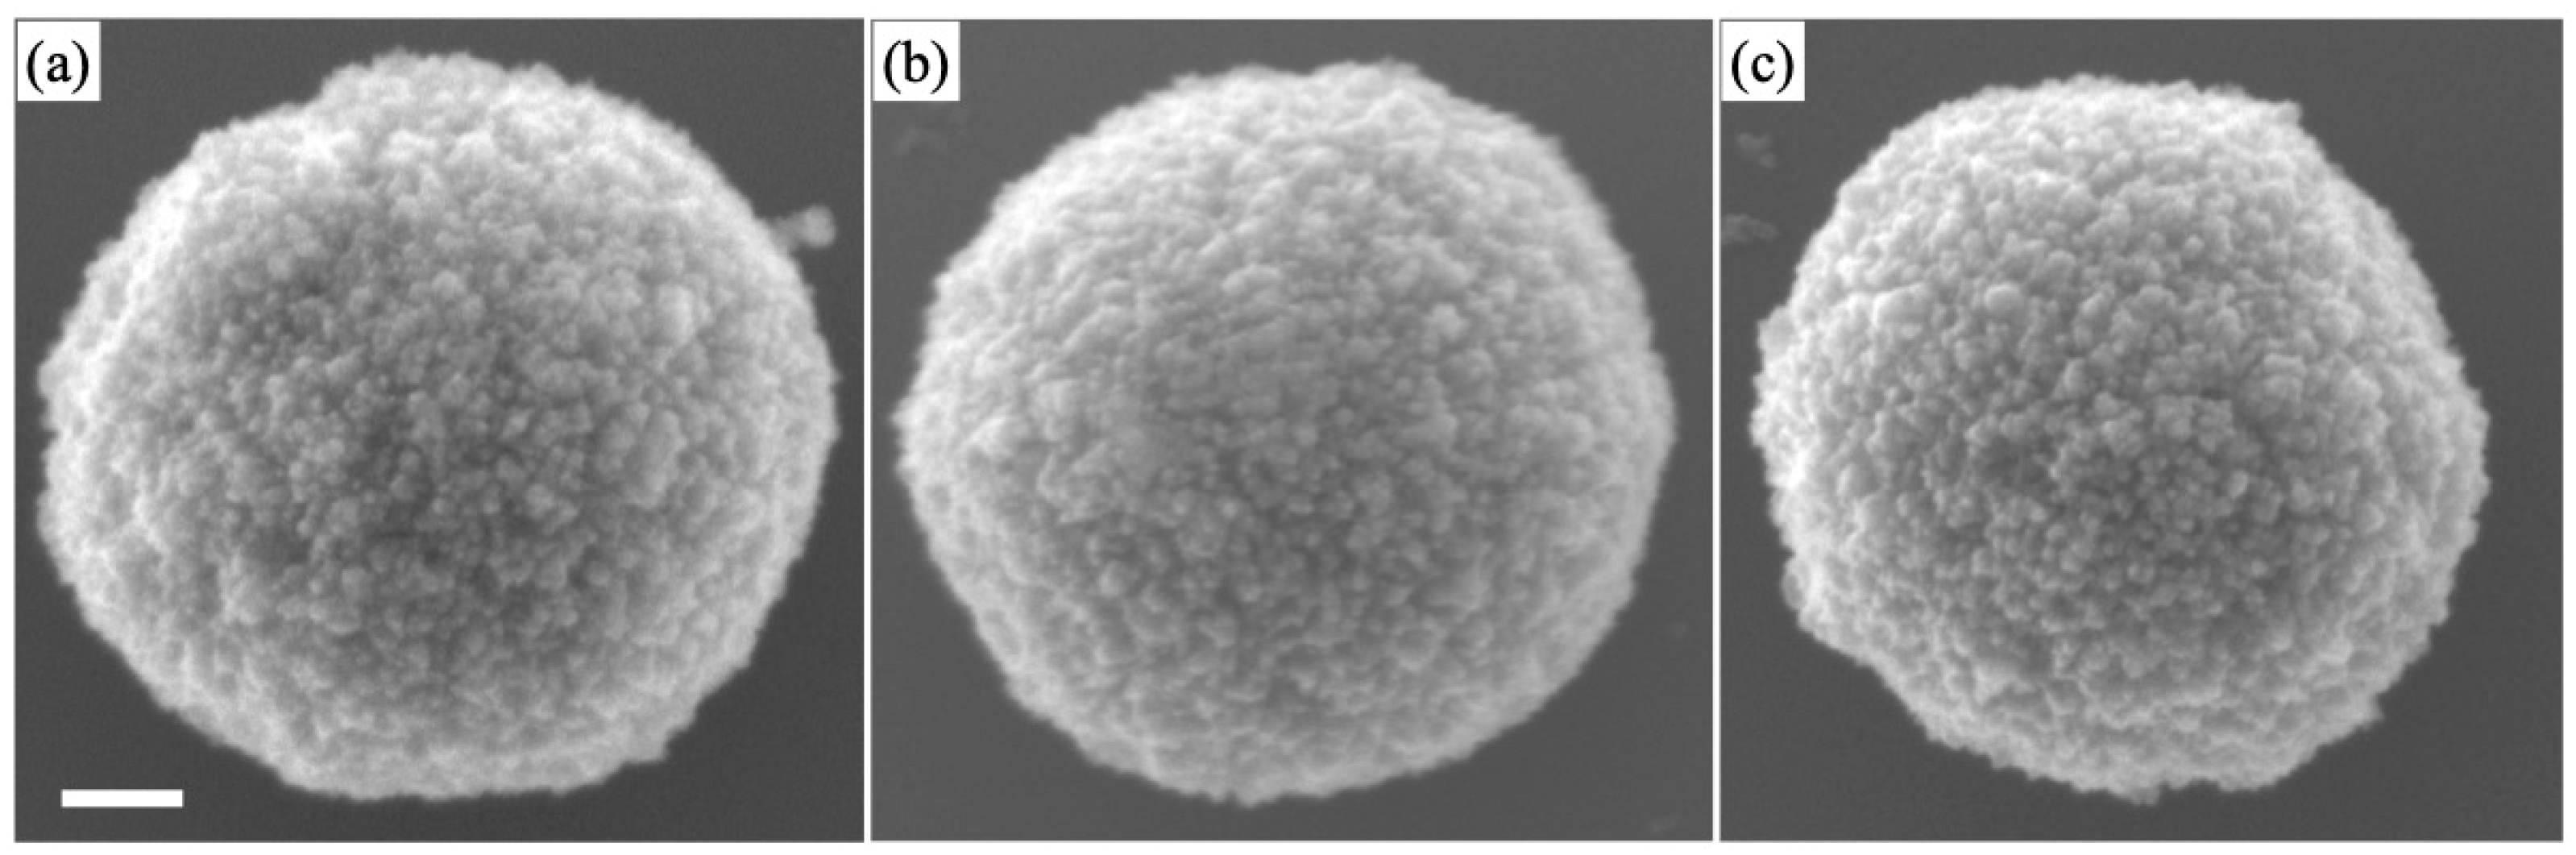
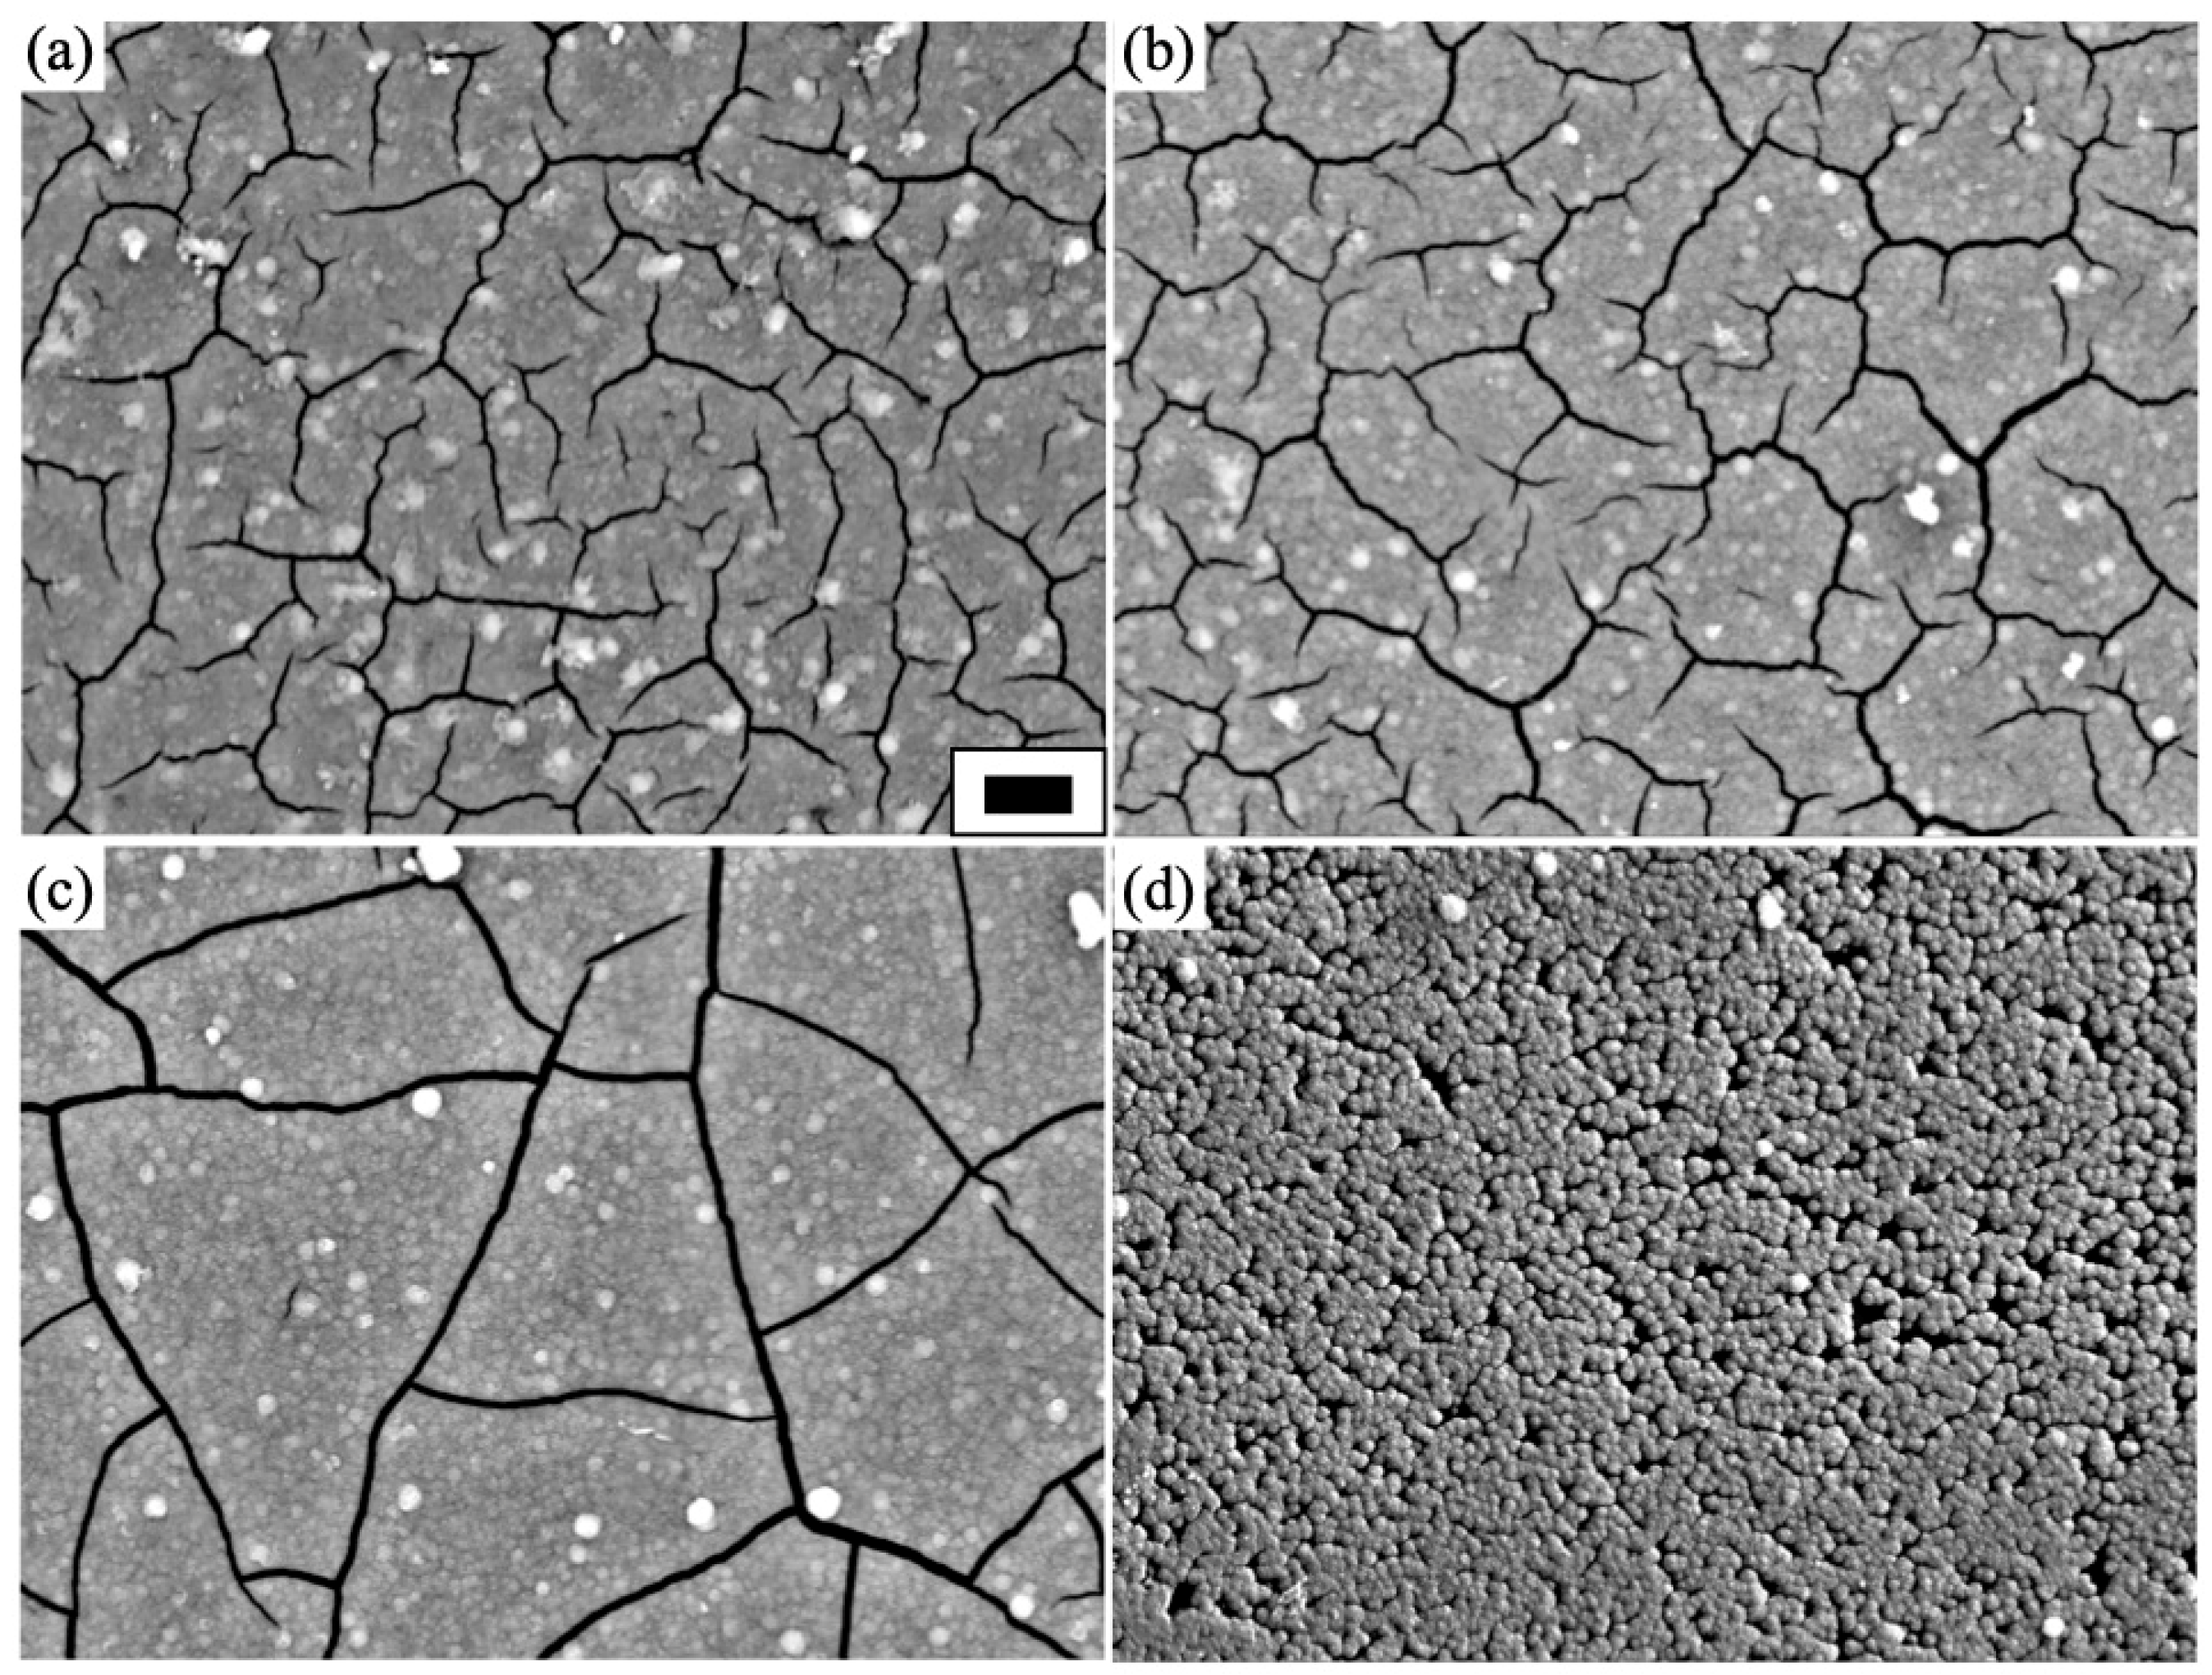
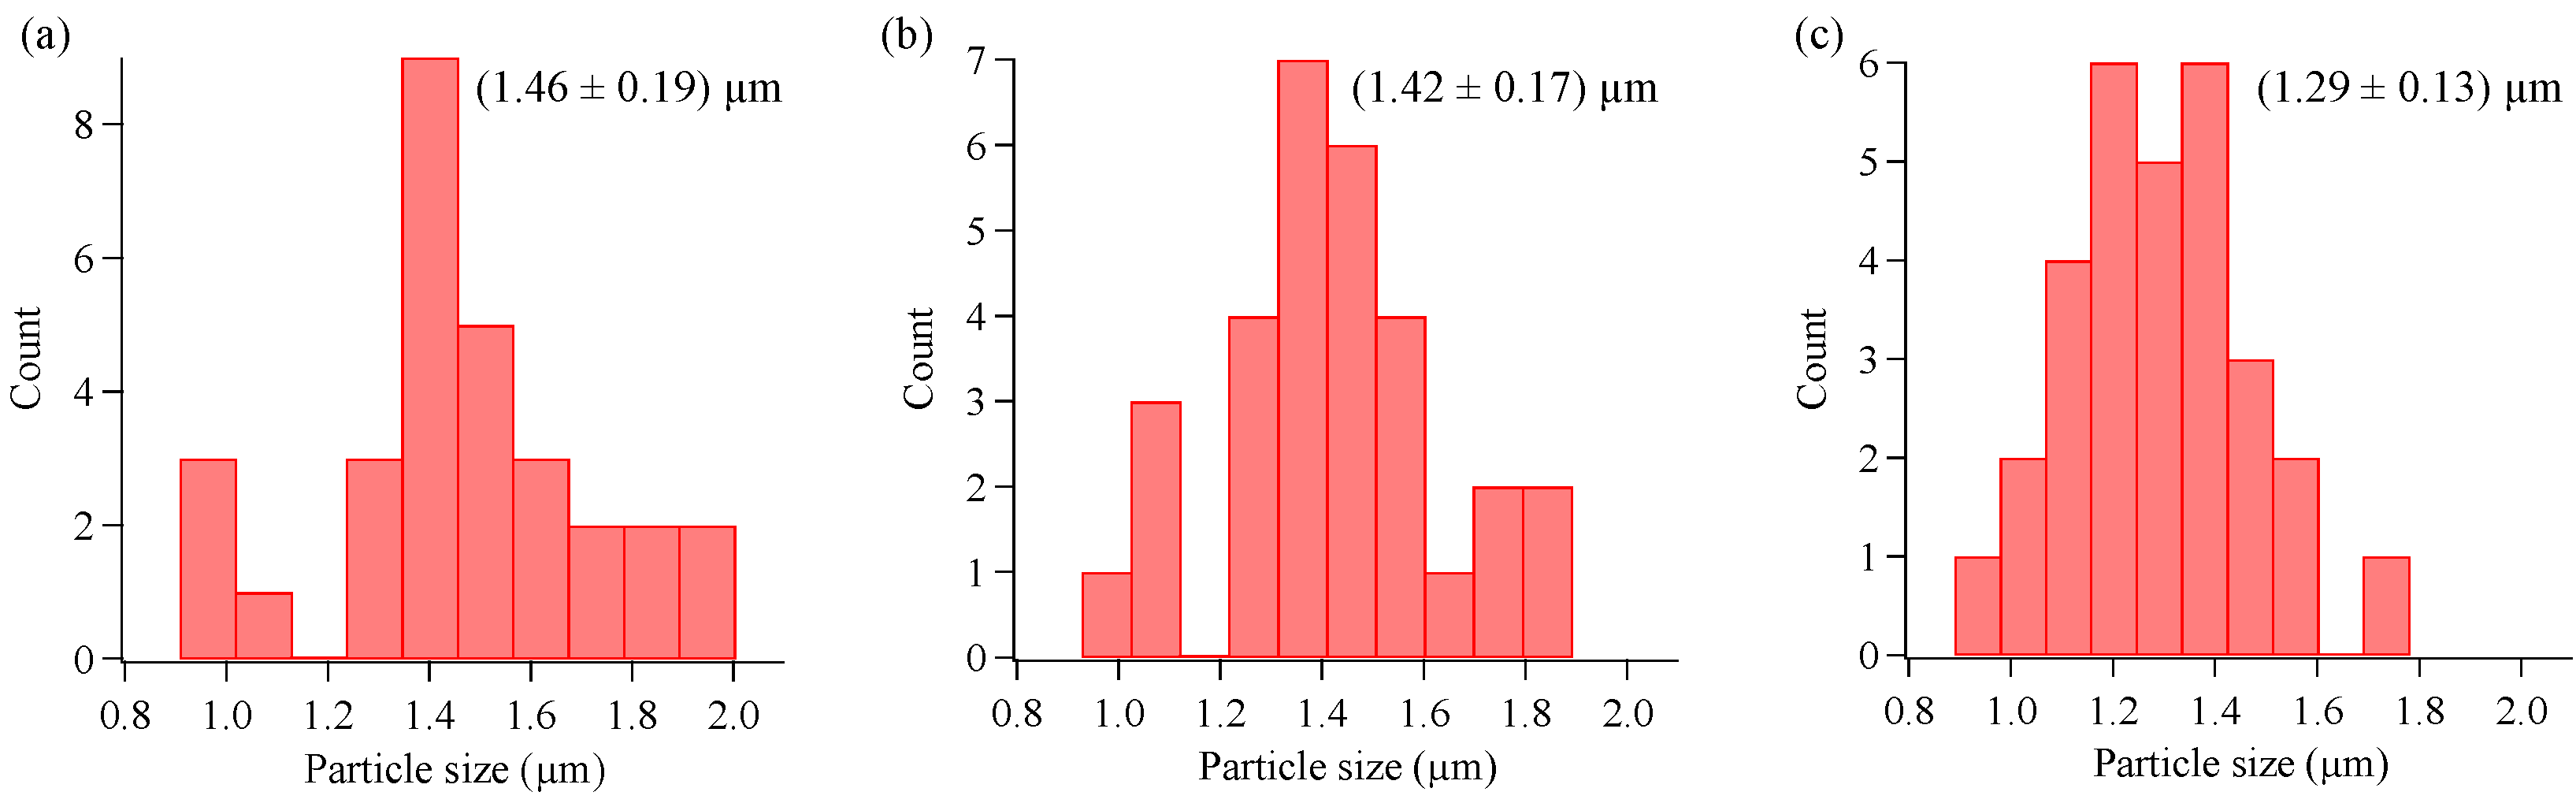
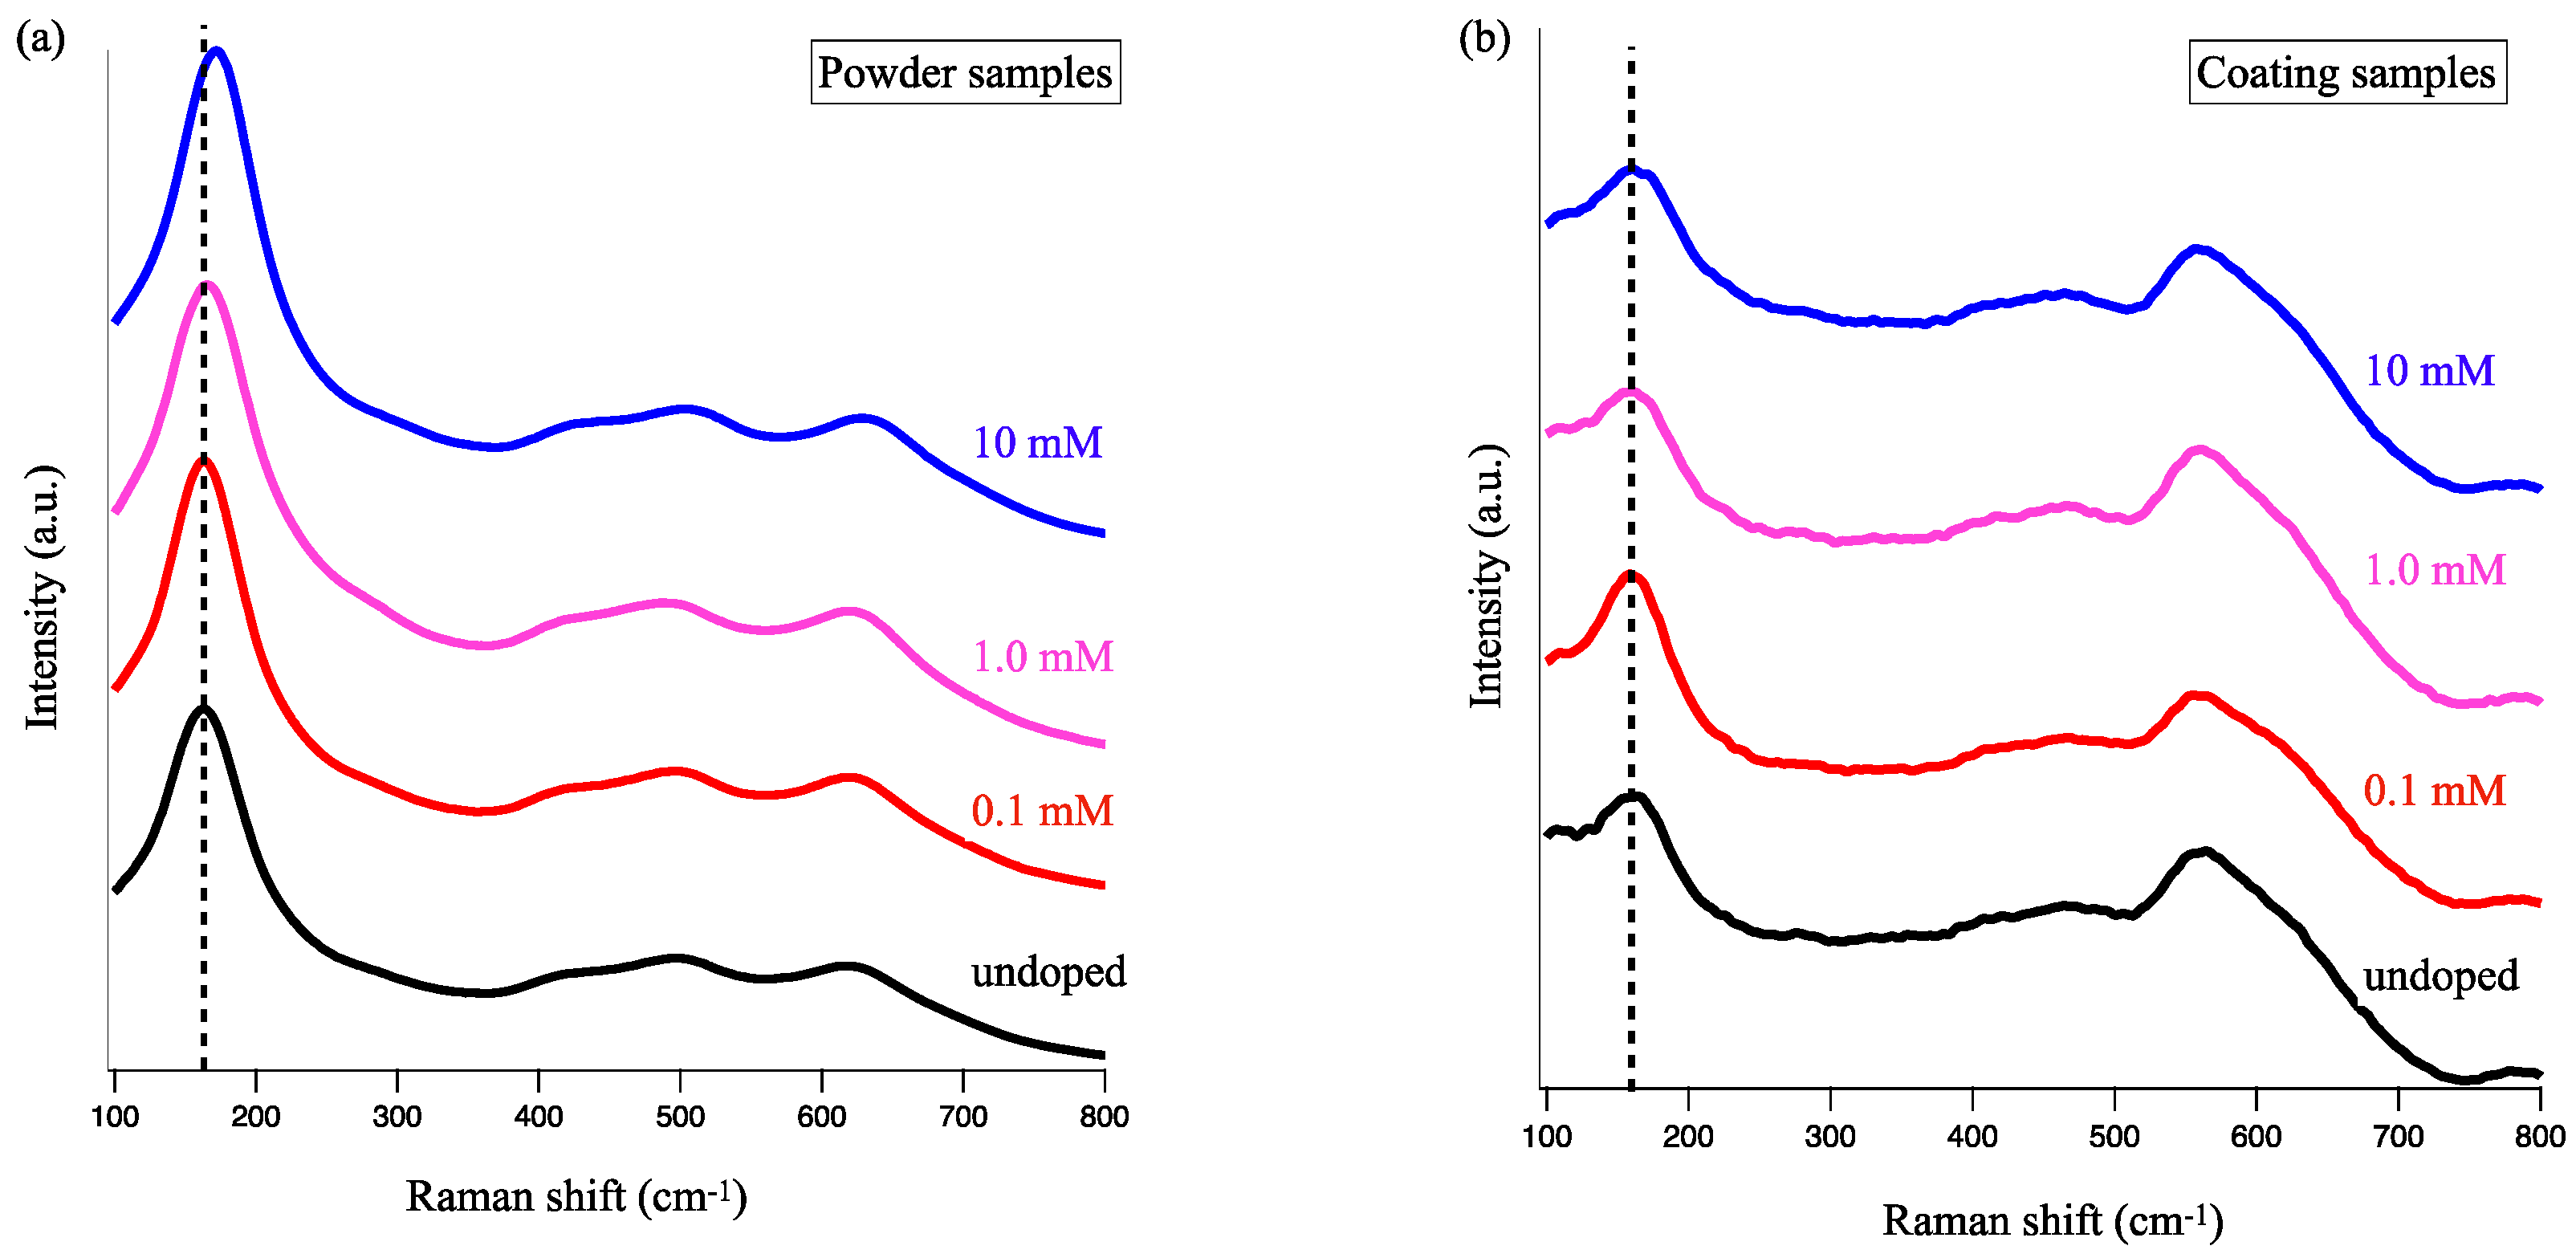
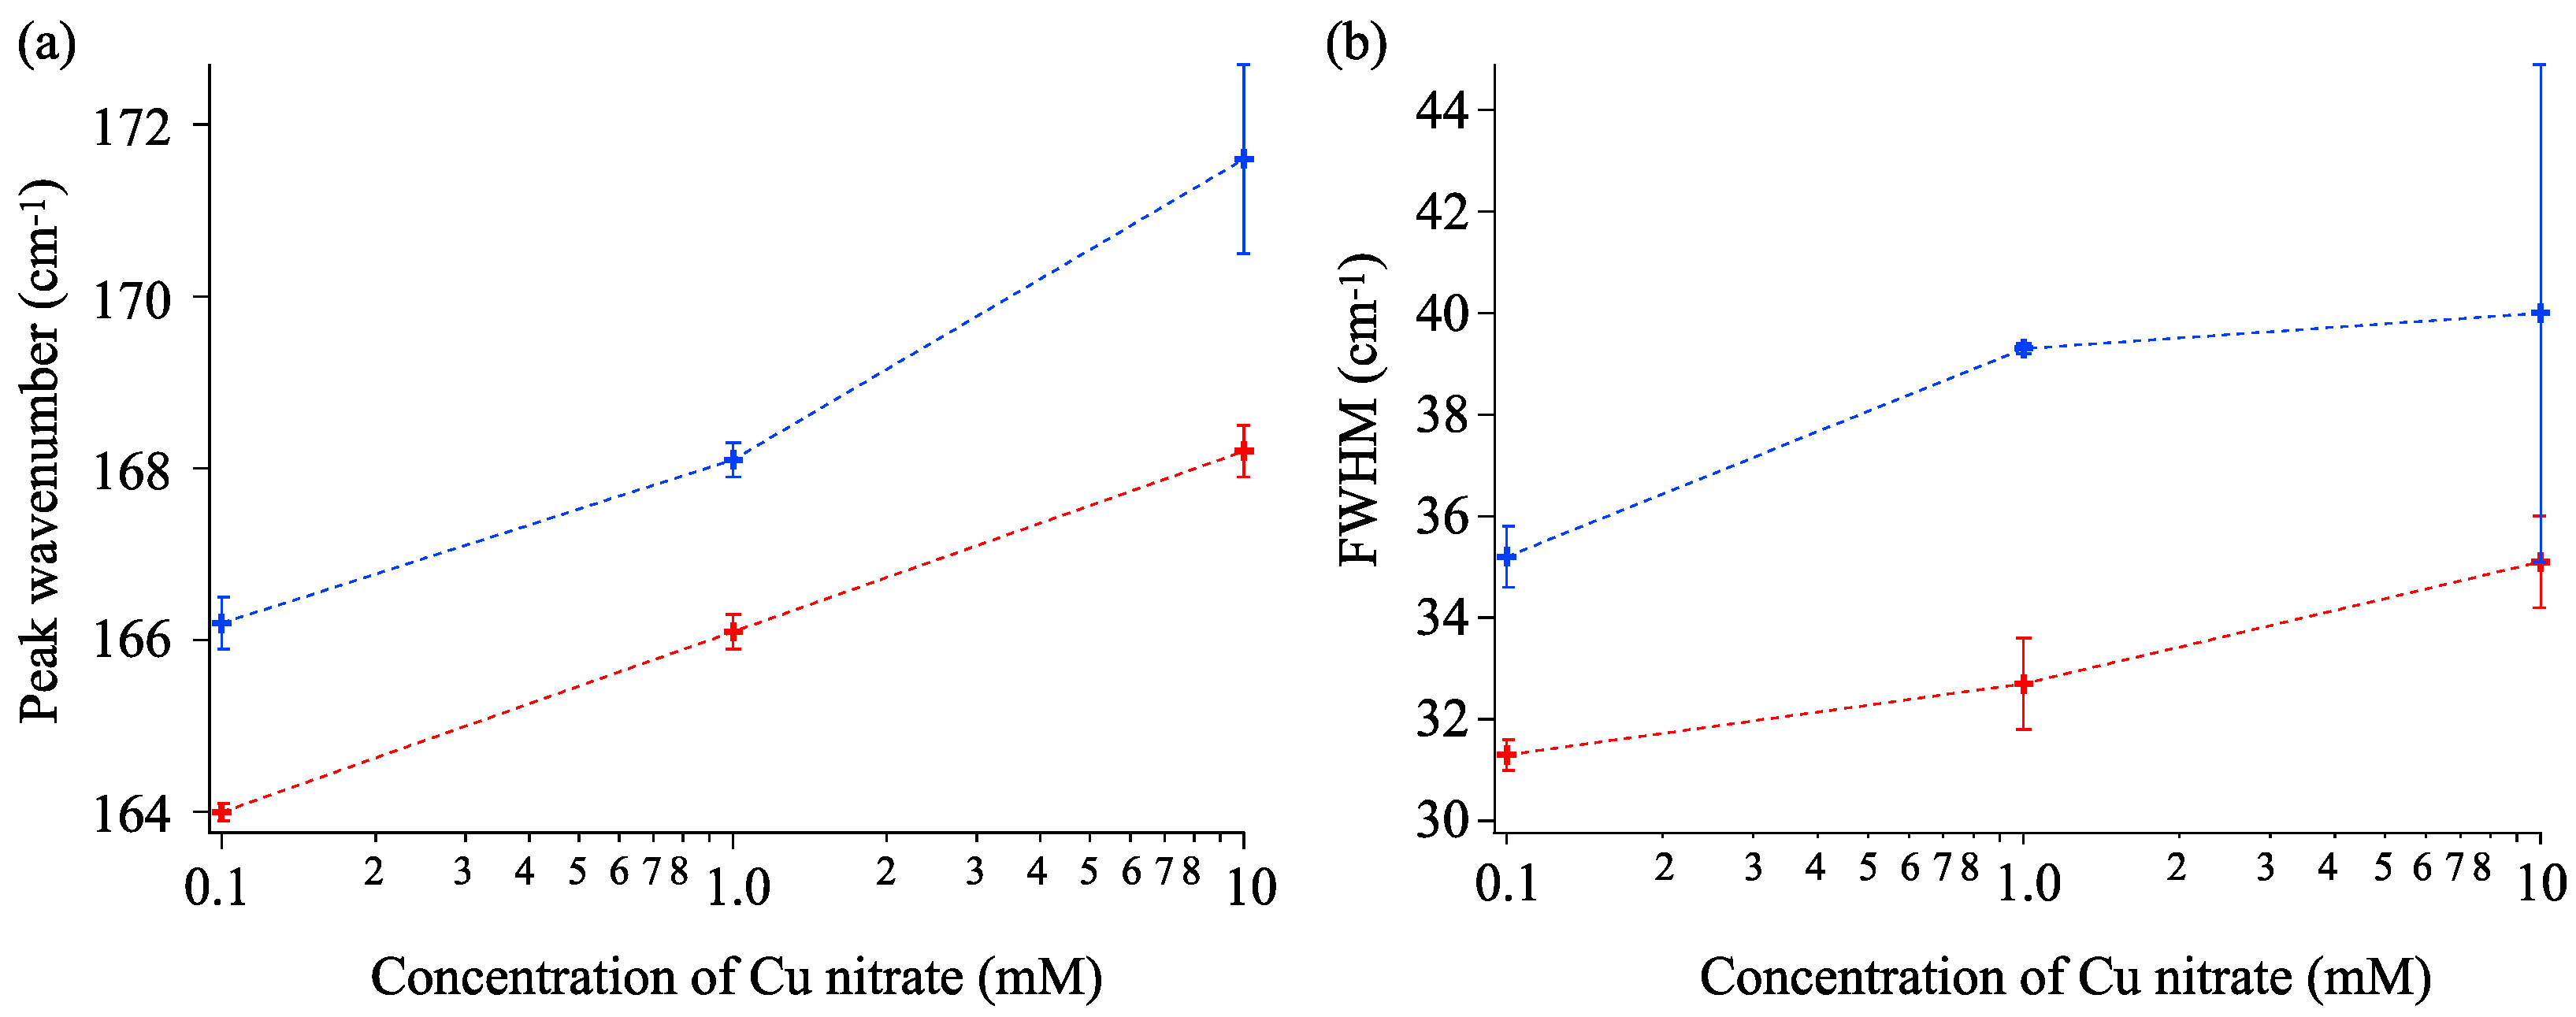
3.2. Concentration Dependence on Crystal Structures
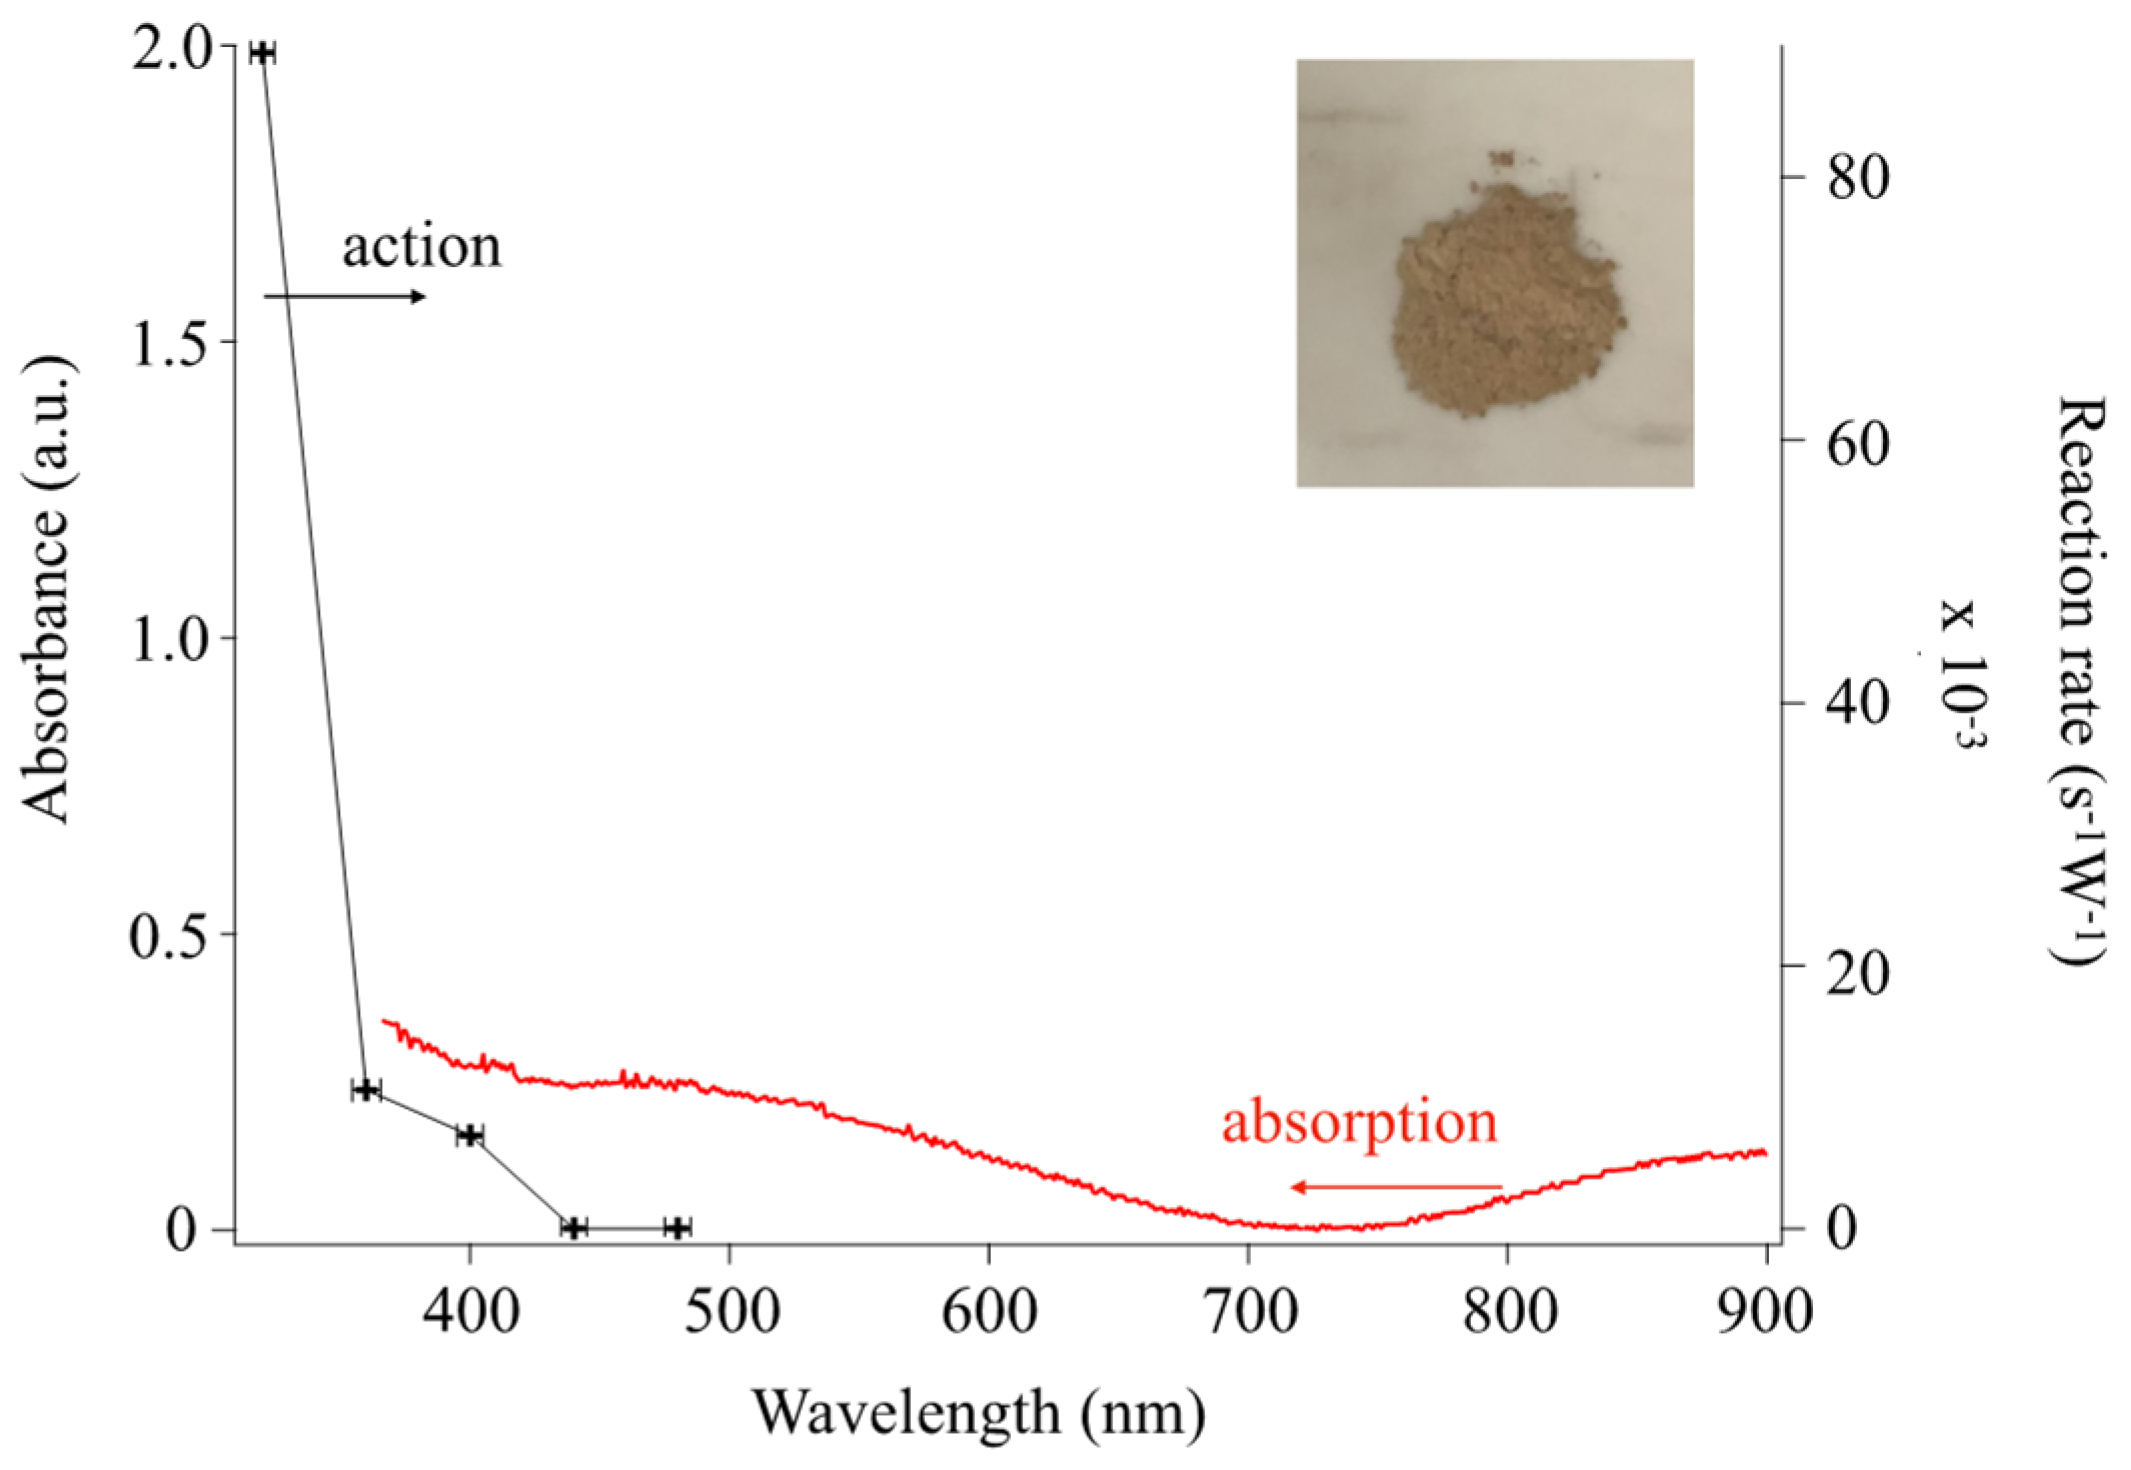
3.3. Doping Levels and Optical Properties
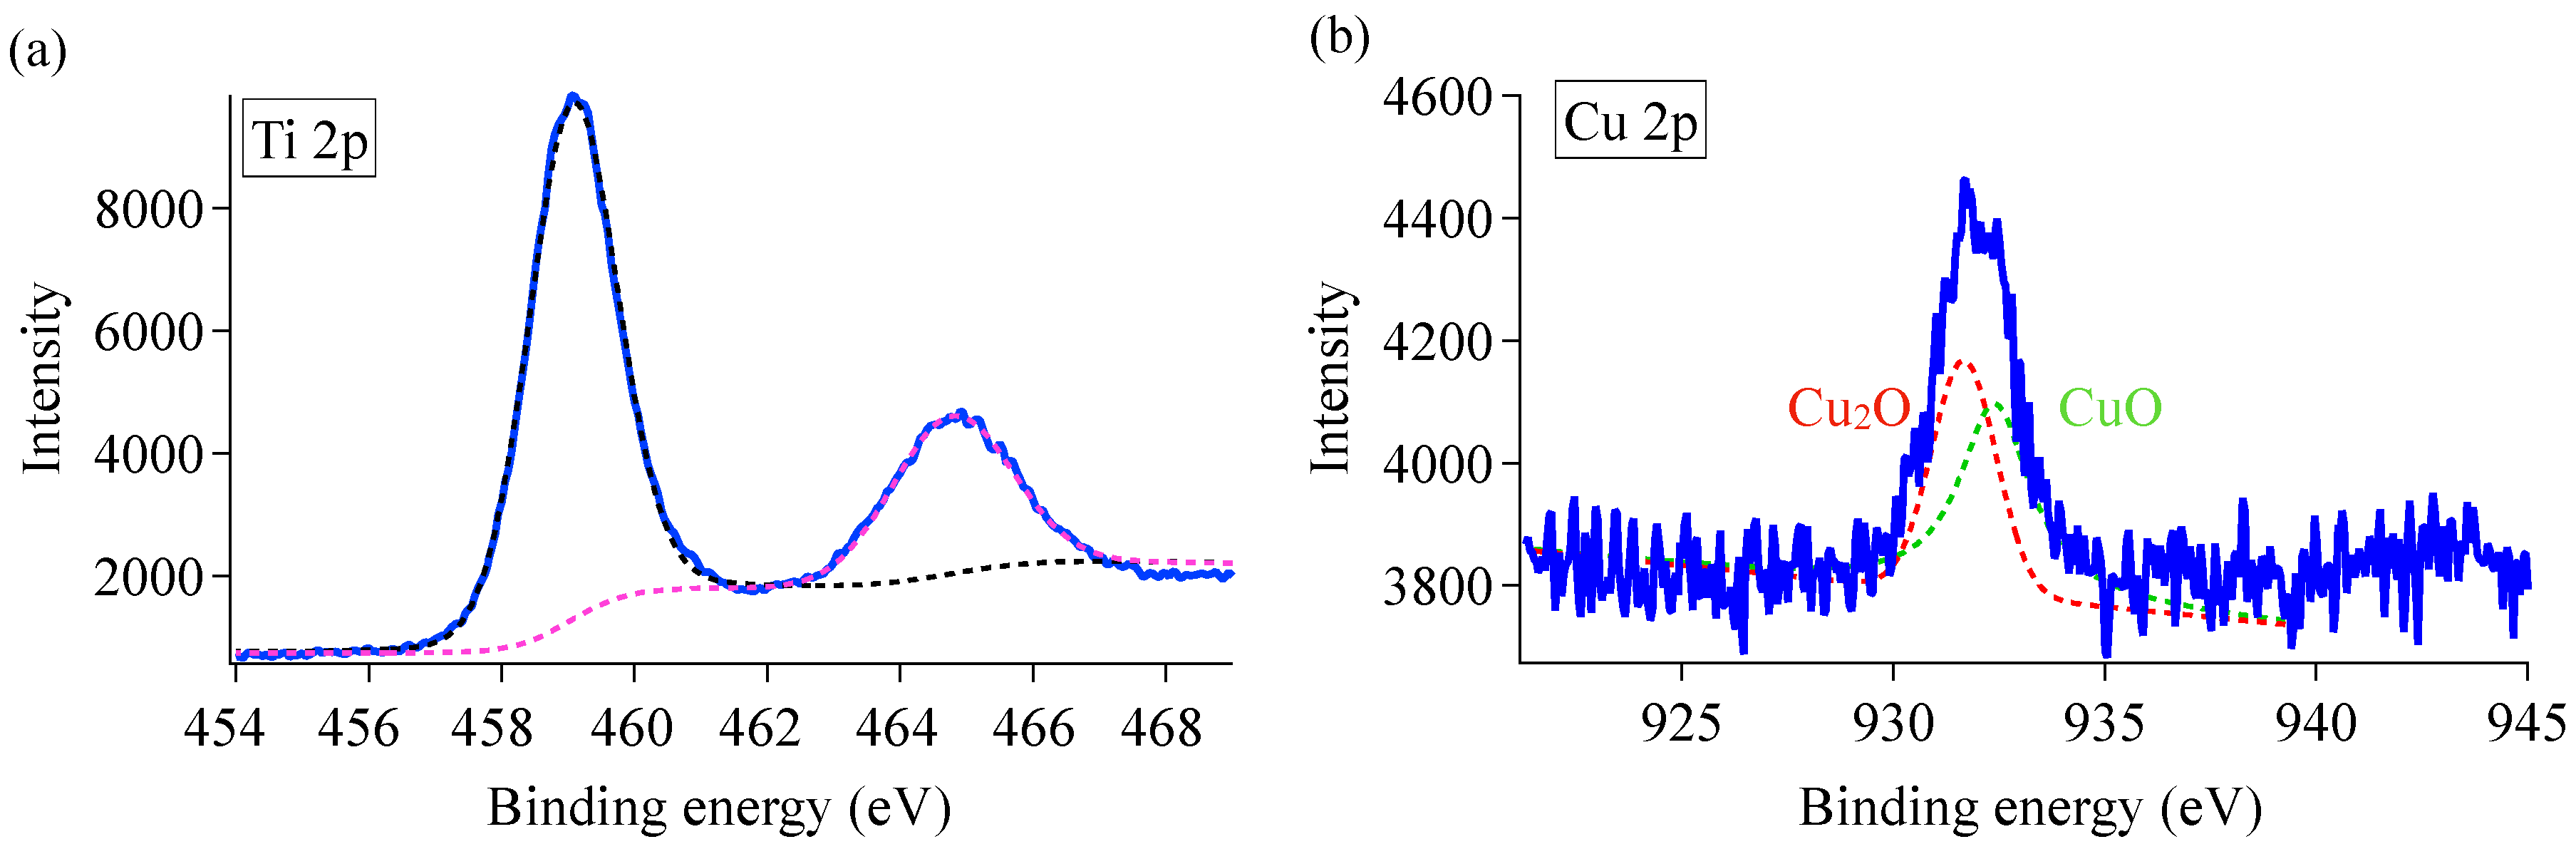
3.4. XPS Analysis
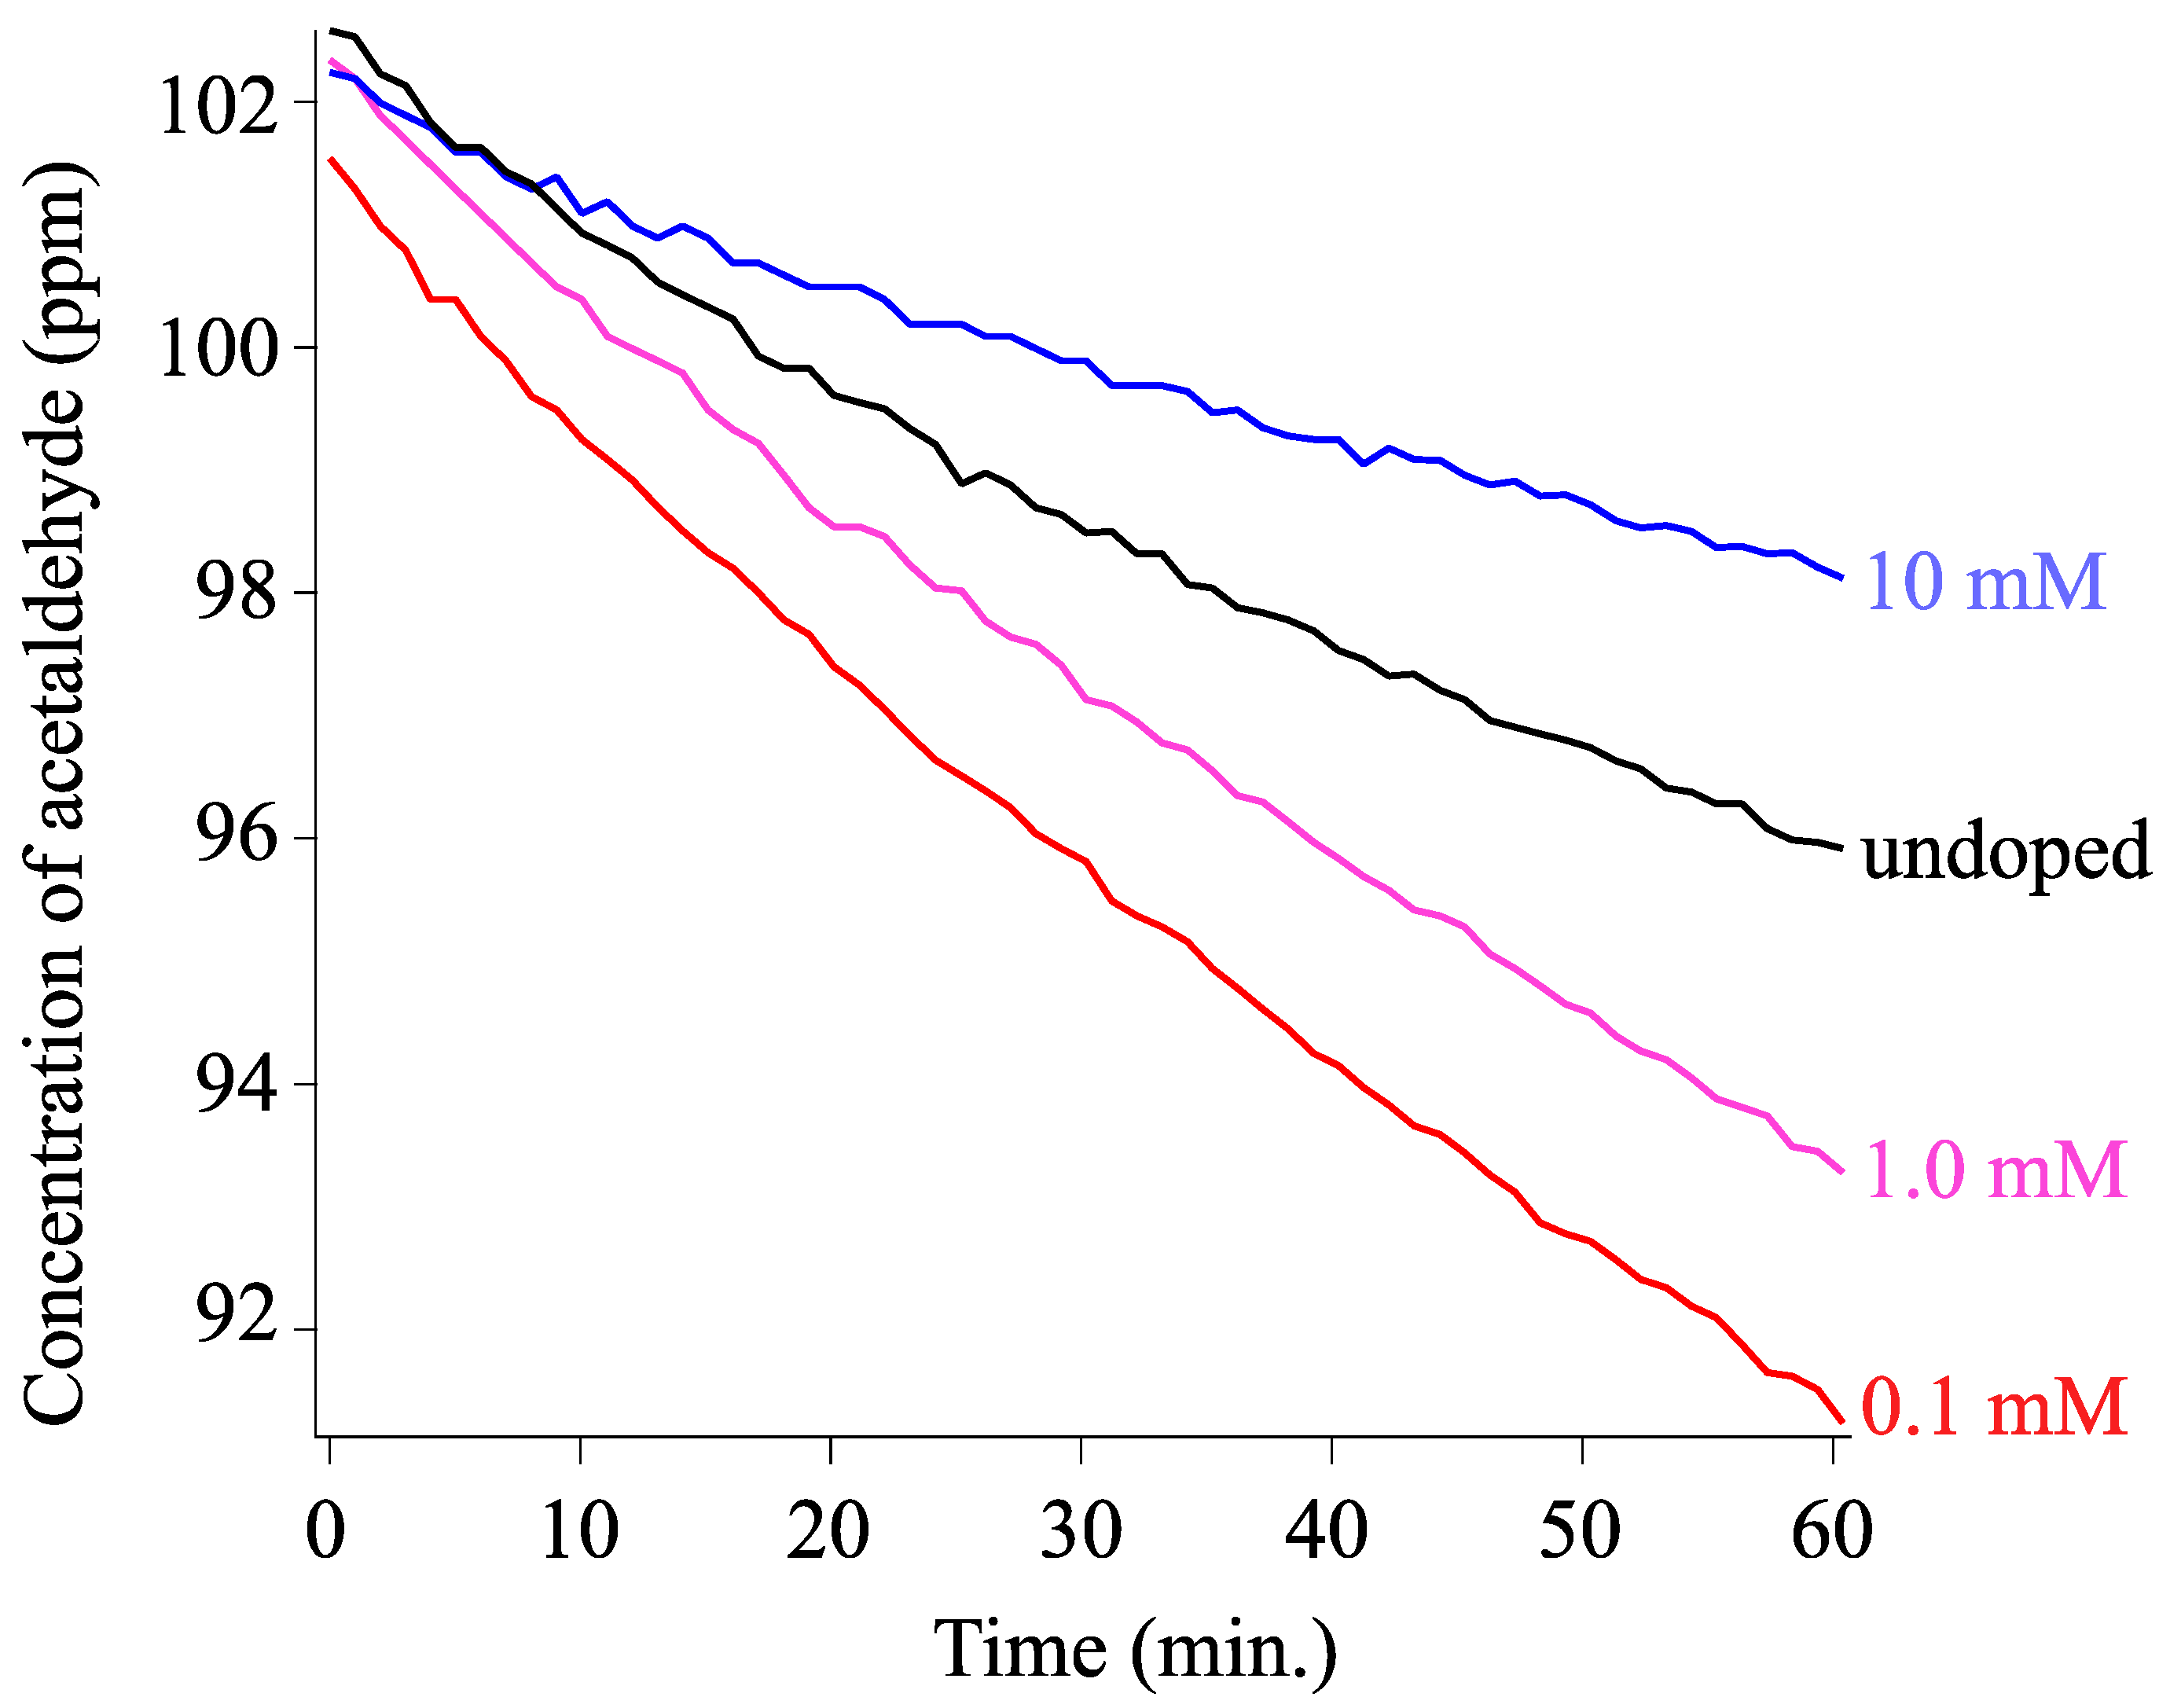
3.5. Photocatalysis
4. Conclusions
Supplementary Materials
Author Contributions
Funding
Institutional Review Board Statement
Data Availability Statement
Acknowledgments
Conflicts of Interest
References
- Fujishima, A.; Zhang, X.; Tryk, D.A. TiO2 Photocatalysis and Related Surface Phenomena. Surf. Sci. Rep. 2008, 63, 515–582. [Google Scholar] [CrossRef]
- Dhakshinamoorthy, A.; Navalon, S.; Corma, A.; Garcia, H. Photocatalytic CO2 Reduction by TiO2 and Related Titanium Containing Solids. Energy Environ. Sci. 2012, 5, 9217. [Google Scholar] [CrossRef]
- Carcel, R.A.; Andronic, L.; Duta, A. Photocatalytic Activity and Stability of TiO2 and WO3 Thin Films. Mater. Charact. 2012, 70, 68–73. [Google Scholar] [CrossRef]
- Fujishima, A.; Honda, K. Electrochemical Photolysis of Water at a Semiconductor Electrode. Nature 1972, 238, 37–38. [Google Scholar] [CrossRef] [PubMed]
- Mino, L.; Negri, C.; Santalucia, R.; Cerrato, G.; Spoto, G.; Martra, G. Morphology, Surface Structure and Water Adsorption Properties of TiO2 Nanoparticles: A Comparison of Different Commercial Samples. Molecules 2020, 25, 4605. [Google Scholar] [CrossRef]
- Augugliaro, V.; Bellardita, M.; Loddo, V.; Palmisano, G.; Palmisano, L.; Yurdakal, S. Overview on Oxidation Mechanisms of Organic Compounds by TiO2 in Heterogeneous Photocatalysis. J. Photochem. Photobiol. C Photochem. Rev. 2012, 13, 224–245. [Google Scholar] [CrossRef]
- Lonnen, J.; Kilvington, S.; Kehoe, S.C.; Al-Touati, F.; McGuigan, K.G. Solar and Photocatalytic Disinfection of Protozoan, Fungal and Bacterial Microbes in Drinking Water. Water Res. 2005, 39, 877–883. [Google Scholar] [CrossRef]
- Herrmann, J.-M. Heterogeneous Photocatalysis: Fundamentals and Applications to the Removal of Various Types of Aqueous Pollutants. Catal. Today 1999, 53, 115–129. [Google Scholar] [CrossRef]
- Hager, S.; Bauer, R. Heterogeneous Photocatalytic Oxidation of Organics for Air Purification by near UV Irradiated Titanium Dioxide. Chemosphere 1999, 38, 1549–1559. [Google Scholar] [CrossRef]
- Ochiai, T.; Aoki, D.; Saito, H.; Akutsu, Y.; Nagata, M. Analysis of Adsorption and Decomposition of Odour and Tar Components in Tobacco Smoke on Non-Woven Fabric-Supported Photocatalysts. Catalysts 2020, 10, 304. [Google Scholar] [CrossRef]
- Takanabe, K. Photocatalytic Water Splitting: Quantitative Approaches toward Photocatalyst by Design. ACS Catal. 2017, 7, 8006–8022. [Google Scholar] [CrossRef]
- Takanabe, K.; Domen, K. Toward Visible Light Response: Overall Water Splitting Using Heterogeneous Photocatalysts. Green 2011, 1, 313–322. [Google Scholar] [CrossRef]
- Khlyustova, A.; Sirotkin, N.; Kusova, T.; Kraev, A.; Titov, V.; Agafonov, A. Doped TiO2: The Effect of Doping Elements on Photocatalytic Activity. Mater. Adv. 2020, 1, 1193–1201. [Google Scholar] [CrossRef]
- Nur, A.S.M.; Sultana, M.; Mondal, A.; Islam, S.; Robel, F.N.; Islam, A.; Sumi, M.S.A. A Review on the Development of Elemental and Codoped TiO2 Photocatalysts for Enhanced Dye Degradation under UV–Vis Irradiation. J. Water Process Eng. 2022, 47, 102728. [Google Scholar] [CrossRef]
- Lu, C.-M.; Sharma, R.K.; Lin, P.-Y.; Huang, Y.-H.; Chen, J.-S.; Lee, W.-C.; Chen, C.-Y. Characteristics of Doped TiO2 Nanoparticle Photocatalysts Prepared by the Rotten Egg White. Materials 2022, 15, 4231. [Google Scholar] [CrossRef] [PubMed]
- Asahi, R.; Morikawa, T.; Ohwaki, T.; Aoki, K.; Taga, Y. Visible-Light Photocatalysis in Nitrogen-Doped Titanium Oxides. Science 2001, 293, 269–271. [Google Scholar] [CrossRef] [PubMed]
- Sirivallop, A.; Areerob, T.; Chiarakorn, S. Enhanced Visible Light Photocatalytic Activity of N and Ag Doped and Co-Doped TiO2 Synthesized by Using an In-Situ Solvothermal Method for Gas Phase Ammonia Removal. Catalysts 2020, 10, 251. [Google Scholar] [CrossRef]
- Yu, H.; Irie, H.; Hashimoto, K. Conduction Band Energy Level Control of Titanium Dioxide: Toward an Efficient Visible-Light-Sensitive Photocatalyst. J. Am. Chem. Soc. 2010, 132, 6898–6899. [Google Scholar] [CrossRef]
- Huang, F.; Yan, A.; Zhao, H. Influences of Doping on Photocatalytic Properties of TiO2 Photocatalyst. In Semiconductor Photocatalysis—Materials, Mechanisms and Applications; IntechOpen: London, UK, 2016. [Google Scholar]
- Karunakaran, C.; Abiramasundari, G.; Gomathisankar, P.; Manikandan, G.; Anandi, V. Cu-Doped TiO2 Nanoparticles for Photocatalytic Disinfection of Bacteria under Visible Light. J. Colloid Interface Sci. 2010, 352, 68–74. [Google Scholar] [CrossRef]
- Krishnakumar, V.; Boobas, S.; Jayaprakash, J.; Rajaboopathi, M.; Han, B.; Louhi-Kultanen, M. Effect of Cu Doping on TiO2 Nanoparticles and Its Photocatalytic Activity under Visible Light. J. Mater. Sci. Mater. Electron. 2016, 27, 7438–7447. [Google Scholar] [CrossRef]
- Alotaibi, A.M.; Williamson, B.A.D.; Sathasivam, S.; Kafizas, A.; Alqahtani, M.; Sotelo-Vazquez, C.; Buckeridge, J.; Wu, J.; Nair, S.P.; Scanlon, D.O.; et al. Enhanced Photocatalytic and Antibacterial Ability of Cu-Doped Anatase TiO2 Thin Films: Theory and Experiment. ACS Appl. Mater. Interfaces 2020, 12, 15348–15361. [Google Scholar] [CrossRef] [PubMed]
- Mathew, S.; Ganguly, P.; Rhatigan, S.; Kumaravel, V.; Byrne, C.; Hinder, S.J.; Bartlett, J.; Nolan, M.; Pillai, S.C. Cu-Doped TiO2: Visible Light Assisted Photocatalytic Antimicrobial Activity. Appl. Sci. 2018, 8, 2067. [Google Scholar] [CrossRef]
- Slamet, N.H.W.; Purnama, E.; Kosela, S.; Gunlazuardi, J. Photocatalytic Reduction of CO2 on Copper-Doped Titania Catalysts Prepared by Improved-Impregnation Method. Catal. Commun. 2005, 6, 313–319. [Google Scholar] [CrossRef]
- Colón, G.; Maicu, M.; Hidalgo, M.C.; Navío, J.A. Cu-Doped TiO2 Systems with Improved Photocatalytic Activity. Appl. Catal. B 2006, 67, 41–51. [Google Scholar] [CrossRef]
- Mingmongkol, Y.; Trinh, D.T.T.; Phuinthiang, P.; Channei, D.; Ratananikom, K.; Nakaruk, A.; Khanitchaidecha, W. Enhanced Photocatalytic and Photokilling Activities of Cu-Doped TiO2 Nanoparticles. Nanomaterials 2022, 12, 1198. [Google Scholar] [CrossRef] [PubMed]
- Xia, X.H.; Gao, Y.; Wang, Z.; Jia, Z.J. Structure and Photocatalytic Properties of Copper-Doped Rutile TiO2 Prepared by a Low-Temperature Process. J. Phys. Chem. Solids 2008, 69, 2888–2893. [Google Scholar] [CrossRef]
- Li, G.; Dimitrijevic, N.M.; Chen, L.; Rajh, T.; Gray, K.A. Role of Surface/Interfacial Cu2+ Sites in the Photocatalytic Activity of Coupled CuO−TiO2 Nanocomposites. J. Phys. Chem. C 2008, 112, 19040–19044. [Google Scholar] [CrossRef]
- López, R.; Gómez, R.; Llanos, M.E. Photophysical and Photocatalytic Properties of Nanosized Copper-Doped Titania Sol–Gel Catalysts. Catal. Today 2009, 148, 103–108. [Google Scholar] [CrossRef]
- Zhang, W.; Li, Y.; Zhu, S.; Wang, F. Copper Doping in Titanium Oxide Catalyst Film Prepared by Dc Reactive Magnetron Sputtering. Catal. Today 2004, 93–95, 589–594. [Google Scholar] [CrossRef]
- Bhattacharyya, K.; Mane, G.P.; Rane, V.; Tripathi, A.K.; Tyagi, A.K. Selective CO2 Photoreduction with Cu-Doped TiO2 Photocatalyst: Delineating the Crucial Role of Cu-Oxidation State and Oxygen Vacancies. J. Phys. Chem. C 2021, 125, 1793–1810. [Google Scholar] [CrossRef]
- Razali, M.H.; Ahmad-Fauzi, M.N.; Mohamed, A.R.; Sreekantan, S. Hydrothermal synthesis and characterisation of Cu doped TiO2 nanotubes for photocatalytic degradation of methyl orange. Adv. Mat. Res. 2014, 911, 126–130. [Google Scholar] [CrossRef]
- Wu, M.-C.; Wu, P.-Y.; Lin, T.-H.; Lin, T.-F. Photocatalytic Performance of Cu-Doped TiO2 Nanofibers Treated by the Hydrothermal Synthesis and Air-Thermal Treatment. Appl. Surf. Sci. 2018, 430, 390–398. [Google Scholar] [CrossRef]
- Feng, S.-H.; Li, G.-H. Hydrothermal and Solvothermal Syntheses. In Modern Inorganic Synthetic Chemistry; Elsevier: Amsterdam, The Netherlands, 2017; pp. 73–104. [Google Scholar]
- Deki, S.; Aoi, Y.; Yanagimoto, H.; Ishii, K.; Akamatsu, K.; Mizuhata, M.; Kajinami, A. Preparation and Characterization of Au-Dispersed TiO2 Thin Films by a Liquid-Phase Deposition Method. J. Mater. Chem. 1996, 6, 1879. [Google Scholar] [CrossRef]
- Maki, H.; Okumura, Y.; Ikuta, H.; Mizuhata, M. Ionic Equilibria for Synthesis of TiO2 Thin Films by the Liquid-Phase Deposition. J. Phys. Chem. C 2014, 118, 11964–11974. [Google Scholar] [CrossRef]
- Herbig, B.; Löbmann, P. TiO2 Photocatalysts Deposited on Fiber Substrates by Liquid Phase Deposition. J. Photochem. Photobiol. A Chem. 2004, 163, 359–365. [Google Scholar] [CrossRef]
- Yu, H.; Lee, S.C.; Yu, J.; Ao, C.H. Photocatalytic Activity of Dispersed TiO2 Particles Deposited on Glass Fibers. J. Mol. Catal. A Chem. 2006, 246, 206–211. [Google Scholar] [CrossRef]
- Listiani, P.S.; Honda, M.; Oya, H.; Horio, Y.; Ichikawa, Y. Optimization of Hydrolysis Temperature in Liquid Phase Deposition for TiO2 Photocatalysis. Jpn. J. Appl. Phys. 2022, 61, 075508. [Google Scholar] [CrossRef]
- Li, H.; Liu, B.; Yin, S.; Sato, T.; Wang, Y. Visible Light-Driven Photocatalytic Activity of Oleic Acid-Coated TiO2 Nanoparticles Synthesized from Absolute Ethanol Solution. Nanoscale Res. Lett. 2015, 10, 415. [Google Scholar] [CrossRef]
- Challagulla, S.; Tarafder, K.; Ganesan, R.; Roy, S. Structure Sensitive Photocatalytic Reduction of Nitroarenes over TiO2. Sci. Rep. 2017, 7, 8783. [Google Scholar] [CrossRef]
- Patterson, A.L. The Scherrer Formula for X-Ray Particle Size Determination. Phys. Rev. 1939, 56, 978–982. [Google Scholar] [CrossRef]
- Durante, O.; Di Giorgio, C.; Granata, V.; Neilson, J.; Fittipaldi, R.; Vecchione, A.; Carapella, G.; Chiadini, F.; DeSalvo, R.; Dinelli, F.; et al. Emergence and Evolution of Crystallization in TiO2 Thin Films: A Structural and Morphological Study. Nanomaterials 2021, 11, 1409. [Google Scholar] [CrossRef] [PubMed]
- Liu, M.; Yu, S.; He, L.; Ni, Y. Recent Progress on Crack Pattern Formation in Thin Films. Soft Matter 2022, 18, 5906–5927. [Google Scholar] [CrossRef] [PubMed]
- Louwerse, M.J.; Piccinini, M.; De Jong, K.P. Diffusion Mechanisms for Ions over Hydroxylated Surfaces: Cu on γ-Al 2 O 3. J. Phys. Chem. C 2019, 123, 18502–18507. [Google Scholar] [CrossRef]
- Liu, D.; Flewitt, P.E.J. Chapter 5. Raman Measurements of Stress in Films and Coatings. Prop. Inorg. Organomet. Compd. 2004, 45, 141–177. [Google Scholar]
- Scanlon, D.O.; Dunnill, C.W.; Buckeridge, J.; Shevlin, S.A.; Logsdail, A.J.; Woodley, S.M.; Catlow, C.R.A.; Powell, M.J.; Palgrave, R.G.; Parkin, I.P.; et al. Band Alignment of Rutile and Anatase TiO2. Nat. Mater. 2013, 12, 798–801. [Google Scholar] [CrossRef] [PubMed]
- Brus, L. Electronic Wave Functions in Semiconductor Clusters: Experiment and Theory. J. Phys. Chem. 1986, 90, 2555–2560. [Google Scholar] [CrossRef]
- Thompson, T.L.; Yates, J.T. TiO2-Based Photocatalysis: Surface Defects, Oxygen and Charge Transfer. Top. Catal. 2005, 35, 197–210. [Google Scholar] [CrossRef]
- Honda, M.; Saito, Y.; Kawata, S. Individual TiO2 Nanocrystals Probed by Resonant Rayleigh Scattering Spectroscopy. Appl. Phys. Express 2014, 7, 112402. [Google Scholar] [CrossRef]
- Reckers, P.; Dimamay, M.; Klett, J.; Trost, S.; Zilberberg, K.; Riedl, T.; Parkinson, B.A.; Brötz, J.; Jaegermann, W.; Mayer, T. Deep and Shallow TiO2 Gap States on Cleaved Anatase Single Crystal (101) Surfaces, Nanocrystalline Anatase Films, and ALD Titania Ante and Post Annealing. J. Phys. Chem. C 2015, 119, 9890–9898. [Google Scholar] [CrossRef]
- Zhu, L.; Lu, Q.; Lv, L.; Wang, Y.; Hu, Y.; Deng, Z.; Lou, Z.; Hou, Y.; Teng, F. Ligand-Free Rutile and Anatase TiO2 Nanocrystals as Electron Extraction Layers for High Performance Inverted Polymer Solar Cells. RSC Adv. 2017, 7, 20084–20092. [Google Scholar] [CrossRef]
- Jackman, M.J.; Thomas, A.G.; Muryn, C. Photoelectron Spectroscopy Study of Stoichiometric and Reduced Anatase TiO2 (101) Surfaces: The Effect of Subsurface Defects on Water Adsorption at Near-Ambient Pressures. J. Phys. Chem. C 2015, 119, 13682–13690. [Google Scholar] [CrossRef]
- You, M.; Kim, T.G.; Sung, Y.-M. Synthesis of Cu-Doped TiO2 Nanorods with Various Aspect Ratios and Dopant Concentrations. Cryst. Growth Des. 2010, 10, 983–987. [Google Scholar] [CrossRef]
- Liu, M.; Qiu, X.; Miyauchi, M.; Hashimoto, K. Cu(II) Oxide Amorphous Nanoclusters Grafted Ti3+ Self-Doped TiO2: An Efficient Visible Light Photocatalyst. Chem. Mater. 2011, 23, 5282–5286. [Google Scholar] [CrossRef]
- Hu, Q.; Huang, J.; Li, G.; Chen, J.; Zhang, Z.; Deng, Z.; Jiang, Y.; Guo, W.; Cao, Y. Effective Water Splitting Using CuOx/TiO2 Composite Films: Role of Cu Species and Content in Hydrogen Generation. Appl. Surf. Sci. 2016, 369, 201–206. [Google Scholar] [CrossRef]
- Francisco, M.S.P.; Mastelaro, V.R.; Nascente, P.A.P.; Florentino, A.O. Activity and Characterization by XPS, HR-TEM, Raman Spectroscopy, and BET Surface Area of CuO/CeO2-TiO2 Catalysts. J. Phys. Chem. B 2001, 105, 10515–10522. [Google Scholar] [CrossRef]


| Solute | FWHM (cm−1) |
|---|---|
| - | 30.2 |
| Cu(NO3)2 | 30.0 |
| CuCl2 | 31.8 |
| Cu(CH3COO)2 | 34.5 |
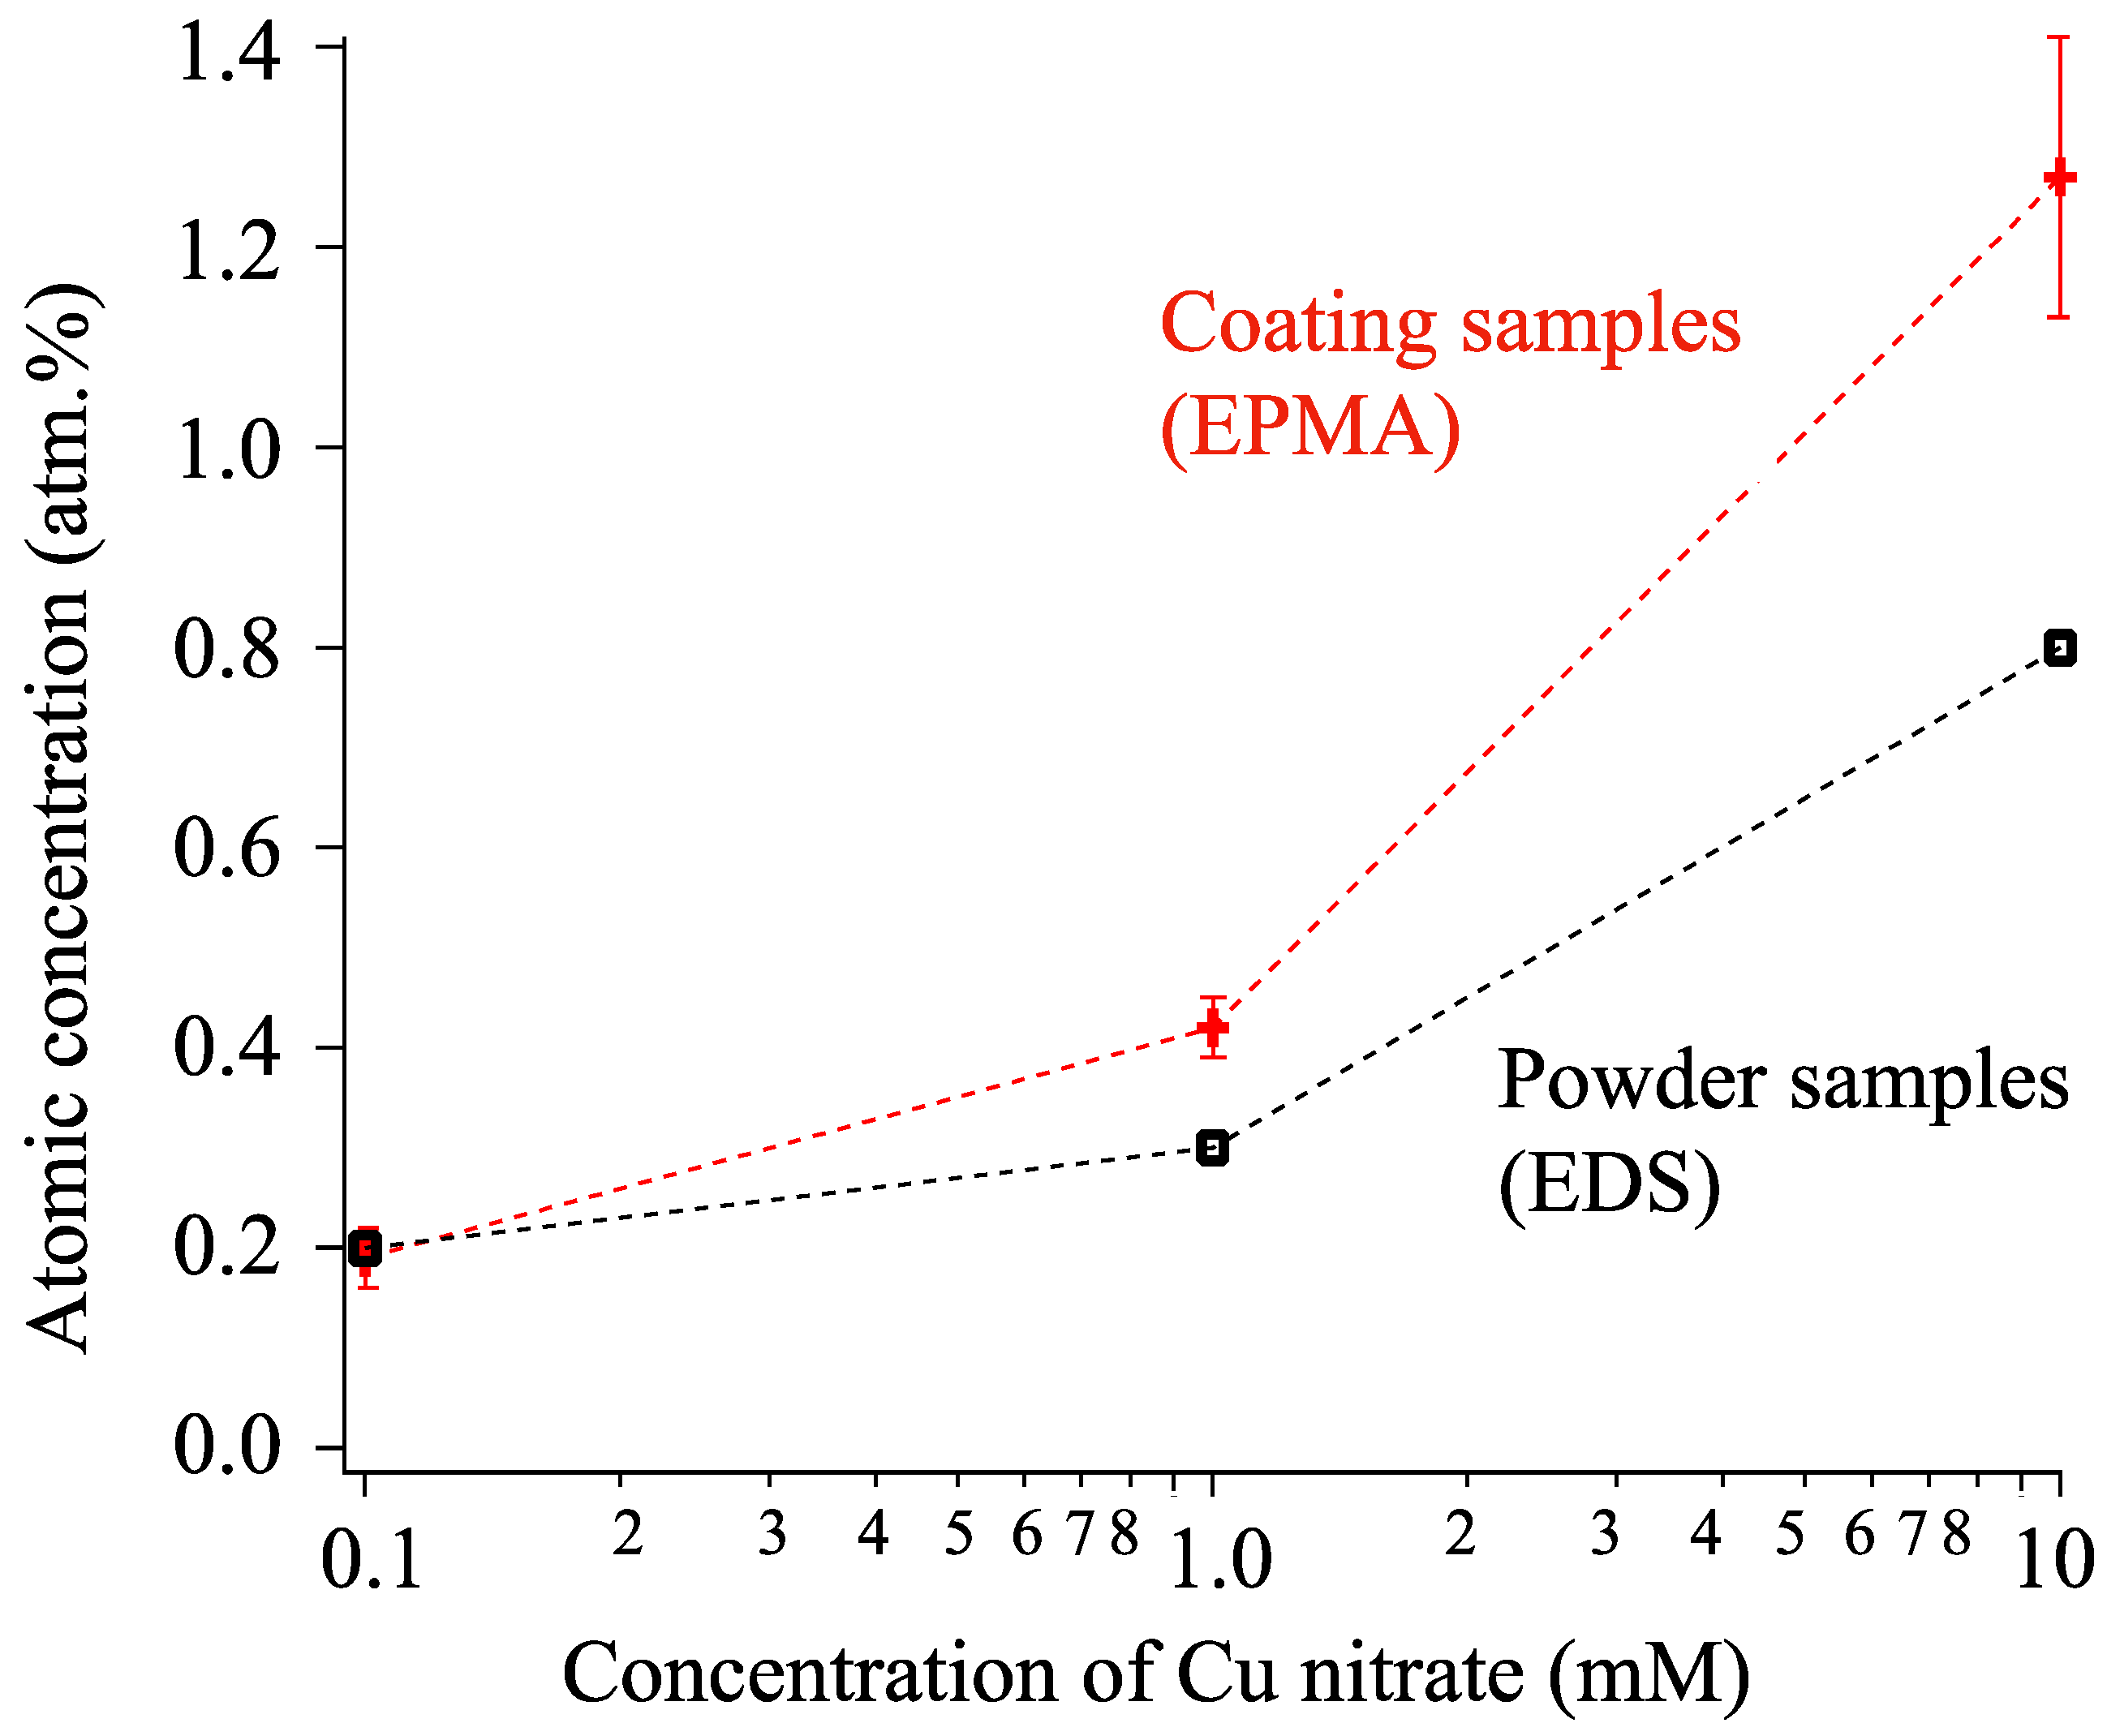
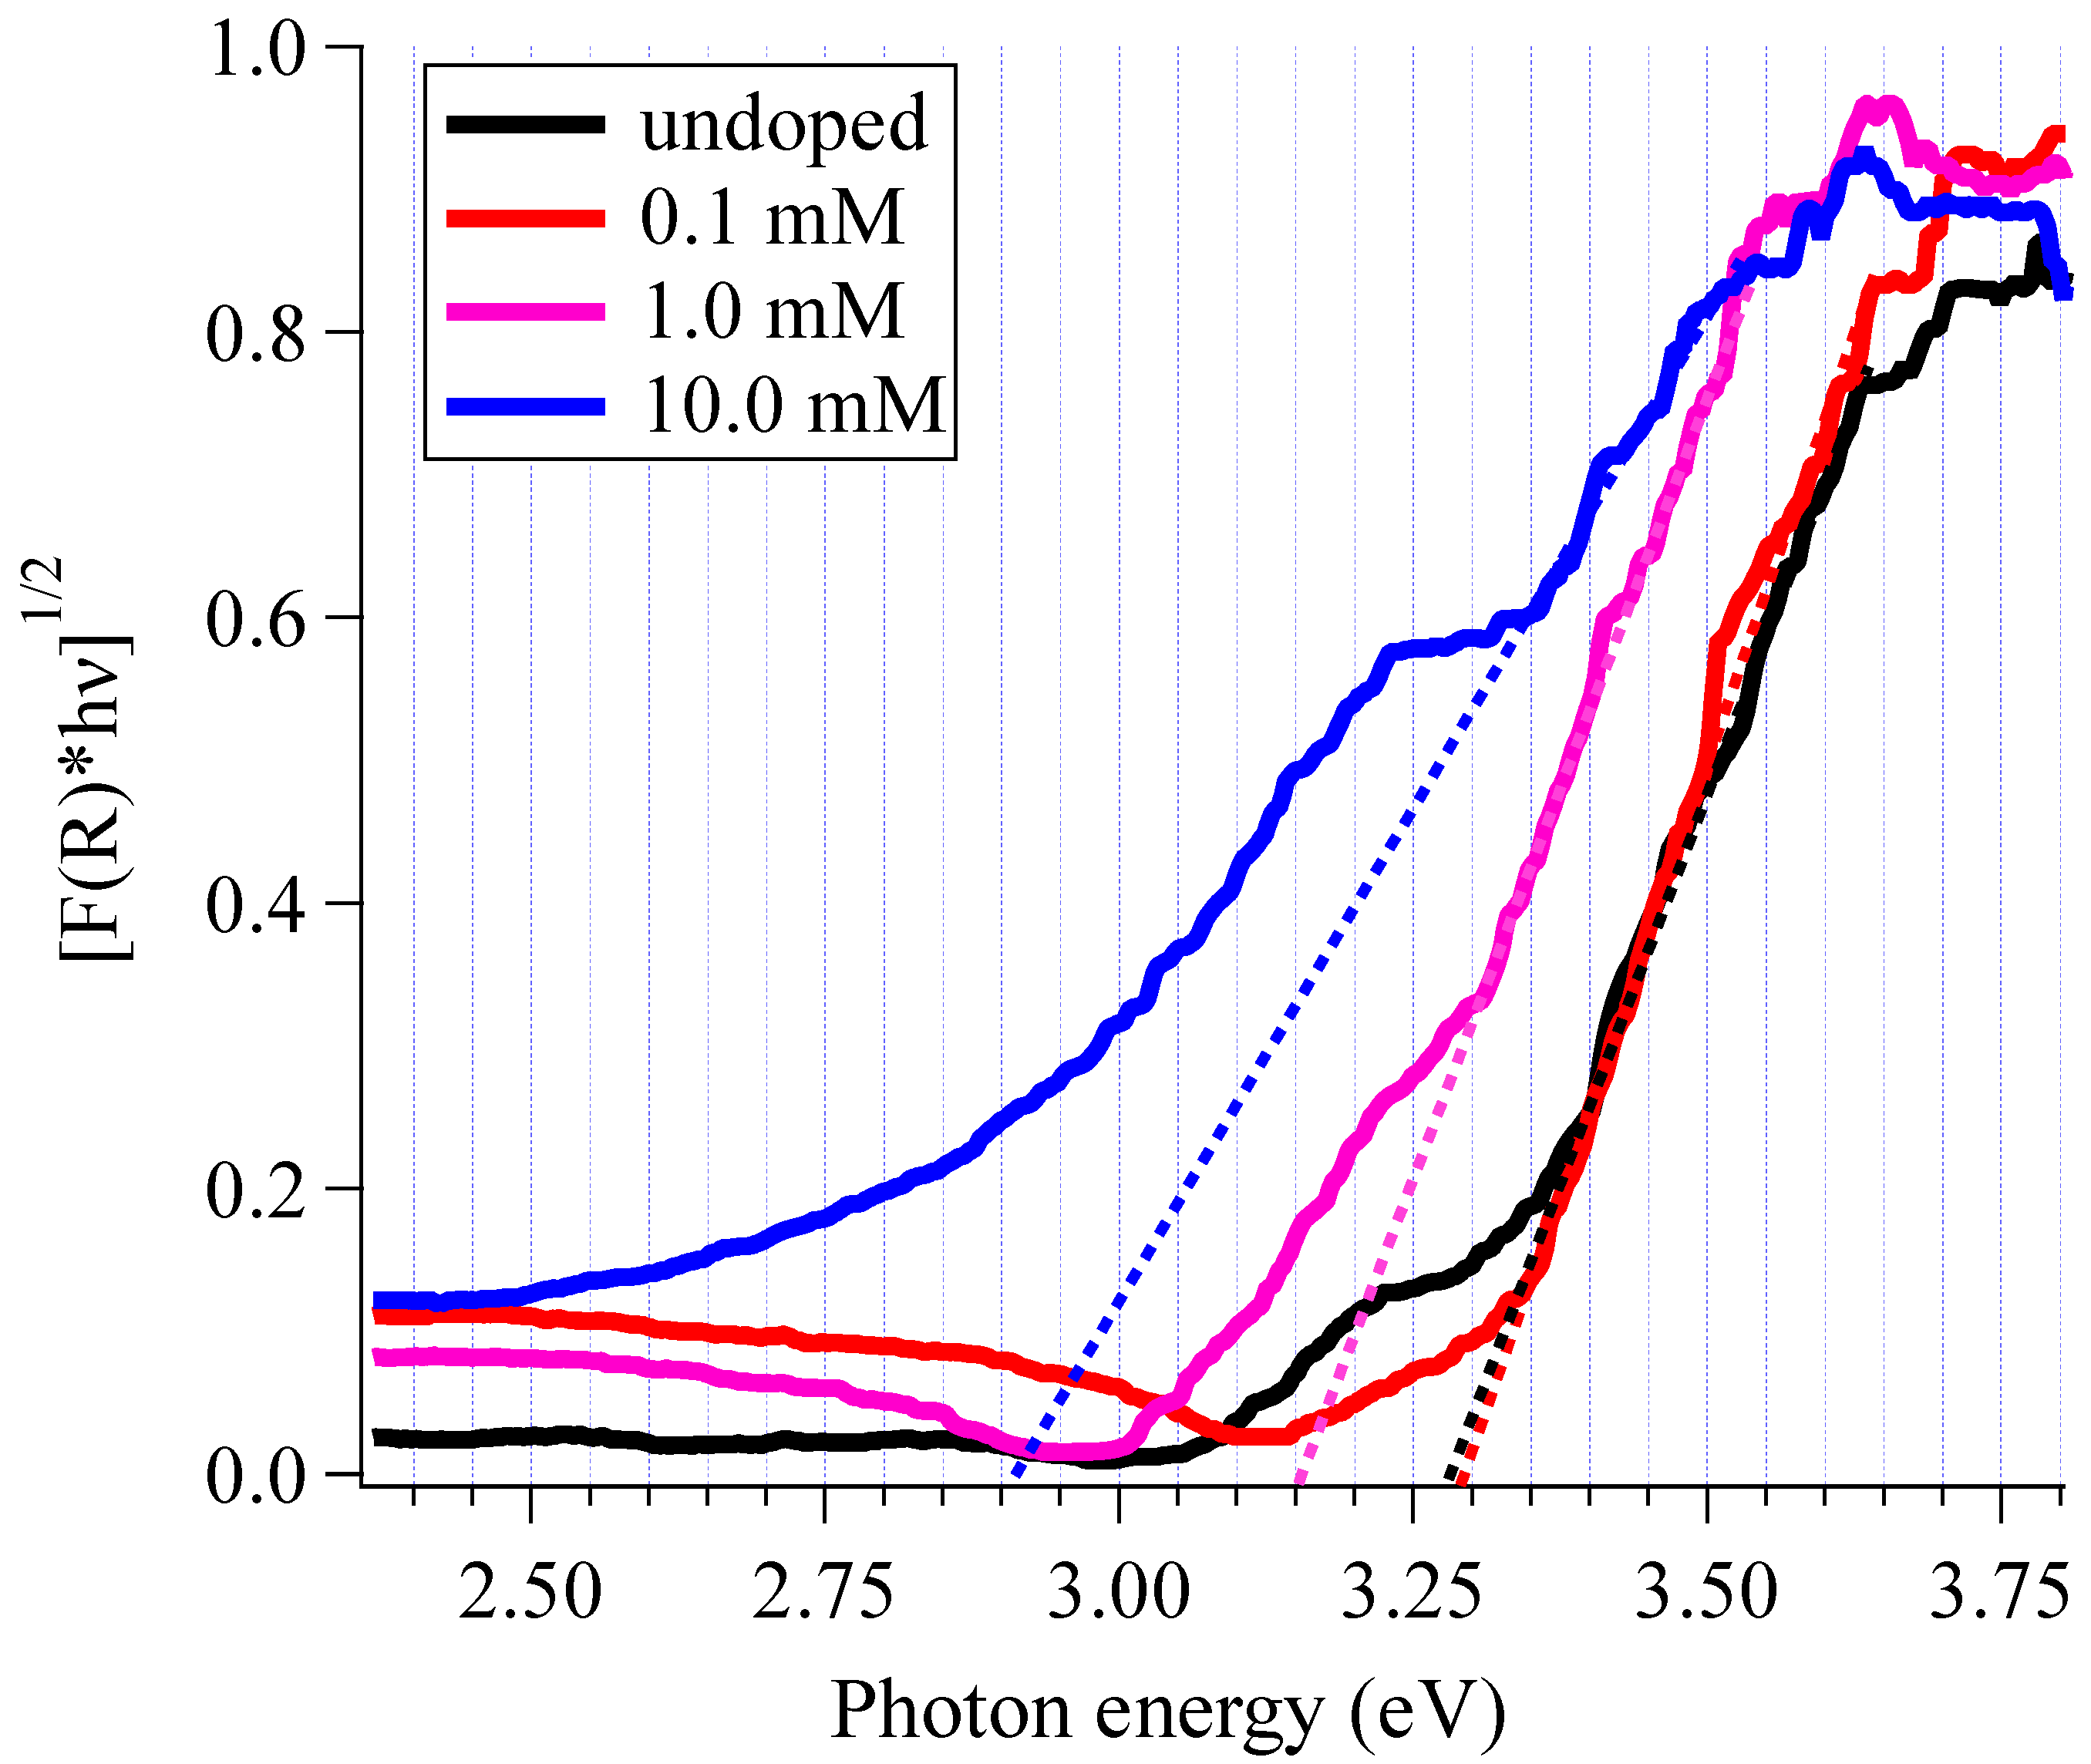
| Conc. (mM) | Atm.% | Bandgap (eV) |
|---|---|---|
| 0.0 | 0.0 | 3.30 |
| 0.1 | 0.2 | 3.30 |
| 1.0 | 0.4 | 3.15 |
| 10 | 1.3 | 2.90 |
| Cu Nitrate (mM) | Rate Constant k (ppm/min.) | Std. Error (ppm/min.) |
|---|---|---|
| 0.0 | 0.00131 | 0.00025 |
| 0.1 | 0.00164 | 0.00011 |
| 1.0 | 0.00156 | 0.00012 |
| 10 | 0.00068 | 0.00006 |
Disclaimer/Publisher’s Note: The statements, opinions and data contained in all publications are solely those of the individual author(s) and contributor(s) and not of MDPI and/or the editor(s). MDPI and/or the editor(s) disclaim responsibility for any injury to people or property resulting from any ideas, methods, instructions or products referred to in the content. |
© 2023 by the authors. Licensee MDPI, Basel, Switzerland. This article is an open access article distributed under the terms and conditions of the Creative Commons Attribution (CC BY) license (https://creativecommons.org/licenses/by/4.0/).
Share and Cite
Honda, M.; Ochiai, T.; Listiani, P.; Yamaguchi, Y.; Ichikawa, Y. Low-Temperature Synthesis of Cu-Doped Anatase TiO2 Nanostructures via Liquid Phase Deposition Method for Enhanced Photocatalysis. Materials 2023, 16, 639. https://doi.org/10.3390/ma16020639
Honda M, Ochiai T, Listiani P, Yamaguchi Y, Ichikawa Y. Low-Temperature Synthesis of Cu-Doped Anatase TiO2 Nanostructures via Liquid Phase Deposition Method for Enhanced Photocatalysis. Materials. 2023; 16(2):639. https://doi.org/10.3390/ma16020639
Chicago/Turabian StyleHonda, Mitsuhiro, Tsuyoshi Ochiai, Popy Listiani, Yuma Yamaguchi, and Yo Ichikawa. 2023. "Low-Temperature Synthesis of Cu-Doped Anatase TiO2 Nanostructures via Liquid Phase Deposition Method for Enhanced Photocatalysis" Materials 16, no. 2: 639. https://doi.org/10.3390/ma16020639
APA StyleHonda, M., Ochiai, T., Listiani, P., Yamaguchi, Y., & Ichikawa, Y. (2023). Low-Temperature Synthesis of Cu-Doped Anatase TiO2 Nanostructures via Liquid Phase Deposition Method for Enhanced Photocatalysis. Materials, 16(2), 639. https://doi.org/10.3390/ma16020639