Abstract
Single crystals of Pb1−3x▯xNd2x(MoO4)1−3x(WO4)3x (PNMWO) with scheelite-type structure, where ▯ denotes cationic vacancies, have been successfully grown by the Czochralski method in air and under 1 MPa. This paper presents the results of structural, optical, magnetic and electrical, as well as the broadband dielectric spectroscopy measurements of PNMWO single crystals. Research has shown that replacing diamagnetic Pb2+ ions with paramagnetic Nd3+ ones, with a content not exceeding 0.01 and possessing a screened 4f-shell, revealed a significant effect of orbital diamagnetism and Van Vleck’s paramagnetism, n-type electrical conductivity with an activation energy of 0.7 eV in the intrinsic area, a strong increase of the power factor above room temperature for a crystal with x = 0.005, constant dielectric value (~30) and loss tangent (~0.01) up to room temperature. The Fermi energy (~0.04 eV) and the Fermi temperature (~500 K) determined from the diffusion component of thermopower showed shallow donor levels.
1. Introduction
Divalent metal molybdates and tungstates with the chemical formula of ABO4 (A = Ca, Sr, Ba, and Pb; B = Mo or W) and tetragonal scheelite-type structure (space group I41/a), both un-doped as well as activated with RE3+ ions, are very interesting materials because of their excellent properties. They are used as efficient phosphors [1], solid state lasers [2,3], optical fibers [4], microwave dielectrics [5,6], catalysts [7,8] and scintillators [9,10,11,12,13]. Recently, other materials with RE3+ ions, i.e., their sesquioxides (RE2O3, RE = Ce, Dy, Gd, Er, Eu, Sm, Yb and Y) are most often used for the fabrication of modern sensors and detectors [14]. In turn, magnetic nanoparticles are now increasingly used in biomedicine [15,16]. Lead molybdate (PbMoO4) and lead tungstate (PbWO4), as members of the scheelite family, are highly ionic compounds with a small contribution of a covalent bonding. Density functional theory calculations indicated, that both compounds are indirect band gap semiconductors and the values of gap (Eg) equal to 2.59 eV and 2.96 eV, respectively [17]. However, the experimental values are in the range 3.1–3.2 eV for PbMoO4 [18,19] and 3.73–4 eV for PbWO4 [20,21].
Our magnetic, electrical, UV-vis diffusion reflection spectroscopy and the broadband dielectric spectroscopy studies of lead tungstate doped with Pr3+ ions [20] and lead molybdato-tungstates doped with Pr3+ [22] or Gd3+ [23,24] ions, have generally shown that they are non-conductive paramagnets or superparamagnets. In particular, microcrystalline samples of Pb1−3x▯xPr2xWO4 with 0.0098 ≤ x ≤ 0.20 obtained by high-temperature solid-state reaction method have the indirect band gap for each Pr3+-doped sample smaller than Eg of pure matrix and it was found to be 3.39 eV (x = 0.0098), 3.57 eV (x = 0.0839), and 3.42 eV (x = 0.20) [20]. In turn, lead molybdato-tungstates doped with Pr3+ ions obtained by the same method, i.e., Pb1−3x▯xPr2x(MoO4)1−3x(WO4)3x with 0 < x ≤ 0.2222, have the maximum value of Eg = 3.22 eV for x = 0.2, which is even lower than of lead tungstates doped with Pr3+ [22]. Interesting results were found for lead molybdato-tungstates doped with Gd3+ ions, i.e., Pb1−3x▯xGd2x(MoO4)1−3x(WO4)3x materials with x = 0.0455, 0.0839, 0.1154, 0.1430, 0.1667 and 0.1774 and x = 0.0455, 0.0839, 0.1430 synthesized via solid state reaction route [23] and via combustion one [24], respectively. For the ceramics obtained by the solid state reaction method, it was observed a paramagnetic state with characteristic superparamagnetic-like behavior, the faster and slower dipole relaxation processes up to x = 0.1154 and their complete absence above this value [23]. In the materials obtained by combustion route, paramagnetic state with characteristic superparamagnetic-like behavior and the absence of dipole relaxation processes were also observed. This is because the dipole relaxation disappears as the grain size decreases, resulting in a spatial polarization in which the electron or ionic freedom of charge is limited [24].
In the present work, we applied the Czochralski technique to grow scheelite-type Nd3+-doped lead molybdato–tungstate single crystals. The growth processes were carried out in air under 1 MPa, which significantly stopped the evaporation of volatile metal oxides. The purpose of our research was to investigate the structural, optical, magnetic and electrical properties of the as-grown single crystals. The novelty of this work is the study of poorly conductive materials that are strongly magnetically diluted. The studies mentioned above allow to determine the influence of magnetic contributions independent of temperature on magnetic parameters. In addition, the Fermi energy and temperature were estimated from the measurements of the diffusion component of the thermoelectric power.
2. Materials and Methods
2.1. Crystal Growth and Chemical Analysis
Single crystals of Pb1−3x▯xNd2x(MoO4)1−3x(WO4)3x solid solution (x = 0.001, 0.005 and ▯ denotes vacant sites, labelled later as PNMWO) were successfully grown by the Czochralski method in an inductively heated platinum crucible in air atmosphere under 1 MPa. Starting materials for crystallization processes were the following metal oxides: for PNMWO single crystal (x = 0.001)—PbO (109.1223 g; 0.4889 mol; purity 99.95%, Alfa Aesar), MoO3 (70.3715 g; 0.4889 mol; purity 99.95%, Alfa Aesar), Nd2O3 (0.1651 g; 0.4906 mmol; purity 99.99%, Alfa Aesar), and WO3 (0.3411 g; 1.4712 mmol; purity 99.95%, Alfa Aesar); for PNMWO single crystal (x = 0.005)—PbO (107.8906 g; 0.4834 mol;), MoO3 (69.5772 g; 0.4834 mol), Nd2O3 (0.8256 g; 2.4536 mmol), and WO3 (7.3608 g; 7.3608 mmol). The total mass of all oxides used for the pulling of both single crystals was 180.0000 g. The PNMWO single crystals, grown in air atmosphere, are light-brown in color (Figure 1). After accurate orientation by X-ray diffraction, the PNMWO single crystals were cut along the [100] and [001] crystallographic planes, and then plates of dimensions of ~5 × 6 × 1 mm3 were cut off. As-prepared samples of PNMWO single crystals were used for the optical, magnetic and dielectric studies. For X-ray diffraction measurements, small pieces of diameters less than 0.1 mm were cut off the as-grown single crystals and selected under a polarization microscope.
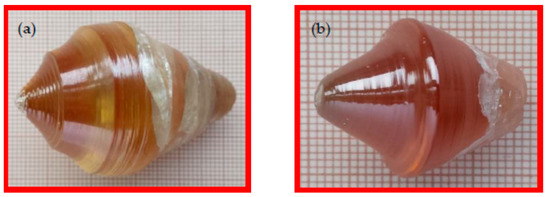
Figure 1.
Images of PNMWO single crystals: (a) x = 0.001 and (b) x = 0.005.
The content of neodymium, lead, molybdenum and tungsten in PNMWO single crystals were determined by an Inductively Coupled Plasma Mass Spectrometry (ICP-MS) technique. The contents of metallic elements were found as: for PNMWO single crystal (x = 0.001)—Nd 0.08 (1) mas% (cal. 0.08 mas%), W 0.14 (2) mas% (cal. 0.15 mas%), Mo 26.01 (3) mas% (cal. 26.06 mas%), and Pb 56.20 (3) mas% (cal. 56.28 mas%); for PNMWO single crystal (x = 0.005)—Nd 0.33 (4) mas% (cal. 0.39 mas%), W 0.68 (3) mas% (cal. 0.75 mas%), Mo 25.66 (5) mas% (cal. 25.76 mas%), and Pb 55.55 (6) mas% (cal. 55.64 mas%). These values closely corresponded to the proposed chemical formula of both crystals.
2.2. Methods
Small pieces of the length less than 0.1 mm were cut off from both PNMWO single crystals. The most suitable parts for the single crystal X-ray measurement were chosen under the polarization microscope, and then mounted on a glass capillaries. SuperNova kappa diffractometer, equipped with Mo Kα X-ray tube and Atlas CCD detector (Agilent Technologies), was used for the X-ray diffraction measurements which were performed at 293 (1) K. CrysAlisPro [25] program was used for collection of the data as well as for determination and refinement of the unit cell parameters from ca. 4000 reflections. Integrations of the collected data were also performed using CrysAlisPro [25]. SHELXL-97 program [26] was used to refine both structures. The positions of O atoms as well as the anisotropic displacement parameters of all atoms were refined.
Ultraviolet and visible (UV-vis) diffuse reflectance spectroscopy was realized with a JASCO-V670 (Jasco International Co., Tokyo, Japan) spectrophotometer equipped with an integrating sphere. The spectra were recorded in the range from 200 to 1000 nm.
The static (DC) magnetic susceptibility was measured in the temperature range of 5–300 K and recorded both in zero-field-cooled (ZFC) and field-cooled (FC) mode. Magnetization isotherms were measured at 5, 10, 20, 40, 60, and 300 K using a Quantum Design MPMS-XL-7AC SQUID magnetometer (Quantum Design, San Diego, CA, USA) in applied external fields up to 70 kOe. The effective magnetic µeff moment was determined using the equation [27,28]:
where k is the Boltzmann constant, NA is the Avogadro number, µB is the Bohr magneton, and C is the molar Curie constant. The effective number of Bohr magnetons peff was calculated from the equation:
where [29] for a Nd3+ ion (J = 9/2, L = 6, S = 3/2, g = 8/11, basic term 4I9/2) with 4f3 electronic configuration.
Electrical conductivity σ(T) of the samples under study was measured by the DC method using a KEITHLEY 6517B Electrometer/High Resistance Meter (Keithley Instruments, LLC, Solon, OH, USA) and within the temperature range of 77–400 K. The thermoelectric power S(T), i.e., the Seebeck coefficient was measured within the temperature range of 100–400 K with the help of a Seebeck Effect Measurement System (MMR Technologies, Inc., San Jose, CA, USA). Dielectric measurements were carried out on PNMWO single crystals which were polished as well as sputtered with (~80 nm) Ag electrodes. The studies were carried out in the frequency range of 5 × 10² – 2 × 10⁶ Hz using a LCR HITESTER (HIOKI 3532–50, Nagano, Japan) and within the temperature range of 80–400 K.
3. Results and Discussion
3.1. Crystal Structure
The X-ray diffraction measurements revealed that both single crystals belong to tetragonal symmetry and crystallize with scheelite-type structure in I41/a space group, analogously as divalent and scheelite-type molybdates and tungstates, i.e., PbMoO4 and PbWO4 [17]. The unit cell parameters of PNMWO crystal (x = 0.001) are as follows: a = b = 5.4380 (4) and c = 12.1111 (13) Å. The R-value is equal to 0.0149. In the case of PNMWO single crystal (x = 0.005) the lattice constants are as follows: a = b = 5.4357 (4) and c = 12.1067 (14) Å. The R-value is equal to 0.0164. The most important crystallographic data are collected in Tables S1–S8.
3.2. UV–Vis Diffuse Reflectance Spectra and Optical Band Gap
The optical properties of PNMWO single crystals along both crystallographic directions were investigated at room temperature using UV-vis diffuse reflectance spectroscopy method. The theory which makes possible to use diffuse reflectance spectra for solids was proposed by Kubelka and Munk [30]. According to this method, the reflectance spectra are converted into absorption ones using the following equation [30]:
where F(R) is the Kubelka-Munk approach, R is the reflectance, α is the absorption coefficient, and S is the scattering factor which is wavelength independent. Optical band energy gap (Eg) is related to the absorbance and photon energy the equation proposed by Tauc and Wood [31,32]:
where hν is the photon energy, A is an energy independent constant characteristic of a material, and n is a constant that can take different values depending on the nature of electronic transition. The permitted direct, forbidden direct, permitted indirect and forbidden indirect transitions take place when n = 1/2, 3/2, 2 and 3, respectively [31,32]. According to literature information, PbMoO4 and PbWO4 exhibit the optical spectrum governed by the indirect absorption process, i.e., for n = 2 [33,34]. In the high energy region of the absorption edge, (αhν)1/2 varied linearly with photon energy. Thus, in the low energy region, the absorption spectrum deviated from a straight line plot. This straight line behavior in the high energy region was taken as prime evidence of an indirect optical band gap. The plots of (αhν)1/2 vs. hν for PNMWO single crystals are depicted in Figure 2. The band gap energy of these crystals are found to be 2.78 eV along the [001] and 2.74 eV along the [100] direction for x = 0.001 as well as 2.50 eV along the [001] and 2.44 eV along the [100] direction for x = 0.005, corresponding to an indirect permitted transition of an electron between valence and conduction band.
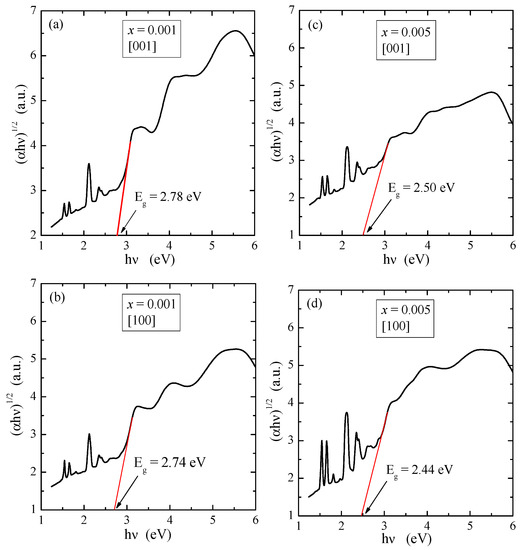
Figure 2.
Plots of (αhν)1/2 vs. hν of PNMWO single crystals: (a) x = 0.001 and [001], (b) x = 0.001 and [100], (c) x = 0.005 and [001], (d) x = 0.005 and [100].
3.3. Magnetic Properties
The results of magnetic measurements of PNMWO single crystals are presented in Table 1 and in Figure 3, Figure 4 and Figure 5. Due to the low content of paramagnetic neodymium ions, which did not exceed 0.01, it was necessary to estimate the temperature-independent magnetic contributions, as they affect the magnetic parameters of the single crystals under study. In general, these contributions to susceptibility (χ) coming from the orbital (χdia) and Landau (χL) diamagnetism, Pauli (χP) and Van Vleck (χVV) paramagnetism as well as others, modify the Curie-Weiss law to the form [35]:
where C is the Curie constant, θ is the Curie-Weiss temperature and χ0 represents all temperature independent susceptibilities. Multiplying Equation (5) on both sides by the temperature T, we obtain a linear relationship of the product χ⋅T as a function of temperature T in the Curie-Weiss region:
where is the intercept that tends to the Curie constant C as the temperature T tends to infinity, i.e., , and χ0 is the slope. The dependencies of the product χZFC⋅T(T) from the measurement and the asymptotes determined from Equation (6) in the Curie-Weiss region are shown in Figure 3, and the parameters b and χ0 are shown in Table 1

Table 1.
Magnetic parameters of PNMWO single crystals.
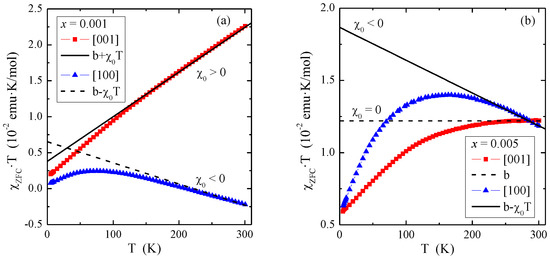
Figure 3.
Product χZFC⋅T vs. temperature T of PNMWO single crystals: (a) x = 0.001 and (b) x = 0.005. The solid and dashed lines, χ⋅T(T), indicates Curie-Weiss behavior. χ0 is the temperature independent contribution of magnetic susceptibility.
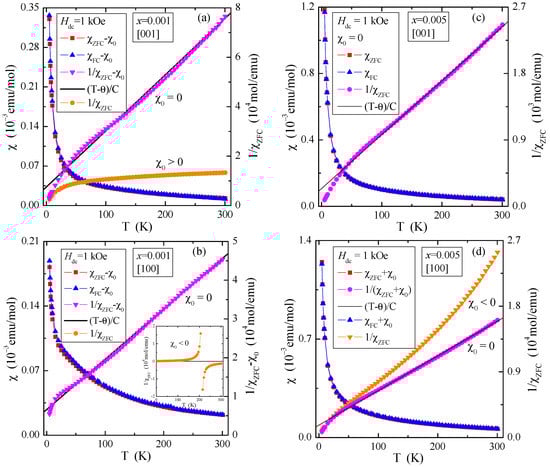
Figure 4.
Magnetic susceptibility , , , (T−θ)/C and vs. temperature T of PNMWO single crystals: (a) x = 0.001 and [001], (b) x = 0.001 and [100]. Inset: χZFC(T) without χ0 correction, (c) x = 0.005 and [001], (d) x = 0.005 and [100], recorded at Hdc = 1 kOe.
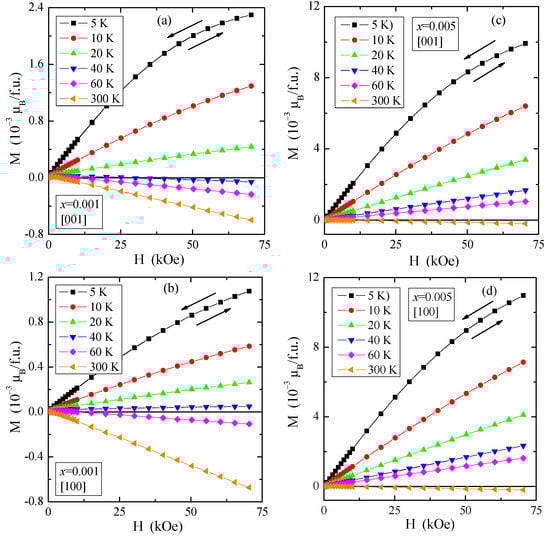
Figure 5.
Magnetization M vs. magnetic field H of PNMWO single crystals: (a) x = 0.001 and [001], (b) x = 0.001 and [100], (c) x = 0.005 and [001], (d) x = 0.005 and [100], recorded at 5, 10, 20, 40, 60 and 300 K. A run of magnetic field is indicated by arrows.
Figure 3 shows that the temperature-independent magnetic contributions are anisotropic, 3a: for the single crystal with x = 0.001 and the direction [001], the dominance of Van Vleck’s paramagnetism (χ0 > 0) is observed, while for the direction [100]—orbital diamagnetism (χ0 < 0), 3b: for the single crystal with x = 0.005 and the direction [001], the compensation of Van Vleck’s paramagnetism and orbital diamagnetism (χ0 = 0) is observed, while for the direction [100] orbital diamagnetism (χ0 < 0) dominates. The χ0 values determined from Equation (6) were used to correct the magnetic susceptibility measured in the ZFC and FC modes (Figure 4). This allowed for the correct determination of magnetic parameters such as the Curie constant (C), Curie-Weiss temperature (θ) and the effective magnetic moment (μeff). They are presented in Table 1. It can be seen from Figure 4 that after the χ0 correction, both single crystals in both directions are paramagnets with a negative value of the paramagnetic Curie-Weiss temperature, θ (Table 1). This means that short-range magnetic interactions are antiferromagnetic (AFM) in nature. Table 1 shows that the values of the effective magnetic moment (μeff) are significantly higher than the effective number of Bohr magnetons (peff). This may mean that some of the molybdenum ions are in a lower oxidation state than 6+, contributing to the total paramagnetic moment. This may explain the existence of short-range AFM interactions, which may result from the competition of interactions between paramagnetic neodymium ions and magnetic molybdenum ones.
Weak paramagnetism is also visible on the magnetization isotherms, M(H), displayed in Figure 5. They showed neither saturation magnetization at 5 K nor magnetic hysteresis for both crystallographic directions resulted in no remanence and coercive field and a transition from paramagnetic to diamagnetic state at 40 K for the single crystal with x = 0.001 and at 300 K for the single crystal with x = 0.005.
3.4. Electrical Studies
The results of the electrical conductivity measurements, σ(103/T), of the PNMWO single crystals clearly showed two areas: extrinsic in the wide temperature range of 77–300 K, in which the weak thermal activation Ea1 ~0.007 eV is observed as well as intrinsic in the temperature range of 350–400 K with a stronger thermal activation of Ea2 ~0.7 eV (Table 2 and Figure 6). Despite stronger activation in the intrinsic area, the electrical conductivity value at 400 K is only 1.3 × 10⁻³ S/m. We have low n-type electrical conductivity in the intrinsic area (Figure 6 and Figure 7). This behavior correlates well with values of the energy gap in the range of 2.4–2.8 eV, which slightly depend on the content of Nd3+ ions in the sample (Table 2). For comparison, the values of Eg ~1.7 eV found for both crystallographic directions of CdMoO4:Eu3+ single crystal [36] are lower than for the single crystals under study, which results in greater electrical conductivity (σ ~9.3 × 10⁻³ S/m) due to the fact that the width of Eu3+-multiplet is comparable to the thermal energy kT. Two distinct areas of electrical conductivity with strong activation in the intrinsic region were also observed in ceramics such as: Cu2In3VO9 [37], M2FeV3O11 (M = Mg, Zn, Pb, Co, Ni) [38] and Cd1−3xGd2x▯xMoO4 [39]. The residual n-type electrical conductivity in the extrinsic region appears to be related to the anion surplus seen in the chemical formula. Another explanation may be related to the fact that at a state of thermal equilibrium structural defects (n) are always present in the lattice even in the crystal which is ideal in other respects. A necessary condition for free energy minimalization gives: n ≅ Nexp(−EV/kT) for n << N, where N is the number of atoms in the crystal, EV is the energy required to transfer the atom from the bulk of the crystal on its surface and k is the Boltzmann constant [40]. On the other hand, n-type electrical conductivity in the intrinsic region may be related to the presence of molybdenum ions at a lower oxidation state than 6+, similar to magnetic studies, where electrons on the unfilled 4d subshell may be a reservoir of current carriers.
Table 2.
Electrical parameters of PNMWO single crystals.
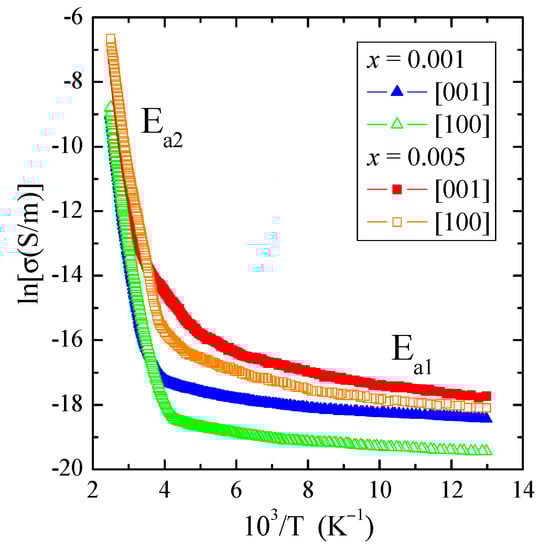
Figure 6.
Electrical conductivity (lnσ) vs. reciprocal temperature 103/T of PNMWO single crystals. Ea1 and Ea2 are the activation energies in the extrinsic and intrinsic regions, respectively.
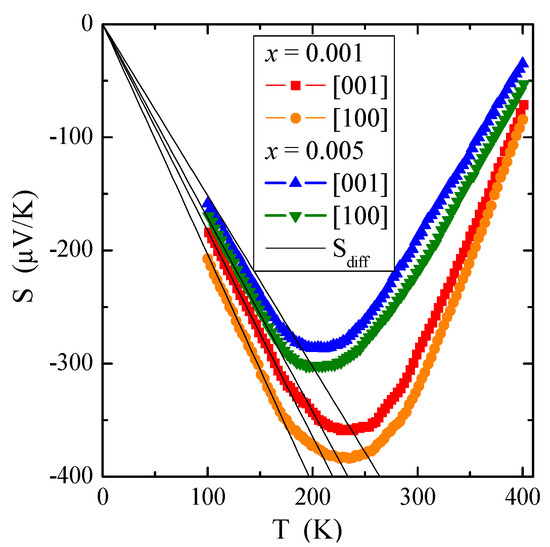
Figure 7.
Thermoelectric power S vs. temperature T of PNMWO single crystals. Sdiff is the diffusion component of thermopower (marked with a solid line).
The temperature dependence of thermoelectric power, S(T), presented in Figure 7, requires special consideration. In general, the thermopower in conventional metals consists of two different parts, i.e., a diffusion component (Sdiff), which according to the Mott formula [41] is proportional to temperature and a phonon resistance component (Sph), which is more complex. The Sph contribution results from a transfer of the phonon momentum to the electron gas. It drops both at low temperatures, such as T3 below θD/10, when the phonons freeze out (where θD is the Debye temperature), and at high temperatures, such as T−1 above approximately θD/2, when the phonon’s excess momentum is limited by anharmonic phonon-phonon scattering [42]. The Debye temperature θD [43] has been estimated from the following formula:
where h is the Planck constant, N = 24 and V (taken from Tables S1–S8) are the number of ions and the volume of the scheelite unit cell, respectively, and vD = 2692 m/s is the sound speed in PbMoO4 matrix [44]. Debye temperature values θD = 326 K for both crystals and 327 K for the matrix taken from Ref. [44] for comparison. The S(T) minimum observed above 200 K in Figure 7 indicates a transfer of phonon momentum to electron gas.
The diffusion contribution Sdiff is a direct application of the Boltzmann transport equation [41], as follows:
where e is the elementary charge, EF is the Fermi energy and a is an empirical slope. From Equation (8), the Fermi energy, EF, can be written as follows:
Our experimental dependence of Sdiff on temperature T is marked by solid lines in Figure 7. Equation (9) allows us to evaluate the Fermi energy EF and the Fermi temperature TF (defined as EF/k) using the experimental value of the slope of thermopower, a, for each single crystal. The values of EF and TF are summarized in Table 2. Compared to metals, e.g., for pure copper: EF = 7 eV and TF = 8.19 × 10⁴ K [40] and to non-metallic conductors, e.g., for Cu1−xGaxCr2Se4 single crystals: EF ~0.3 eV and TF ~3 × 10³ K [45], the values for materials under study are very small. This means that the Fermi level is near the border of the valence band and the shallow donor level is just below the conduction band. The source of the observed low n-type electrical conductivity, which is more thermally activated above room temperature, may be 4d electrons derived from molybdenum ions with an oxidation state lower than 6+.
Figure 8 shows an interesting dependence of the power factor S2σ on temperature T. The power factor has a very small value of several dozen fW/(cmK2). However, its value significantly increases with increasing temperature, i.e., in the intrinsic region above 300 K for a sample richer in neodymium ions, regardless of the crystallographic direction. Similar behavior of S2σ(T) with only a few fW/(cmK2) was observed in ceramic Gd3+ and Co2+-co-doped calcium molybdato-tungstates [46] as well as in Nd3+ and Mn2+-co-doped calcium molybdato-tungstates [47]. The above mentioned studies show that even in ion-bonded materials containing a constant content of 3d transition metal ions, thermoelectric efficiency can be improved by doping them with 4f rare-earth ions.
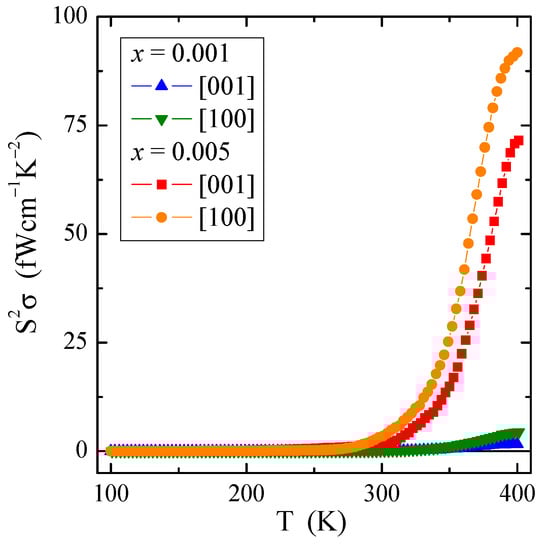
Figure 8.
Power factor S2σ vs. temperature T of PNMWO single crystals.
3.5. Dielectric Properties
Figure 9 presents temperature dependence of the relative dielectric permittivity, εr, for various electric field frequencies of PNMWO single crystals with x = 0.001 and 0.005, measured along [001] and [100] crystallographic directions. As can be seen, for each single crystal εr ~30 remains independent of temperature and frequency up to 300 K and increases rapidly above this temperature as well as at the same time decreases with increasing frequency. In the thermally activated region, the accumulation of electric charge is significantly higher for the sample with x = 0.001 (max. εr ~200) than for the sample with x = 0.005 (max. εr ~100). The loss tangent, tanδ, shows a similar behavior and its value does not exceed 0.01 below room temperature (Figure 10) and a strong energy loss above this temperature, i.e., in a highly thermally activated region. Impedance spectroscopy used to analyze the above results, did not reveal the Cole-Cole semicircles (not presented here). This suggests that in single crystals under study no dipole relaxation processes were observed in the temperature range up to 400 K. Therefore, a charge accumulation visible in the spectra may be caused by the polarization of the space charge in the macroscopic region where the charge freedom of the electron or ion is limited. Similar behavior was found in microcrystalline Gd3+-doped lead molybdato-tungstates with the chemical formula of Pb1−3x▯xGd2x(MoO4)1−3x(WO4)3x for x > 0.1154, synthesized via solid state reaction route [23] and in nanoparticles of the same solid solution obtained via combustion route [24]. This effect was there additionally confirmed by the analysis of the fit of the dielectric loss spectra of Gd3+-doped samples by the sum of the conductivity and Havriliak-Negami, Cole-Cole and Cole-Davidson functions [24].
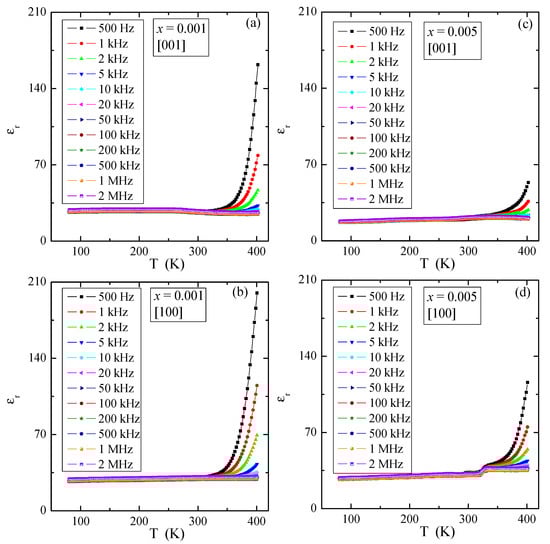
Figure 9.
Relative dielectric permittivity εr vs. temperature T of PNMWO single crystals: (a) x = 0.001 and [001], (b) x = 0.001 and [100], (c) x = 0.005 and [001], (d) x = 0.005 and [100].
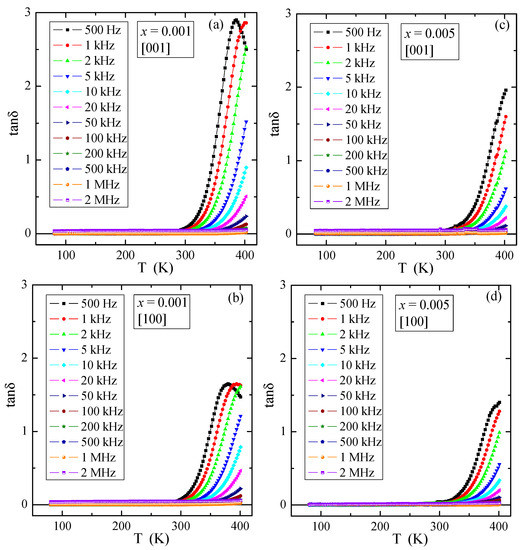
Figure 10.
Loss tangent tanδ vs. temperature T of PNMWO single crystals: (a) x = 0.001 and [001], (b) x = 0.001 and [100], (c) x = 0.005 and [001], (d) x = 0.005 and [100].
4. Conclusions
PNMWO single crystals obtained by the Czochralski method in air and under 1 MPa were characterized by structural, magnetic, UV-vis, electrical conductivity, thermoelectric power, power factor and dielectric spectroscopy measurements. They have shown scheelite-type structure, anisotropic character of the temperature-independent paramagnetic contributions, weak n-type conductivity in the extrinsic region (77–300 K) with the activation energy of 0.008 eV and stronger one with the activation energy of 0.7 eV in the intrinsic region (350–400 K), a strong increase of the power factor above room temperature for a crystal with x = 0.005, constant dielectric value (~30) and loss tangent (~0.01) up to room temperature. Calculations of the Fermi energy (~0.04 eV) and the Fermi temperature (~500 K) revealed the existence of shallow donor levels. In turn, the impedance spectroscopy analysis showed no dipole relaxation processes and possible charge accumulation through space charge polarization. The final conclusion is that the source of observed weak n-type electrical conductivity may be 4d electrons derived from molybdenum ions with an oxidation state lower than 6+ and anionic vacancies. Single crystals under study with such properties can be useful in the production of lossless capacitors used in the temperature range up to 300 K.
Supplementary Materials
The following supporting information can be downloaded at: https://www.mdpi.com/article/10.3390/ma16020620/s1, Table S1: Crystal data and structure refinement for PNMWO single crystal (x = 0.001). Table S2: Atomic coordinates (104) and equivalent isotropic displacement parameters (Å2 103) for PNMWO single crystal (x = 0.001). U(eq) is defined as one third of the trace of the orthogonalized Uij tensor. Table S3: Bond lengths [Å] and angles [°] for PNMWO single crystal (x = 0.001). Table S4: Anisotropic displacement parameters (Å2 103) for PNMWO single crystal (x = 0.001). The anisotropic displacement factor exponent takes the form: −2 2[h2a * 2U11 + ... + 2 h k a* b* U12]. Table S5: Crystal data and structure refinement for PNMWO single crystal (x = 0.005). Table S6: Atomic coordinates (104) and equivalent isotropic displacement parameters (Å2 103) for PNMWO single crystal (x = 0.005). Table S7: Bond lengths [Å] and angles [°] for PNMWO single crystal (x = 0.005). Table S8: Anisotropic displacement parameters (Å2 × 10³) for PNMWO single crystal (x = 0.005). The anisotropic displacement factor exponent takes the form: −2π2[ h2a*2U11 + ... + 2 h k a* b* U12].
Author Contributions
Conceptualization, B.S. and T.G.; methodology, T.G., B.S., E.T. and M.B.; validation, T.G.; formal analysis, T.G., J.K., E.T. and M.B.; investigation, B.S., E.T. and M.O.; resources, E.T. and M.B.; writing—original draft preparation, T.G., E.T. and J.K.; writing—review and editing, T.G. and E.T.; visualization, E.T. and T.G.; supervision, T.G.; project administration, B.S. All authors have read and agreed to the published version of the manuscript.
Funding
This research received no external funding.
Institutional Review Board Statement
Not applicable.
Informed Consent Statement
Not applicable.
Data Availability Statement
CIF files for PNMWO single crystals have been deposited in the CCDC database with the following Nos. 2221426-2221427.
Conflicts of Interest
The authors declare no conflict of interest.
References
- Sczancoski, J.C.; Bomio, M.D.R.; Cavalcante, L.S.; Joya, M.R.; Pizani, P.S.; Varela, J.A.; Longo, E.; Siu Li, M.; Andrés, J.A. Morphology and blue photoluminescence emission of PbMoO4 processed in conventional hydrothermal. J. Phys. Chem. C 2009, 113, 5812–5822. [Google Scholar] [CrossRef]
- Boulon, G. Fifty years of advances in solid-state laser materials. Opt. Mater. 2012, 34, 499–512. [Google Scholar] [CrossRef]
- Guzik, M.; Tomaszewicz, E.; Guyot, Y.; Legendziewicz, J.; Boulon, G. Structural and spectroscopic characterizations of two promising Nd-doped monoclinic or tetragonal laser tungstates. J. Mat. Chem. 2012, 22, 14896–14906. [Google Scholar] [CrossRef]
- Rushbrooke, J.G.; Ansorge, R.E. Optical fibre readout and performance of small scintillating crystals for a fine-grained gamma detector. Nucl. Instrum. Methods 1989, 280, 83–90. [Google Scholar] [CrossRef]
- Xi, H.-H.; Zhou, D.; He, B.; Xie, H.-D. Microwave dielectric properties of scheelite structured PbMoO4 ceramic with ultralow sintering temperature. J. Am. Ceram. Soc. 2014, 97, 1375–1378. [Google Scholar] [CrossRef]
- Tomaszewicz, E.; Piątkowska, M.; Pawlikowska, M.; Groń, T.; Oboz, M.; Sawicki, B.; Urbanowicz, P. New vacancied and Dy3+-doped molybdates e their structure, thermal stability, electrical and magnetic properties. Ceram. Int. 2016, 42, 18357–18367. [Google Scholar] [CrossRef]
- Golestaneh, M. Degradation of organic pollutant in waste water via CdMoO4 nanostructures as an effective photocatalyst; ultrasound-assisted preparation and characterization. J. Nanostruct. 2019, 9, 623–629. [Google Scholar]
- Eghbali-Arani, M.; Pourmasoud, S.; Ahmadi, F.; Rahimi-Nasrabadi, M.; Ameri, V.; Sobhani-Nasab, A. Optimization and detailed stability study on coupling of CdMoO4 into BaWO4 for enhanced photodegradation and removal of organic contaminant. Arab. J. Chem. 2020, 13, 2425–2438. [Google Scholar] [CrossRef]
- Kobayashi, M.; Usuki, Y.; Ishii, M.; Senguttuvan, N.; Tanji, K.; Chiba, M.; Hara, K.; Takano, H.; Nikl, M.; Bohacek, P.; et al. Significant improvement of PbWO4 scintillating crystals by doping with trivalent ions. Nucl. Instrum. Methods Phys. Res. A 1999, 434, 412–423. [Google Scholar] [CrossRef]
- Mikhailik, V.B.; Henry, S.; Kraus, H.; Solskii, I. Temperature dependence of CaMoO4 scintillation properties. Nucl. Instrum. Methods Phys. Res. A 2007, 583, 350–355. [Google Scholar] [CrossRef]
- Ishii, M.; Harada, K.; Kobayashi, M.; Usuki, Y.; Yazawa, T. Mechanical properties of PbWO4 scintillating crystals. Nucl. Instrum. Methods Phys. Res. A 1996, 376, 203–207. [Google Scholar] [CrossRef]
- Annenkov, A.N.; Auffray, E.; Chipaux, R.; Drobychev, G.Y.; Fedorov, A.A.; Géléoc, M.; Golubev, N.A.; Korzhik, M.V.; Lecoq, P.; Lednev, A.A.; et al. Systematic study of the short-term instability of PbWO4 scintillator parameters under irradiation. Radiat. Meas. 1998, 29, 27–38. [Google Scholar] [CrossRef]
- Kobayashi, M.; Usuki, Y.; Ishii, M.; Itoh, M. Significant increase in fast scintillation component from PbWO4 by annealing. Nucl. Instrum. Methods Phys. Res. A 2005, 537, 312–316. [Google Scholar] [CrossRef]
- Hossain, M.K.; Ahmed, M.H.; Khan, M.I.; Miah, S.; Hossain, S. Recent Progress of Rare Earth Oxides for Sensor, Detector, and Electronic Device Applications: A Review. ACS Appl. Electron. Mater. 2021, 3, 4255–4283. [Google Scholar] [CrossRef]
- Rubel, M.H.K.; Hossain, M.K. Crystal Structures and Properties of Nanomagnetic Materials in eBook: Fundamentals of Low Dimensional Magnets; CRC Press: Boca Raton, FL, USA, 2022; p. 183. [Google Scholar]
- Anik, M.I.; Hossain, M.K.; Hossain, I.; Ahmed, I.; Doha, R.M. 18—Biomedical Applications of Magnetic Nanoparticles in the Book: Magnetic Nanoparticle-Based Hybrid Materials Fundamentals and Applications; Woodhead Publishing Ltd.: Cambridge, UK, 2021; p. 463. [Google Scholar]
- Zhang, Y.; Holzwarth, N.A.W.; Williams, R.T. Electronic band structures of the scheelite materials CaMoO4, CaWO4, PbMoO4, and PbWO4. Phys. Rev. B 1998, 57, 12738–12750. [Google Scholar] [CrossRef]
- Hashim, M.; Hu, C.; Wang, X.; Li, X.; Guo, D. Synthesis and photocatalytic property of lead molybdate dendrites with exposed (0 0 1) facet. Appl. Surf. Sci. 2012, 258, 5858–5862. [Google Scholar] [CrossRef]
- Shen, M.; Zhang, Q.; Chen, H.; Peng, T. Hydrothermal fabrication of PbMoO4 microcrystals with exposed (001) facets and its enhanced photocatalytic properties. Cryst. Eng. Comm. 2011, 13, 2785–2791. [Google Scholar] [CrossRef]
- Groń, T.; Piątkowska, M.; Tomaszewicz, E.; Sawicki, B.; Urbanowicz, P.; Duda, H. Electrical and optical properties of new Pr3+-doped PbWO4 ceramics. Mater. Sci.-Pol. 2018, 36, 530–536. [Google Scholar] [CrossRef]
- Kwolek, P.; Tokarski, T.; Łokcik, T.; Szaciłowski, K. Novel, microwave assisted route of synthesis of binary oxides semiconducting phases—PbMoO4 and PbWO4. Arch. Metall. Mater. 2013, 58, 217–222. [Google Scholar] [CrossRef]
- Piątkowska, M.; Tomaszewicz, E. Synthesis, structure and thermal stability of new scheelite-type Pb1−3x▯xPr2x(MoO4)1−3x(WO4)3x ceramic materials. J. Therm. Anal. Cal. 2016, 126, 111–119. [Google Scholar] [CrossRef]
- Kukuła, Z.; Maciejkowicz, M.; Tomaszewicz, E.; Pawlus, S.; Oboz, M.; Groń, T.; Guzik, M. Electric relaxation of superparamagnetic Gd-doped lead molybdato-tungstates. Ceram. Int. 2019, 45, 4437–4447. [Google Scholar] [CrossRef]
- Groń, T.; Maciejkowicz, M.; Tomaszewicz, E.; Guzik, M.; Oboz, M.; Sawicki, B.; Pawlus, S.; Nowok, A.; Kukuła, Z. Combustion synthesis, structural, magnetic and dielectric properties of Gd3+-doped lead molybdato-tungstates. J. Adv. Ceram. 2020, 9, 255–268. [Google Scholar] [CrossRef]
- CrysAlisPro; Version 1.171.38.41q; Rigaku Oxford Diffraction; Agilent Technologies Ltd.: Yarnton, UK, 2015.
- Sheldric, G.M. Crystal structure refinement with Shelxl. Acta Crystallogr. C 2015, 71, 3–8. [Google Scholar] [CrossRef] [PubMed]
- Groń, T.; Krok-Kowalski, J.; Duda, H.; Mydlarz, T.; Gilewski, A.; Walczak, J.; Filipek, E.; Bärner, K. Metamagnetism in the Cr2V4-xMoxO13+0.5x solid solutions. Phys. Rev. 1995, 51, 16021–16024. [Google Scholar] [CrossRef]
- Krok-Kowalski, J.; Groń, T.; Warczewski, J.; Mydlarz, T.; Okońska-Kozłowska, I. Ferrimagnetism and metamagnetism in Cd1-xCuxCr2S4 spinels. J. Magn. Magn. Mater. B 1997, 168, 129–138. [Google Scholar] [CrossRef]
- Morrish, A.H. Physical Principles of Magnetism; John Wiley & Sons, Inc.: New York, NY, USA, 1965; p. 47. [Google Scholar]
- Kubelka, P.; Munk, F. Ein Beitrag zur Optic der Farbanstriche. Z. Tech. Phys. 1931, 12, 593–601. [Google Scholar]
- Tauc, J.; Grigorovici, R.; Vancu, A. Optical properties and electronic structures of amorphous germanium. Phys. Status Solidi 1966, 15, 627–637. [Google Scholar] [CrossRef]
- Tauc, J.; Menth, A. States in the gap. J. Non-Cryst. Sol. 1972, 8–10, 569–585. [Google Scholar] [CrossRef]
- Cavalcante, L.S.; Sczancoski, J.C.; Albarici, V.C.; Matos, J.M.E.; Varela, J.A.; Longo, E. Synthesis, characterization, structural refinement and optical absorption behavior of PbWO4 powders. Mater. Sci. Eng. 2008, 150, 18–25. [Google Scholar] [CrossRef]
- Kwolek, P.; Pilarczyk, K.; Tokarski, T.; Łapczyńska, M.; Pacia, M.; Szaciłowski, K. Lead molybdate—A promising material for optoelectronics and photocatalysis. J. Mater. Chem. C 2015, 3, 2614–2623. [Google Scholar] [CrossRef]
- Groń, T.; Pacyna, A.W.; Malicka, E. Influence of temperature independent contribution of magnetic susceptibility on the Curie-Weiss law. Sol. State Phenom. 2011, 170, 213–218. [Google Scholar] [CrossRef]
- Sawicki, B.; Tomaszewicz, E.; Groń, T.; Berkowski, M.; Głowacki, M.; Oboz, M.; Kusz, J.; Pawlus, S. Dipole relaxation process and giant dielectric permittivity in Eu3+-doped CdMoO4 single crystal. J. Mater. 2021, 7, 845–857. [Google Scholar] [CrossRef]
- Groń, T.; Bosacka, M.; Filipek, E.; Pacześna, A.; Urbanowicz, P.; Sawicki, B.; Duda, H. Semiconducting properties of Cu2In3VO9 ceramic material. Ceram. Int. 2017, 43, 2456–2459. [Google Scholar] [CrossRef]
- Groń, T.; Blonska-Tabero, A.; Filipek, E.; Urbanowicz, P.; Sawicki, B.; Duda, H.; Stokłosa, Z. Electrical transport properties of M2FeV3O11 (M = Mg, Zn, Pb, Co, Ni) ceramics. Ceram. Int. 2017, 43, 6758–6764. [Google Scholar] [CrossRef]
- Sawicki, B.; Groń, T.; Tomaszewicz, E.; Duda, H.; Górny, K. Some optical and transport properties of a new subclass of ceramic tungstates and molybdates. Ceram. Int. 2015, 41, 13080–13089. [Google Scholar] [CrossRef]
- Kittel, C. Introduction to Solid State Physics; John Wiley & Sons, Inc.: New York, NY, USA, 1971; p. 641. [Google Scholar]
- Barnard, R.D. Thermoelectricity in Metals and Alloys; Taylor & Francis: London, UK, 1972. [Google Scholar]
- Trodahl, H.J. Thermopower of the superconducting cuprates. Phys. Rev. B 1995, 51, 6175. [Google Scholar] [CrossRef] [PubMed]
- Debye, P. Zur Theorie der spezifischen Wärmen. Ann. Phys. 1912, 344, 789–839. [Google Scholar] [CrossRef]
- Chen, Q.; Sundman, B. Calculation of Debye temperature for crystalline structures—A case study on Ti, Zr, and Hf. Acta Mater. 2001, 49, 947–961. [Google Scholar] [CrossRef]
- Groń, T.; Bärner, K.; Kleeberg, C.; Okońska-Kozłowska, I. The thermoelectric power of ferromagnetically ordered Cu1-xGaxCr2Se4 spinels. Physica B 1996, 225, 191–196. [Google Scholar] [CrossRef]
- Sawicki, B.; Karolewicz, M.; Tomaszewicz, E.; Oboz, M.; Groń, T.; Kukuła, Z.; Pawlus, S.; Nowok, A.; Duda, H. Effect of Gd3+ substitution on thermoelectric power factor of paramagnetic Co2+-doped calcium molybdato-tungstates. Materials 2021, 14, 3692. [Google Scholar] [CrossRef]
- Sawicki, B.; Tomaszewicz, E.; Guzik, M.; Groń, T.; Oboz, M.; Duda, H.; Pawlus, S.; Urbanowicz, P. Effect of Ca2+ site substitution on structural, optical, electrical and magnetic properties in Nd3+ and Mn2+-co-doped calcium molybdato-tungstates. Ceram. Int. 2023, 49, 944–955. [Google Scholar] [CrossRef]


Disclaimer/Publisher’s Note: The statements, opinions and data contained in all publications are solely those of the individual author(s) and contributor(s) and not of MDPI and/or the editor(s). MDPI and/or the editor(s) disclaim responsibility for any injury to people or property resulting from any ideas, methods, instructions or products referred to in the content. |
© 2023 by the authors. Licensee MDPI, Basel, Switzerland. This article is an open access article distributed under the terms and conditions of the Creative Commons Attribution (CC BY) license (https://creativecommons.org/licenses/by/4.0/).