
Measuring Thermal Diffusivity of Azoheteroarene Thin Layers by Photothermal Beam Deflection and Photothermal Lens Methods


 ,
,  ,
, 


Abstract
1. Introduction
2. Materials and Methods
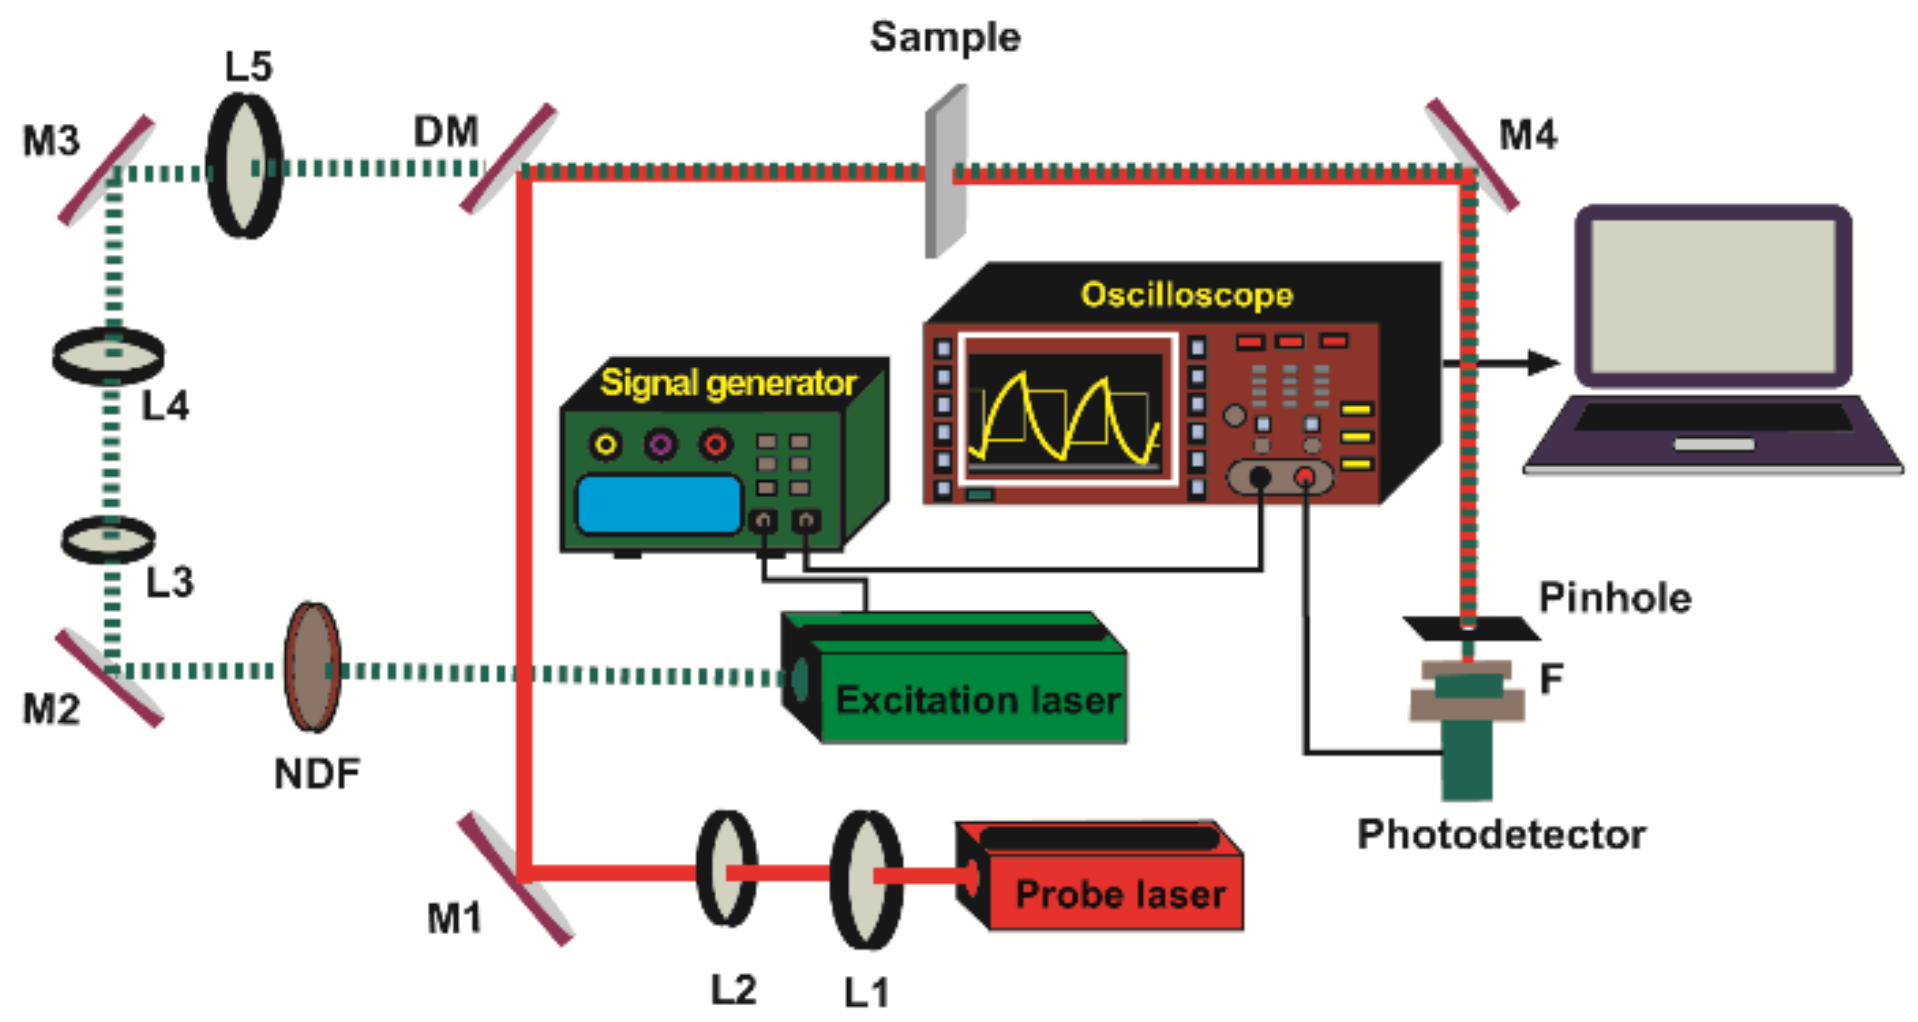
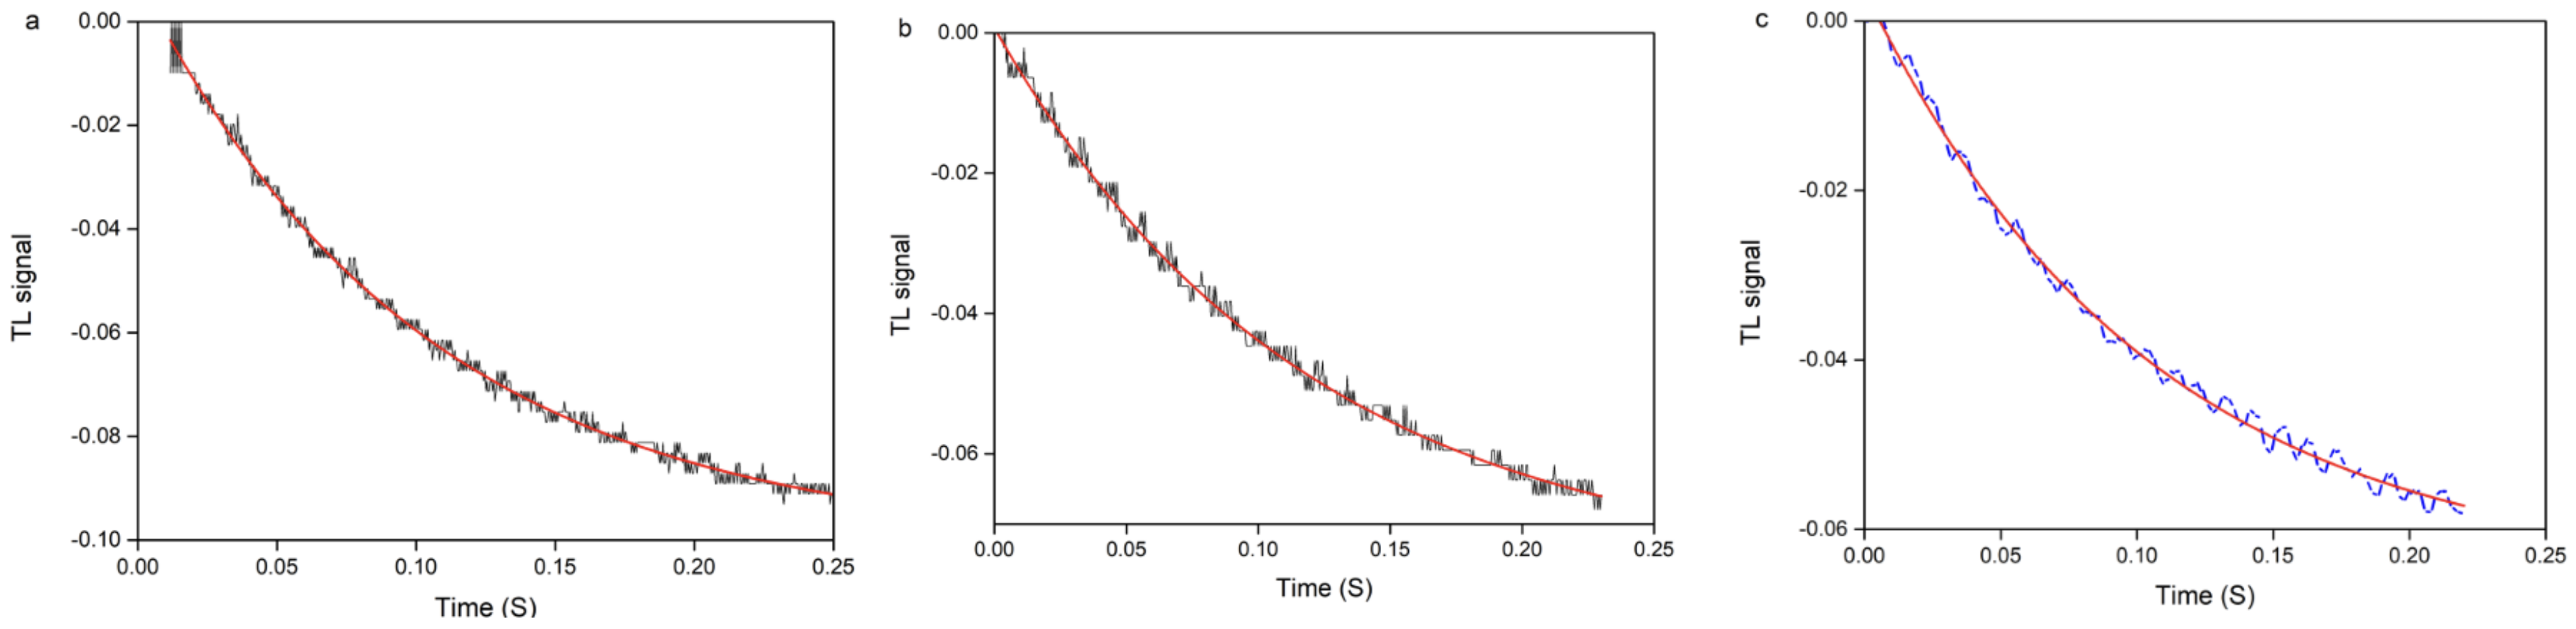
2.1. Thermal Lens
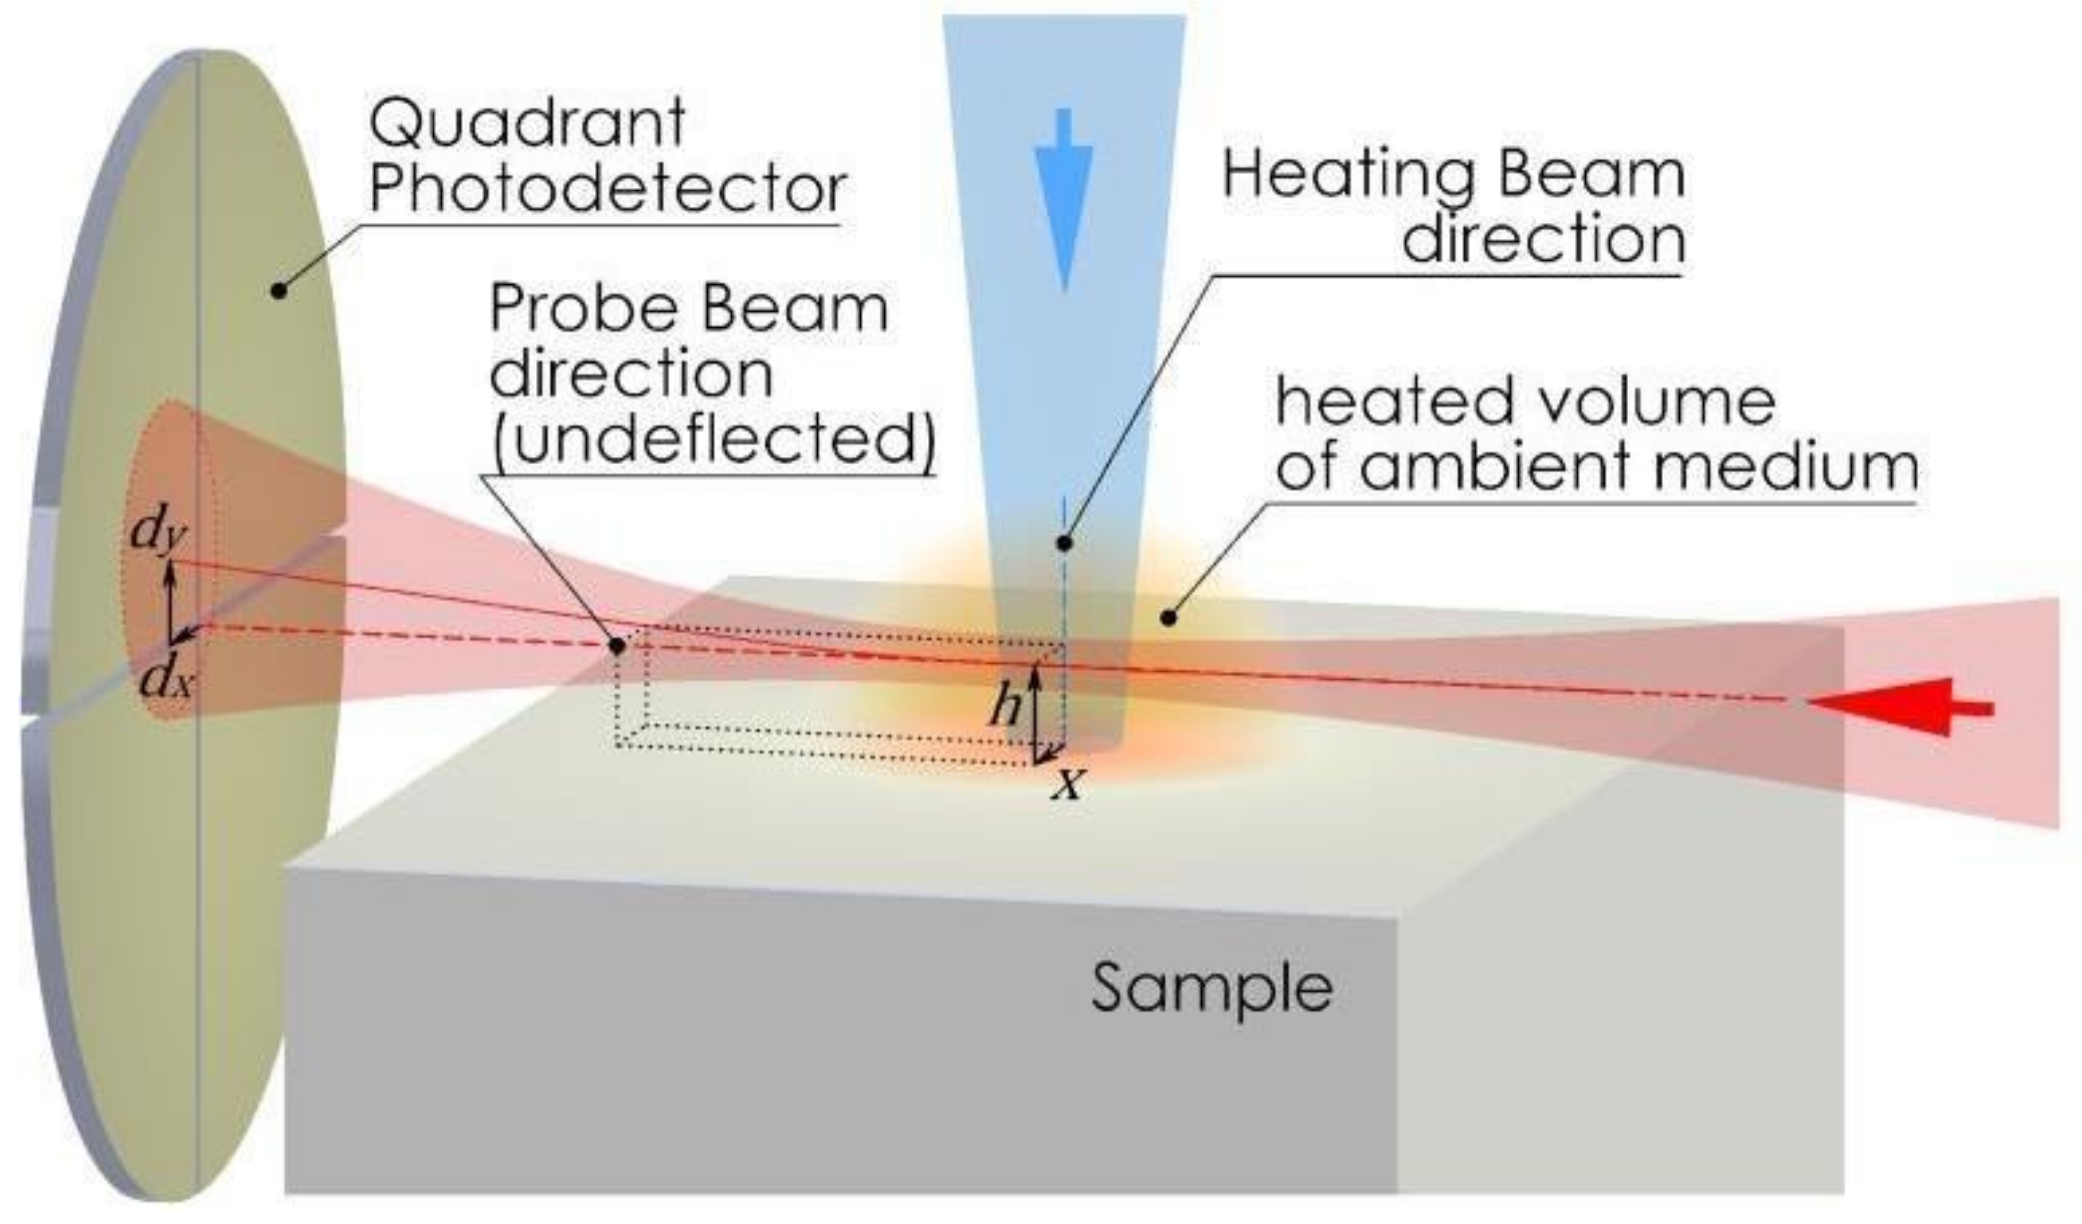
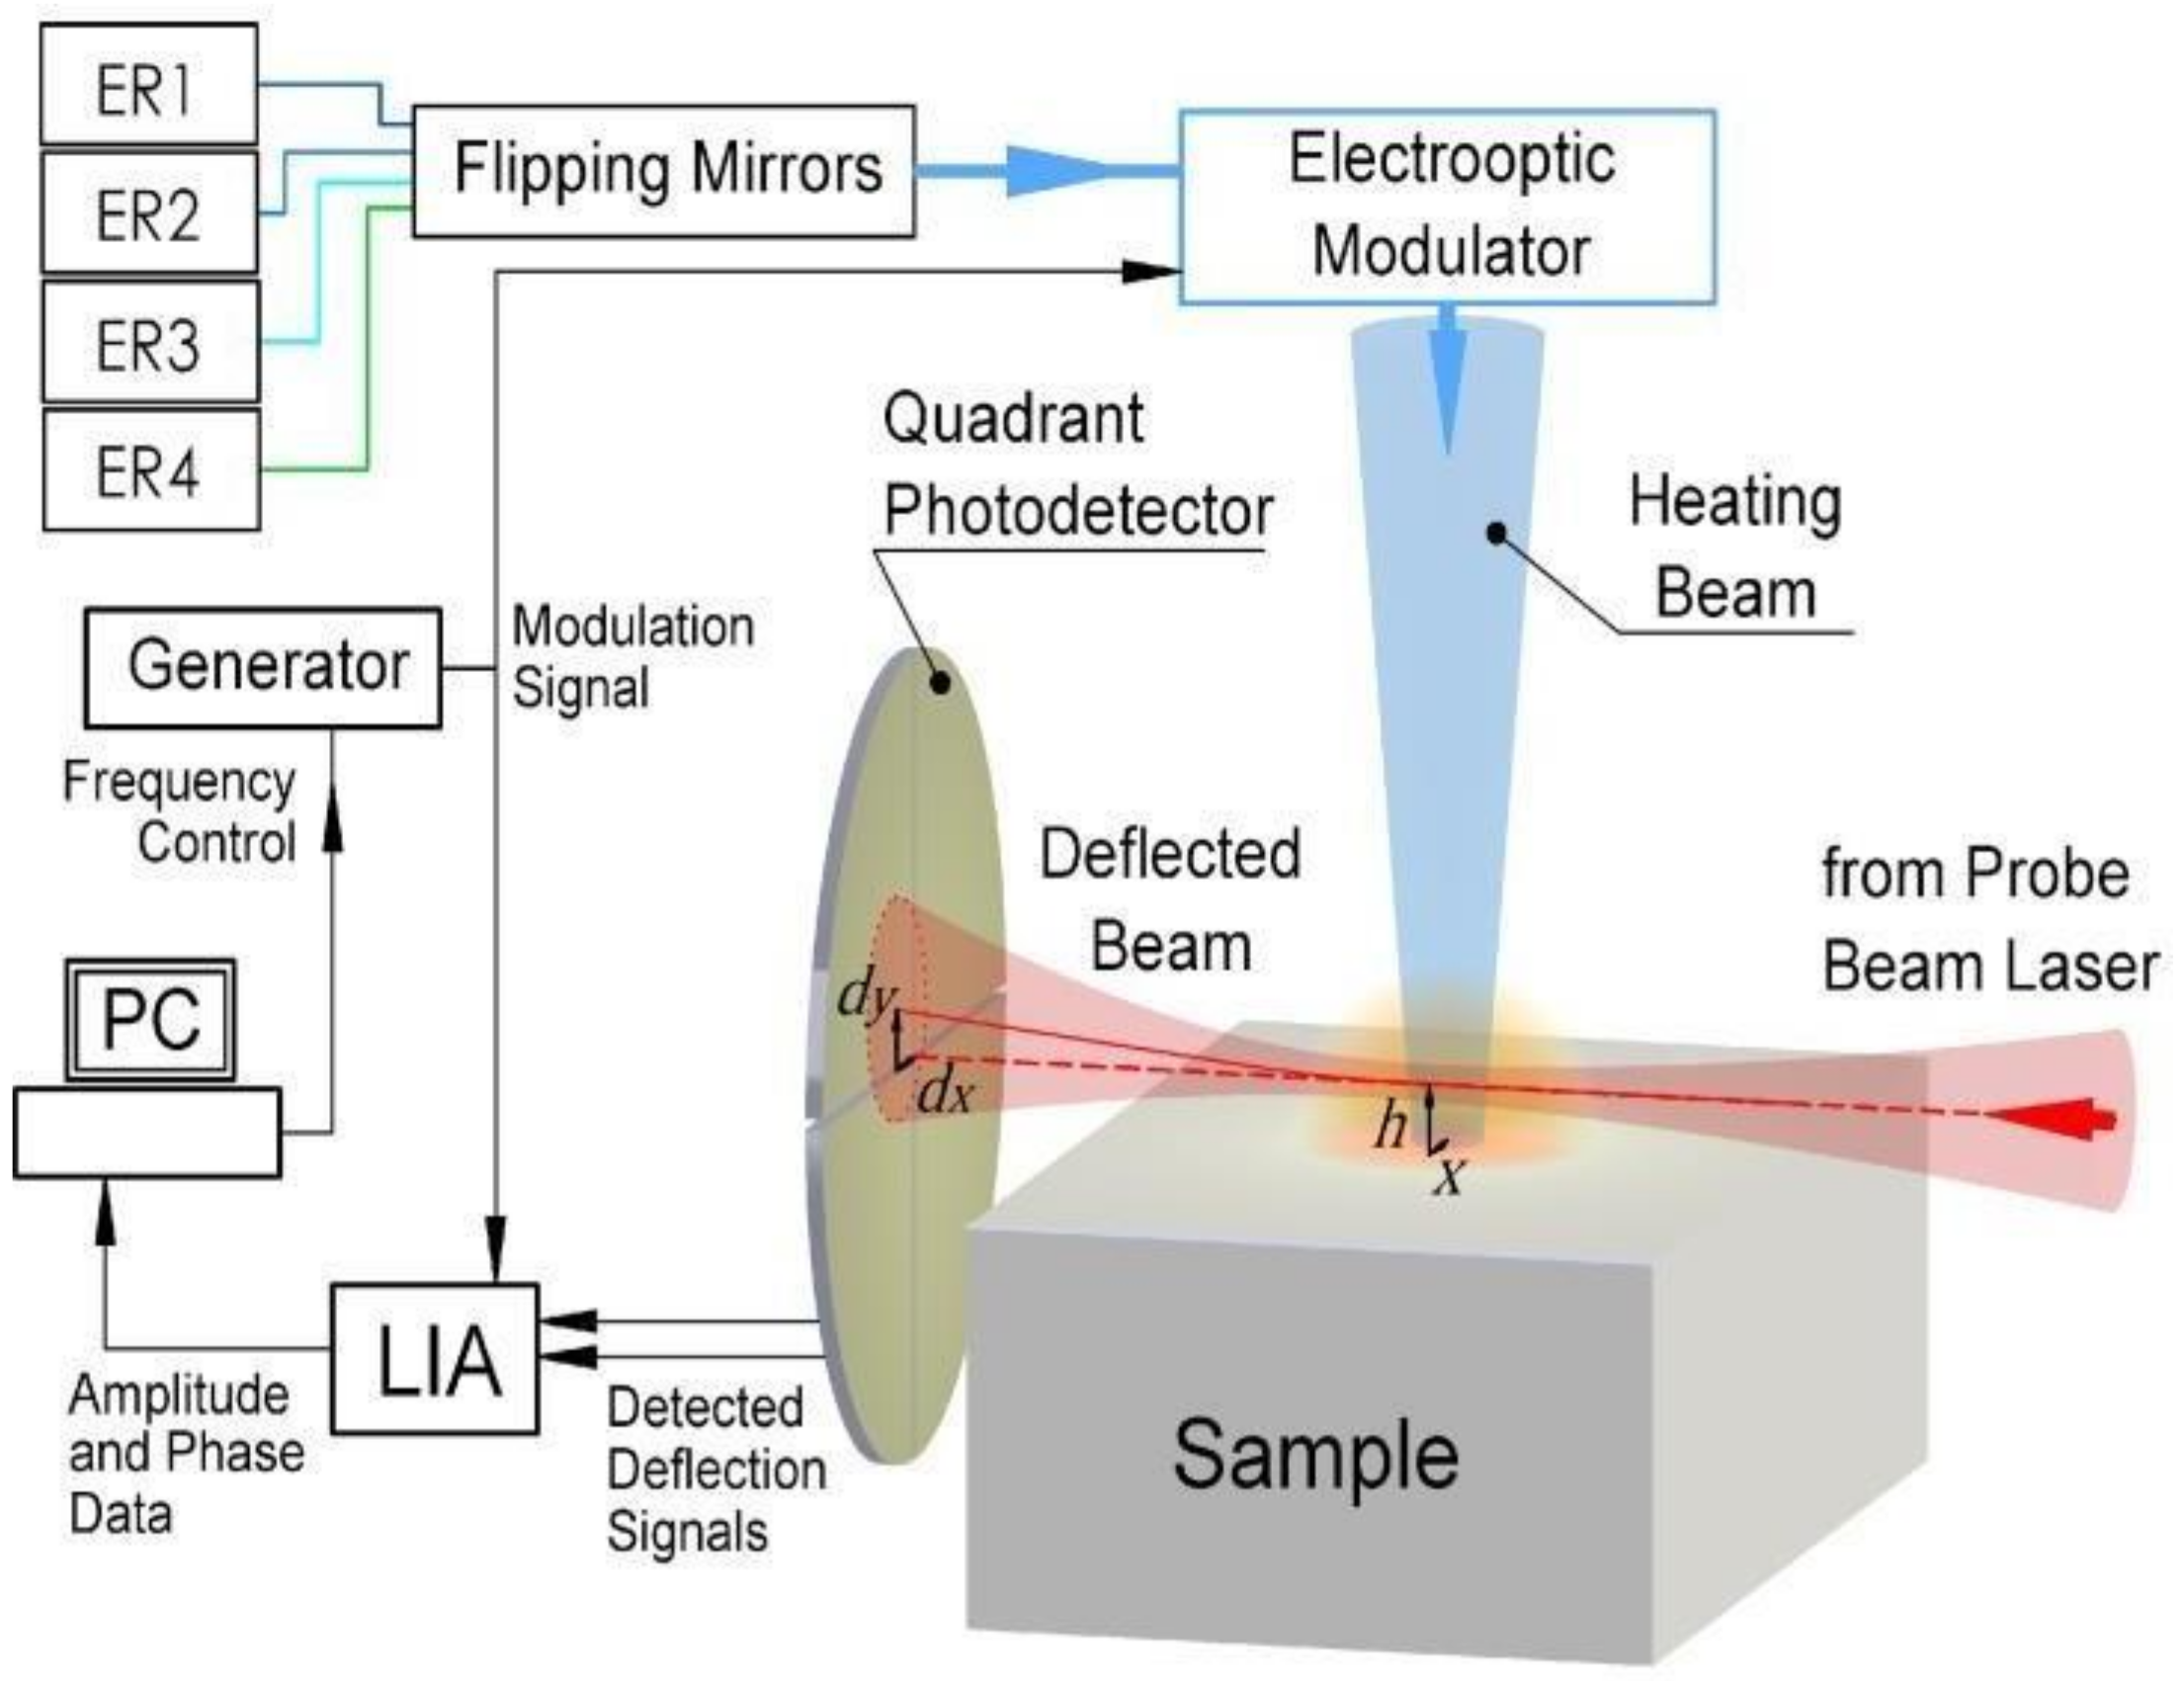
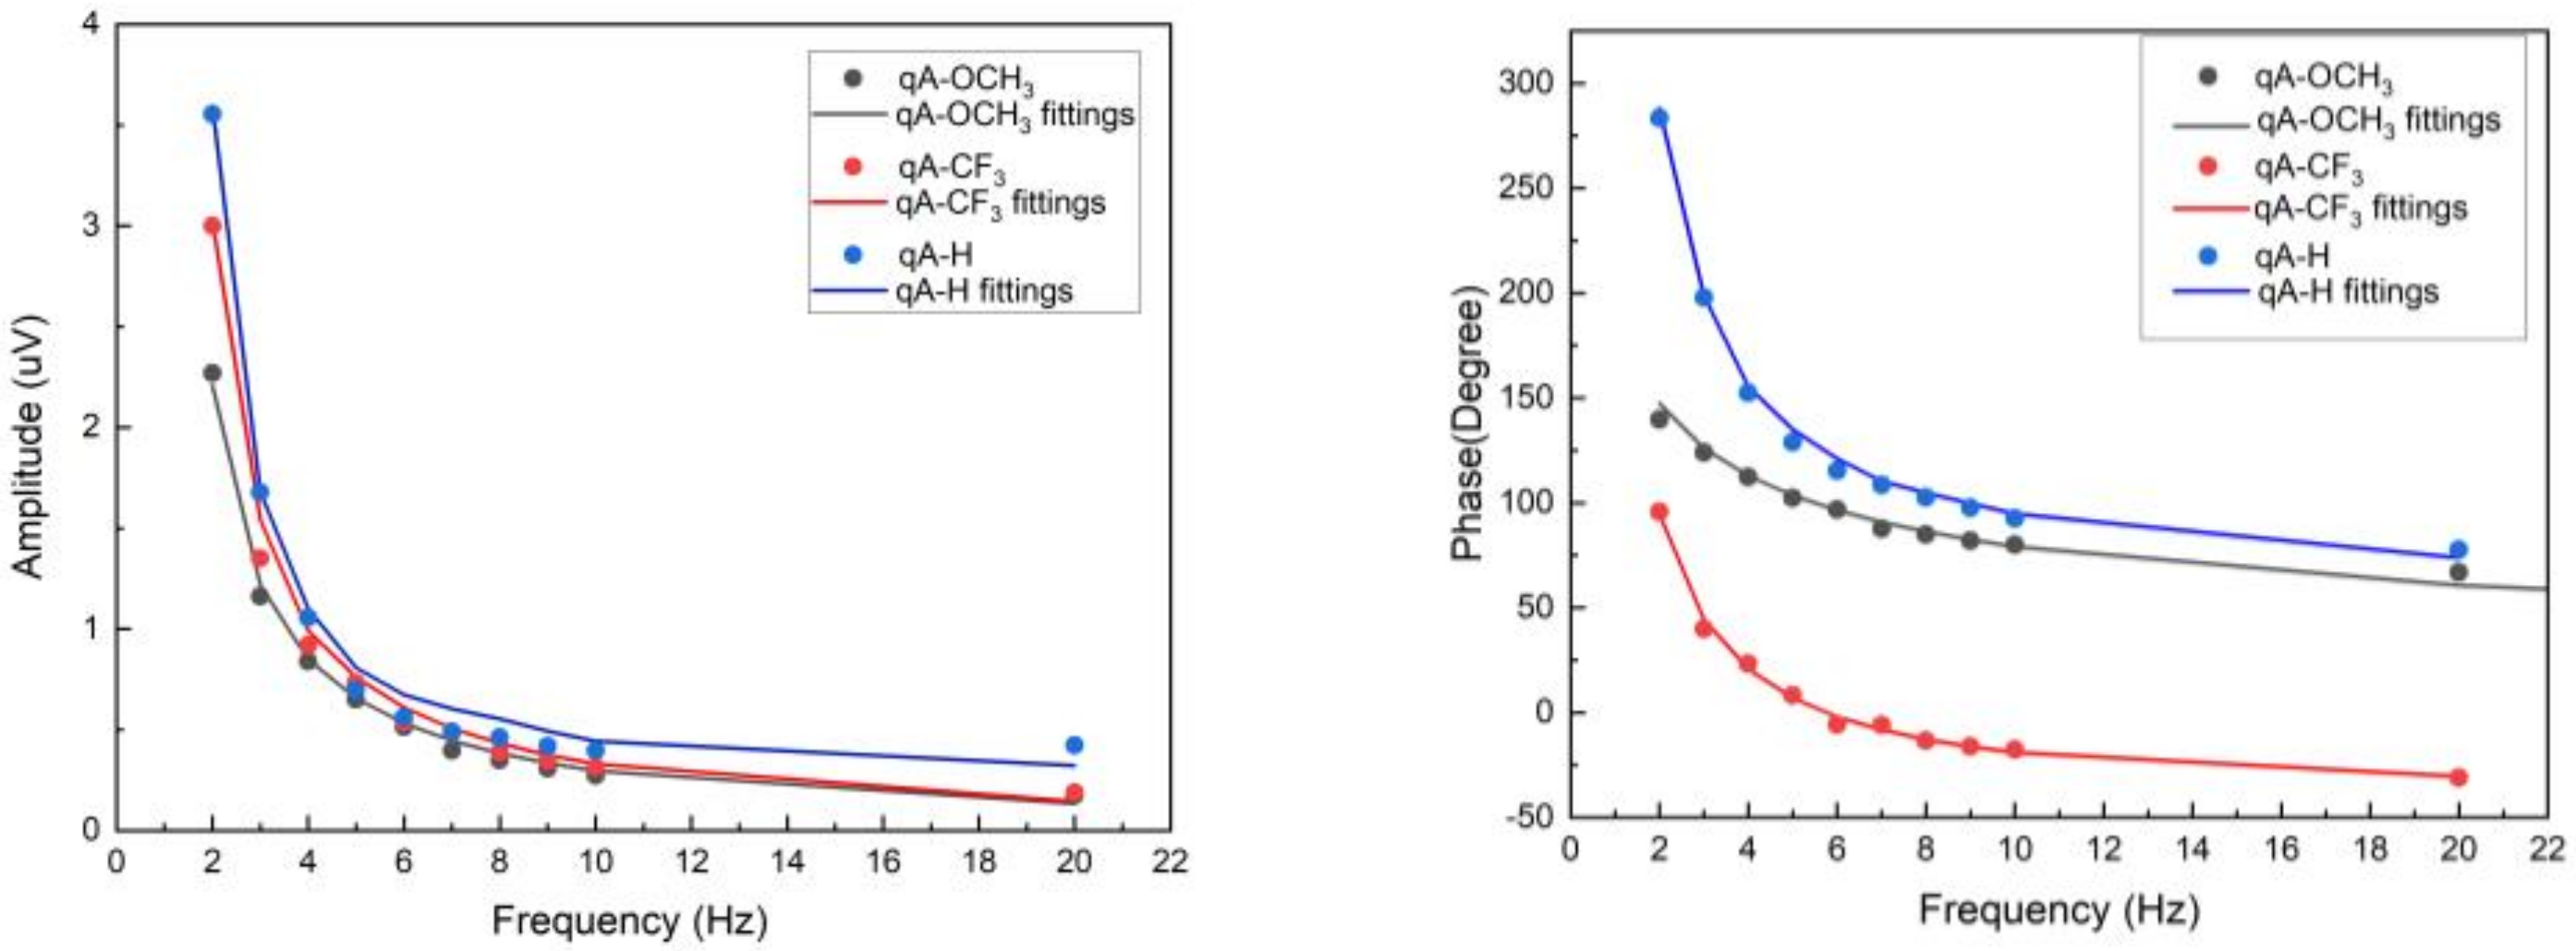
2.2. Photothermal Beam-Deflection Spectroscopy
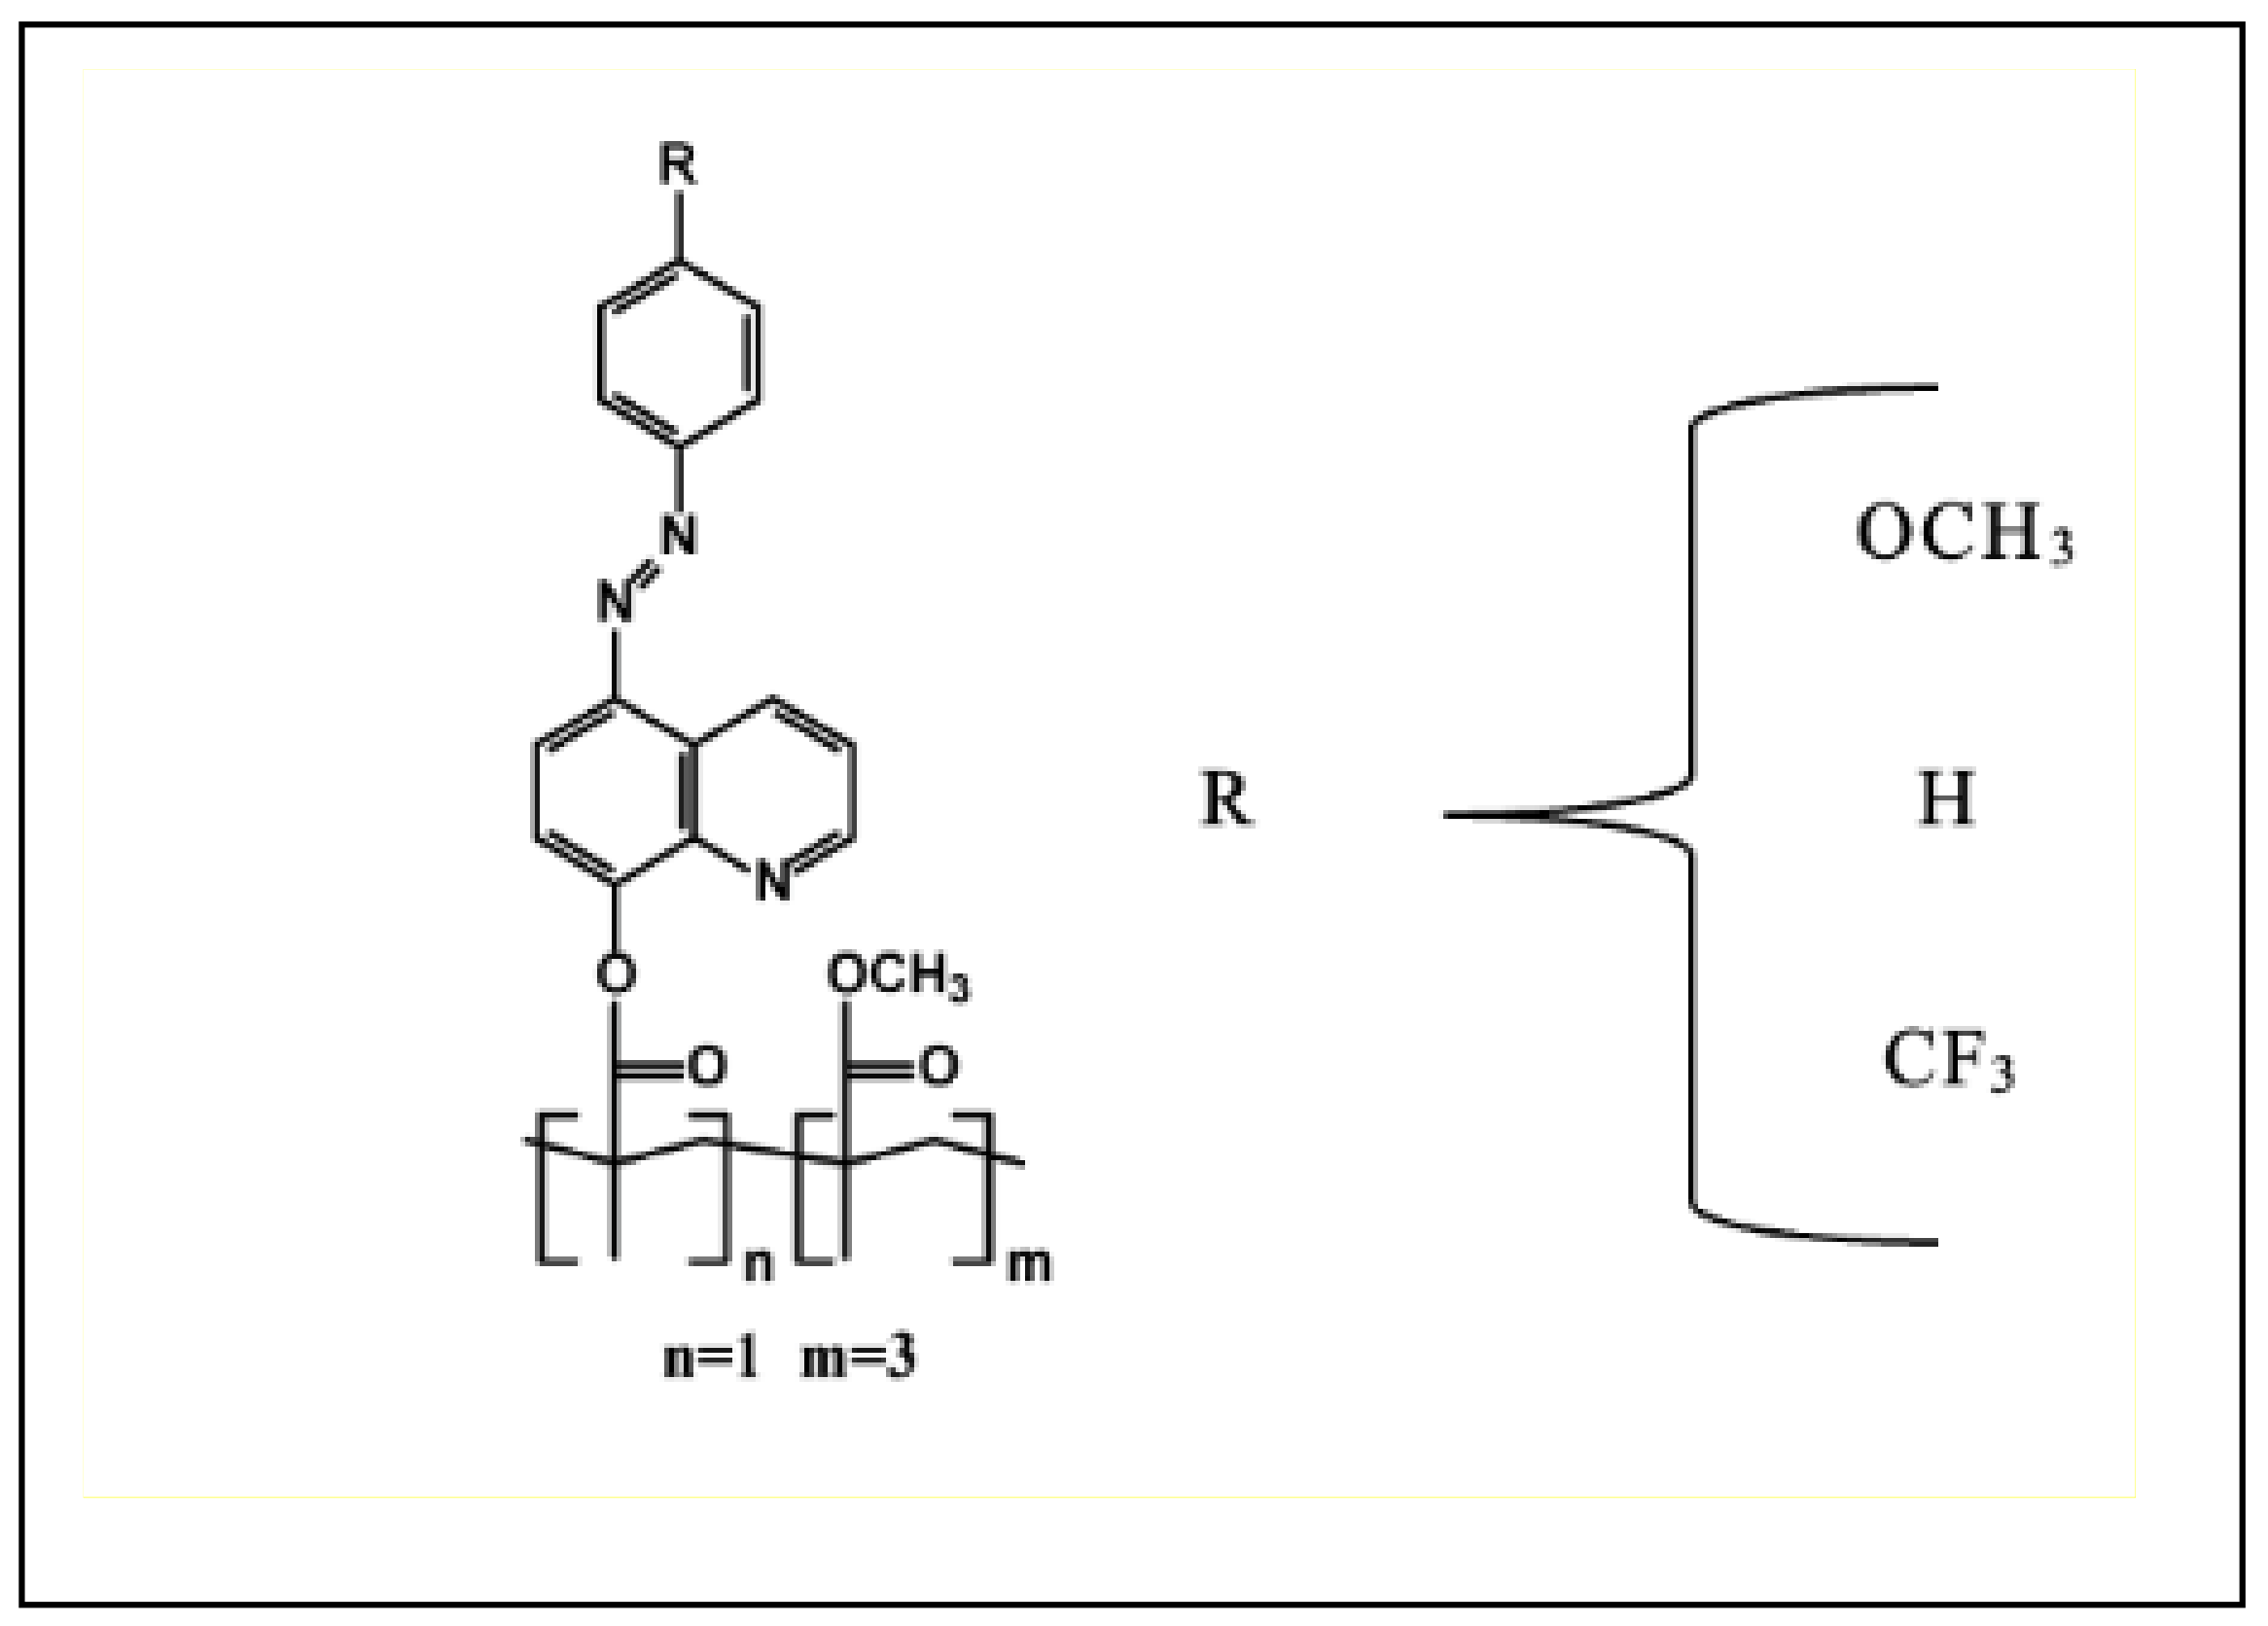
2.3. Azoheteroarene Functionalized Polymer Thin Films
3. Signal Modeling
3.1. Thermal Lens Theory
3.2. Photodeflection Signal
4. Experimental Results and Discussion
5. Conclusions
Author Contributions
Funding
Institutional Review Board Statement
Informed Consent Statement
Data Availability Statement
Conflicts of Interest
References
- Bialkowski, S.E.; Astrath, N.G.C.; Proskurnin, M.A. Photothermal Spectroscopy Methods; John Wiley & Sons: Hoboken, NJ, USA, 2019; pp. 1–512. [Google Scholar]
- Proskurnin, M.A.; Khabibullin, V.R.; Usoltseva, L.O.; Vyrko, E.A.; Mikheev, I.V.; Volkov, D.S. Photothermal and Optoacoustic Spectroscopy: State of the art and prospects. Physics-Uspekhi 2022, 3, 270–312. [Google Scholar] [CrossRef]
- Proskumin, M.A. Laser Spectroscopy for Sensing Fundamentals, Techniques, and Applications. Master’s Thesis, Lomosow State University, Moscow, Russia, 2014. [Google Scholar]
- Fomina, P.S.; Proskurnin, M.A. Photothermal Radiometry Methods in Materials Science and Applied Chemical Research. J. Appl. Phys. 2022, 132, 040701. [Google Scholar] [CrossRef]
- Bertolotti, M.; Voti, R.L. A note on the History of Photoacoustic, Thermal Lensing and Photothermal Deflection Techniques. J. Appl. Phys. 2020, 128, 230901. [Google Scholar] [CrossRef]
- Corona, J.; Kandadai, N. Recent progress in Modulated Photothermal Radiometry. Sensors 2023, 10, 4935. [Google Scholar] [CrossRef]
- Yuan, C.; Hanus, R.; Graham, S. A Review of Thermoreflactance Techniques for Characterizing Wide Bandgap Semiconductor’s Thermal Properties and Temperatures. J. Appl. Phys. 2022, 22, 220701. [Google Scholar] [CrossRef]
- Gordon, J.P.; Leite, R.C.C.; Moore, R.S.; Porto, S.P.S.; Whinnery, J.R. Long Transient Effects in Lasers with Inserted Liquid Samples. J. Appl. Phys. 1965, 1, 3–8. [Google Scholar] [CrossRef]
- Marcano, A.; Cabrera, H.; Guerra, M.; Cruz, R.A.; Jacinto, C.; Catunda, T. Optimizing and calibrating a mode-mismatched thermal lens experiment for low absorption measurement. J. Opt. Soc. Am. B 2006, 23, 1408–1413. [Google Scholar] [CrossRef]
- Escola, F.Z.; Mingolo, N.; Martinez, O.E.; Rocca, J.J.; Menoni, C.S. Characterization of Absorptance Homogeneity in Thin-film Coating for High-power Lasers by Thermal lensing Microscopy. Appl. Opt. 2019, 26, 7233–7240. [Google Scholar] [CrossRef]
- Korte, D.; Cabrera, H.; Toro, J.; Grima, P.; Leal, C.; Villabona, A.; Franko, M. Optimized frequency dependent photothermal beam deflection spectroscopy. Laser Phys. Lett. 2016, 13, 125701. [Google Scholar] [CrossRef][Green Version]
- Korte, D.; Kaukler, D.; Fanetti, M.; Cabrera, H.; Daubront, E.; Franko, M. Determination of petrophysical properties of sedimentary rocks by optical methods. Sediment. Geol. 2017, 350, 72–79. [Google Scholar] [CrossRef]
- Maria, I.; Bomono, F.; Wunderlich, D.; Fantz, U.; Nocentini, R. Reconstruction of the large multi-aperture beam via IR calorimetry technique and beam emission spectroscopy at the ELISE test facility. Nucl. Fusion 2020, 60, 066025. [Google Scholar] [CrossRef]
- Jeon, P.; Kim, J.; Kim, H.; Yoo, J. Thermal conductivity measurement of anisotropic material using photothermal deflection method. Thermochim. Acta 2008, 477, 32–37. [Google Scholar] [CrossRef]
- Moorhead, M.S.; Avedisian, C.T. Heat Transfer in Multilayered Thin Film Materilas Applied to Photothermal Deflection Spectroscopy. J. Thermophys. Heat Transf. 2022, 36, 1. [Google Scholar] [CrossRef]
- Jeon, P.; Lee, E.; Lee, K.; Yoo, J. A theoretical study for the thermal diffusivity measurement using photothermal deflection scheme. Energy Eng. J. 2001, 10, 63–70. [Google Scholar]
- Natansohn, A.; Rochon, P. Photoinduced Motions in Azo-Containing Polymers. Chem. Rev. 2002, 102, 4139–4417. [Google Scholar] [CrossRef] [PubMed]
- Derkowska-Zielinska, B.; Fedus, K.; Wang, H.; Cassagne, C.; Boudebs, G. Nonlinear optical characterization of Disperse Orange 3. Opt. Mater. 2017, 72, 545–548. [Google Scholar] [CrossRef]
- Bandara, D.; Burdette, S.C. Photoisomerization in different classes of azobenzene. Chem. Soc. Rev. 2012, 41, 1809–1825. [Google Scholar] [CrossRef] [PubMed]
- Louie Frobel, P.G.; Suresha, S.R.; Mayadevi, S.; Sreeja, S.; Mukherjee, C.; Muneera, C.I. Intense low threshold nonlinear absorption and nonlinear refraction in a new organic–polymer nanocomposite. Mater. Chem. Phys. 2011, 129, 981–989. [Google Scholar] [CrossRef]
- Chomicki, D.; Kharchenko, O.; Skowronski, L.; Kowalonek, J.; Kozanecka-Szmigiel, A.; Szmigiel, D.; Smokal, V.; Krupka, O.; Derkowska-Zielinska, B. Physico-Chemical and Light-Induced Properties of Quinoline Azo-dyes Polymers. Int. J. Mol. Sci. 2020, 16, 5755. [Google Scholar] [CrossRef]
- Derkowska-Zielinska, B.; Krupka, O.; Smokal, V.; Grabowski, A.; Naparty, M.; Skowronski, L. Optical Properties of Disperse Dyes Doped Poly (methyl Methacrylate). Mol. Cryst. Liq. 2016, 1, 87–93. [Google Scholar] [CrossRef]
- Korte, D.; Franko, M. Application of complex geometrical optics to determination. J. Opt. Soc. Am. 2015, 32, 61–74. [Google Scholar] [CrossRef]


| Type of Substituent | Electron-Donating | Neutral | Electron-Withdrawing |
|---|---|---|---|
| Substituent | qA-OCH3 | qA-H | qA-CF3 |
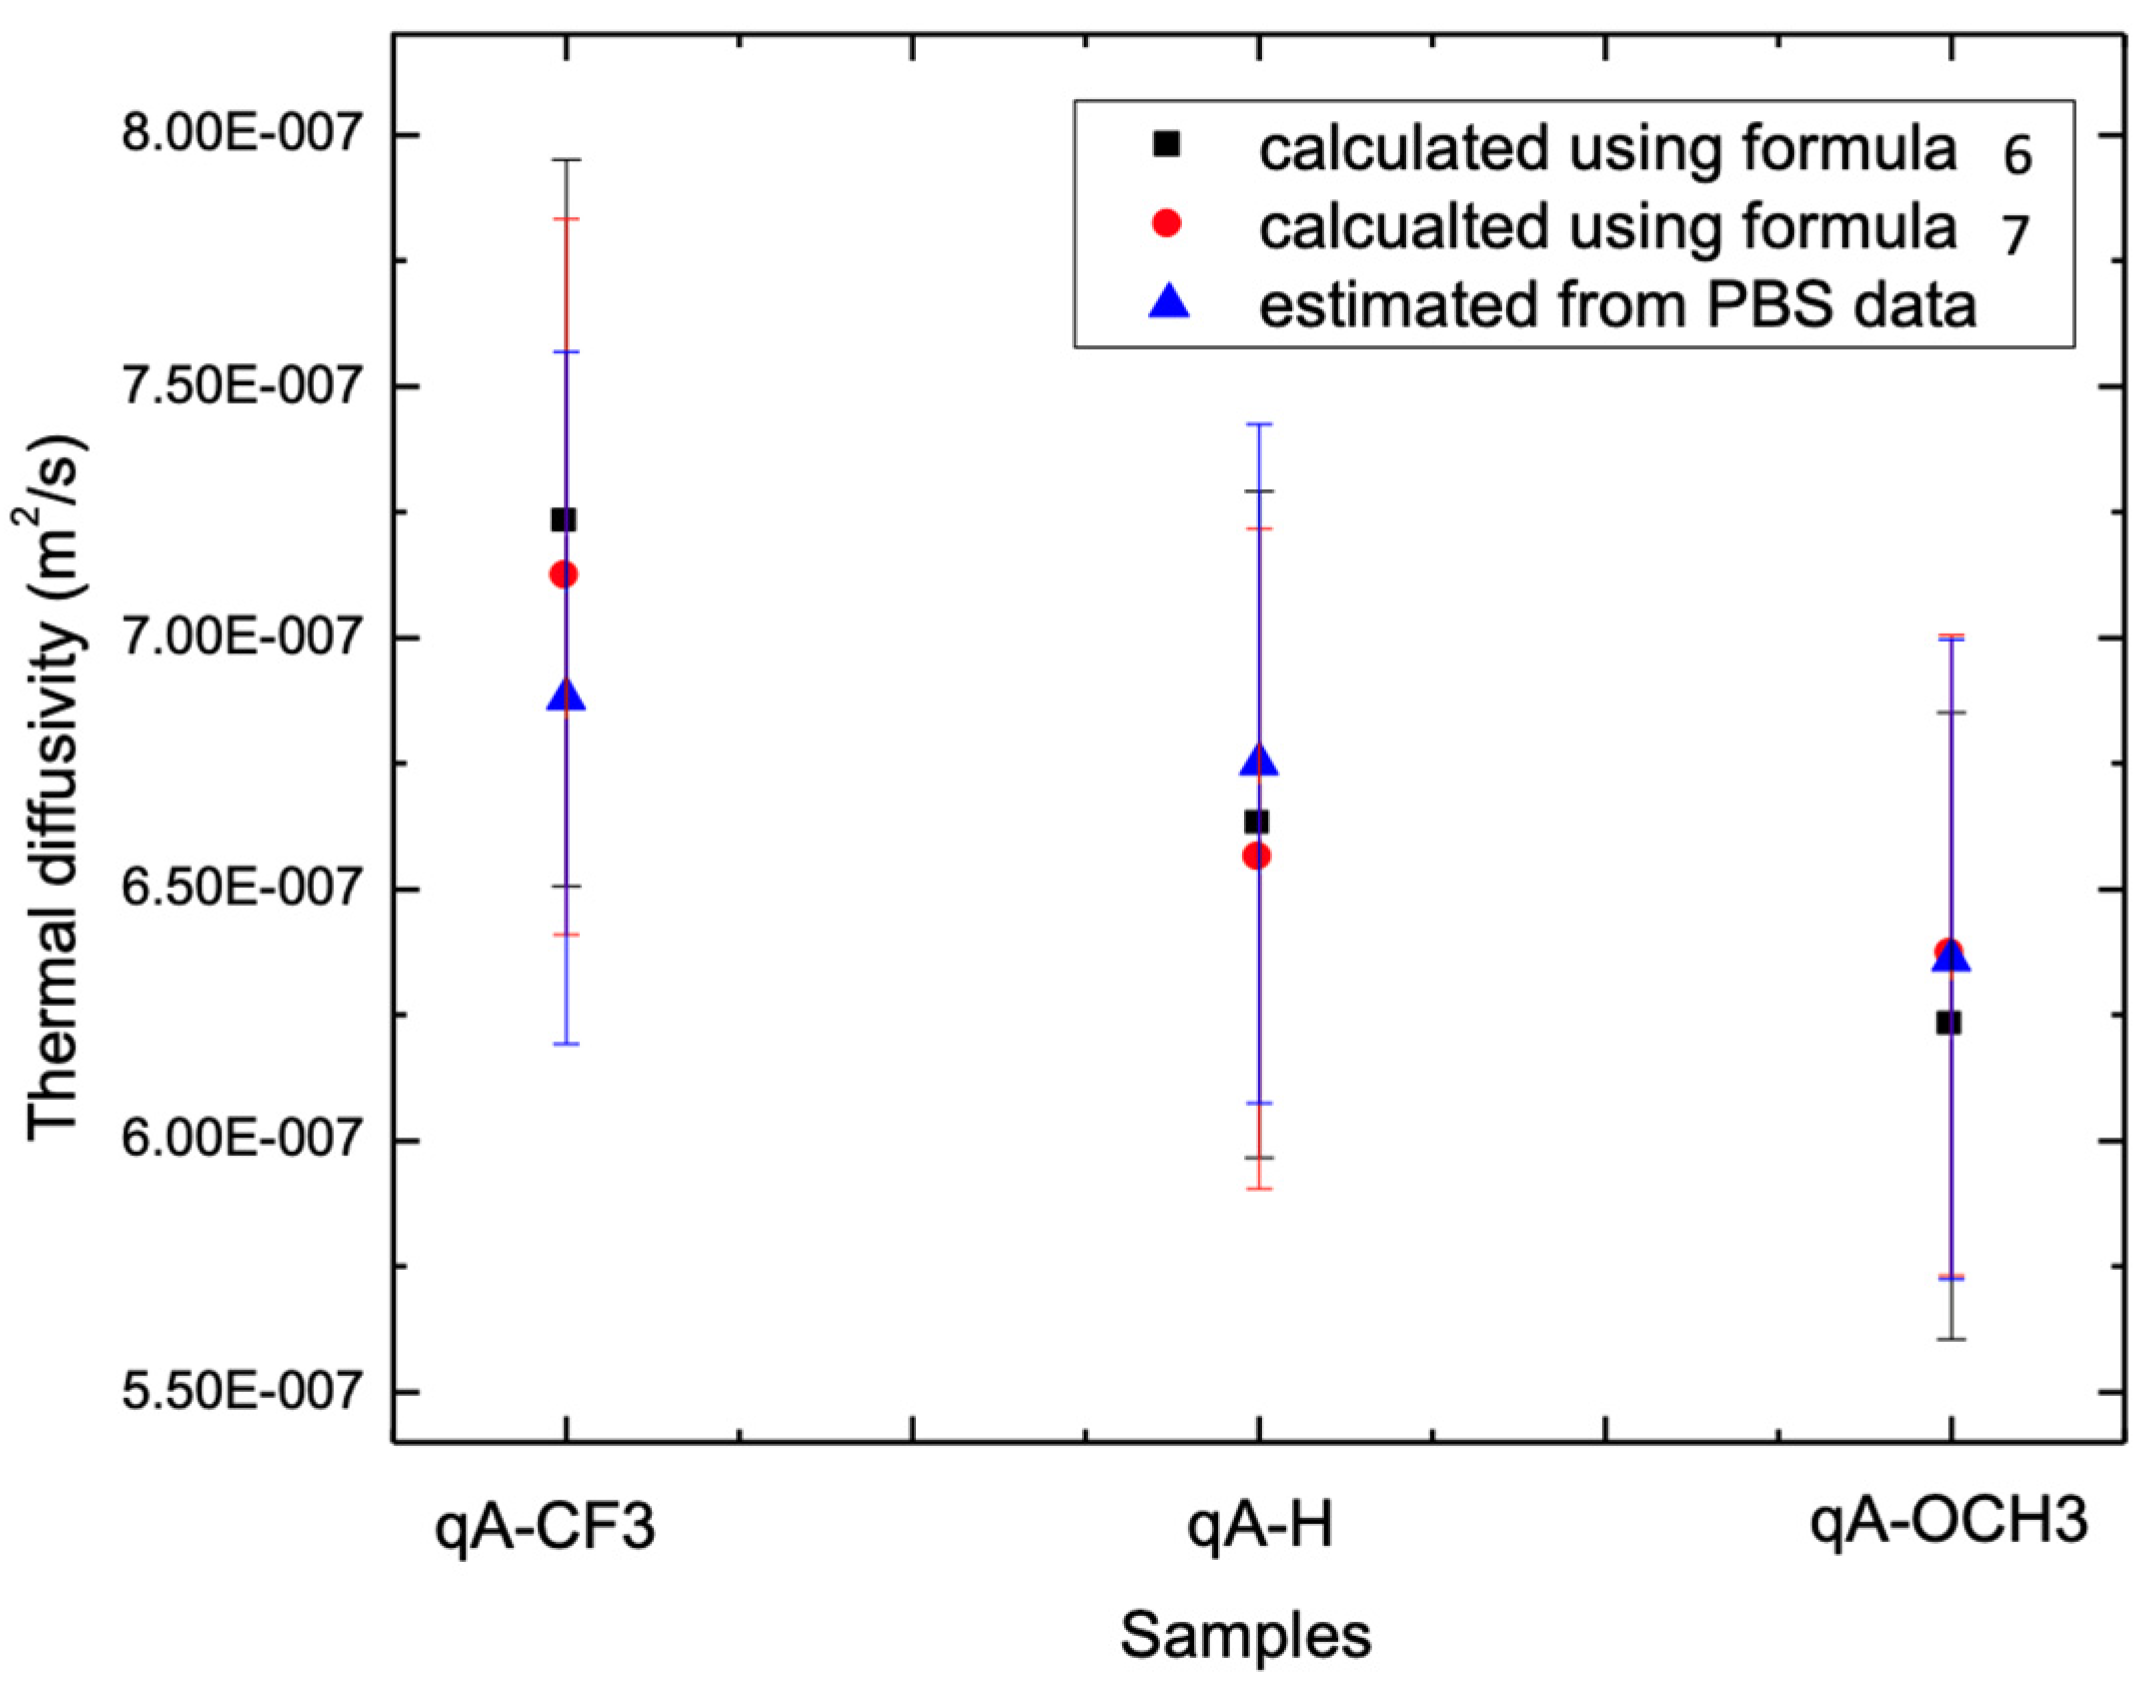
| Sample | Determined Using PBDS | Determined Using TLS | ||||
|---|---|---|---|---|---|---|
| (W/mK) | (m2/s) × 10−6 | Optical Absorption Coefficient (1/cm) × 103 | (m2/s) × 10−6 | (m2/s) × 10−6 Using Formula (6) | Using Formula (7) | |
| qA-CF3 | 1.06 ± 0.09 | 0.69 ± 0.07 | 40 ± 10 | 0.86 ± 0.08 | 0.72 ± 0.07 | 0.71 ± 0.07 |
| qA-H | 1.04 ± 0.09 | 0.68 ± 0.07 | 58 ± 20 | 0.83 ± 0.08 | 0.66 ± 0.07 | 0.67 ± 0.07 |
| qA-OCH3 | 0.97 ± 0.09 | 0.64 ± 0.06 | 56 ± 20 | 0.81 ± 0.08 | 0.62 ± 0.06 | 0.64 ± 0.06 |
Disclaimer/Publisher’s Note: The statements, opinions and data contained in all publications are solely those of the individual author(s) and contributor(s) and not of MDPI and/or the editor(s). MDPI and/or the editor(s) disclaim responsibility for any injury to people or property resulting from any ideas, methods, instructions or products referred to in the content. |
© 2023 by the authors. Licensee MDPI, Basel, Switzerland. This article is an open access article distributed under the terms and conditions of the Creative Commons Attribution (CC BY) license (https://creativecommons.org/licenses/by/4.0/).
Share and Cite
Mikaeeli, A.; Korte, D.; Cabrera, H.; Chomicki, D.; Dziczek, D.; Kharchenko, O.; Song, P.; Liu, J.; Wieck, A.D.; Pawlak, M. Measuring Thermal Diffusivity of Azoheteroarene Thin Layers by Photothermal Beam Deflection and Photothermal Lens Methods. Materials 2023, 16, 6312. https://doi.org/10.3390/ma16186312
Mikaeeli A, Korte D, Cabrera H, Chomicki D, Dziczek D, Kharchenko O, Song P, Liu J, Wieck AD, Pawlak M. Measuring Thermal Diffusivity of Azoheteroarene Thin Layers by Photothermal Beam Deflection and Photothermal Lens Methods. Materials. 2023; 16(18):6312. https://doi.org/10.3390/ma16186312
Chicago/Turabian StyleMikaeeli, Ameneh, Dorota Korte, Humberto Cabrera, Dariusz Chomicki, Dariusz Dziczek, Oksana Kharchenko, Peng Song, Junyan Liu, Andreas D. Wieck, and Michal Pawlak. 2023. "Measuring Thermal Diffusivity of Azoheteroarene Thin Layers by Photothermal Beam Deflection and Photothermal Lens Methods" Materials 16, no. 18: 6312. https://doi.org/10.3390/ma16186312
APA StyleMikaeeli, A., Korte, D., Cabrera, H., Chomicki, D., Dziczek, D., Kharchenko, O., Song, P., Liu, J., Wieck, A. D., & Pawlak, M. (2023). Measuring Thermal Diffusivity of Azoheteroarene Thin Layers by Photothermal Beam Deflection and Photothermal Lens Methods. Materials, 16(18), 6312. https://doi.org/10.3390/ma16186312