Article

In Silico Guided Design of Metal/Semiconductor Photocatalysts: A Case of Cu-Modified TiO2 for Ciprofloxacin Degradation

by
Marija Kovačević
1,
Sanja Živković
1,
Miloš Ognjanović
1,
Miloš Momčilović
1,
Dubravka Relić
2 and
Dragana Vasić Anićijević
1,*
1
Vinča Institute of Nuclear Sciences—National Institute of the Republic of Serbia, University of Belgrade, Mike Petrovića Alasa 12-14, 11351 Belgrade, Serbia
2
Faculty of Chemistry, University of Belgrade, Studentski Trg 12-14, 11158 Belgrade, Serbia
*
Author to whom correspondence should be addressed.
Materials 2023, 16(16), 5708; https://doi.org/10.3390/ma16165708
Submission received: 18 July 2023 / Revised: 16 August 2023 / Accepted: 17 August 2023 / Published: 21 August 2023
(This article belongs to the Section Catalytic Materials)

Abstract

:
(1) Background: An increasing use of pharmaceutics imposes a need for the permanent development of efficient strategies, including the tailoring of highly specific new materials for their removal from the environment. Photocatalytic degradation has been the subject of increasing interest of the researchers in the field. (2) Methods: This paper is focused on the investigation of the possibility to deposit a thin metal layer on a TiO2 surface and study its photocatalytic performance for the degradation of ciprofloxacin using a combination of theoretical and experimental methods. (3) Results: Based on the extensive DFT screening of 24 d-metals’ adhesion on TiO2, Cu was selected for further work, due to the satisfactory expected stability and good availability. The (Cu)TiO2 was successfully synthesized and characterized with XRD, SEM+EDS and UV-Vis spectrophotometry. The uniformly distributed copper on the TiO2 surface corresponds to the binding on high-affinity oxygen-rich sites, as proposed with DFT calculations. The photocatalytic degradation rate of ciprofloxacin was improved by about a factor of 1.5 compared to the bare non-modified TiO2. (4) Conclusions: The observed result was ascribed to the ability of adsorbed Cu to impede the agglomeration of TiO2 and increase the active catalytic area, and bandgap narrowing predicted with DFT calculations.

1. Introduction

An increasing use of antibiotic drugs worldwide is inevitably linked with raising pollution concerns [1,2]. Estimated average environmental water drug concentrations are between nanograms and micrograms per liter [3]. Due to the limited biodegradability of antibiotics and thus the limited ability of sewage treatment plants to remove them, they are ubiquitous and persistent according to their physico-chemical properties, thus leading to the hidden consequences of the chronic exposure and development of resistant microorganisms [4,5]. Efforts in resolving these issues impose a permanent need for developing novel techniques, and improving existent techniques, for their efficient and sustainable removal from the environment.
Photocatalytic degradation belongs to the group of advanced oxidation process methods (AOPs), and is widely investigated as a universal, efficient and environmentally friendly method for the elimination of various organic pollutants, including organic compounds (drugs, dyes and pesticides) and microorganisms (bacteria), from aqueous media [6]. The efficient photo-induced generation of hydroxyl radicals (·OH), as the principal oxidizing species [7], is of crucial interest for the performance of photocatalytic systems, in order to maximize the mineralization extent of organic compounds, minimize the generation of secondary byproducts and assure zero secondary waste [8,9].
Most commonly investigated photocatalytic materials include metal oxide semiconductors such as TiO2, ZnO, SiO2, Fe2O3, CdS and ZnS, due to their satisfactory stability, corrosion resistivity, availability and non-toxicity [10].
On the other hand, their photocatalytic performance is limited due to their tendance to agglomerate according to the high surface energy, large band gap (requires UV range light) and short recombination time of photogenerated electron–hole pairs [8,11].
Several strategies based on semiconductor modification by metals and metal oxides (doping, metal loading, core/shell systems and semiconductor combinations—introduction of heterojunctions) have been developed in order to overcome these issues [9,12,13]. Most of the studies in the field agree that a sophisticated design and highly precise control of material modification are crucial to achieve improved photocatalytic performances, as otherwise the heterostructural features can easily transform to recombination centers and further reduce charge carriers’ lifetime, induce catalyst surface clogging and reduce overall efficiency [14,15,16,17].
Single metal–atom and thin metal layer surface catalysts have been the subject of permanent but emerging interest of researchers, due to the possibility to obtain significantly different properties compared to bulk materials, and are made with a minimal consumption of expensive resources [18]. In order to efficiently tune their photocatalytic performances, it is necessary to enable the insight into their fundamental properties on the atomic level [19].
DFT calculations represent an efficient tool not only for the prediction of behavior of metal/semiconductor interfaces but also for the explanation of their structural and electronic properties up to the level of a single atom [20,21,22,23,24]. The ongoing development of catalytic descriptors [25] and calculation procedures to overcome present methodological drawbacks [26] widens the possibility to employ in silico experiments in the design of catalyst materials. However, despite extensive research, to our knowledge, there is still a lack of systematic studies that investigate metal thin layer formation and behavior on semiconductor surfaces.
In this study, a novel strategy for the preparation of thin layer metal/semiconductor photocatalysts based on DFT-guided design is presented and applied on TiO2 (rutile). An extensive DFT screening of d-metals’ binding on the TiO2 surface was performed in order to provide a systematic insight into the adhesion properties and predict the thin layer quality of the investigated metals. The aim was to identify a suitable metal to prepare a thin layer metal/TiO2 model system with an easily controllable structure, to be further studied experimentally and theoretically. Based on the screening results, the Cu coating was selected for TiO2 modification as effectively adsorbed, available and easy-to-prepare with the NaBH4 reduction method. The photocatalytic effectiveness of the prepared nanoparticles was evaluated towards the removal of the antibiotic drug ciprofloxacin (Figure 1 and Figure S1) in an aqueous suspension under UV irradiation. The improvement of the degradation rate with (Cu)TiO2 compared to bare TiO2 by a factor of 1.5 was noticed. The obtained improvement was discussed from the point of view of DFT insights and experimental findings, shedding new light on the photocatalytic properties of catalyst materials modified by thin layer metal deposition.

2. Materials and Methods

2.1. DFT Calculations

For DFT calculations, a pwscf code of the Quantum ESPRESSO package (version 6.6) was used [27]. Ultrasoft pseudopotentials based on GGA-PBE approximation [28] with a plane wave kinetic energy cutoff of 50 eV were implemented, while the charge density cutoff was 500 eV. Optimized rutile bulk parameters were a = 4.639 Å and c = 2.968 Å. In the DFT screening of the adhesion of different d-metals, the TiO2 surface was modelled as a (001) slab in a 4- 1 × 1 (12-atom) cell. In the DFT modelling of Cu adhesion on TiO2, the 36-atom cells of (001) and (110) surfaces were used. There was at least a 25 Å vacuum between slabs, to prevent artificial electrostatic interactions.
All calculations were spin polarized. Hubbard correction (GGA + U) was used in a simplified version of Cococcioni and de Gironcoli’s work [29]. An effective U value of 3 eV for the Ti-d states was taken from the literature [30]. The k-point grid was sampled through a Monkhorst—Pack scheme [31], using 4 × 4 × 1 k-points. Electronic and ionic force convergence criteria were 10−6 Ry and 10−4 Ry/Bohr, respectively. The structures are presented in XcrysDen [32]. The charge of atoms was analyzed using Bader code [33].
The adhesion of metals was investigated at high-symmetry sites. The adhesion energy on the TiO2(001) surface was calculated according to Equation (1):
E a d h = E s u r f + M E s u r f E M
where Esurf+M is the total energy of the surface with adhered metal, Esurf is the total energy of the bare TiO2(001) or TiO2(110) surface and EM is the total energy of the isolated metal atom.

2.2. Preparation of TiO2

TiO2 rutile nanopowder was prepared according to the procedure from [34]. Titanium (IV)–isopropoxide (Ti(OCH(CH3)2)4) (Sigma-Aldrich, St. Louis, MO, USA, 97%) was dissolved in isopropyl alcohol (Centrohem, Stara Pazova, Serbia, 99.5%) and stirred on a magnetic stirrer at room temperature. After a couple of minutes, TiO2 nanoparticles were precipitated with the addition of alkaline distilled water (pH 8). The reaction mixture was stirred at room temperature for 45 min. The molar ratio of alkoxide/alcohol/water was fixed at 5:3:1. The as-prepared precipitate was washed using deionized water, centrifuged, dried overnight in a drying oven at 100 °C, calcined at 700 °C for 5 h and left in the oven to cool down overnight.

2.3. Preparation of Cu/TiO2

Cu metal was deposited onto the TiO2 surface according to the method proposed in [35]. In total, 500 mg of prepared TiO2 nanoparticles was added to 50 mL of deionized water and dispersed using an ultrasonic bath at 90 °C for 30 min. Then, 5.8750 mg (0.4 molar % Cu compared to TiO2) of Cu(NO3)2·3H2O (Merck, Darmstadt, Germany, 99.5%) and 12.5 mg of solid NaOH (Lach-ner, Neratovice, Czech Republic, 99.6%) were added to the mixture and stirred for a couple of minutes. Next, 5 mL (50 mg/L) of a NaBH4 solution (BDH Chemicals Ltd., Poole, UK, 95%) was added drop-wise to the reaction mixture and stirred at room temperature for 1.5 h. Afterward, the suspension was washed using deionized water, centrifuged and, finally, dried overnight in the dryer at 100 °C.

2.4. Photodegradation of the Ciprofloxacin

The ciprofloxacin solution was prepared from a commercial ciprofloxacin–lactate solution for infusion (Marocen®, Hemofarm, Serbia), which contains 100 mg of the ciprofloxacin in 10 mL of the solution. First, the commercial solution was dissolved in deionized water in a volumetric flask of 250 mL and then 12.5 mL of this solution was dissolved in deionized water in another volumetric flask of 250 mL, with the final concentration of 4.75 × 10⁻⁴ M, 20 mg/L of ciprofloxacin.
The procedure of photodegradation was carried out in the same way for both photocatalysts. In total, 20 mg of finely powdered catalyst (TiO2 or (Cu)TiO2) nanoparticles was added into 50 mL of the ciprofloxacin solution (4.75 × 10⁻⁴ M, 20 mg/L of ciprofloxacin). The reaction mixture was stirred for 30 min in the dark, alongside a blank (solution of ciprofloxacin). Next, the blank and the mixture solutions were irradiated under UV light (Philips TUV 15W UVC Disinfection Lamps, Philips, Poland) for 4 h. Aliquots were taken after 0, 15, 30, 60, 120, 150, 180, 210 and 240 min for mixing and 30, 60, 120, 180 and 240 min for the blank in a 4 mL quartz cuvette. The photodegradation process was monitored with UV-Vis spectrometry (LLG Labware, Detroit, MI, USA), by recording the UV-Vis spectra in the wavelength range from 190 to 500 nm.

2.5. XRD Analysis

The crystal structure of TiO2-based powders was determined by analyzing X-ray powder diffraction (XRPD) data. The measurements were conducted on dried powders using a high-resolution SmartLab® diffractometer (Rigaku, Japan), equipped with a Cu Kα radiation source (λ = 1.5406 Å) under a voltage of 40 kV and a 30 mA current. The data collection for the patterns was performed in the 10–70° 2θ range. The X-ray diffraction scan was conducted at a scan rate of 1°/min. The step size used during the scan was 0.02°. The phase identification of the synthesized materials as well as the crystallite size, lattice strain and lattice parameter were calculated using the Halder–Wagner method incorporated in PDXL2-integrated X-ray powder diffraction software (Version 2.8.40; Rigaku Corporation, Tokyo, Japan).

2.6. SEM Analysis

Scanning electron microscopy (SEM) with energy dispersive X-ray spectroscopy (EDS) was performed with a PhenomProX electron microscope (Phenom, Thermo Fisher Scientific, Waltham, MA, USA).

2.7. TOC Analysis

Total organic carbon (TOC) was measured on a TOC-LCPH analyzer (Shimadzu Co., Kyoto, Japan). Mineralization efficiency was calculated from Equation (2):
M i n e r a l i z a t i o n   e f f i c i e n c y % = 1 T O C f i n a l T O C i n i t i a l × 100

3. Results

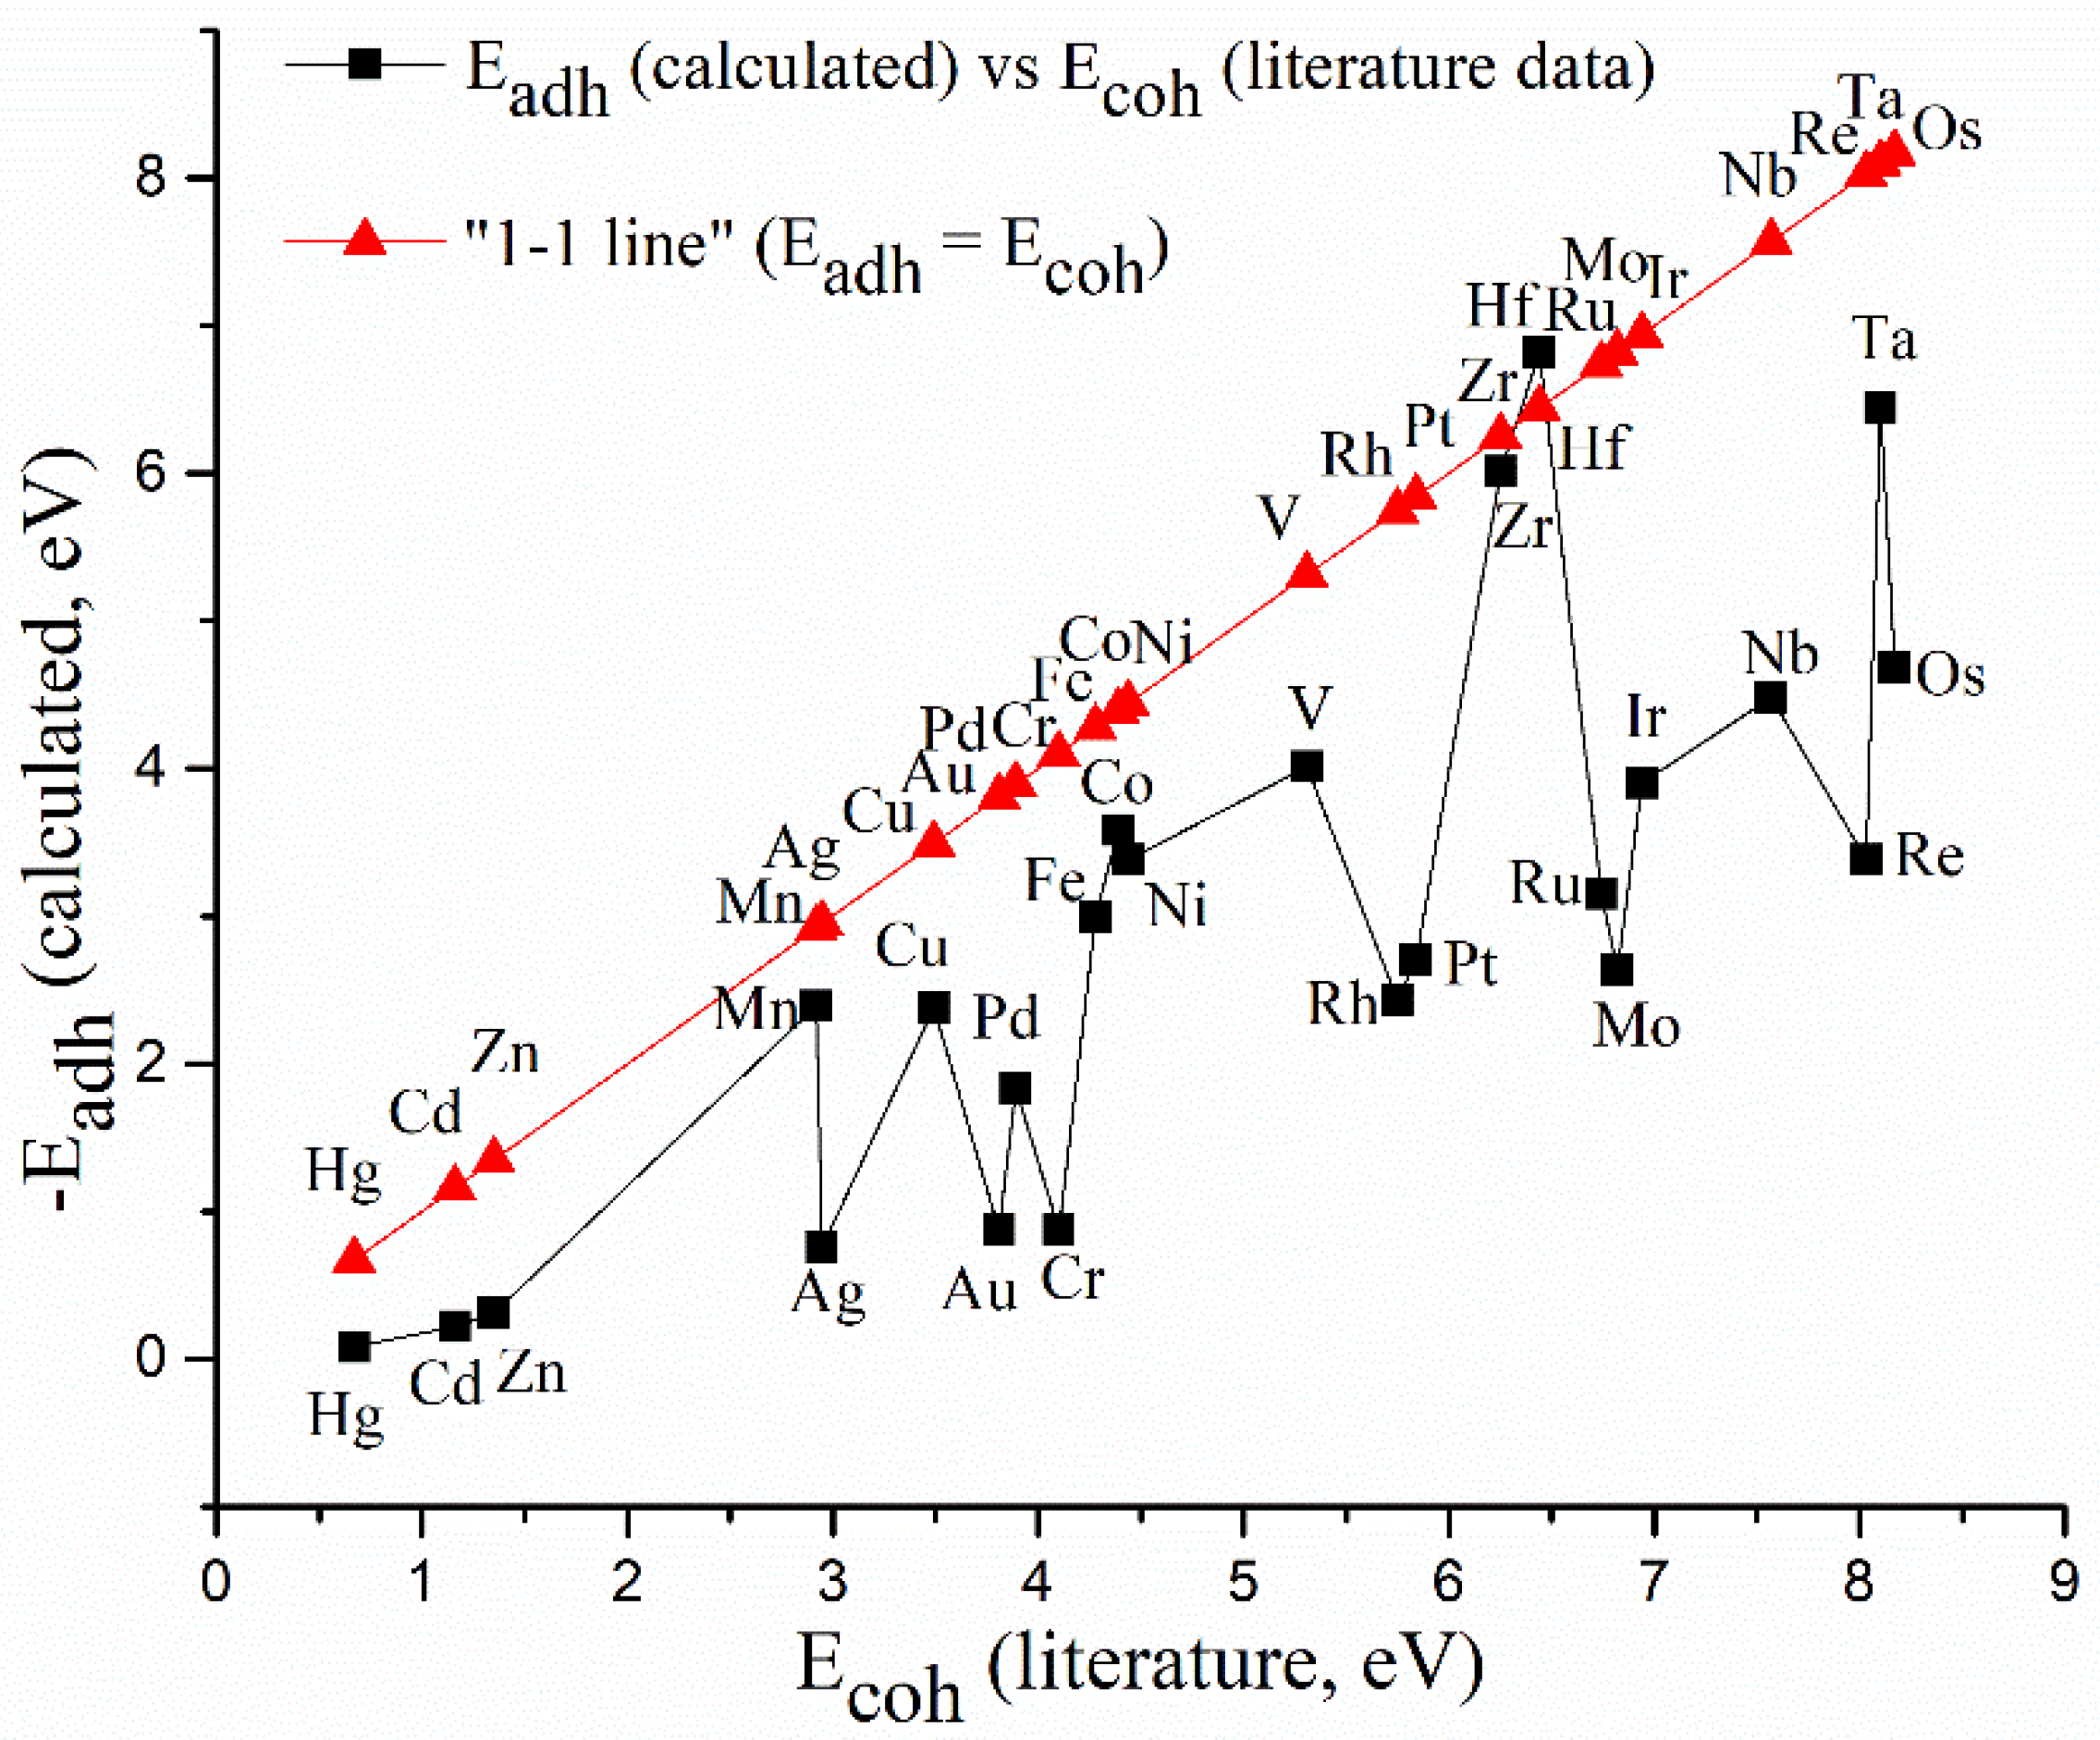
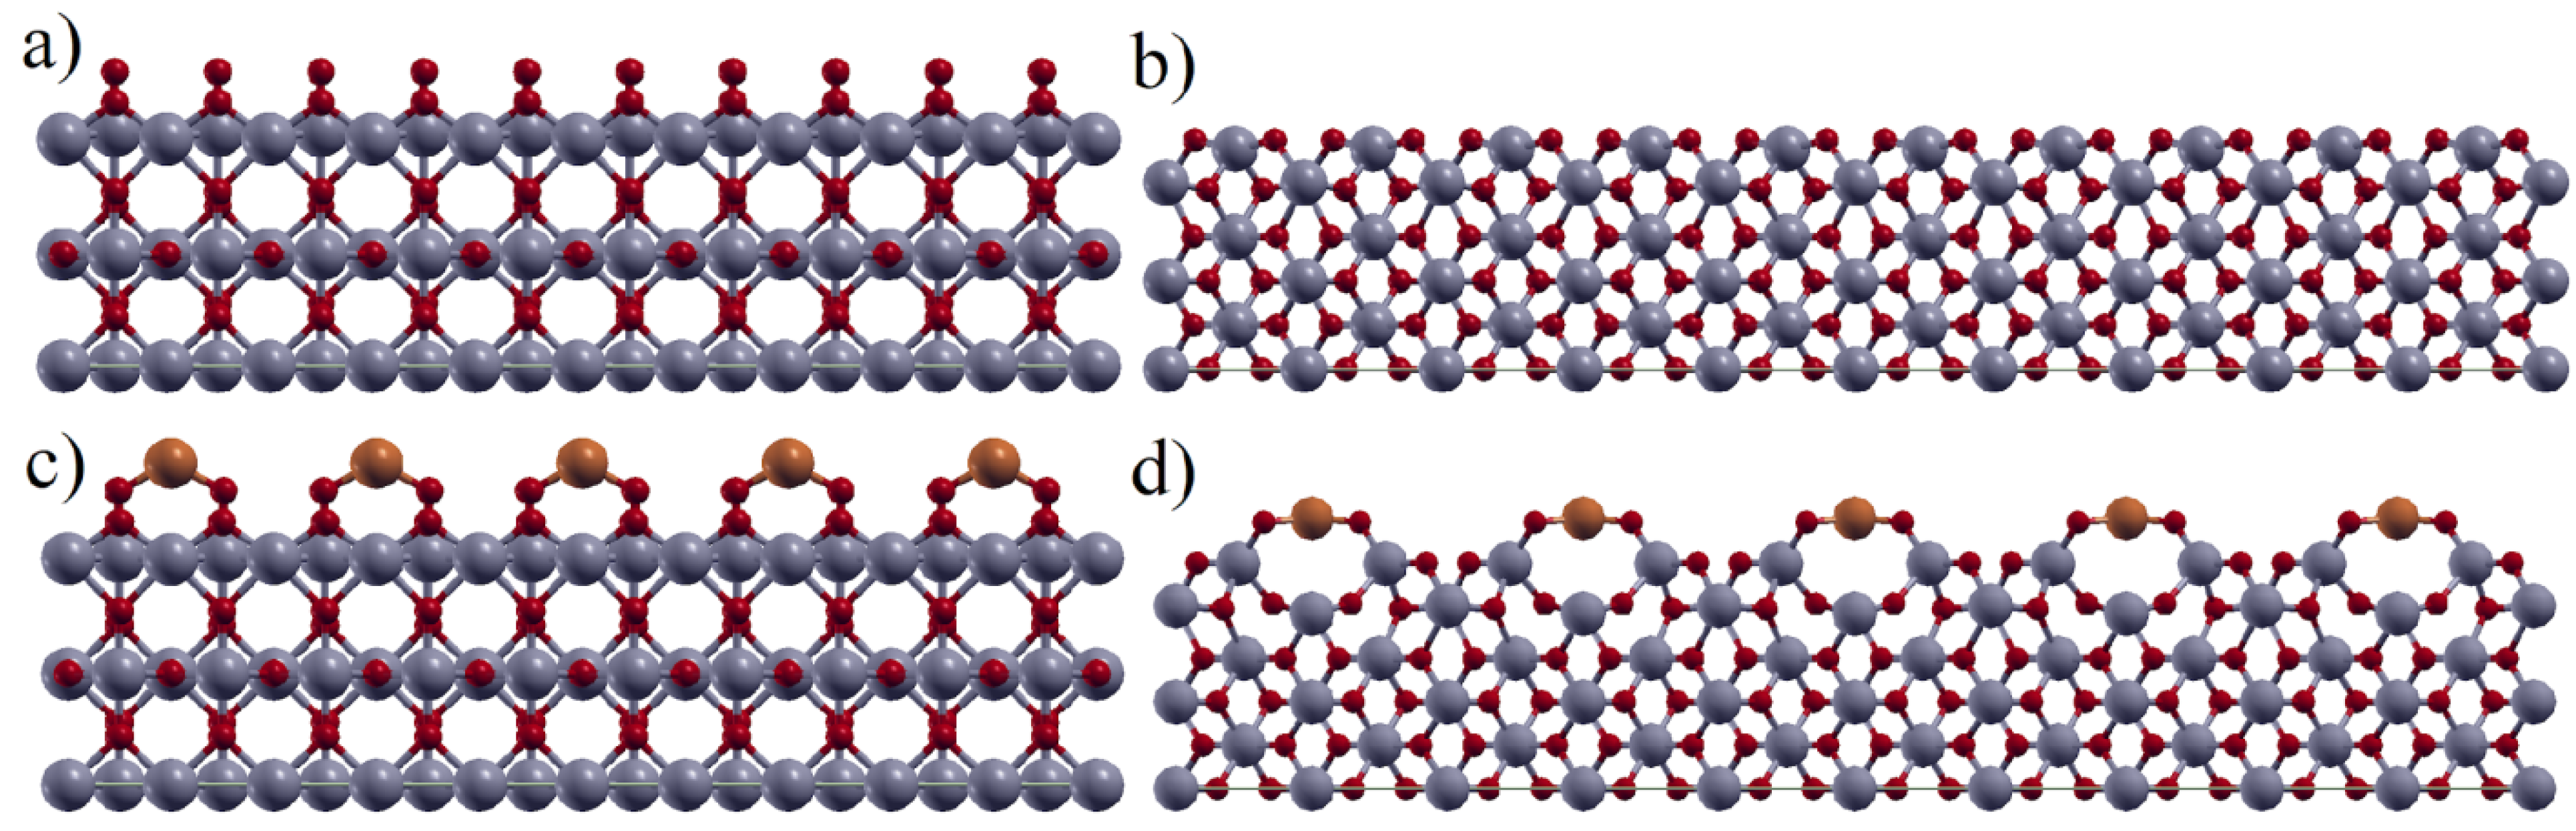
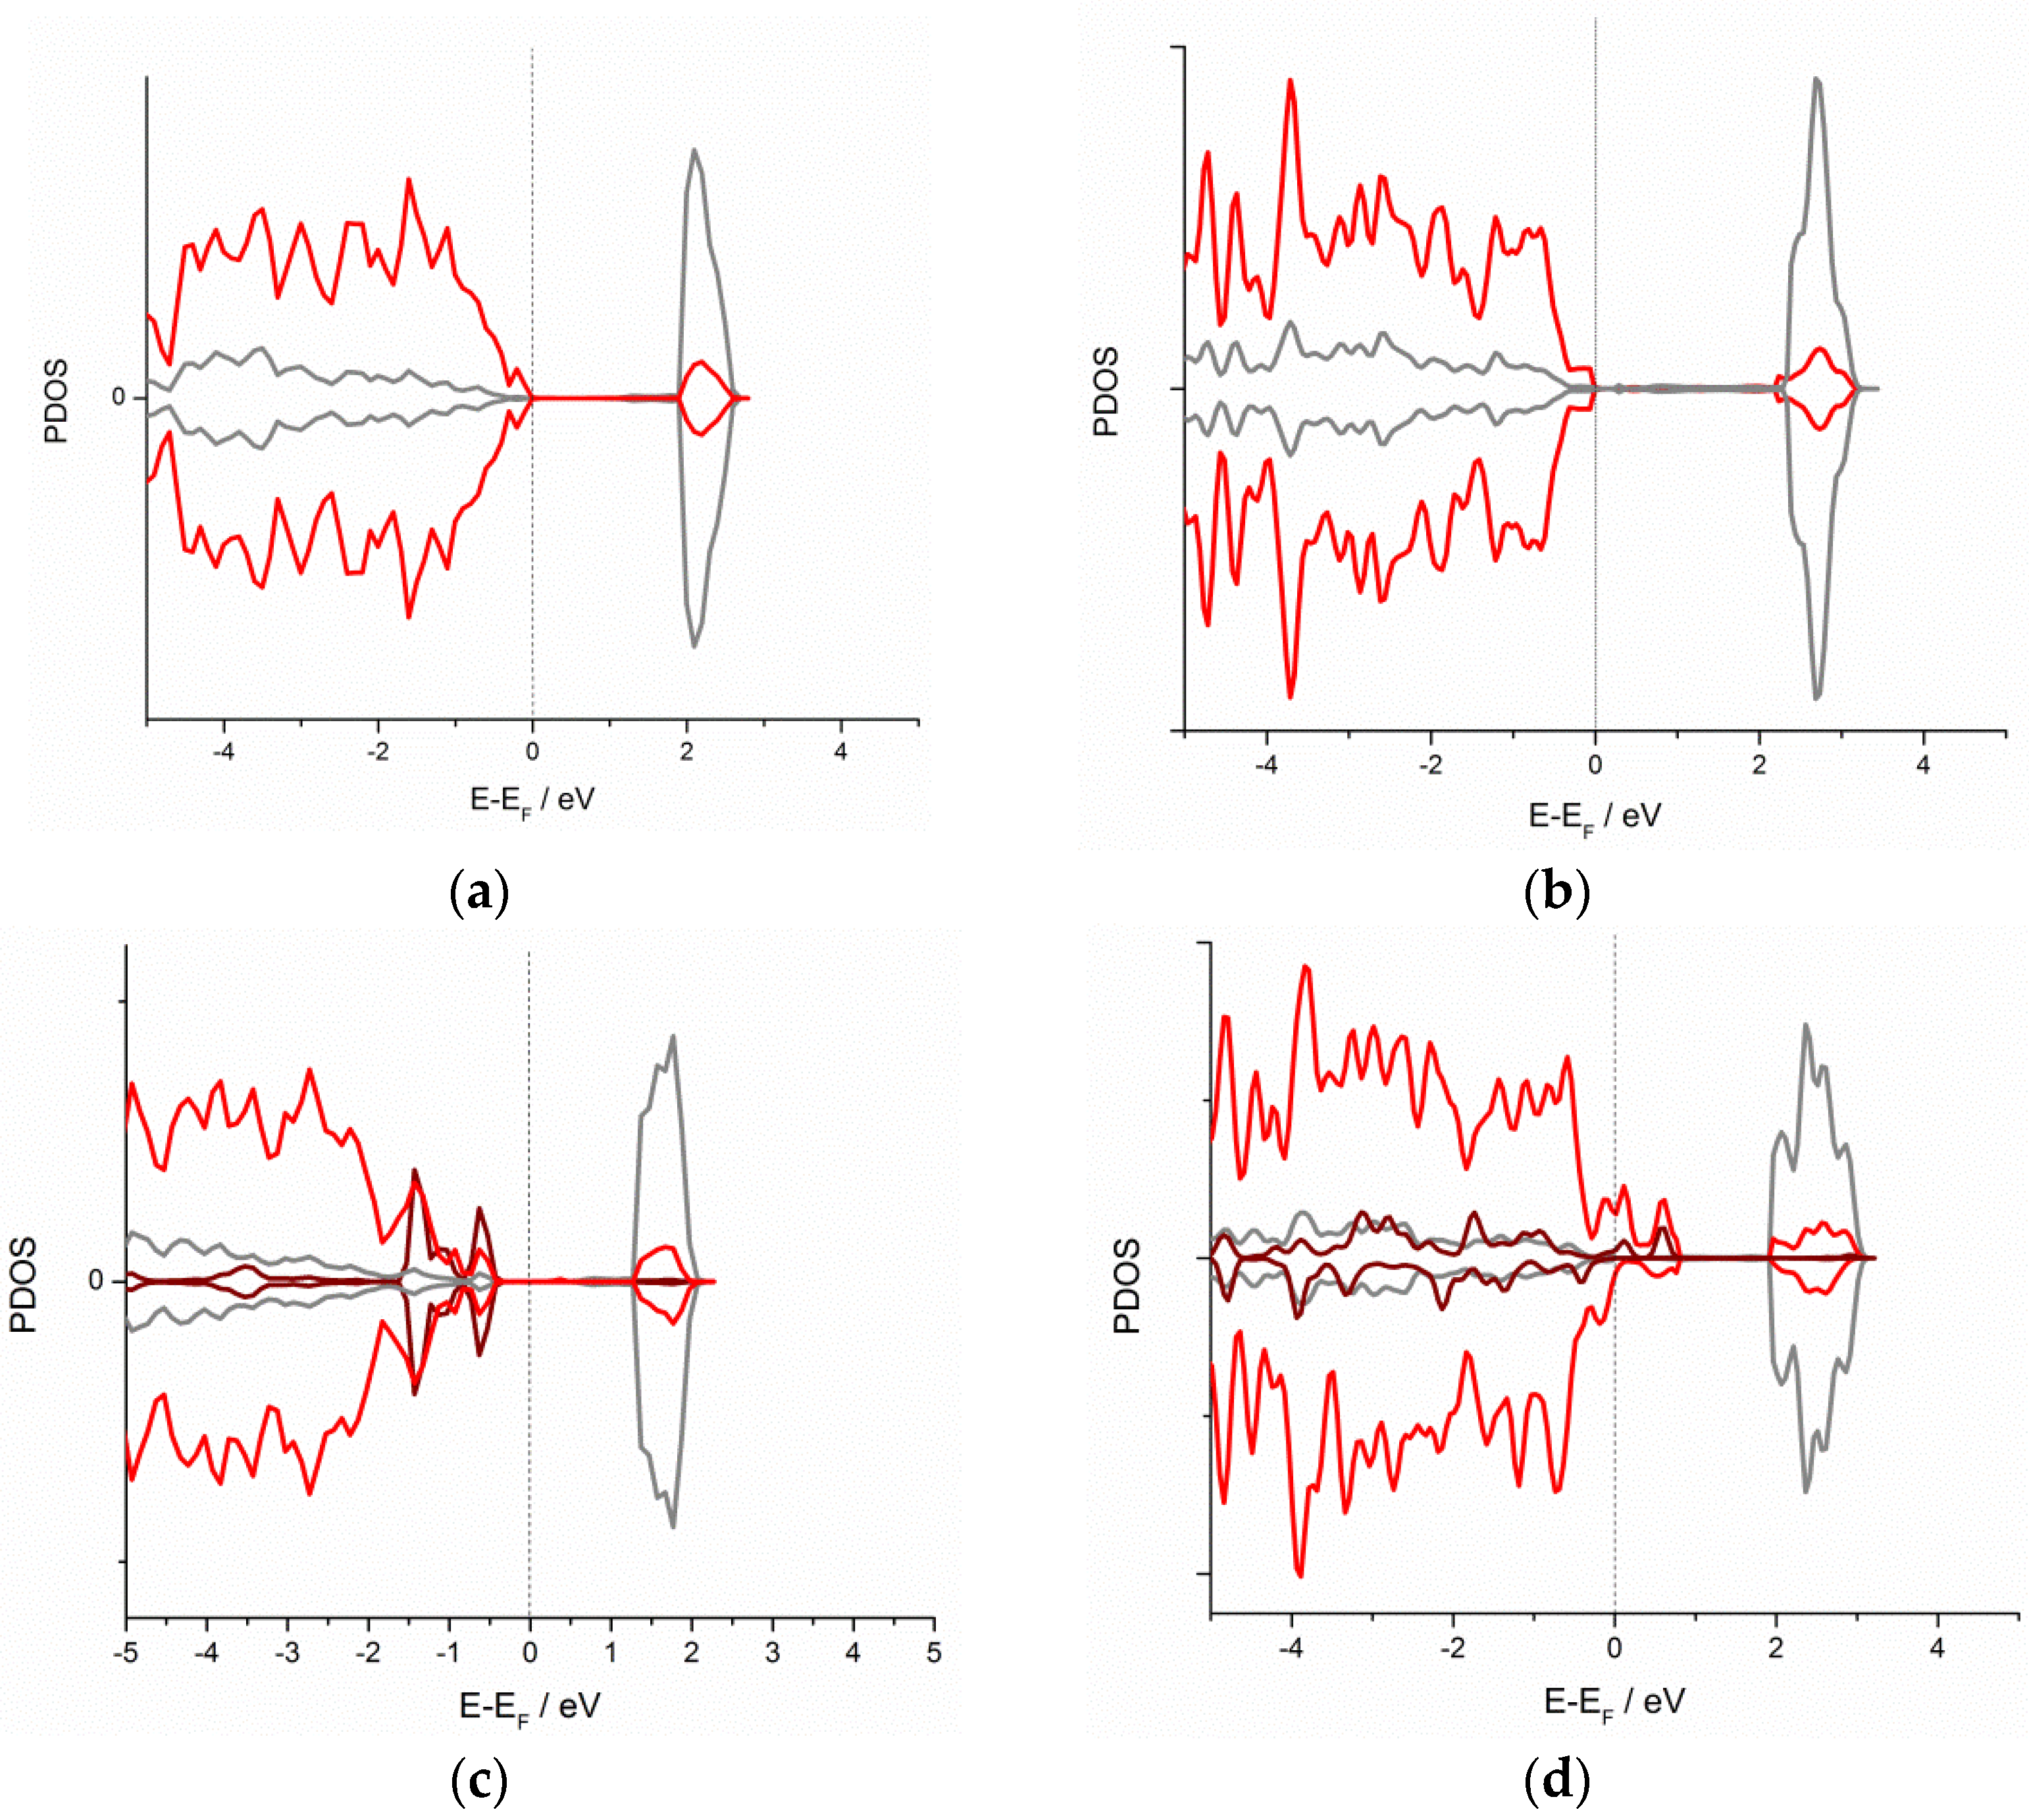
3.1. DFT Screening of d-Metal Adhesion

In order to find the optimal metal coating for the TiO2 photocatalyst, DFT screening was performed for bare rutile TiO2(001) and (M)TiO2(001) for 24 transition metals (M) on three different binding sites: hollow, bridge and top (Figure 1).
DFT-calculated adhesion energies of transition metals on high-symmetry sites of the TiO2(001) surface are given in Table 1.
According to the obtained DFT calculation results, the bridge adsorption site is preferential for the majority of transition metals. All investigated metals show negative adhesion energies (i.e., adhesion is thermodynamically possible). Besides the Eadh, the physical stability of the deposited overlayer also depends on the relation between Eadh and the cohesive energy as the intrinsic property of a metal (Ecoh). When Eadh > Ecoh, the metal is expected to form a stable monolayer, and vice versa, when Ecoh > Eadh, the metal is prone to form agglomerates [36].
In Figure 2, calculated adhesion energies on preferential binding sites are correlated with experimental literature data on cohesive energies of metals, to predict their affinity to agglomerate on the TiO2 surface.
As can be seen in Figure 2, all d-elements except Hf exhibit lower calculated Eadh on the Ti(001) surface compared to literature experimental cohesive energies (Eadh < Ecoh). Therefore, the agglometration of all metals (except Hf) in a form of nanoparticles, rather than the formation of monolayers, is thermodynamically encouraged, making impossible the deposition of stable uniform overlayers at high metal loadings. On the other hand, in Figure 2, it can be seen that some metals—Hg, Cd, Zn, Mn, Cu, Fe, Co, Ni, V, Zr and Hf—still exhibit a smaller Eadh-Ecoh difference (are closer to the “1-1 line”) than the rest (Ag, Au, Cr, Rh, Pt, Mo, Ru, Ir, Nb, Re and Os). So, it was decided to select the model metal to be deposited from the first group, assuming that the smaller Eadh-Ecoh difference will additionally decrease the probability of metal agglomeration on the TiO2 surface.
Among the metals from the first group, Cu, affordable but noble, was selected as the most appropriate model metal to achieve our goal—to deposit a thin metal layer on the TiO2 surface and further study its photocatalytical behavior experimentally and theoretically. Namely, Cu can be easily reduced to the metallic state with the common NaBH4-based method, and is not prone to oxidation in aqueous media (see also Table S1). As calculated Cu adhesion energy (Eadh = −2.39 eV) is lower by 0.53 eV compared to the literature cohesive energy, it was decided to keep a low molar ratio (up to 0.5 molar % Cu vs. TiO2), in order to maximize the probability for Cu-TiO2 interaction and minimize the agglomeration of Cu particles.
To closer investigate the ability of Cu to bind on the TiO2 surface and further study the electronic properties of the system, the model is widened to the adhesion of a single Cu atom on (001) and (110) rutile planes in a larger, 36-atom cell. Optimized geometries of the investigated surfaces with and without adsorbed Cu are represented in Figure 3.
Calculated adhesion energies of Cu at the bridge site along with Bader charge transfer upon binding are given in Table 2.
The obtained values of adhesion energies confirm that the Cu atom is thermodynamically stable on the TiO2 rutile surface, and the binding is accompanied by a significant charge transfer from Cu to TiO2. Adhesion on TiO2(110) is significantly stronger compared to TiO2(001). Moreover, although agglomeration was initially expected based on DFT screening results, Cu binding with O(2) oxygens of the TiO2(110) surface results in strong ionic binding (Eadh > Ecoh) and one electron is completely transferred from Cu to TiO2.
In summary, obtained DFT results point out that, at low surface concentrations of Cu, a formation of a surface oxide is thermodynamically encouraged, due to the availability of the sites rich with unsaturated oxygen (a high surface energy). At higher surface concentrations of Cu, after the saturation of oxygen-rich sites, one might expect agglomerates of Cu atoms that are initially seeded at these sites.
The electronic structure projected density of states (PDOS) of TiO2(001) and TiO2(110) with and without adsorbed Cu is represented in Figure 4.
PDOS structures essentially confirm the formation of the Cu-O bond. In both cases of (001) and (110) surfaces, Cu features appear on the top of the valence band, overlapping with O states. Although the quantitative representation of a bandgap with DFT requires artificially large U-correction [37], the decrease in a bandgap width upon the introduction of novel states is clearly visible. Also, in the case of the (001) surface, there is a downshift of the Ti d-band upon Cu adsorption, pointing to the partial contribution of the metal bond, while on the (110) surface, there is no significant downshift of the Ti d-band, pointing to that the newly formed Cu-O bond is barely ionic.

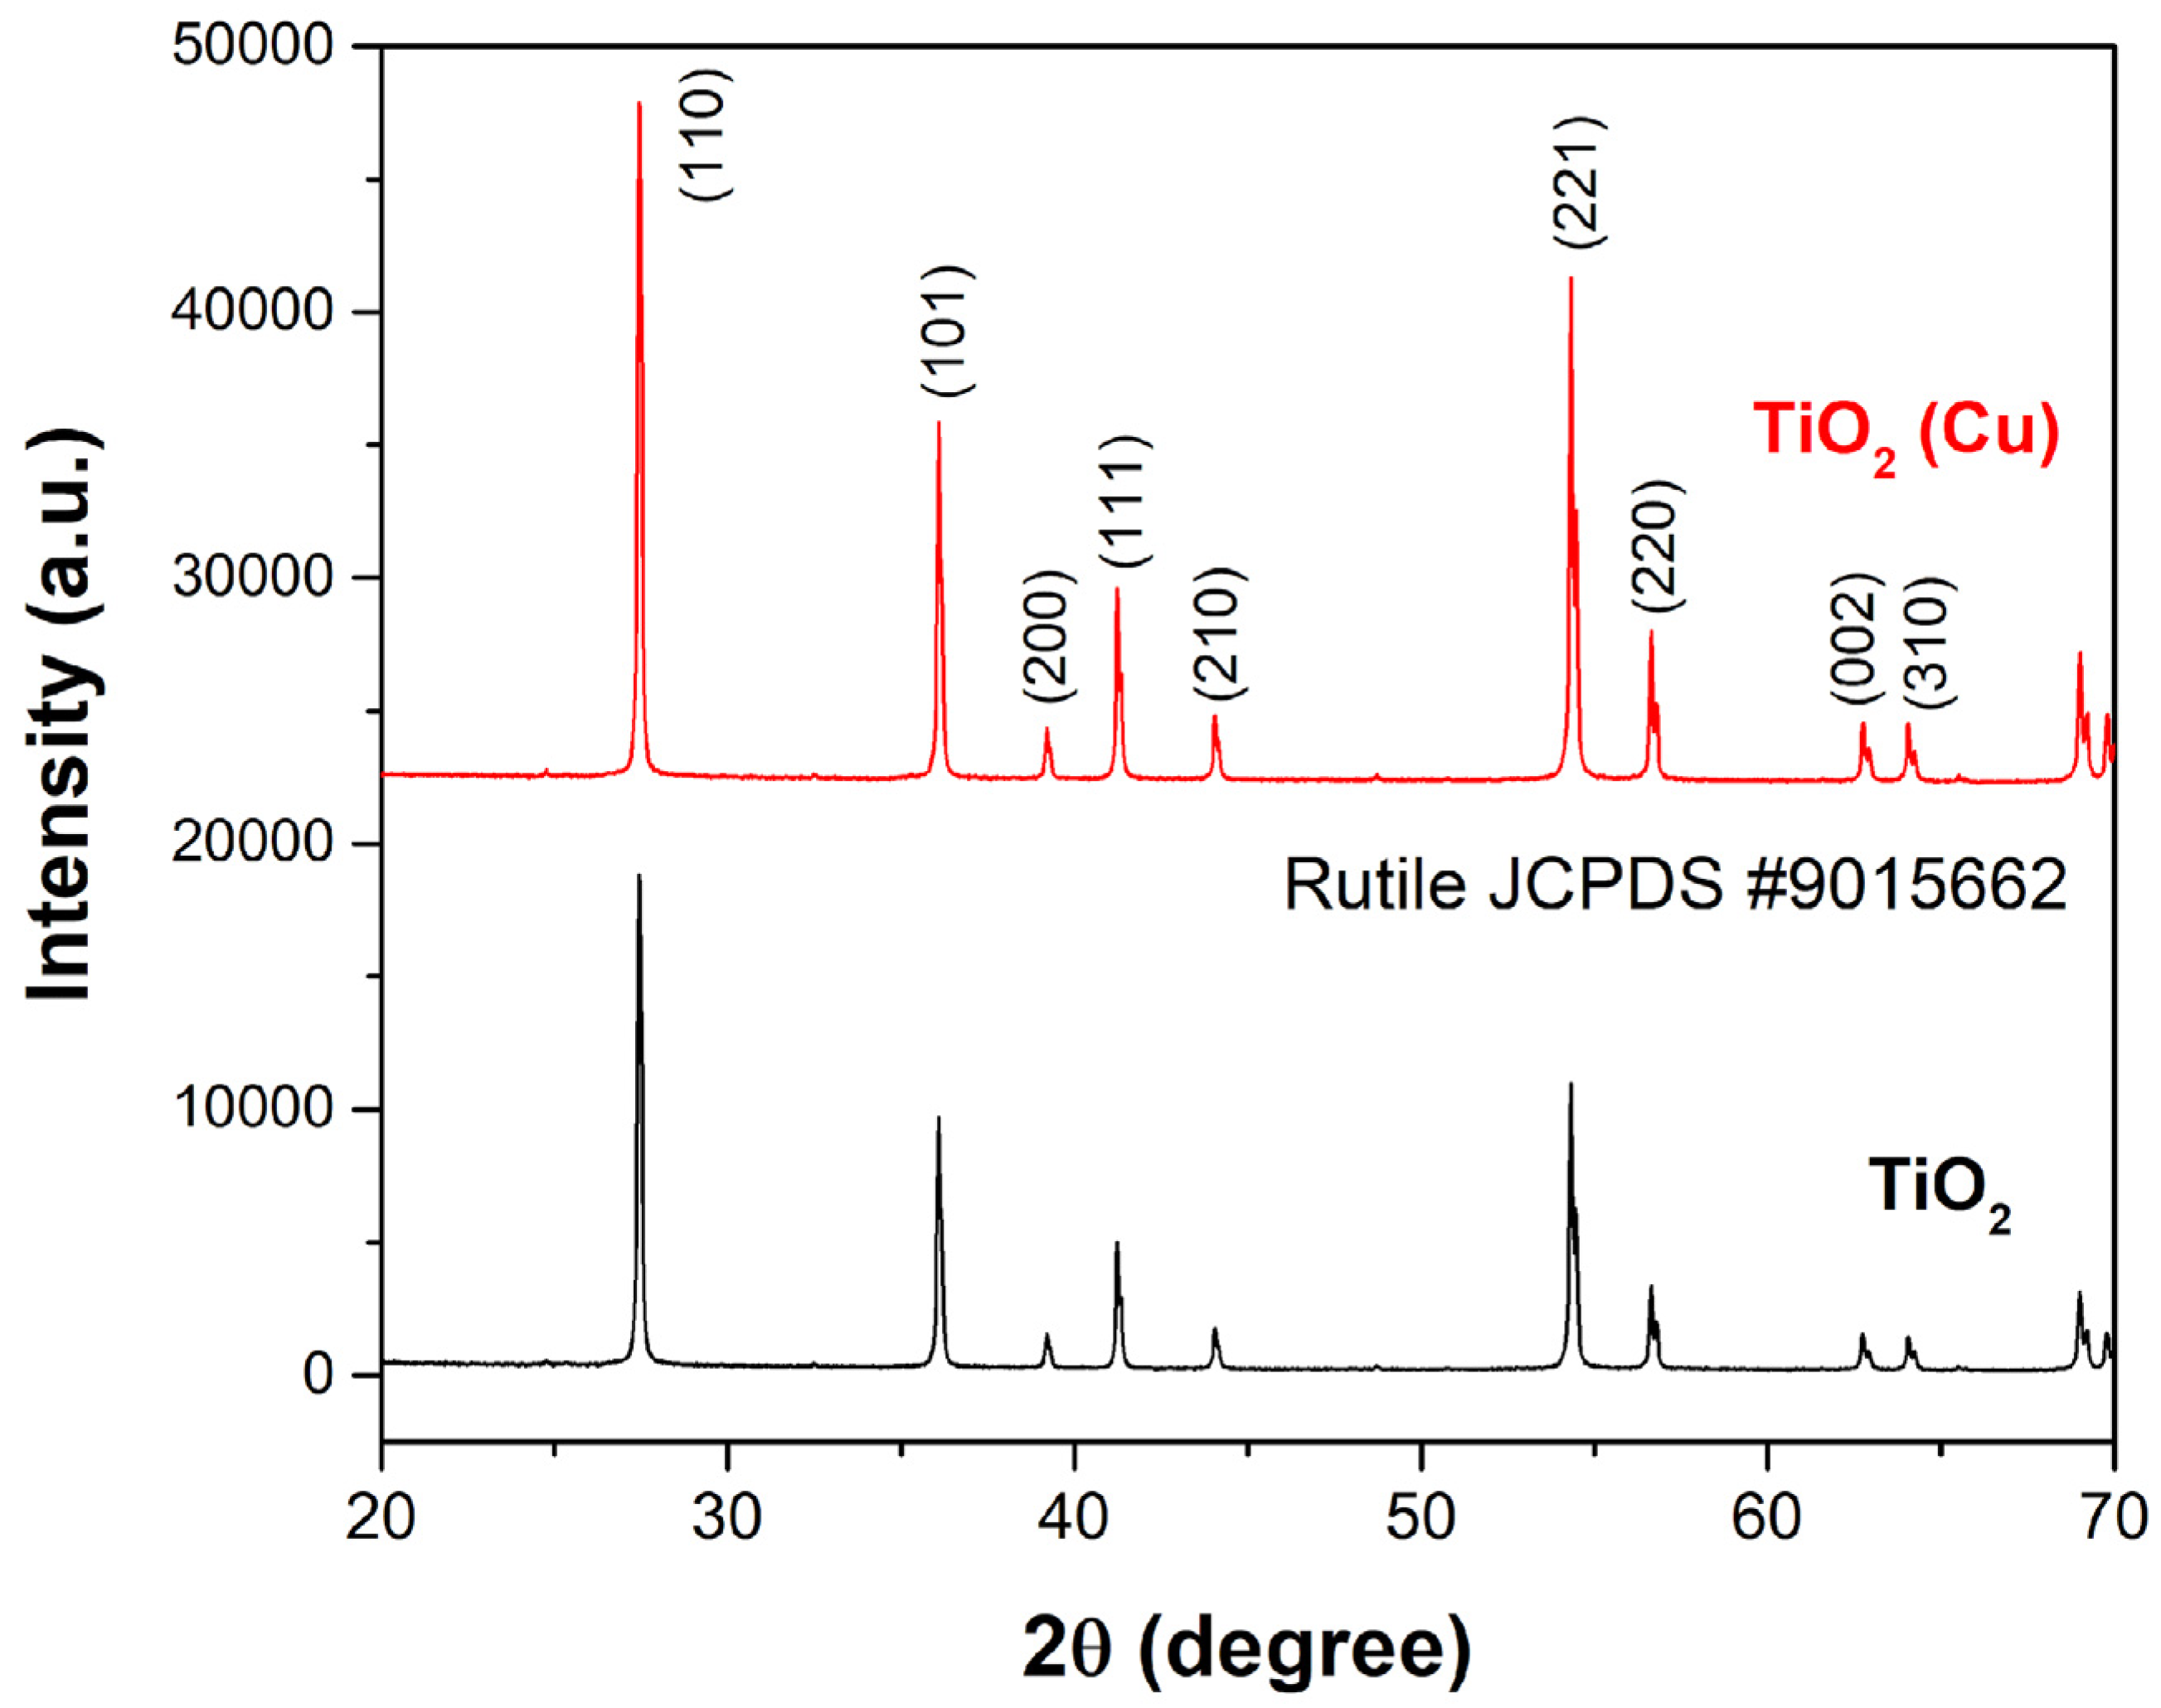
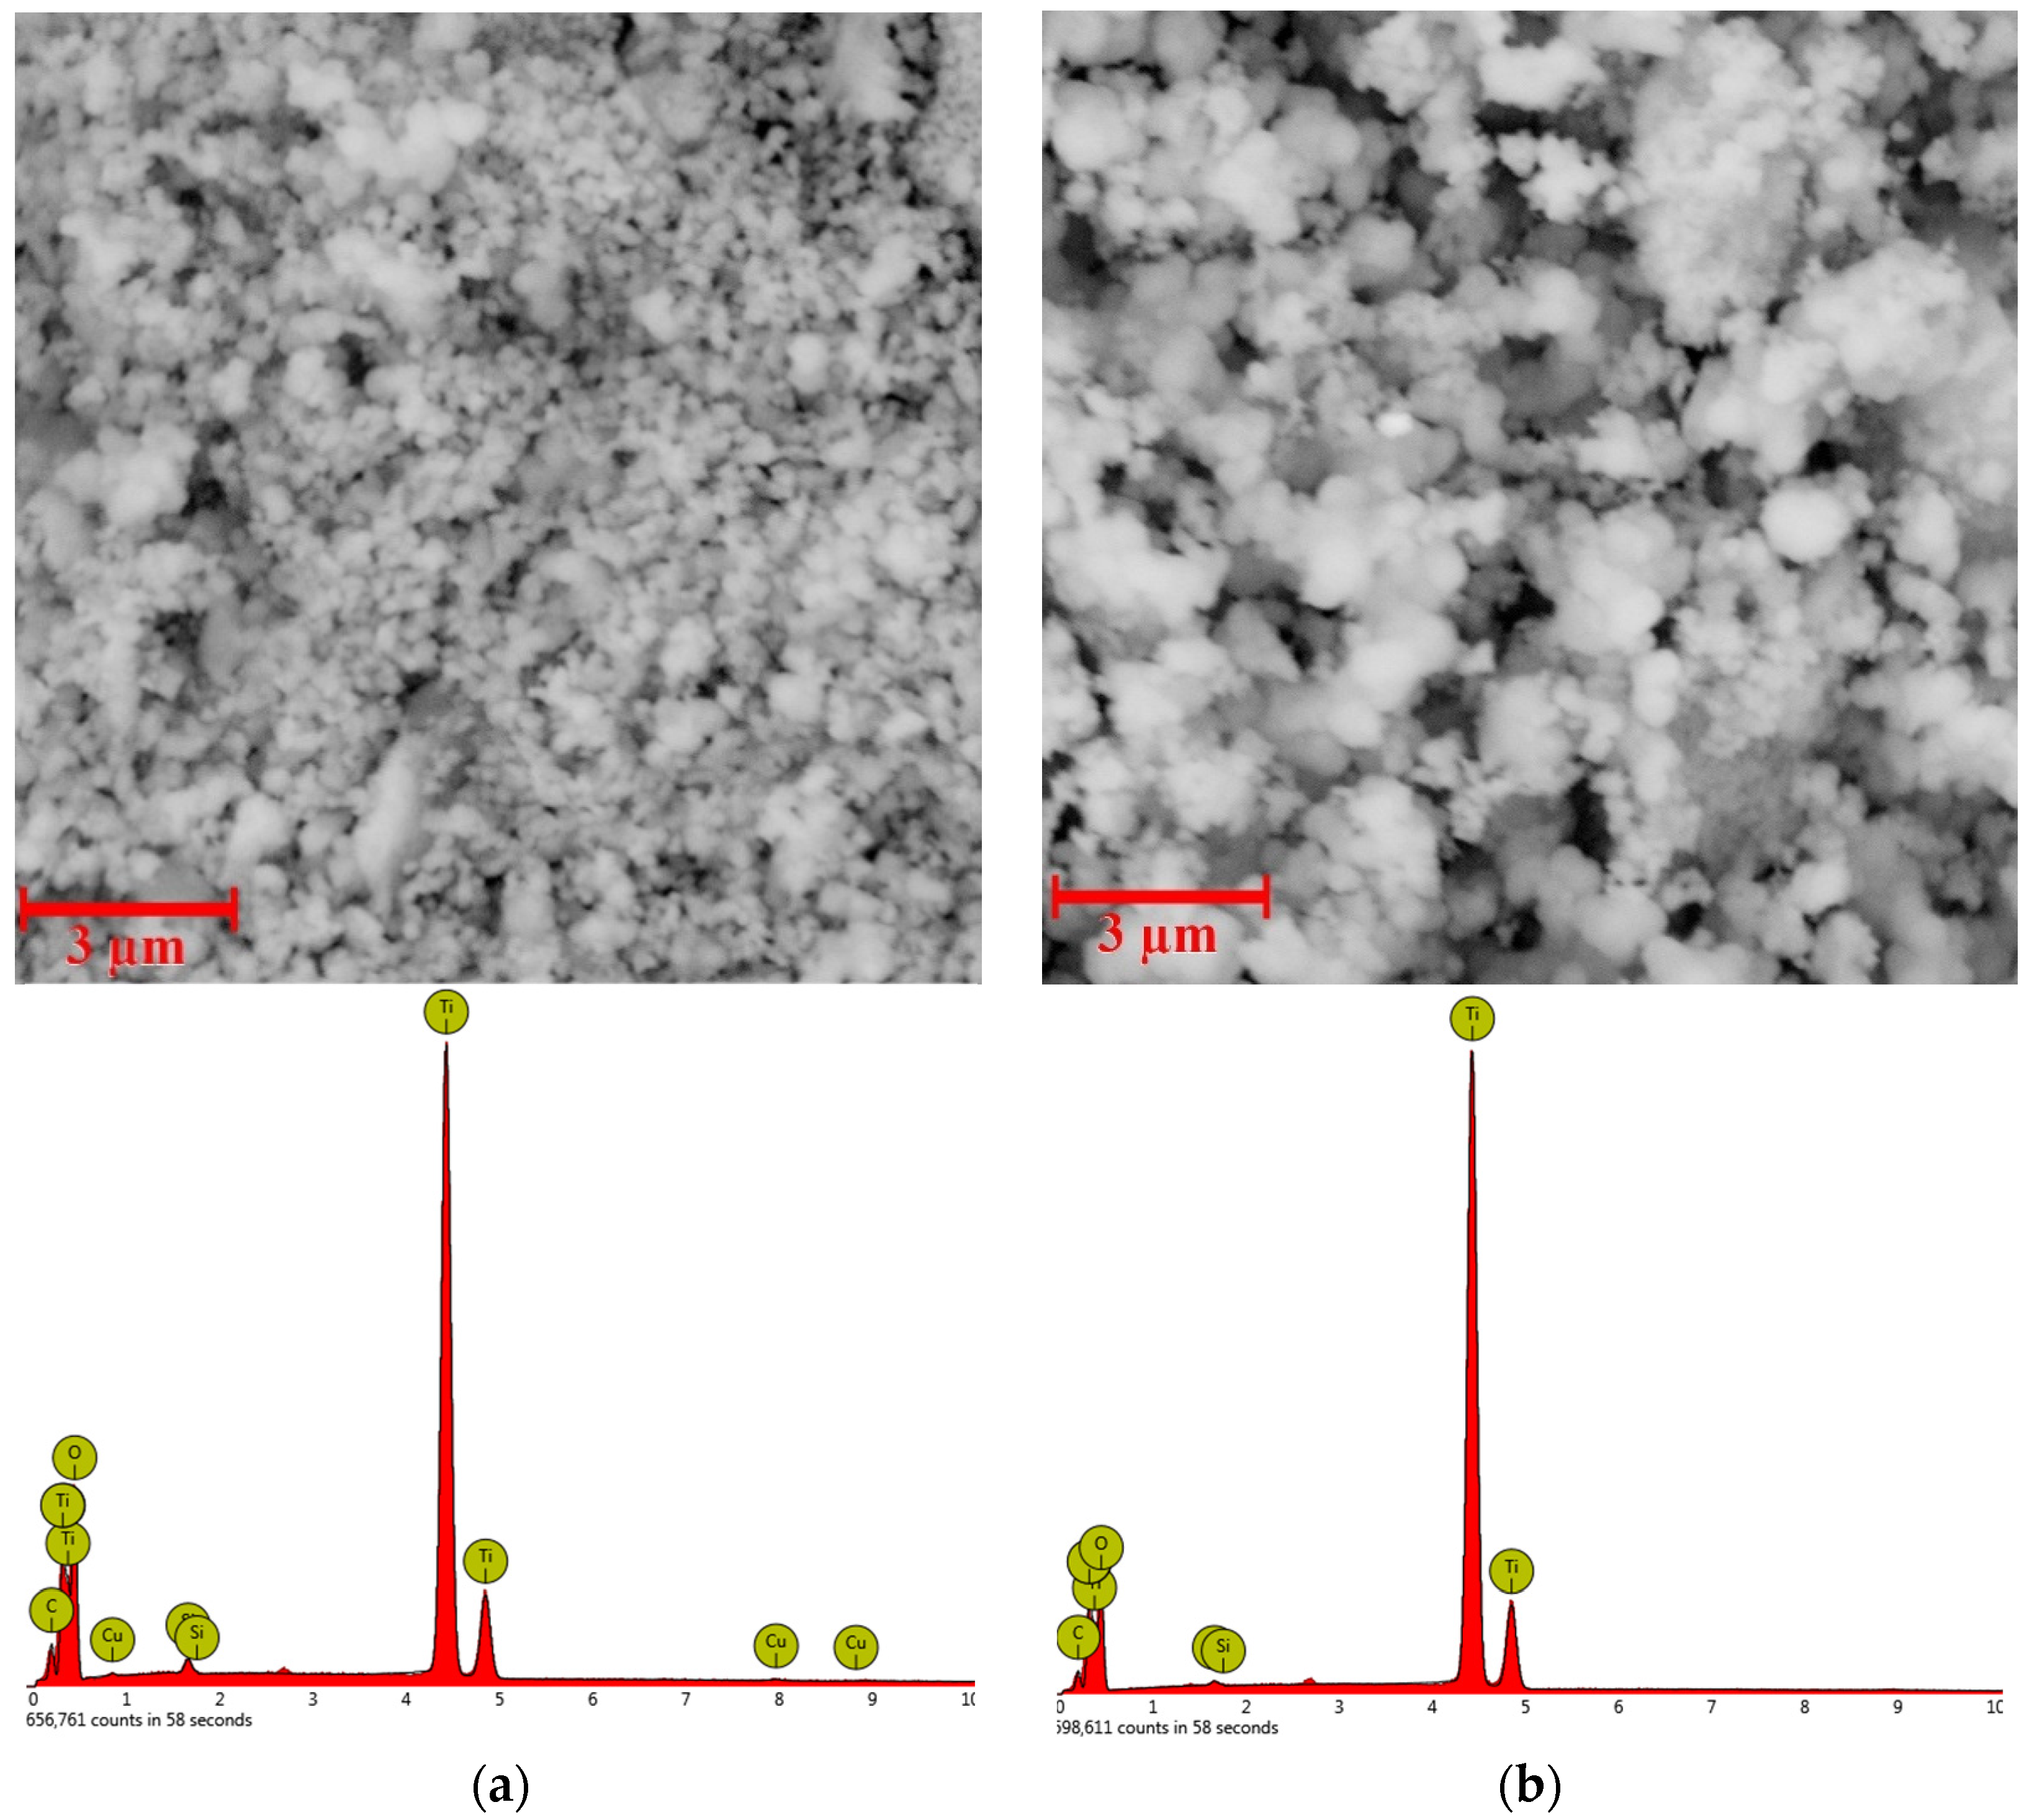
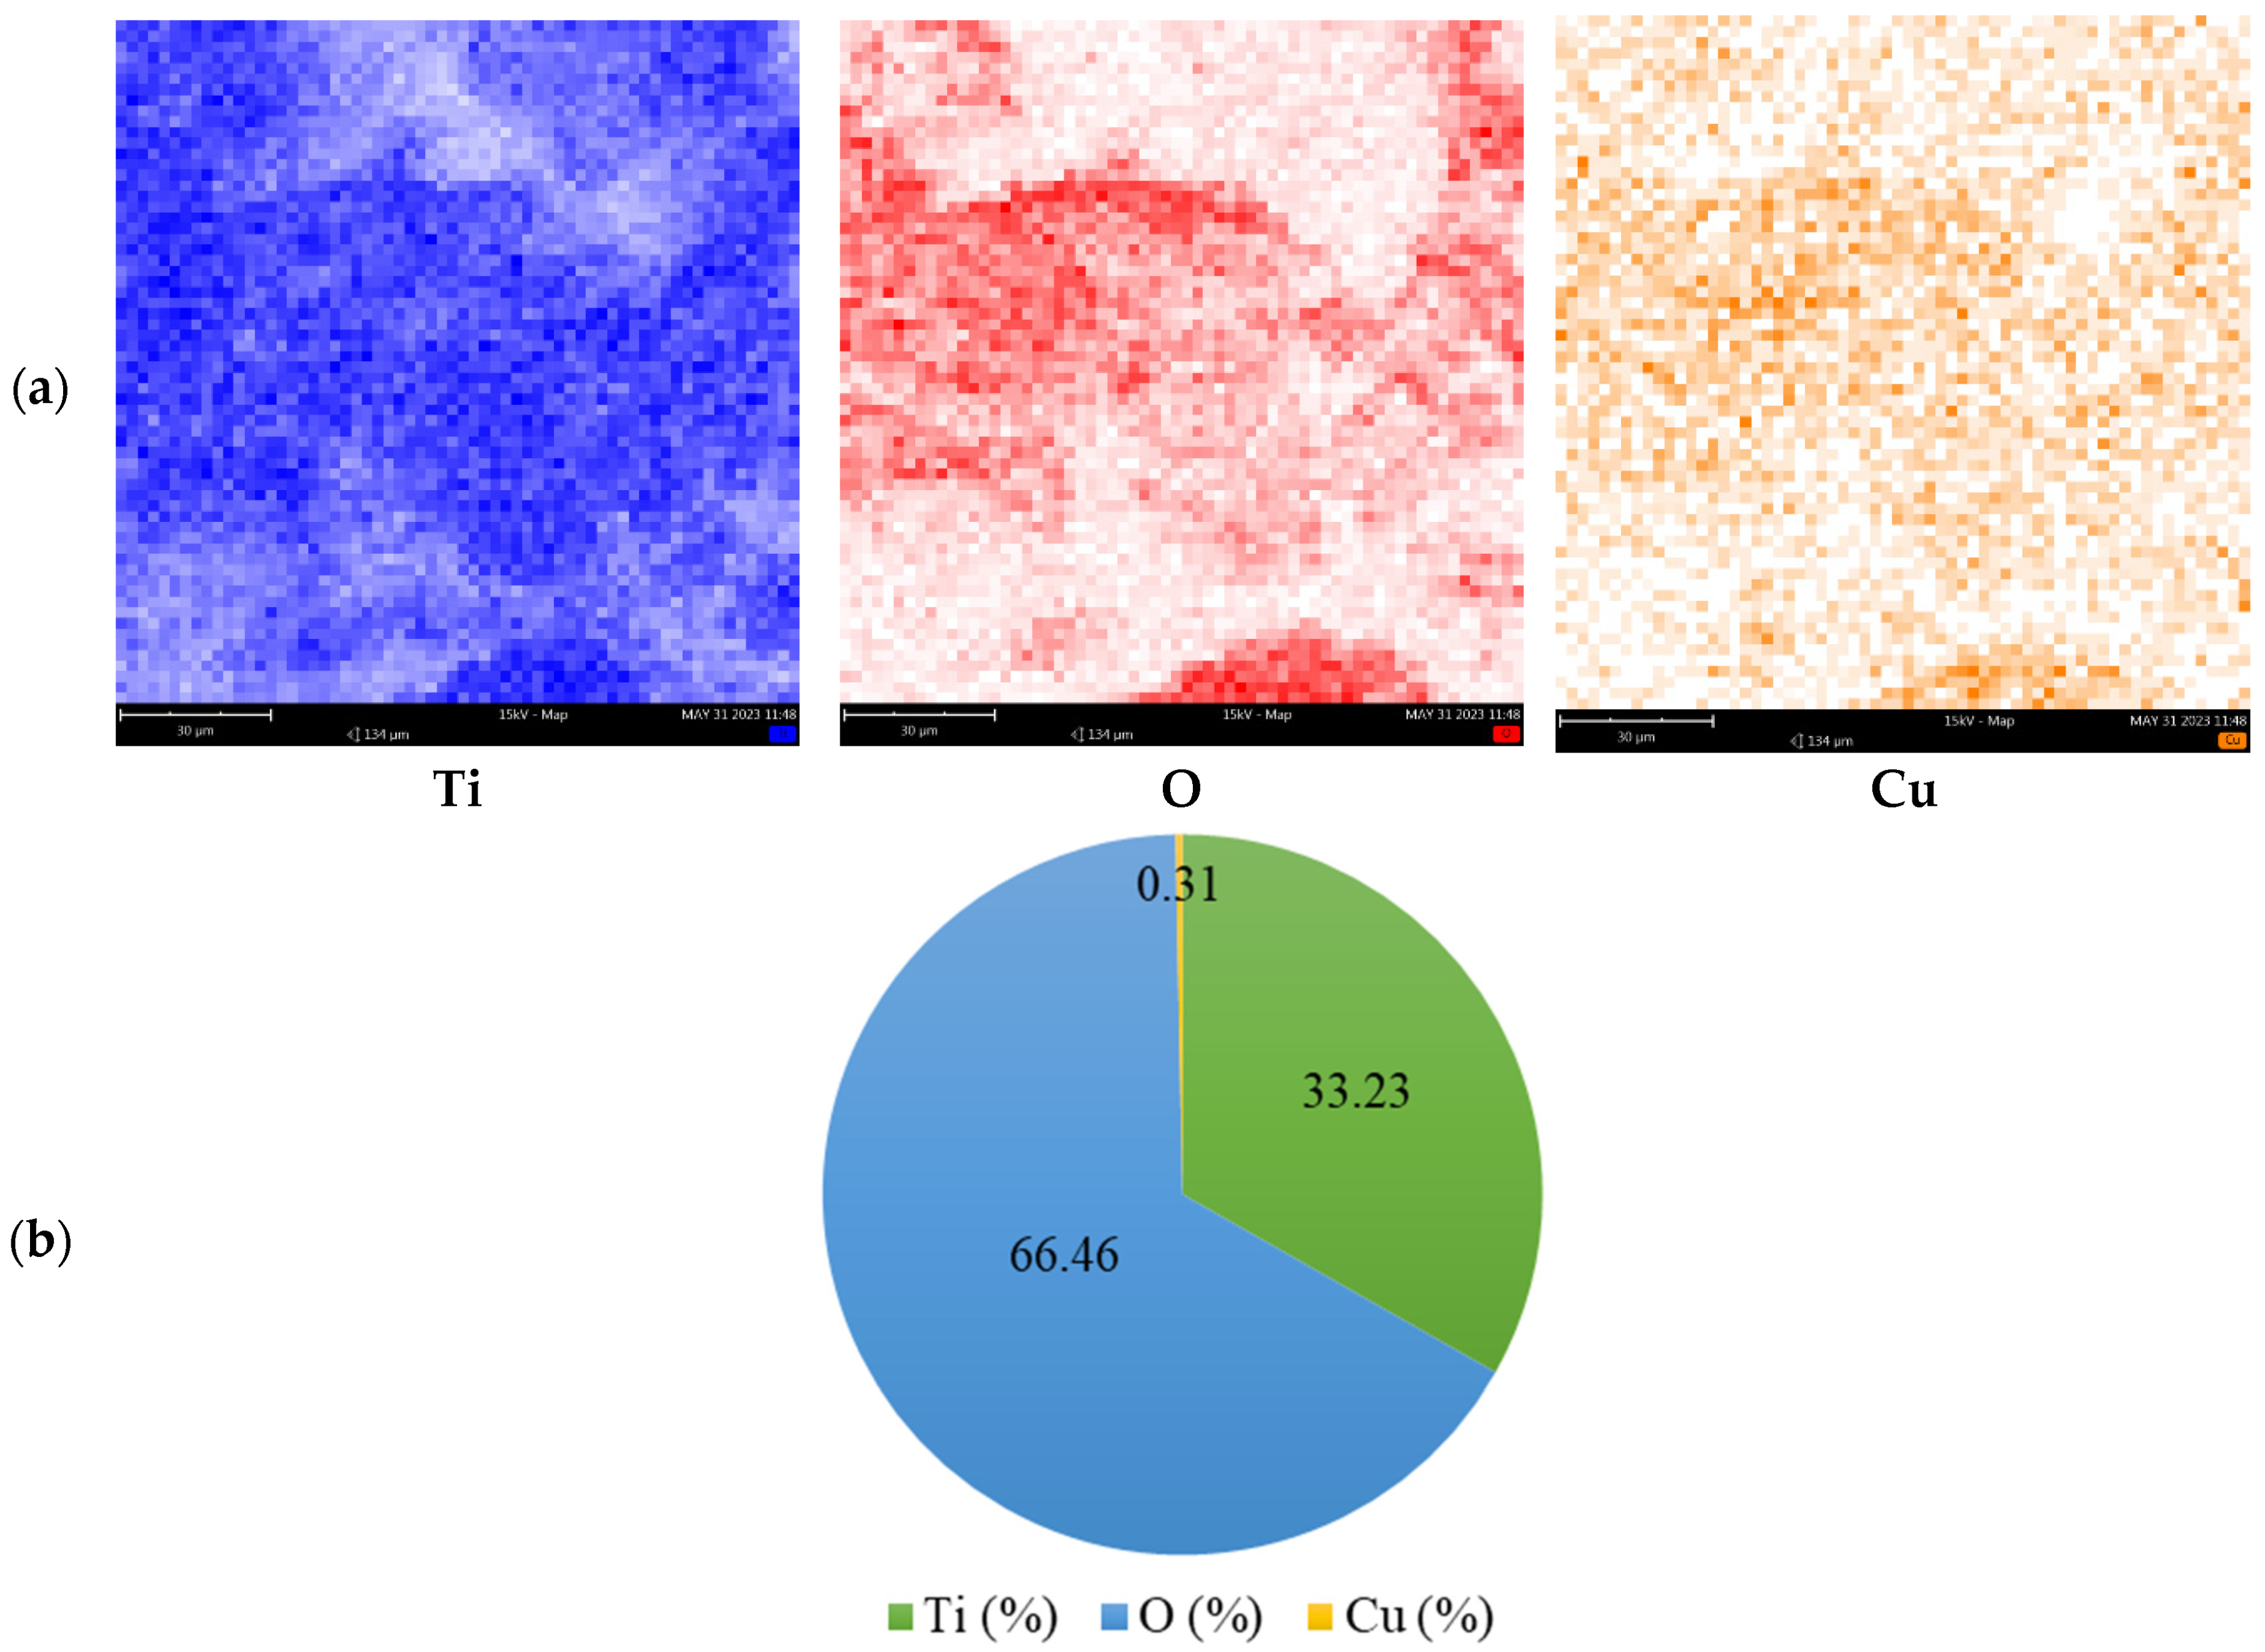
3.2. Characterization of Prepared Photocatalysts

XRD patterns of prepared (Cu)TiO2, compared to bare TiO2, are presented in Figure 5.
The XRPD pattern of (Cu)TiO2 is remarkably similar to the one of bare TiO2. Such a result is expected, as the initial amount of Cu in the (Cu)TiO2 sample preparation is below the detection limit of the crystallographic method. The good agreement with JCPDS #9015662 points out that the prepared materials crystallize in the tetragonal P42/mnm space group as a pure rutile phase of titanium dioxide. The patterns also show that the crystalline structure of TiO2 remains stable after the modification with the Cu coating. The crystallite size, lattice strain and lattice parameter calculated with the Halder–Wagner method are listed in Table 3. As can be seen, there are only slight differences in the crystalline properties of these two materials, whereby the crystallites are slightly larger in TiO2(Cu).
SEM images and EDX spectra of prepared (Cu)TiO2 and bare TiO2 samples are represented in Figure 6.
SEM images (Figure 6) of bare TiO2 reveal variable-shape agglomerates of spherical nanoparticles of about 1 µm in diameter. The (Cu)TiO2 sample exhibits a similar structure, although the average size of agglomerates is lower compared to bare TiO2. The average diameter of nanospheres in (Cu)TiO2 is also lower compared to bare TiO2 (about 100 nm), being comparable with an average crystallite size obtained from a Debye–Scherrer analysis.
The EDX pattern (Figure 6) confirms the presence of Cu in the (Cu)TiO2 sample. Moreover, elemental maps of (Cu)TiO2 (Figure 7) confirm that copper and oxygen follow similar and rather uniform spatial distribution—oxygen-rich areas are also rich in copper—confirming the preposition of prevalent Cu-O binding at low Cu loadings from DFT calculations. Si peaks, present in both bare and Cu-coated samples, can be attributed to SiO2 as a residual impurity, probably from calcination, while detected carbon originates from the carbon-based support for SEM imaging and Ti-isopropoxide residues from synthesis.
The normalized amount (Figure 7b) of Cu in the (Cu)TiO2 sample is 0.31 atomic %, being close to the input amount of Cu during sample preparation (0.40%).

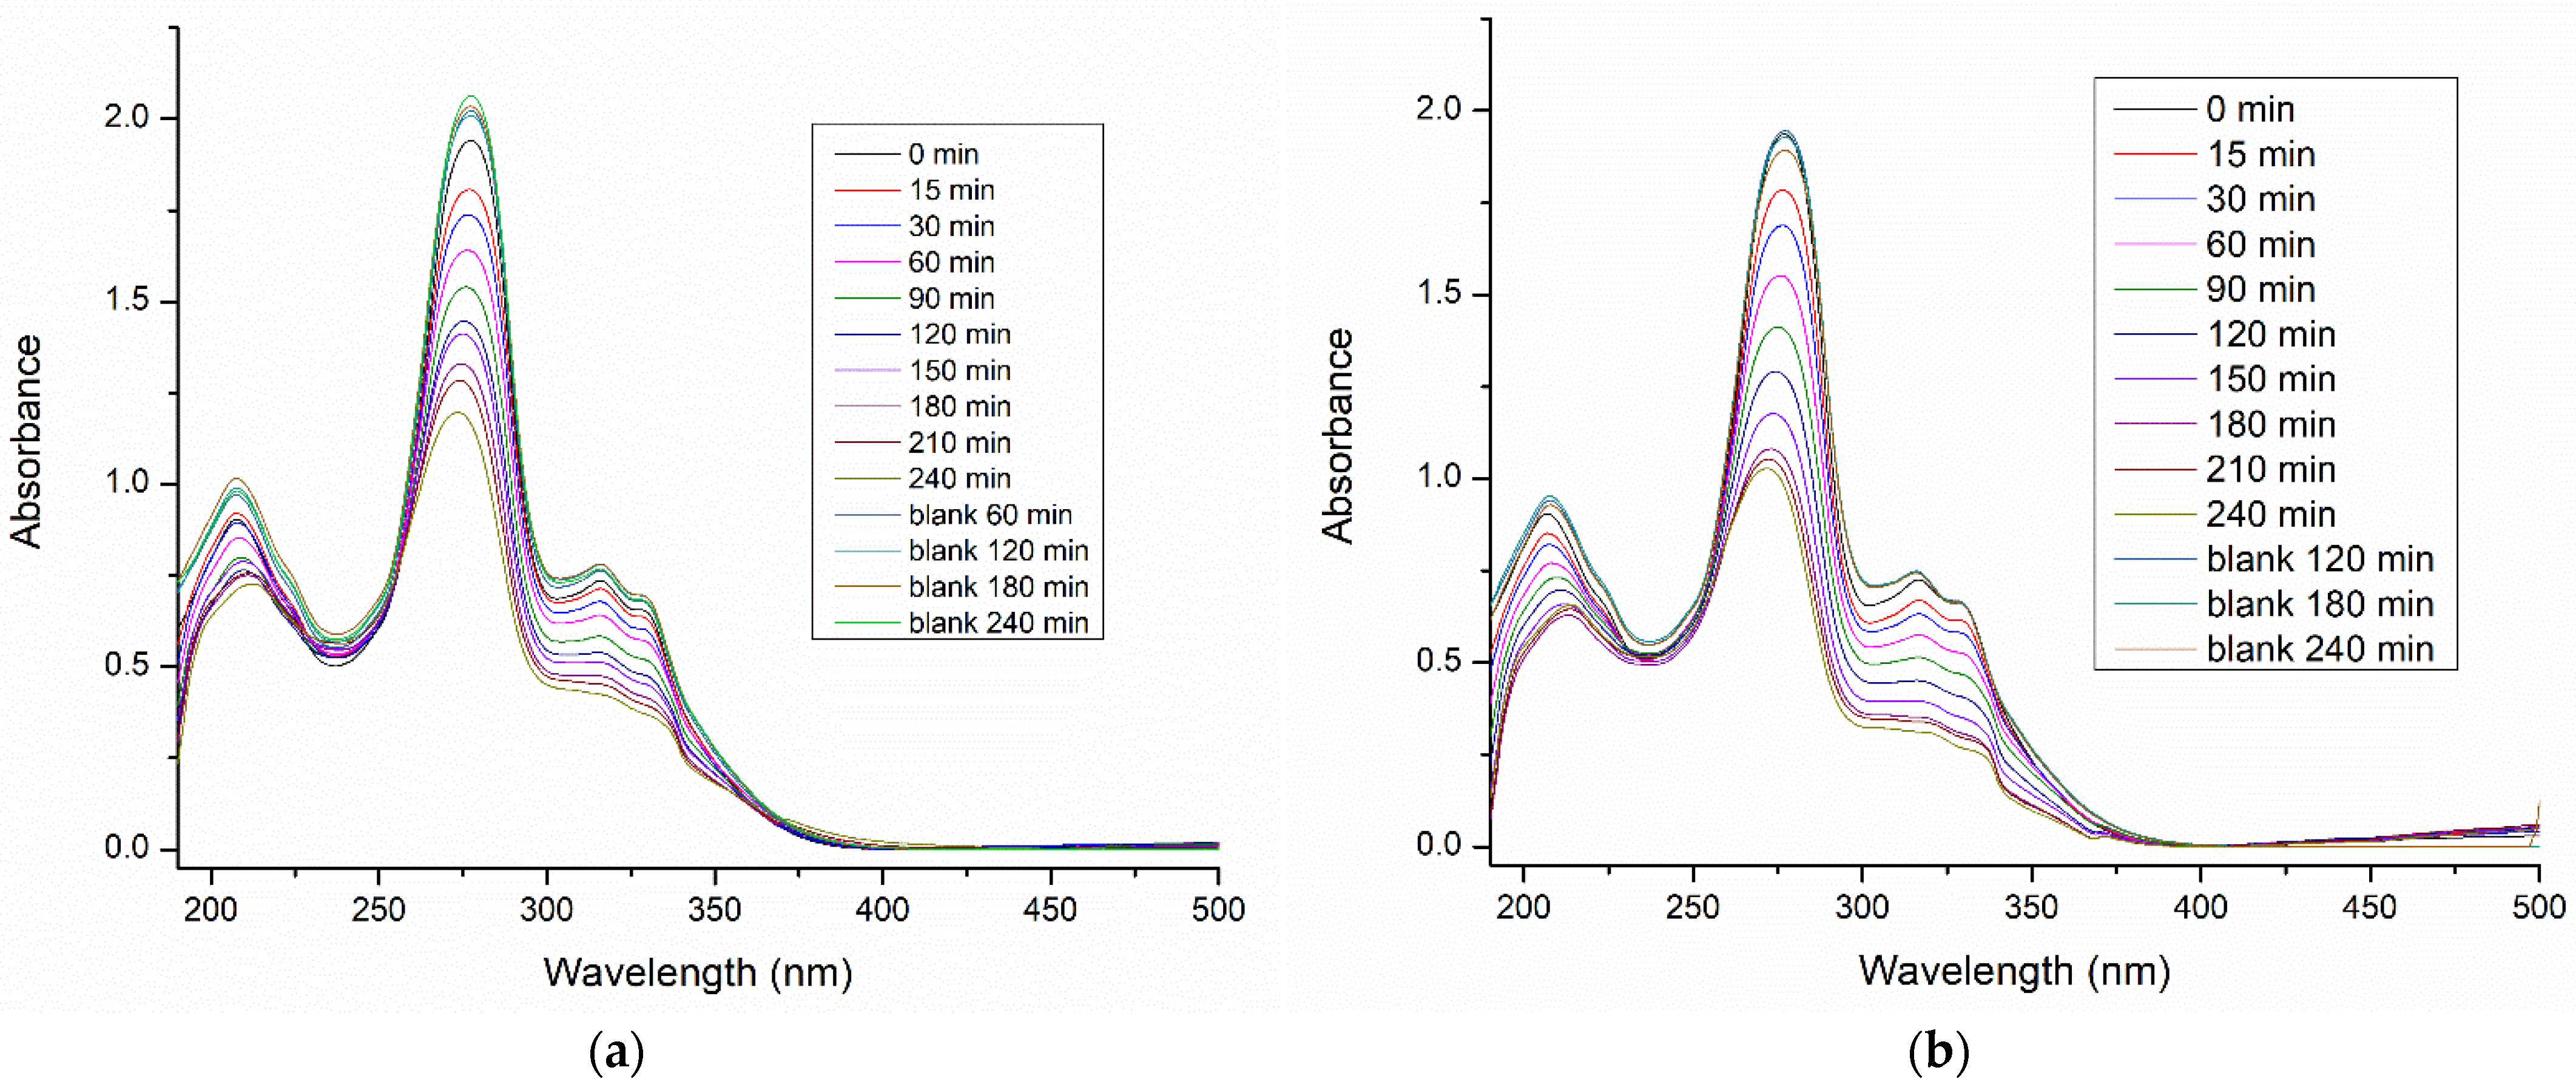
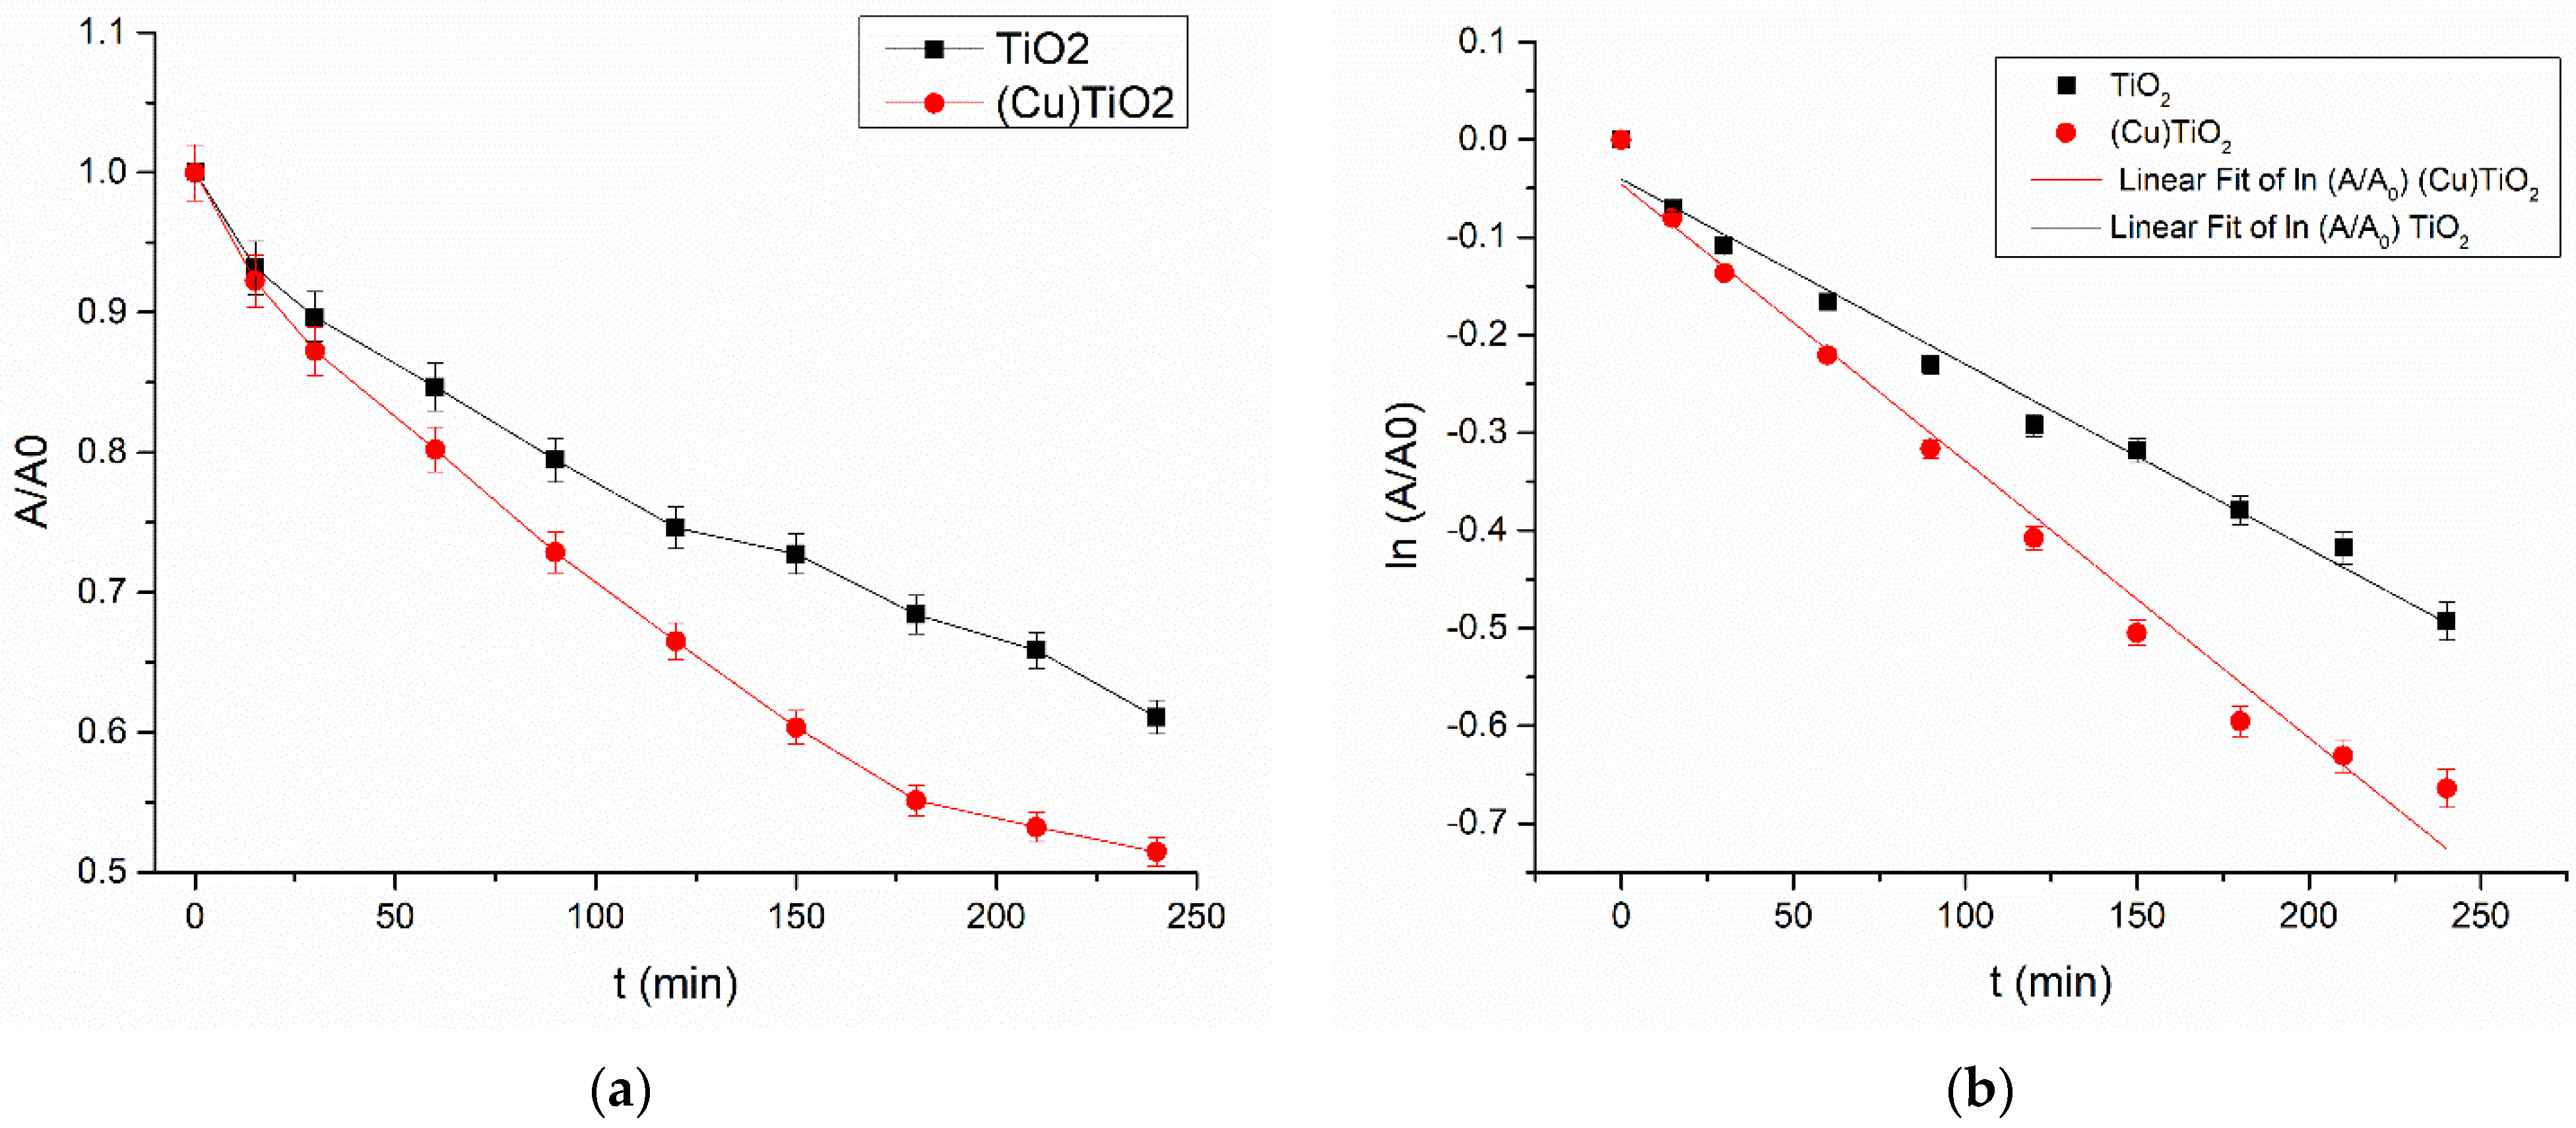
3.3. Photodegradation of Ciprofloxacin

Prepared (Cu)TiO2 was applied as a photocatalyst for the degradation of ciprofloxacin. UV-Vis spectra of 4.75 × 10⁻⁴ M of a ciprofloxacin solution during 240 min of photo-treatment with (Cu)TiO2, compared with bare TiO2, are presented in Figure 8.
UV-Vis spectra confirm that the characteristic absorption maximum of ciprofloxacin at about 277 nm decreases with time, due to the photodegradation. UV-Vis spectra of bare TiO2 and (Cu)TiO2 photocatalysts (Figure S2) confirm that the investigated photocatalysts do not absorb on the area of interest for tracking ciprofloxacin degradation.
The degradation rate was calculated from the decrease in absorbance at 277 nm, assuming the pseudo-first-order kinetics (Equation (3)):
A = A 0 · e k t
where A0 is the absorbance at time t = 0, and k (min−1) is a pseudo-first-order rate constant.
The linearized form of Equation (3) is given in Equation (4).
l n A A 0 = k t
was applied to obtain the rate constant k from the slope of the graph.
Resulting kinetic curves of CIP photodegradation on (Cu)TiO2 and bare TiO2 photocatalysts are represented in Figure 9.
Calculated pseudo-first-order rate constants are given in Table 4.
As is evident from Figure 8, about 37% of ciprofloxacin was degraded within 240 min in the presence of the bare TiO2 photocatalyst, and the degradation extent was raised to about 50% in the presence of (Cu)TiO2 within the same time. In Table 4, it is confirmed that the degradation rate on (Cu)TiO2 is significantly (about 1.5 times) higher compared to non-modified TiO2. The mineralization extent was measured with a TOC analysis at the end of the degradation process, and the results are represented in Table 5.
As can be seen from Table 5, the spectrometrically detected ciprofloxacin degradation is followed by the mineralization of the organic matter in the sample. The total mineralization extent is slightly larger for (Cu)TiO2—12.2%—compared to bare TiO2 (9.5%).

4. Discussion

In order to identify the acceptable metals to prepare a thin metal layer of controllable properties on a TiO2 photocatalyst, comprehensive DFT screening of the adsorption of d-metals on TiO2(001) was carried out. However, due to the lower affinity for adsorption than for agglomeration (Eadh < Ecoh), almost all investigated metals showed similar expected behavior, with the thermodynamically favorized agglomeration of metal particles, pointing out that the metal concentration, rather than the type, is a major factor determining its structure on the TiO2 surface. Accordingly, it was concluded that keeping a small amount of metal coating (up to 0.5%) will help in avoiding excessive metal agglomeration. Among investigated metal adsorbates, Cu was found to be reasonably thermodynamically stable, available and easy to prepare, so it was selected as a model metal for further work.
However, subsequent and more detailed calculations revealed that adsorption is still thermodynamically favorized on the oxygen-rich sites, yielding in a formation of some kind of surface oxide. The widened DFT model predicted the strong interaction of Cu with non-saturated oxygens on TiO2(110) (Eadh > Ecoh) followed by a considerable charge transfer from Cu to TiO2. The electron transfer from the metal to semiconductor is, at first glance, somewhat surprising, as one might expect a charge transfer in the opposite direction due to the formation of the Schottky junction [38]. However, the obtained result is in good agreement with the literature data on the deposition of other metal atoms, such as Pt and Pd [30] and Au [39], as well as with experimental XPS data that confirm the presence of Cu-O on the surface of Cu-modified TiO2 [40]. In addition, it was shown with earlier theoretical studies of similar systems that the charge transfer from a semiconductor to metal is promoted by oxygen vacancies and is also dependent on metal loading, i.e., on metal cluster size [41]. The PDOS calculations revealed that, upon the introduction of Cu, novel states appear on the top of the valence band, and thus the bandgap width is decreased, confirming the possibility of a synergistic effect of TiO2 and deposited Cu to build an interface with improved optical properties for photocatalytic processes.
In the next step, Cu-coated TiO2 was produced using the NaBH4 chemical reduction method, and it was then used to photodegrade the antibiotic ciprofloxacin. The XRD analysis confirmed that the rutile TiO2 was successfully prepared and stable after the deposition of the Cu coating. The findings of the SEM imaging showed that the agglomeration of TiO2 particles is reduced in the presence of the Cu coating, as the size of nanoparticle agglomerates is reduced from about 1 μm to approximately 100 nm, being comparable with the average crystallite size from the Debye–Scherrer analysis (91 ± 5 nm). The obtained reduction in particle size points to that the adsorbed Cu probably impedes the agglomeration of TiO2 and thus contributes to the larger TiO2 surface area available for the photocatalytic process. The EDX analysis confirmed the presence of uniformly distributed Cu in the prepared sample, following the similar spatial distribution as oxygen, and thus additionally confirming its binding affinity towards oxygen. A small loss of Cu during synthesis (0.31% EDX-detected compared to 0.40% input) is in good agreement with the expected good stability of the Cu coating, predicted from DFT calculations. The results are also comparable with TEM findings of Eskandarloo et al. [35], where Cu was identified as 10 nm dots deposited onto TiO2 nanospheres of about 50 nm in diameter.
The newly prepared photocatalyst showed an improved performance for the degradation of ciprofloxacin compared to bare TiO2 rutile. The degradation rate increased by a factor of 1.5. The obtained improvement in the degradation performance of the modified photocatalyst is expected considering the reduced agglomeration and smaller TiO2 particle size in the presence of the Cu coating.
The current work is compared with data from similar studies in Table 6.
The results are in reasonable agreement with the available literature data on similar catalytic materials, considering the low amount of the catalyst compared to the pollutant concentration in the present study. Although the increase in the catalyst amount would certainly further increase the reaction rate, high catalyst loadings are avoided in this study in order to assure the reliable detection of ciprofloxacin with UV-Vis spectrometry.
The DFT screening of adhesion energies of d-metals appeared to be a reasonable strategy for the improvement in efficiency of TiO2-based photocatalysts. Efficient metal binding at low loadings contributes to the better availability of the photocatalyst surface, due to the less pronounced agglomeration of TiO2 particles. Moreover, the real chemical binding of metals on surface sites rich in energy, which can be successfully tracked using DFT calculations, does contribute to the formation of novel synergistic structures that modify the intrinsic optical properties of input materials, having a perspective to further tune the photocatalytic performances.

Supplementary Materials

The following supporting information can be downloaded at: https://www.mdpi.com/article/10.3390/ma16165708/s1, Figure S1. Structure of ciprofloxacin [46]; Table S1: Qualitative scoring table for metal selection; Figure S2. UV-Vis absorption spectra of bare TiO2 and TiO2(Cu).

Author Contributions

Conceptualization, M.K., S.Ž. and D.V.A.; Data curation, M.K.; Formal analysis, M.K. and D.V.A.; Funding acquisition, M.M., D.R. and D.V.A.; Investigation, M.K., S.Ž. and M.O.; Methodology, S.Ž. and D.V.A.; Project administration, M.M.; Resources, M.M. and D.R.; Supervision, D.R.; Validation, S.Ž., M.M. and D.R.; Visualization, M.K. and M.O.; Writing—original draft, M.K., M.O. and D.V.A.; Writing—review and editing, S.Ž., M.M. and D.R. All authors have read and agreed to the published version of the manuscript.

Funding

The authors would like to thank the Ministry of Science, Technological Development and Innovation of the Republic of Serbia for the financial support to the research through institutional funding (Contract number: 451-03-47/2023-01/200017).

Institutional Review Board Statement

Not applicable.

Informed Consent Statement

Not applicable.

Data Availability Statement

Not applicable.

Acknowledgments

The authors would like to thank the Ministry of Science, Technological Development and Innovation of the Republic of Serbia for the financial support to the research through institutional funding (Contract number: 451-03-47/2023-01/200017). The authors would like to thank Dalibor Stanković for valuable discussion, Igor Pašti for providing the SEM imaging analysis and Marija Simić for providing assistance for the TOC analysis.

Conflicts of Interest

The authors declare no conflict of interest.

References

  1. Akter, S.; Islam, M.S.; Kabir, M.H.; Shaikh, M.A.A.; Gafur, M.A. UV/TiO2 photodegradation of metronidazole, ciprofloxacin and sulfamethoxazole in aqueous solution: An optimization and kinetic study. Arab. J. Chem. 2022, 15, 103900. [Google Scholar] [CrossRef]
  2. Costa, L.N.; Nobre, F.X.; Lobo, A.O.; de Matos, J.M.E. Photodegradation of ciprofloxacin using Z-scheme TiO2/SnO2 nanostructures as photocatalyst. Environ. Nanotechnol. Monit. Manag. 2021, 16, 100466. [Google Scholar] [CrossRef]
  3. Barbara Ambrosetti, L.C.; Palmisano, R. Photo-Degradation of Amoxicillin, Streptomycin, Erythromycin and Ciprofloxacin by UV and UV/TiO2 Processes. Evaluation of Toxicity Changes Using a Respirometric Biosensor. J. Environ. Anal. Chem. 2015, 2, 1000143. [Google Scholar] [CrossRef]
  4. Abellán, M.N.; Giménez, J.; Esplugas, S. Photocatalytic degradation of antibiotics: The case of sulfamethoxazole and trimethoprim. Catal. Today 2009, 144, 131–136. [Google Scholar] [CrossRef]
  5. Pecquet, S.; Ravoire, S.; Andremont, A. Faecal excretion of ciprofloxacin after a single oral dose and its effect on faecal bacteria in healthy volunteers. J. Antimicrob. Chemother. 1990, 26, 125–129. [Google Scholar] [CrossRef] [PubMed]
  6. Saravanan, A.; Deivayanai, V.C.; Kumar, P.S.; Rangasamy, G.; Hemavathy, R.V.; Harshana, T.; Gayathri, N.; Alagumalai, K. A detailed review on advanced oxidation process in treatment of wastewater: Mechanism, challenges and future outlook. Chemosphere 2022, 308, 136524. [Google Scholar] [CrossRef] [PubMed]
  7. Rangarajan, G.; Jayaseelan, A.; Farnood, R. Photocatalytic reactive oxygen species generation and their mechanisms of action in pollutant removal with biochar supported photocatalysts: A review. J. Clean. Prod. 2022, 346, 131155. [Google Scholar] [CrossRef]
  8. Qutob, M.; Hussein, M.A.; Alamry, K.A.; Rafatullah, M. A review on the degradation of acetaminophen by advanced oxidation process: Pathway, by-products, biotoxicity, and density functional theory calculation. RSC Adv. 2022, 12, 18373–18396. [Google Scholar] [CrossRef]
  9. Zheng, A.L.T.; Ohno, T.; Andou, Y. Recent Progress in Photocatalytic Efficiency of Hybrid Three-Dimensional (3D) Graphene Architectures for Pollution Remediation. Top. Catal. 2022, 65, 1634–1647. [Google Scholar] [CrossRef]
  10. Pavel, M.; Anastasescu, C.; State, R.-N.; Vasile, A.; Papa, F.; Balint, I. Photocatalytic Degradation of Organic and Inorganic Pollutants to Harmless End Products: Assessment of Practical Application Potential for Water and Air Cleaning. Catalysts 2023, 13, 380. [Google Scholar] [CrossRef]
  11. Akerdi, A.G.; Bahrami, S.H. Application of heterogeneous nano-semiconductors for photocatalytic advanced oxidation of organic compounds: A review. J. Environ. Chem. Eng. 2019, 7, 103283. [Google Scholar] [CrossRef]
  12. Zheng, A.L.T.; Abdullah, C.A.C.; Chung, E.L.T.; Andou, Y. Recent progress in visible light-doped ZnO photocatalyst for pollution control. Int. J. Environ. Sci. Technol. 2022, 20, 5753–5772. [Google Scholar] [CrossRef]
  13. Shafiee, A.; Rabiee, N.; Ahmadi, S.; Baneshi, M.; Khatami, M.; Iravani, S.; Varma, R.S. Core–Shell Nanophotocatalysts: Review of Materials and Applications. ACS Appl. Nano Mater. 2022, 5, 55–86. [Google Scholar] [CrossRef]
  14. Low, J.; Yu, J.; Jaroniec, M.; Wageh, S.; Al-Ghamdi, A.A. Heterojunction Photocatalysts. Adv. Mater. 2017, 29, 1694. [Google Scholar] [CrossRef] [PubMed]
  15. Goktas, A.; Modanlı, S.; Tumbul, A.; Kilic, A. Facile synthesis and characterization of ZnO, ZnO:Co, and ZnO/ZnO:Co nano rod-like homojunction thin films: Role of crystallite/grain size and microstrain in photocatalytic performance. J. Alloys Compd. 2022, 893, 162334. [Google Scholar] [CrossRef]
  16. Žerjav, G.; Arshad, M.S.; Djinović, P.; Junkar, I.; Kovač, J.; Zavašnik, J.; Pintar, A. Improved electron–hole separation and migration in anatase TiO2 nanorod/reduced graphene oxide composites and their influence on photocatalytic performance. Nanoscale 2017, 9, 4578–4592. [Google Scholar] [CrossRef]
  17. Al-Namshah, K.S.; Shkir, M.; Ibrahim, F.A.; Hamdy, M.S. Auto combustion synthesis and characterization of Co doped ZnO nanoparticles with boosted photocatalytic performance. Phys. B Condens. Matter 2022, 625, 413459. [Google Scholar] [CrossRef]
  18. Liu, J. Catalysis by Supported Single Metal Atoms. ACS Catal. 2016, 7, 34–59. [Google Scholar] [CrossRef]
  19. Shao, C.; Lin, L.; Duan, L.; Jiang, Y.; Shao, Q.; Cao, H. Nickel-enhanced electrochemical activities of shape-tailored TiO2{001} nanocrystals for water treatment: A combined experimental and DFT studies. Electrochim. Acta 2021, 376, 138066. [Google Scholar] [CrossRef]
  20. Hossain, M.N.; Choueiri, R.M.; Abner, S.; Chen, L.D.; Chen, A. Electrochemical Reduction of Carbon Dioxide at TiO2/Au Nanocomposites. ACS Appl. Mater. Interfaces 2022, 14, 51889–51899. [Google Scholar] [CrossRef]
  21. Liu, Y.; Zhang, Q.; Zhang, W.; Zhang, R.; Wang, B.; Ji, C.; Pei, Z.; Sang, S. Tuning Schottky Barrier and Contact Type of Metal–Semiconductor in Ti3C2T2/MoS2 (T = F, O, OH) by Strain: A First-Principles Study. J. Phys. Chem. C 2021, 125, 16200–16210. [Google Scholar] [CrossRef]
  22. Biswas, A.; Nandi, S.; Kamboj, N.; Pan, J.; Bhowmik, A.; Dey, R.S. Alteration of Electronic Band Structure via a Metal-Semiconductor Interfacial Effect Enables High Faradaic Efficiency for Electrochemical Nitrogen Fixation. ACS Nano 2021, 15, 20364–20376. [Google Scholar] [CrossRef] [PubMed]
  23. Liu, L.; Lv, P. DFT insight into the effect of Cu atoms on adsorption and dissociation of CO2 over a Pd8/TiO2(101) surface. RSC Adv. 2021, 11, 17391–17398. [Google Scholar] [CrossRef]
  24. Kashiwaya, S.; Morasch, J.; Streibel, V.; Toupance, T.; Jaegermann, W.; Klein, A. The Work Function of TiO2. Surfaces 2018, 1, 73–89. [Google Scholar] [CrossRef]
  25. Wang, X.; Zhang, G.; Yang, L.; Sharman, E.; Jiang, J. Material descriptors for photocatalyst/catalyst design. WIREs Comput. Mol. Sci. 2018, 8, e1369. [Google Scholar] [CrossRef]
  26. Badalov, S.V.; Bocchini, A.; Wilhelm, R.; Kozub, A.L.; Gerstmann, U.; Schmidt, W.G. Rutile, anatase, brookite and titania thin film from Hubbard corrected and hybrid DFT. Mater. Res. Express 2023, 10, 075501. [Google Scholar] [CrossRef]
  27. Giannozzi, P.; Baroni, S.; Bonini, N.; Calandra, M.; Car, R.; Cavazzoni, C.; Ceresoli, D.; Chiarotti, G.L.; Cococcioni, M.; Dabo, I.; et al. QUANTUM ESPRESSO: A modular and open-source software project for quantum simulations of materials. J. Phys. Condens. Matter Inst. Phys. J. 2009, 21, 395502. [Google Scholar] [CrossRef] [PubMed]
  28. Perdew, J.P.; Burke, K.; Ernzerhof, M. Generalized Gradient Approximation Made Simple. Phys. Rev. Lett. 1996, 77, 3865–3868. [Google Scholar] [CrossRef] [PubMed]
  29. Cococcioni, M.; de Gironcoli, S. Linear response approach to the calculation of the effective interaction parameters in theLDA+Umethod. Phys. Rev. B 2005, 71, 035105. [Google Scholar] [CrossRef]
  30. Batalović, K.; Radaković, J.; Bundaleski, N.; Rakočević, Z.; Pašti, I.; Skorodumova, N.V.; Rangel, C.M. Origin of photocatalytic activity enhancement in Pd/Pt-deposited anatase N-TiO2–Experimental insights and DFT study of the (001) surface. Phys. Chem. Chem. Phys. 2020, 22, 18536–18547. [Google Scholar] [CrossRef] [PubMed]
  31. Monkhorst, H.J.; Pack, J.D. Special points for Brillouin-zone integrations. Phys. Rev. B 1976, 13, 5188–5192. [Google Scholar] [CrossRef]
  32. Kokalj, A. XCrySDen—A new program for displaying crystalline structures and electron densities. J. Mol. Graph. Model. 1999, 17, 176–179. [Google Scholar] [CrossRef] [PubMed]
  33. Henkelman, G.; Arnaldsson, A.; Jónsson, H. A fast and robust algorithm for Bader decomposition of charge density. Comput. Mater. Sci. 2006, 36, 354–360. [Google Scholar] [CrossRef]
  34. Viana, M.M.; Soares, V.F.; Mohallem, N.D.S. Synthesis and characterization of TiO2 nanoparticles. Ceram. Int. 2010, 36, 2047–2053. [Google Scholar] [CrossRef]
  35. Eskandarloo, H.; Badiei, A.; Behnajady, M.A.; Mohammadi Ziarani, G. Photo and Chemical Reduction of Copper onto Anatase-Type TiO2 Nanoparticles with Enhanced Surface Hydroxyl Groups as Efficient Visible Light Photocatalysts. Photochem. Photobiol. 2015, 91, 797–806. [Google Scholar] [CrossRef] [PubMed]
  36. Kittel, C. Introduction to Solid State Physics: International Edition, 8th ed.; John Wiley Sons (WIE): Hoboken, NJ, USA, 2005. [Google Scholar]
  37. De Angelis, F.; Di Valentin, C.; Fantacci, S.; Vittadini, A.; Selloni, A. Theoretical studies on anatase and less common TiO2 phases: Bulk, surfaces, and nanomaterials. Chem. Rev. 2014, 114, 9708–9753. [Google Scholar] [CrossRef] [PubMed]
  38. Nakayama, T.; Kangawa, Y.; Shiraishi, K. Atomic Structures and Electronic Properties of Semiconductor Interfaces. In Comprehensive Semiconductor Science and Technology; Bhattacharya, P., Fornari, R., Kamimura, H., Eds.; Elsevier: Amsterdam, The Netherland, 2011; pp. 113–174. [Google Scholar]
  39. Ortega, Y.; Hernandez, N.C.; Menendez-Proupin, E.; Graciani, J.; Sanz, J.F. Nitrogen/gold codoping of the TiO2(101) anatase surface. A theoretical study based on DFT calculations. Phys. Chem. Chem. Phys. PCCP 2011, 13, 11340–11350. [Google Scholar] [CrossRef]
  40. Jeon, M.-K.; Park, J.-W.; Kang, M. Hydrogen Production from Methanol/Water Decomposition in a Liquid Photosystem Using the Anatase and Rutile Forms of Cu-TiO2. J. Ind. Eng. Chem 2007, 13, 84–91. [Google Scholar]
  41. Long, F.; Cao, X.; Liu, P.; Jiang, X.; Jiang, J.; Zhang, X.; Xu, J. Tuning charge transfer of Pt cluster by support defects in Pt/TiO2 for photocatalytic conversion of fatty acid into diesel-like alkane. J. Clean. Prod. 2022, 375, 133975. [Google Scholar] [CrossRef]
  42. Triquet, T.; Tendero, C.; Latapie, L.; Manero, M.-H.; Richard, R.; Andriantsiferana, C. TiO2 MOCVD coating for photocatalytic degradation of ciprofloxacin using 365 nm UV LEDs-kinetics and mechanisms. J. Environ. Chem. Eng. 2020, 8, 104544. [Google Scholar] [CrossRef]
  43. Zheng, X.; Xu, S.; Wang, Y.; Sun, X.; Gao, Y.; Gao, B. Enhanced degradation of ciprofloxacin by graphitized mesoporous carbon (GMC)-TiO(2) nanocomposite: Strong synergy of adsorption-photocatalysis and antibiotics degradation mechanism. J. Colloid Interface Sci. 2018, 527, 202–213. [Google Scholar] [CrossRef] [PubMed]
  44. Yaacob, N.A.; Khasri, A.; Ridzuan, M.J.M.; Salleh, N.H.M.; Chaijak, P. Synergistic Adsorption/Photodegradation of Ciprofloxacin by UV Light-Driven Nanocomposite Photocatalyst of Cu Doped AC/TiO2: Experimental Design via RSM-CCD; Research Square: Durham, NC, USA, 2023. [Google Scholar] [CrossRef]
  45. Hassani, A.; Khataee, A.; Karaca, S. Photocatalytic degradation of ciprofloxacin by synthesized TiO2 nanoparticles on montmorillonite: Effect of operation parameters and artificial neural network modeling. J. Mol. Catal. A Chem. 2015, 409, 149–161. [Google Scholar] [CrossRef]
  46. Thai, T.; Salisbury, B.H.; Zito, P.M. Ciprofloxacin. In StatPearls; StatPearls Publishing: St. Petersburg, FL, USA, 2023. [Google Scholar]
Figure 1. Structures of bare TiO2 (a) and (M)TiO2 with M on the hollow (b), bridge (c) and top (d) sites. Color code: Ti—gray, O—red, M—white.
Materials 16 05708 g001
Figure 2. The correlation between metal cohesive energies from literature data (Ecoh) [36] and metal adhesion energies on TiO2(001) calculated in the present study (Eadh) is represented by black squares. The “1-1 line” (Eadh = Ecoh), given for reference, is represented by red triangles. For such representations, all metals with Eadh < Ecoh (weaker adhesion on TiO2(001) compared to cohesion) are below the “1-1 line”.
Materials 16 05708 g002
Figure 3. Optimized geometries of 36-atom slabs TiO2(001)—(a,c), and TiO2(110)—(b,d) with adsorbed Cu on bridge site. Color code: Ti—gray, O—red, Cu—brown.
Materials 16 05708 g003
Figure 4. Electronic structure PDOS of (a) TiO2(001), (b) TiO2(110), (c) (Cu)TiO2(001) and (d) (Cu)TiO2(110) surfaces with and without adsorbed Cu. Fermi level is taken as energy zero. Color code: Ti states—gray, O states—red, Cu states—wine.
Materials 16 05708 g004
Figure 5. XRD patterns of freshly prepared (Cu)TiO2 and bare TiO2 powders.
Materials 16 05708 g005
Figure 6. SEM images and EDX spectra of (a) (Cu)TiO2 and (b) bare TiO2 at the magnification ×20,000.
Materials 16 05708 g006
Figure 7. (a) Elemental maps of Ti, O and Cu in (Cu)TiO2 sample. (b) Normalized amount of the elements from EDS analysis.
Materials 16 05708 g007
Figure 8. UV-Vis spectra of the ciprofloxacin solution of the initial concentration 4.75 × 10⁻⁴ M during 240 min of photodegradation on bare TiO2 (a) and (Cu)TiO2 (b).
Materials 16 05708 g008
Figure 9. Degradation curves (a) and their linearized pseudo-first-order fits (b) of ciprofloxacin degradation on bare TiO2 (black squares) and (Cu)TiO2 (red circles).
Materials 16 05708 g009
Table 1. Adhesion energies (Eadh) of investigated metals on high-symmetry sites of TiO2(001) surface (n.s. stands for “non-stable”).
Metal/Ads. SiteBridge (eV)Hollow (eV)Top (eV)Metal/Ads. SiteBridge (eV)Hollow (eV)Top (eV)
Ag−0.868−0.690−0.274Nb−4.476−4.416−0.604
Au−0.680−0.757−0.523Ni−3.376−2.967n.s.
Cd−0.220n.s.−0.050Os−4.675−3.902−0.675
Co−3.581−2.967−0.422Pd−1.398−1.830−0.806
Cr−0.870n.s.−0.115Pt−1.962−2.698−0.939
Cu−2.376−1.206−0.270Re−2.700−3.382−0.259
Fe−2.492−2.994−0.431Rh−2.429−1.802−0.799
Hf−6.817−2.695−1.106Ru−2.805−3.145−0.860
Hg−0.076−0.048−0.041Ta−4.805−6.435−0.769
Ir−2.887−3.897−0.979V−4.006−2.348−0.342
Mn−2.385−0.931−0.268Zn−0.314−0.077−0.053
Mo−2.628−2.598−0.141Zr−6.014−5.503−1.170
Table 2. Calculated adhesion energies of Cu and electron transfer.
Eadh (eV)Electrons Transferred from Cu to TiO2
(Cu)TiO2(001)−2.610.65
(Cu)TiO2(110)−6.711.05
Table 3. Crystallite size, lattice strain and lattice parameter of the prepared TiO2-based materials.
SampleCrystallite Size (Å)Lattice Strain (%)Lattice Parameter (Å)
TiO2(Cu)751(19)0.01(3)a = 4.59332(8)
b = 4.59332(8)
c = 2.95910(7)
TiO2685(20)0a = 4.59274(14)
b = 4.59274(14)
c = 2.95958(12)
Table 4. Calculated pseudo-first-order rate constants of CIP degradation on TiO2 and (Cu)TiO2 photocatalysts.
k (min−1)R2
(Cu)TiO20.0028 ± 0.00020.97942
TiO20.00189 ± 0.000090.98365
Table 5. Results of TOC analysis.
Initial TOC (t = 0) mg/LFinal TOC (t = 240 min) mg/LTOC Removal (%)
TiO214.813.49.5
(Cu)TiO214.813.012.2
Table 6. Comparison of current work to literature data.
CatalystCatalyst Dosage (mg/L)Initial Concentration (mg/L)UV-Irradiation ParametersTime (min)Removal Efficiency (%)Reference
Cu/TiO2202015 W
λ = 254 nm
24050Present study
TiO27008024 W
λ = 254 nm
60089[1]
TiO212020Irradiance, 100 Wm−2
λ = 365 nm
6075[42]
GMC-TiO2 composite3501514 W
λ = 254 nm
90100[43]
Cu-doped AC/TiO23201007 W
λ = 254 nm
12095[44]
TiO2/MMT1002016 W
UV-C
12062[45]
Disclaimer/Publisher’s Note: The statements, opinions and data contained in all publications are solely those of the individual author(s) and contributor(s) and not of MDPI and/or the editor(s). MDPI and/or the editor(s) disclaim responsibility for any injury to people or property resulting from any ideas, methods, instructions or products referred to in the content.

